the Creative Commons Attribution 4.0 License.
the Creative Commons Attribution 4.0 License.
 | 12 Mar 2018
Light-absorption of dust and elemental carbon in snow in the Indian Himalayas and the Finnish Arctic
Jonas Svensson
Johan Ström
Niku Kivekäs
Nathaniel B. Dkhar
Shresth Tayal
Ved P. Sharma
Arttu Jutila
John Backman
Aki Virkkula
Meri Ruppel
Antti Hyvärinen
Anna Kontu
Henna-Reetta Hannula
Matti Leppäranta
Rakesh K. Hooda
Atte Korhola
Eija Asmi
Heikki Lihavainen
Light-absorbing impurities (LAIs) deposited in snow have the potential to substantially affect the snow radiation budget, with subsequent implications for snow melt. To more accurately quantify the snow albedo, the contribution from different LAIs needs to be assessed. Here we estimate the main LAI components, elemental carbon (EC) (as a proxy for black carbon) and mineral dust in snow from the Indian Himalayas and paired the results with snow samples from Arctic Finland. The impurities are collected onto quartz filters and are analyzed thermal–optically for EC, as well as with an additional optical measurement to estimate the light-absorption of dust separately on the filters. Laboratory tests were conducted using substrates containing soot and mineral particles, especially prepared to test the experimental setup. Analyzed ambient snow samples show EC concentrations that are in the same range as presented by previous research, for each respective region. In terms of the mass absorption cross section (MAC) our ambient EC surprisingly had about half of the MAC value compared to our laboratory standard EC (chimney soot), suggesting a less light absorptive EC in the snow, which has consequences for the snow albedo reduction caused by EC. In the Himalayan samples, larger contributions by dust (in the range of 50 % or greater for the light absorption caused by the LAI) highlighted the importance of dust acting as a light absorber in the snow. Moreover, EC concentrations in the Indian samples, acquired from a 120 cm deep snow pit (possibly covering the last five years of snow fall), suggest an increase in both EC and dust deposition. This work emphasizes the complexity in determining the snow albedo, showing that LAI concentrations alone might not be sufficient, but additional transient effects on the light-absorbing properties of the EC need to be considered and studied in the snow. Equally as imperative is the confirmation of the spatial and temporal representativeness of these data by comparing data from several and deeper pits explored at the same time.


The deposition of light-absorbing impurities (LAI) in snow influences the radiation budget and can cause enhanced melting via snow darkening (Warren and Wiscombe, 1980). This process affects regions with seasonal snow cover, leading to an earlier snow retreat, which has major implications for thawing and biogeochemical processes acting on the ground (AMAP, 2011). In mountainous areas with glaciers, the impurities perturb glacier properties and the hydrological cycle (e.g., Xu et al., 2009). The impact on snow reflectance (albedo) from black carbon (BC) aerosol particles is of particular interest. Being one of the most effective light-absorbing aerosols, BC enters the atmosphere by combustion of carbon-based fuels, in activities including forest fires and anthropogenic burning of bio- and fossil fuels (Bond et al., 2013). Because of its negative effect on snow albedo, considerable effort has been made to globally quantify BC in snow (e.g., Doherty et al., 2010; Ming et al., 2008; Schmitt et al., 2015), as well as in ice cores (e.g., McConnell et al., 2007; Ruppel et al., 2014; Xu et al., 2009).
The potential impact of LAI on snow and ice makes the Himalayas a region of special interest. It contains numerous glaciers which are in a general state of recession, although contrasting patterns have been reported in different areas (e.g., Bolch et al., 2012; Kääb et al., 2012). Himalayan glaciers act as freshwater sources for several major rivers in Asia, including the Indus, Ganges, Brahmaputra, Mekong, and Yangtze, thus affecting millions of people's lives (e.g., Immerzeel et al., 2010). The glaciers are especially susceptible to BC emissions, as India and China are located in close proximity and emit the most BC worldwide (Bond et al., 2013). A recent study by Ming et al. (2015) found a decreasing trend in albedo during the period of 2000–2011 on Himalayan glaciers, and suggested that rising air temperatures and the deposition of LAI are responsible for the decrease. In light of the vast area of the Himalayas, there is a lack of in situ measurements of LAI on glaciers, which are crucial for modeling work (Gertler et al., 2016). The lack of measurements is especially pronounced in the Indian Himalayas, since previous measurements of LAI in Himalayan snow and ice have largely been confined to China (e.g., Xu et al., 2006) and Nepal (e.g., Ginot et al., 2014; Kaspari et al., 2011, 2014; Ming et al., 2008).
In addition to BC, other LAI can contribute significantly to the radiative balance of the cryosphere. Recent research has identified mineral dust and microorganisms as having a more important role than previously thought in the current decline in albedo of the Greenland ice sheet and other parts of the Arctic (e.g., Dumont et al., 2014; Lutz et al., 2016). Similarly, Kaspari et al. (2014) reported such high dust concentrations in the snow of Himalayan Nepal that the contribution of dust in lowering the snow albedo sometimes exceeded that of BC. The importance of dust has also been illustrated from other regions, for example the Colorado Rocky Mountains, US, where dust causes a significantly earlier peak in runoff (Painter et al., 2007). In the Arctic, Doherty et al. (2010) suggest that 30 to 50 % of sunlight absorbed in the snowpack by impurities is due to non-BC constituents. Evidently, dust has an important role in the cryospheric radiative balance. However, differentiating between the different impurities in the snow is not trivial and requires more than one analytical technique (Doherty et al., 2016). Traditionally, dust in snow has been quantified by gravimetrically measuring filters (e.g., Aoki et al., 2006; Painter et al., 2012). Other methods consist of using transmitted light microscopy (Thevenon et al., 2009), a microparticle counter to measure the insoluble dust (Ginot et al., 2014), or mass spectrometry (using iron as a proxy for dust) (Kaspari et al., 2014).
At present, three primary methods are used to measure BC in snow and ice (see Qian et al., 2015, in which they are extensively presented). Out of the three methods, two utilize filters to collect impurities in a melted sample. The first filter method measures optically the spectrally resolved absorption by the impurities using an integrating sphere sandwich spectrophotometer (ISSW) (e.g., Doherty et al., 2010; Grenfell et al., 2011). The second filter method is the thermal–optical analysis of filters (e.g., Forsström et al., 2009; Hagler et al., 2007). The third, non-filter-based method, uses laser-induced incandescence with a single particle soot photometer (SP2) (e.g., McConnell et al., 2007; Schwarz et al., 2012).
Each measurement method has benefits and drawbacks. The SP2 is specific to refractory BC and is able to provide estimates on the size of the BC particles. However, the SP2 has a size range limitation (roughly 70–600 nm, depending on the instrument settings and nebulizer setup), which may result in the underestimation of BC mass since particles in snow have been reported to be larger (Schwarz et al., 2012, 2013). Conversely, the use of filters can provide a practical logistics advantage for the collection of LAI in remote locations, as it is difficult to maintain the necessary frozen chain for the snow samples from the field to the laboratory for analysis. Particulate losses can be very significant if a sample is not kept frozen and thus will not provide accurate results. Filtering of liquid samples can be conducted in the field, and the substrates are more easily stored and transported to the laboratory. The ISSW method has the advantage that it measures light-absorbing constituents on the filter indiscriminately. Thus, the ISSW method is not specific to BC, and requires interpretation of the spectral response to determine the BC component. The thermal–optical method (TOM) provides an actual measurement of elemental carbon (EC) that is instrumentally defined. EC is assumed to be the dominant light-absorbing component of BC, and often EC and BC are used interchangeably in literature. The sampling efficiency of quartz filters used in TOM is not well characterized for small particles (Lim et al., 2014). However, smaller particles normally contribute little to the total particulate mass (Hinds, 1999). Thus, each method for measuring BC in snow has both advantages and disadvantages.
Here we present observations of LAI in snow from two glaciers in the Sunderdhunga valley in the Indian Himalayas, which have not – to our knowledge – been explored previously with respect to LAI in snow. Using a measuring approach whereby the TOM is combined with a custom-built particle soot absorption photometer (PSAP), we perform laboratory tests to provide a correct interpretation of the results. Our Himalayan observations are further compared to samples from Arctic Finland for their LAI content.
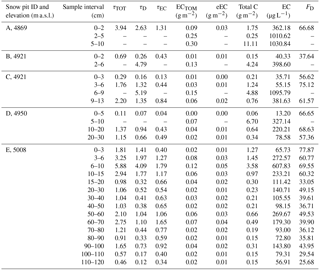
Table 1Snow pit filter samples taken from Sunderdhunga in 2015. Durga Kot glacier snow pits are A–D and Bhanolti glacier snow pit E.
2.1 Snow sample collection and site characteristics
2.1.1 The Indian Himalayas
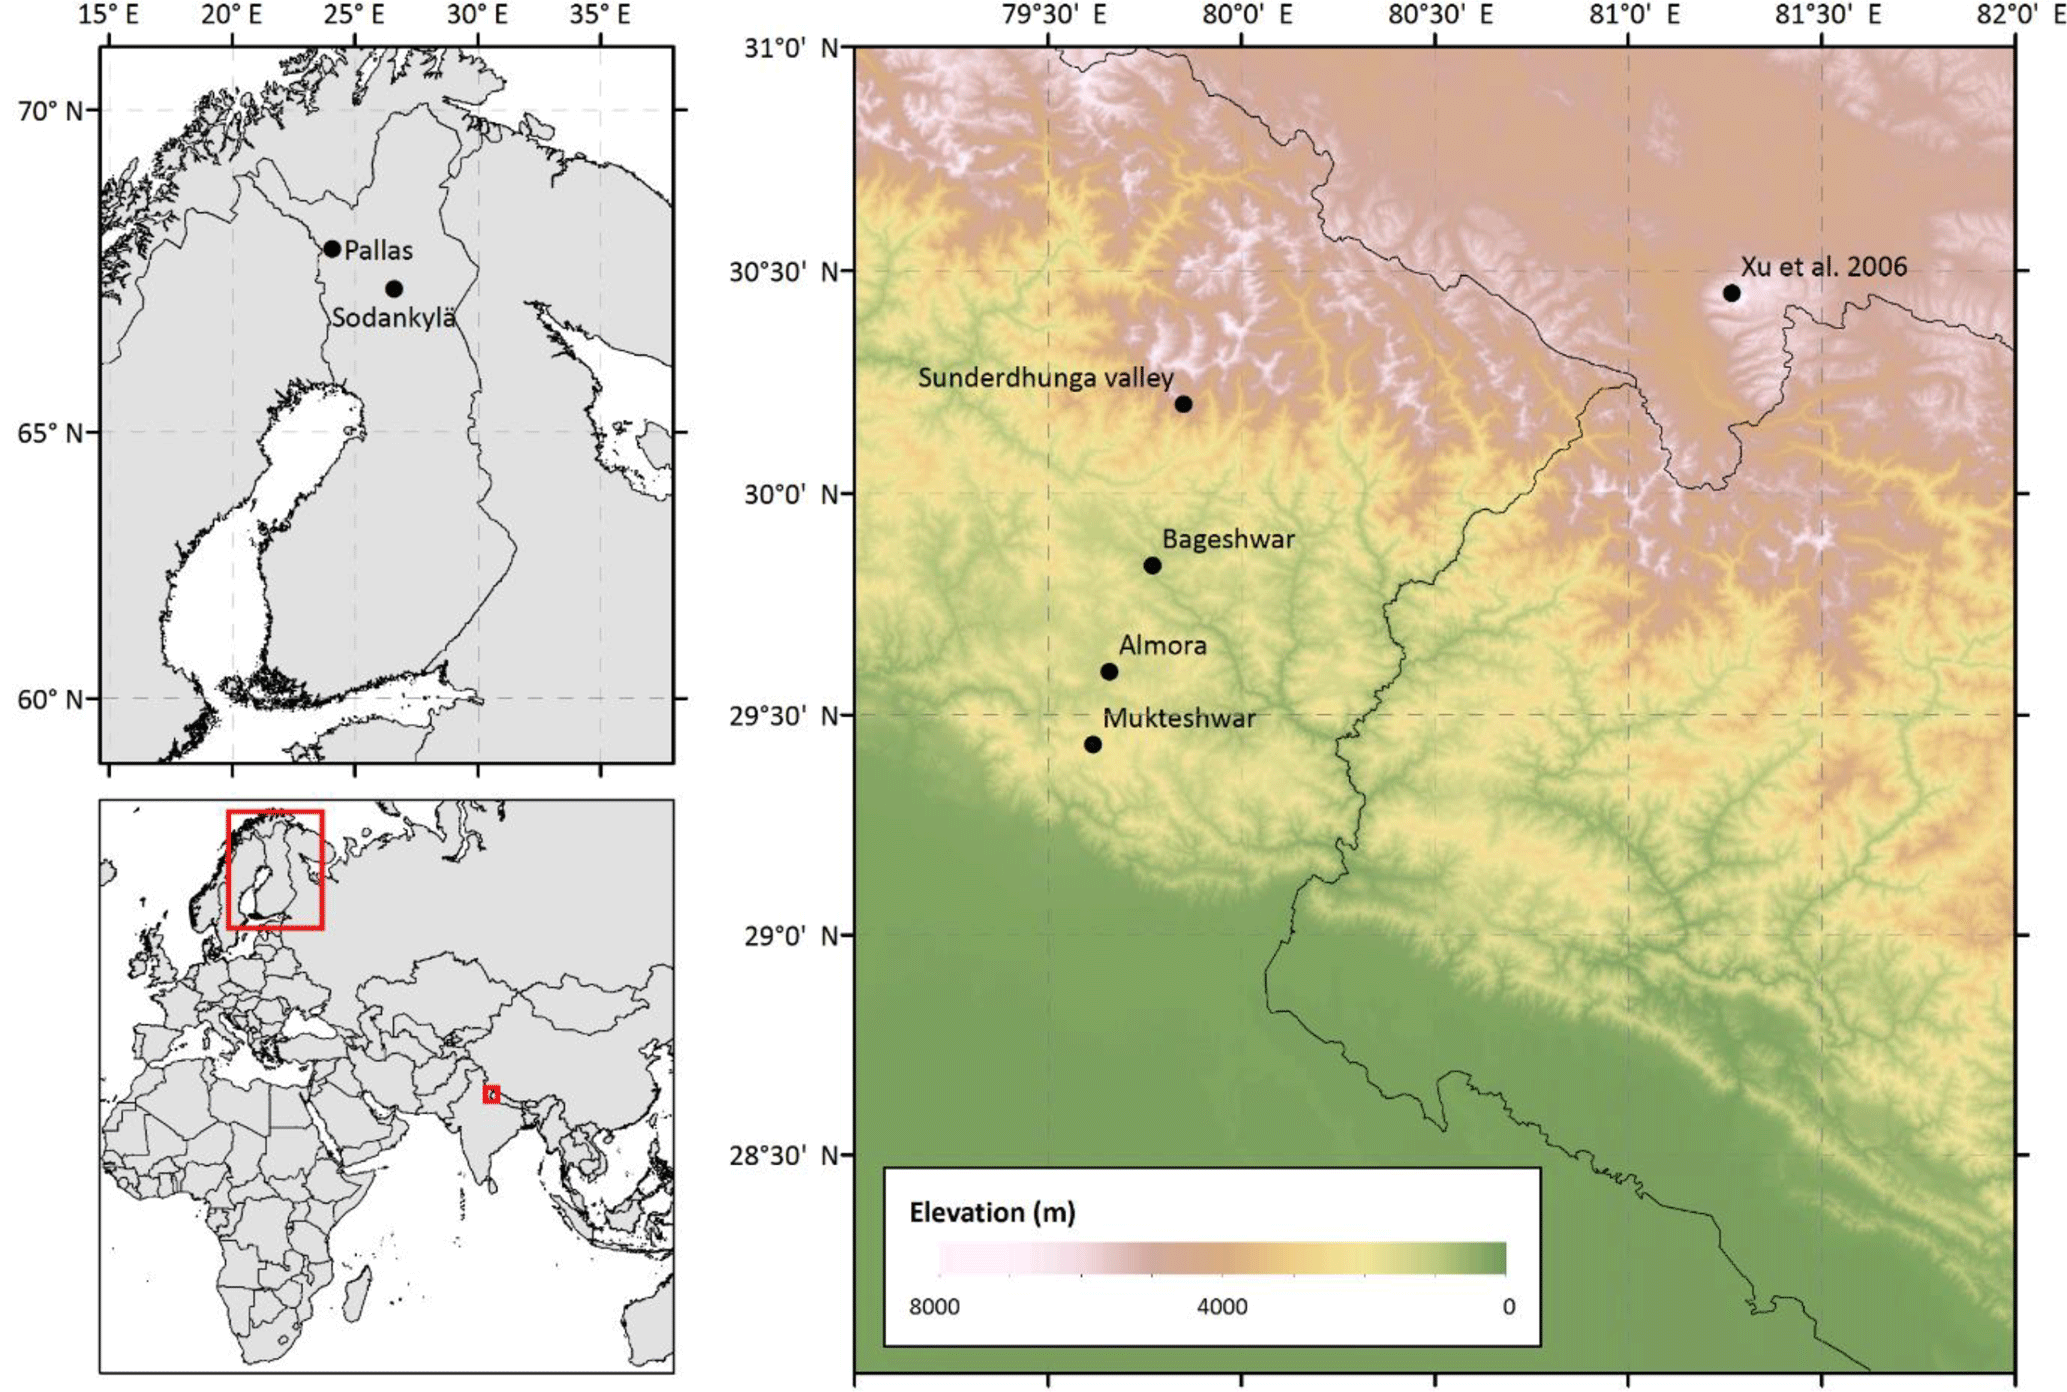
Snow samples were collected in September 2015, during the Indian post-monsoon season, from two adjacent glaciers in the Sunderdhunga valley (Fig. 1). The Bhanolti and Durga Kot glaciers (30∘12′ N, 79∘51′ E) are located in the state of Uttarakhand, India. Facing northeast, the glaciers cover an elevation range of about 4400–5500 m a.s.l. and are two small valley type glaciers in the Ganges hydrological basin. As the glaciers are situated at a relatively low altitude, they are more likely to be exposed to BC than other Himalayan glaciers at a higher altitude, as BC has been shown to decrease with altitude in other parts of the Himalayas (e.g., Kaspari et al., 2014; Ming et al., 2013; Yang et al., 2015). The Sunderdhunga area does not have any major local pollution sources. However, regionally the small towns of Bageshwar (∼ 40 km S; population ∼ 9000) and Almora (∼ 70 km S; population ∼ 34 000) may play a role. On a larger scale, the Sunderdhunga area is affected by the large-scale emissions from the Indo-Gangetic Plain (IGP). Measurements of airborne BC and other aerosol particles at Mukteshwar, a distance of ∼ 90 km southwards at an altitude of 2200 m a.s.l., have shown a clear seasonal pattern in atmospheric concentrations with emissions originating from the IGP (Hyvärinen et al., 2011; Raatikainen et al., 2017). With a peak during the pre-monsoon season (from March to the onset of monsoon season), the BC loading has been reported to decrease by about 70 % at Mukteshwar during the monsoon (Hyvärinen et al., 2011). Similarly, dust concentrations in the air have been shown to peak during the pre-monsoon season at Mukteshwar (Hyvärinen et al., 2011). The pre-monsoon season, also known as the “dust-season” in India, brings air masses from the Thar Desert transporting dust to the Himalayas (Gautam et al., 2013). Dust from local sources has also been identified at Mukteshwar during this season (Hyvärinen et al., 2011).
At the Durga Kot glacier four snow pits with varying depths were dug at different elevations, while at the Bhanolti glacier one snow pit was dug (see Table 1 for snow pits and sample details). Snow samples were collected with a metal spatula in Nasco Whirl-Pak bags, and thereafter brought to base camp where the snow was melted and filtered. As it was not possible to maintain the crucial frozen chain for the snow samples during transport back to the laboratory, this approach of melting in the field was used for the glacier snow samples. The snow was melted gently over a camping stove in enclosed glassware to avoid contamination. The liquid samples were subsequently filtered through quartz fiber filters (Munktell, 55 mm, grade T 293), in accordance with previous work (e.g., Forsström et al., 2009; Svensson et al., 2013). Filters were dried in ambient conditions in petri dishes and thereafter transported to the laboratory for analysis (described in Sect. 2.2).
2.1.2 Arctic Finland
Snow samples collected in Finland originated from the seasonal snowpack of Sodankylä (67∘21′ N 26∘37′ E) and Pallas (67∘58′ N 24∘06′ E) see Fig. 1. The Pallas samples were gathered in March and April of 2015 (n = 10) from an open mire and in March of 2016 (n = 2) from an area above the tree line (in close proximity of the Pallas Global Atmosphere Watch Station). More details of the Pallas sampling area are provided in Svensson et al. (2013) where EC in the snow was previously investigated. The sampled snow was confined to the top layers of the snowpack. The Sodankylä samples (n = 15) are from the Finnish Meteorological Institute Arctic Research Center, where weekly surface snow samples (0–5 cm) have been collected since 2009 (the first part of the time series is presented in Meinander et al., 2013; where details of the area are provided). The samples used in this study originate from spring of 2013 and 2014. The snow samples from Pallas and Sodankylä were collected in Nasco Whirl-Pak bags and stored in a frozen state until filtration. Samples were then melted in a microwave oven at each site's respective laboratory, and followed the same filtering procedure described above, according to e.g., Forsström et al. (2009) and Svensson et al. (2013).
2.2 Light-absorbing impurities analysis
To estimate the contribution to the reduction in transmission on the filter sample substrate due to minerals, we compared the light transmission through the filter using the PSAP before and after heating the sample as part of the TOM analysis. Since it is difficult to gravimetrically determine the dust content on quartz filters, we decided to use this combined instrument approach to estimate the dust content. A custom built PSAP (Krecl et al., 2007) was used for the optical measurements, and for the TOM a Sunset Laboratory organic carbon elemental carbon (OCEC) analyzer was used to determine EC. Brief descriptions of the OCEC analyzer and the PSAP are given below in Sect. 2.2.1 and 2.2.2, respectively.
The approach of measuring light transmission before and after heat treatment to estimate the different light-absorbing components has been previously used for airborne sampled aerosol (e.g., Hansen et al., 1993). In Hansen et al. (1993), filter samples were optically analyzed before and after being treated in a 600 ∘C furnace, in which the carbonaceous material was vaporized from the filter. These measurements enabled them to obtain an estimate of the dust content on the filter. Lavanchy et al. (1999) followed a similar optical and thermal approach to determine the BC and dust content of ice core samples. For the EC measurement they used a two-step combustion procedure by Cachier et al. (1989), and in between the thermal treatment they used a modified version of an aethalometer to measure the attenuation of light through the filter. Our experimental method is analogous to that of Lavanchy et al. (1999). However, as a Sunset Laboratory OCEC analyzer and a custom built PSAP were readily available to us, this instrument configuration was used in our study. As results from this type of analysis may be very instrument specific, a series of laboratory tests (described in Sect. 2.3) were conducted to confirm the reliability of the method before ambient snow samples were measured. The analysis procedure for the filters (outlined further in Sect. 2.3) was the same for the laboratory samples and the ambient samples.
2.2.1 Elemental carbon analysis
From a 10 cm2 filter sample area, separate punches of 1 cm2 were taken and analyzed for organic carbon (OC) and EC content using a Sunset Laboratory OCEC analyzer (Birch and Cary, 1996) with the EUSAAR_2 analysis protocol (Cavalli et al., 2010). During the first stage, in a helium atmosphere, the filter punch is heated at different temperature steps. In this phase OC is volatilized and detected by a flame ionization detector (FID). During the second stage, oxygen is introduced, and EC is released from the filter through combustion. To account for pyrolysis (darkening of the filter) occurring during the first step, a laser (at a 632 nm wavelength) continuously measures the transmittance (or reflectance as an option for newer instruments) of the filter punch, and when the original value of the transmittance (measured before thermal sequence starts) is attained during the second step, separation between OC and EC is done. The EC values reported here (referred to as ECTOM) were all corrected for pyrolysis accordingly.
Uncertainties associated with the TOM method are mainly associated with uneven filter loading, loss of particles to filtering containers, and the inefficiency of the filters, capturing the impurities (undercatch) (Forsström et al., 2013; Lim et al., 2014). For our filtering set-up, the undercatch has been estimated as ca. 22 % (Forsström et al., 2013), and is most likely significant for smaller sized particles, since undercatch tests have indicated an inefficiency for smaller sized particles (Lim et al., 2014). During OCEC-analysis, an artifact from samples with a high fraction of pyrolysis OC (Lim et al., 2014), and the interference of an accurate split point determination from filters containing a high dust load, can also be considerable for the TOM method (Wang et al., 2012). Generally, mineral dust may contain carbonate carbon (CC) that may interfere with the OC and EC measurements unless it is chemically removed prior to analysis. However, unlike in other OCEC analysis protocols (such as IMPROVE), here chemical removal of CC was unnecessary, as in the EUSAAR_2 protocol CC evolves during the fourth temperature step of the OC analysis (Cavalli et al., 2010; Karanasiou et al., 2011), and consequently CC does not interfere with our EC quantification. In cases where CC is present in very high concentrations on the filters, ca. 5 % of CC may only evolve during the EC analysis step causing potential overestimation of EC (Karanasiou et al., 2011). As none of our filters indicated high CC concentrations during the fourth temperature step of the OC analysis we assume only minor potential overestimation of our EC results due to CC. Refraining from acid pretreatment of the samples is also advisable, as incomplete volatilization of residual acid is known to cause irreversible damage to the measurement instruments. Furthermore, the acid treatment has been shown to cause intense charring phenomena, which may lead to severe overestimation of EC (Jankowski et al., 2008).
2.2.2 Absorption measurements
The PSAP uses a single diode at 526 nm as a light source. The light is split by two light-pipes, which illuminate two areas of 3.1 mm in diameter. The filter substrate is placed over these areas and individual detectors below the filter measure the transmitted light. During normal operation, when measuring BC in air, these two signals are used as sample and reference points. The reference point is exposed to particle-free air and the sample spot is exposed to particles present in the ambient air. In this experiment both signals are used to measure the change in transmission by comparing the signal before and after the filter has been analyzed using TOM. The signal change is related to the transmission from a particle free filter (filtered using Milli-Q (MQ) water and dried; the measurement procedure is further explained in Sect. 2.3).
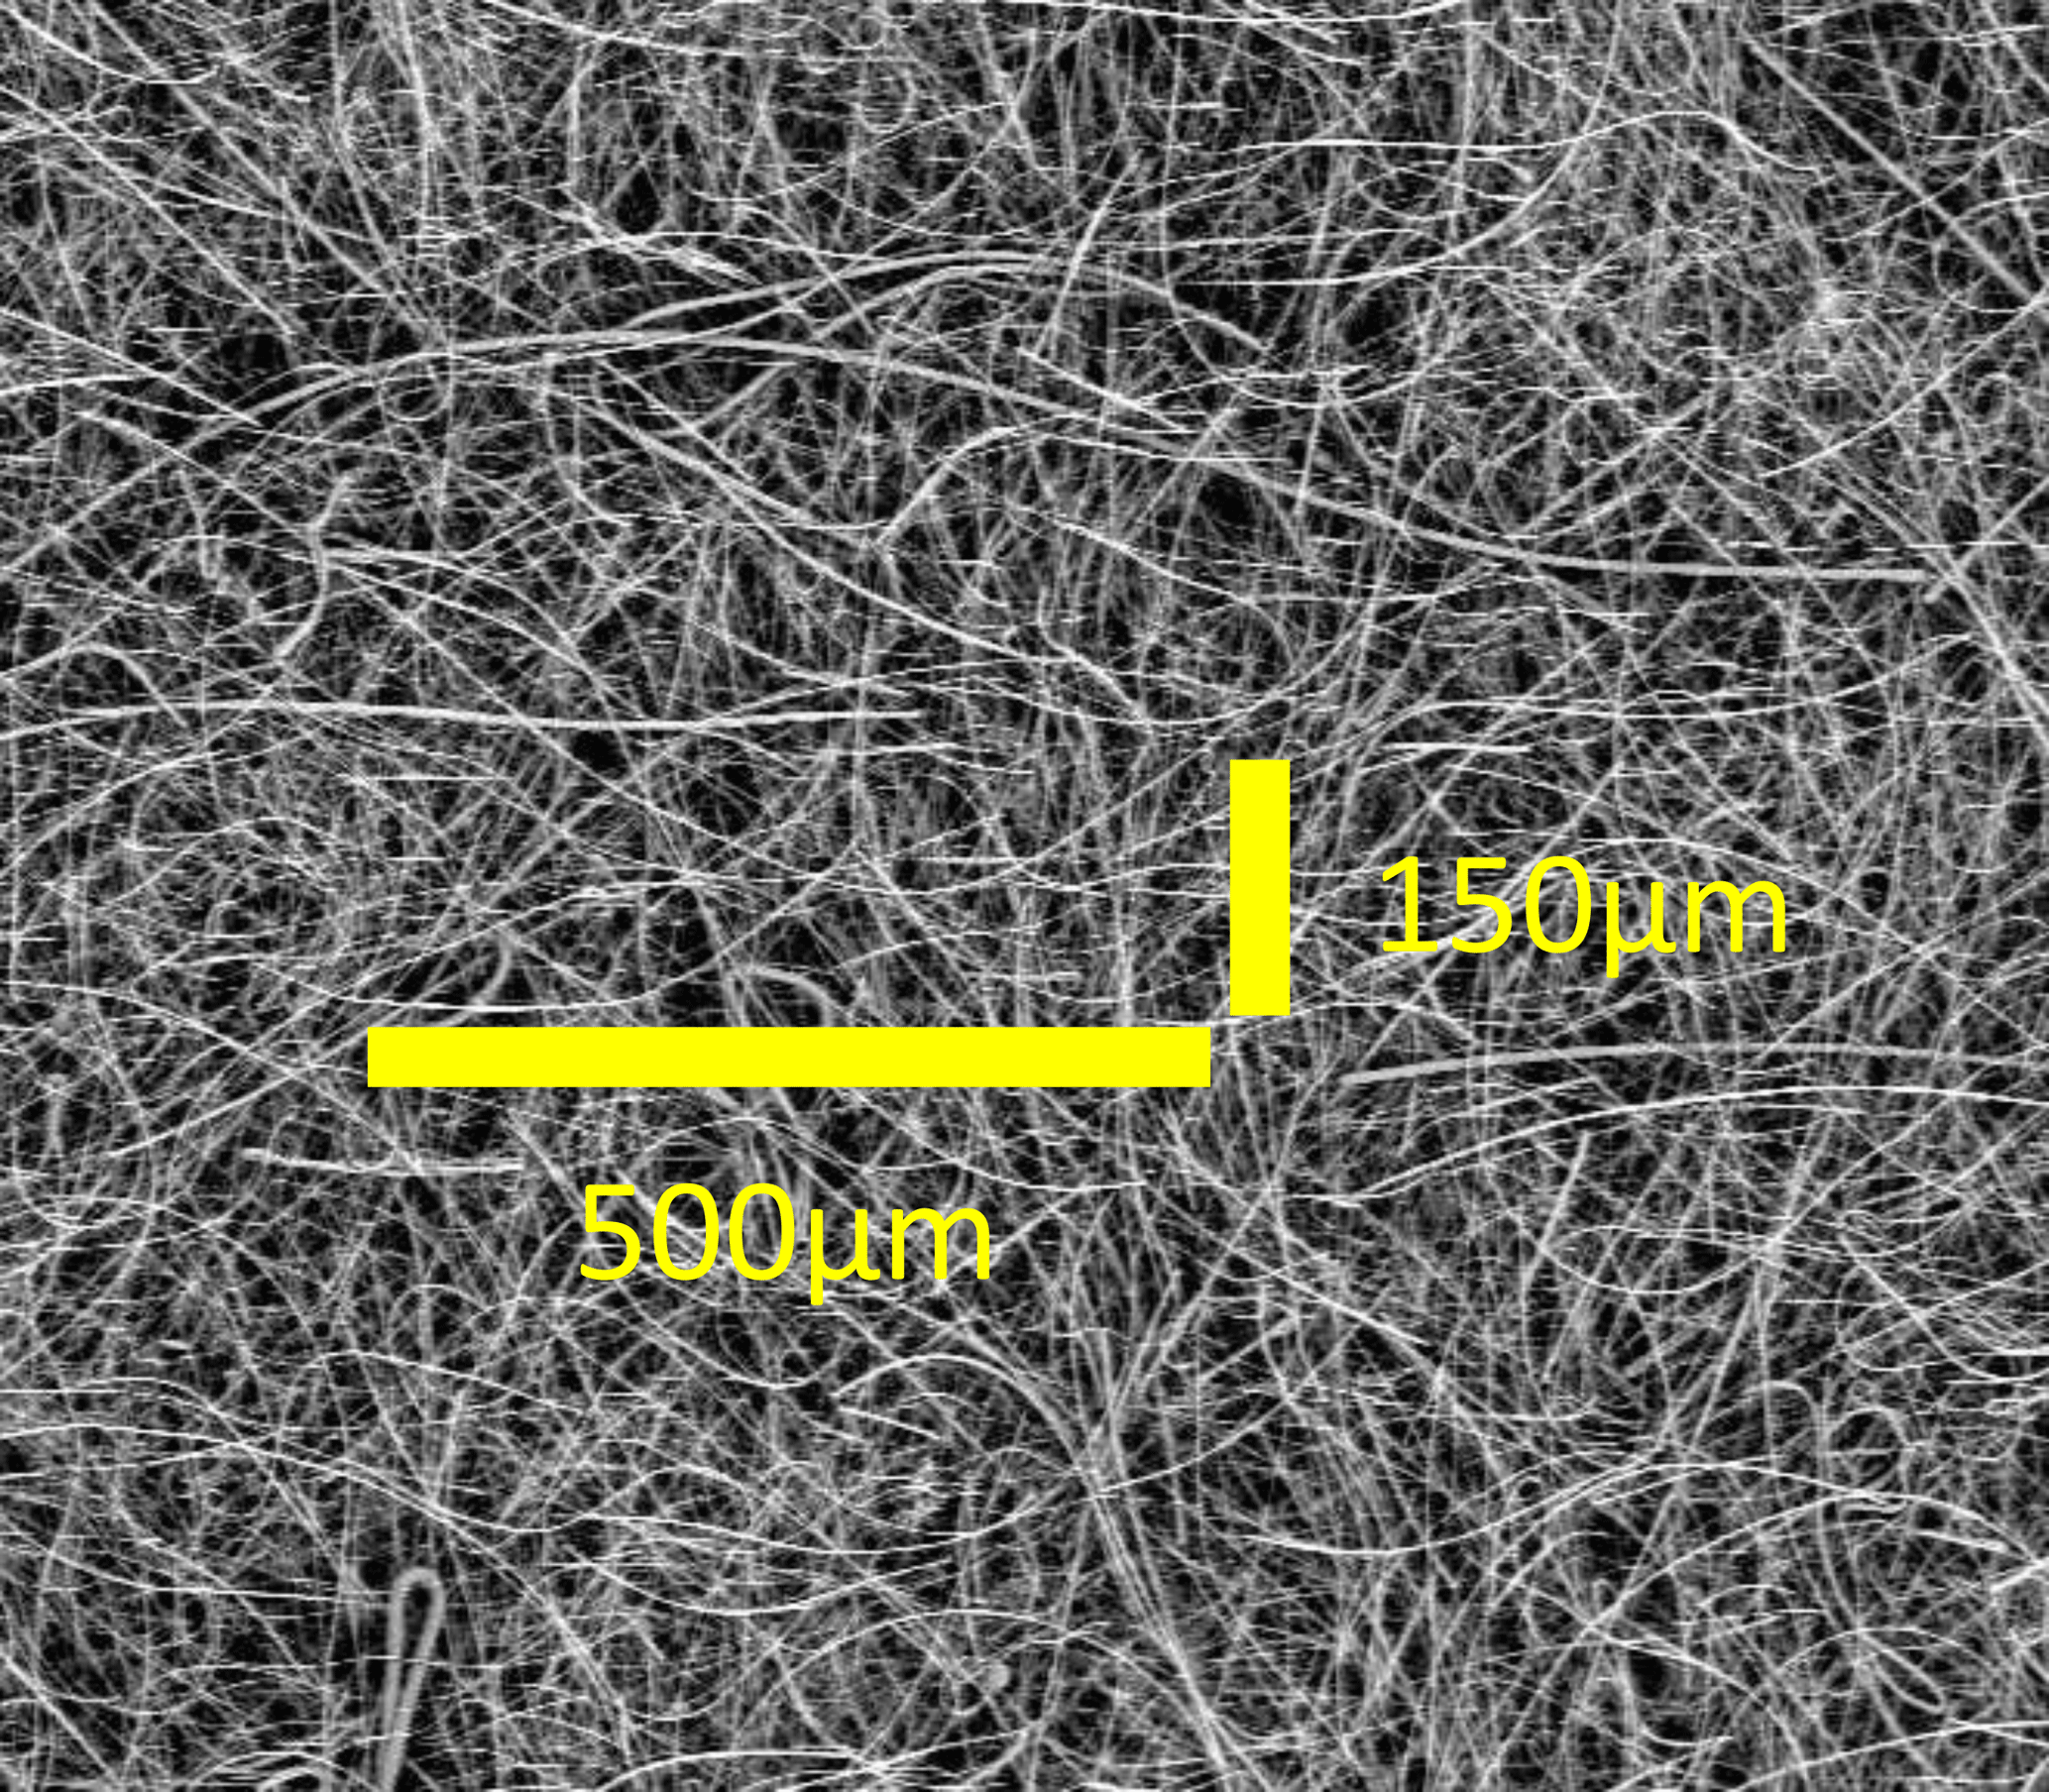
The corrections required for the PSAP when used for air sampling is well documented (e.g., Bond et al., 1999; Virkkula et al., 2005), in particular concerning enhanced absorption from the filter itself, through multiple scattering effects from the filter fibers and particle loading effects (shadowing and reduction in multiple scattering). However, these corrections are essentially uncharacterized for melted snow samples and the quartz fiber filters used. The fiber filters used are substantially thicker compared to what is normally used for PSAP measurements (Pallflex cellulose membrane filter) or the ISSW measurements (Nuclepore filter). Moreover, the filter substrate is very large in terms of surface area compared to the particles sampled. The geometry is very complex and in relation to a particle the substrate is more of a three dimensional web or sponge rather than a flat surface area on a filter. An example of a blank filter sample obtained by a scanning electron microscope is presented in Fig. 2. The horizontal scale of 500 µm is for comparison, and the scale of 150 µm is to illustrate the relative thickness of the substrate.
The basis for the optical attenuation measurements is the exponential attenuation of light as it passes through some medium, often described by the Bouguer–Lambert–Beer law (Eq. 1) as follows:
where I0 in our case is the light intensity through a clean filter and I is the light intensity through a sample loaded filter. The exponent τ is the optical depth of LAI on the filter. For our study the multiple scattering absorption enhancement factor of the filter will be treated as a constant, but not given a numerical value. Due to the geometry of the filter, corrections for any enhanced absorption due to coexisting scattering particles, and the loading effect, are not specifically considered. Hence, we will assume a linear relation between the logarithmic change in the transmittance (Tr) of a filter and the optical depth (Eq. 2) as follows:
where and τTOT is the combined effect of all light absorbing impurities. Our interest was to estimate the relative contributions of EC (τEC), and mineral dust (τD) particles to measured optical depth according to Eq. (3).
From TOM we get the EC mass surface density (µg cm−2). Thus, we can write τEC as the product of the EC mass surface density on the filter and an effective material specific mass absorption cross section MACeff,EC of BC that includes the multiple scattering enhancement of the filter, which is applicable for our measurements and not necessarily as universal MAC values. Typically, MAC values are reported in units of m2 g−1.
2.3 Laboratory tests
A series of laboratory tests using the OCEC analyzer and the PSAP combination were conducted before initiating analysis of the field samples. For this purpose, the following filter sets were created:
-
A set of filter samples (n = 36) with different amounts of BC. Two types of soot (BC) were used and each was mixed (a small amount of soot not weighed) with MQ water and a small amount of ethanol (to enable mixing of the BC particles in the liquid) in an ultrasonic bath. One soot type was collected by chimney cleaners in Helsinki, Finland, originating from oil based combustion, and has been used previously in soot on snow experiments (Svensson et al., 2016). The second type was a product from NIST (National Institute of Standards and Technology), which consists of diesel particle matter from industrial forklifts, NIST-2975. From the BC stock solutions, different amounts of solution were taken out and diluted with additional water for the same total volume of filtrate (ca. 0.5 L liquid). The newly created mixture solution was thereafter filtered using the same filter procedure as the ambient snow samples (described in Sect. 2.1.1).
-
The second set of filters (n = 16) generated contained mineral dust only. Analogous to the soot mixtures, two types of mineral were used. The first mineral was SiC (manufactured by Carborundum) mesh no. 1200, corresponding to particles approximately < 1 µm in diameter. It is light grey with hints of blue and the amount of SiC added to the MQ water was measured using a digital scale (resolution of 10 µg) before filtration. With the known concentration of the mixture, we observed how much of the weighed mineral was deposited on the filter during filtration to estimate losses. By comparing the whole filters gravimetrically before and after filtration, these tests showed that 10 % or less of the mineral was lost during filtering. The second type of mineral consisted of stone crush from a site in Ulriksdal,Stockholm, likely to be mainly granite. A sieve mesh no. 400 was used for this material, which corresponds to mineral particles of approximately < 38 µm in diameter. Filters were prepared according to the procedure given above for the other mineral (SiC).
-
The last set of laboratory solutions made contained various mixtures of SiC mineral and chimney soot (n = 30). These filters were treated in the same way as described above, with a soot stock solution and a mineral weighed solution being mixed into one solution.
The procedure to analyze all three sets of filters samples was identical. After the filter substrates had dried, one punch (1 cm2) from the filter was put into the PSAP instrument to measure the transmission across the filter in relation to a blank filter. This punch was taken for analyses of OC and EC content using the OCEC analyzer. After the TOM and removal of the carbonaceous particles, this filter punch was again analyzed in the PSAP. Hence, we acquired the transmission through the filter before and after heating in comparison to a blank filter. We did tests where the same filter punch was used in the PSAP instrument as well as the OCEC analyzer, and compared this to identical samples that were used in each instrument. Both procedures provided the same result. Furthermore, extensive tests were carried out using blank filters that had been subject to filtering of MQ water, and treated the same way as prepared samples and the ambient snow samples. No measurable EC could be detected on these filters. It should be noted that part of the second set of the laboratory filters (stone crush mineral) were analyzed with a different, but identical, PSAP and OCEC analyzer at a different laboratory (Stockholm University).
3.1 Laboratory samples
The change in optical depth as a function of analyzed EC using our two standard types of BC particles (filter set no. 1) is shown in Fig. 3. Both materials behave optically similar and the slopes are within 15 % of each other, with chimney soot having a slope of 39.8 ± 1.4 m2 g−1 and NIST soot 34.4 ± 1.8 m2 g−1 (fits have been set to a fixed intercept at 0; ± refers to standard error of slope). Previous studies of atmospheric airborne BC aerosol and its MAC with different filter-based absorption photometers are numerous, while reported MAC values for BC in snow are very sparse. The MAC value of BC is dependent on many factors, such as particle size, density, and refractive index, mixing state (i.e., coating). Reported airborne BC MAC values are lower than what we found for the two soot standards (which were mixed in liquid solution to simulate similar conditions as for our ambient snow samples). However, the MAC of air sample usually takes into account the multiple-scattering correction factor (Cref). For example for the commonly used aethalometer, its optical depth is divided by a Cref in the range of 2.8–4.3 (Collaud Coen et al., 2010). If a Cref of 5.2 was considered for our BC solution data, similar MAC values would be found (e.g., Bond et al., 2013 reports freshly generated BC with a MAC of 7.5 ± 1.2 m2 g−1 at λ = 550 nm). However, for our data set we have chosen not to take any Cref into account as our samples are liquid instead of air based, and currently no Cref exists for liquid samples.

Figure 3Comparison of the optical depth (at λ = 526 nm) by Chimney and NIST soot as a function of analyzed EC density by the OCEC analyzer.
Figure 4 shows results analogous to Fig. 3, but for the two mineral aerosol solutions (filter set no. 2). The slope of the optical depth of SiC versus measured SiC amount is more than a factor of one hundred smaller (0.23 ± 0.008 m2 g−1) than the slopes for our BC standards. This is consistent with previously reported results for airborne mineral dust (e.g., Hansen et al., 1993). The stone crush material, an essentially white powder, yielded an even smaller slope of 0.02 ± 0.001 m2 g−1. Clearly, the slopes, or the MAC, for the mineral particles are very composition specific. For a few (n = 5) of the mineral aerosol samples the optical depth was measured both before and after TOM. No EC was detected on these samples and no significant difference in τ could be observed before or after heating the sample, as one would expect as no BC was added to these filters.
From the analysis of chimney and NIST soot (Fig. 3) and SiC and stone crush dust (Fig. 4) the experiments were extended to comprise mixtures of soot and dust. Using the MAC of chimney soot (see Fig. 3), we estimate the EC content of the third set of filters, containing a mixture of SiC and chimney soot. The estimated EC (eEC) is based on the difference between the optical thickness before TOM analysis (τTOT) and the optical thickness after the analysis (τD). The eEC is then compared to the amount of EC obtained in TOM for the same filters. This comparison is presented in Fig. 5. The data are rather scattered, but the slope of the linear regression is within 17 % of the 1 : 1 line. The scatter seen in Fig. 5 is due to the difference in the detection techniques (optical vs. TOM). The observed scatter in Fig. 5 could also be related to the fact that BC is mixed with SiC. Nevertheless, it shows that EC can be reproduced reasonably well, based on the PSAP measurement, including cases with a mixture of BC and minerals.
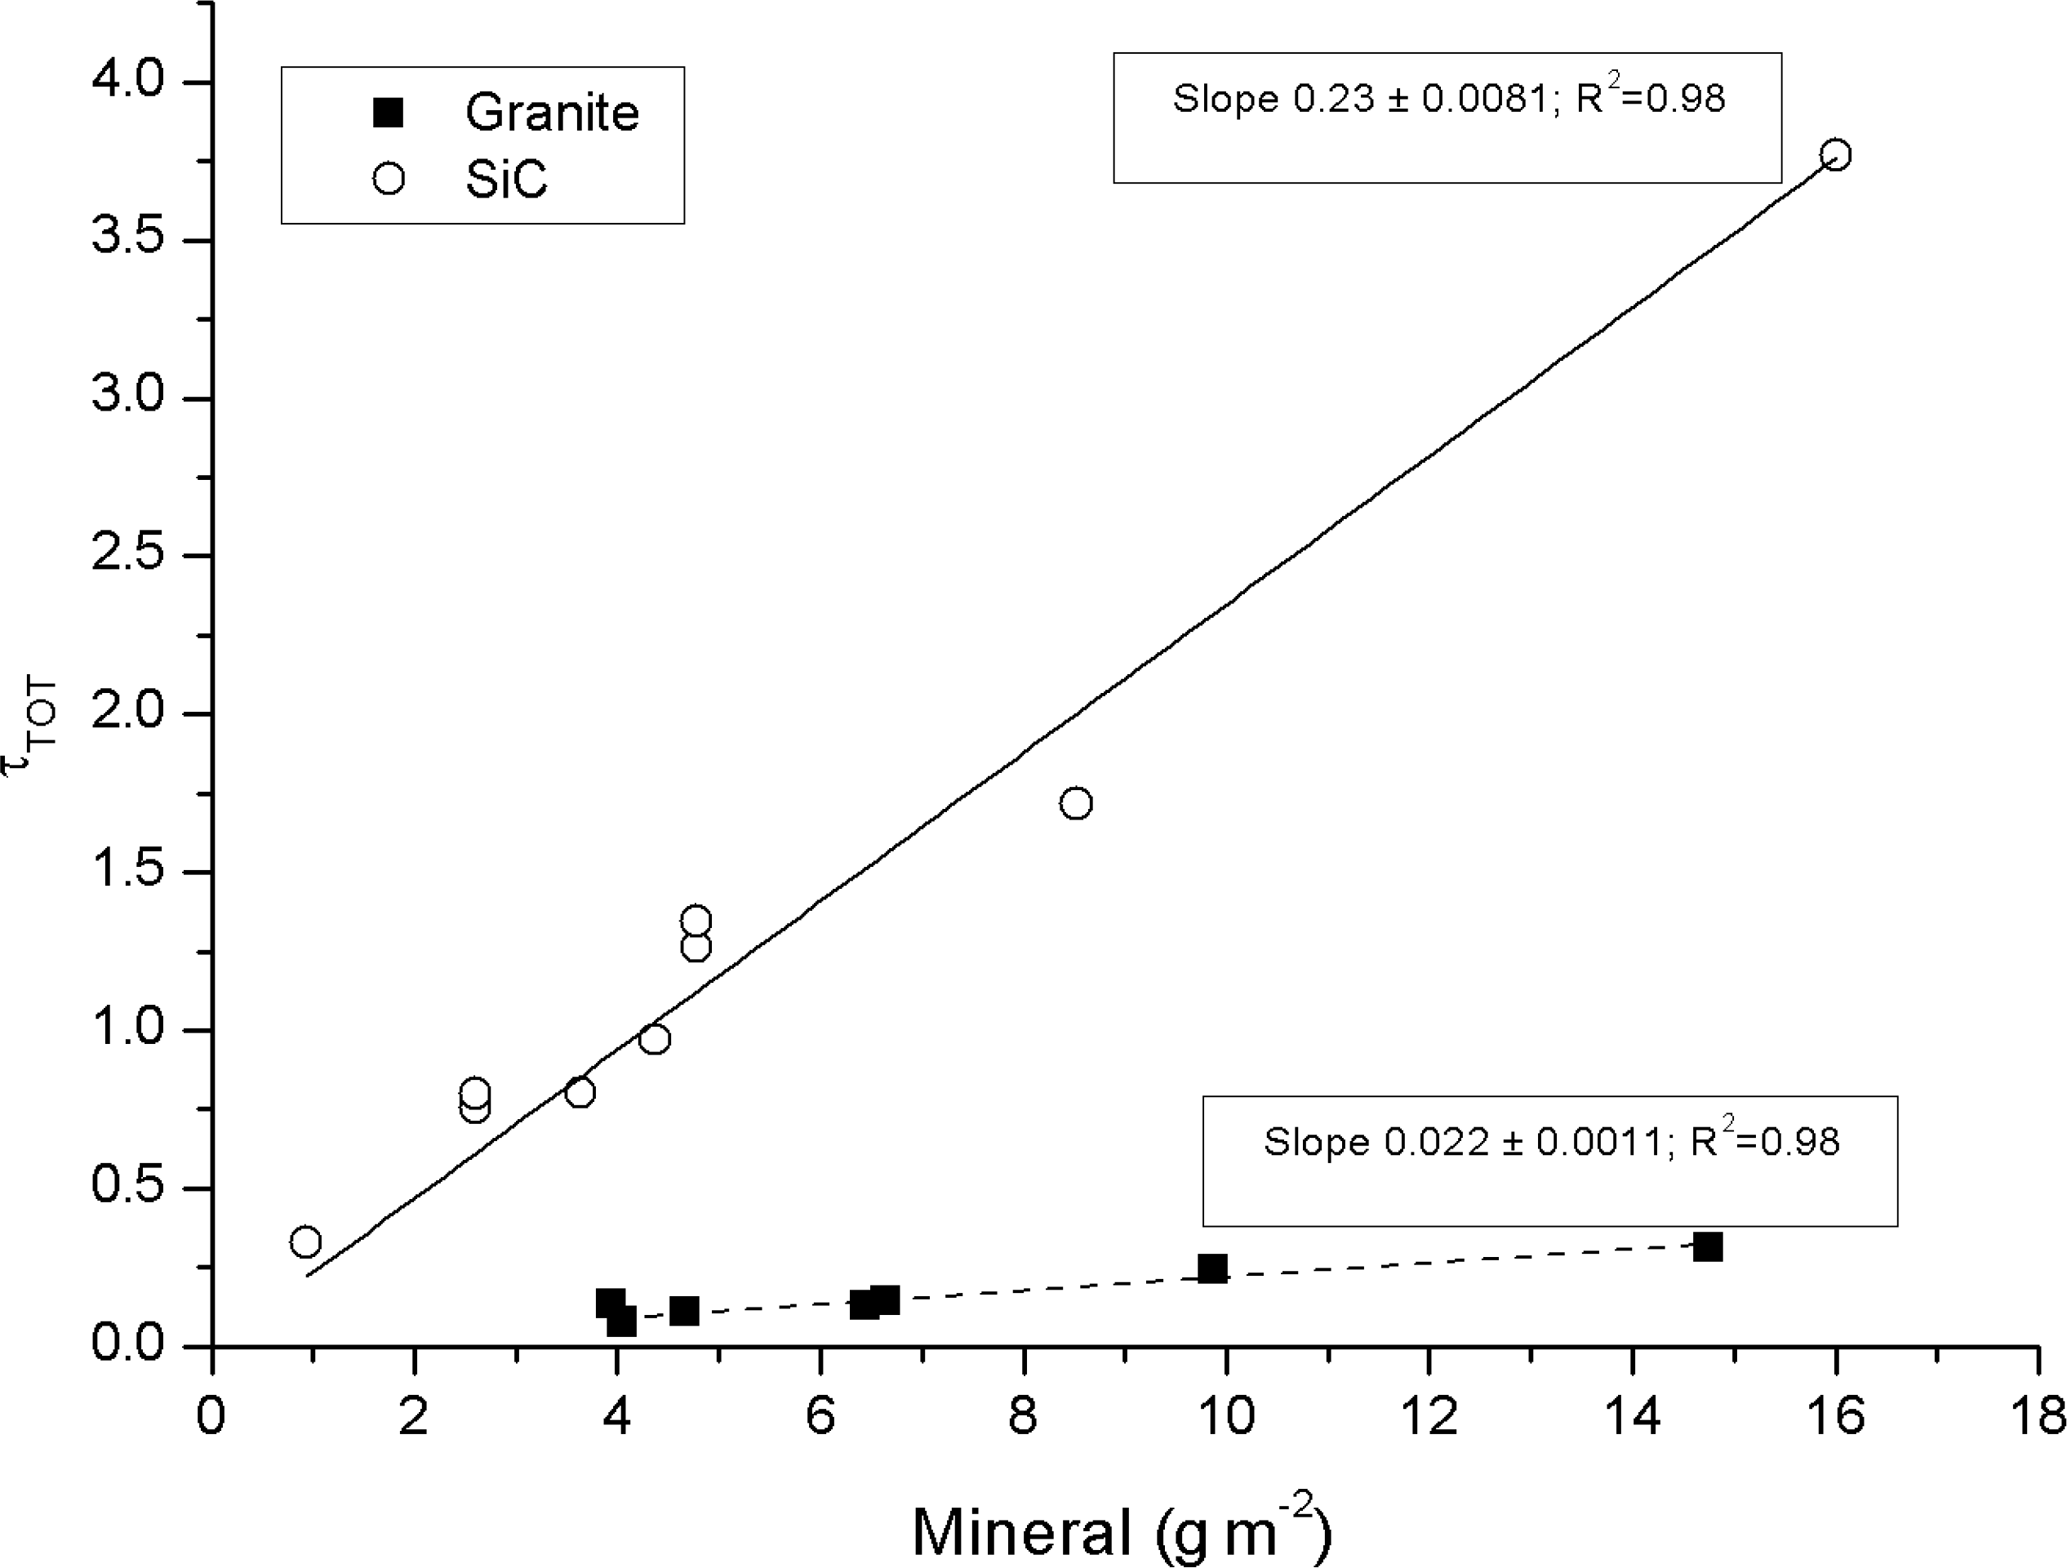
Figure 4The optical depth (at λ = 526 nm) as a function of the amount of minerals present on the filter.
In addition to chimney soot, the mineral SiC is the second absorbing component on the third set of filters. In Fig. 6 the optically estimated SiC content, based on the SiC slope in Fig. 4 and τD is compared to the known weighed amount of SiC before adding it to the liquid. Similarly, as in Fig. 5, there is some scatter in the data, but the overall pattern indicates a consistency with a reliable optical measurement. Two slopes are presented, one including all of the data points (slope 1.02), and the second slope (0.88) excluding three data points with weighed SiC amounts exceeding 7.5 g m−2.
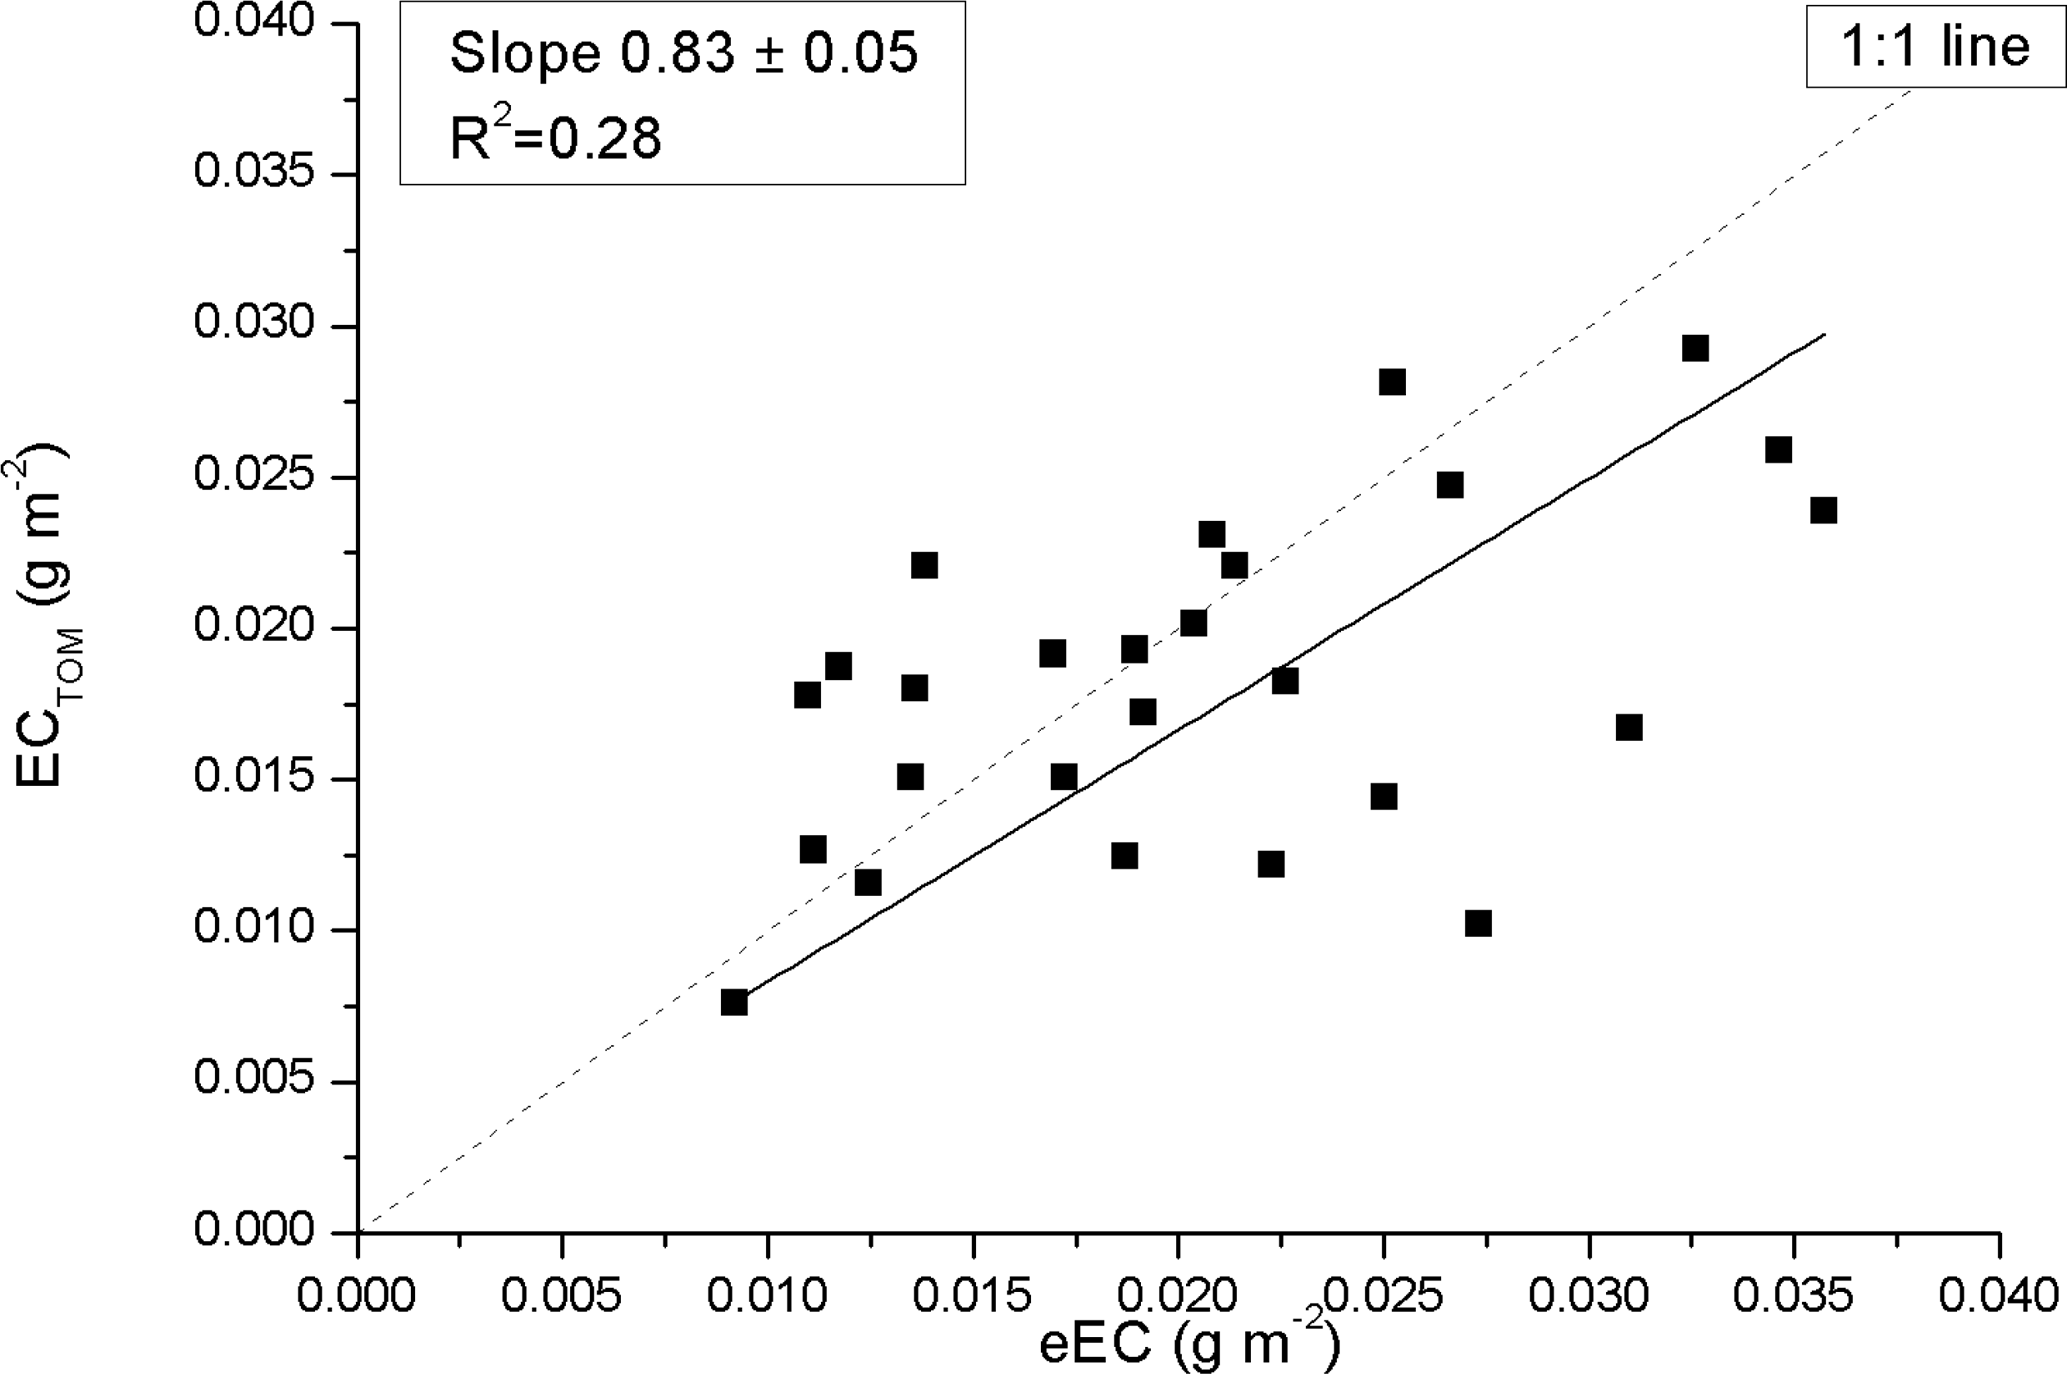
Figure 5EC amount observed by the TOM (ECTOM) for chimney soot and SiC mixtures as a function of estimated EC (eEC), using a PSAP optical depth signal before and after heating the filter and using the MACeff,EC of 39.8 m2 g−1 from Fig. 3.
Based on the relations established for EC and SiC individually in Figs. 3 and 4, respectively, it is possible to retrieve their separate concentrations from a mixture based on the change in filter transmission before and after heating the filter. The consistent results from these laboratory tests gives confidence in the applicability of applying this method on our ambient samples from India and Finland.

Figure 6Comparison between the weighed SiC amounts added to the water and the optically derived SiC density on the substrate. The data is for Chimney soot and SiC mixtures, with two alternative slopes; one containing all data points (1.02), and one excluding three data points in the top right of graph (0.88).
3.2 Ambient snow samples
3.2.1 EC in snow
In all of the Sunderdhunga snow pits, a distinct layer with concentrated impurities was observed. These impurity layers always had the highest EC concentrations (exceeding 300 µg L−1) of each pit (Table 1). For some of the samples from Sunderdhunga taken from the impurity concentrated layers, the substrates were overloaded with material and quantitative impurity values could not be determined (due to not having an initial transmission value). Excluding these heavy impurity layers, the average and median EC concentration for the other snow samples were 141.3 and 101.9 µg L−1. Surface samples taken above 4900 m a.s.l. had EC concentrations in the range of 13.2–65.7 µg L−1. Consisting of relatively fresh snow, these surface samples contained LAI mostly originating from the post-monsoon season.
Previous studies of BC in snow and ice from the Himalayas have shown seasonal variation. At the Mera glacier in Nepal Ginot et al. (2014) showed that BC concentrations peak during the pre-monsoon in a shallow ice core. From the same glacier, Kaspari et al. (2014) observed similar seasonal peaks of BC concentration in snow and firn samples taken above the equilibrium line altitude, where the snow had not undergone any significant summer melt. Interestingly, dust did not show the same strong seasonality as BC in their studies (Ginot et al., 2014; Kaspari et al., 2014).
Measurements of BC in snow taken closest to Sunderdhunga, as reported in the literature, are from about 140 km east-north-east (78∘ heading), at a higher altitude between 5780 and 6080 m a.s.l. Gathered in the surface snow of the Namunani glacier Xu et al. (2006) reported low EC concentrations in the range of 0.3–9.7 µg L−1. The difference between Sunderdhunga and Namunani can probably be attributed to the expected high spatial variability of BC in snow in the area. The difference in sampling altitude and different measurement techniques to determine the EC likely plays a role as well (Xu et al., 2006 used a two-step heating-gas chromatography, similar to method of Lavanchy et al., 1999). The difference could possibly also be explained by the geographical location, with Namunani located on the northern flank of the Himalayas, and it is on the leeward side of the main sources of LAI to the south. Furthermore, it is not explicitly stated in Xu et al. (2006) during which season snow samples were collected, which likewise would affect EC concentrations.
For reference, the EC concentration in the surface snow from the Finnish Arctic were in the range of 6.2–102 µg L−1. Samples from Pallas had an average and median of 40.0 and 31.0 µg L−1, respectively, whereas the samples from Sodankylä had an average of 23.7 µg L−1 and median of 13.1 µg L−1. The higher concentration observed in Pallas might result from the fact that the majority of samples were taken later in the snow season compared to Sodankylä samples and EC has likely concentrated in the surface snow later in the season (e.g., Svensson et al., 2013). On a larger scale, the concentrations are in the same magnitude as previous measurements of EC in snow from the European Arctic (Forsström et al., 2013; Meinander et al., 2013; Svensson et al., 2013).
In the site specific derived MAC values there is a significant difference. In Fig. 7 the optical depth of EC (τEC) is plotted as a function of the analyzed EC (with TOM) for all of the snow samples. The slopes for the three sampling sites are 21.0, 21.9, and 17.1 m2 g−1 (Pallas, Sodankylä, and Sunderdhunga, respectively). These values are around half of what the laboratory standard BC tests show (Fig. 3), indicating a smaller absorption efficiency for the EC particles originating from the snow compared to the laboratory particles. This is unexpected, as any non-EC absorbing material or even scattering particles mixed with EC would tend to increase the MAC value compared to pure BC particles (e.g., Cappa et al., 2012; Bond et al., 2013). In our case, we would expect the MAC to be greater for our EC particles originating from snow. A consequence of a lower MAC for the snow EC particles could be that the snow albedo reduction caused by the EC is inaccurate, as the EC particles have less absorbing efficiency. Schwarz et al. (2013) previously reported a lower MAC value for BC particles in the snow compared to airborne BC particles, due to a difference in the measured mean size. The BC particles from the snow were observed to be larger compared to airborne BC particles, explaining the decrease in MAC for the snow particles. The authors further showed how the BC effect in snow albedo reduction is currently overestimated due to the lower MAC for snow BC particles.
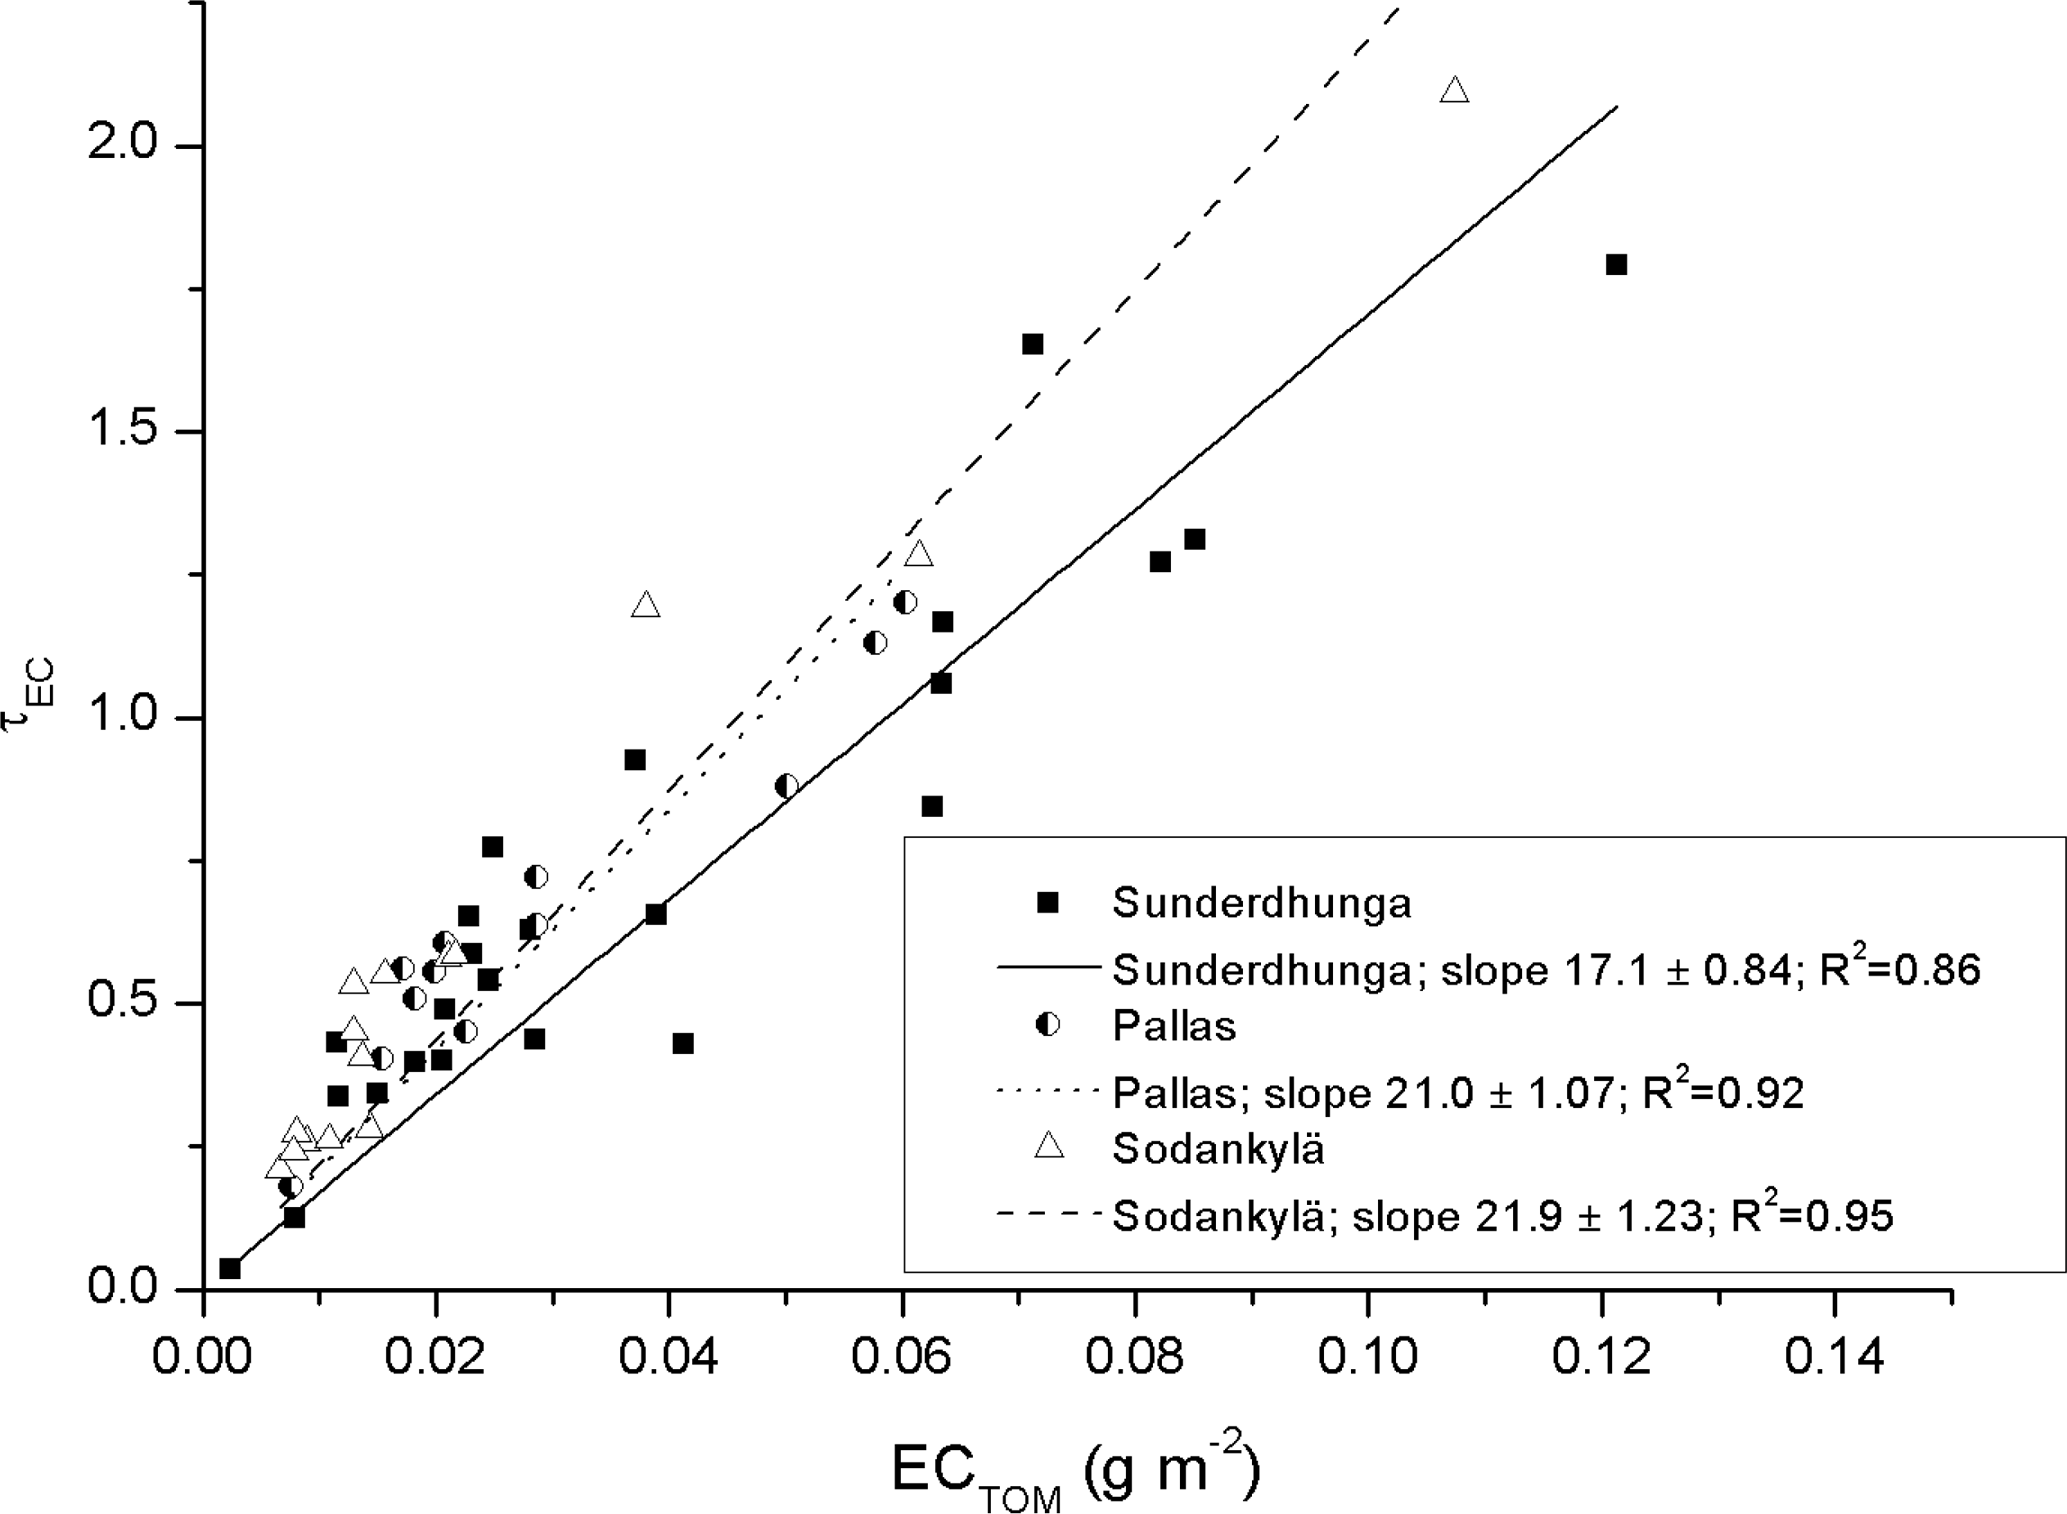
Figure 7The optical depth τEC as function of the analyzed EC based on TOM, for the Arctic and Himalayan samples.
In our case, if the laboratory generated BC consists of smaller particles compared to the snow samples this could lead to a larger MAC value for the lab-standards. The size distribution of the BC particles in the filters are unknown to us, but as suggested by the modeled MAC curve, presented in Fig. 8, this size dependence can play a role. The modeled MAC for theoretical BC particles demonstrates a decrease in MAC with particle size, particularly for particles larger than about 130 nm. The absorption efficiencies were calculated for λ = 526 nm by using the Mie code of Barber and Hill (1990) and for BC we use the same complex refractive index of 1.85 − 0.71i that was used by Lack and Cappa (2010) and a particle density of 1.7 g cm−3.
Another hypothesis is related to the fact that the samples are liquids and that the matrix is strongly light scattering and rather thick. It is likely that the liquid will embed the particles deeper into the filter than what is typical for air samples (e.g., Chen et al., 2004). In air and on filter surfaces, BC mixed with a scattering medium shows enhanced absorption. On the samples presented in Table 1, about 90 to 95 % of the carbon is water insoluble organic carbon, whereas the laboratory BC was essentially free from OC. This difference could explain the lower MAC for the ambient samples if the net effect of the added OC actually made the BC a less efficient absorber in this particular matrix. Further tests are required to confirm this hypothesis.
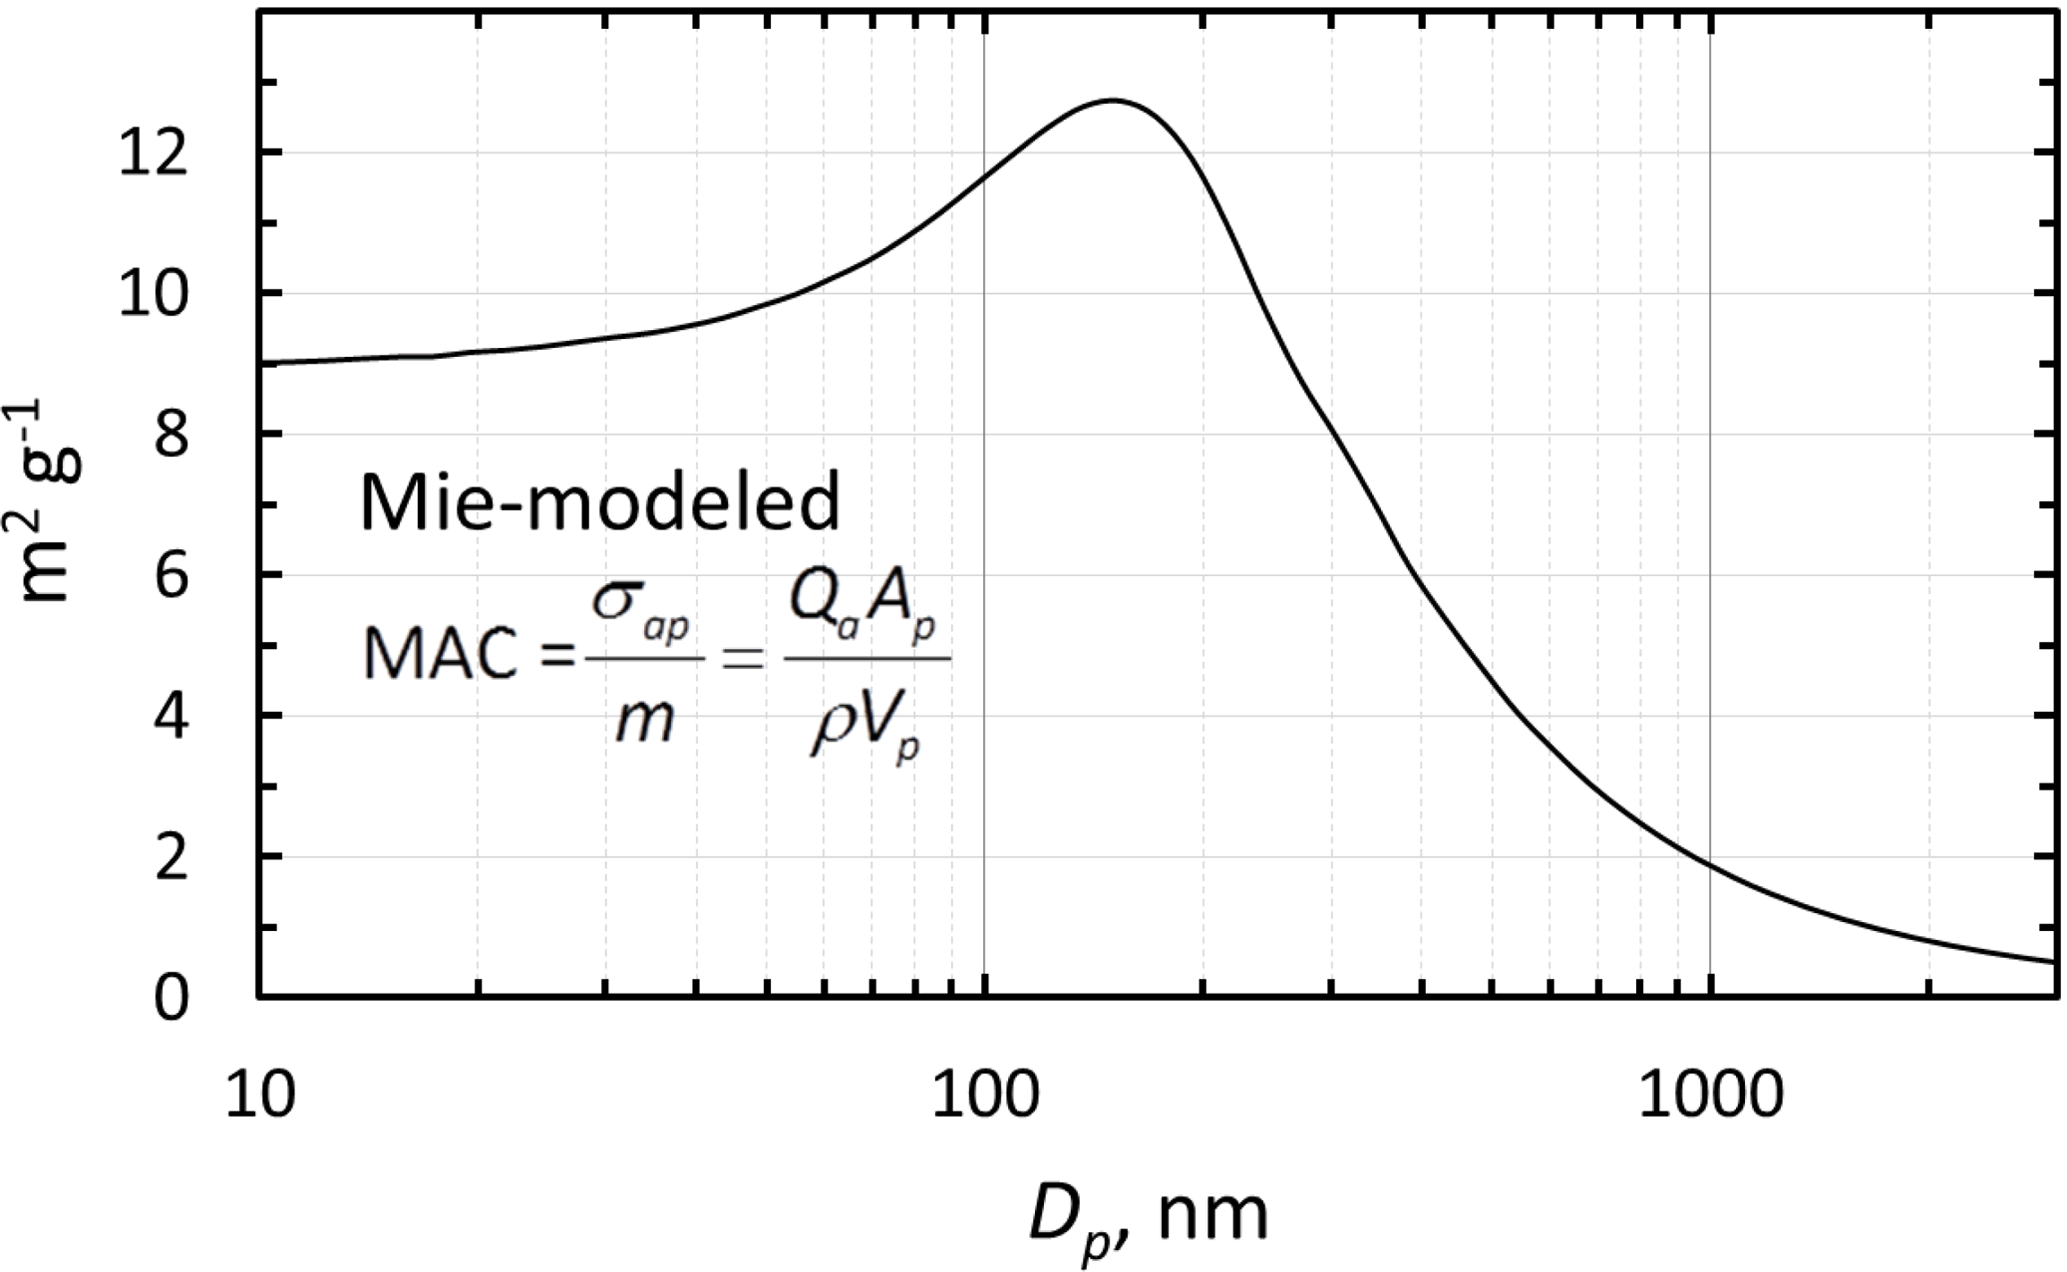
Figure 8Modeled mass absorption coefficient (MAC) of single BC particles as a function of particle diameter at λ = 526 nm.
3.2.2 Dust fraction of LAI in snow
Because the ambient mineral dust MAC value is unknown for our snow samples, it is not possible to use the SiC or stone crush MAC values to estimate the dust content on the filters. Instead, we use the fraction of minerals (fD) expressed in percent of the total optical thickness, to estimate the mineral aerosol contribution to the filter absorption (at λ = 526 nm). In our data set, there is a systematic difference between the two Arctic sites and the Himalayan site (Fig. 9). For Pallas and Sodankylä fD is typically less than 20 %, whereas for Sunderdhunga fD is typically much greater than that, with modes at 35 and 65 %. For the Arctic, the values are broadly in line with previous estimates on the amount of light absorption caused by LAI other than BC, i.e., 30–50 % (e.g., Doherty et al., 2010).
Studies from the Nepalese Himalayas concluded that dust may be responsible for about 40 % of the snow albedo reduction (Kaspari et al., 2014). Similarly, Qu et al. (2014) observed that the contribution of dust to albedo reduction can reach as much as 56 % on a glacier in the Tibetan plateau. Our dust estimate, as a fraction of the optical depth of LAI on the filter, shows similar results or an even greater fraction of dust than these previous studies, highlighting the importance of dust (see also Fig. 10a) causing albedo reduction in this region of the Himalayas.
3.2.3 Vertical distribution of LAI in Sunderdhunga
An average of the vertical profiles from pits C, D, and E is presented for EC and fD in Fig. 10a.
The variables plotted in Fig. 10b display layers of enhanced amounts of both dust and EC, located between ice layers, and additionally high values at the top of the pit above the first ice layer. These layers are interpreted as indicators for seasonal variation at this location, with alternating melt and refreezing periods marked by the ice layers. As the ice layers and the enhancements in LAI are interleaved it suggests that the impurities were deposited on the glacier mainly in-between the melt and refreeze periods. In addition, the melting seems to take place in a relative shallow layer at the surface and does not protrude deeply, which may cause the annual layers to mix (Doherty et al., 2013). The observed variation in EC and dust values could correspond to the findings of Ginot et al. (2014) and Kaspari et al. (2014) who showed annually peaking BC concentrations in the pre-monsoon in Himalayan ice cores. However, between the ice layers at ca. 65 and 85 cm, no clear peak is observed in EC or dust values (Fig. 10b), which could either indicate that no peak occurred during that particular year, or an ice layer formed at ca. 65 cm in the middle of the year, as potentially occurred at ca. 105 cm.
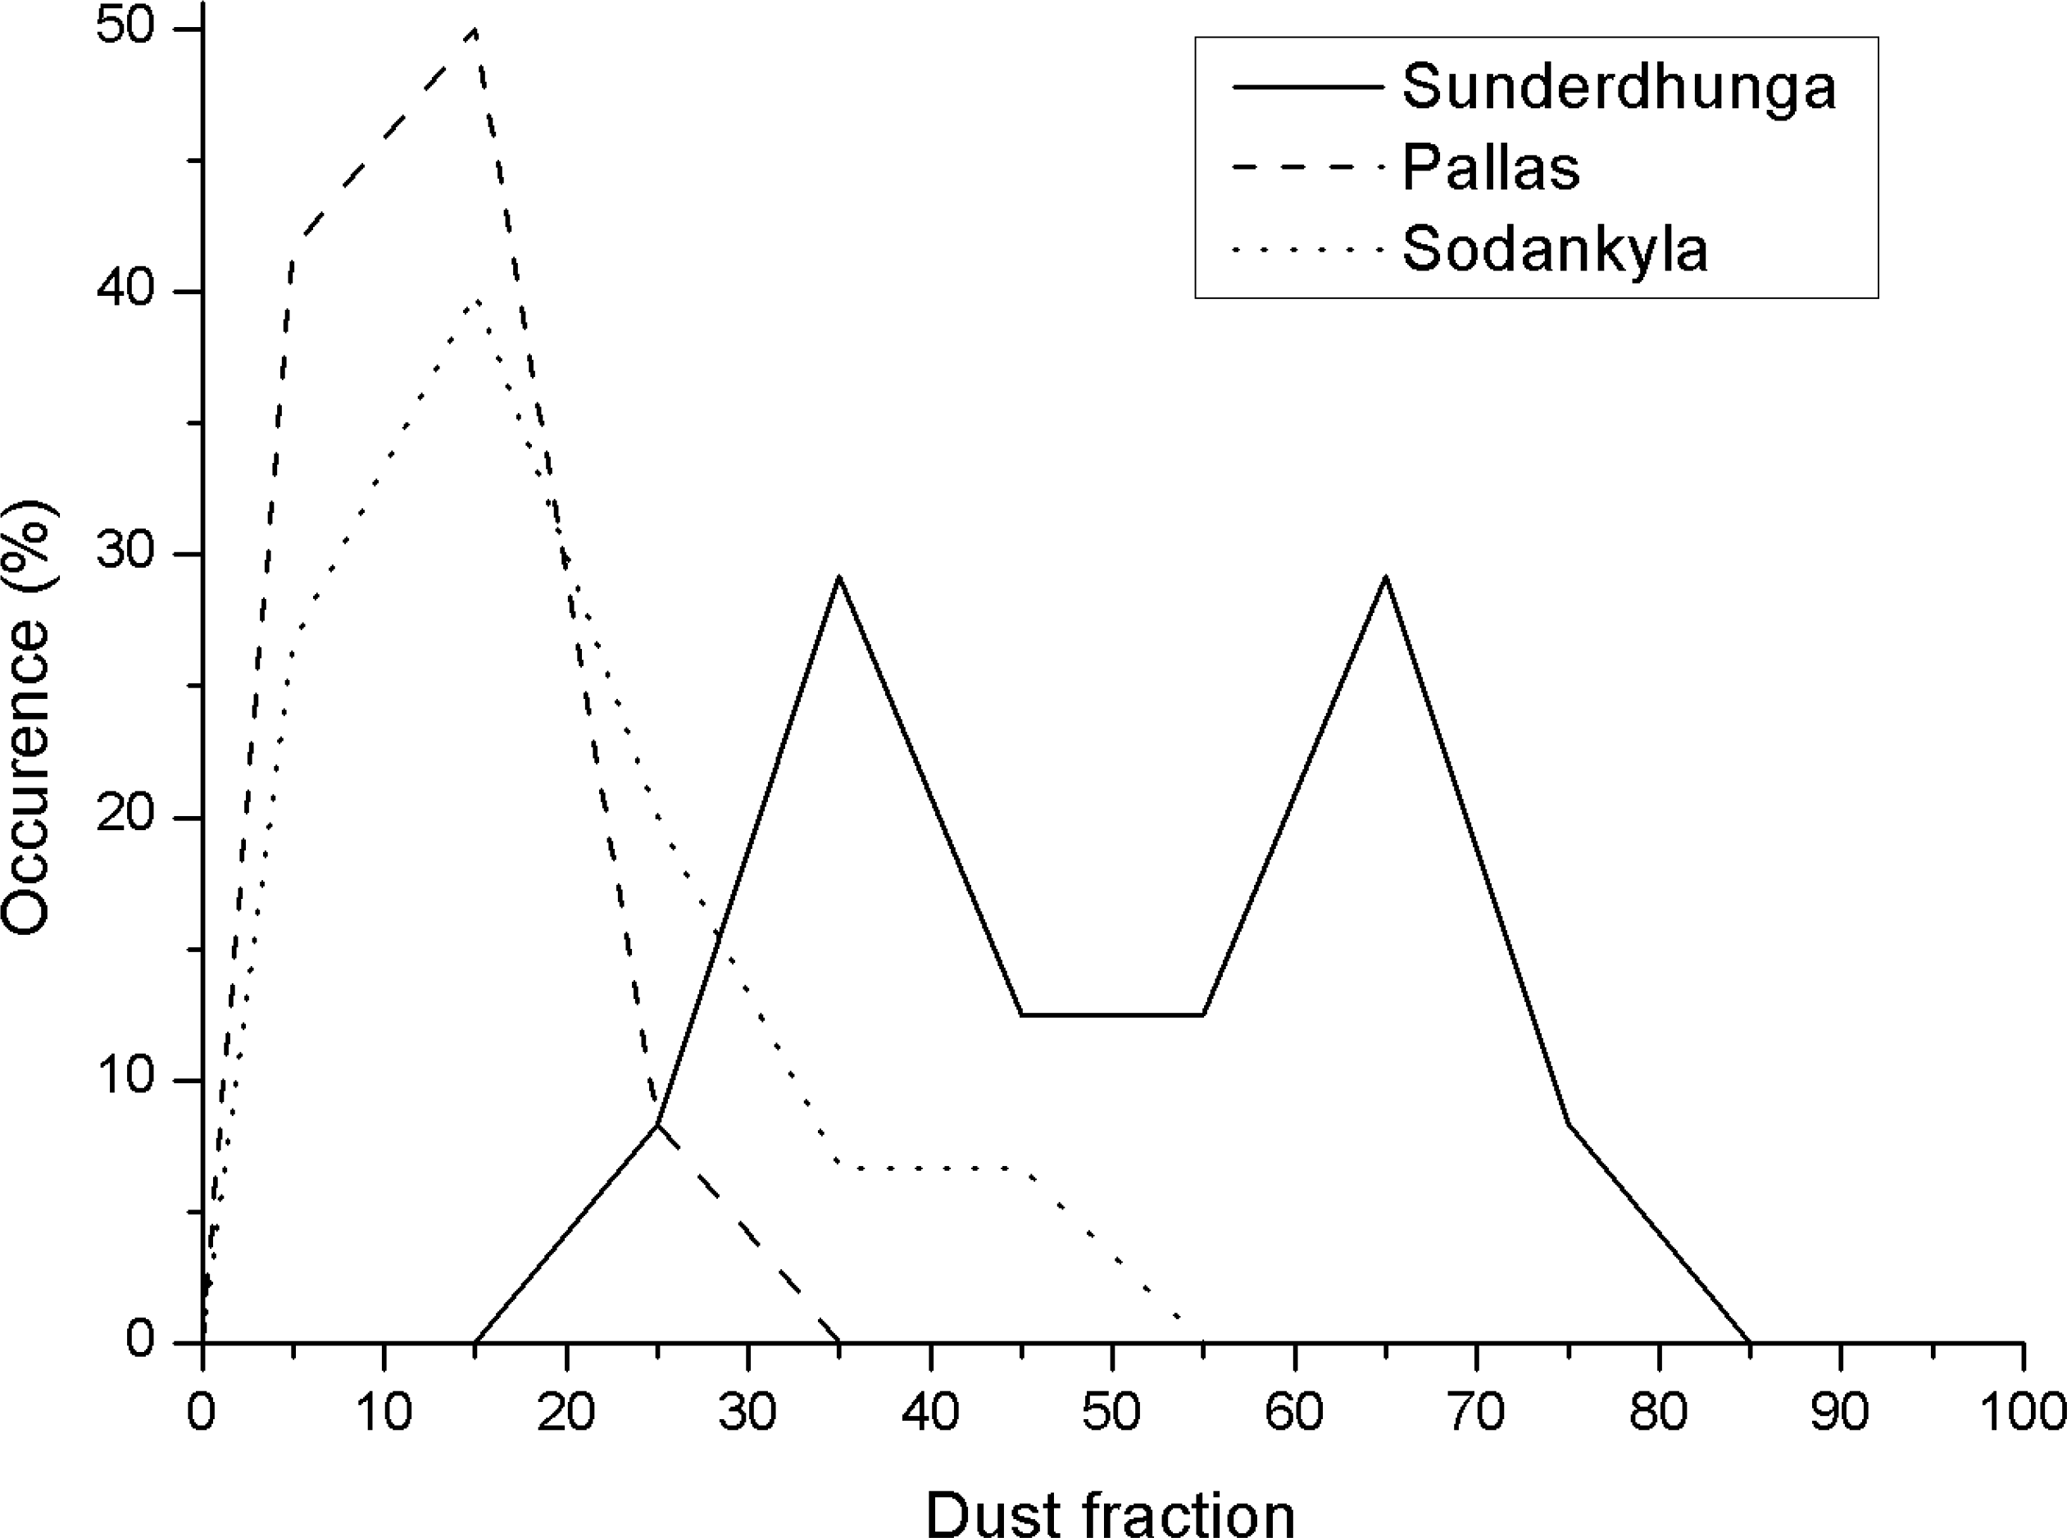
Figure 9Frequency of the occurrence of dust optical thickness fractions at the three sampling sites.
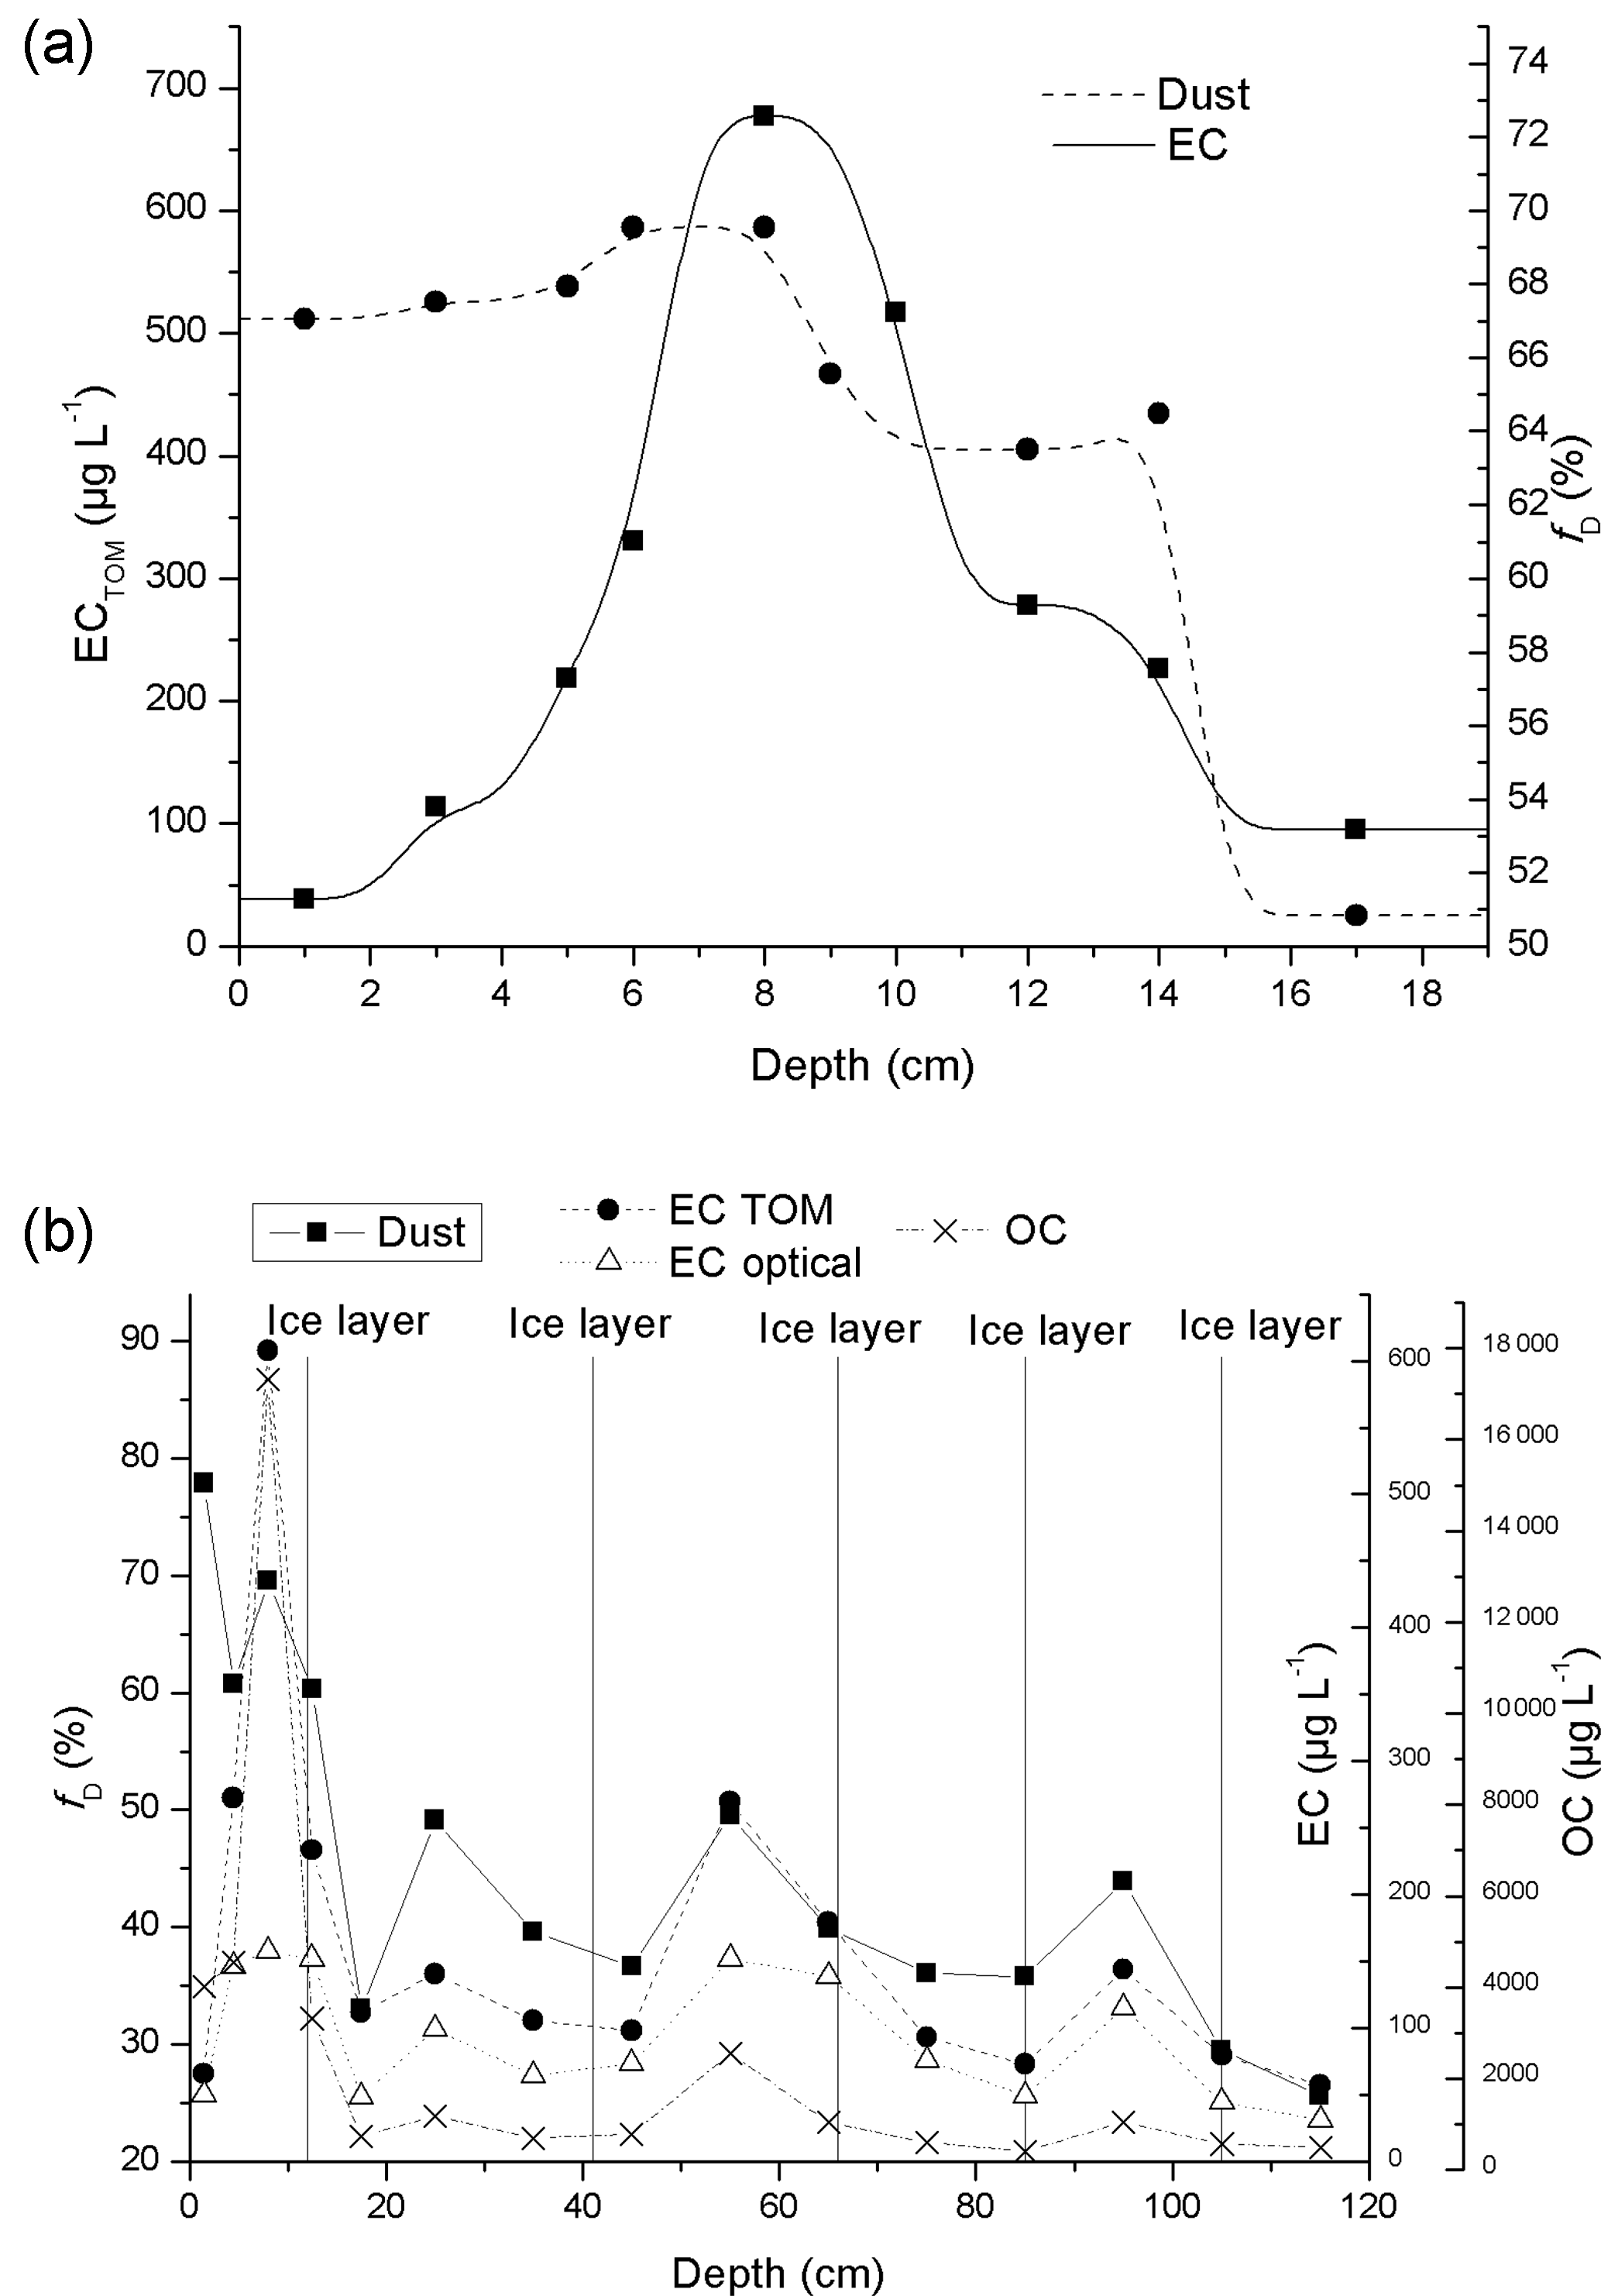
Figure 10(a) Profile displaying average EC concentration and dust fraction from snow pits C and D (Durga Kot glacier), and snow pit E (Bhanolti glacier); (b) complete vertical profile E, taken at Bhanolti glacier.
The snow pit potentially covers five years of snow accumulation which is certainly too short a time period to make any conclusions on a temporal trend of LAI variations at the site. However, an evident increase in LAI is present, especially in the top 20 cm. Due to the time span of the snow pit we cannot know for certain whether this increase presents a short term pollution event or indicates increasing LAI at the site over a longer time period. We have two hypotheses for the observed increase in EC concentrations and the fraction of dust occurring in the top layer of the snow pit. The higher values may be a consequence of increased ambient EC and dust concentrations in the area, causing increased dry and wet deposition fluxes of these impurities to the glacier, even when assuming constant precipitation. Moreover, as it is fD that increases, the deposition of dust would have had to increase proportionally more than EC and OC. This could be a result of larger areas in the region being free of snow or changes in the wind characteristics (e.g., stronger winds and/or change in direction). Conversely, local changes in the net snow mass balance due to a larger fraction of the snow being sublimated in the time period covered by the top 20 cm in comparison to the deeper layers, may partly explain the increased EC and dust absorption values at the top of the pit. Both of these basic scenarios can be in effect at the same time.
Here observations of LAI in snow originating from two glaciers in the Indian Himalayas are first presented with a method not used widely before to determine LAI in snow. Consisting of a custom built PSAP and an OCEC analyzer, the attenuation of light is studied on quartz filters, providing estimates on the fraction of light-absorbance caused by non-EC constituents in LAI. Himalayan data display a much greater light-absorbance by dust in the LAI compared to filter samples originating from the seasonal snowpack of Arctic Finland. The role of dust in reducing the snow albedo in this part of Himalayan glaciers needs to be further evaluated, as our results suggest that it might be the dominating LAI in the snow. Our measurements further reveal that the optical properties of EC are different for laboratory-generated soot compared to EC deposited on snow. Our finding of a MAC value of about half of the laboratory EC for the ambient EC particles could have implications for the snow albedo reduction caused by EC. Over approximately the last five year period in the Himalayas, EC concentrations in the snow display signs of increase in the top part of the snow pit compared to deeper layers. Additional work on the optical properties of EC in snow are needed to enable more accurate estimates of albedo reduction caused by EC in snow, both spatially and temporally. This should be done by measuring the EC particles light-absorption properties while in the snow, as the ambient conditions could be different than laboratory settings.
Data are available upon request from the listed contact author.
The authors declare that they have no conflict of interest.
This work has been supported by the Academy of Finland projects: “Absorbing
Aerosols and Fate of Indian Glaciers” (AAFIG; project number 268004),
“Greenhouse gas, aerosol and albedo variations in the changing Arctic”
(project number 269095), and “Novel Assessment of Black Carbon in the
Eurasian Arctic: From Historical Concentrations and Sources to Future
Climate Impacts” (NABCEA (project number 296302). The Academy of Finland
Center of Excellence program (project number 272041), as well as the Nordic
research and innovation initiative “Cryosphere-Atmosphere Interactions in a
Changing Arctic Climate” have also supported this work. Jonas Svensson is
thankful for the support from Svenska Kulturfonden. We would like to thank
the providers of the soot Consti Taloteknikka, and Göran Lidén at SU
Luftlab for the mineral samples. The ACES department at Stockholm
University, is part of the Bolin Centre for Climate Research. Finally we
would like to thank the participants of the AAFIG 2015 expedition, including
Sherpas and guides from Real Adventure, for their work during the
expedition.
Edited by: Mingjin Tang
Reviewed by: three anonymous referees
AMAP: The Impact of Black Carbon on Arctic Climate. Arctic Monitoring and Assessment Programme (AMAP), Oslo, Norway, 72 pp., 2011.
Aoki, T., Motoyoshi, H., Kodama, Y., Yasunari, T. J., Sugiura, K., and Kobayashi, H.: Atmospheric aerosol deposition on snow surfaces and its effect on albedo, SOLA, 2, 13–16, https://doi.org/10.2151/sola.2006-004, 2006.
Barber, P. W. and Hill, S. C.: Light scattering by particles: Computational methods, World Scientific Publishing, Singapore, 1990.
Birch, M. E. and Cary R. A.: Elemental carbon-based method for monitoring occupational exposures, to particulate diesel exhaust, Aerosol Sci. Tech., 25, 221–241, 1996.
Bolch, T., Kulkarni, A., Kääb, A., Huggel, C., Paul, F., Cogley, J. G., Frey, H., Kargel, J. S., Fujita, K., Scheel, M., Bajracharya, S., and Stoffel, M.: The State and Fate of Himalayan Glaciers, Science, 336, 310–314, https://doi.org/10.1126/science.1215828, 2012.
Bond, T. C., Anderson, T. L., and Campbell, D.: Calibration and Intercomparison of Filter-Based Measurements of Visible Light Absorption by Aerosols, Aerosol Sci. Tech., 30, 582–600, 1999.
Bond, T. C., Doherty, S. J., Fahey, D. W., Forster, P. M., Berntsen, T., DeAngelo, B. J., Flanner, M. G, Ghan, S., Kärcher, B., Koch, D., Kinne, S., Kondo, Y., Quinn, P. K., Sarofim, M. F., Schultz, M. G., Schulz, M., Venkataraman, C., Zhang, H., Zhang, S., Bellouin, N., Guttikunda, S. K., Hopke, P. K., Jacobson, M. Z., Kaiser, J. W., Klimont, Z., Lohmann, U., Schwarz, J. P., Shindell, D., Storelvmo, T., Warren, S. G., and Zender, C. S.: Bounding the role of black carbon in the climate system: A scientific assessment, J. Geophys. Res.-Atmos., 188, 5380–5552, https://doi.org/10.1002/jgrd.50171, 2013.
Cachier, H., Bremond, M. P., and Buat-Ménard, P.: Determination of atmospheric soot carbon with a simple thermal method, Tellus B, 41B, 379–390, 1989.
Cappa, C., Onasch, T., Massoli, P., Worsnop, D., Bates, T., Cross, E., Davidovits, P., Hakala, J., Hayden, K., Jobson, B., Kolesar, K., Lack, D., Lerner, B., Li, S., Mellon, D., Nuaaman, I., Olfert, J., Petäja, T., Quinn, P., Song, C., Subramanian, R., Williams, E., and Zaveri, R.: Radiative absorption enhancements due to the mixing state of atmospheric black carbon, Science, 337, 1078–1081, https://doi.org/10.1126/science.1223447, 2012.
Cavalli, F., Viana, M., Yttri, K. E., Genberg, J., and Putaud, J.-P.: Toward a standardised thermal-optical protocol for measuring atmospheric organic and elemental carbon: the EUSAAR protocol, Atmos. Meas. Tech., 3, 79–89, https://doi.org/10.5194/amt-3-79-2010, 2010.
Chen, L.-W. A., Chow, J. C., Watson, J. G., Moosmüller, H., and Arnott, W. P.: Modeling reflectance and transmittance of quartz-fiber filter samples containing elemental carbon particles: Implications for thermal/optical analysis, J. Aerosol Sci., 35, 765–780, 2004.
Collaud Coen, M., Weingartner, E., Apituley, A., Ceburnis, D., Fierz-Schmidhauser, R., Flentje, H., Henzing, J. S., Jennings, S. G., Moerman, M., Petzold, A., Schmid, O., and Baltensperger, U.: Minimizing light absorption measurement artifacts of the Aethalometer: evaluation of five correction algorithms, Atmos. Meas. Tech., 3, 457–474, https://doi.org/10.5194/amt-3-457-2010, 2010.
Doherty, S. J., Warren, S. G., Grenfell, T. C., Clarke, A. D., and Brandt, R. E.: Light-absorbing impurities in Arctic snow, Atmos. Chem. Phys., 10, 11647–11680, https://doi.org/10.5194/acp-10-11647-2010, 2010.
Doherty, S. J., Grenfell, T. C., Forsström, S., Hegg, D. L., Brandt, R. E., and Warren, S. G.: Observed vertical redistribution of black carbon and other insoluble light-absorbing particles in melting snow, J. Geophys. Res., 118, 1–17, https://doi.org/10.1002/jgrd.50235, 2013.
Doherty, S. J., Hegg, D. A., Johnson, J. E., Quinn, P. K., Schwarz, J. P., Dang, C., and Warren, S. G.: Causes of variability in light absorption by particles in snow at sites in Idaho and Utah, J. Geophys. Res.-Atmos., 121, 4751–4768, https://doi.org/10.1002/2015JD024375, 2016.
Dumont, M., Brun, E., Picard, G., Michou, M., Libois, Q., Petit, J.-R., Geyer, M., Morin, S., and Josse, B.: Contribution of light-absorbing impurities in snow to Greenland's darkening since 2009, Nat. Geosci., 7, 509–512, https://doi.org/10.1038/ngeo2180, 2014.
Forsström, S., Ström, J., Pedersen, C. A., Isaksson, E., and Gerland, S.: Elemental carbon distribution in Svalbard snow, J. Geophys. Res.-Atmos., 114, D19112, https://doi.org/10.1029/2008JD011480, 2009.
Forsström, S., Isaksson, E., Skeie, R. B., Ström, J., Pedersen, C. A., Hudson, S. R., Berntsen, T. K., Lihavainen, H., Godtliebsen, F., and Gerland, S.: Elemental carbon measurements in European Arctic snow packs, J. Geophys. Res.-Atmos., 118, 13614–13627, https://doi.org/10.1002/2013JD019886, 2013.
Gautam, R., Hsu, N. C., Lau, W. K.-M., and Yasunari, T. J.: Satellite observations of desert dust-induced Himalayan snow darkening, Geophys. Res. Lett., 40, 988–993, https://doi.org/10.1002/grl.50226, 2013.
Gertler, C. G., Puppala, S. P., Panday, A., Stumm, D., and Shea, J.: Black carbon and the Himalayan cryosphere: a review, Atmos. Environ., 125, 404–417, doi.org/10.1016/j.atmosenv.2015.08.078, 2016.
Ginot, P., Dumont, M., Lim, S., Patris, N., Taupin, J.-D., Wagnon, P., Gilbert, A., Arnaud, Y., Marinoni, A., Bonasoni, P., and Laj, P.: A 10 year record of black carbon and dust from a Mera Peak ice core (Nepal): variability and potential impact on melting of Himalayan glaciers, The Cryosphere, 8, 1479–1496, https://doi.org/10.5194/tc-8-1479-2014, 2014.
Grenfell, T. C., Doherty, S. J., Clarke, A. D., and Warren, S. G.: Light absorption from particulate impurities in snow and ice determined by spectrophotometric analysis of filters, Appl. Optics, 50, 2037–2048, 2011.
Hagler, G. S. W., Bergin, M. H., Smith, E. A., Dibb, J. E., Anderson, C., and Steig, E. J.: Particulate and water-soluble carbon measured in recent snow at Summit, Greenland, Geophys. Res. Lett., 34, L16505, https://doi.org/10.1029/2007GL030110, 2007.
Hansen, A. D. A., Kapustin, V. N., Kopeikin, V. M., Gillette, D. A., and Bodhaine, B. A.: Optical absorption by aerosol black carbon and dust in a desert region of central Asia, Atmos. Environ., 27, 2527–2531, 1993.
Hinds, W. C.: Aerosol Technology, Wiley-interscience, New York, USA, 1999.
Hyvärinen, A.-P., Raatikainen, T., Brus, D., Komppula, M., Panwar, T. S., Hooda, R. K., Sharma, V. P., and Lihavainen, H.: Effect of the summer monsoon on aerosols at two measurement stations in Northern India – Part 1: PM and BC concentrations, Atmos. Chem. Phys., 11, 8271–8282, https://doi.org/10.5194/acp-11-8271-2011, 2011.
Immerzeel, W. W., van Beek, L. P. H., and Bierkens, M. F. P.: Climate Change Will Affect the Asian Water Towers, Science, 328, 1382–1385, https://doi.org/10.1126/science.1183188, 2010.
Jankowski, N., Schmidl, C., Marr, I. L., Bauer, H., and Puxbaum, H.: Comparison of methods for the quantification of carbonate carbon in atmospheric PM10 aerosol samples, Atmos. Environ., 42, 8055–8064, 2008.
Kääb, A., Berthier, E., Nuth, C., Gardelle, J., and Arnaud, Y.: Contrasting patterns of early 21st century glacier mass change in the Himalaya, Nature, 488, 495–498, https://doi.org/10.1038/nature11324, 2012.
Karanasiou, A., Diapouli, E., Cavalli, F., Eleftheriadis, K., Viana, M., Alastuey, A., Querol, X., and Reche, C.: On the quantification of atmospheric carbonate carbon by thermal/optical analysis protocols, Atmos. Meas. Tech., 4, 2409–2419, https://doi.org/10.5194/amt-4-2409-2011, 2011.
Kaspari, S. D., Schwikowsk, M., Gysel, M., Flanner, M. G., Kang, S., Hou, S., and Mayewski, P. A.: Recent increase in black carbon concentrations from a Mt. Everest ice core spanning 1860–2000 AD, Geophys. Res. Lett., 38, L04703, https://doi.org/10.1029/2010GL046096, 2011.
Kaspari, S., Painter, T. H., Gysel, M., Skiles, S. M., and Schwikowski, M.: Seasonal and elevational variations of black carbon and dust in snow and ice in the Solu-Khumbu, Nepal and estimated radiative forcings, Atmos. Chem. Phys., 14, 8089–8103, https://doi.org/10.5194/acp-14-8089-2014, 2014.
Krecl, P., Ström, J., and Johansson, C.: Carbon content of atmospheric aerosols in a residential area during the wood combustion season in Sweden, Atmos. Environ., 41, 6974–6985, 2007.
Lack, D. A. and Cappa, C. D.: Impact of brown and clear carbon on light absorption enhancement, single scatter albedo and absorption wavelength dependence of black carbon, Atmos. Chem. Phys., 10, 4207–4220, https://doi.org/10.5194/acp-10-4207-2010, 2010.
Lavanchy, V. M. H., Gäggler, H. W., Schotterer, U., Schwikowski, M., and Baltensperger, U.: Historical record of carbonaceous particle concentrations from a European high-alpine glacier (Colle Gnifetti, Switzerland), J. Geophys. Res., 104, 21227–21236, https://doi.org/10.1029/1999JD900408, 1999.
Lim, S., Faïn, X., Zanatta, M., Cozic, J., Jaffrezo, J.-L., Ginot, P., and Laj, P.: Refractory black carbon mass concentrations in snow and ice: method evaluation and inter-comparison with elemental carbon measurement, Atmos. Meas. Tech., 7, 3307–3324, https://doi.org/10.5194/amt-7-3307-2014, 2014.
Lutz, S., Anesio, A. M., Raiswell, R., Edwards, A., Newton, R. J., Gill, F., and Benning, L. G.: The biogeography of red snow microbiomes and their role in melting arctic glaciers, Nat. Commun., 7, 11968, https://doi.org/10.1038/ncomms11968, 2016.
McConnell, J. R., Edwards, R., Kok, G. L., Flanner, M. G., Zender, C. S., Saltzman, E. S., Banta, J. R., Pasteris, D. R., Carter, M. M., and Kahl, J. D. W.: 20th century industrial black carbon emissions altered arctic climate forcing, Science, 317, 1381–1384, https://doi.org/10.1126/science.1144856, 2007.
Meinander, O., Kazadzis, S., Arola, A., Riihelä, A., Räisänen, P., Kivi, R., Kontu, A., Kouznetsov, R., Sofiev, M., Svensson, J., Suokanerva, H., Aaltonen, V., Manninen, T., Roujean, J.-L., and Hautecoeur, O.: Spectral albedo of seasonal snow during intensive melt period at Sodankylä, beyond the Arctic Circle, Atmos. Chem. Phys., 13, 3793–3810, https://doi.org/10.5194/acp-13-3793-2013, 2013.
Ming, J., Cachier, H., Xiao, C., Qin, D., Kang, S., Hou, S., and Xu, J.: Black carbon record based on a shallow Himalayan ice core and its climatic implications, Atmos. Chem. Phys., 8, 1343–1352, https://doi.org/10.5194/acp-8-1343-2008, 2008.
Ming, J., Xiao, C., Du, Z., and Yang, X.: An Overview of Black Carbon Deposition in High Asia Glaciers and its Impacts on Radiation Balance, Adv. Water Resour., 55, 80–87, 2013.
Ming, J., Wang, Y., Du, Z., Zhang, T., Guo, W., Xiao, C., Xu, X., Ding, M., Zhang, D., and Yang, W.: Widespread albedo decreasing and induced melting of Himalayan snow and ice in the early 21st century, PLoS One, 10, e0126235. https://doi.org/10.1371/journal.pone.0126235, 2015.
Painter, T. H., Barrett, A. P., Landry, C. C., Neff, J. C., Cassidy, M. P., Lawrence, C. R., McBride, K. E., and Farmer, G. L.: Impact of disturbed desert soils on duration of mountain snow cover, Geophys. Res. Lett., 34, L12502, https://doi.org/10.1029/2007GL030284, 2007.
Painter, T. H., Skiles, S. M., Deems, J. S., Bryant, A. C., and Landry C. C.: Dust radiative forcing in snow of the Upper Colorado River Basin: 1. A 6 year record of energy balance, radiation, and dust concentrations, Water Resour. Res., 48, W07521, https://doi.org/10.1029/2012wr011985, 2012.
Qian,Y., Yasunari, T. J., Doherty, S. J., Flanner, M. G., Lau, W. K., Ming, J., and Zhang, R.: Light-absorbing particles in snow and ice: measurement and modeling of climatic and hydrological impact, Adv. Atmos. Sci., 32, 64–91, https://doi.org/10.1007/s00376-014-0010-0, 2015.
Qu, B., Ming, J., Kang, S.-C., Zhang, G.-S., Li, Y.-W., Li, C.-D., Zhao, S.-Y., Ji, Z.-M., and Cao, J.-J.: The decreasing albedo of the Zhadang glacier on western Nyainqentanglha and the role of light-absorbing impurities, Atmos. Chem. Phys., 14, 11117–11128, https://doi.org/10.5194/acp-14-11117-2014, 2014.
Raatikainen, T., Brus, D., Hooda, R. K., Hyvärinen, A.-P., Asmi, E., Sharma, V. P., Arola, A., and Lihavainen, H.: Size-selected black carbon mass distributions and mixing state in polluted and clean environments of northern India, Atmos. Chem. Phys., 17, 371–383, https://doi.org/10.5194/acp-17-371-2017, 2017.
Ruppel, M. M., Isaksson, E., Ström, J., Beaudon, E., Svensson, J., Pedersen, C. A., and Korhola, A.: Increase in elemental carbon values between 1970 and 2004 observed in a 300-year ice core from Holtedahlfonna (Svalbard), Atmos. Chem. Phys., 14, 11447–11460, https://doi.org/10.5194/acp-14-11447-2014, 2014.
Schmitt, C. G., All, J. D., Schwarz, J. P., Arnott, W. P., Cole, R. J., Lapham, E., and Celestian, A.: Measurements of light-absorbing particles on the glaciers in the Cordillera Blanca, Peru, The Cryosphere, 9, 331–340, https://doi.org/10.5194/tc-9-331-2015, 2015.
Schwarz, J. P., Doherty, S. J., Li, F., Ruggiero, S. T., Tanner, C. E., Perring, A. E., Gao, R. S., and Fahey, D. W.: Assessing Single Particle Soot Photometer and Integrating Sphere/Integrating Sandwich Spectrophotometer measurement techniques for quantifying black carbon concentration in snow, Atmos. Meas. Tech., 5, 2581–2592, https://doi.org/10.5194/amt-5-2581-2012, 2012.
Schwarz, J. P., Gao, R. S., Perring, A. E., Spackman, J. R., and Fahey, D. W.: Black carbon aerosol size in snow, Nat. Sci. Reports, 3, 1356, https://doi.org/10.1038/srep01356, 2013.
Svensson, J. Ström, J., Hansson, M., Lihavainen, H., and Kerminen, V.-M.: Observed metre scale horizontal variability of elemental carbon in surface snow, Environ. Res. Lett., 8, 034012, https://doi.org/10.1088/1748-9326/8/3/034012, 2013.
Svensson, J., Virkkula, A., Meinander, O., Kivekäs, N., Hannula, H.-R., Järvinen, O., Peltoniemi, J. I., Gritsevich, M., Heikkilä, A., Kontu, A., Neitola, K., Brus, D., Dagsson-Waldhauserova, P., Anttila, K., Vehkamäki, M., Hienola, A., de Leeuw, G., and Lihavainen, H.: Soot-doped natural snow and its albedo – results from field experiments, Boreal Environ. Res., 21, 481–503, 2016.
Thevenon, F., Anselmetti, F. S., Bernasconi, S. M., and Schwikowski, M.: Mineral dust and elemental black carbon records from an Alpine ice core (Colle Gnifetti glacier) over the last millennium, J. Geophys. Res., 114, D17102, 102, https://doi.org/10.1029/2008JD011490, 2009.
Virkkula, A., Ahlquist, N. C., Covert, D. S., Arnott, W. P., Sheridan, P. J., Quinn, P. K., and Coffman, D. J.: Modification, Calibration and a Field Test of an Instrument for Measuring Light Absorption by Particles, Aerosol Sci. Tech., 39, 68–83, 2005.
Wang, M., Xu, B., Zhao, H., Cao, J., Joswiak, D., Wu, G., and Lin, S.: The Influence of Dust on Quantitative Measurements of Black Carbon in Ice and Snow when Using a Thermal Optical Method, Aerosol Sci. Tech., 46, 60–69, https://doi.org/10.1080/02786826.2011.605815, 2012.
Warren, S. G. and Wiscombe, W. J.: A model for the spectral albedo of snow. II: Snow containing atmospheric aerosols, J. Atmos. Sci., 37, 2734–2745, 1980.
Xu, B., Yao, T., Liu, X., and Wang, N.: Elemental and organic carbon measurements with a two-step heating-gas chromatography system in snow samples from the Tibetan Plateau, Ann. Glaciol., 43, 257–262, 2006.
Xu, B., Cao, J., Hansen, J., Yao, T., Joswiak, D. R., Wang, N., Wu, G., Wang, M., Zhao, H., Yang, W., Liu, X., and He, J.: Black soot and the survival of Tibetan glaciers, P. Natl. Acad. Sci. USA, 106, 22114–22118, https://doi.org/10.1073/pnas.0910444106, 2009.
Yang, S., Xu, B., Cao, J., Zender, C. S., and Wang, M.: Climate effect of black carbon aerosol in a Tibetan Plateau glacier, Atmos. Environ., 111, 71–78, https://doi.org/10.1016/j.atmosenv.2015.03.016, 2015.