the Creative Commons Attribution 3.0 License.
the Creative Commons Attribution 3.0 License.
Comparison of VOC measurements made by PTR-MS, adsorbent tubes–GC-FID-MS and DNPH derivatization–HPLC during the Sydney Particle Study, 2012: a contribution to the assessment of uncertainty in routine atmospheric VOC measurements
Erin Dunne
Ian E. Galbally
Min Cheng
Paul Selleck
Suzie B. Molloy
Sarah J. Lawson
Understanding uncertainty is essential for utilizing atmospheric volatile organic compound (VOC) measurements in robust ways to develop atmospheric science. This study describes an inter-comparison of the VOC data, and the derived uncertainty estimates, measured with three independent techniques (PTR-MS, proton-transfer-reaction mass spectrometry; GC-FID-MS, gas chromatography with flame-ionization and mass spectrometric detection; and DNPH–HPLC, 2,4-dinitrophenylhydrazine derivatization followed by analysis by high-performance liquid chromatography) during routine monitoring as part of the Sydney Particle Study (SPS) campaign in 2012. Benzene, toluene, C8 aromatics, isoprene, formaldehyde and acetaldehyde were selected for the comparison, based on objective selection criteria from the available data. Bottom-up uncertainty analyses were undertaken for each compound and each measurement system. Top-down uncertainties were quantified via the inter-comparisons. In all seven comparisons, the correlations between independent measurement techniques were high with R2 values with a median of 0.92 (range 0.75–0.98) and small root mean square of the deviations (RMSD) of the observations from the regression line with a median of 0.11 (range 0.04–0.23 ppbv). These results give a high degree of confidence that for each comparison the response of the two independent techniques is dominated by the same constituents. The slope and intercept as determined by reduced major axis (RMA) regression gives a different story. The slopes varied considerably with a median of 1.25 and a range of 1.16–2.01. The intercepts varied with a median of 0.04 and a range of −0.03 to 0.31 ppbv. An ideal comparison would give a slope of 1.00 and an intercept of 0.
Some sources of uncertainty that are poorly quantified by the bottom-up uncertainty analysis method were identified, including: contributions of non-target compounds to the measurement of the target compound for benzene, toluene and isoprene by PTR-MS as well as the under-reporting of formaldehyde, acetaldehyde and acetone by the DNPH technique. As well as these, this study has identified a specific interference of liquid water with acetone measurements by the DNPH technique.
These relationships reported for Sydney 2012 were incorporated into a larger analysis with 61 similar published inter-comparison studies for the same compounds. Overall, for the light aromatics, isoprene and the C1–C3 carbonyls, the uncertainty in a set of measurements varies by a factor of between 1.5 and 2. These uncertainties (∼50 %) are significantly higher than uncertainties estimated using standard propagation of error methods, which in this case were ∼22 % or less, and are the result of the presence of poorly understood or neglected processes that affect the measurement and its uncertainty. The uncertainties in VOC measurements identified here should be considered when assessing the reliability of VOC measurements from routine monitoring with individual, stand-alone instruments; when utilizing VOC data to constrain and inform air quality and climate models; when using VOC observations for human exposure studies; and for comparison with satellite retrievals.
- Article
(2056 KB) -
Supplement
(400 KB) - BibTeX
- EndNote


Volatile organic compounds (VOCs) in the atmosphere have important roles in processes leading to formation of ozone and secondary organic aerosol, and quantitative measurements of VOCs are important for source reconciliation, verification of atmospheric models and exposure assessment. While atmospheric VOC measurements commenced around 60 years ago, measurement techniques are still rapidly evolving and the uncertainties associated with these measurements are often poorly understood. Assessment of uncertainty for VOC measurement techniques by standard methods (Harris, 2003; JCGM, 2008) often underestimates what happens in practice because of the presence of poorly understood or neglected processes that affect the measurement and its uncertainty. However comparison of independent techniques for measuring individual VOCs provides a more critical test of uncertainties. Inter-comparison of independent techniques and their quantification of measurement uncertainty can collectively contribute significantly to the tasks of validation of a wider range of new knowledge, particularly where atmospheric VOC observations are used to validate VOC emissions inventories, air chemistry models and human exposure to air toxins.
Uncertainty in measurements of atmospheric constituents, including VOCs, can arise from four components of the measurement process:
-
the pretreatment of the sample (e.g. in the inlet or adsorption, storage and desorption on a cartridge),
-
the matrix in which the sample (and calibration standards) are presented to the detector (e.g. in nitrogen, helium, air or some complex mixture),
-
the presence of interfering compounds in the sample (e.g. co-eluting in chromatography or isobaric compounds in mass spectrometry) and
-
the instrument calibration (e.g. calibration standards used, linearity of detector response).
There are three distinct methods of determining these uncertainties in VOC measurements. In the first approach, one can examine the individual components of a single measurement technique and assess the uncertainty of each and combine these to get a total uncertainty for that method as described in the Guide to Expression of Uncertainty in Measurement (JCGM, 2008). With this approach, one question always remains: were any sources of uncertainty overlooked? The second method is to make multiple paired measurements with different measurement techniques, of either synthetic VOC mixtures in cylinders or from air in chambers, and determine the uncertainty from the resulting paired and replicate measurements. This again only captures a partial contribution to the uncertainty, but it is particularly effective in identifying the presence of unknown sources of uncertainty and complements the first approach. The third approach, used here, is to undertake multiple paired measurements of ambient air. This approach does not allow replicate analyses but has the advantage of including the influence of environmental and operational factors on the measurement uncertainty.
Three independent VOC measurement systems were employed in the study presented here: continuous measurements by proton-transfer-reaction mass spectrometry (PTR-MS), integrated 5–10 h samples on VOC adsorbent tubes with subsequent offline analysis by GC-FID-MS (gas chromatography with flame-ionization and mass spectrometric detection) based on the United States Environmental Protection Agency (USEPA) Method TO 17 (USEPA, 1999a) and integrated 5–10 h samples on 2,4-dinitrophenylhydrazine (DNPH) cartridges with subsequent offline analysis by high-performance liquid chromatography (HPLC) based on USEPA Method TO 11A (USEPA, 1999b). While notable examples exist, e.g. Kajos et al. (2015), there is no widely accepted procedure for assessing uncertainty in PTR-MS measurements. Furthermore, while TO 17 and TO 11A provide quality control criteria they do not provide a procedure for systematic uncertainty analysis.
The Sydney Particle Study (SPS) was an intensive field experiment designed to provide a detailed characterization of the chemical and aerosol composition of the urban atmosphere in Sydney, Australia, in summer 2011 and autumn 2012 (Cope et al., 2014). Sydney is Australia's largest city (population ∼4.3 million) and occasionally (∼3 days yr−1) experiences exceedances of minimum air quality standards for ozone and particulate matter (PM2.5) (OEH, 2015). In Sydney, the VOCs present were dominated by those from biogenic sources, motor vehicles, bushfires and domestic wood heating (CSIRO 2008, Cope et al., 2014).
The second SPS campaign, SPS 2, occurred in autumn from 15 April to 13 May 2012. The measurement site was approximately 1000 km from the parent laboratory, where the equipment was transported and assembled before the study; therefore, we suggest that the results are typical of normal operating conditions for these instruments rather than that of a specially selected intensive inter-comparison study.
The compounds selected for discussion in the proceeding analysis are a subset of the species measured by the PTR-MS, AT-VOC (adsorbent tube VOC sampling) and DNPH techniques in SPS 2. For the full results of the PTR-MS, AT-VOC and DNPH analysis from SPS 2, the reader is referred to Keywood et al. (2016).
We present quantitative comparisons of concentrations of VOCs including (a) C6–C8 aromatic compounds and isoprene by PTR-MS and integrated VOC adsorbent tube measurements with subsequent GC-FID-MS analyses and (b) formaldehyde, acetaldehyde and acetone by PTR-MS measurements and carbonyl compounds sampling onto DNPH cartridges followed by HPLC analysis. The results are discussed with regard to the primary responses, interfering species, standard uncertainty analyses and the limitations of the methods.
The results from this study are compared with other inter-comparison data from the scientific literature and some conclusions about the uncertainty in current VOC measurements presented.
2.1 Measurement site and set-up
The sampling site (33.802∘ S, 150.998∘ E) was located in the Sydney suburb of Westmead, in the grounds of a psychiatric hospital at a position greater than 500 m from major roads. Measurements were conducted over the period 15 April–13 May 2012. The PTR-MS and the sampling apparatus for both the VOC adsorbent tubes and the DNPH cartridges were located in a demountable building surrounded by a grass-covered area with occasional trees and the nearest buildings were >20 m away. The main VOC sampling inlet was ∼1 m above the roofline, consisting of an ∼80 mm O.D. glass inlet of ∼2 m length.
2.2 Carbonyl-DNPH derivatization analysed by HPLC
Ambient air was drawn from the main VOC sample inlet via ∼4 m length of 1∕4-inch Silcosteel tubing into a custom-designed automated sampler. The automated sampler is a continuous air sampler with two channels allowing for simultaneous extractive sampling onto VOC adsorbent tubes and DNPH cartridges. The automated sampler has two inline flow sensors installed after the VOC and DNPH sample manifolds. The 1 min flows measured by the sensors are logged via the automated sampler software, and the total sample volume for each VOC and DNPH sample was determined from the logged flows. The automated sampler was leak checked and the flow sensor calibrated before and after the sample period by measuring the inlet and outlet flows for each sample port, ensuring they agreed within 10 %. The exhaust flow was measured daily during sampling.
Three samples per day (05:00–10:00, 11:00–19:00 and 19:00–05:00; all times are in local time) were collected by the automated sampler which actively drew air through DNPH coated solid silica adsorbent cartridges (Supelco LpDNPH S10, Supelco, Pennsylvania, USA), using a constant flow air sampling pump at a set flow rate of 1 L min−1. One field blank and one lab blank per 10 samples were collected during the sample period. In order to capture potential contamination during transport, storage and handling field blank tubes were uncapped and installed in the automated sampler for the same period as the samples.
There is a known deterioration, over 1 or more days, of derivatized DNPH-carbonyl samples at room temperature. Because of this, the compartment housing the DNPH cartridges in the automated sampler was maintained at ∼7 ∘C and the cartridges were refrigerated before and after sampling. An ozone scrubber (KI impregnated filter) was placed in front of the DNPH cartridges.
The method of DNPH–HPLC sampling employed in this study is compatible with USEPA Method TO-11A (USEPA, 1999b). Following sampling, the derivatives were eluted from the cartridge in 2.5 mL of acetonitrile (HPLC grade, Merck) and analysed by high-performance liquid chromatography consisting of a Dionex GP40 gradient pump, a Waters 717 autosampler, a Shimadzu system controller SCL-10A VP, a Shimadzu diode array detector (DAD) SPD-M10A VP, a Shimadzu column oven CTO-10AS VP and Shimadzu CLASS-VP chromatography software. Compound separation was performed with two Supelco Supelcosil LC-18 columns in series (5 µm, 4.6 mm I.D., 250 mm length, part no. 58298). The chromatographic conditions include a flow rate of 1.6 mL min−1 and an injection volume of 25 µL, and the DAD was operated in the 220–520 nm wavelength range with 360 nm used for mono-carbonyl quantification. The peaks were separated by gradient elution with an initial mobile phase of 64 % acetonitrile and 36 % deionized water (18.2 MΩ⋅cm, Millipore Milli-Q Advantage) for 10 min, followed by a linear gradient to 100 % acetonitrile for 20 min, and with a column temperature of 30 ∘C. A certified liquid standard (Supelco CARB Method 1004 DNPH Mix 2 C/N 47651-U) containing 30 µg mL−1 of each derivatized carbonyl was diluted 1:25 in a volumetric flask. This prepared standard was then used to perform a four-point calibration (0.15, 0.30, 0.6 and 1.2 µg mL−1). Further details of the DNPH method can be found in Lawson et al. (2008).
2.3 VOC adsorbent tubes analysed by GC-FID-MS (AT-VOC)
In SPS 2, three samples per day (05:00–10:00, 11:00–19:00 and 19:00–05:00) were collected by the automated sampler which actively drew air through two multi-adsorbent tubes in series (Markes Carbograph plus Carbopack X) using a constant flow air sampling pump at a set flow rate of 20 mL min−1. Tubes were conditioned and pre-analysed prior to use. Two tubes in series were installed for every sample to check breakthrough for each analyte, which was <5 % for all samples. One field blank and one lab blank per 10 samples were collected during the sample period. In order to capture potential contamination during transport, storage and handling field blank tubes were uncapped and installed in the automated sampler for the same period as the samples. No flow was passed through the blank tubes during the deployment period. Prior to and following sampling, tubes were capped and stored in an airtight metal tins at <4 ∘C.
The adsorbent tubes were analysed by a PerkinElmer TurboMatrixTM 650 ATD (automated thermal desorber) and a Hewlett Packard 6890A gas chromatograph (GC) equipped with flame-ionization detection (FID) and a mass spectrometer (MS).
The method of adsorbent tube VOC sampling and analysis employed in this study was compatible with ISO16017-1:2000 and in accordance with USEPA Compendium Method TO-17 (USEPA, 1999a).
A series of certified gas standards including a BTEX standard (benzene, toluene, ethylbenzene and xylenes) (manufacturer stated accuracy ±2 %) (Air Liquide–Scott Specialty Gases, Longmont, CO, USA), a BTEX plus isoprene standard (National Physical Laboratory, Middlesex, UK) (manufacturer stated accuracy ±2 %), a TO-15 standard (Air Liquide, Plumsteadville, PA, USA) (manufacturer stated accuracy ±5 %) and a photochemical assessment monitoring stations (PAMS) gas standard (Spectra Gases, Linde, NJ, USA) (manufacturer stated accuracy ±5 %) were used to calibrate the GC-FID-MS. The calibration was done via an injection of the calibration gas onto an adsorption tube using a fixed volume temperature-stabilized loop for standards with >2 ppm individual VOCs and via sampling a known volume of calibration gas onto an adsorption tube using a calibrated mass flow controller for standards with <2 ppm individual VOCs. Multiple desorption tests on tubes loaded with a 10 ppm BTEX calibration standard observed response factors on second desorption that were 2 % or less than the response factors from the initial desorption, providing confidence that the analytes in the ambient samples taken during SPS 2 were fully desorbed during the analysis process.
2.4 Proton-transfer-reaction mass spectrometry (PTR-MS)
A flow of 1.5 L min−1 of ambient air was drawn off the main VOC inlet line via a second ∼4 m length of 1∕4-inch O.D. Silcosteel tubing by a constant flow sampling pump through the PTR-MS auxiliary system and the PTR-MS sampled 300 mL min−1 from the auxiliary system.
In SPS 2 a commercially built PTR-MS (Ionicon Analytik, GmbH, Innsbruck, Austria) was utilized for continuous VOC measurements. For a detailed description of PTR-MS the reader is referred to Ellis and Mayhew (2014), de Gouw and Warneke (2007), and Lindinger et al. (1998). Briefly, the instrument consists of a hollow cathode ion source where reagent ions were generated, a drift tube where the reagent ions and the sample were mixed and chemical ionization reactions occurred between the reagent and the analytes, and a quadrupole mass spectrometer (Balzers QMG422) with a secondary electron multiplier operating in pulse counting mode, for sorting and detecting reagent and product ions.
The drift tube was operated at 60 ∘C with and an applied voltage of 445 V and a pressure of 2.16 mbar ( Td). The PTR-MS quadrupole continuously scanned 181 masses between 14 and 200 amu with a dwell time for a single mass (m∕z) of 1 s, generating a full mass scan approximately every 3 min (20 datapoints h−1 ).
Table 1Ambient sampling times from SPS 2 for the PTR-MS, AT-VOC and DNPH–HPLC methods; zero and calibration times for the PTR-MS.
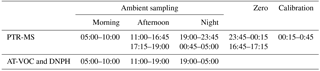
The PTR-MS operated with the aid of custom-built auxiliary equipment that regulated the flow of air in the sample inlet and controlled whether the PTR-MS was sampling ambient or zero air, or calibration gas. The timing and duration of zero, calibration and ambient measurements for SPS 2 are detailed in Table 1. Zero readings were made by diverting ambient air through a zero furnace (350 ∘C) with a platinum wool catalyst that destroyed VOCs in the air before entering the PTR-MS. This zero air had the same mole fractions of H2O and CO2 as the ambient air being sampled, neglecting minor contributions from the oxidation of the VOCs present.
All PTR-MS ion signals from calibration and ambient measurements referred to in this study were background corrected.
Table 2The PTR-MS calibration factors for each of the VOCs included in this work, normalized to 106 counts per second (cps) of H3O+ reagent ions per ppb (ncps ppbv−1) (average H3O+ ion signal =13.5 million cps). The uncertainty limits represent ± the standard deviation (±1σ) of the daily mean in the calibration measurements over the campaign average. N represents the number of 30 min calibration periods used to calculate the sensitivity statistics. The average calibration for formaldehyde is presented in the table; the ambient data processing for formaldehyde utilized a linear equation calibration factor , where the water vapour concentration is in g m−3.
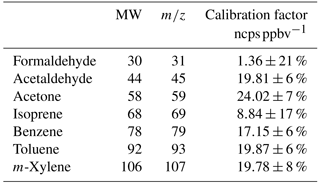
The minimum detectable limit (MDL) for each m∕z scanned by the PTR-MS was determined from the scatter in the zero measurements using the principles of ISO6879 (ISO, 1995). The MDL for a single measurement was set at the 95th percentile of the deviations about the mean zero. This is approximately equal to an S∕N ratio =2. The PTR-MS was calibrated daily for 30 min. For each calibration measurement a set flow of 10–20 mL min−1 of the calibration standard was diluted in a flow 1500 mL min−1 of ambient air that had been passed through the zero furnace. The empirically derived calibration factors for the seven compounds of interest to this study, which were included in the calibration standards, are listed in the Table 2. The scatter (±1σ) of the daily mean in the calibration measurements over the campaign average was ∼10 % (range 6–21 %).
The PTR-MS was calibrated with three certified gas standards containing in total 20 VOC species. These certified gas standards were supplied by Apel-Riemer Environmental Inc. (Broomfield, CO, USA) and Air Liquide–Scott Specialty Gases (Plumsteadville, PA, USA). The stated accuracy for each component in the standards was ±5 %.
The gravimetrically prepared Apel-Riemer standard used to calibrate the PTR-MS contained benzene, toluene and m-xylene, among other components. This standard was also analysed with the GC-FID-MS against a certified BTEX gas standard (Air Liquide–Scott Specialty Gases) (manufacturer stated accuracy ±2 %). The FID response factors for the two standards differed by 5–9 % (BTEX / Apel-Riemer ratios: benzene 0.95, toluene 0.95 and m-xylene 0.91) and we can conclude that the PTR-MS and GC-FID-MS calibrations were compatible within these limits.
Interference in the identification and quantification of a target compound in PTR-MS measurements of ambient air can and frequently does occur due to the presence of products from other reaction pathways such as isobaric compounds, fragment ions from other compounds, isotopologues and products of secondary reactions (Warneke et al., 2003; Rogers et al., 2006; Inomata et al., 2008; Dunne et al., 2012; Kaser et al., 2013). When comparing PTR-MS measurements to more selective VOC measurement techniques such as chromatographic methods, the presence of interference in the target ion signal often results in an apparent positive bias in the PTR-MS reported values. The uncertainty related to mass interference is not incorporated in the bottom-up uncertainty analysis and is investigated here to determine its role where there were significant differences at the 95 % confidence limit between the mean values measured by each instrument.
If the identity of the interferents are known, and their concentration and PTR-MS response (fragmentation patterns and instrument sensitivity) is also known or can be estimated, their contribution to the target m∕z can be quantified and subtracted (e.g. Rogers et al., 2006; Inomata et al., 2008; Dunne et al., 2012). Where possible, for the compounds examined in this study, a method was developed to correct the PTR-MS target ion signal for the presence of known and quantifiable interference. The correction procedure for each compound examined here and the information used to quantify the correction are provided in the supplementary material. The corrected and uncorrected PTR-MS reported values are discussed for each compound in Sect. 3.
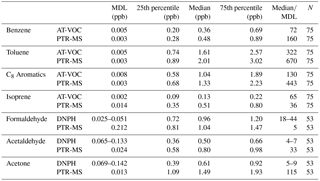
Table 3The MDL and summary statistics (ppb) for the PTR-MS, AT-VOC and DNPH data for each of the seven compounds selected for this study. Note that the DNPH MDL differs between morning afternoon and night samples due to different sampling times result. For the purposes of this table the DNPH MDLs and median / MDLs are quoted as a range.
2.5 Criteria for measurement comparisons
While a number of compounds were measured by both the PTR-MS and AT-VOC or DNPH techniques, only compounds whose data met the following criteria were retained for the analysis:
-
Each PTR-MS sample had an ambient data acquisition period that was >90 % of the integrated sampling period of the AT-VOC or DNPH for each sample.
-
Each compound known to substantially contribute to a given m∕z signal in PTR-MS measurements of the atmosphere was also measured in the AT-VOC and/or DNPH samples.
-
An empirical calibration from measurements of a certified standard containing the compound(s) of interest was available for both techniques being compared.
-
The ratio of the median / MDL was >5 for both datasets for the compounds being compared (Table 3). The relative error of most measurement systems increases with decreasing volume mixing ratio (Horwitz, 1982; de Gouw and Warneke, 2007). Using datasets with median / MDL >5 was considered suitable for a robust quantitative comparison. While values below the MDL are still retained for the analysis, 50 % of the data was >5 times the MDL, ensuring the comparison is not dominated by random instrument noise.
The averaging periods used to merge the PTR-MS, AT-VOC and DNPH data from SPS 2 are listed in Table 1. Three DNPH cartridges and three pairs of VOC adsorbent tubes were collected daily: a 5 h sample collected in the morning (05:00–10:00), an 8 h sample collected in the afternoon (11:00–19:00) and a 10 h sample collected over night (19:00–05:00). Three averages were determined from PTR-MS data that corresponded with the three integrated sampling periods listed above (see Table 1).
Of the range of compounds measured by each of the three VOC measurement systems (PTR-MS, AT-VOC, DNPH), the data for seven compounds or compound groups satisfied criteria 1, 2, 3 and 4 for inclusion in the inter-comparison presented here; they were benzene, toluene, the C8 aromatics, isoprene, formaldehyde, acetaldehyde and acetone.
2.6 Uncertainty in VOC measurements and inter-comparisons
There were two methods of determining uncertainties in VOC measurements assessed in this study, bottom-up and top-down. The first approach, the bottom-up method, examined the individual components of a single measurement technique, assessed the uncertainty of each and combined these to get a total uncertainty for that method (Harris, 2003; JCGM, 2008). The uncertainty analysis proceeded via the mathematical model, here called the measurement equation, for the measurement as described in the Guide to Expression of Uncertainty in Measurement (JCGM, 2008). Details of the uncertainty analysis procedure for each of the selected compounds and for the measurement technique are described in the Supplement 1. All uncertainties in this analysis are expanded uncertainties with a coverage factor k=2, i.e. 2 standard deviations. The associated level of confidence of the uncertainty interval is typically 95 %.
The bottom-up uncertainty analysis for the AT-VOC method included uncertainty due to
-
the accuracy of the certified calibration standards;
-
the variance in the response factors of the GC-FID in measurements of certified calibration gas standards;
-
the uncertainty in the loop volume, temperature and pressure; and
-
the variance in a series of replicate ambient measurements of the target VOCs by the AT-VOC method.
The bottom-up uncertainty analysis for the DNPH method included uncertainty due to
-
the accuracy of the certified calibration standards,
-
the variance in the response factors of the HPLC in measurements of a series of replicate DNPH cartridges spiked with a certified liquid standard mixture and
-
the variance in a series of replicate ambient measurements of the target VOCs by the DNPH method.
The bottom-up uncertainty analysis for the PTR-MS method included uncertainty due to
-
the accuracy of the certified calibration standards,
-
the variance in the performance of the mass flow controllers which were used to control the flows of the dilution and calibration gas standards and
-
The variance in the response factors of the PTR-MS in measurements of certified calibration gas standards.
In the second approach to assessing uncertainty, the top-down method, we evaluated the systematic difference between two methods by evaluating the slope and intercept of a linear regression between two sets of paired simultaneous measurements. We evaluate random deviations of individual measurements as the root mean square of the orthogonal distance between the location of the pair of observations (x, y) and the regression line for the whole dataset, here referred to as the root mean square of the deviations (RMSD) (Harris, 2003).
When comparing two observational datasets, reduced major axis (RMA) regression, also called geometric mean regression, is preferable to simple least squares linear regression because the analysis is not between an independent and dependent variable, and RMA accounts for random measurement error on both the x and y variables rather than only the y variable (Kermack and Haldane, 1950; Ayers, 2001; Franq and Govaerts, 2014). The RMA method is recommended when the measurement errors are unknown (Franq and Govaerts, 2014).
Contributions to the uncertainty of these measurements that are not included in the bottom-up analyses but are apparent from the top-down analyses are discussed. These contributions are described as poorly understood and poorly quantified processes that do not occur in the measurement equation. Some examples of these for PTR-MS and DNPH are identified. None were immediately apparent for AT-VOC.
The results of this inter-comparison are compared with similar published studies from the scientific literature and some conclusions about the uncertainty in current VOC measurements are presented. The other studies examined were published in the peer-reviewed literature, in which all employed PTR-MS as one of the instruments being compared; only results of ambient air studies were included (direct measurements of VOC emission sources such as biomass burning plumes were excluded) and in all comparisons both instruments were calibrated for the species of interest.
Seven sets of inter-comparisons matched the criteria presented in Sect. 2.6. These were
-
benzene, toluene, the sum of the C8 aromatics and isoprene measured by both the PTR-MS and the AT-VOC techniques in SPS 2 and
-
formaldehyde, acetaldehyde and acetone measured by both the PTR-MS and the DNPH techniques in SPS 2.
For simplicity, the subsequent text is organized around the names of the most common compound(s) occurring in the instrument response, while the discussion recognizes that other interfering or co-eluting compounds can be contributing to the instrument response.
The MDL, summary statistics (25th percentile, median, 75th percentile) and the median / MDL for each compound are presented in Table 3.
Table 4The means and SDs of the atmospheric data; the estimated measurement uncertainties of the means (k=2) (see Supplement); the 95 % confidence limit of the means (ppb) for the seven compounds measured by PTR-MS, AT-VOC and DNPH; and the number of paired observations, N, in this study.
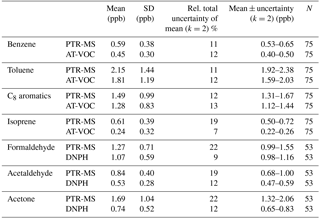
The uncertainty associated with measurement of these VOCs is evaluated via the methods in the Guide to Expression of Uncertainty in Measurement (JCGM, 2008) and presented in the Supplement. While there is some overlap between the observed uncertainty and the calculated measurement uncertainty, they also include distinct components. The observed uncertainty of a set of atmospheric VOC measurements includes a component due to atmospheric variability that is not included in the calculated uncertainty. The calculated measurement uncertainty can include a component due to uncertainty in the calibration standards, which does not occur in the observed variability of atmospheric measurements which are measured against one reference standard.
Here we analyse whether the sets of simultaneous measurements of VOCs by two different methods have uncertainties such that their mean values plus or minus the measurement uncertainties overlap within the 95 % confidence limit or not. Table 4 shows that for benzene, isoprene, acetaldehyde and acetone, the mean values do not overlap within the 95 % confidence limits. In contrast, for toluene, xylenes and formaldehyde, the mean values do overlap within the 95 % confidence limits.
3.1 Inter-comparison of PTR-MS and AT-VOC samples analysed by GC-FID-MS
The inter-comparisons for benzene, toluene, the sum of the C8 aromatics and isoprene measured by both the PTR-MS and the AT-VOC techniques are presented in Table 5 as the slope and intercept of the RMA regression analysis, correlation (R2) and the RMSD for each compound and scatterplots of the data are presented in Fig. 1a–e.

Figure 1Intercomparisons of PTR-MS vs. AT-VOC and DNPH measurements of selected VOCs in SPS 2 (2012). RMA correlation coefficients (R2) and regression fits are indicated (solid line) plus or minus the standard error (dashed lines).
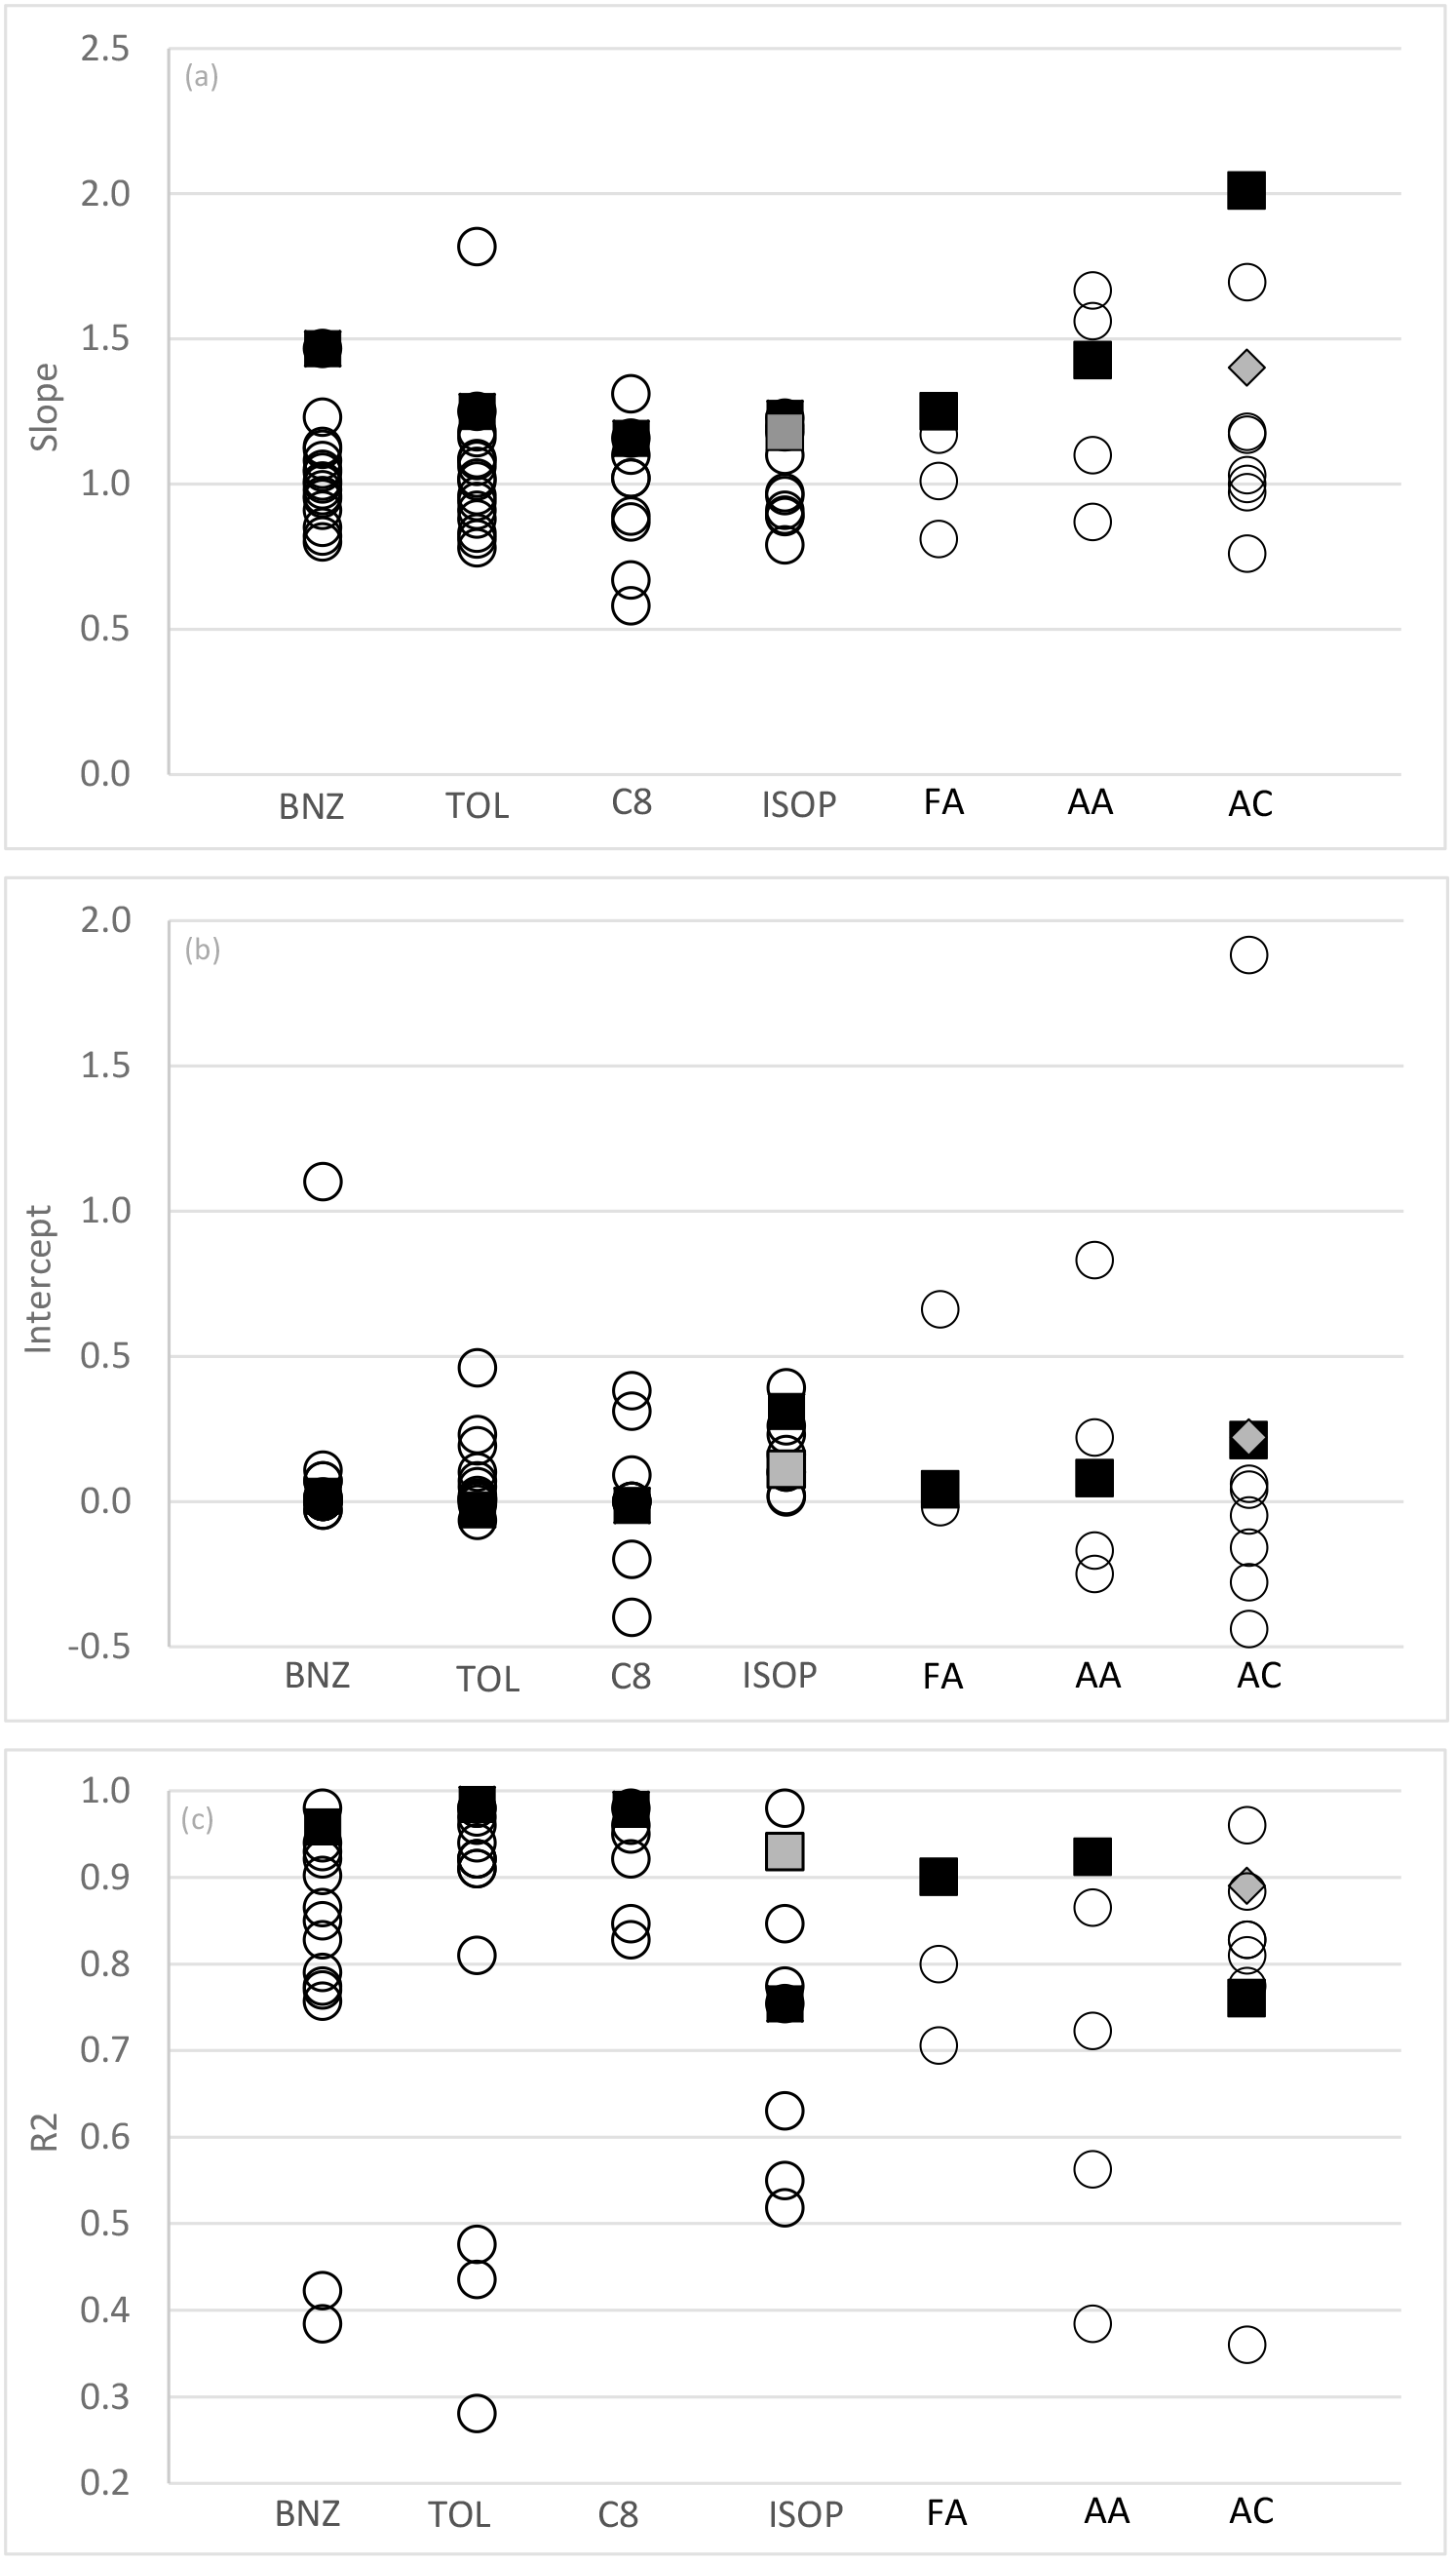
Figure 2(a–c) Slopes, intercepts (ppbv) and correlation coefficient from linear regression (x, y) analyses between PTR-MS (y) and independent VOC measurement techniques (x) from this study (black squares) and other published studies (open circles). BNZ – benzene; TOL – toluene; C8 – C8 aromatics; ISOP – isoprene; FA – formaldehyde; AA – acetaldehyde; AC – acetone. Note that grey squares are determined from analysis of isoprene afternoon data from this study. Grey diamonds are determined from the analysis of DNPH acetone excluding periods affected by condensation (average dew point temperature <7 ∘C). Published studies used in this figure are referred to within the text for each compound Sects. 3.1.1–3.2.3.
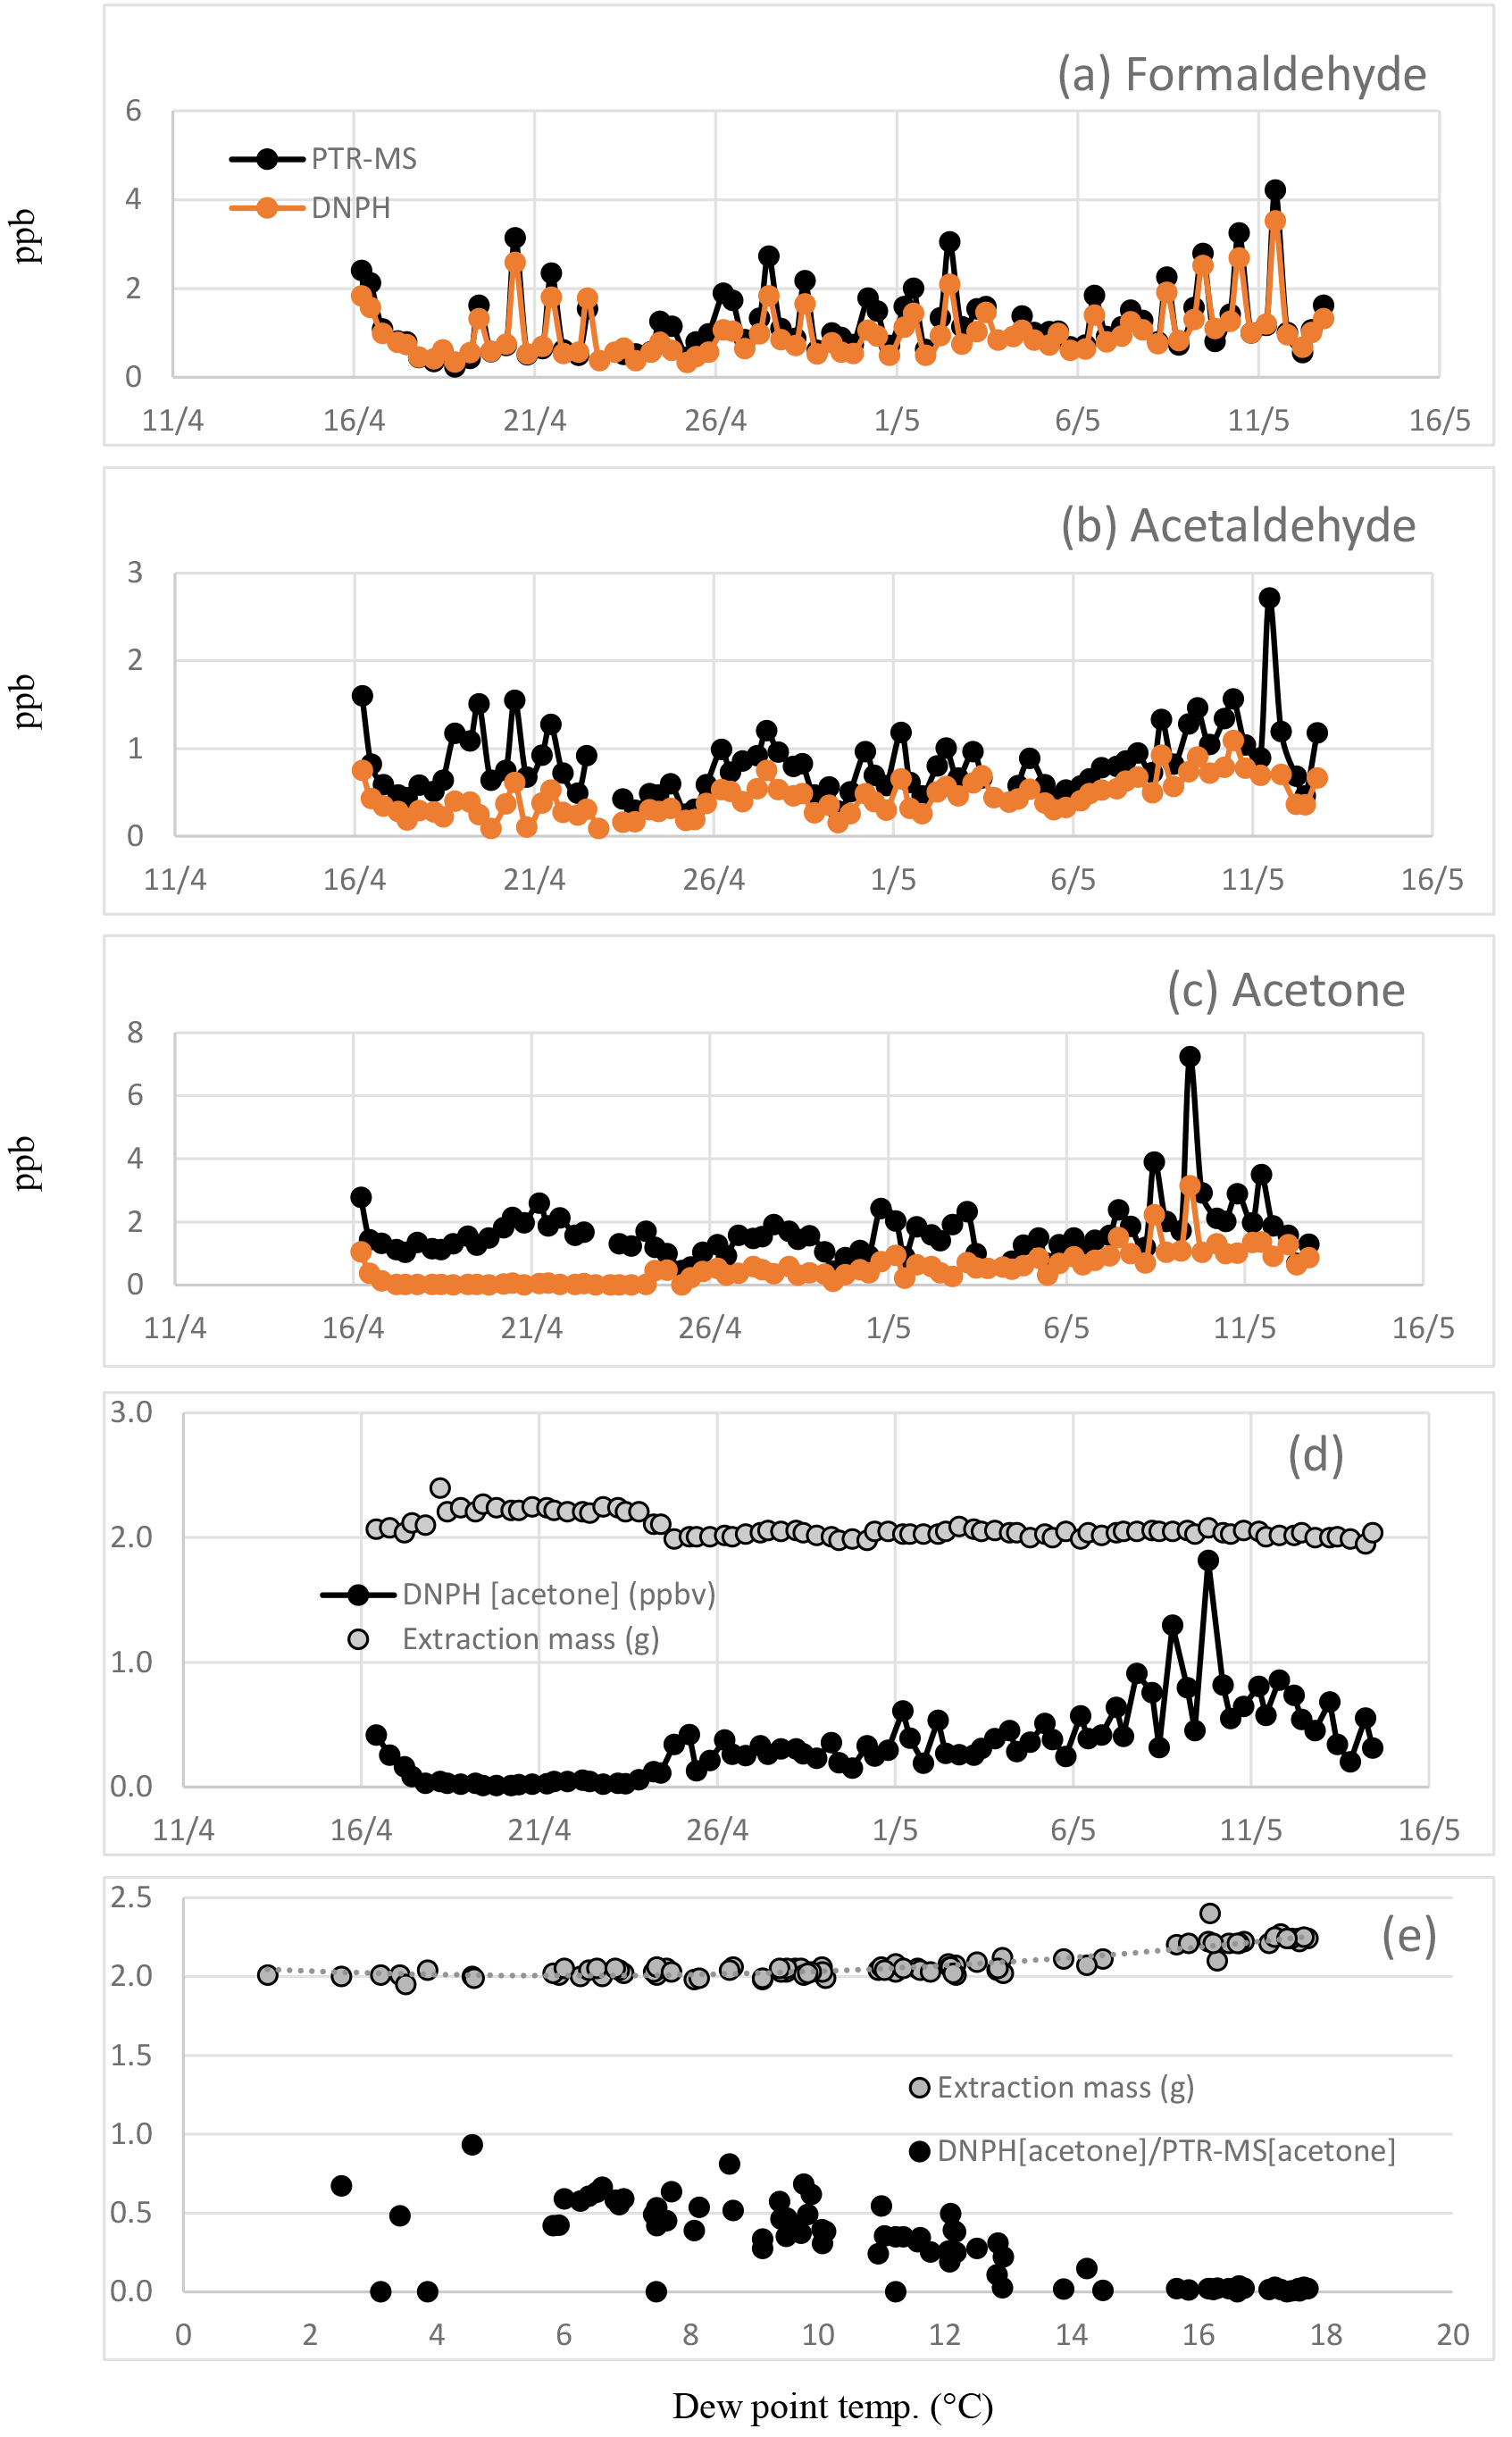
Figure 3Time series of (a) formaldehyde, (b) acetaldehyde and (c) acetone measured in the DNPH samples and by the PTR-MS in SPS 2. Also shown is the (d) time series of the DNPH reported acetone concentration and extraction mass and (e) the DNPH extraction masses plotted vs. dew point along with the ratio of DNPH reported acetone data to the PTR-MS reported acetone data (DNPH[acetone]∕PTR-MS[acetone] plotted vs. dew point).
3.1.1 Benzene
In PTR-MS, protonated benzene is detected at m∕z 79. The comparisons presented in Table 4 indicate a significant difference at the 95 % confidence limit between the mean values measured by the PTR-MS at m∕z 79 and the benzene reported by the AT-VOC method.
Reduced major axis regression analysis between the PTR-MS data for m∕z 79 and the AT-VOC benzene data yielded a slope of 1.47±0.04, an intercept of 0.02±0.00 ppbv and an R2 of 0.96 (Fig. 1a). The high R2 value and small RMSD of 0.04 ppbv (RMSD / median =8 %) (Table 5, Fig. 1a) indicates the AT-VOC and PTR-MS were both responding to benzene.
It is possible the slope of ∼1.5 was a result of contributions to the PTR-MS signal at m∕z 79 from compounds other than benzene, such as fragment ions from ethylbenzene, propyl- and isopropyl-benzene, and butyl- and isobutyl-benzene which can potentially contribute to the signal at m∕z 79 (Warneke et al., 2003; Gueneron et al., 2015). In addition, an unknown CH2O4H+ ion signal was detected at m∕z 79 by high-resolution proton-transfer-reaction time-of-flight mass spectrometry (PTR-ToF-MS) in a rural atmosphere (Park et al., 2013).
Ethylbenzene was measured in the AT-VOC samples; however, propyl- and isopropyl benzene were not, and their contribution to the PTR-MS ion signal at m∕z 79 could not be assessed. Using the AT-VOC data for ethylbenzene and literature values of the ethylbenzene and benzene PTR-MS response variables – branching ratios (Gueneron et al., 2015) and ionization reaction rates (Cappellin et al., 2012) – a correction was applied to the PTR-MS m∕z 79 data to subtract interference due to the presence of fragment ion signals from ethylbenzene. This correction procedure is described in detail in the Supplement Sect. S.2.
The slope of the RMA regression between the corrected PTR-MS data and the AT-VOC data improved slightly to 1.36±0.03 (intercept , R2=0.96), indicating ethylbenzene made a minor but measurable contribution to the PTR-MS signal at m∕z 79 in this study.
The quantitative agreement between the measurement of benzene by PTR-MS and AT-VOC in this study was poorer than those reported in similar real-world inter-comparisons, most of which have reported slopes between 0.8 and 1.2 shown graphically in Fig. 2 (Warneke et al., 2001; de Gouw et al., 2003; Kato et al., 2004; Kuster et al., 2004; Jobson et al., 2010; Rogers et al., 2006; de Gouw and Warneke, 2007; Kaser et al., 2013; Wang et al., 2014; Kajos et al., 2015; Cui et al., 2016).
The degree of interference will vary with the relative concentrations of higher aromatics to benzene in the atmosphere being studied. As the higher aromatics have shorter atmospheric lifetimes than benzene, the interference will vary with ageing of an air mass. Thus, when measuring aged air masses, PTR-MS reported values should show better agreement with more selective GC techniques. In this study, within a large city, fresh emissions would be present, containing on average a greater fraction of higher aromatics. Thus, we would expect a larger contribution to the m∕z 79 signal from fragment ions of higher aromatics.
In summary, a comparison between the measurements of benzene by PTR-MS and the AT-VOC technique indicates a significant difference in the measured concentrations which is unresolved but is likely to vary according to the relative contribution of higher aromatics in different atmospheres.
3.1.2 Toluene
In PTR-MS, toluene undergoes non-dissociative proton transfer from H3O+ producing a single ion signal at m∕z 93 (Gueneron et al., 2015). The comparisons presented in Table 4 indicate no difference between mean values measured by PTR-MS and AT-VOC methods at the 95 % confidence limit.
RMA regression analysis between the PTR-MS data at m∕z 93 and the AT-VOC data for toluene yielded a slope of 1.25±0.02, an intercept of ppbv and an R2 of 0.98 (Table 5, Fig. 1b). The RMSD was 0.11 ppb, which was only 5 % of the median PTR-MS value (Table 5). The high R2 value and small RMSD indicates the PTR-MS signal at m∕z 93 was dominated by toluene.
The slope>1 may be a result of contributions to the PTR-MS signal at m∕z 93 from compounds other than toluene. These include α- and β-pinene, p-cymene and several C9 aromatics (ethyltoluenes, 1,2,3-trimethylbenzene), all of which are known to produce fragment ions at m∕z 93 in PTR-MS (Warneke et al., 2003; Maleknia et al., 2007; Ambrose et al., 2010; Gueneron et al., 2015).
These potential interferent compounds, with the exception of p-ethyltoluene and 1,2,3-trimethylbenzene, were measured in the AT-VOC samples. Using the AT-VOC data for α- and β-pinene, p-cymene, and m- and o-ethyltoluene, as well as literature values of their PTR-MS response variables – branching ratios (Gueneron et al., 2015) and ionization reaction rates (Cappellin et al., 2012) – a correction was applied to the PTR-MS m∕z 93 data to subtract interference due to the presence of fragment ion signals from these interferents. This correction procedure is described in detail in the Supplement Sect. S.2.
This correction had a minor impact on the slope of the RMA regression (, intercept , R2=0.98) and the reason for the remaining discrepancy was unresolved.
With the exception of two of studies (Kato et al., 2004; Kajos et al., 2015) previous inter-comparisons between toluene measurements by PTR-MS and GC techniques have reported slopes of 0.8–1.2 and generally good correlations (R2>0.75) (Fig. 2.) (Warneke et al., 2001; de Gouw et al., 2003; Kuster et al., 2004; de Gouw and Warneke, 2007; Kaser et al., 2013; Wang et al., 2014; Kajos et al., 2015; Cui et al., 2016).
In summary, a comparison between the measurements of toluene by PTR-MS and the AT-VOC technique indicates that there was not a significant difference in the measured concentrations at the 95 % confidence limit. There may be some residual unquantified interference with the PTR-MS toluene measurement which may vary due to contributions from the many additional monoterpene species commonly present in the atmosphere but not accounted for here (Geron et al., 2000; Maleknia et al., 2007).
3.1.3 C8 aromatics
In PTR-MS, the signal at m∕z 107 is commonly regarded as a measure of the sum of the C8 aromatic isomers ( m-, p-, o-xylenes and ethylbenzene) (de Gouw and Warneke, 2007). The comparisons presented in Table 4 indicate no difference between mean values of the sum of the C8 aromatic isomers measured by the PTR-MS and AT-VOC techniques at the 95 % confidence limit; however, as observed for benzene and toluene, there appears to be a systematic difference between the two methods.
Table 5The slope (m), intercepts (b) and correlation coefficients (R2) from the RMA regression analysis between the PTR-MS, AT-VOC and DNPH–HPLC measurements. Also included are the estimates of random measurement uncertainty expressed as RMSD for each species and the ratio of the RMSD to the median PTR-MS value expressed as a percentage (%).
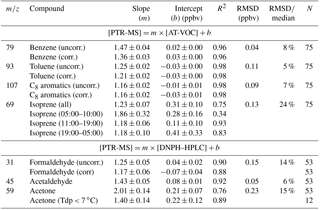
RMA regression analysis between the PTR-MS signal at m∕z 107 (ppb) and the AT-VOC data for the sum of the C8 aromatics yielded a slope of 1.16±0.02, an intercept of ppbv and an R2 of 0.98 (Table 5, Fig. 1c). The RMSD of 0.09 ppbv was only 7 % of the median PTR-MS value (Table 5), which when combined with the high R2 value indicates both techniques were responding to the C8 aromatics.
The concentration of C8 aromatics detected by the PTR-MS at m∕z 107 was quantified using a calibration factor of 19.78 ncps ppbv−1 that was determined from measurements of a certified gas standard containing m-xylene. Unlike m-, p- and o-xylene, ethylbenzene undergoes fragmentation in the PTR-MS, and at the operating conditions used in this study ∼90 % of the ethylbenzene ion signal occurs at m∕z 107 (Gueneron et al., 2015). Consequently, using a calibration factor based on m-xylene alone will lead to an underestimation by PTR-MS when quantifying the sum of the C8 aromatic isomers from the signal at m∕z 107. Using the AT-VOC data to determine the relative abundance of the C8 aromatic isomers in the atmosphere as well as literature values of their PTR-MS response variables – branching ratios (Gueneron et al., 2015) and ionization reaction rates (Cappellin et al., 2012) – a corrected calibration factor of 19.61 ncps ppbv−1 was applied to the PTR-MS m∕z 107 data to correct for the presence of ethylbenzene. The correction procedure is described in detail in the Supplement Sect. S.2.
This correction resulted in a minor increase in the slope to 1.19±0.02, with an intercept of ppbv and an R2 of 0.98.
A minor contribution to the PTR-MS signal at m∕z 107 may occur due to the presence of protonated benzaldehyde (de Gouw and Warneke, 2007), which was measured by the DNPH method in this study and comprised 2 % on average (range 0–5 %) of the sum of the C8 aromatics reported by AT-VOC. Subtracting the concentration of benzaldehyde from the PTR-MS signal at m∕z 107 had no effect on the slope of the RMA regression (slope =1.16, R2=0.98) and resulted in a minor increase in the negative offset (intercept ppbv) (see Supplement S.2).
The results reported here are similar to many previous intercomparison studies that have reported good quantitative agreement, within ±20 % (R2>0.85), between PTR-MS and GC techniques for the measurement of the sum of the C8 aromatics (Warneke et al., 2001; Kuster et al., 2004; Jobson et al., 2010; Rogers et al., 2006; de Gouw and Warneke, 2007; Wang et al., 2014; Cui et al., 2016). However, slopes as low as 0.6 (Kato et al., 2004) and as high as 3.2 (de Gouw et al., 2003) have been reported with the discrepancy in both cases, which is attributable to calibration inaccuracies.
In summary, a comparison between the measurements of C8 aromatics by PTR-MS and the AT-VOC technique indicates that there was not a significant difference in the measured concentrations. There may be some residual unquantified interference with the PTR-MS C8 aromatic measurement.
3.1.4 Isoprene
In measurements of the atmosphere the PTR-MS signal at m∕z 69 is attributed to isoprene. The RMA regression analysis between the PTR-MS and AT-VOC data for isoprene yielded a slope of 1.23±0.07, an intercept of 0.31±0.10 ppbv and an R2 of 0.75 (Fig. 1d). The lower R2 and higher RMSD of 0.13 ppbv (Fig. 1d, Table 5) observed for isoprene indicate the two instruments may not have been responding entirely to the same compounds (Fig. 1d). The comparisons presented in Table 4 indicate a significant difference at the 95 % confidence limit between the mean values measured by each instrument.
Isoprene emissions are dominated by biogenic sources and are strongly light and temperature dependent with maxima in the afternoon. For SPS 2, when only the afternoon data were considered, closer agreement was observed between the PTR-MS and AT-VOC data for isoprene attributed to a 0.2 ppb lower intercept (0.11±0.10 ppb) and significantly higher R2 of 0.93 (, RMSD =0.12 ppbv) (Table 5, Fig. 1e). There is no significant correlation between AT-VOC isoprene and the PTR-MS signal at m∕z 69 for the period 05:00–10:00 (R2=0.34), rendering the RMA slope and intercept essentially meaningless. There is a slope of 1.18 and offset of 0.41 ppb in the RMA regression for the period 19:00–05:00 (R2 =0.83), indicating that other compounds may be contributing to the PTR-MS signal at m∕z 69 and their relative contribution is largest at night and in the early hours of the morning when isoprene concentrations are lowest.
Park et al. (2013) observed three peaks at m∕z 69 in high-resolution PTR-ToF-MS spectra in a rural area: C3H2O2H+ (∼10 %), C4H4OH+ (∼14 %) and C5H8H+ (∼75 %). PTR-ToF-MS measurements also identified dimethylcyclohexane and cyclopentene at m∕z 69 in air impacted by evaporative fuel emissions (Yuan et al., 2014). GC-PTR-MS analysis has also shown multiple other species can contribute to m∕z 69, specifically 2- and 3-methylbutanal, and 1-penten-3-ol in urban air (de Gouw et al., 2003); furan in air masses impacted by biomass burning (Christian et al., 2004); and 2-methyl-3-buten-2-ol in air masses impacted by emissions from pine trees (Karl et al., 2012). Unfortunately independent measurements of these interferent compounds are not available for this study and their contributions to the PTR-MS signal m∕z 69 cannot be estimated.
The results reported here are consistent with previous inter-comparisons studies between PTR-MS and GC techniques which have reported slopes of 0.79–2.15 often with significant (up to 0.39 ppb) offsets, shown graphically in Fig. 2 (de Gouw et al., 2003; Kato et al., 2004; Kuster et al., 2004; Wang et al., 2004; de Gouw and Warneke, 2007; Kaser et al., 2013).
In summary, a comparison between the measurements of isoprene by PTR-MS and the AT-VOC technique indicates a significant difference in the measured concentrations which may vary according to the relative contribution of other species that contribute to the PTR-MS signal at m∕z 69 particularly at night. The influence of these compounds on measurements of isoprene by PTR-MS, while well known, are not quantified in the bottom-up measurement uncertainty analysis of the PTR-MS technique.
3.2 Intercomparison of PTR-MS with DNPH derivatization–HPLC
In the following section, the inter-comparisons for formaldehyde, acetaldehyde and acetone measured by both the PTR-MS and the DNPH–HPLC techniques in SPS 2 will be discussed in turn. The MDL, summary statistics (25th percentile, median, 75th percentile) and the median / MDL values for the PTR-MS and DNPH data for each compound are presented in Table 3. The results of the analysis of measurement uncertainty are presented in Table 4.
The results of the RMA regression analysis and the RMSD for each compound are summarized in Table 5. Scatterplots of the comparisons for the three carbonyl compounds are presented in Fig. 1f–h.
As part of this analysis, we have identified a loss process in the DNPH method due to condensation of H2O in the cartridges. To explain this loss, some detail of the measurement technique is necessary. The compartment housing the DNPH cartridges in the automated sampler was maintained at ∼7 ∘C and the cartridges were refrigerated before and after sampling. Liquid water was observed in the some cartridges on retrieval and it was assumed the additional mass was due to the condensation of water from ambient air in the chilled DNPH cartridge during sampling. The derivatized carbonyl compounds on the DNPH cartridge samples are extracted with a fixed volume of acetonitrile after air sampling and prior to HPLC analysis. The volume of acetonitrile used in the extraction is determined beforehand and the mass of extract afterwards. For the period 16–24 April, the extraction masses (g) were ∼10 % higher than the volume of acetonitrile added in the extraction and also higher than the extraction masses for other sample and blank cartridges analysed in this study (Fig. 3d). Typically the mass of the DNPH cartridge extraction is ∼2.0 g. At dew point temperatures >7 ∘C the mass of the extraction from the DNPH cartridge was observed to be higher (∼2.1–2.4 g) (Fig. 3e). The presence of liquid water appears to substantially reduce the collection efficiency of acetone with concentrations < MDL as shown in Fig. 3d, which would be extremely unlikely in an urban area and point to a significant measurement issue. To investigate the effect of condensation in the cartridges, the DNPH data for formaldehyde, acetaldehyde and acetone including and excluding the period 16–24 April were analysed separately and are discussed below.
The inter-comparisons for formaldehyde, acetaldehyde and acetone measured by both the PTR-MS and the DNPH techniques are presented in Table 5 as the slope and intercept of the RMA regression analysis, correlation (R2) and the RMSD for each compound and scatterplots of the data are presented in Fig. 1f–h.
3.2.1 Formaldehyde
In PTR-MS, protonated formaldehyde is detected at m∕z 31 (Hansel et al., 1997). The measurement of formaldehyde with PTR-MS is complex as its proton transfer chemical ionization reaction with H3O+ is close to endothermic and loss via back reaction in humid air is non-negligible (Hansel et al., 1997; Inomata et al., 2008). In order to account for the water vapour dependence of the PTR-MS response to formaldehyde, daily instrument background and calibration measurements were made using zero air that had the same mole fractions of H2O as the ambient air being sampled. The linear relationship observed between the formaldehyde calibration factors measured daily and the respective water vapour density (g m−3) was determined, and a corrected calibration factor was applied to the ambient hourly data based on the ambient water vapour density measured hourly.
The comparisons presented in Table 4 indicate that the mean values reported by PTR-MS and DNPH agree within 95 % confidence limits. RMA regression analysis between the PTR-MS signal at m∕z 31 and the formaldehyde in the DNPH–HPLC samples yielded a slope of 1.30±0.04, an intercept of ppbv, an R2 of 0.92 and an RMSD of 0.14 ppbv (N=77). The high R2 value gives confidence that both the PTR-MS and the DNPH technique were both responding to formaldehyde.
To examine any possible effect of liquid water, the analysis was repeated excluding the data of 16–24 April. The results yielded a slope of 1.25±0.05, an intercept of 0.04±0.02 ppbv, an R2 of 0.90 and an RMSD of 0.15 ppbv (N=53) (Table 5 and Fig. 1f), indicating a minor but significant effect of liquid water.
The slope of 1.25 may be a result of contributions to the PTR-MS signal at m∕z 31 from compounds other than formaldehyde, including methanol, ethanol, and methyl hydroperoxide (Inomata et al., 2008) and glyoxal (Stonner et al., 2016). The protonated molecular ion signal of ethanol and methyl hydroperoxide cannot be unequivocally identified in the PTR-MS spectra and their concentrations were not determined independently by either the AT-VOC or DNPH method, and consequently their contribution to the m∕z 31 signal cannot be determined in this study.
The dominant ion signal in the PTR-MS spectra of glyoxal is detected at m∕z 31 due to strong fragmentation of the parent ion (Stonner et al., 2016). However, these authors also found that, like formaldehyde, glyoxal also has a low proton affinity and loss via back reaction in humid air is also non-negligible, resulting in a very low PTR-MS sensitivity of ∼0.3–0.8 ncps ppbv−1 compared to a formaldehyde sensitivity of ∼1.4 ncps ppbv−1 for this study.
Using the PTR-MS and DNPH data for methanol and glyoxal respectively, along with laboratory measurements and literature values of the PTR-MS response variables for formaldehyde, methanol and glyoxal – branching ratios (BRx) (Dunne, 2016; Stonner et al., 2016) and reaction rates (Cappellin et al., 2012) – a correction was applied to the PTR-MS m∕z 31 data to subtract interference in the measurement of formaldehyde due to the presence of fragment ions from methanol and glyoxal. This correction procedure is described in detail in the Supplement Sect. S.2. Applying the correction for methanol and glyoxal interference to the reduced m∕z 31 dataset (N=53) from this study resulted in a slight improvement in the slope to 1.17±0.06, with an intercept of ppbv and an R2 of 0.88 (Table 5).
Previous studies have reported PTR-MS values for formaldehyde that were systematically higher than DNPH–HPLC measurements (Wisthaler et al., 2008; Cui et al., 2016) and higher than differential optical absorption spectroscopy (DOAS) and Hantzsch techniques (Wisthaler et al., 2008; Warneke et al., 2011). Other studies report DNPH–HPLC values for formaldehyde that were systematically lower than those reported by other analytical methods (DOAS, FTIR, Hantzsch, TDLAS) (Kleindienst et al., 1988; Lawson et al., 1990; Gilpin et al., 1997; Hak et al., 2005; Wisthaler et al., 2006).
In summary, a comparison between the measurements of formaldehyde by PTR-MS and the DNPH technique indicates there was not a significant difference in the measured concentrations although some discrepancy between the two instruments remains unresolved.
3.2.2 Acetaldehyde
In measurements of the atmosphere the signal at m∕z 45 in PTR-MS spectra is commonly attributed to protonated acetaldehyde (de Gouw and Warneke, 2007). The comparisons between PTR-MS measurements at m∕z 45 and DNPH measurements of acetaldehyde presented in Table 4 indicate a significant difference at the 95 % confidence limit between the mean values measured by each instrument. RMA regression analysis between the PTR-MS data for m∕z 45 and the acetaldehyde values determined from the DNPH–HPLC samples yielded a slope of 1.47±0.09, an intercept of 0.14±0.02 ppbv, an R2 of 0.72 and an RMSD of 0.11 ppbv (N=77).
To examine any possible effect of liquid water, the analysis was repeated excluding the data of 16–24 April (see Sect. 3.2.1). The results were a slope of 1.43±0.05, an intercept of 0.08±0.01 ppbv, an R2 of 0.92 and an RMSD of 0.05 ppbv (N=54) (Fig. 1g, Table 5). The results indicate an insignificant effect on slope but a substantial increase in the correlation coefficient and reduction in RMSD by excluding the data indicating liquid water. The comparisons presented in Table 4 indicate a significant difference at the 95 % confidence limit between the mean values measured by each instrument.
A positive bias in PTR-MS measurements of acetaldehyde may result from contributions to the m∕z 45 signal from compounds other than acetaldehyde. Due to structural constraints the signal at m∕z 45 can be either C2H5O+ ions, and/or CH3NO+. The contribution from protonated carbon dioxide () is not relevant here as it is removed by the background zero correction.
Two studies using high-resolution PTR-ToF-MS have observed a single peak at m∕z 45 consisting of C2H5O+ (Park et al., 2013; Warneke et al., 2015). The C2H5O+ product ions may result from protonated acetaldehyde; protonated vinyl alcohol; protonated ethylene oxide; or fragment ions from ethylene glycol (Wood et al., 2015), ethanol, (Inomata and Tanimoto, 2009), 2-propanol (Inomata and Tanimoto, 2010), methyl ethyl ketone, methyl glyoxal and methyl isobutyl ketone (Dunne, 2016). None of these compounds were likely to be individually present in sufficient concentrations to account for the discrepancy observed in this study; however, the combined effect of numerous compounds yielding m∕z 45 product ions cannot be dismissed as a possible explanation.
In an atmospheric simulation chamber study three PTR-MS instruments reported acetaldehyde values close to the known injected value, whereas a DNPH method significantly underestimated (∼30 %) the known chamber concentration (Apel et al., 2008). In a recent comparison in urban air between PTR-MS and DNPH–HPLC, Cui et al. (2016) reported a slope of ∼1 between the two methods but a significant positive offset in the PTR-MS data of 0.83 ppbv and an R2 of 0.56.
Herrington et al. (2007) reported the collection efficiency of acetaldehyde on DNPH cartridges declined from ∼100 % for a sampling duration of 6 h to ∼60 % for a sampling duration of 12 h, the reasons for which have not been resolved. As 8 and 10 h sampling durations were used for the DNPH sampling in this study, poor collection efficiencies may have resulted in a negative bias in the DNPH–HPLC measurements of acetaldehyde.
As shown in Fig. 2, other real-world inter-comparison studies have reported variable agreement between measurements of acetaldehyde by PTR-MS and GC methods (slopes of 0.87–1.7, intercepts of −0.25–0.22, R2 of 0.38–0.86) (de Gouw et al., 2003; Warneke et al., 2011; Kaser et al., 2013; Kajos et al., 2015).
In summary, a comparison between the measurements of acetaldehyde by PTR-MS at m∕z 45 and the DNPH technique indicates there was a significant difference in the measured concentrations. There may be other species that contribute to the PTR-MS signal at m∕z 45, as well as under-reporting in the DNPH measurements. These processes are poorly understood and poorly quantified measurement uncertainties.
3.2.3 Acetone
In PTR-MS measurements, the ion signal at m∕z 59 is regarded as a measure of protonated acetone. The comparisons between the PTR-MS signal at m∕z 59 and DNPH measurements of acetone presented in Table 4 indicate a significant difference at the 95 % confidence limit between the mean values measured by each instrument.
The RMA regression analysis between the PTR-MS signal at m∕z 59 and acetone measured in the DNPH samples for the whole dataset yielded a slope of 1.67±0.13, an intercept of 0.79±0.12 and an R2 of 0.51 (N=77). To examine any possible effect of liquid water, the analysis was repeated excluding the data of 16–24 April. The results yielded a slope of 2.01±0.14 ppbv, an intercept of 0.21±0.07 ppbv, an R2 of 0.76 and an RMSD of 0.24 ppbv (N=53) (Table 5, Fig. 1h) indicating a significant effect of liquid water.
As discussed previously the compartment housing the DNPH cartridges in the automated sampler was maintained at ∼7 ∘C and condensation of water from ambient air was observed in some of the chilled DNPH cartridges. As a result higher DNPH cartridge extraction masses occurred at dew point temperatures >7 ∘C (Fig. 3e), and DNPH reported concentrations of acetone frequently approached zero at dew point temperatures >15 ∘C (Fig. 3d).
Datapoints that coincided with average dew point temperatures >7 ∘C were omitted from the RMA analysis. The average dew point temperature was <7 ∘C in only 12 out of 53 DNPH samples, resulting in a significantly reduced dataset. However, omitting datapoints with dew point >7 ∘C markedly improved the agreement between the DNPH and PTR-MS measurements of acetone, with the results of the RMA analysis changing to a slope of 1.40±0.14, an intercept of 0.22±0.12 and an R2 of 0.89 (N=12) when water-affected samples were omitted.
Ho et al. (2014) also identified a significant negative bias in the collection efficiency of acetone on DNPH cartridges that was related to humidity, sample flow rate and sample duration. While Ho et al. (2014) used a similar DNPH cartridge type, these authors reported 35–80 % of acetone was lost under similar conditions as those experienced in this study (RH >70 %, sample flow 1 L min−1, sample duration 8–10 h). These authors proposed a plausible explanation for the observed behaviour: when carbonyls pass through the DNPH sorbent, reactions occur involving the addition of the -NH2 group to the -C=O group to form a reaction intermediate. The reaction between DNPH and ketones occurs at a slower rate than for aldehydes, resulting in poorer collection efficiencies for ketones. In the second step of the reaction, the intermediate loses a water molecule to form the hydrazone derivative. Therefore, when the water mixing ratio is high (i.e. high absolute humidity), loss via the back reaction may be substantial.
In PTR-MS, the ion signal at m∕z 59 is regarded as a measure of protonated acetone. However, in measurements of the atmosphere the m∕z 59 signal may also contain contributions from propanal and glyoxal (de Gouw and Warneke, 2007; Thalman et al., 2015; Stonner et al., 2016). Acetone, propanal and glyoxal were all measured by the DNPH method in the present study with mean values of 0.74±0.54, 0.03±0.04 and 0.06±0.04 ppbv respectively (N=53).
Using the DNPH data for propanal and glyoxal, along with literature values of the PTR-MS response variables – branching ratios (Spanel et al., 1997; Stonner et al., 2016) and reaction rates (Cappellin et al., 2012) – a correction was applied to the PTR-MS m∕z 59 data (excluding the data of 16–24 April, N=53) to subtract interference in the measurement of acetone due to the presence of propanal and glyoxal. This correction procedure is described in detail in the Supplement Sect. S.2.
Applying the correction for propanal and glyoxal interference to the reduced m∕z 59 dataset (N=53) from this study had a negligible effect on the agreement between the two methods (, intercept ppbv, R2=0.76). Similarly when this correction is applied to the m∕z 59 data and compared with DNPH acetone for periods with average dew point temperature <7 ∘C, only a minor improvement in the agreement between the two methods is observed (, ppbv).
Previous published atmospheric and chamber study measurements reported PTR-MS values for acetone that were ∼30 to >100 % higher than simultaneous DNPH–HPLC measurements (Müller et al., 2006; Apel et al., 2008; Cui et al., 2016). Conversely, generally good agreement has been observed between PTR-MS and GC methods and AP-CIMS (atmospheric pressure chemical ionization mass spectrometry) (slopes = 0.97–1.18, 0.28–0.06, R2=0.77–0.96) (Fig. 3) (Sprung et al., 2001; de Gouw et al., 2003; Kaser et al., 2013; Wang et al., 2014; Kajos et al., 2015).
Overall, the PTR-MS signal at m∕z 59 was dominated by acetone with minor contributions from propanal and glyoxal. Consistent with previous studies, a significant negative bias was identified in sampling of acetone onto DNPH cartridges and further work is required to determine the performance of DNPH cartridge sampling for quantitative measurements of acetone under real-world conditions. At high humidity, the formation of condensation in DNPH cartridges must be guarded against as stated in TO-11A (USEPA, 1999b).
Comparisons have been made between measurements of benzene, toluene, C8 aromatics and isoprene by two independent techniques: PTR-MS and adsorbent tube sampling with GC-FID-MS analysis. Comparisons were also made between measurements of formaldehyde, acetaldehyde and acetone by PTR-MS and DNPH derivatization with HPLC analysis during routine observations for an air pollution field campaign. In all seven comparisons the correlations between independent measurement techniques are high with R2 values of median 0.92, range 0.75 to 0.98, and the root mean square of the deviations of the observations from the regression line are small with a median of 0.11, range 0.04 to 0.23 ppb, for the comparisons. This gives a high degree of confidence that for each comparison the two independent techniques are responding to the same constituents.
The slope and intercept as determined by reduced major axis regression gives a different story. The slopes vary considerably with a median of 1.25 and a range of 1.16–2.01. The intercepts vary with a median of 0.04 and a range of −0.03 to 0.31 ppb. An ideal comparison would give a slope of 1.00 and an intercept of 0. Also an analysis of the measurement uncertainties indicates significant differences at the 95 % confidence limit between the mean concentrations for benzene, isoprene, acetaldehyde and acetone between the different measurement techniques.
The reasons for the variations in slope include the contributions of non-target compounds to the measurement of the target compound for benzene, toluene and isoprene by PTR-MS and the under-reporting of formaldehyde, acetaldehyde and acetone by the DNPH technique. This study has identified specific issues with (a) the use of PTR-MS in urban areas at night when interferences from other compounds in isoprene measurements are significant and (b) an interference of liquid water in the sample trap with acetone measurements by the DNPH technique. Despite attempting to correct for these issues, significant discrepancies between the PTR-MS and the AT-VOC and DNPH–HPLC methods remain unresolved. The PTR-MS always has a larger response than the AT-VOC and DNPH–HPLC method and the slopes reported here were often at the higher end when compared with other published inter-comparison studies for the same compounds (Fig. 3). Additional, unquantified uncertainty due to mass interference in PTR-MS and interference in the collection of efficiency of aldehydes and ketones on DNPH may be responsible for the unresolved discrepancies reported here.
Other sources of uncertainty that may arise when comparing two observational datasets that are not included in the bottom-up uncertainty analyses and were not assessed here include the following:
-
Non-equivalent certified standards. As a first approach, an assumption of equivalence between certified gaseous standards, such as those used to calibrate the PTR-MS and GC-FID-MS, and certified liquid standards used for the DNPH method is reasonable. The equivalence of the certified liquid standards used to determine the instrument response for the DNPH method and the certified gaseous standards used to calibrate the PTR-MS was not assessed in this study and may appear as a systematic bias in the top-down uncertainty assessment.
-
Non-equivalent sampling and averaging times. While the averaging periods of the three measurement systems examined here overlapped by 90 % or more, some uncertainty remains due to non-equivalent sampling times that is not incorporated into the bottom-up uncertainty analysis.
-
Non-equivalent instrument calibration methods. The PTR-MS calibrations were performed daily in the field and the standard gases were presented to the detector in a VOC-free ambient air matrix, whereas the AT-VOC and DNPH methods have calibration methods where the standard is presented to the HPLC and GC-FID-MS in the laboratory, omitting field sampling influences.
These are generic issues that should be addressed in future VOC inter-comparison studies.
The relationships reported for Sydney 2012 were incorporated into a larger analysis with 61 other inter-comparison studies for the same compounds (found in the recent scientific literature; see Fig. 3). For the whole available set of inter-comparisons, the R2 has a median of 0.85 and a range of 0.13 to 0.98, the slopes had a median of 1.02 and a range of 0.58 to 2.01, and the intercept has a median of 0.02 and a range of −0.44 to 1.88. Based on this compilation we conclude that for the light aromatics, isoprene and the C1–C3 carbonyls, the uncertainty in a set of atmospheric measurements with current measurement technology varies by a factor between 1.5 and 2. These uncertainties from the inter-comparisons (∼50 %) are significantly higher than uncertainties estimated using standard propagation of error methods presented in Table 4 of 22 % or less. The difference is presumably the result of poorly understood or neglected processes that affect these measurements and their uncertainties.
There are two qualifications concerning this overall uncertainty analysis. This analysis in no way indicates what the uncertainty is in measurements of other VOC compounds. A smaller uncertainty has been reported for alkanes (Hoerger et al., 2015). Similarly, if the emissions and concentrations of a VOC are measured with the same technique or with techniques that are compared, then the uncertainties associated with an atmospheric mass balance compiled using these measurements may be smaller than the case where different VOC measurement techniques that have not been compared are used.
The uncertainties in VOC measurements identified here should be considered when assessing the reliability of VOC measurements from individual instruments, when utilizing VOC data to constrain and inform air quality and climate models, when using VOC observations for human exposure studies and when comparing ambient VOC data with satellite retrievals.
The Sydney Particle Study (SPS) involved a comprehensive suite of measurements of atmospheric gases and aerosols in order to characterize the sources, size distribution and composition of aerosols in Sydney and better understand the characteristics of gas-phase secondary aerosol precursors. The dataset was published by Keywood et al. (2016) and the final report was provided by Cope et al. (2014).
The supplement related to this article is available online at: https://doi.org/10.5194/amt-11-141-2018-supplement.
The authors declare that they have no conflict of interest.
The NSW Environmental Trust has provided support for this study through the “Atmospheric Particles in Sydney: model-observation
verification study”. The NSW Office of Environment and Heritage supported the Sydney Particle Study. We also thank the staff and
management of Westmead Hospital for assistance during the field campaigns. This work was initiated when E. Dunne was undertaking her PhD
studies at Monash University. E. Dunne thanks Monash University for a postgraduate scholarship.
Edited by: Yoshiteru Iinuma
Reviewed by: three anonymous referees
Ambrose, J. L., Haase, K., Russo, R. S., Zhou, Y., White, M. L., Frinak, E. K., Jordan, C., Mayne, H. R., Talbot, R., and Sive, B. C.: A comparison of GC-FID and PTR-MS toluene measurements in ambient air under conditions of enhanced monoterpene loading, Atmos. Meas. Tech., 3, 959–980, https://doi.org/10.5194/amt-3-959-2010, 2010.
Apel, E., Brauers, T., Koppmann, R., Bandowe, B., Boßmeyer, J., Holzke, C., Tillmann, R., Wahner, R., Wegener, R., Brunner, A., Jocher, M., Ruuskanen, T., Spirig, C., Steigner, D., Steinbrecher, R., Gomez Alvarez, E., Müller, K., Burrows, J. P., Schade, G. W., Solomon, J., Ladstätter-Weißenmayer, A., Simmonds, P., Young, D., Hopkins, J. R., Lewis, A. C., Legreid, G., Reimann, S., Hansel, A., Wisthaler, A., Blake, R. S., Ellis, A. M., Monks, P. S., and Wyche, K. P.: Intercomparison of oxygenated volatile organic compound measurements at the SAPHIR atmosphere simulation chamber, J. Geophys. Res., 113, D20307, https://doi.org/10.1029/2008JD009865, 2008.
Ayers, G. P.: Comment on regression analysis of air quality data, Atmos. Environ., 35, 2423–2425, 2001.
Cappellin, L., Karl, T., Probst, M., Ismailova, O., Winkler, P. M., Soukoulis, C., Aprea, E., Mark, T. D., Gasperi, F., and Biasioli, F.: On quantitative determination of volatile organic compound concentrations using proton trasnfer reaction time-of-flight mass spectrometry, Environ. Sci. Technol., 46, 2283–2290, https://doi.org/10.1021/es203985t, 2012.
Christian, T. J., Kleiss, B., Yokelson, R. J., Holzinger, R., Crutzen, P. J., Hao, W. M., Shirai, T., and Blake, D. R.: Comprehensive laboratory measurements of biomass burning emissions: 2. First intercomparion of open-path FTIR, PTR-MS, and GC-MS/FID/ECD, J. Geophys. Res.-Atmos., 109, D02311, https://doi.org/10.1029/2003JD003874, 2004.
Cope, M., Keywood, M., Emmerson, K., Galbally, I. E., Boast, K., Chambers, S., Cheng, M., Crumeyrolle, S., Dunne, E., Fedele, R., Gillett, R., Griffiths, A., Harnwell, J., Katzfey, J., Hess, D., Lawson, S. L., Miljevic, B., Molloy, S., Powell, J., Reisen, F., Ristovski, Z., Ward, J., Zhang, C., and Zeng, J.: Sydney Particle Study – Stage II, CSIRO and Office of Environment and Heritage, Australia, 2014.
Cui, L., Zhang, Z., Huang, Y., Lee, S. C., Blake, D. R., Ho, K. F., Wang, B., Gao, Y., Wang, X. M., and Louie, P. K. K.: Measuring OVOCs and VOCs by PTR-MS in an urban roadside microenvironment of Hong Kong: relative humidity and temperature dependence, and field intercomparisons, Atmos. Meas. Tech., 9, 5763–5779, https://doi.org/10.5194/amt-9-5763-2016, 2016.
de Gouw, J., Goldan, P. D., Warneke, C., Kuster, W. C., Roberts, J. M., Marchewka, M., Bertman, S. B., Pszenny, A. A. P., and Keene, W. C.: Validation of proton transfer reaction-mass spectrometry (PTR-MS) measurements of gas-phase organic compounds in the atmosphere during the New England Air Quality Study (NEAQS) in 2002, J. Geophys. Res.-Atmos., 108, 4682, https://doi.org/10.1029/2003JD003863, 2003.
de Gouw, J. and Warneke, C.: Measurements of volatile organic compounds in the Earth's atmosphere using proton-transfer-reaction mass spectrometry, Mass Spectrom. Rev., 26, 223–257, 2007.
Dunne, E.: Measurement of Atmospheric Volatile Organic Compounds with Proton Transfer Reaction-Mass Spectrometry, PhD. Sci., Monash University, Melbourne, Australia, 280 pp., 2016.
Dunne, E., Galbally, I. E., Lawson, S. L., and Patti, A.: Interference in the PTR-MS measurement of acetonitrile at m∕z 42 in polluted urban air – a study uding switchable reagent ion PTR-MS, Int. J. Mass Spectrom., 319–320, 40–47, 2012.
Ellis, A. M. and Mayhew, C. A.: Proton Transfer Reaction Mass Spectrometry: Principles and Applications, John Wiley and Sons Ltd., Chichester, UK, 2014.
Franq, B. G. and Govaerts, B. B.: Measurement methods comparison with errors-in-variables regressions. From horizintal to vertical OLS regression, review and new perspectives, Chemometr. Intell. Lab., 134, 123–129, 2014.
Geron, C., Rasmussen, R., Arnts, R. R., and Guenther, A.: A review and synthesis of monoterpene speciation from forests in the United States, Atmos. Environ., 34, 1761–1781, 2000.
Gilpin, T., Apel, E., A., F., Wert, B., Calvert, J., Genfa, Z., Dasgupta, P. K., Harder, P., Heikes, P. W., Hopkins, B., Westberg, H., Kleindienst, T. E., Lee, Y. N., Zhou, X., Lonneman, W., and Sewell, S.: Intercomparion of six ambient [CH2O] measurement techniques, J. Geophys. Res.-Atmos., 102, 21161–21188, https://doi.org/10.1029/97JD01314, 1997.
Gueneron, M., Erickson, M. H., VanderSchelden, G. S., and Jobson, B. T.: PTR-MS fragmentation patterns of gasoline hydrocarbons, Int. J. Mass Spectrom., 379, 97–109, 2015.
Hak, C., Pundt, I., Trick, S., Kern, C., Platt, U., Dommen, J., Ordóñez, C., Prévôt, A. S. H., Junkermann, W., Astorga-Lloréns, C., Larsen, B. R., Mellqvist, J., Strandberg, A., Yu, Y., Galle, B., Kleffmann, J., Lörzer, J. C., Braathen, G. O., and Volkamer, R.: Intercomparison of four different in-situ techniques for ambient formaldehyde measurements in urban air, Atmos. Chem. Phys., 5, 2881–2900, https://doi.org/10.5194/acp-5-2881-2005, 2005.
Hansel, A., Wisthaler, A., Schwarzman, M., and Lindinger, W.: Energy dependencies of the proton transfer reactions , Int. J. Mass Spectrom., 167–268, 697–703, 1997.
Harris, D. C.: Quantitative Chemical Analysis, W. H. Freeman and Co, New York, 2003.
Herrington, J. S., Fan, Z. H., Lioy, P. J., and Zhang, J.: Low acetaldehyde collection efficiencies for 24 h sampling with 2,4-dinitrophenylhydrazine(DNPH)-coated solid sorbents, Environ. Sci. Technol., 41, 580–585, 2007.
Ho, S. S. H., Chow, J. C., Watson, J. G., Ip, H. S. S., Ho, K. F., Dai, W. T., and Cao, J. J.: Biases in ketone measurements using DNPH-coated solid sorbent cartridges, Anal. Chem., 6, 967–974, 2014.
Hoerger, C. C., Claude, A., Plass-Duelmer, C., Reimann, S., Eckart, E., Steinbrecher, R., Aalto, J., Arduini, J., Bonnaire, N., Cape, J. N., Colomb, A., Connolly, R., Diskova, J., Dumitrean, P., Ehlers, C., Gros, V., Hakola, H., Hill, M., Hopkins, J. R., Jäger, J., Junek, R., Kajos, M. K., Klemp, D., Leuchner, M., Lewis, A. C., Locoge, N., Maione, M., Martin, D., Michl, K., Nemitz, E., O'Doherty, S., Pérez Ballesta, P., Ruuskanen, T. M., Sauvage, S., Schmidbauer, N., Spain, T. G., Straube, E., Vana, M., Vollmer, M. K., Wegener, R., and Wenger, A.: ACTRIS non-methane hydrocarbon intercomparison experiment in Europe to support WMO GAW and EMEP observation networks, Atmos. Meas. Tech., 8, 2715–2736, https://doi.org/10.5194/amt-8-2715-2015, 2015.
Horwitz, W.: Evaluation of analytical methods used for regualtion of foods and drugs, Anal. Chem., 54, 67–76, 1982.
Inomata, S. and Tanimoto, H.: A deuterium-labeling study on the reproduction of hydronium ions in the PTR-MS detection of ethanol, Int. J. Mass Spectrom., 285, 95–99, 2009.
Inomata, S. and Tanimoto, H.: A quantitative examination of the detection sensitvities of proton-transfer reaction mass spectrometry for gaseous 2-propanol and acetic acid, B. Chem. Soc. Jpn., 83, 900–904, 2010.
Inomata, S., Tanimoto, H., Kameyama, S., Tsunogai, U., Irie, H., Kanaya, Y., and Wang, Z.: Technical Note: Determination of formaldehyde mixing ratios in air with PTR-MS: laboratory experiments and field measurements, Atmos. Chem. Phys., 8, 273–284, https://doi.org/10.5194/acp-8-273-2008, 2008.
ISO: ISO 6879: 1995 Air Quality-Performance Characteristics and Related Concepts for Air Quality Measruing Methods, International Organization for Standardization, Geneva, Switzerland, 1995.
JCGM: JCGM 100: 2008 Evaluation of Measurement Data – Guide to the Expression of Uncertainty in Measurement, BIPM, Sevres, France, 2008.
Jobson, B. T., Volkamer, R. A., Velasco, E., Allwine, G., Westberg, H., Lamb, B. K., Alexander, M. L., Berkowitz, C. M., and Molina, L. T.: Comparison of aromatic hydrocarbon measurements made by PTR-MS, DOAS and GC-FID during the MCMA 2003 Field Experiment, Atmos. Chem. Phys., 10, 1989–2005, https://doi.org/10.5194/acp-10-1989-2010, 2010.
Kajos, M. K., Rantala, P., Hill, M., Hellén, H., Aalto, J., Patokoski, J., Taipale, R., Hoerger, C. C., Reimann, S., Ruuskanen, T. M., Rinne, J., and Petäjä, T.: Ambient measurements of aromatic and oxidized VOCs by PTR-MS and GC-MS: intercomparison between four instruments in a boreal forest in Finland, Atmos. Meas. Tech., 8, 4453–4473, https://doi.org/10.5194/amt-8-4453-2015, 2015.
Karl, T., Hansel, A., Cappellin, L., Kaser, L., Herdlinger-Blatt, I., and Jud, W.: Selective measurements of isoprene and 2-methyl-3-buten-2-ol based on NO+ ionization mass spectrometry, Atmos. Chem. Phys., 12, 11877–11884, https://doi.org/10.5194/acp-12-11877-2012, 2012.
Kaser, L., Karl, T., Schnitzhofer, R., Graus, M., Herdlinger-Blatt, I. S., DiGangi, J. P., Sive, B., Turnipseed, A., Hornbrook, R. S., Zheng, W., Flocke, F. M., Guenther, A., Keutsch, F. N., Apel, E., and Hansel, A.: Comparison of different real time VOC measurement techniques in a ponderosa pine forest, Atmos. Chem. Phys., 13, 2893–2906, https://doi.org/10.5194/acp-13-2893-2013, 2013.
Kato, S., Miyakawa, Y., Kaneko, T., and Kajii, Y.: Urban air measurements using PTR-MS in Tokyo area and comparison with GC-FID measurements, Int. J. Mass Spectrom., 235, 103–110, 2004.
Kermack, K. and Haldane, J. B. S.: Organic correlation and allometry, Biometrika, 37, 30–41, 1950.
Keywood, M., Selleck, P. W., Galbally, I. E., Lawson, S. J., Powell, J., Cheng, M., Gillett, R., Ward, J., Harnwell, J., Dunne, E., Boast, K., Reisen, F., Molloy, S., Griffiths, A., Chambers, S., Humphries, R., Andree-Guerette, E., and Cohen, D.: Sydney Particle Study 2 – Aerosol and Gas Data Collection v1., CSIRO Data Collection, https://doi.org/10.4225/08/5791B5528BD63, 2016.
Kleindienst, T. E., Shepson, P. B., Nero, C. M., Arnts, R. R., Tejada, S. B., Mackay, G. I., Mayne, L. K., Schiff, H. I., Lind, J. A., Kok, A., Lazrus, A. L., Dasgupta, P. K., and Dong, S.: An intercomparison of formaldehyde measurement techniques at ambient concentration, Atmos. Environ., 22, 1931–1939, 1988.
Kuster, W. C., Jobson, B. T., Karl, T., Riemer, D., Apel, E., Goldan, P. D., and Fehsenfeld, F. C.: Intercomparison of volatile organic carbon measurement techniques and data at La Porte during the TexAQS2000 Air Quality Study, Environ. Sci. Technol., 38, 221–228, 2004.
Lawson, D. R., Biermann, H. W., Tuazon, E. C., Winer, A. M., Mackay, G. I., Schiff, H. I., Kok, A., Dasgupta, P. K., and Fung, K.: Formaldehyde measurement methods evaluation and ambient concentrations during the Carbonaceous Species Methods Comparison Study, Aerosol Sci. Tech., 12, 64–76, 1990.
Lindinger, W., Hansel, A., and Jordan, A.: On-line monitoring of volatile organic compounds at pptv levels by means of proton-transfer-reaction mass spectrometry (PTR-MS) medical applications, food control and environmental research, Int. J. Mass Spectrom., 173, 191–241, 1998.
Maleknia, S., Bell, T., and Adams, M.: PTR-MS analysis of reference and plant-emitted volatile organic compounds, Int. J. Mass Spectrom., 262, 203–210, 2007.
Müller, K., Haferkorn, S., Grabmer, W., Wistahler, A., Hansel, A., Kreuzwieser, J., Cojocariu, C., Rennenberg, H., and Herrmann, H.: Biogenic carbonyl compounds within and above a coniferous forest in Germany, Atmos. Environ., 40, S81–S91, 2006.
OEH: New south Wales Air Quality Statement 2015, Office of Environment and Heritage, Sydney NSW, Australia, 2015.
Park, J. H., Goldstein, A. H., Timkovsky, J., Fares, S., Weber, R. J., Karlik, J., and Holzinger, R.: Active atmosphere-ecosystem exchange of the vast majority of detected volatile organic compounds, Science, 341, 643–647, 2013.
Rogers, T. M., Grimsrud, E. P., Herndon, S. C., Jayne, J. T., Kolb, C. E., Allwine, E., Westberg, H., Lamb, B. K., Zavala, M., Molina, L. T., Molina, M. J., and Knighton, W. B.: On-road measurements of volatile organic compounds in the Mexico Cty metropolitan area using proton transfer reaction mass spectrometry, Int. J. Mass Spectrom., 252, 26–37, 2006.
Spanel, P., Ji, Y., and Smith, D.: SIFT studies of the reactions of H3O+, NO+ and with a series of aldehydes and ketones, Int. J. Mass Spectrom., 165–166, 25–37, 1997.
Sprung, D., Jost, C., Reiner, T., Hansel, A., and Wistahler, A.: Acetone and acetonitrile in the tropical Indian Ocean boundary layer and free troposphere: Aircraft-based intercomparison of AP-CIMS and PTR-MS measurements, J. Geophys. Res.-Atmos., 106, 28511–28527, https://doi.org/10.1029/2000JD900599, 2001.
Stonner, C., Derstroff, B., Klupfel, T., Crowley, J. N., and Williams, J.: Glyoxal measurement with proton transfer reaction time of flight mass spectrometer (PTR-TOF-MS): characterization and calibration, J. Mass Spectrom., 52, 30–35, 2016.
Thalman, R., Baeza-Romero, M. T., Ball, S. M., Borrás, E., Daniels, M. J. S., Goodall, I. C. A., Henry, S. B., Karl, T., Keutsch, F. N., Kim, S., Mak, J., Monks, P. S., Muñoz, A., Orlando, J., Peppe, S., Rickard, A. R., Ródenas, M., Sánchez, P., Seco, R., Su, L., Tyndall, G., Vázquez, M., Vera, T., Waxman, E., and Volkamer, R.: Instrument intercomparison of glyoxal, methyl glyoxal and NO2 under simulated atmospheric conditions, Atmos. Meas. Tech., 8, 1835–1862, https://doi.org/10.5194/amt-8-1835-2015, 2015.
USEPA: Compendium Method TO-17 Determination of Volatile Organic Compounds in Ambient Air Using Actie Sampling Onto Sorbent Tubes, 1999a.
USEPA: Compendium Method TO 11A- Determination of Formaldehyde in Ambient Air Using Adsorbent Cartridge Followed by High Performance Liquid Chromatography (HPLC) [Active Sampling Methodology], 1999b.
Wang, M., Zeng, L., Lu, S., Shao, M., Liu, X., Yu, X., Chen, W., Yuan, Q., Hu, M., and Zhang, Z.: Development and validation of a cryogen-free automatic gas chromatogrph system (GC-MS/FID) for online measurements of volatile organic compounds, Anal. Methods-UK, 6, 9424, https://doi.org/OI: 10.1039/c4ay01855a, 2014.
Wang, T., Španěl, P., and Smith, D.: A selected ion flow tube, SIFT, study of the reactions of H3O+, NO+ and ions with several N- and O-containing heterocyclic compounds in support of SIFT-MS, Int. J. Mass Spectrom., 237, 167–174, 2004.
Warneke, C., van der Veen, C., Luxembourg, S., de Gouw, J., and Kok, A.: Measurements of benzene and toluene in ambient air using proton-transfer-reaction mass spectrometry: calibration, humidity dependence, and field intercomparison, Int. J. Mass Spectrom., 207, 167–182, 2001.
Warneke, C., de Gouw, J., Kuster, W. C., Goldan, P. D., and Fall, R.: Validation of atmospheric VOC measurements by proton-transfer-reaction mass spectrometry using a gas-chromatographic preseparation method, Environ. Sci. Technol., 37, 2494–2501, 2003.
Warneke, C., Roberts, J. M., Veres, P., Gilman, J., Kuster, W. C., Burling, I., Yokelson, R. J., and de Gouw, J.: VOC identification and inter-comparison from laboratory biomass burning using PTR-MS and PIT-MS, Int. J. Mass Spectrom., 303, 6–14, 2011.
Wisthaler, A., Hansel, A., Koppmann, R., Brauers, T., Bossmeyer, J., Steinbrecher, R., Junkermann, W., Müller, K., Solomon, S. J., and Apel, E.: PTR-MS measurements of HCHO and results from HCHO intercomparison measurements in the atmosphere simulation chamber SAPHIR, Geophys. Res. Abstr., 8, 04776, 2006.
Wood, E. C., Knighton, W. B., Fortner, E. C., Herndon, S. C., Onasch, T. B., Franklin, J. P., Worsnop, D. R., Dallmann, T. R., Gentner, D. R., Goldstein, A. H., and Harley, R. A.: Ethylene glycol emissions from on-road vehicles, Environ. Sci. Technol., 49, 3322–3329, 2015.
Yuan, B., Warneke, C., Shao, M., and De Gouw, J.: Interpretation of volatile organic compound measurements by proton-transfer-reaction mass spectrometry over the deepwater horizon oil spill, Int. J. Mass Spectrom., 358, 43–48, 2014.