the Creative Commons Attribution 4.0 License.
the Creative Commons Attribution 4.0 License.
 | 20 Apr 2018
Comparison of aerosol optical depth from satellite (MODIS), sun photometer and broadband pyrheliometer ground-based observations in Cuba
Juan Carlos Antuña-Marrero
Victoria Cachorro Revilla
Frank García Parrado
Ángel de Frutos Baraja
Albeth Rodríguez Vega
David Mateos
René Estevan Arredondo
Carlos Toledano
In the present study, we report the first comparison between the aerosol optical depth (AOD) and Ångström exponent (AE) of the Moderate Resolution Imaging Spectroradiometer (MODIS) instruments on the Terra (AODt) and Aqua (AODa) satellites and those measured using a sun photometer (AODSP) at Camagüey, Cuba, for the period 2008 to 2014. The comparison of Terra and Aqua data includes AOD derived with both deep blue (DB) and dark target (DT) algorithms from MODIS Collection 6. Combined Terra and Aqua (AODta) data were also considered. Assuming an interval of ±30 min around the overpass time and an area of 25 km around the sun photometer site, two coincidence criteria were considered: individual pairs of observations and both spatial and temporal mean values, which we call collocated daily means. The usual statistics (root mean square error, RMSE; mean absolute error, MAE; median bias, BIAS), together with linear regression analysis, are used for this comparison. Results show very similar values for both coincidence criteria: the DT algorithm generally displays better statistics and higher homogeneity than the DB algorithm in the behaviour of AODt, AODa, AODta compared to AODSP. For collocated daily means, (a) RMSEs of 0.060 and 0.062 were obtained for Terra and Aqua with the DT algorithm and 0.084 and 0.065 for the DB algorithm, (b) MAE follows the same patterns, (c) BIAS for both Terra and Aqua presents positive and negative values but its absolute values are lower for the DT algorithm; (d) combined AODta data also give lower values of these three statistical indicators for the DT algorithm; (e) both algorithms present good correlations for comparing AODt, AODa, AODta vs. AODSP, with a slight overestimation of satellite data compared to AODSP, (f). The DT algorithm yields better figures with slopes of 0.96 (Terra), 0.96 (Aqua) and 0.96 (Terra + Aqua) compared to the DB algorithm (1.07, 0.90, 0.99), which displays greater variability. Multi-annual monthly means of AODta establish a first climatology that is more comparable to that given by the sun photometer and their statistical evaluation reveals better agreement with AODSP for the DT algorithm. Results of the AE comparison showed similar results to those reported in the literature concerning the two algorithms' capacity for retrieval. A comparison between broadband aerosol optical depth (BAOD), derived from broadband pyrheliometer observations at the Camagüey site and three other meteorological stations in Cuba, and AOD observations from MODIS on board Terra and Aqua show a poor correlation with slopes below 0.4 for both algorithms. Aqua (Terra) showed RMSE values of 0.073 (0.080) and 0.088 (0.087) for the DB and DT algorithms. As expected, RMSE values are higher than those from the MODIS–sun photometer comparison, but within the same order of magnitude. Results from the BAOD derived from solar radiation measurements demonstrate its reliability in describing climatological AOD series estimates.
- Article
(2287 KB) -
Supplement
(215 KB) - BibTeX
- EndNote


Atmospheric aerosols play an important role in weather and climate (IPPC, 2013). Depending on the physical, chemical and optical properties of atmospheric aerosols together with their origin and spatial and temporal distribution, they can affect the Earth's radiative budget as well as dynamic, biogeochemical and chemical processes (Knippertz and Stuut, 2014; Seinfeld and Pandis, 2016). All of these processes play a key role at a global and regional scales due to the high spatio-temporal variability of aerosol properties. Aerosols can also affect the biosphere and, in particular, humans in several ways: for example, the Saharan dust transported to America across the Atlantic supplies nutrients to the Amazon forest (Swap et al., 1992; Yu et al., 2015). Moreover, in the Caribbean, in addition to aerosols of local origin, dust makes the amount of aerosol exceed air quality standards associated with human health (Prospero and Lamb, 2003; Prospero et al., 2014). The great variability of Saharan dust transported to the Caribbean basin has been documented using long-term observations in Barbados (Prospero and Lamb, 2003; Prospero and Mayol-Bracero, 2013) and more recently in Miami, Guadeloupe and Cayenne (Prospero et al., 2014). The Caribbean region is thus of great importance for aerosol studies due to its low aerosol background, which helps aerosol transport studies (Kaufman et al., 2005; Denjean et al., 2016; Velasco-Merion et al., 2017). One difficulty, however, is that it is an area where land and water are mixed in individual pixels when remote satellite aerosol studies are carried out.
In order to improve calculations of aerosol climatology for Cuban land areas, which remains ongoing, we compared aerosol ground-based observations and available satellite data, as a first step towards assessing this climatology. This involves a comparison between all the available Camagüey sun photometer aerosol optical depth (AOD) data and the broadband aerosol optical depth (BAOD) provided by solar radiation measurements with the series of AOD (550 nm) from the Moderate Resolution Imaging Spectroradiometer (MODIS) instruments on board the Terra (2001 to 2015) and Aqua (2002 to 2015) satellites. Selected observations were those spatially and temporally collocated between satellite instruments and ground-based sites. In addition to the aerosol load given by the AOD, we also evaluated the Ångström exponent (AE) as a parameter that provides information about particle size for MODIS and sun photometer data.
One of the challenges we faced was the low amount of potential coincident AOD and AE from MODIS and the sun photometer. The same is true for AOD from MODIS and broadband-pyrheliometer-derived BAOD, in both cases due to existing gaps in the ground-based time series and also because this area is strongly affected by clouds (mainly partial cloud cover). In order to maximise the number of satellite and surface measurement pairs, we used primary AOD and AE L2 products without any averaging as well as combined AOD and AE from Terra and Aqua MODIS sensors as a whole data set. We also used deep blue (DB) and dark target (DT) algorithms to evaluate the reliability of satellite AOD and AE retrievals in selecting the most appropriate data set to derive the climatology of both AOD and AE aerosol parameters in Cuba.
The earliest attempt to measure aerosol optical properties at ground level in Cuba recorded in a scientific publication dates back to 1988 (Martinez, 1988), where the Linke turbidity factor and the Ångströmß turbidity coefficient were derived from solar direct normal irradiance (DNI) measurements. Twenty years later, a cooperation agreement between scientific institutions in Spain and Cuba enabled a Cimel CE318 sun photometer to be installed at Camagüey (Cuba) and for it to be included in the AErosol RObotic NEtwork (AERONET, Holben et al., 1998). Several aerosol studies have been conducted using the AOD and AE from Camagüey's sun photometer observations (see Antuña-Marrero et al., 2017; http://www.goac.cu/uva/, last access: 9 April 2018).
Broadband pyrheliometric DNI observations allow the BAOD to be determined, which complements sun photometer aerosol observations at Camagüey, and provides aerosol information at three other locations in Cuba. The main purpose of determining BAOD is to offer information concerning aerosol variability over the island, also making it possible to extend aerosol records back in time. The first BAOD calculations used for DNI measurement were conducted at Camagüey under clear-sky conditions for the period 1985–2007 using Gueymard's (1998) improved parameterisations (Fonte and Antuña, 2011). García et al. (2015) used this kind of DNI observation for a longer period (1981–2013) and compared this BAOD to sun photometer AOD data. They used observations under the clear line of sight between the broadband pyrheliometer and a region of 5∘ around the sun as well as improved climatological values of the integrated water vapour.
This comparative analysis does not aim to be a validation study of the MODIS sensor since many works during the long history of the MODIS sensor on the Terra and Aqua platforms have sought to improve its features (these include Kaufman et al., 1997a, b; Tanré et al., 1997; Remer et al., 2002, 2005, 2006; Hsu, et al., 2004, 2006, 2013; Levy et al., 2007, 2009, 2010, 2013, 2015; Sayer et al., 2013, 2014; https://darktarget.gsfc.nasa.gov/atbd/overview, last access: 9 April 2018). However, compared to other areas of the world, no studies have been reported in the Caribbean region and in Cuba in particular (Papadimas et al., 2009; Mishchenko et al., 2010; Kahn et al., 2011; Bennouna et al., 2011, 2013; Witte et al., 2011; Gkikas et al., 2013, 2016; Levy et al., 2015).
As mentioned, our aim is to establish reliable aerosol climatology in Cuba based on satellite and ground-based instruments. By making a detailed comparison of similarities and differences between available data sets, the present work seeks to make a contribution to this aim.
The article is structured as follows. Section 2 begins with the description of the data sets, followed by the explanation of the coincidence criteria between the AOD and AE MODIS L2 products and the same two variables from the sun photometer and broadband pyrheliometer BAOD. This section ends with the explanation of the statistical indices used. Section 3 is composed of various sections designed to explain and discuss the large volume of results that emerge from the comparison by taking two different retrieval AOD aerosol algorithms for both the Terra and Aqua platforms, with the sun photometer and BAOD. Section 4 contains the conclusions.
2.1 MODIS satellite instruments
The twin MODIS instruments on board the Terra and Aqua satellites have accumulated over 15 years of observations of several atmospheric parameters, including AOD at several wavelengths and the AE parameter. These are the two most common parameters for describing atmospheric aerosol optical properties. Based on the assumptions about the properties of the Earth's surface and the aerosol type expected over these surfaces, the MODIS Atmosphere team developed three algorithms for processing MODIS observations (Levy et al., 2013). Regions which appear visually dark from space, referred to as dark target (DT), include the algorithm assumptions for vegetated land surfaces (Kaufman et al., 1997a, b) and for remote ocean regions (Tanré et al., 1997). The third algorithm, called the deep blue (DB) algorithm, includes assumptions for surfaces which are visually bright from space and uses near-UV wavelengths (DB band near 410 nm). Under these conditions, the DB band provides a better signal than the visible wavelengths, improving the information content for aerosol retrievals (Hsu et al., 2004, 2006) due to lower surface albedo at this short wavelength. Levy et al. (2013) provide a detailed explanation of basic MODIS retrieval concepts and improvements to the DT algorithm in Collection 6 for aerosol products. In addition, Hsu et al. (2013) give a detailed explanation of the DB algorithm improvements in Collection 6.
Following Levy et al. (2013), we summarise the MODIS calculus chain. MODIS Level 0 (L0) is the basic data file containing raw observations from the sensors. Observations grouped in 5 min swath scans (called granules) are Level 1A (L1A), which after calibration become Level 1B (L1B). L1B data feed the MODIS geophysical retrieval algorithms, generating the primary geophysical observations, which include AOD and AE, designated Level 2 (L2). This is followed by Level 3 (L3), consisting of daily and monthly statistics of geophysical products, in 1∘ × 1∘ latitude–longitude grid boxes. L2 aerosol products are stored in the MOD04 (Terra) and MYD04 (Aqua) files.
Table 1Aerosol products from the MODIS Collection 6 data set used in the present study.
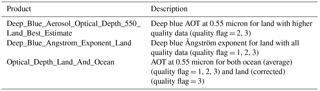
We selected AOD at 550 nm from MODIS (both on Terra and Aqua satellites) Collection 6, L2 data level derived using the two algorithms, DB for land with the highest data quality (quality flag = 2, 3) and DT for land, corrected (quality flag = 3). In addition, we selected the AE retrieved over land from the DB algorithm using the corresponding pairs of AOD values (412∕470 or 470∕650 nm) with the highest quality (quality flag = 2, 3), since the DT algorithm only retrieves the AE over the ocean (Table B1 in Levy et al., 2013). Table 1 lists the aerosol products used in the present study.
At a global scale, it has been established that by using the DT algorithm over land, MODIS-retrieved aerosol size parameters evidence poor quantitative capacity, particularly AE (e.g. Levy et al., 2010; Mielonen et al., 2011). However, for the DB algorithm, AE capacity increases for moderate or high aerosol loadings, AOD > 0.3 (Sayer et al., 2013). We therefore decided to conduct the comparison between the AE from the MODIS DB algorithm and the AE from the Camagüey sun photometer to estimate its uncertainty. The enhanced DB algorithm methodology for deriving AE in Collection 6 is the same as in Collection 5. It uses the Ångström power law and AOD values at 412, 470 and 650 nm. Under non-vegetated surfaces, AE is derived using the AOD from pair 412∕470 nm. For vegetated surfaces, AE is derived from the 470∕650 nm pair. In the case of a surface with mixed vegetated and non-vegetated areas, AE is derived using the AOD at the three wavelengths mentioned (Hsu et al., 2013).
2.2 Camagüey AERONET sun photometer
The Camagüey sun photometer was installed thanks to an agreement between the University of Valladolid (UVA), Spain, and the Meteorological Institute of Cuba (INSMET) for joint aerosol research. It contributes to the NASA AErosol RObotic NEtwork (AERONET; Antuña et al., 2012). Annual replacement of the instrument for a calibrated instrument, sent from Valladolid to Camagüey, encountered numerous transportation and customs delays, causing gaps in the observation series. However, the collected series of observations does represent a valuable data set of aerosol columnar optical properties in the Caribbean, enabling GOAC–INSMET (Atmospheric Optics Group of Camagüey – Institute of Meteorology) and GOA-UVA (Atmospheric Optics Group of Valladolid University) to conduct preliminary aerosol research (Antuña-Marrero et al., 2017).
The AERONET Cimel sun photometers have been conducting aerosol observations at nine spectral narrow band filters for over two decades, producing spectral AOD and column effective particle properties (Holben et al., 1998). In general, Cimel sun photometer nominal wavelengths are 340, 380, 440, 500, 675, 870, 935, 1020 and 1640 nm. In some cases, the 1640 nm is replaced by a 1240 nm. Its processing algorithm, based on the Beer–Lambert–Bouguer law, allows spectral optical depth values at an uncertainty level of approximately 0.01 to 0.02 to be determined (Holben et al., 1998; Eck et al., 1999). Because of this low level of uncertainty, AERONET AOD observations commonly serve as reference values (ground truth) to validate AOD measured by other remote sensing sensors (Zhao et al., 2002). AERONET AE are derived for five different wavelength intervals: 340–440, 380–500, 440–675, 440–870 and 500–870 nm. In the present study, the selected AE is the one in the 440–675 nm range (AESP).
We used Camagüey sun photometer Level 2.0 data as processed by AERONET, i.e. cloud screened and quality assured (Smirnov et al., 2000), covering the period from 7 October 2008 to 1 August 2014. This consisted of 29 940 single AOD (340 to 1640 nm) and AESP observations. By applying the Ångström power law, we converted single sun photometer AOD observations at 500 nm wavelength to AOD at 550 nm, (AODSP) using the AESP from the same measurement:
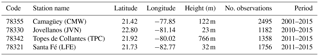
Table 2Information about Cuban actinometric stations operating under the Solar Radiation Diagnostic Service (SRDS). Available number of BAOD observations are included in column 6 and the period is covered in the last column.
2.3 Solar direct irradiance measurements and derived BAOD
Four actinometric stations belonging to the Solar Radiation Diagnostic Service in Cuba provided the DNI observations used to derive the BAOD (Antuña et al., 2008, 2011). Table 2 lists the WMO code of the four stations, the geographical location and the number of observations available for the periods at each station. Figure 1 shows the geographical location of the four stations. The stations are equipped with Yanishevsky manual broadband solar radiation instruments supplied between the 1970s and 1980s by the Hydrometeorological Service of the Soviet Union. The Yanishevski broadband pyrheliometer is the M-3 model, a thermo-battery system with a 5∘ field of view connected to an analogic galvanometer, GSA-1MA or GSA-1MB model (GGO, 1957).
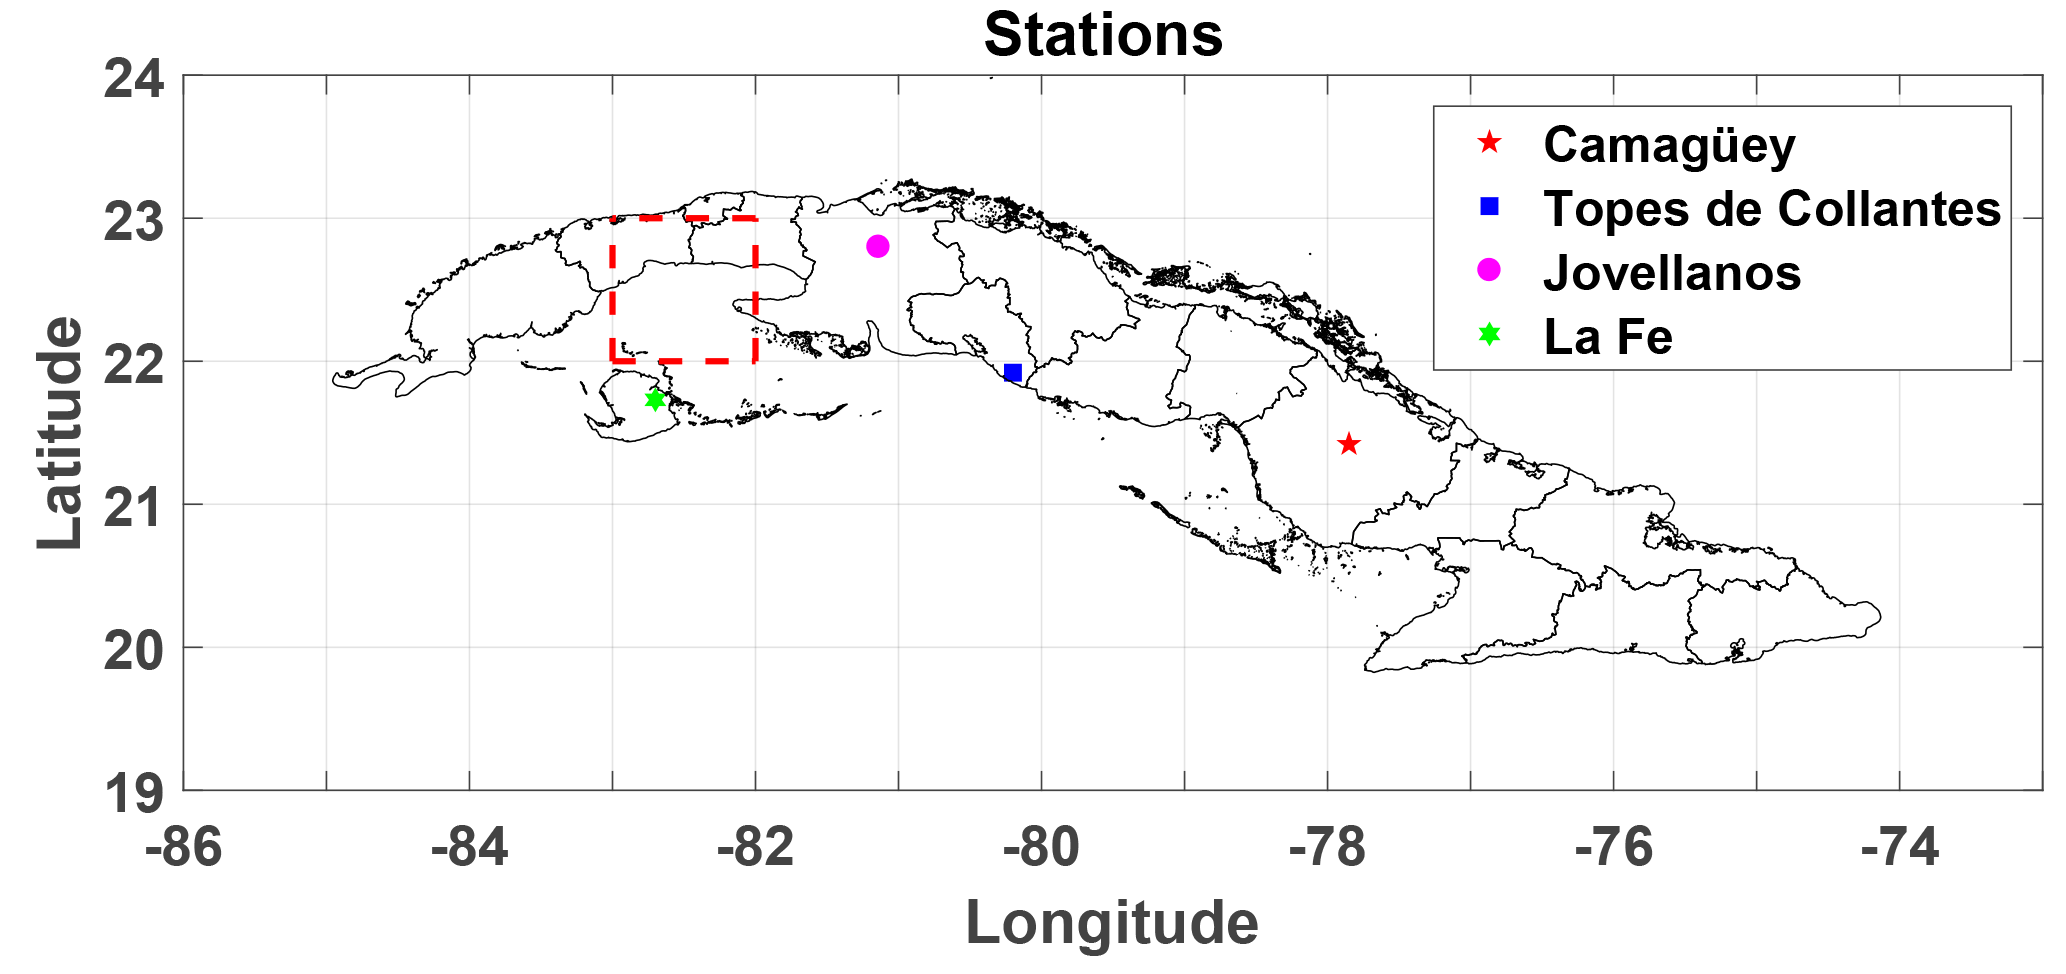
Figure 1Map of Cuba with the stations where the sun photometer and the four broadband pyrheliometer observations are conducted.
Calibrations of all the actinometric instruments are conducted periodically by comparison with a master broadband pyrheliometer and a master pyranometer. Trained observers perform hourly manual observations from sunset to sunrise, following the standard methodologies and quality control procedures established for this set of instruments (GGO, 1957). Once the manual measurement is conducted and recorded in a notebook designed for that purpose, all the measurement information is digitised using Actino version 2.0 software (Estevan, 2010; Antuña et al., 2008) of the Diagnostic Service of the Broadband Aerosol & Clouds Optical Depth for Cuba (http://www.goac.cu/seoc/, last access: 9 April 2018), a public service provided by GOAC. The software includes robust quality control of input data, its processing and output quality control (Antuña et al., 2011). Because of the ageing of the Soviet-era instruments, the magnitude of the error associated with the broadband pyrheliometers currently operating in Cuba is estimated to be around 10 %.
Based on the model parameterisation of solar broadband irradiances, the integrated aerosol optical depth δa, BAOD, can be obtained using Eq. (2), in which direct normal solar irradiance (DNI) is measured and the remaining variables are determined independently (Gueymard, 1998).
The individual atmospheric processes considered are Rayleigh scattering, absorption by ozone (O3), stratospheric and tropospheric nitrogen dioxide (NO2), uniformly mixed gases, water vapour, and extinction (mostly scattering) by aerosols. The variables in Eq. (2) are optical air mass of aerosols (ma), Rayleigh scattering, uniformed mixed gases, O3 absorption and stratospheric NO2(mR), water vapour (mw) and tropospheric NO2 (mnt) and the corresponding broadband optical depths δ. The method makes a series of assumptions, i.e. using Bouguer's law, in the strict sense that it is only valid for monochromatic radiation and is applied to define broadband transmittance. For a detailed description of the derivation of Eq. (2) and the parameterisation of the variables, see Gueymard (1998), Fonte and Antuña (2011) and García et al. (2015) for the method's application to our data.
In order to avoid cloud contamination in BAOD retrieval, we used only DNI observations with the cloud-free condition in the line of sight to the sun. In other words there is a clear line of sight between the broadband pyrheliometer and a region of 5∘ around the sun (GOAC, 2010). Furthermore, to avoid errors associated with high-elevation zenith angles, causing larger air masses, DNI observations performed at 06:00 and 18:00 local time (LT) were not used in the present study.
The main errors of the method for determining BAOD are associated with instrumental errors and the error when estimating the precipitable water (PW) component (Gueymard, 2013). In the first case, in order to ensure the quality of the solar radiation data set from the four actinometric stations used in this study, including DNI, they are regularly subject to a two-step quality control procedure (Estevan et al., 2012). The first step applies the standard procedures designed for Yanishevski-type actinometric instruments from the former Soviet Hydrometeorological Service (Kirilov et al., 1957). Data that pass this quality procedure are then evaluated following the standards set by the Baseline Solar Radiation Network, BSRN (Ohmura, 1998; Long and Shi, 2006, 2008; Estevan et al., 2012).
The size of the field of view of the broadband pyrheliometers is another potential source of error since, in certain cases, circumsolar radiation causes more radiation to be measured than expected. In such cases, the effect is an underestimation of BAOD. Nevertheless, this effect is low in general, except in specific conditions such as large air masses or in the presence of high aerosol loads or large-particle aerosols (Gueymard, 1998).
Monthly mean PW values at the four actinometric stations were used as input to derive monthly mean δw values (Gueymard, 1998). For Camagüey, we calculated the monthly mean PW values from the sun photometer PW observations from 2008 to 2014 (García et al., 2015). For each of the three other stations, we calculated the monthly mean PW values using the vertical integrated water vapour (kg m−2) from spatially coincident ERA-Interim reanalysis between 1979 and 2013 (Barja et al., 2015). Taking into account all the above-mentioned errors, the total uncertainty of the method used to determine BAOD is of the order of 10−2 (Gueymard, 1998).
2.4 Coincidence criteria for MODIS and sun photometer observations
Obtaining sufficient AOD satellite observations over land for climatological studies in insular areas poses a challenge when compared to the amount of data usually available over continental regions such as the USA, Europe or China. The reason tends to be the small size of the islands. In the case of Cuba, its particular narrow latitudinal and elongated longitudinal extension combined with its irregular coasts renders the MODIS L3 product unsuitable for climatological studies. As can be seen in Fig. 1, most of the 1∘ by 1∘ grid cells consist of both land and sea areas, resulting from the merging AOD measured over the two surfaces. The red grid cell in Fig. 1 is an example of the limitations of MODIS L3 products in representing land areas in the case of Cuba. In response to this, we plan to use the MODIS L2 product to produce aerosol climatology for Cuba rather than L3, which is commonly used for this type of study. In this regard, it is vital to validate the single observations from MODIS L2 with the single sun photometer observations. We designed and applied a method to maximise the available pairs of MODIS L2 and sun photometer AOD and AE observations that are coincident in space and time while avoiding duplicating the use of any of them. Additionally, in an effort to increase the amount of data, we tested the differences between Terra and Aqua L2 MODIS AOD and AE observations in order to determine the possible combination of both Terra and Aqua in a single data set.
Hereinafter, AODt, AODa, AODta and AODSP will denote spatio-temporal AOD from collocated MODIS (Terra, Aqua and Terra + Aqua) and AERONET sun photometer data respectively. Unless otherwise indicated, “AOD” refers to AOD at 550 nm wavelength. Similarly, AE from Terra, Aqua and Terra + Aqua derived using only the DB algorithm will be denoted by AEt, AEa and AEta.
Given the challenges arising from the small amount of potential coincident spatial and temporal AODt and AODa with AODSP and BAOD, as explained above, we used MODIS L2 data to maximise the number of available MODIS observations for comparison. Hereinafter, we call these observations “single observation values”, using the same denomination for the instantaneous sun photometer observations on each day and for hourly broadband pyrheliometer observations. Another way to increase the amount of data was to combine AODt and AODa (AODta) for comparison with AODSP and BAOD. In these cases, different observations of AODSP and BAOD match AODt and AODa because the time difference established for coincidence (±30 min) is lower than the difference between the Terra and Aqua daily overpass times.
Table 3Number of available non-negative AODa, AODt, AEa and AEt data. They are spatially coincident with the Camagüey sun photometer in a radius of 25 km for each retrieval algorithm, DB and DT for the whole period 2001–2015 as well as the period 2008–2014, when sun photometer data, AODSP and AESP, are available.
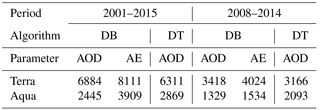
Spatial coincidence criteria were guaranteed by selecting all the AODt and AODa measured inside the 25 km radius around the sun photometer site for the whole data period from each satellite sensor. Table 3 shows the amount of spatial coincident information for non-negative AODt and AODa values. It shows the amount of data available for the whole period 2001 to 2015, when broadband pyrheliometer observations at Camagüey are available, and 2008 to 2014, the period of available sun photometer observations. There are at least twice as many available observations from Terra as from Aqua for the two periods. The greater number of available data from Terra compared to Aqua is associated with the different overpass times of the two satellites over Cuba. Figure 2 shows that Terra overpasses occur from mid-morning to late morning before convective activity begins, while the Aqua overpasses take place in the early afternoon when convection has already begun, causing a higher number of observations to be discarded in AOD retrievals due to cloud presence.

Figure 2Frequencies of the time of day (local time) overpass of Terra and Aqua (blue and red respectively). Camagüey's sun photometer site is in a radius of 25 km for the period 2001 to 2015. In green are the time frequencies for the Camagüey's sun photometer observations in the period 2008 to 2014. In addition, the time frequencies for the direct radiation observations are used to calculate the BAOD. The bar width is 10 min for Terra, Aqua and the sun photometer and 1 h for the BAOD.
Collocated “Single observation” values and “daily mean” values
All Aqua and Terra overpass times in a radius of 25 km around Camagüey for the periods 2001 to 2015 (Terra) and 2002 to 2015 (Aqua) are shown in Fig. 2. Overpass times, defined by the maximum and minimum values of all the 25 km spatially coincident MODIS observations, are 10:12–11:49 (LT) for Terra and 12:47–14:20 (LT) for Aqua. In addition, Fig. 2 shows the diurnal frequency of sun photometer observations from 2008 to 2014 and the diurnal frequency of the BAOD observations for Camagüey for the period 1981 to 2015. Note that the BAOD histogram shows only hourly frequency values, since that is the time interval between the manual pyrheliometric observations.
For each day, we compared the corresponding time of each single sun photometer measurement with the time of each single AODt and AODa observation located in a radius of 25 km around the sun photometer site (an area of almost 2000 km2) and in the time window of ±30 min between both types of observations. The former selection process includes, for each satellite, the AODt and AODa values derived both with the DB and DT processing algorithms separately, producing four independent bulk data sets, two for Aqua and two for Terra. We then identified four different cases of matching data per day in the bulk coincident data sets. The first consisted of days with only one AODSP value and one AODt (AODa) coincident value, and the second consisted of only one AODSP value coincident with multiple AODt (AODa) values each day. In the third case, only one AODt (AODa) value coincided with multiple AODSP values. Finally, the fourth case consisted of multiple AODSP values coincident with multiple AODt (AODa) values.
Coincident cases were then selected for comparison on a case by case basis. In the first instance, we selected all cases. In the second case, because of the MODIS instruments spatio-temporal sampling geometry, time differences between MODIS and sun photometer observations are of the order of 1 min. As a result, only the criterion of the minimum distance between the positions of the AODt (AODa) and the sun photometer was applied to determine the pair of coincident values, therefore not allowing any repeated AODSP and AODt (AODa) values to be selected. Since it consists of only one AODt (AODa) measurement and multiple AODSP observations, in the third case the distance is the same; hence the selection criteria was the minimum of the time differences between AODSP and AODt (AODa) observations. The fourth case, the most complicated, allowed both criteria to be applied. No differences in the amount of coincident data were found when testing whether the order in which the two criteria were applied had any impact.
Another approach, the most commonly used for comparison (Bennouna et al., 2011; Sayer et al., 2014), involves averaging all the AODSP values in the interval of ±30 min and comparing them to the MODIS instrument overpass time (note that AODt and AODa averages are really the daily values of MODIS) located in a radius of 25 km around the sun photometer. At least two single AODSP and two single AODt (AODa) observations were required to calculate the spatio-temporal average. We applied a similar approach to calculate collocated daily means of AESP, AEt and AEa. The procedures described above generated a series of collocated daily means of AODSP vs. AODt (AODa) and AESP vs. AEt (AEa). Hence, by combining the former generated series of AOD (AE) for Terra and Aqua, we produced the coincident (Terra + Aqua) data set. The term “collocated daily mean AOD” will be used hereinafter, although it should be stressed that this approach reduces the number of observations generated by virtually a third.
After explaining the coincidence criteria adopted here, it is well known that this type of comparison shows major differences depending on the spatial and/or temporal resolution taken for the MODIS sensor in relation to the ground-based instruments used (Santese et al., 2007; Levy et al., 2009; Bennouna et al., 2011, 2013). The justification for using a single-observation data set and a collocated daily means data set separately to analyse this comparison is based on (a) the characteristics of the surface area under study, with nearby areas of water and land; (b) the difference concerning how cloud cover affects data during the overpass time of the Terra and Aqua platforms; (c) the possibility of including the largest amount of data; and (d) the fact that only single observations can be compared in the case of BAOD pyrheliometer measurements.
2.5 Statistics
The statistics used in the present study are those commonly used (e.g. Sayer et al., 2014). These are the root mean square error (RMSE), mean absolute error (MAE), median bias (BIAS), the Pearson linear correlation coefficient (R), the number of coincident MODIS and sun photometer cases (cases) and the fraction (f) of the MODIS/AERONET AOD retrievals in agreement within the expected uncertainty. Expected uncertainty, defined as a 1 standard deviation confidence interval, entails the sum of the absolute and relative AOD errors. Usually referred to as expected error (EE), it was applied in accordance with Eq. (3) (Sayer et al., 2014).
The aim is to compare the performance of the DB and DT algorithms directly (Sayer et al., 2014). All of these statistical indicators were evaluated for the whole set of collocated AODt, AODa, AODta with AODSP, and BAOD; AEt, AEa, AEta with AESP; as well as time frequencies (Fig. 2) and histograms of these quantities. We also evaluated these statistics on a monthly scale for the AOD values.
This section is divided into four subsections. In the first subsection, we analyse in detail the main results from comparing the AOD satellite MODIS sensors and the sun photometer data given by the statistical indicators and linear correlations as a result of taking two different criteria, which were two different retrieval AOD aerosol algorithms for the Terra and Aqua platforms. Section 3.2 analyses the same type of results but from the perspective of monthly values, since they represent the climatology of AOD and the associated uncertainties. Section 3.3 shows AE behaviour and Sect. 3.4 analyses the comparison of satellite MODIS data in relation to broadband aerosol optical depth from solar radiation.
3.1 Comparison of AOD retrievals from sun photometer and MODIS satellite instruments
As explained, we selected MODIS AODt (AODa) and sun photometer AODSP data based on two different criteria for their comparison. Results are shown in Tables 4 and 5, corresponding to collocated daily means and single observations respectively. The values of all the statistics of these two tables are extraordinarily similar, with analogous behaviour for the different algorithm and platforms. In truth, no substantial differences are found. It must be noted that Table 4 for collocated daily means contains a third less data than Table 5 based on single observations. In contrast, however, the latter data have a higher associated error than daily mean data. This result cannot be foreseen a priori but clearly demonstrates that either criterion may be taken, since the result is basically the same.
Table 4Statistics from comparing collocated daily means of AODt and AODa with AODSP and the combined AODta.
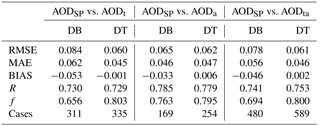
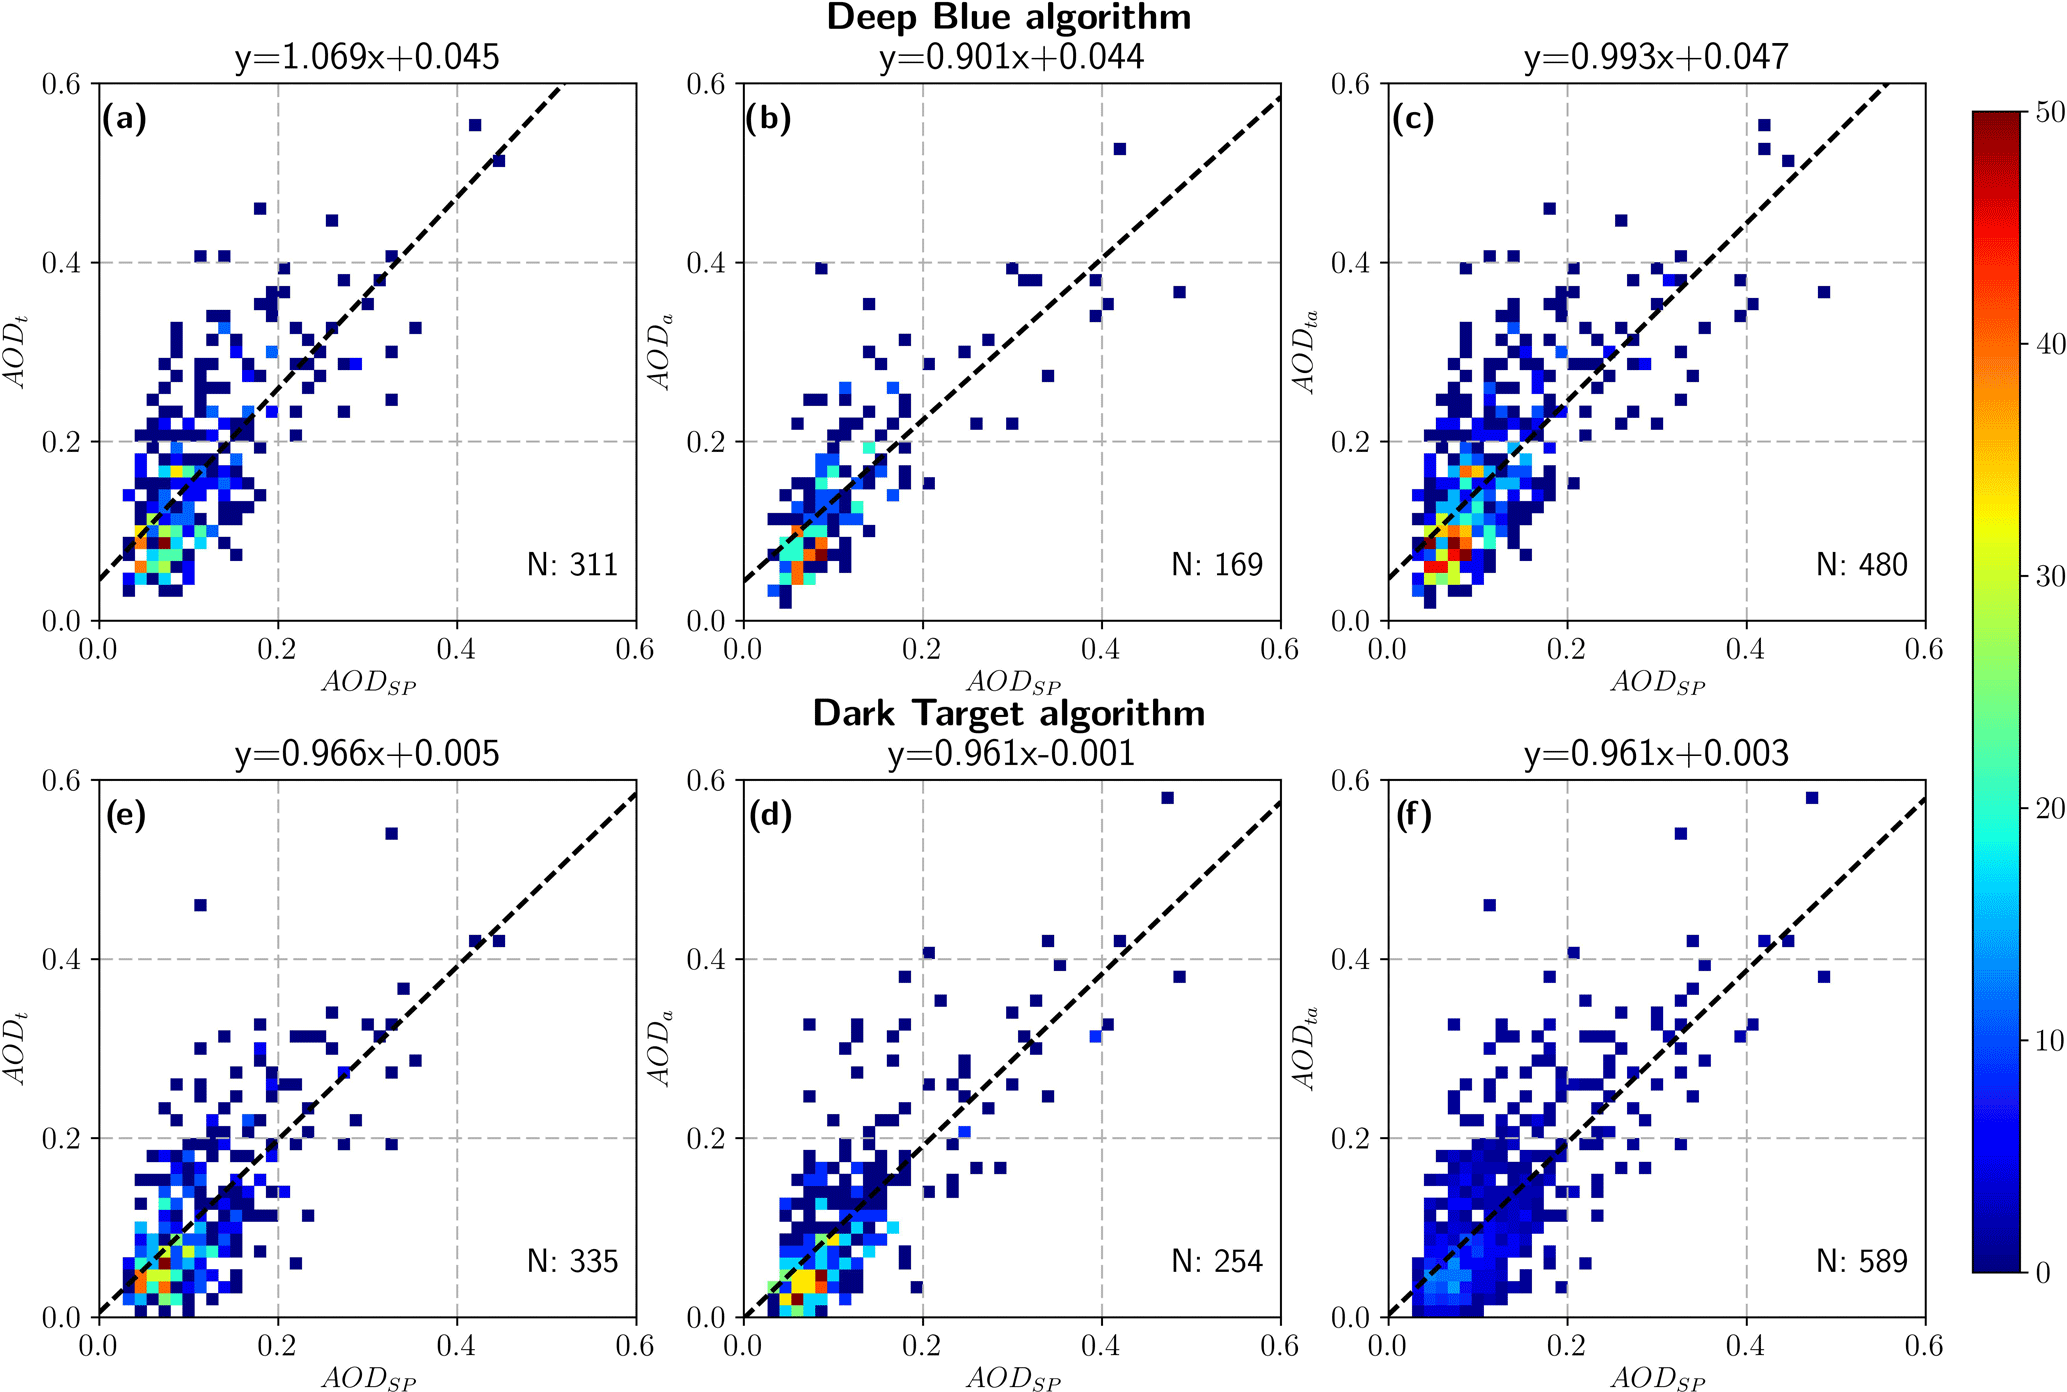
Figure 3Collocated daily mean density scatter plots of the coincident AOD observations from the sun photometer and Terra and Aqua MODIS instruments for DB and DT algorithms: (a) to (c) show AODSP vs. AODt, AODa and AODta respectively for the DB algorithm; (d) to (f) show the same for the DT algorithm. The data density is represented by the colour scale, showing the number of data points located in a particular area of the plot. Linear regression is given by the black discontinuous line and the corresponding equation. The number of data points appears in the right bottom.
Taking Table 5 together with Fig. 3 of collocated daily mean values, we then analyse the different behaviours of the two algorithms for the Terra and Aqua platforms. AODt (AODa) from the satellite are compared with the sun photometer, AODSP. Figure 3 shows the density plots of the collocated daily mean AOD values from the sun photometer vs. those of MODIS instruments for Terra, Aqua and Terra+Aqua for DB (top plots) and DT (bottom plots) algorithms. The least squares linear fit lines and equations are also shown in the figure, while the correlation coefficients (R values) are in Table 5. In general, the plots show that low-loading aerosols predominate and that scatter increases for higher aerosol loadings, with a slight overestimation of AODt (AODa) satellite data compared to AODSP. In all cases, the slopes are between 1 and 0.9 and the intercepts are of the order of 10−2 (with lower values for the DT algorithm), showing very good values of these parameters for Terra and Aqua for both the DT and DB algorithms.
Table 5Statistics from comparing collocated single observation of AODt and AODa with AODSP and combined AODta.
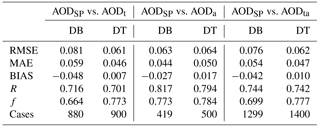

Figure 4Monthly means and statistics (RMSE, MAE… ) resulting from the comparison between AODSP and AODta for both DB and DT algorithms: (a) monthly means of the AODSP and AODta for both DB and DT algorithms, (b) RMSE for the comparison between AODSP and AODta for both DB and DT algorithms, (c) the same for MAE, (d) BIAS, (e) R and (f) f. The blue discontinuous line at f= 68 % represents 1 standard deviation confidence interval for the EE indicator.
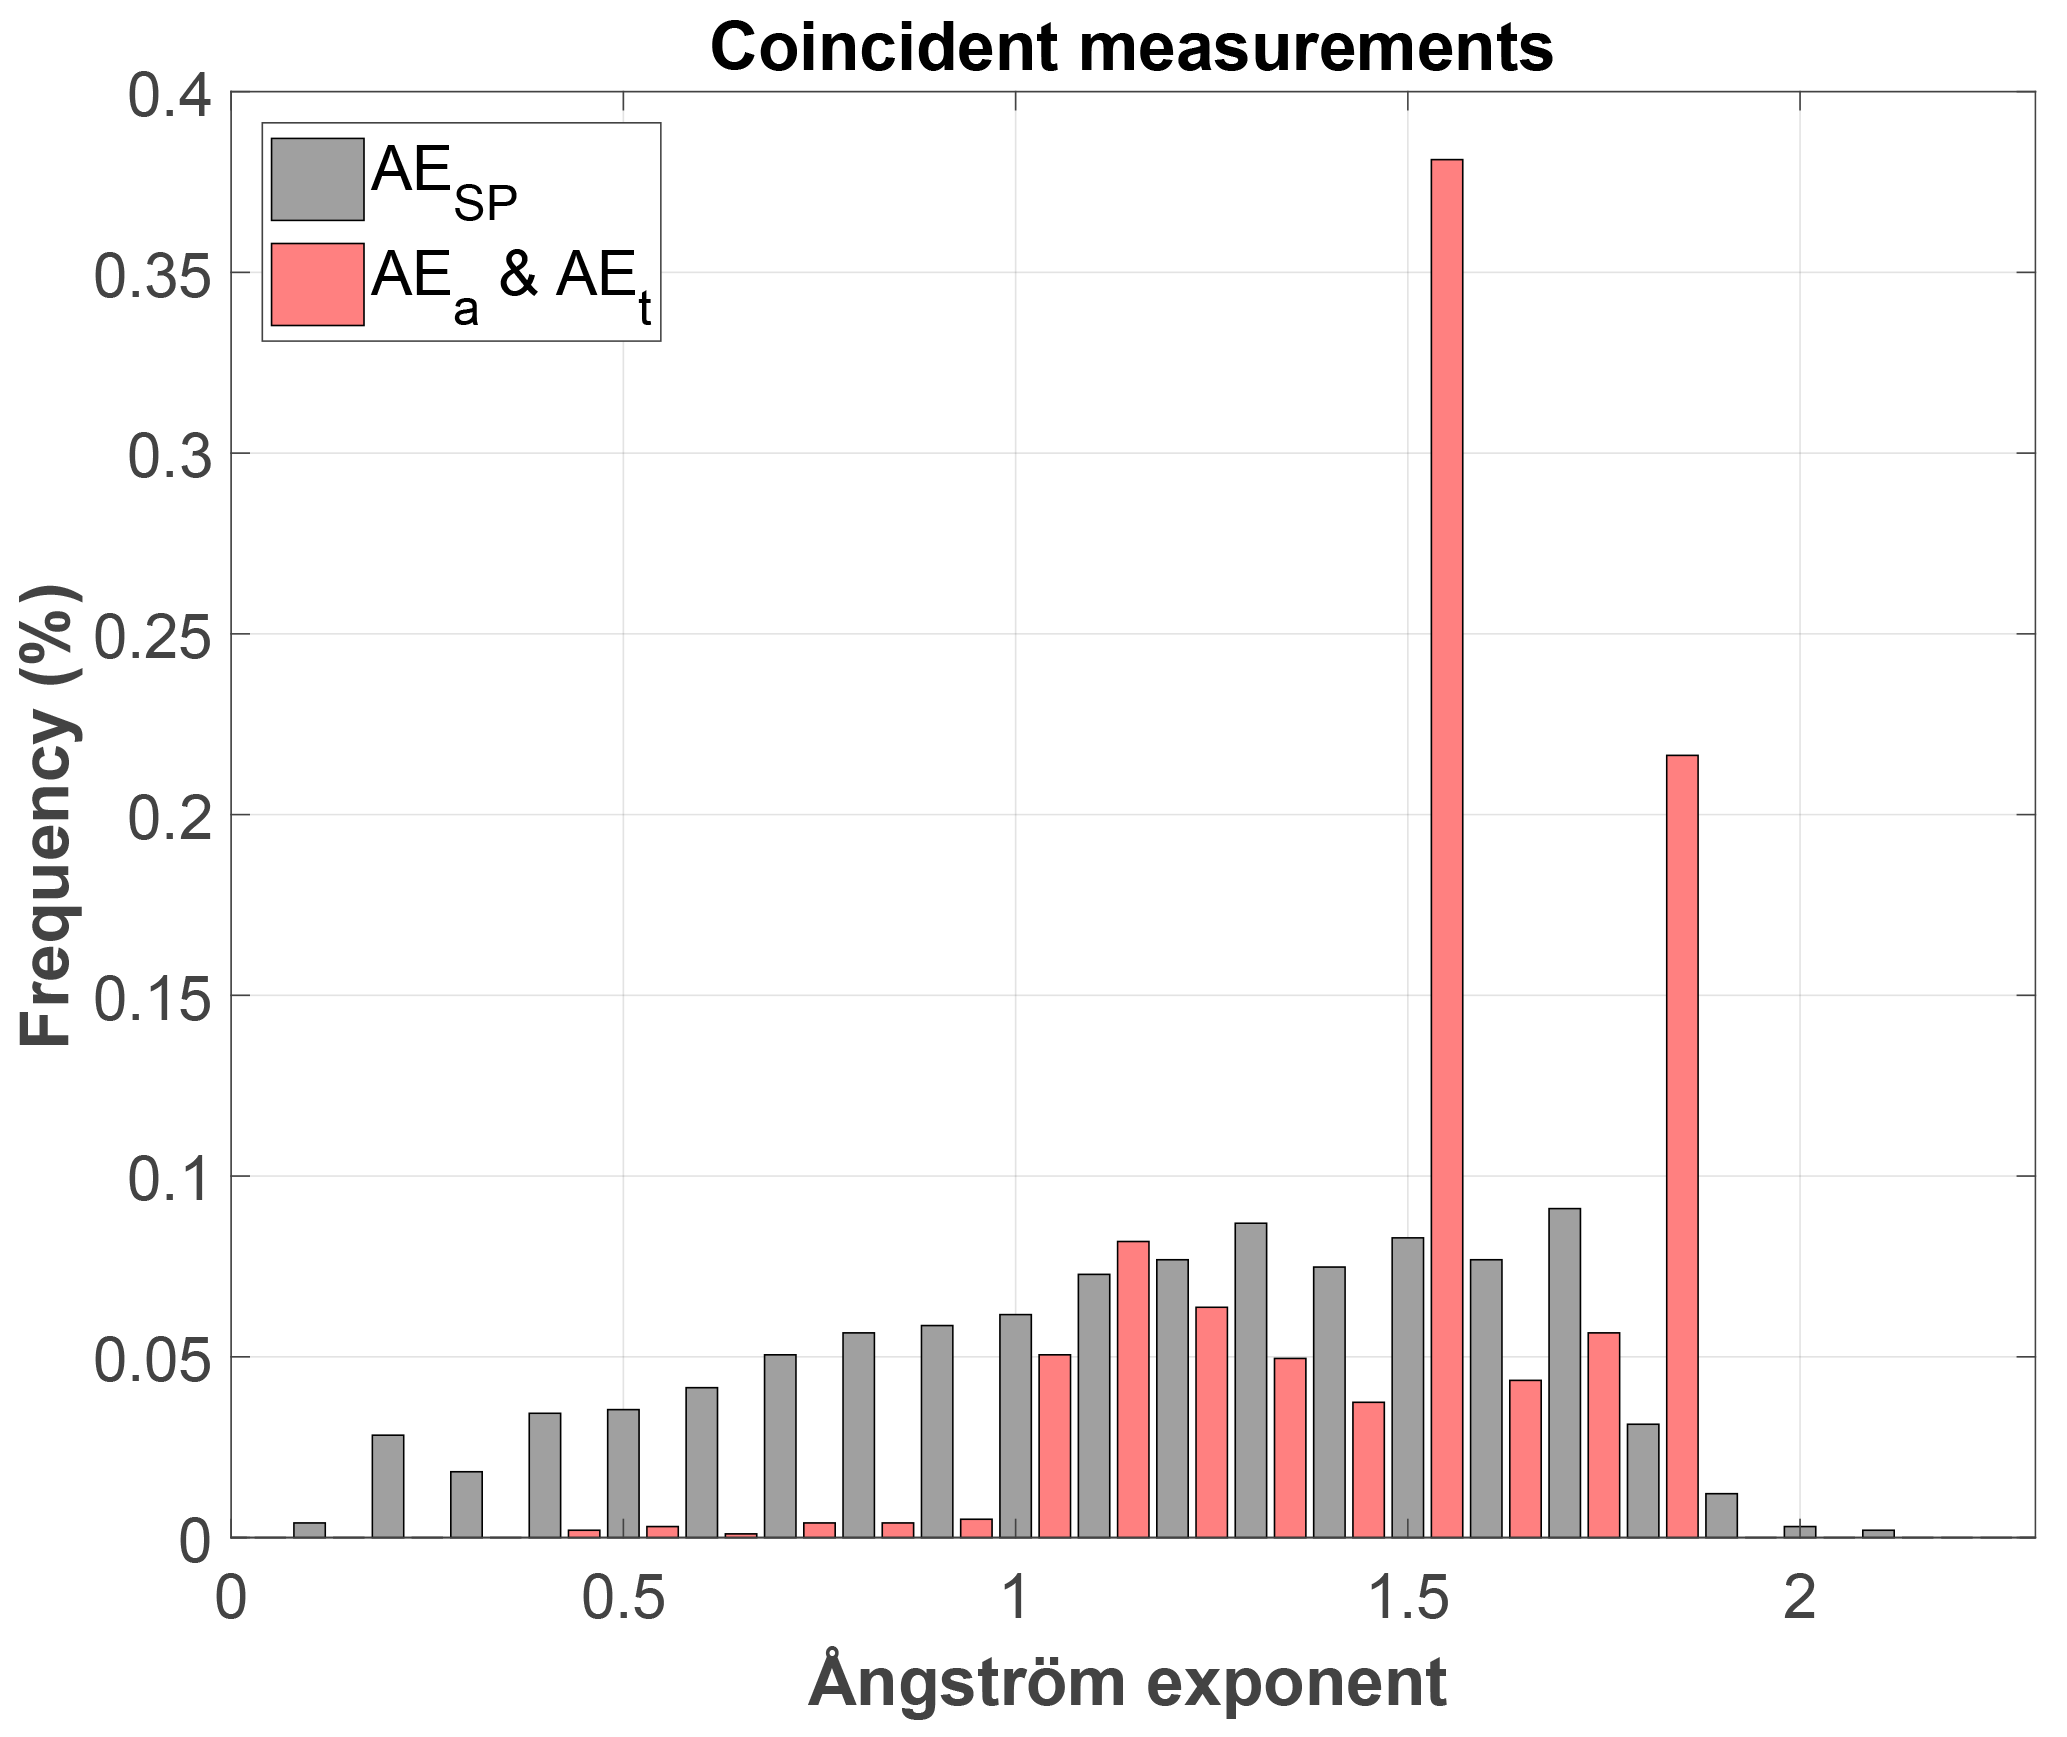
Figure 5Frequency distribution of the Ångström exponent (AE) values from both MODIS instruments Terra and Aqua and the sun photometer are coincident in ±30 min and 25 km radius around Camagüey.
Figure 3 shows that the DT algorithm generally displays better behaviour than the DB algorithm. The DT algorithm evidences more unified behaviour, as can be seen for the slope values (0.96 for both Aqua and Terra), while DB changes, giving a value above 1 (1.069) for Terra and below 1 for Aqua (0.901). However, these differences are not very relevant since both algorithms give almost identical R values, and the difference appears for the platforms with higher values for Aqua than for Terra (∼ 0.78 and ∼ 0.73 respectively). A compensation effect can be observed when data are combined, since in this case the slope of the DB algorithm is closer to 1 than the DT algorithm, although the intercept is higher (closer to 0 for the DT algorithm). For combined data, the two algorithms show more similar behaviour than for separate Aqua or Terra results. Table 5 shows that the magnitudes of the RMSE, MAE, BIAS and f statistics are lower for the DT than for the DB algorithm (see the higher values of DB for Terra, column 1, and the more similar values in the other columns). As mentioned, the values of these four parameters show that the DT algorithm presents more unified behaviour for both platforms than the DB, which has similar values for Aqua but changes significantly for Terra.
Although the statistical numbers in the comparison depend on the area under study, comparisons between areas are always possible. A recent validation of MODIS Collection 6 AODa (Aqua), derived using the DB algorithm with AODSP from six AERONET stations in Central and South America (CSA) and seven in eastern North America (ENA), was reported by Sayer et al. (2013). The number of pairs of collocated MODIS and AERONET daily averaged observations for CSA (ENA) was 3032 (4155). Sun photometer data were averaged within the 30 min MODIS overpass time and MODIS data were averaged in the 25 km radius around the sun photometer site, which makes the comparison appropriate. We selected the BIAS and R statistics in Table 1, which were defined as in the present study (Sayer et al., 2013).
Table 6Statistics from comparing AEt, AEa and AEta with AESP for single observations and daily mean values.
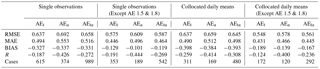
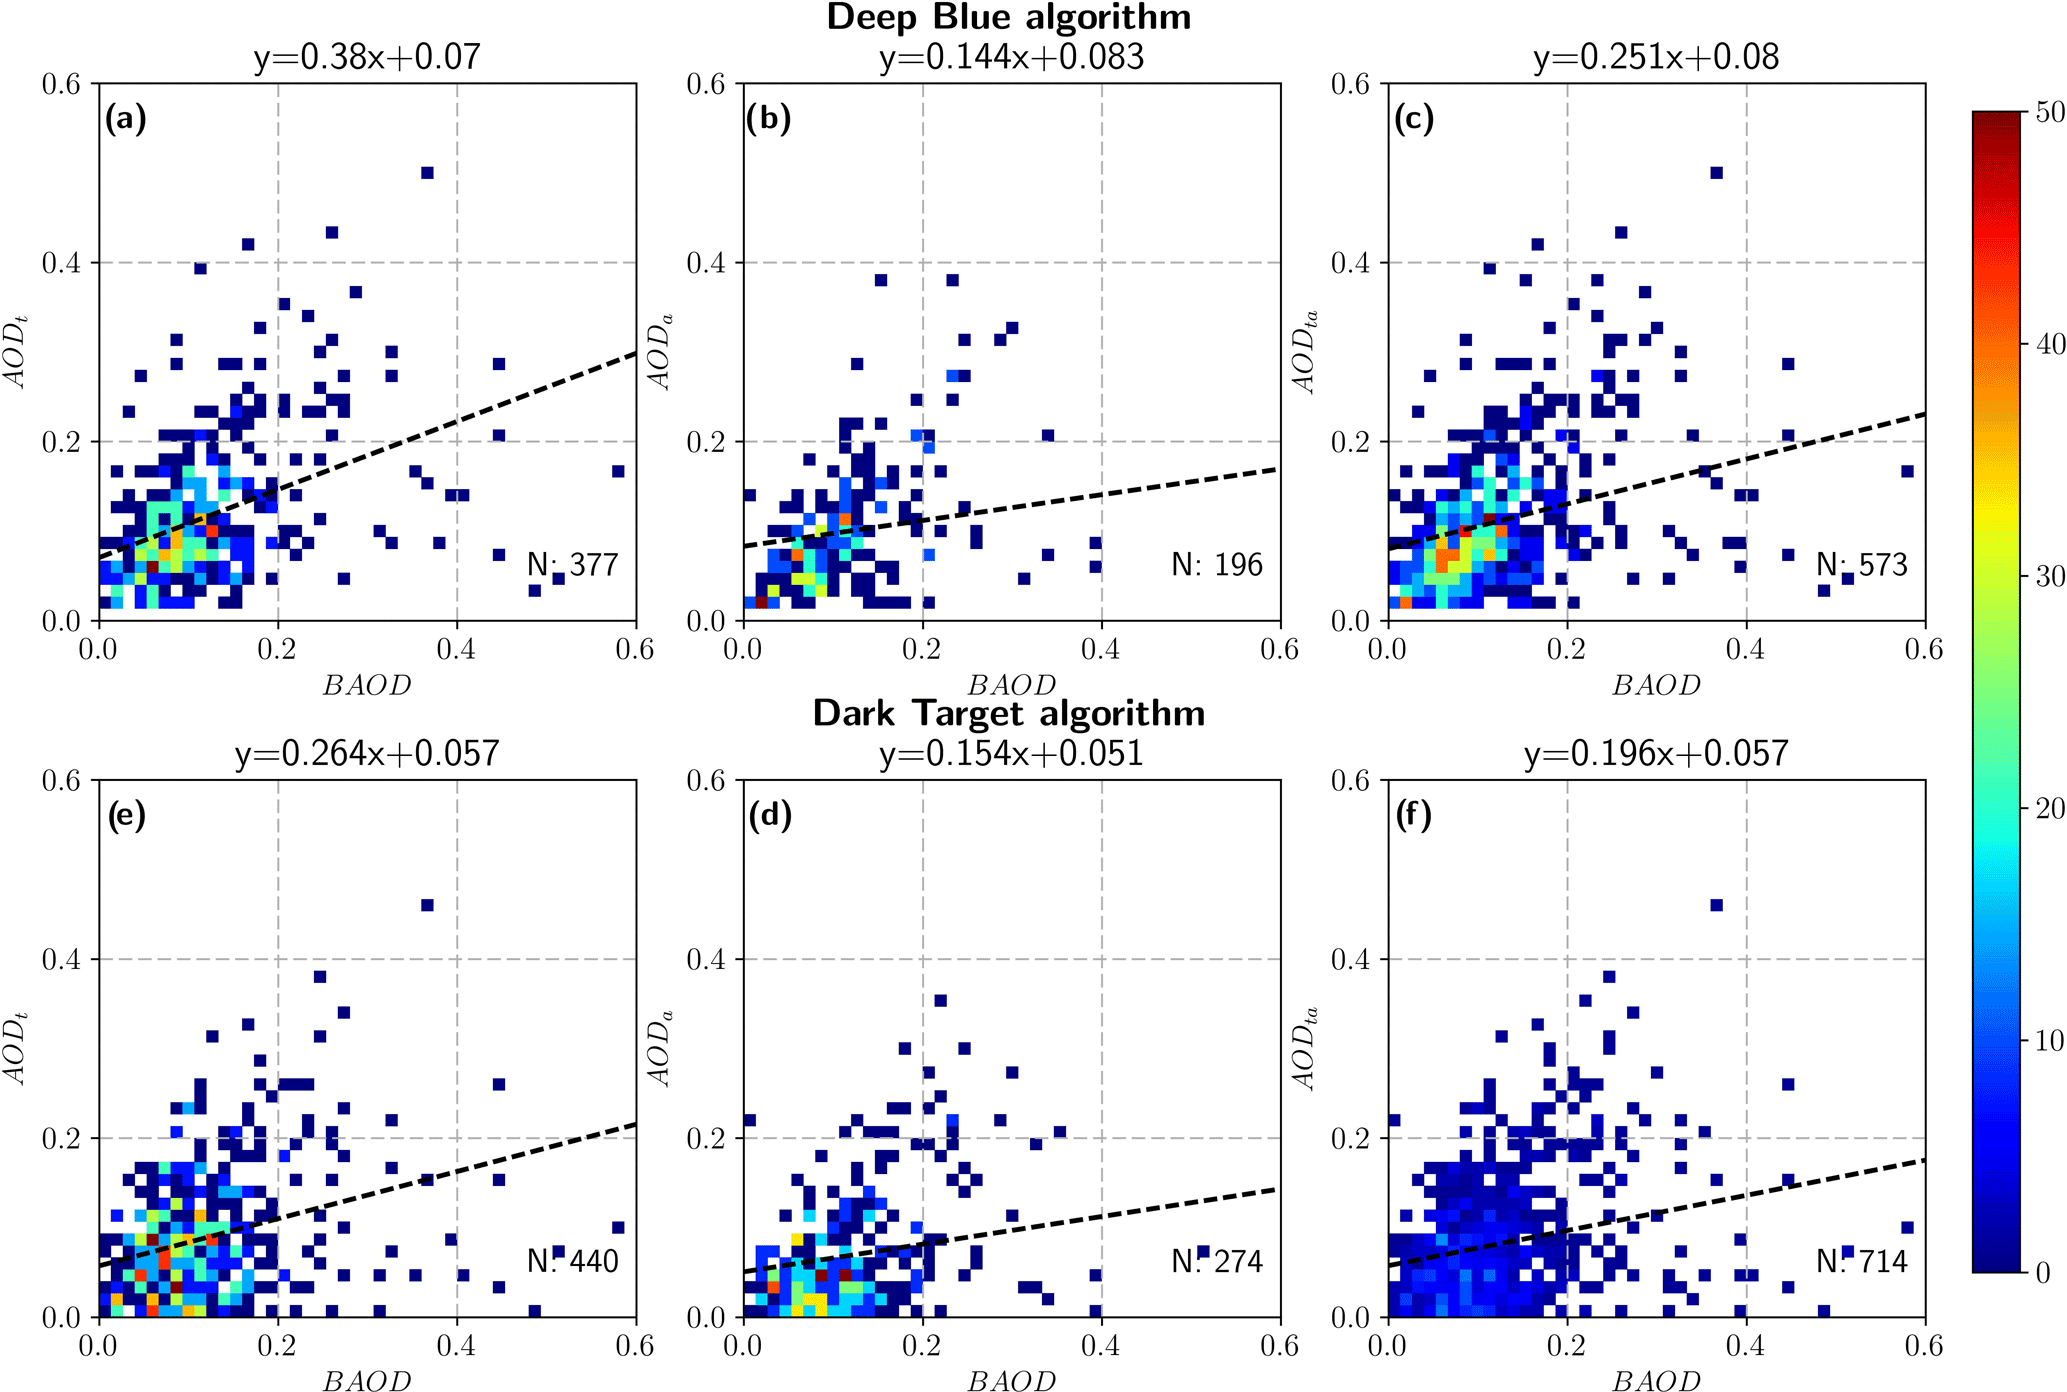
Figure 6Single observations density scatter plots of the coincident BAOD observations from the broadband pyrheliometer and Terra and Aqua MODIS instruments for DB and DT algorithms: panels (a) to (c) show BAOD vs. AODt and AODa and AODta for the DB algorithm; (d) to (f) show the same for the DT algorithm. The data density is represented by the colour scale, showing the number of data points located in a particular area of the plot. Linear regression line is shown by the black discontinuous line and the corresponding equation. The number of data points appear in the right bottom.
We compare those statistics with the ones given in Tables 4 and 5, calculated for Camagüey. The BIAS for the CSA (ENA) stations is −0.016 (0.0094), although those of Camagüey for both single observations and collocated daily means are −0.027 and −0.033, thus showing higher values for Camagüey, similar signs for CSA and the opposite signs for ENA. R values for Camagüey for single observations and collocated daily means are 0.82 and 0.79 respectively, which are lower by around 10 % (5 %) than the R values of 0.96 (0.86) for the CSA (ENA). However, it should be noted that the number of cases used for the statistics at Camagüey was 419 for single observations and 169 for collocated daily means, representing 6 % and 14 % of the 3032 cases used in the cited study. In addition, none of the stations in the CSA (ENA) regions were located in the Caribbean, but were further south and north (Sayer et al., 2014). Despite the significant difference in the number of cases used in both studies and the location of the six stations, the results show reasonable agreement.
3.2 Monthly means values and statistics
Given the close similarity in the results from single observations and collocated daily means data, it seems reasonable to evaluate monthly mean values based on only one of them, i.e. for the collocated daily means data. Figure 4 shows the monthly means (based on the mean of each month for every year of the measured period) and the statistics resulting from the comparison between AODSP and AODta for both the DB and DT algorithms. Tables S1 and S2 (see Supplement) also illustrate this comparison, although they add separate information for Terra and Aqua (see Supplement). In Fig. 4a, the multi-annual monthly means from the combined AODta and AODSP for both the MODIS DB and DT algorithm are shown, providing an initial overview of aerosol AOD climatology in Camagüey. It can also be seen that the DT algorithm gives the best match with monthly mean AODSP.
Table 7Number of coincident cases of AODt, AODa, AODta with BAOD both for the DB and DT algorithms.
The monthly RMSE and MAE plots in Fig. 4b and c generally show increases, with an increase in the AODta for the DT algorithm and also for the DB algorithm. The exception is the minimum in April for the DT algorithm (this means greater differences between satellite and sun photometer in summer than in winter). These results are consistent with the fact that the AOD uncertainty depends on the AOD itself (see Eq. 3) and greater AOD variability in summer. The AODta peaks for the DT algorithm in March in both RMSE and MAE are also present in the results for AODt and AODa separately, and the number of cases available for the statistics is among the highest of all the months seen in Tables S1 and S2. In Table S2, for the DT algorithm, we can see that the number of cases of AODta from March to April drops by 55 %. However, something similar happens for the DB algorithm in Table S1, with the number of AODta cases falling from March to April by 61 %. Sampling cannot therefore be seen as the cause of the RMSE and MAE peaks for the DT algorithm. We plan to revisit this feature in future studies. In summer, the RMSE and MAE show their maximum values associated with the maximum values of the AOD resulting from Saharan dust reaching Cuba from across the Atlantic. The BIAS is negative in summer for both Terra and Aqua AOD, showing that AODt and AODa observations have higher magnitudes than AODSP.
Tabulated results of the comparison between AODt, AODa and AODta with AODSP on a monthly scale also show better results for the DB (see Table S1) than for the DT (Table S2) algorithm. Here, we only discuss the results of the joint AODta data set using both the DT and DB algorithms. In Fig. 4d, the BIAS for the DT algorithm is positive from December to May, a period of the year with predominantly lower AODta and AODSP values. During this period, AODta underestimates AODSP. BIAS then becomes negative from June to November, which is when Saharan dust reaches the Caribbean basins. At the same time, the BIAS of the AODta derived with the DB algorithm is negative for the whole year, with higher absolute values than those from the DT algorithm.
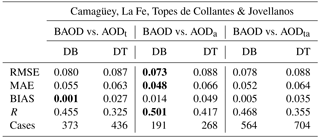
Table 8Statistics from comparing the single observations of BAOD at the four actinometric stations coincident in space and time with the single observation (L2) of AODt, AODa and AODta. In bold are the values of best agreement.
The correlation coefficient, R, in Fig. 4e is the statistic which shows almost the same agreement for the DB and DT algorithms. However, the DT shows a higher number of R values bearing higher magnitudes. R magnitudes remain over 0.5 almost the whole year round, except in December and January when lower AOD values occur.
Figure 4f shows the fraction of the AODta (f) in agreement with AODSP within the expected uncertainty, showing higher values over 80 % from November to January, in general for both algorithms. This is the period of the year with the lowest monthly mean values of both AODta and AODSP. During the rest of the year, including the period of the Saharan dust arrivals, it shows its lowest values between 60 and 75 % for the DT algorithm, while values for DB below 50 % occur in four of the months between June and October. The discontinuous blue line at f= 68 % denotes a 1 standard deviation confidence interval, which is selected to describe EE. The f values above that value mean the algorithm works better than expected. All the statistics demonstrate that the DT algorithm performs better than the DB for the region of study. However, the lowest R values for those months with the highest f values would seem to be contradictory. At present, we have no explanation for this.
3.3 Comparison of Ångström exponent by sun photometer and MODIS satellite instruments
Figure 5 shows the frequency distribution of the coincident AESP with both AEt and AEa using the DB algorithm, as explained. As can be seen in the literature, the Ångström exponent varies between 0 and 2. Our Ångström exponent data obtained from the AERONET sun photometer measurements are within this range, with a wide and smooth frequency distribution of values and with a not well-defined maximum in the range 1.2–1.6. Neither AEt nor AEa present any real distribution shape because there are practically no values below 1. Most are around AE = 1.5, followed by a second maximum at AE= 1.8. The first, 1.5, is a regional default value for AEt and AEa (Hsu et al., 2013; Sayer et al., 2013) assumed by the DB algorithm in the case of low AOD values (AODt or AODa < 0.2). The second is associated with the fact that the AEt and AEa values allowed by the aerosol optical models in Collection 6 are constrained between 0 and 1.8 to avoid unrealistic values (Sayer et al., 2013).
Table 6 shows the results of the comparison of coincident AEt, AEa and AEta with ESP. For both single observations and collocated daily mean data the statistics were calculated for the two options: the first including all values and the second excluding cases with AE = 1.5 and 1.8. The statistics in Table 6 present similar values for those derived by single observation and for collocated daily mean values. This was expected once we knew the results for AOD, although similar values also appear for Terra and Aqua (no clear distinction appears between Terra and Aqua). These statistics present very high values if compared with those shown for AOD. The R correlation coefficient presents very low values, which are below 0.5 (the poor correlation is observed in the scatter plots similarly to those in Fig. 6, not shown here). Excluding AEt and AEa values equal to 1.5 or 1.8 entails no substantial difference, only lower BIAS values. Overall, the results of the comparison showed the low quantitative skill of the AEt and AEa for this site. One factor contributing to this result is that the AE from the MODIS DB algorithm displays great uncertainty for low-AOD conditions, since AE is obtained as a gradient between two small AOD numbers (Wagner and Silva, 2008).
3.4 Comparison of AOD between MODIS products and BAOD for the four Cuban actinometric stations
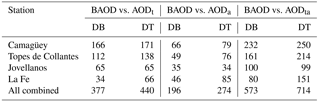
Two main facts limit the number of available BAOD values coincident in time with AODt and AODa: the hourly time step between manual DNI observations and the required condition of a clear line of sight between the pyrheliometer and a region of 5∘ around the sun. Consequently, only one BAOD measurement could coincide each day with AODt and another with AODa given the time coincidence criteria. Table 7 lists the number of coincident AODt, AODa, AODta observations in space and time with BAOD for the DB and DT algorithms for each of the actinometric stations. Since the number of coincident observations at each station is low, we decided to combine all the pairs of AODt, AODa and AODta coincident with BAOD in the four sites in order to conduct the comparison. In addition, we did not consider the very few cases with values of BAOD > 0.6, around 1 % of all cases, so as to avoid the possibility of inadvertent cloud contamination.
Table 8 contains almost the same statistics used in previous comparison satellite-sun photometer data (see Tables 4 and 5), both for the DB and DT algorithms for the four actinometric stations together. The only statistic not included in Table 8 is f, the fraction of the MODIS/AERONET AOD retrievals in agreement within the expected uncertainty, because this uncertainty still has to be established for BAOD. We highlighted the best-performing algorithm in bold for each of the statistics. The AODa derived with the DB algorithm performs better than the other three combinations of AODt, AODa, for DT and DB in accordance with all four statistics, except for BIAS, where the best-performing algorithm is still the DB algorithm, but for AODt. However, in general, and taking into account the low amount of data and the fact that we have single observations, the RMSE, MAE and BIAS for AODt, AODa, AODta derived with both DB and DT algorithms remain in the same order of magnitude as in Tables 4 and 5, with the exception of the low values of the correlation coefficient R. The BIAS shows almost similar behaviour except for its best-performing value. This contrasting behaviour of algorithms and platforms with respect to the earlier results of Tables 4–5 is clearly shown in Fig. 6, where the scatter plots of the BAOD vs. AODt, AODa, and AODta are depicted. What is clear is the poor correlation given by the very low values of the slope with respect to value 1 and also the relatively high values of the intercept in relation to 0. Hence it results in low values of the R coefficient. BAOD shows a high uncertainty for low values of AOD (below 2; see this range over the x axis in the plots), which are those prevalent in this area (l).
This study addresses the comparisons of different sources of AOD and AE from a ground-based sun photometer (AERONET level 2.0 data), MODIS instruments (Terra, Aqua, and Terra + Aqua) and retrievals from direct normal solar irradiance observations in Cuba.
The comparison of spatial and temporal coincident single observations and collocated daily means of AODt, AODa, AODta vs. AODSP shows, in general, a better performance for the dark target (DT) than for the deep blue (DB) algorithm for Camagüey. In particular we found (1) small differences between AODt and AODa, thus justifying the combination of these observations in a single data set for climatological studies; (2) both DT and DB algorithms are better than expected (f around 80 %) between November and January, but in other months f is of the order of 1 standard deviation (f= 68 %) for DT and significantly lower for DB; (3) from linear correlation analysis, MODIS slightly overestimates AOD compared to the sun photometers; and (4) data from both MODIS instruments are well correlated with AERONET AOD with regression slopes close to 1 and the DT algorithm outperforming the DB algorithm. In addition, the comparison of multi-annual monthly means of AODta with AODSP indicate better agreement with results from the DT algorithm (compared to DB), consistent with the findings above.
The Ångström exponents AEt, AEa and AEta do not show good agreement with the spatial and temporal coincident AESP values when the default −1.5 and the constrained −1.8 values are or are not considered. Those results corroborate the limited skills of the MODIS-derived AE, as indicated in previous studies.
In the comparison of BAOD vs. AODt, AODa, AODta, where only individual observations can be compared, the statistics indicate larger uncertainties but of the same order of magnitude as the statistics of MODIS photometer. Although correlations are very poor, these results support the potential for BAOD to be a reliable source of aerosol information for climatological studies in areas that lack a sun photometer or any other surface aerosol measurement.
MODIS Aerosol Product MxD04 Version 6.0 DOI information and links for downloading can be accessed from the MODIS Data Product at the NASA Goddard Space Flight Center (GSFC) from https://modis.gsfc.nasa.gov/data/dataprod/mod04.php (NASA, 2018a). Sun photometer aerosol observations for Camagüey, Cuba, from the AErosol RObotic NEtwork (AERONET) from Goddard Space Flight Center (GSFC) are available from http://aeronet.gsfc.nasa.gov (NASA, 2018b).
The supplement related to this article is available online at: https://doi.org/10.5194/amt-11-2279-2018-supplement.
The authors declare that they have no conflict of interest.
This work has been supported by the Cuban National Program “Meteorology and
sustainable development for Cuba” research grant P211LH007-20 and by the
joint agreement between the University of Valladolid, Spain, and the Cuban
Meteorological Institute for aerosol research. Juan Carlos Antuña-Marrero wishes to thank
Loraine Remer and Andrew Sayer for their contributions to understanding
MODIS algorithms. This research has received funding from the European
Union's Horizon 2020 Research and Innovation Program under grant agreement
no. 654109 (ACTRIS-2). We acknowledge the funding provided by MINECO
(CTM2015-66742-R) and by the Junta de Castilla y León (VA100U14).
Edited by: Marloes Gutenstein-Penning de Vries
Reviewed by: two anonymous referees
Antuña, J. C., Fonte, A., Estevan, R., Barja, B., Acea, R., and Antuña Jr., J. C.: Solar radiation data rescue at Camagüey, Cuba, B. Am. Meteorol. Soc., 89, 1507–1511, https://doi.org/10.1175/2008BAMS2368.1, 2008.
Antuña J. C., Hernández, C., Estevan, R., Barja, B., Fonte, A., Hernández, T., and Antuña Jr., J. C.: Camagüey's solar radiation rescued dataset: preliminary applications, Óptica Pura y Aplicada, 44, 43–48, 2011.
Antuña, J. C., Estevan, R., and Barja, B.: Demonstrating the Potential for First-Class Research in Underdeveloped Countries: Research on Stratospheric Aerosols and Cirrus Clouds Optical Properties, and Radiative Effects in Cuba (1988–2010), B. Am. Meteorol. Soc., 93, 1017–1027, https://doi.org/10.1175/BAMS-D-11-00149.1, 2012.
Antuña-Marrero, J. C., De Frutos Baraja, A., and Estevan Arredondo, R.: Joint aerosol research between Cuba and Spain proves fruitful, EOS, 98, 10 pp., 2017.
Barja, B., Rosas, J., and Estevan, R.: Caracterización del contenido integral del vapor de agua atmosférico sobre Cuba obtenido mediante mediciones y modelación, Scientific Report, Grant 200.04070, 77 pp., unpublished, 2015 (in Spanish).
Bennouna, Y. S., Cachorro, V. E., B., Toledano, C., Berjon, Prats, N., D Fuertes, González, R.; Rodrigo, R., Torres, B., and De Frutos, A. M.: Comparison of atmospheric aerosol climatologies over southwestern Spain derived from AERONET and MODIS, Remote Sens. Environ., 115, 1272–1284, https://doi.org/10.1016/j.rse.2011.01.011, 2011.
Bennouna, Y. S., Cachorro, V. E., Torres, B., Toledano, C., Berjon, A., de Frutos, A. M., and Alonso Fernandez-Coppel, I.: Atmospheric turbidity determined by the annual cycle of the aerosol optical depth over north-center Spain from ground (AERONET) and satellite (MODIS), Atmos. Environ., 67, 352–364, https://doi.org/10.1016/j.atmosenv.2012.10.065, 2013.
Denjean, C., Formenti, P., Desboeufs, K., Chevaillier, S., Triquet, S., Maillé, M., Cazaunau, M., Laurent, B., Mayol-Bracero, O. L., Vallejo, P., Quiñones, M., Gutierrez-Molina, I. E., Cassola, F., Prati, P., Andrews, E., and Ogren, J.: Size distribution and optical properties of Africanm mineral dust after intercontinental transport, J. Geophys. Res., 121, 7117–7138, https://doi.org/10.1002/2016JD024783, 2016.
Eck, T., Holben, B., Reid, J., and Dubovik, O.: Wavelength dependence of the optical depth of biomass burning, urban, and desert dust aerosols, J. Geophys. Res., 104, 31333–31349, 1999.
Estevan, R.: Certificación de depósito legal facultativo de obras protegidas, software: “Actino 2.0”, CENDA, 218–2010, 2010 (in Spanish).
Estevan R., Antuña, J. C., Barja, B., Hernández, C. E., Hernández, T., García, F., Rosas, J., and Platero, I. Y.: Climatología de la Radiación solar en Camagüey 1981–2010, Scientific Report, Grant 01301216, 41 pp., unpublished, 2012 (in Spanish).
Fonte, A. and Antuña, J. C.: Caracterización del espesor óptico de banda ancha de los aerosoles troposféricos en Camagüey, Cuba, Revista Cubana de Meteorología, 17, 15–26, 2011.
García, F., Estevan, R., Antuña-Marrero, J. C., Rosas, J., Platero, I. Y., Antuña-Sánchez, J., and Díaz, N.: Determinación de la Línea Base del Espesor Óptico de Aerosoles de Banda Ancha y comparación con datos de fotómetro solar, Óptica Pura y Aplicada, 48, 249–258, https://doi.org/10.7149/OPA.48.4.249, 2015.
GGO: Manual for the setup and operation of solar radiation instruments, Ed. Guidrometeoizdat, 124 pp., 1957 (in Russian).
Gkikas, A., Hatzianastassiou, N., Mihalopoulos, N., Katsoulis, V., Kazadzis, S., Pey, J., Querol, X., and Torres, O.: The regime of intense desert dust episodes in the Mediterranean based on contemporary satellite observations and ground measurements, Atmos. Chem. Phys., 13, 12135–12154, https://doi.org/10.5194/acp-13-12135-2013, 2013.
Gkikas, A., Basart, S., Hatzianastassiou, N., Marinou, E., Amiridis, V., Kazadzis, S., Pey, J., Querol, X., Jorba, O., Gassó, S., and Baldasano, J. M.: Mediterranean intense desert dust outbreaks and their vertical structure based on remote sensing data, Atmos. Chem. Phys., 16, 8609–8642, https://doi.org/10.5194/acp-16-8609-2016, 2016.
GOAC: Manual de Observaciones Actinométricas, 37 pp., unpublished, 2010 (in Spanish).
Gueymard, C. A.: Turbidity determination from broadband irradiance observations: A detailed multicoefficient approach, J. Appl. Meteorol., 37, 414–435, 1998.
Gueymard, C. A.: Aerosol turbidity derivation from broadband irradiance observations: Methodological advances and uncertainty analysis, Solar 2013 Conf., Baltimore, MD, American Solar Energy Soc., 8 pp., 2013.
Holben B. N., Eck, T. F., Slutsker, I., Tanre, D., Buis, J. P., Setzer, A., Vermote, E., Reagan, J. A., Kaufman, Y., Nakajima, T., Lavenu, F., Jankowiak, I., and Smirnov, A.: AERONET – A federated instrument network and data archive for aerosol characterization, Remote Sens. Environ., 66, 1–16, 1988.
Hsu, N. C., Tsay, S. C., King, M. D., and Herman, J. R.: Aerosol Properties Over Bright-Reflecting Source Regions, IEEE T. Geosci. Remote, 42, 557–569, https://doi.org/10.1109/TGRS.2004.824067, 2004.
Hsu, N. C., Tsay, S. C., King, M. D., and Herman, J. R.: Deep blue retrievals of Asian aerosol properties during ACE-Asia, IEEE T. Geosci. Remote, 44, 3180–3195, https://doi.org/10.1109/TGRS.2006.879540, 2006.
Hsu, N. C., Jeong, M.-J., Bettenhausen, C., Sayer, A. M., Hansell, R., Seftor, C. S., Huang, J., and Tsay, S.-C.: Enhanced Deep Blue aerosol retrieval algorithm: the second generation, J. Geophys. Res., 118, 9296–9315, https://doi.org/10.1002/jgrd.50712, 2013.
IPCC: Climate Change 2013, The Physical Science Basis – Contribution of Working Group I to the Fifth Assessment Report of the Intergovernmental Panel on Climate Change, edited by: Stocker, T. F., Qin, D., Plattner, G.-K., Tignor, M., Allen, S. K., Boschung, J., Nauels, A., Xia, Y., Bex, V., and Midgley, P. M., Cambridge University Press: Cambridge, UK and New York, NY, 2013.
Kahn, R. A., Garay, M. J., Nelson, D. L., Levy, R. C., Bull, M. A., Diner, D. J., Martonchik, J. V., Hansen, E. G., Remer, L. A., and Tanré, D.: Response to “Toward unified satellite climatology of aerosol properties: 3. MODIS versus MISR versus AERONET”, J. Quant. Spectrosc. Ra., 112, 901–909, https://doi.org/10.1016/j.jqsrt.2010.11.001, 2011.
Kaufman, Y. J., Wald, A. E., Remer, L. A., Gao, B.-C., Li, R.-R., and Flynn, L.: The MODIS 2.1-μm channel-correlation with visible reflectance for use in remote sensing of aerosol, IEEE T. Geosci. Remote, 35, 1286–1298, https://doi.org/10.1109/36.628795, 1997a.
Kaufman, Y. J., Tanré, D., Remer, L. A., Vermote, E. F., Chu, A., and Holben, B. N.: Operational remote sensing of tropospheric aerosol over land from EOS moderate resolution imaging spectroradiometer, J. Geophys. Res., 102, 17051–17068, https://doi.org/10.1029/96JD03988, 1997b.
Kaufman, Y. J., Koren, I., Remer, L., Tanré, D., Ginoux, P., and Fan, S.: Dust transport and deposition observed from the Terra-Moderate Resolution Imaging Spectroradiometer (MODIS) spacecraft over the Atlantic Ocean, J. Geophys. Res. Atmos., 110, D10S12, https://doi.org/10.1029/2003JD004436, 2005.
Kirilov, T. B., Vlasov, Y. B., and Flaum, M. Y.: Manual para la operación e instalación de instrumentos de radiación solar, Ed.Guidrometeoizdat, Leningrad, 124 pp., 1957 (in Russsian).
Knippertz, P. and Stuut, J.-B. W. (Eds.): Chapter 1 Introduction, in: Mineral Dust: A Key Player in the Earth System, Springer, New York, 1–14, https://doi.org/10.1007/978-94-017-8978-3, 2014.
Levy, R. C., Remer, L., Mattoo, S., Vermote, E., and Kaufman, Y.: Second-generation operational algorithm: Retrieval of aerosol properties over land from inversion of moderate resolution imaging spectroradiometer spectral reflectance, J. Geophys. Res.-Atmos., 112, D13211, https://doi.org/10.1029/2006JD007811, 2007.
Levy, R. C., Leptoukh, G., Kahn, R., Zubko, V., Gopalan, A., and Remer, L.: A critical look at deriving monthly aerosol optical depth from satellite data, IEEE T. Geosci. Remote, 47, 2942–2956, 2009.
Levy, R. C., Remer, L. A., Kleidman, R. G., Mattoo, S., Ichoku, C., Kahn, R., and Eck, T. F.: Global evaluation of the Collection 5 MODIS dark-target aerosol products over land, Atmos. Chem. Phys., 10, 10399–10420, https://doi.org/10.5194/acp-10-10399-2010, 2010.
Levy, R. C., Mattoo, S., Munchak, L. A., Remer, L. A., Sayer, A. M., Patadia, F., and Hsu, N. C.: The Collection 6 MODIS aerosol products over land and ocean, Atmos. Meas. Tech., 6, 2989–3034, https://doi.org/10.5194/amt-6-2989-2013, 2013.
Levy, R. C., Munchak, L. A., Mattoo, S., Patadia, F., Remer, L. A., and Holz, R. E.: Towards a long-term global aerosol optical depth record: applying a consistent aerosol retrieval algorithm to MODIS and VIIRS-observed reflectance, Atmos. Meas. Tech., 8, 4083–4110, https://doi.org/10.5194/amt-8-4083-2015, 2015.
Long, C. N. and Shi, Y.: The QCRad Value Added Product: Surface Radiation Measurement Quality Control Testing, Including Climatology Configurable Limits, Office of Biological and Environmental Research, U.S. Department of Energy, 69 pp., 2006.
Long, C. N. and Shi, Y.: An Automated Quality Assessment and Control Algorithm for Surface Radiation Observations, Open Atmospheric Science Journal, 2, 23–37, 2008.
Martínez, E., Campos, A., Borrajero, I., and Vázquez, A.: Algunos índices de turbidez del aire en la Ciudad de la Habana, Revista Cubana de Meteorología, 1, 57–60, 1988.
Mielonen, T., Levy, R. C., Aaltonen, V., Komppula, M., de Leeuw, G., Huttunen, J., Lihavainen, H., Kolmonen, P., Lehtinen, K. E. J., and Arola, A.: Evaluating the assumptions of surface reflectance and aerosol type selection within the MODIS aerosol retrieval over land: the problem of dust type selection, Atmos. Meas. Tech., 4, 201–214, https://doi.org/10.5194/amt-4-201-2011, 2011.
Mishchenko M.I., Liu, L., Geogdzhayev, I. V., Travis, L. D., Cairns, B., and Lacis, A. A.: Toward unified satellite climatology of aerosol properties.: 3. MODIS versus MISR versus AERONET, J. Quant. Spectrosc. Ra., 111, 540–552, 2010.
NASA: NASA Goddard Space Flight Center (GSFC), MODIS Data Product, available at: https://modis.gsfc.nasa.gov/data/dataprod/mod04.php, last access: 9 April 2018a.
NASA: Aerosol Robotic Network (AERONET) from Goddard Space Flight Center (GSFC), Sun photometer aerosol observations for Camagüey, Cuba, available at: http://aeronet.gsfc.nasa.gov, last access: 9 April 2018b.
Ohmura, A., Dutton, E., Forgan, B., Froehlich, C., Gilgen, H., Hegner, H., Heimo, A., Koenig-Langlo, G., McArthur, B., Mueller, G., Philipona, R., Pinker, R., Whitlock, C., and Wild, M.: Baseline Surface Radiation Network (BSRN/WCRP), a new precision radiometry for climate research, B. Am. Meteorol. Soc., 79, 2115–2136, 1998.
Papadimas, C. D., Hatzianastassiou, N., Mihalopoulos, N., Kanakidou, M., Katsoulis, B. D., and Vardavas, I.: Assessment of the MODIS Collections C005 and C004 aerosol optical depth products over the Mediterranean basin, Atmos. Chem. Phys., 9, 2987–2999, https://doi.org/10.5194/acp-9-2987-2009, 2009.
Prospero, J. M. and Lamb, P. J.: African droughts and dust transport to the Caribbean: Climate change implications, Science, 302, 1024–1027, 2003.
Prospero, J. M. and Mayol-Bracero, O. L.: Understanding the transport and impact of African dust on the Caribbean Basin, B. Am. Meteorol. Soc., 94, 1329–1335, 2013.
Prospero, J. M., Collard, F.-X., Molinié, J., and Jeannot, A.: Characterizing the annual cycle of African dust transport to the Caribbean Basin and South America and its impact on the environment and air quality, Global Biogeochem. Cy., 29, 757–773, https://doi.org/10.1002/2013GB004802, 2014.
Remer, L. A., Tanré, D., Kaufman, Y. J., Ichoku, C., Mattoo, S., Levy, R., Chu, D. A., Holben, B. N., Dubovik, O., Smirnov, A., Martins, J.V., Li, R. R., and Ahmad, Z.: Validation of MODIS aerosol retrieval over ocean, Geophys. Res. Lett., 29, 1618, https://doi.org/10.1029/2001GL013204, 2002.
Remer, L. A., Kaufman, Y. J, Tanre, D., Mattoo, S., Chu, D. A., Martins, J. V., Li, R. R., Ichoku, C., Levy, R. C., Kleidman, R. G., Eck, T. F., Vermote, E., and Holben, B. N.: The MODIS aerosol algorithm, products, and validation, J. Atmos. Sci., 62, 947–973, 2005.
Remer, L. A., Tanré, D., Kaufman, Y., Levy, R., and Mattoo, S.: Algorithm for remote sensing of tropospheric aerosol from MODIS: Collection 005, https://modis-images.gsfc.nasa.gov/_docs/MOD04:MYD04_ATBD_C005_rev1.pdf (last access: 9 April 2018), 2006.
Sayer, A. M., Hsu, N. C., Bettenhausen, C., and Jeong, M.-J.: Validation and uncertainty estimates for MODIS Collection 6 “Deep Blue” aerosol data, J. Geophys. Res.-Atmos., 118, 7864–7872, https://doi.org/10.1002/jgrd.50600, 2013.
Sayer, A. M., Munchak, L. A., Hsu, N. C., Levy, R. C., Bettenhausen, C., and Jeong, M.-J.: MODIS Collection 6 aerosol products: Comparison between Aqua's e-Deep Blue, Dark Target, and “merged” data sets, and usage recommendations, J. Geophys. Res.-Atmos., 119, 13965–13989, https://doi.org/10.1002/2014JD022453, 2014.
Santese, M., De Tomasi, M. F., and Perrone, M. R.: AERONET versus MODIS aerosol parameter at different spatial resolutions over southeast Italy, J. Geophys. Res., 112, D10214, https://doi.org/10.1029/2006JD007742, 2007.
Seinfeld, J. H. and Pandis, S. N.: Atmospheric chemistry and physics: from air pollution to climate change, 3rd Edn., John Wiley & Sons, Inc., ISBN: 9781118947401, 1120 pp., 2016.
Smirnov, A., Holben, B. N., Eck, T. F.. Dubovik, O., and Slutsker, I.: Cloud-screening and quality control algorithms for the AERONET database, Remote Sens. Environ., 73, 337–349, 2000.
Swap, R., Garstang, M., Greco, S., Talbot, R., and Kallberg, P.: Saharan dust in the Amazon basin, Tellus B, 44, 133–149, 1992.
Tanré, D., Kaufman, Y. J., Herman, M., and Mattoo, S.: Remote sensing of aerosol properties over oceans using the MODIS/EOS spectral radiances, J. Geophys. Res., 102, 16971–16988, 1997.
Velasco-Merino, C., Mateos, D., Toledano, C., Prospero, J. M., Molinie, J., Euphrasie-Clotilde, L., González, R., Cachorro, V. E., Calle, A., and de Frutos, A. M.: Impact of long-range transport over the Atlantic Ocean on Saharan dust optical and microphysical properties, Atmos. Chem. Phys. Discuss., https://doi.org/10.5194/acp-2017-1089, in review, 2017.
Wagner, F. and Silva, A. M.: Some considerations about Ångström exponent distributions, Atmos. Chem. Phys., 8, 481–489, https://doi.org/10.5194/acp-8-481-2008, 2008.
Witte, J. C., Douglass, A. R., da Silva, A., Torres, O., Levy, R., and Duncan, B. N.: NASA A-Train and Terra observations of the 2010 Russian wildfires, Atmos. Chem. Phys., 11, 9287–9301, https://doi.org/10.5194/acp-11-9287-2011, 2011.
Yu, H., Chin, M., Yuan, T., Bian, H., Remer, L. A., Prospero, J. M., Omar, A., Winker, D., Yang, Y., Zhang, Y., Zhang, Z., and Zhao, C.: The fertilizing role of African dust in the Amazon rainforest: A first multiyear assessment based on data from Cloud-Aerosol Lidar and Infrared Pathfinder Satellite Observations, Geophys. Res. Lett., 42, 1984–1991, https://doi.org/10.1002/2015GL063040, 2015.
Zhao, T. X.-P., Stowe, L. L., Smirnov, A., Crosby, D., Sapper, J., and McClain, C. R.: Development of a global validation package for satellite oceanic aerosol optical thickness retrieval based on AERONET observations and its application to NOAA/NESDIS operational aerosol retrievals, J. Atmos. Sci., 59, 294–312, 2002.