the Creative Commons Attribution 4.0 License.
the Creative Commons Attribution 4.0 License.
 | 14 May 2018
Characterization of a catalyst-based conversion technique to measure total particulate nitrogen and organic carbon and comparison to a particle mass measurement instrument
Chelsea E. Stockwell
Agnieszka Kupc
Bartłomiej Witkowski
Ranajit K. Talukdar
Yong Liu
Vanessa Selimovic
Kyle J. Zarzana
Kanako Sekimoto
Carsten Warneke
Rebecca A. Washenfelder
Robert J. Yokelson
Ann M. Middlebrook
James M. Roberts
The chemical composition of aerosol particles is a key aspect in determining their impact on the environment. For example, nitrogen-containing particles impact atmospheric chemistry, air quality, and ecological N deposition. Instruments that measure total reactive nitrogen (Nr = all nitrogen compounds except for N2 and N2O) focus on gas-phase nitrogen and very few studies directly discuss the instrument capacity to measure the mass of Nr-containing particles. Here, we investigate the mass quantification of particle-bound nitrogen using a custom Nr system that involves total conversion to nitric oxide (NO) across platinum and molybdenum catalysts followed by NO−O3 chemiluminescence detection. We evaluate the particle conversion of the Nr instrument by comparing to mass-derived concentrations of size-selected and counted ammonium sulfate ((NH4)2SO4), ammonium nitrate (NH4NO3), ammonium chloride (NH4Cl), sodium nitrate (NaNO3), and ammonium oxalate ((NH4)2C2O4) particles determined using instruments that measure particle number and size. These measurements demonstrate Nr-particle conversion across the Nr catalysts that is independent of particle size with 98 ± 10 % efficiency for 100–600 nm particle diameters. We also show efficient conversion of particle-phase organic carbon species to CO2 across the instrument's platinum catalyst followed by a nondispersive infrared (NDIR) CO2 detector. However, the application of this method to the atmosphere presents a challenge due to the small signal above background at high ambient levels of common gas-phase carbon compounds (e.g., CO2). We show the Nr system is an accurate particle mass measurement method and demonstrate its ability to calibrate particle mass measurement instrumentation using single-component, laboratory-generated, Nr-containing particles below 2.5 µm in size. In addition we show agreement with mass measurements of an independently calibrated online particle-into-liquid sampler directly coupled to the electrospray ionization source of a quadrupole mass spectrometer (PILS–ESI/MS) sampling in the negative-ion mode. We obtain excellent correlations (R2 = 0.99) of particle mass measured as Nr with PILS–ESI/MS measurements converted to the corresponding particle anion mass (e.g., nitrate, sulfate, and chloride). The Nr and PILS–ESI/MS are shown to agree to within ∼ 6 % for particle mass loadings of up to 120 µg m−3. Consideration of all the sources of error in the PILS–ESI/MS technique yields an overall uncertainty of ±20 % for these single-component particle streams. These results demonstrate the Nr system is a reliable direct particle mass measurement technique that differs from other particle instrument calibration techniques that rely on knowledge of particle size, shape, density, and refractive index.
- Article
(3823 KB) -
Supplement
(513 KB) - BibTeX
- EndNote


Aerosol particles are a key component of the atmospheric chemical environment as they have climate, human health, and ecosystem effects (Pöschl, 2005; IPCC, 2013). Measuring aerosol particle chemical composition is a challenging endeavor that has been the subject of a great deal of innovation in the past few decades (Jayne et al., 2000; Weber et al., 2001; Jimenez et al., 2009; Hallquist et al., 2009). The calibration of these instruments has evolved to better detect speciated composition. Still, there is a need for fundamental mass-based calibration techniques to place aerosol particle measurements firmly in the context of other atmospheric chemical observations.
Nitrogen (N) compounds are major constituents of atmospheric aerosol and play a significant role in atmospheric chemistry, radiative balance, air quality, and N deposition in both terrestrial and aquatic ecosystems (Neff et al., 2002; Liao et al., 2003; Forster et al., 2007; Cornell, 2010; Xu and Penner, 2012; Park et al., 2014; Fuzzi et al., 2015). The relative contribution of N compounds, specifically particulate nitrate, to total atmospheric particle mass is expected to increase in the coming century due to a projected reduction in SO2 and increasing NH3 (Bauer et al., 2007; Bellouin et al., 2011; Hauglustaine et al., 2014; Li et al., 2015), and already dominates in some urban and agricultural environments (Haywood et al., 2008; Vieno et al., 2016). Excluding N species in deposition studies contributes to uncertainty in regional and global nitrogen budgets used to evaluate ecological, biogeochemical, and climate impacts (Jickells et al., 2013; Cornell, 2010; Cape et al., 2011). Measuring individual N species, classes of N compounds, or total N is challenging, and laboratory and field data are limited. For example, while there are a number of methods to measure inorganic N species, particulate organic N is more difficult to quantify with fewer sampling and measurement methods currently available for such a variety of compounds (Lin et al., 2010; Farmer et al., 2010; Lee et al., 2016). Measuring the total N mass of atmospheric particles will improve our understanding of their role in nitrogen cycles associated with sources such as agriculture or wildfires and processes such as photochemical oxidation.
Several techniques exist to measure total reactive nitrogen (Nr), defined here as all atmospheric nitrogen excluding N2 and N2O, which includes both gas (e.g., total odd nitrogen (NOy), NH3, amines, nitriles, nitrates) and particle-phase species (e.g., inorganic and organic N compounds). An established rapid-response robust technique for measuring Nr involves thermal and catalytic conversion to nitric oxide (NO) with detection by ozone (O3) chemiluminescence. The catalyst material, temperature, and sampling methods dictate the efficiency, time resolution, and speciation of measurements (Winer et al., 1974; Williams et al., 1998; Dunlea et al., 2007; Schwab et al., 2007; Benedict et al., 2017). The chemiluminescence detection technique has been used to measure NOx (NO + NO2; Parrish and Fehsenfeld, 2000), total gas-phase Nr (e.g., Hardy and Knarr, 1982; Horstman, 1982), individual reactive nitrogen components (e.g., NH3; Breitenbach and Shelef, 1973; Saylor et al., 2010), or subsets of nitrogen compounds by removal of selected compounds using filters or denuders upstream (Prenni et al., 2014). Marx et al. (2012) completed the only study to explicitly report quantitative conversion of particle-bound Nr for a limited number of species; however the results show a range of conversion efficiencies (78–142 %). Several other studies assume at least some (nonquantitative) particle conversion across their catalysts (Fahey et al., 1985, 1986; Prenni et al., 2014). To our knowledge, no study selectively isolates particle-phase reactive nitrogen to assess the particle-phase contribution to total nitrogen signals from individual sources or in their atmospheric measurement. Here we characterize the particulate Nr conversion in our converter consisting of heated platinum and molybdenum catalysts followed by rapid chemiluminescence detection using common inorganic atmospheric Nr species including (NH4)2SO4, NH4Cl, NaNO3, NH4NO3, and (NH4)2C2O4. The application of the converter coupled with NO−O3 chemiluminescence, hereafter referred to as the Nr system, to quantitatively convert and measure the sum of Nr particle mass was evaluated using mass concentrations determined using traditional particle instrument calibration methods.
Organic carbon species are major constituents of aerosol particles (Jimenez et al., 2009) and are responsible for some of the more important climate and health impacts of particles (Pöschl, 2005). Calibration of measurement systems for organic carbon species is a challenging task since there are thousands of possible compounds of differing sizes, functional groups, and therefore volatilities (Jimenez et al., 2016; Murphy, 2016a, b). A comprehensive mass-based technique for organic aerosol species would be a highly desirable addition to the current measurement technology. Theoretically, the high-temperature platinum catalyst in our system should convert carbon species to carbon dioxide (CO2) in the presence of air. Conversion of volatile organic compounds (VOCs) to CO2 on high-temperature precious metal catalysts is a well-developed technique (see for example the Pt catalyst used in Veres et al., 2010). Total organic carbon measurements using similar catalysts (e.g., palladium on alumina) followed by reduction to methane have been used previously (Roberts et al., 1998; Maris et al., 2003). Platinum-based catalysts are widely used and have been shown to be more efficient than palladium in oxidation studies (Schwartz et al., 1971; Kamal et al., 2016). Here we characterize the conversion efficiency of particle-phase organic carbon across our Pt catalyst by direct measurements using a LI-COR nondispersive infrared (NDIR) CO2 analyzer. The current converter design coupled with both NO and CO2 detectors allows simultaneous measurements of Nr and total carbon (Cy).
Many traditional particle instrument calibration methods involve measurements of particle properties by inertial, gravitational, diffusional, electrical (e.g., sizing), thermal, or optical measurement devices (Chen et al., 2011). Generally, direct mass concentration calibration techniques involve offline analysis of filters or semi-real time measurements (e.g., PILS combined with ion chromatography). More rapid techniques directly measure number concentrations and particle sizes. However, these methods often require knowledge of aerosol properties (e.g., composition, shape, density, refractive index) and sampling parameters (e.g., volumetric flow rate, pressure, temperature, relative humidity) in order to determine mass concentrations. The Nr system is an alternative that directly measures mass traced back to gas-phase calibration standards instead of relying on particle size, shape, or refractive index.
In order to demonstrate the application of the Nr system to directly measure particle mass to calibrate particle mass measurement instrumentation, we compare mass concentrations measured by a new approach of directly coupling a particle-into-liquid sampler to the electrospray ionization source of a quadrupole mass spectrometer (PILS–ESI/MS) for online mass analysis of water-soluble aerosols. The PILS is an established technique developed to efficiently collect the water-soluble fraction of aerosol (Weber et al., 2001; Orsini et al., 2003; Sorooshian et al., 2006). Here, we couple the PILS with an independently calibrated electrospray interface followed by mass spectrometric detection to obtain online mass measurements of single-component, laboratory-generated, Nr-containing aerosol that can be directly compared to the calibration obtained with the Nr system.
In this work, we present the converter setup, system methodology, and evaluate the particle-conversion efficiency of a custom Nr system for several atmospherically relevant Nr-containing particles. The conversion efficiency of the Nr catalyst was evaluated by comparing the Nr mass signal with the mass calculated from instrument calibration techniques that measure the particle number size distributions of laboratory-generated aerosols of known composition. We then show the quantitative conversion of organic carbon across the instrument's platinum catalyst followed by CO2 detection. Finally we compare particle mass directly measured using the PILS–ESI/MS with that measured using the Nr instrument. The primary objectives are to characterize particle conversion in the Nr system, and to investigate the capabilities of the Nr system as a calibration instrument that directly measures particle mass concentration.
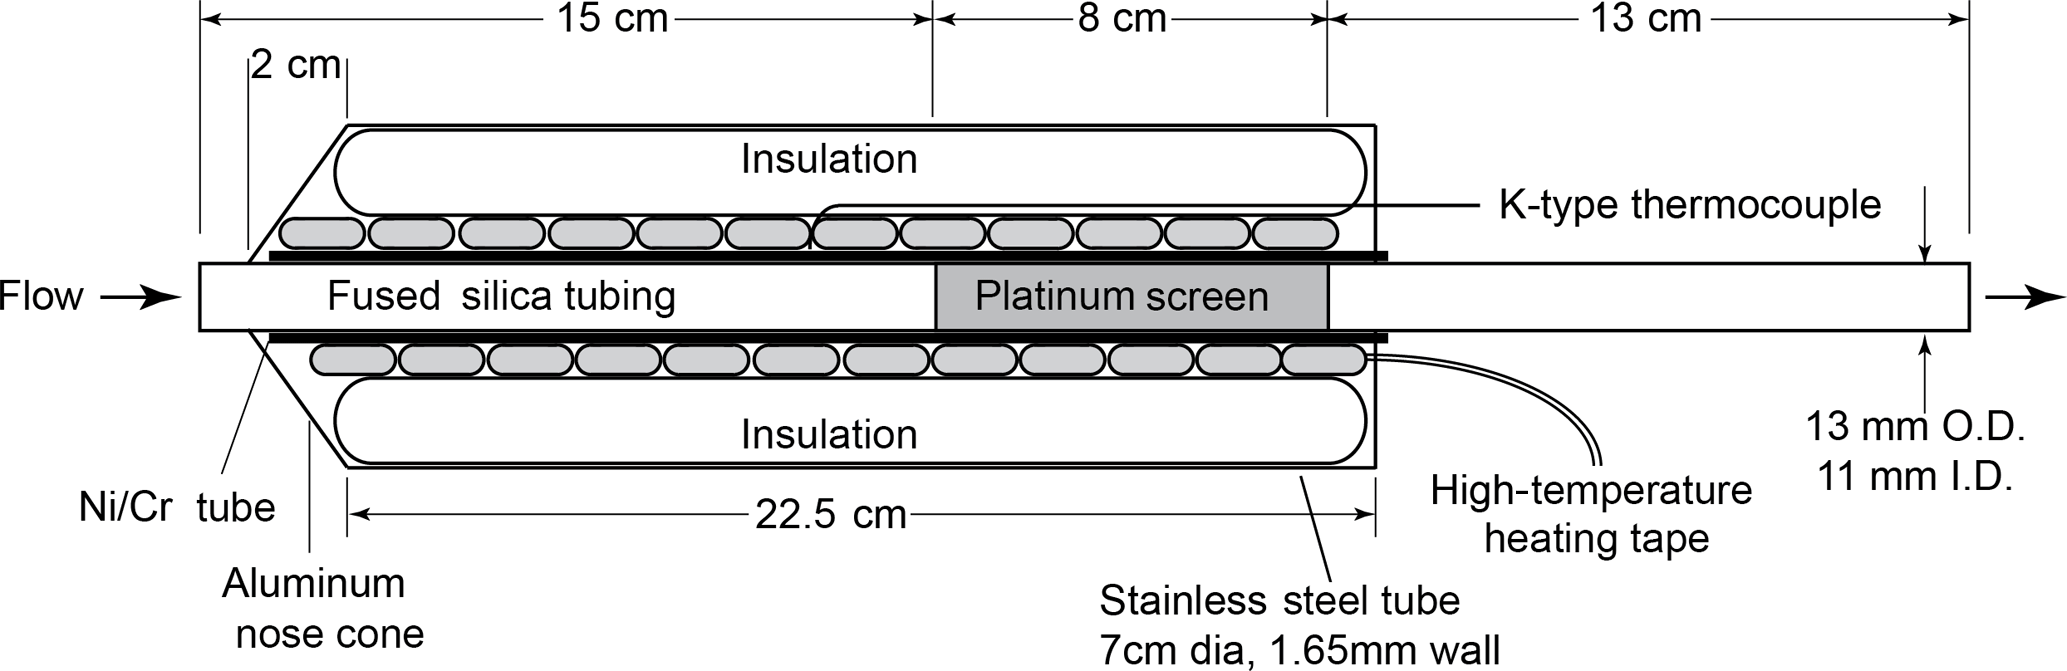
Figure 1Diagram of the custom-built platinum catalyst system for the total reactive nitrogen instrument (Nr) operated at 750 ∘C. The outlet flow is followed by a molybdenum oxide catalyst before the custom NO−O3 chemiluminescent instrument.
2.1 Instrument descriptions
2.1.1 Total reactive nitrogen (Nr) system
Measurements of total reactive nitrogen, Nr, were accomplished by catalytic conversion to NO and detection of the NO using a chemiluminescence instrument. This NO−O3 chemiluminescence instrument is a custom-built version of the common atmospheric monitoring instrument (Williams et al., 1998) and is calibrated directly with gas-phase standards of NO. All the Nr species were converted to NO or NO2 on a high-temperature catalyst, and the NO2 was subsequently converted to NO on a lower-temperature catalyst. The high-temperature catalyst system consisted of a quartz tube (13 mm OD × 11 mm ID × 35 cm L) packed with 36 platinum (Pt) screens (Shimadzu part no. 630-00105) run at high temperature (750 ∘C), shown in Fig. 1. The catalyst bed was confined to an 8 cm long section by dimples in the quartz tube, and that section was positioned so that the gas reaching it had been equilibrated to 750 ∘C, as confirmed by a thermocouple probe. The flow through the catalyst was set to 1 standard L min−1 via a downstream flow controller. The Pt surface area was 126 cm2 and the residence time was 0.1 s at 83.3 kPa and 750 ∘C. Platinum catalysts of this kind are also known to oxidize NO to NO2, which has been the source of problems with some previous systems that were designed to measure atmospheric ammonia (NH3) (Schwab et al., 2007). In our system, the Pt catalyst is followed by a molybdenum oxide (MoOx) catalyst consisting of a solid molybdenum tube (4.2 mm ID × 32 cm L) operated at 450 ∘C, to which an 8 standard cm3 min−1 flow of pure hydrogen was added to create a stable molybdenum oxide surface. Run in this manner, the MoOx surface did not require periodic treatment at higher temperatures under reducing conditions as described by Williams et al. (1998). The heated MoOx catalyst reduces the remaining NO2 to NO. The NO chemiluminescence detection scheme used for laboratory calibrations had a fundamental sensitivity between six and seven counts per part per trillion (pptv) and the detection limit determined by the background signal in zero air (ZA) was typically 15 pptv (4σ) for a 1 s measurement. The operation of this instrument often required considerable de-tuning to keep the instrument count rates below the rollover point of the photon-counting electronics (approximately 5 MHz) for the particle concentrations generated; thus the detection limit was closer to 0.1 ppbv (corresponding to 0.3 µg m−3 for aerosol nitrate).
2.1.2 Total carbon (Cy) system
Measurements of total carbon (Cy) were accomplished by catalytic conversion to carbon dioxide (CO2) and detection using a CO2 analyzer. The high-temperature (750 ∘C) platinum catalyst (Fig. 1) in the Nr system should quantitatively convert carbon-containing species to CO2 in the presence of air. Gas-phase carbon conversion across similar precious metals has been studied extensively (see for example the Pt catalyst used in Veres et al., 2010). The total flow through the Pt catalyst was set to ∼ 1.5 standard L min−1 and was then split before the MoOx catalyst. In our sampling scheme 0.5 standard L min−1 of flow was directed to a LI-COR 6251 (LI-6251; Lincoln, NE) CO2 analyzer, while the remaining flow, 1 standard L min−1, was directed through the MoOx catalyst and to the NO−O3 chemiluminescence detector as detailed in Sect. 2.1.1. Run in this manner, the conversion of compounds that contain both N and C atoms can then be measured simultaneously using the NO−O3 chemiluminescence detector and LI-6251 detector in parallel.
The LI-COR instrument was internally referenced to scrubbed ZA. At ambient CO2 levels, it is challenging to retrieve reliable measurements since the signal relative to the background abundance of CO2 is small. In order to evaluate organic carbon conversion efficiency, our approach relies on using ultrapure air for aerosol generation and carrier gas flow; therefore ambient CO and CO2 are eliminated. The LI-6251 was calibrated with sub-5 ppm CO2 standards (Scott-Marrin Inc., Riverside, CA) in ultrapure air. Due to the low signal levels and the uncertainty of the low-concentration CO2 standards, the overall uncertainty of the CO2 measurements below 1 ppmv presented in this work is ±10 % for 10 s averages.
2.1.3 PILS–ESI/MS
A schematic of the PILS–ESI/MS is shown in Fig. 2. The PILS (Brechtel Manufacturing Inc., Hayward, CA) was developed by Weber et al. (2001) and collects water-soluble aerosol compounds by growing particles into liquid droplets in a supersaturated water environment and then collecting the droplets. A detailed description of the PILS can be found in Sorooshian et al. (2006). The PILS is an established water-soluble aerosol collection technique that has been coupled with various mass analysis methods and was used previously by other laboratories in instrument evaluation studies (e.g., Drewnick et al., 2003; Takegawa et al., 2005; Canagaratna et al., 2007).
The PILS liquid output flow was set to 100 µL min−1 and was continuously mixed with an acetonitrile flow (100 µL min−1). The 1 : 1 volume mixture of acetonitrile and water was directed toward the custom electrospray ionization source (at ∼ 10 µL min−1) of a commercial quadrupole mass spectrometer (Balzers Instruments, QMG 422) operated in negative-ion mode for online analysis of selected water-soluble organic and inorganic compounds. The electrospray interface involved sample injection at ambient pressure through a fused silica capillary tip (30 µM ID) with a 2.5 L min−1 N2 sheath flow at a spray voltage of −3.5 kV. The MS instrument was modified from the negative-ion proton-transfer chemical-ionization mass spectrometer (NI-PT-CIMS) described in Veres et al. (2008). The flow tube was replaced with a stainless steel capillary inlet connected to the front region (I; shown in Fig. 2) held at ∼ 300 Pa. Ions were focused across this region using a planar direct current (DC) ion carpet (Anthony et al., 2014) mounted in front of the orifice leading to the second region (II). The ions were then accelerated through the collisional dissociation chamber (CDC) and collimated in the octopole ion guide at a total pressure of ∼ 1 Pa (region II). The ions were transferred to the quadrupole mass spectrometer (region III). The electron multiplier detector was maintained at a pressure of less than 6.6 × 10⁻³ Pa.
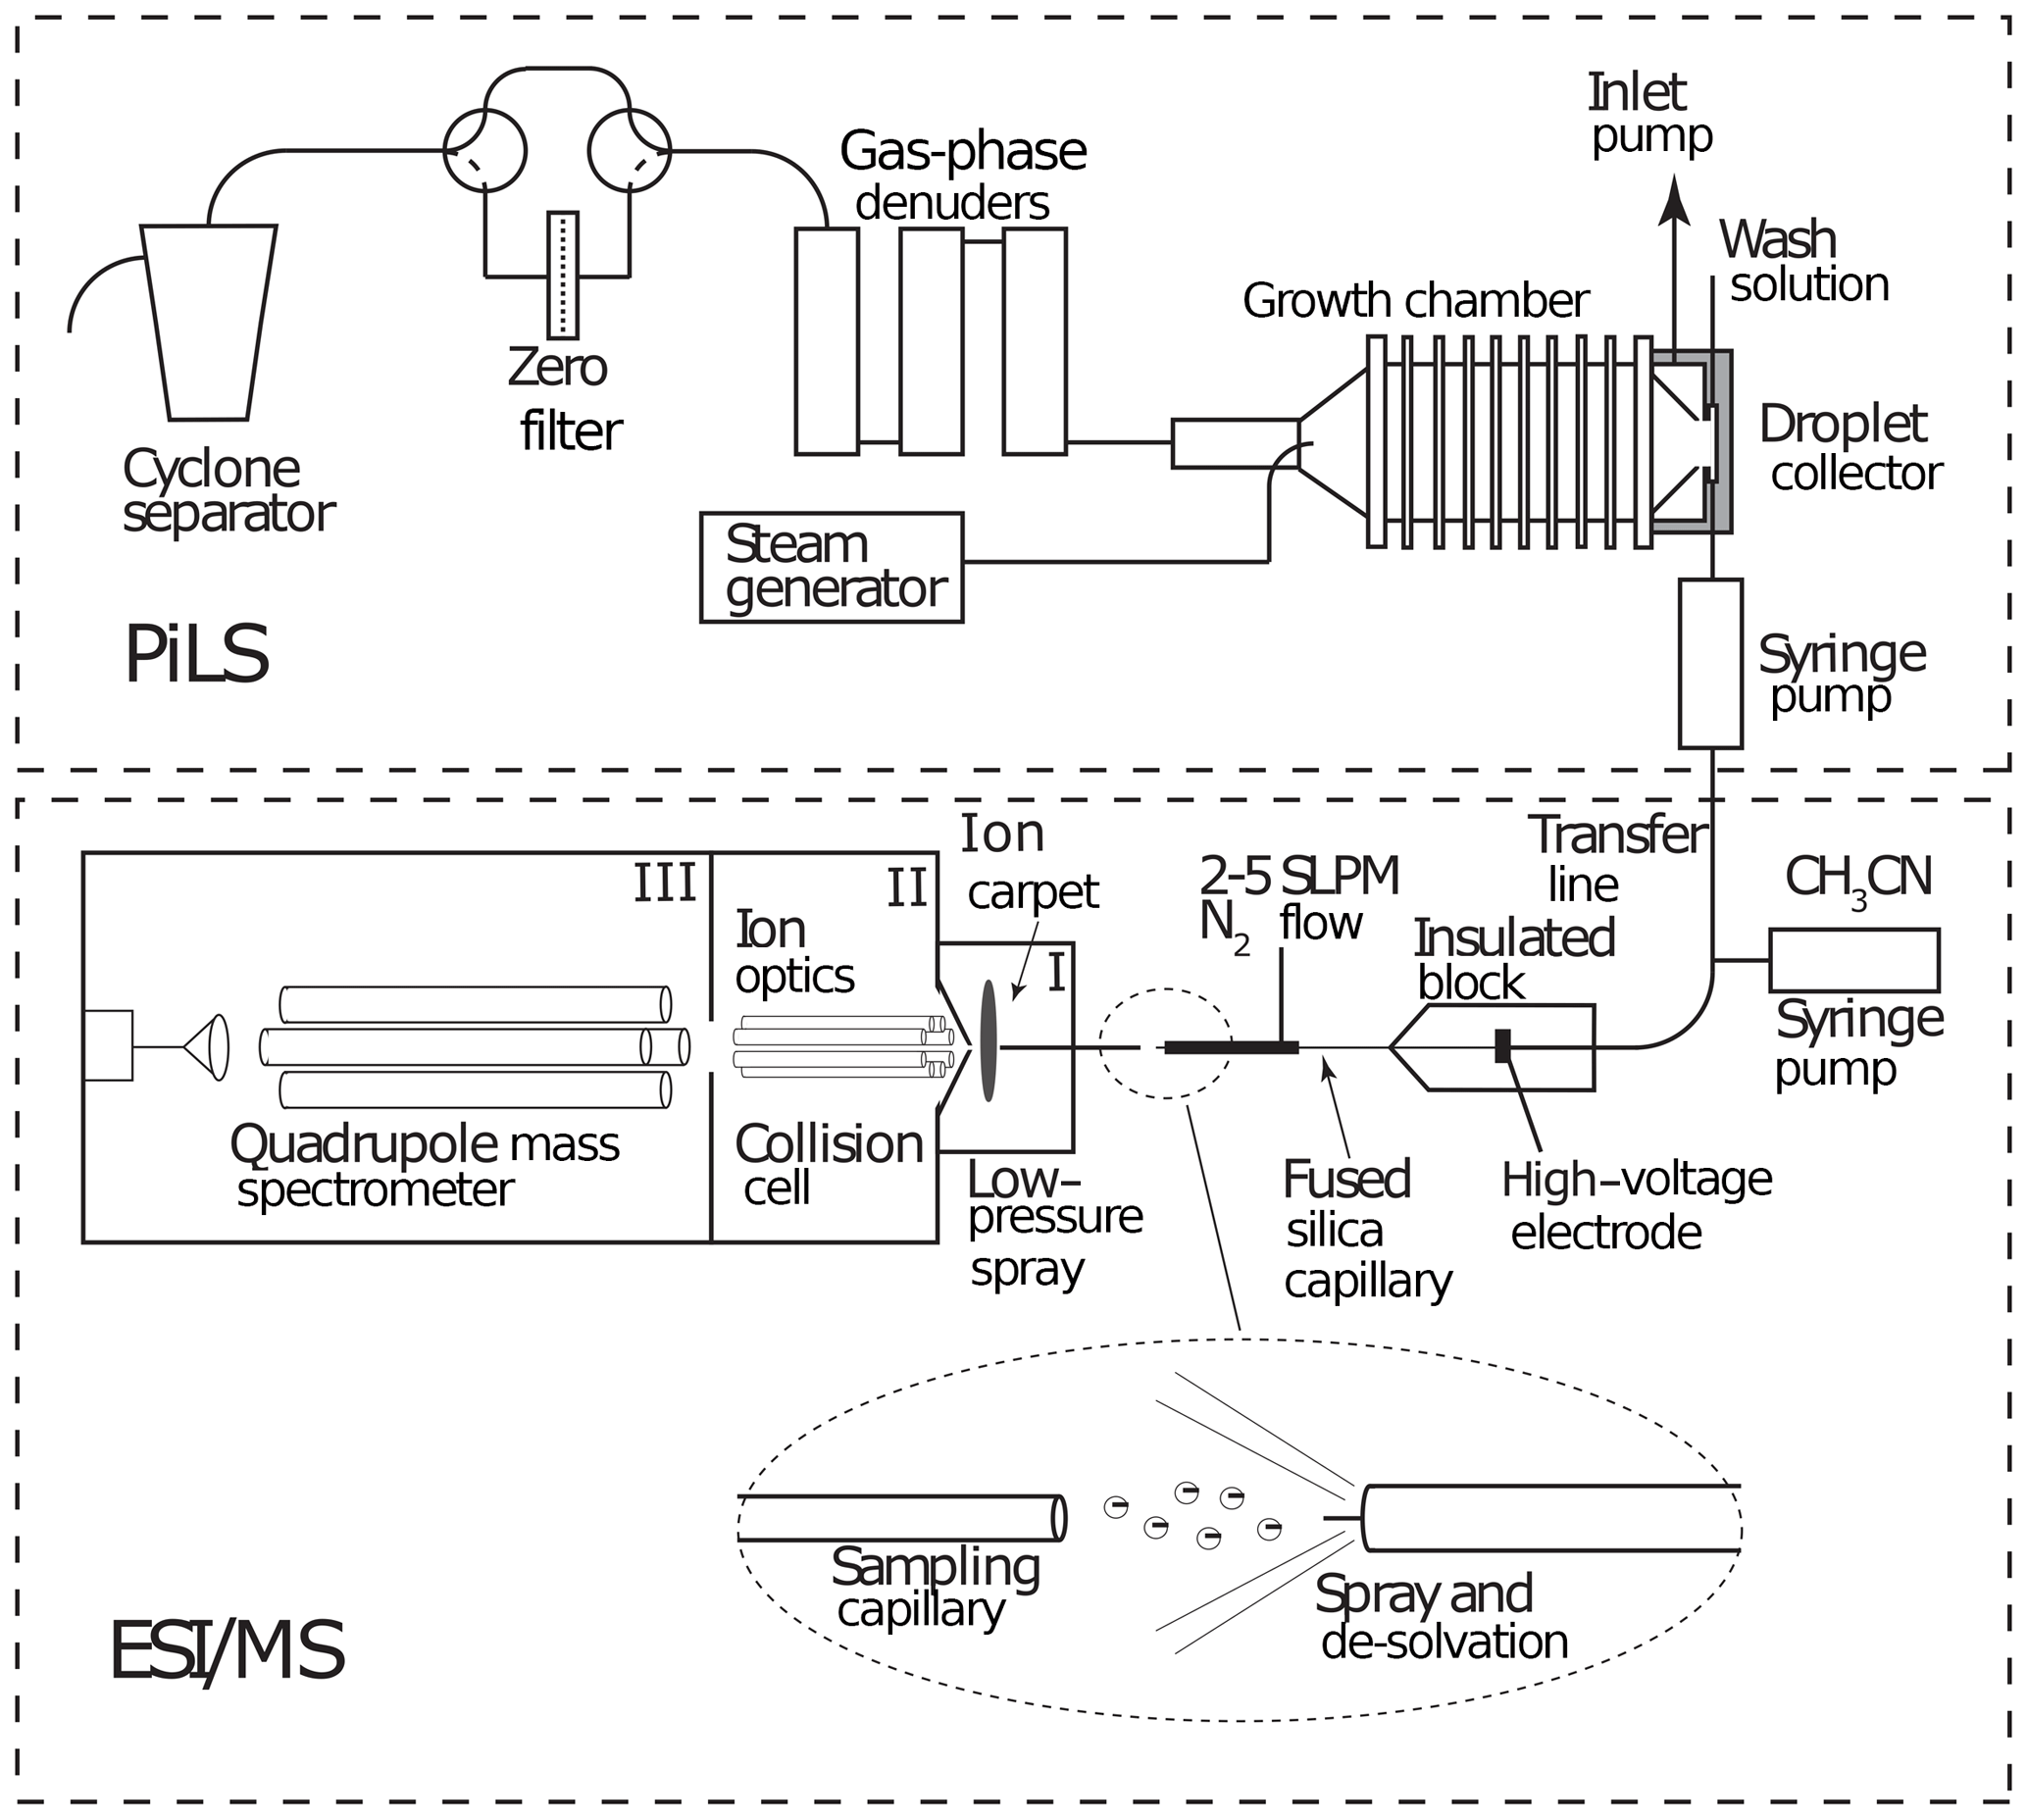
Figure 2Schematic of a particle-into-liquid sampler (PILS; Sorooshian et al., 2006) interfaced to an electrospray ionization (ESI) source of a quadrupole mass spectrometer (MS) for continuous measurement of water-soluble components of atmospheric particles.
The ESI/MS was calibrated using volumetrically and gravimetrically prepared liquid-phase standards of the anions associated with the target compounds (e.g., , , Cl−) (Sigma Aldrich, St. Louis, MO). Anion-specific calibration factors were calculated from linear least-square fits of multipoint calibration curves. The uncertainty in the slope resulted in a maximum uncertainty of ∼ 10 % for the compounds tested. The ESI flow rate, solvent composition, analyte chemical properties, and matrix effects potentially impact the ionization and transmission efficiencies of compounds (Kostiainen and Kauppila, 2009). For these reasons, experiments were performed under similar, or as close to identical, conditions as the calibrations for instrument evaluation. The limits of detection for the anions measured with the PILS–ESI/MS were below ∼ 0.1 µg m−3 for the current system and sampling conditions. Sorooshian et al. (2006) discuss volatility losses in the PILS for several inorganic species and reported negligible loss with a collection efficiency of ≥ 96 % for mass loadings of Cl−, , and ranging from 1 to 140 µg m−3. Additionally, Orsini et al. (2003) showed the collection efficiency of ≥ 95 % for particles as small as 30 nm diameter for a 15 L min−1 sample flow rate. Ammonium () is the major ion susceptible to volatilization as shown in Ma (2004), who indicated an underestimation of ∼ 15 %. In this study, because we were operating in the negative-ion mode, we did not measure directly.
2.2 Experimental design
2.2.1 Methods for determining gas-phase conversion efficiency
The efficiency of conversion of several N-containing gases by the Nr catalyst was determined through addition of a number of representative compounds that were calibrated independently. The NO signal from the converted species was then compared to the signal from an NO in N2 standard (5.38 ppmv, Scott-Marrin Inc., Riverside, CA) that was used as the working standard for this project. Typical calibration levels were in the range of 50 to 100 ppbv as determined by the mass flow controllers used to mix the standard into the measurement stream. The standards used for each compound and their associated calibrations were as follows.
The NO2 standard stream was produced from the NO working standard through gas-phase titration with a small stream of O2 in which O3 had been produced by photolysis at 184.9 nm using a mercury discharge lamp. This technique is used routinely for NOx and NOy measurement systems (Williams et al., 1998) and allows straightforward determination of NO2 conversion provided care is taken not to over-titrate the NO stream to produce NO3 and therefore N2O5. The uncertainty in the NO2 conversion determination is simply the propagated errors in the subtraction of the signals before and after titration.
The ammonia (NH3) conversion was examined using two different NH3 sources, a gas mixture (3.1 ppmv in N2, Scott-Marrin), and a permeation device (Kin-Tek, La Marque, Texas). Care was taken with these standards to keep them under flow for periods of several days in order to insure any system surfaces were equilibrated. The calibration of these standards was accomplished with ultraviolet (UV) absorption spectroscopy at a 184.9 nm wavelength using an instrument described by Neuman et al. (2003), and based on absorption cross sections reported in the literature (Tannenbaum et al., 1953; Lovejoy, 1999; Froyd, 2002). The uncertainty of NH3 conversion was propagated based on the uncertainties in flow rate and UV absorption determinations.
The hydrogen cyanide (HCN) standard consisted of a commercial gravimetric mixture of HCN in N2 (10 ppmv, Gasco, Oldsmar, FL), which was mixed into the system using a mass flow controller. The specified uncertainty of this mixture was ±10 %, and the standard concentration was verified using long-path Fourier-transform infrared (FTIR) spectroscopy to within the stated uncertainty. The HCN standard was used to produce a gas-phase stream of cyanogen chlorine (ClCN) by reaction with chloramine-T, a nonvolatile chlorinating agent, which has been described previously (Valentour et al., 1974). To do this, a small stream (5 standard cm3 min−1) of the HCN standard was combined with humidified ZA (60 % RH, 30 standard cm3 min−1) over a bed packed with glass beads coated with a solution of chloramine-T. The glass beads were prepared by coating glass 3 mm outer diameter (OD) beads with a 2 g 100 mL−1 solution and packing ∼ 20 cm3 of them in a 12.7 mm OD PFA tube and flowing ZA over them until dry. The reaction was shown to be essentially 100 % (±10 %) using proton-transfer-reaction mass spectrometry (PTR-MS), when conducted in a humidified atmosphere (RH ≥ 60 %), and by FTIR analysis of the HCN and ClCN in the gas stream before and after chlorination.
The isocyanic acid (HNCO) standard was prepared according to the methods described by Roberts et al. (2010), in which the trimer, cyanuric acid, was thermally decomposed at 250 ∘C in a diffusion cell to produce a steady stream of HNCO, which was then calibrated using long-path FTIR spectroscopy. Initially, this source has the potential to produce NH3 as an impurity, most likely because of the presence of trace amounts of water. Keeping the source under flow and above 120 ∘C at all times when not in use was found to reduce the NH3 impurity to negligible levels (< 5 %), as measured using PTR-MS. The uncertainties in the HNCO standard were propagated from the uncertainties in the HNCO cross section (Northwest Infrared, PNNL), the NH3 subtraction, and flow rates. Standard streams of both nitrobenzene and trimethylamine were produced using gravimetrically prepared solutions and a commercial liquid calibration device (Ionicon, Innsbruck, Austria). The uncertainties in these liquid calibration standards were estimated from the propagated uncertainties in the solution concentrations and the liquid and gas flow rates.
The conversion of nitrous oxide (N2O) is a potential interference in the Nr method as N2O is not typically considered a reactive nitrogen compound in the troposphere. Several experiments were conducted to determine the extent of this potential interference using a 10.1 ppmv N2O standard. The resulting conversion efficiency ranged from 0.03 to 0.05 % in dry and humidified air, respectively. These can be considered upper limits for this interference as we cannot be completely sure that there were no Nr contaminants (e.g., NO2) in the N2O standard.
2.2.2 Methods for determining particle-phase conversion efficiency
Several aerosols were generated including polystyrene latex spheres (PSLs; Nanosphere size standards, Thermo Fisher Scientific Inc., Waltham, MA), NH4NO3, (NH4)2SO4, (NH4)2C2O4 (Sigma Aldrich, St. Louis, MO), NH4Cl (J. T. Baker Chemical Co., Phillipsburg, NJ), and NaNO3 (Fisher Scientific, Hampton, NH). Aerosol particles were generated by atomizing aqueous solutions of pure compounds in distilled water (∼ 0.5–6 g L−1) using a custom-built Collison-type atomizer (similar to one reported by Liu and Lee, 1975) in a dry particle-free nitrogen or ZA flow. The output flow was dried using a silica gel diffusion dryer to a relative humidity (RH) less than 10 %. The dry polydisperse particles were then size-selected using a custom-built differential mobility analyzer (DMA; similar to one described by Knutson and Whitby, 1975). The DMA was operated at a sample flow of 0.3–0.5 volumetric L min−1 and a ratio of 10 : 1 between the sheath and sample flow. The particles were diluted with ultra-high-purity filtered ZA (range 1–10 L min−1) before entering a mixing vessel. In instances in which a mixing vessel was not available, a segment of smaller diameter tubing was added in-line to promote mixing prior to the flow being divided among the instruments. A condensation particle counter (CPC; 3022A, TSI Inc., Shoreview, MN) (Stolzenburg and McMurry, 1991) continuously measured the particle number concentration of the DMA output flow, following dilution. We measured the CPC flow rate pre- and post-sampling using a low-flow DryCal (Mesa Laboratories, Lakewood, CO) and estimate an uncertainty in the CPC flow rate calibration to be ±1 %. During several experiments, the aerosol flow was split and sampled by an ultra-high-sensitivity aerosol spectrometer (UHSAS; Droplet Measurement Technologies, Longmont, CO) to continuously measure the particle concentration and size distribution for particles with diameters between ∼ 63 and 1000 nm.
For the liquid concentrations, atomizer conditions, and DMA settings used here, the DMA output size distribution was a multi-peaked population consisting not only of singly charged particles but also particles with multiple (mostly two or three) charges that could contribute significantly to the overall particle mass. Hence the particle mass could not be calculated directly from the singly charged mobility diameter, particle density, and the CPC number concentrations. We generally used two methods to calculate the particle mass concentrations for these experiments. For the first method, the size distributions were measured using the scanning mobility particle sizer (SMPS; Wang and Flagan, 1990) function of the DMA (physical diameter, Dp = 1–1000 nm). We used the DMA transfer theory (Knutson and Whitby, 1975; Stolzenburg, 1988) with the steady-state charge distribution approximation of Wiedensohler (1988) to estimate the fraction of multiply charged particles contributing to the CPC number concentration for each diameter setting. There are a number of possible sources of uncertainty using these methods that may include particle losses, DMA transfer function uncertainty, counting uncertainty, and inversion errors. When comparing mass concentrations from the SMPS with those measured by the Nr system, issues with the SMPS-derived size distributions became apparent (discussed separately in Sect. 3.2.2). For the second method of calculating mass concentrations, we directly measured the diluted DMA output using the UHSAS. UHSAS particle sizing is a function of the amount of light scattered onto the photodetectors, which depends not only on the particle size but also on the composition-dependent particle refractive index (Bohren and Huffman, 1983; Liu and Daum, 2000; Hand and Kreidenweis, 2002; Rosenberg et al., 2012). The UHSAS manufacturer recommended calibration uses PSL microspheres, which are well characterized and have a known refractive index (n = 1.58) and shape. Because the UHSAS sizing is sensitive to particle refractive index, a new sizing calibration curve was produced for each studied particle type (i.e., refractive index) using a DMA to select particles for a range of known sizes (Kupc et al., 2018). These calibration curves were used to retrieve accurate particle size distributions that properly accounted for the multiply charged particles.
Differences in particle counting efficiency between the UHSAS and CPC are potentially important. Previous laboratory studies show UHSAS and CPC number concentration comparisons in excellent agreement (Cai et al., 2008; Kupc et al., 2018); however, occasionally only a ∼ 90 % counting efficiency for the UHSAS was observed when compared to the CPC. These differences are attributed to particle coincidence at high concentrations (> 1000 cm−3) and to inefficient particle mixing before reaching the instruments. Corrections for particle coincidence were applied (Kupc et al., 2018) though we expect differences due to particle mixing add an additional 10 % uncertainty to the measurements. The UHSAS- and CPC-measured particle number concentrations were generally within 10 % of each other; however, the CPC values did not require coincidence corrections and had a better signal-to-noise ratio. Due to problems with measuring SMPS size distributions and requiring coincidence corrections for the UHSAS number concentrations, we used the UHSAS size distributions with the total particle number taken from the CPC measurement to calculate particle mass from total volume and density.
2.2.3 Nitrogen-containing particles
The measurement of particle-phase Nr requires decomposition or volatilization of the solid material, followed by catalytic conversion to NO (or NO2). Broadly, there are three types of Nr-containing particles, with a range of thermal stabilities from volatile to refractory. First, there is considerable literature that indicates that small particles composed of two major semi-volatile species, ammonium nitrate (NH4NO3) and ammonium chloride (NH4Cl), will dissociate to constituents NH3 and HNO3 (and HCl) when modestly heated to temperatures < 100 ∘C (Huffman et al., 2009; Hu et al., 2011). These materials will be readily converted on high-temperature catalysts (e.g., platinum, Pt) as gas-phase NH3 and HNO3. The second type of Nr-containing particles include intermediate-stability compounds consisting mostly of nitro-organics (R-NO2), organic nitrates (RONO2), and amine and ammonium salts of acids. These compounds begin to decompose at relatively low temperatures. For example, thermal decomposition studies of bulk ammonium oxalate ((NH4)2C2O4) indicate that it begins to decompose at temperatures slightly above 200 ∘C (Usherenko et al., 1988). Similarly, bulk samples of ammonium sulfate ((NH4)2SO4) and ammonium bisulfate ((NH4)HSO4) decompose at approximately 150–250 ∘C depending on water content (Kiyoura and Urano, 1970). Given sufficient residence time, intermediate-volatility compounds will start to convert to gas-phase products in the hot inlet tubing and fully convert to NO (or NO2) on a hot Pt surface (750 ∘C). The third type of Nr-containing particles are composed of refractory salts such as sodium nitrate (NaNO3), which will be the most resistant to decomposition and require contact with high-temperature surfaces of the Pt catalyst. Studies of the thermal decomposition of NaNO3 on Pt surfaces indicate that NO is evolved starting at about 500 ∘C. In summary, the existing literature suggests that the thermal decomposition and conversion of Nr-containing particles to NO (NO2) is thermodynamically feasible provided there is sufficient residence time and surface area in the catalyst zone.
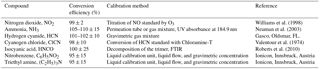
Table 1Conversion efficiencies of Nr compounds by the Pt and MoOx catalyst system.
3.1 Nr gas-phase conversion efficiency
We verified the efficiency of conversion of a range of gas-phase Nr compounds in this catalyst system using calibrated gas mixtures or standard streams and auxiliary analysis methods as described in Sect. 2.2.1. The conversion efficiencies are summarized in Table 1 and range from 95 to 110 %. The values were based on the ratios of the Nr measured as NO to the expected values specified by each calibration method. The uncertainties in the measured conversion efficiencies are in the propagated errors in each calibration method, and in all cases the range encompasses 100 % conversion. For example, the largest uncertainty in the NH3 conversion efficiency was the NH3 UV absorption cross section at 184.9 nm (value of 4.4 ± 0.3 × 10⁻¹⁸ cm2 taken from Neuman et al., 2003). It is possible that there were Nr compounds in the standard stream aside from NH3 that were responsible for the result being > 100 %. However, the fact that the determination was above 100 % for both a permeation source and a gas-phase mixture (3.1 ppmv in N2) implies that the UV absorption cross section is high by 5–10 % or that there were contaminants in both calibration sources. NH3 is one of the more important reactive nitrogen species in the atmosphere–biosphere system and is thermodynamically one of the more difficult to convert. Compounds considered NOy species, such as nitric acid, acetyl peroxynitrates, and alkyl nitrates, were not studied in this work (aside from NO2) since they are known to be converted at high efficiency on precious metal (Fahey et al., 1986) or molybdenum oxide (Winer et al., 1974) catalysts. The resulting uncertainties in the Nr measurement are estimated to be ±10 % based on comparisons of measured NO signals to individual Nr compound calibrations.

Figure 3The signal resulting from particles only. (a) Real-time Nr-measured (black) and CPC-derived (red) aerosol mass concentrations (µg m−3) from an atomized solution of NaNO3. (b) Time response of the Nr signal (ppbv) shown in black (left axis), and the CPC signal (particles cm−3) shown in red (right axis), as particle sizes of (NH4)2SO4 are selectively changed. The dashed vertical lines and labels indicate the singly charged particle diameter selected with the DMA.
N2O is a potential interference that is discussed in Sect. 2.2.1, though in this instance the conversion efficiency upper limit determined for this instrument is a negligible interference in the Nr measurements in ambient air or ZA matrices, and likewise will not be significant in biomass burning sources given that N2O enhancements in fresh biomass smoke are generally not observed or contribute minimally to total nitrogen (Griffith et al., 1991). N2O emissions from other sources (e.g., natural and anthropogenic agricultural sources, fossil fuel combustion, or animal waste) can be significant; therefore the interference from N2O conversion must be considered. O3 is another potential source of gas-phase interference due to the decomposition of O3 to O2 + O, followed by reaction of O with N2O at high temperature to form NO. However, the NO production in the O + N2O reaction is an approximately 20 % channel with a net rate constant of approximately 1 × 10⁻¹⁵ cm3 molecule−1 s−1 at 750 ∘C (NIST, 2017). If all the O atoms from 70 ppbv of O3 were available for reaction with an ambient level of N2O (340 ppbv), then the 0.1 s residence time in the converter would result in approximately 28 pptv of NO, an upper limit that is generally a negligible amount in almost any atmospheric context except in remote regions.
3.2 Nr particle measurements
3.2.1 Nr system setup and response
The atomizer output was diluted with particle-free nitrogen and ultrapure ZA; therefore, the Nr measurement should theoretically be attributed to particles only since no detectable gas-phase nitrogen is added to the sample stream. However, equilibration within the sample lines may result in outgassing and formation of gas-phase compounds affecting total Nr detection. Figure 3a shows the initial response of the Nr system in cleaned inlets for NaNO3. The Nr mass signal tracks the CPC-derived aerosol mass features closely as the aerosol source concentrations fluctuate. Additionally, as different particle sizes are selected by the DMA for (NH4)2SO4 (Fig. 3b), changes in the total Nr response are fast and precisely track the changes in the CPC signal. The potential gas-phase constituents equilibrating in the lines from aerosols in this study include HNO3, HCl, and NH3. If these compounds formed before reaching the Nr catalyst it is likely adsorption and desorption from inlets and tubing surfaces would occur (e.g., Neuman et al., 1999; Yokelson et al., 2003). As an example, the presence of NH3 in Fig. 3b (or HNO3 in nitrate-containing particles) would be indicated by a delayed and lengthened rise or fall in the Nr response with sudden changes to the input concentrations. However, the total Nr response precisely tracks the CPC signal on rapid timescales (a few seconds), suggesting that gas-phase NH3 was not present in significant quantities. In experiments at exceptionally high aerosol loadings of (NH4)2C2O4 (up to several parts per million volume of total Nr, i.e., several thousand micrograms per cubic meter) Nr signal “tailing” was observed, suggesting that NH3 was scavenging to the walls of the inlet before the heated quartz tubing.

Figure 4Calculated mass from particles size-selected by the DMA and corrected for multiply charged particles using SMPS-derived size distributions compared to aerosol mass concentrations (µg m−3) measured as Nr for (a) NaNO3, (b) (NH4)2SO4, (c) NH4Cl, and (d) (NH4)2C2O4. The particle size is designated by the color plot (error bars indicate ±1 SD) and the 1 : 1 line is shown in black with 20 % error indicated by the grey shading.
Marx et al. (2012) reported calculated conversion efficiencies in air sampled from a small chamber for NaNO3, NH4NO3, and (NH4)2SO4 to be 78, 142, and 91 %, respectively. The authors suggested the overestimation of NH4NO3 was a result of its semi-volatile properties under ambient conditions that led to the formation of gaseous NH3 and HNO3 in the chamber. For these reasons, we limit the background artifacts and volatilization effects that may have occurred during chamber filling and sampling in Marx et al. (2012) by sampling immediately following solution atomization through conductive tubing at relatively high sample flow rates. Additionally, we use a DMA to size-select the atomized polydisperse aerosol to evaluate the particle conversion efficiency at several different diameters (100–600 nm in 50 nm increments) to investigate the volatilization effects and conversion efficiencies of smaller particles for the extended list of Nr-containing aerosols studied in our work.
3.2.2 Challenges using the DMA/SMPS to determine Nr-particle conversion efficiency
The voltage scanning (SMPS) function of the DMA and number concentration measurements by the CPC are a conventional method to determine particle size distributions, and for calculating particle mass from total volume and density, assuming spherical particles. For the total nitrogen measurements, the total particle-bound Nr mixing ratios were retrieved and converted to mass concentrations for each corresponding salt. Figure 4a–d show the SMPS-calculated vs. Nr-measured mass concentrations (µg m−3) for particles of different composition and diameter. The plots show that a strong correlation (R2 > 0.98) and good agreement was obtained for smaller particles (50–200 nm) with slopes ranging from 0.86 to 0.97, while for larger particles (≥ 250 nm) the mass-calculated values from the SMPS-derived distributions were sometimes as much as > 50 % too high. The R2 for all particles including ≥ 250 nm ranged from 0.71 to 0.85 with slopes of 1.08–1.36.

Figure 5Correlation plots of mass concentrations measured as Nr for (a) NaNO3, (b) (NH4)2SO4, (c) NH4Cl, and (d) (NH4)2C2O4 versus mass concentrations calculated using CPC number concentrations with UHSAS size distributions. Particle sizes (nm) are indicated by the color plot and the 1:1 line is shown in dashed black. The solid lines are orthogonal distance regression fits. The slope (uncertainty) and R2 is shown.
For larger particles, we used a UHSAS to determine the size distribution of multiply charged species exiting the DMA. The SMPS inversion-derived size distributions were generally broader than the UHSAS size distributions, though agreement improved at increased scan times. Small differences in the size distribution recovered from the voltage scans at larger diameters (> 200 nm) affected the mass distribution considerably because particle mass scales with diameter cubed. A possible explanation is that we are not correctly accounting for the delay time from the DMA exit to the CPC; therefore the particle counts did not correspond to the correct size designated from voltage scanning and this likely skewed the size distribution relative to the true distribution (Collins et al., 2002). Methods for limiting these effects exist (Russell et al., 1995; Collins et al., 2002), including slower voltage scan rates. However, our results demonstrate the added challenges in particle mass determination using estimated size distributions from the SMPS method. For the remaining discussion, we measure the size distributions directly using the UHSAS with particle concentration measurements (by either the CPC or UHSAS) to evaluate the Nr particle conversion in the Nr system.
3.2.3 Determining Nr-particle conversion efficiency using a DMA and UHSAS
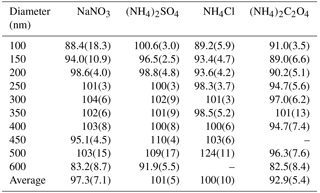
For the aerosol mass concentrations (µg m−3) calculated using UHSAS particle size distributions, we refer to these values as UHSAS-calculated mass. Comparisons of the mass directly measured as Nr versus UHSAS-calculated mass concentrations for atomized solutions of NaNO3, (NH4)2SO4, NH4Cl, and (NH4)2C2O4 are shown in Fig. 5 with orthogonal distance regression lines with slopes that range from 0.910 to 1.06 for concentrations from ∼ 0 to 70 µg m−3. The instruments are highly correlated (R2 = 0.90–0.99) and the fits indicate that for the salts tested there is quantitative conversion of particulate nitrogen, to within the combined uncertainties of the methods, independent of diameter (range: 100–600 nm). More detailed particle conversion efficiencies by size are shown in Table 2 for each aerosol tested. On average across all size ranges the results indicate 97 ± 7, 101 ± 5, 100 ± 10, and 93 ± 5 % particle conversion efficiencies for NaNO3, (NH4)2SO4, NH4Cl, and (NH4)2C2O4, respectively. The largest deviation from the one-to-one line occurred for (NH4)2C2O4, which may imply some ammonia loss, though the agreement is generally still within 10 % for most particle sizes.
For the case of NH4NO3, the UHSAS-measured size distribution peaked at significantly lower diameters than expected based on the DMA size selection. This difference has been reported previously (Cai et al., 2008; Womack et al., 2017), though to a lesser extent (∼ 8 %) than observed here (up to 30 %). Possible explanations for these differences could include vaporization and/or evaporation effects, residual water in the particles, surface effects, or differences in electrical mobility diameter and geometric diameter due to non-sphericity as discussed in DeCarlo et al. (2004). For these reasons, we made no attempt to characterize NH4NO3 behavior in either the DMA or UHSAS and refer to Sect. 4 for mass concentration comparisons of polydisperse aerosol measured using separate mass measurement techniques (both the Nr system and PILS–ESI/MS). It is worth noting that NH4NO3 is one of the more volatile compounds included in this study and it is reasonable to expect similar particle conversion efficiencies in the Nr system catalysts for NH4NO3 as the other species tested (Table 2).
Table 2Particle conversion efficiencies (%) with uncertainties (1 standard deviation) in parentheses. The sizing accuracy is ∼ ±2.5 % using NIST-traceable PSLs for 150–500 nm spheres as our calibration standard.
3.3 Carbon conversion efficiency of Pt catalyst
The high-temperature platinum catalyst should quantitatively convert carbon-containing species to CO2 in the presence of air. Therefore, the addition of a CO2 analyzer to the system as described in Sect. 2.1.2 allows for simultaneous measurements of Nr and Cy. Gas-phase carbon conversion across similar precious metals has been studied previously (e.g., Veres et al., 2010). The efficient conversion of gas-phase C compounds in our catalyst system was confirmed using a CO standard in air, and a combination CO2, CO, and CH4 standards in air. The following discussion focuses on the conversion of particle-phase organic compounds (OC). The efficient conversion of Nr-containing particles was demonstrated in Sect. 3.2.2 for the range of N oxidation states and should extend to other Nr-containing particles; we expect that the resulting Nr and Cy signals from each detector will be in proportion by dividing the result by the number of carbon and nitrogen atoms in the parent molecule to give the standard concentration on a molar basis. Polydisperse particulate OC was generated from the solution following an N2 purge to eliminate carbonate from the solution. Aerosol particles from solutions of anthranilic acid (C7H7NO2, 2-aminobenzoic acid, Sigma Aldrich), threonine (C4H9NO3, 2-amino-3-hydroxybutanoic acid, Sigma Aldrich), tryptophan (C11H12N2O2, 2-amino-3-indolylpropanoic acid, Sigma Aldrich), and quinine (C20H24N2O2, Sigma Aldrich) were tested. These compounds were chosen based on their water solubility to avoid the use of organic solvents. An example of the Nr and Cy response is shown in Fig. 6 for threonine (see Fig. S1 in the Supplement for additional compounds). The relative difference between the Nr and Cy measured concentrations (up to several hundred parts per billion volume) is less than 10 %, which is within the propagated uncertainties of the CO2 calibration standards and both detection methods. We conclude that the Nr catalyst with a CO2 detector in parallel can be used as a total carbon measurement system and would be useful to establish instrument calibrations for carbon-containing aerosol. The system is currently limited to calibration of compounds in ZA matrices because ambient levels of the common gas-phase carbon compounds CO2, CO, and CH4 are high.
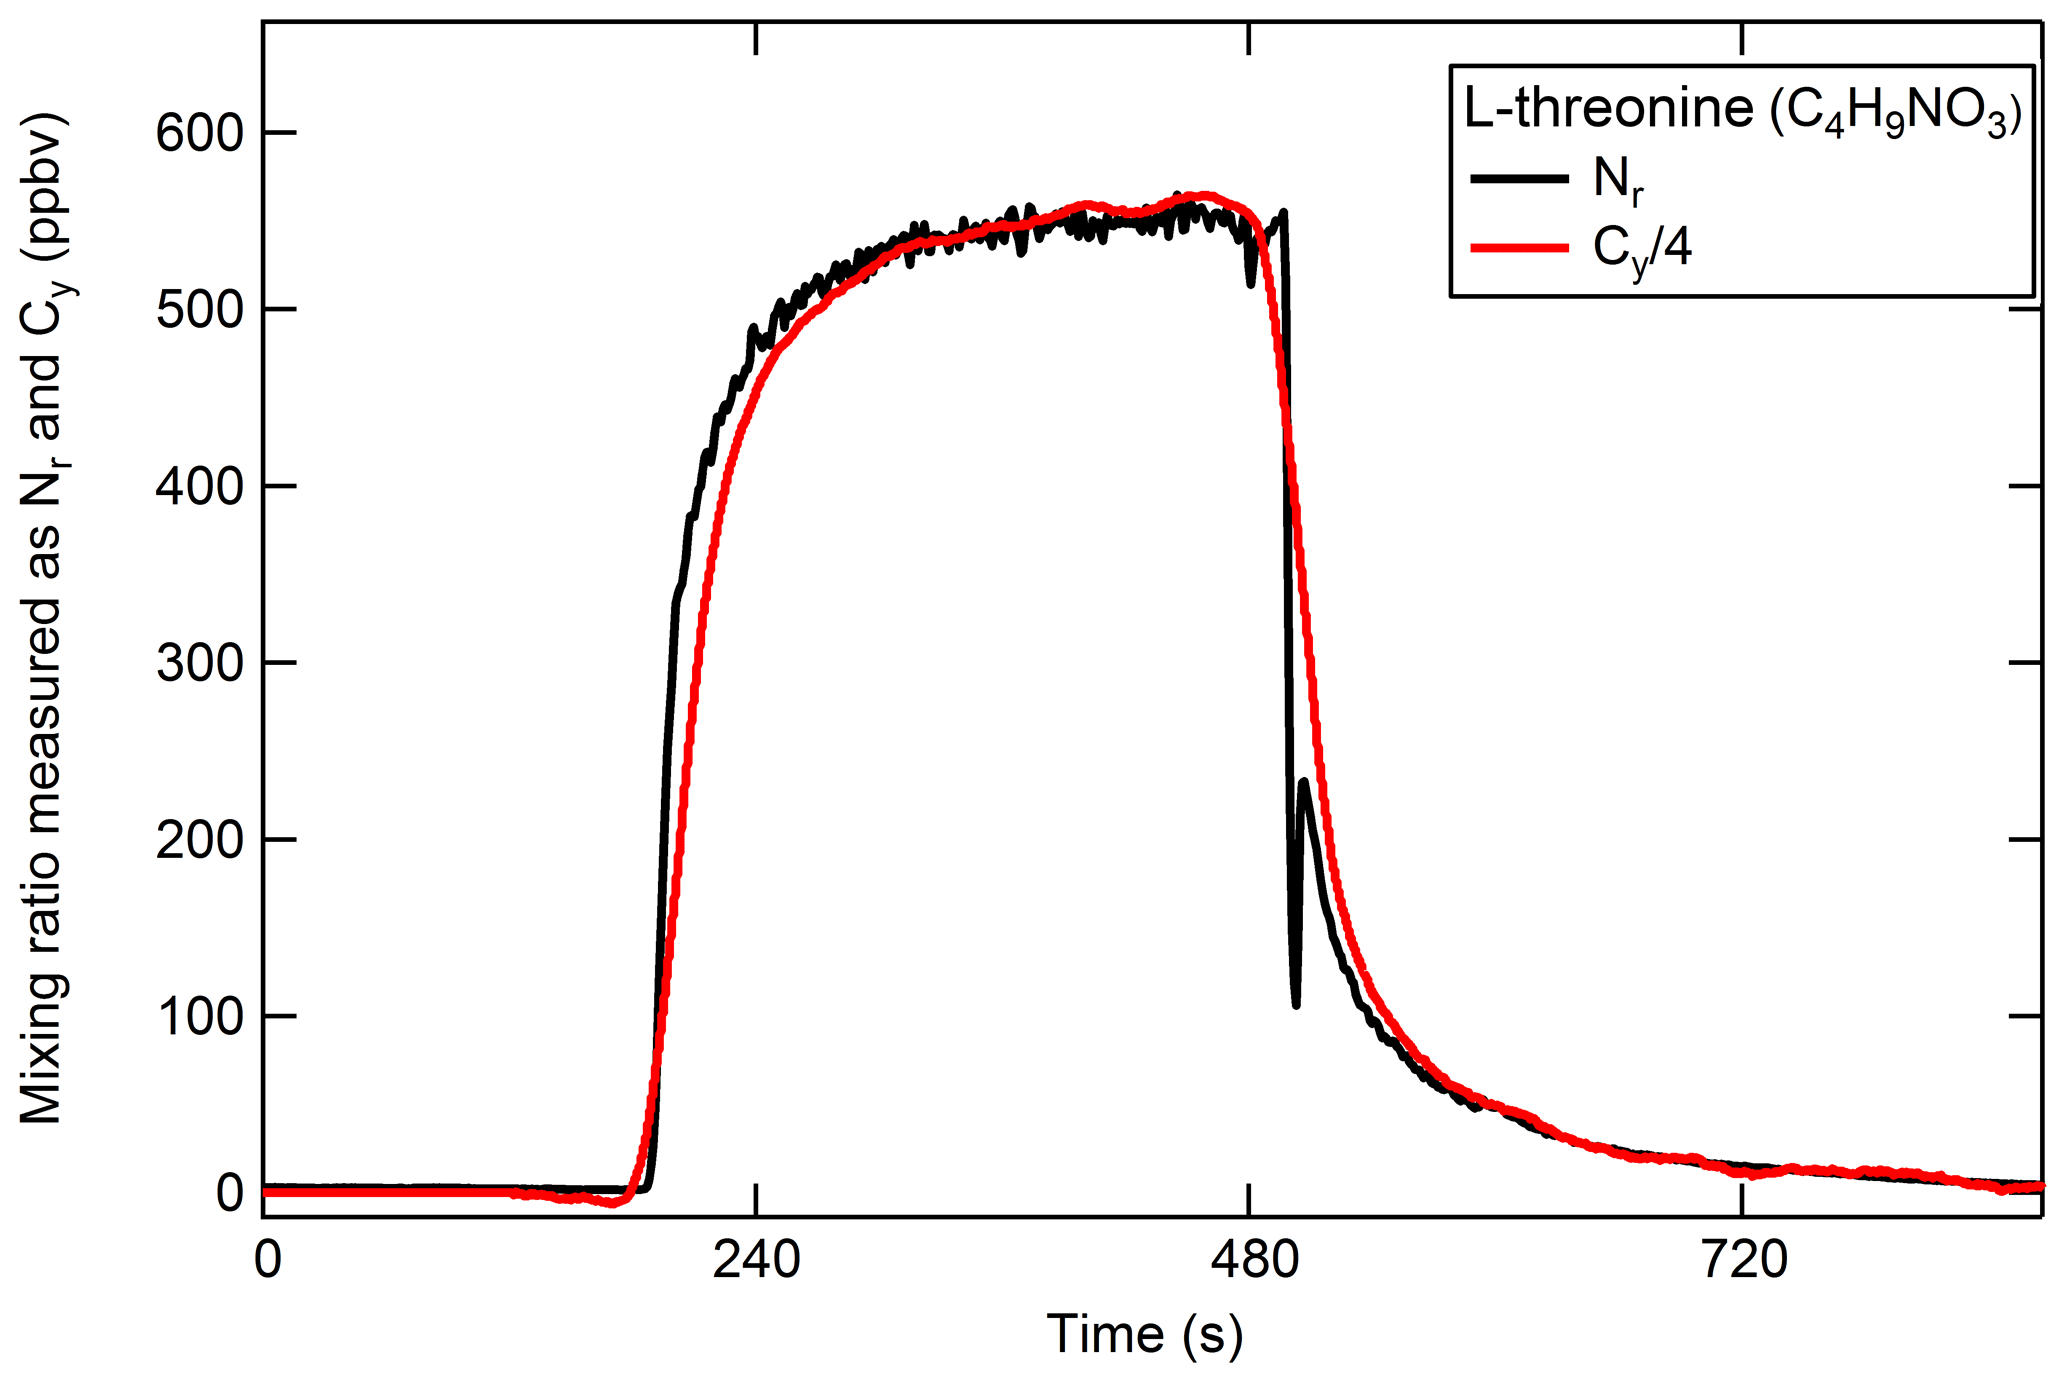
Figure 6An example of the quantitative conversion of atomized polydisperse threonine (C4H9NO3) to NO and CO2 measured using NO−O3 chemiluminescence and a LI-COR-6251, respectively. The measured total Cy (red) is divided by the number of C atoms in threonine (four).
3.4 Nr measurements of biomass burning emissions
As an example of both gas and particle measurements using the Nr system, we follow with a brief discussion of N emissions from biomass burning. The primary gaseous N compounds in biomass burning plumes include NO, NO2, N2, NH3, and to a lesser extent HCN, CH3CN, HONO, HNCO (Lobert et al., 1990, 1991; Kuhlbusch et al., 1991; McMeeking et al., 2009; Burling et al., 2010; Stockwell et al., 2014, 2015), and other Nr-containing gases. Figure 7 shows results obtained from a representative fire (Fire 047) from the Fire Influence on Regional and Global environments Experiment (FIREX) 2016 Missoula Fire Lab study (https://www.esrl.noaa.gov/csd/projects/firex/, last access: 6 May 2018). Figure 7a shows the co-measured Nr and NO concentrations (ppmv). The majority of the Nr system's response is due to the sum of gas-phase Nr constituents that were measured by a FTIR spectrometer (Selimovic et al., 2018), an H3O+ chemical ionization mass spectrometer (Koss et al., 2018), and a broadband cavity-enhanced extinction spectrometer (Min et al., 2016) (Fig. 7b). At the beginning of the burn (before 10:23 MST) the average relative percent difference between the total nitrogen signal and the sum of individually measured gas-phase compounds is ∼ 16 %, which is less than the combined error of the individual measurements. There is greater disagreement shown in Fig. 7c (difference is up to ∼ 1 ppmv; up to ∼ 50 % relative percent difference) during other stages of the fire. The modified combustion efficiency (MCE) is a measure to estimate the relative contribution of flaming and smoldering combustion that occurred over the course of a fire, where the MCE is defined as the ratio of ) (Yokelson et al., 1996). A higher MCE value (approaching 0.99) designates relatively pure flaming combustion (more complete oxidation), and a lower MCE (∼ 0.75–0.84) designates more smoldering combustion. We have shown in our laboratory experiments that there is quantitative Nr particle conversion across the Nr catalyst; therefore, it is possible that the residual signals are due to particulate N-containing compounds. Particulate ammonium may contribute to the excess Nr signal measured during periods dominated by smoldering combustion (MCE < 0.90). The oxidized N-containing gas-phase species are relatively more abundant during the initial part of the fire; thus particulate nitrate could account for some Nr signal during the flaming-dominated stages as shown in Fig. 7. By confirming particulate Nr conversion in this system, it is possible that a total N budget can be reconstructed for additional laboratory fires measured during the FIREX laboratory study where individual particle-phase Nr data are available.
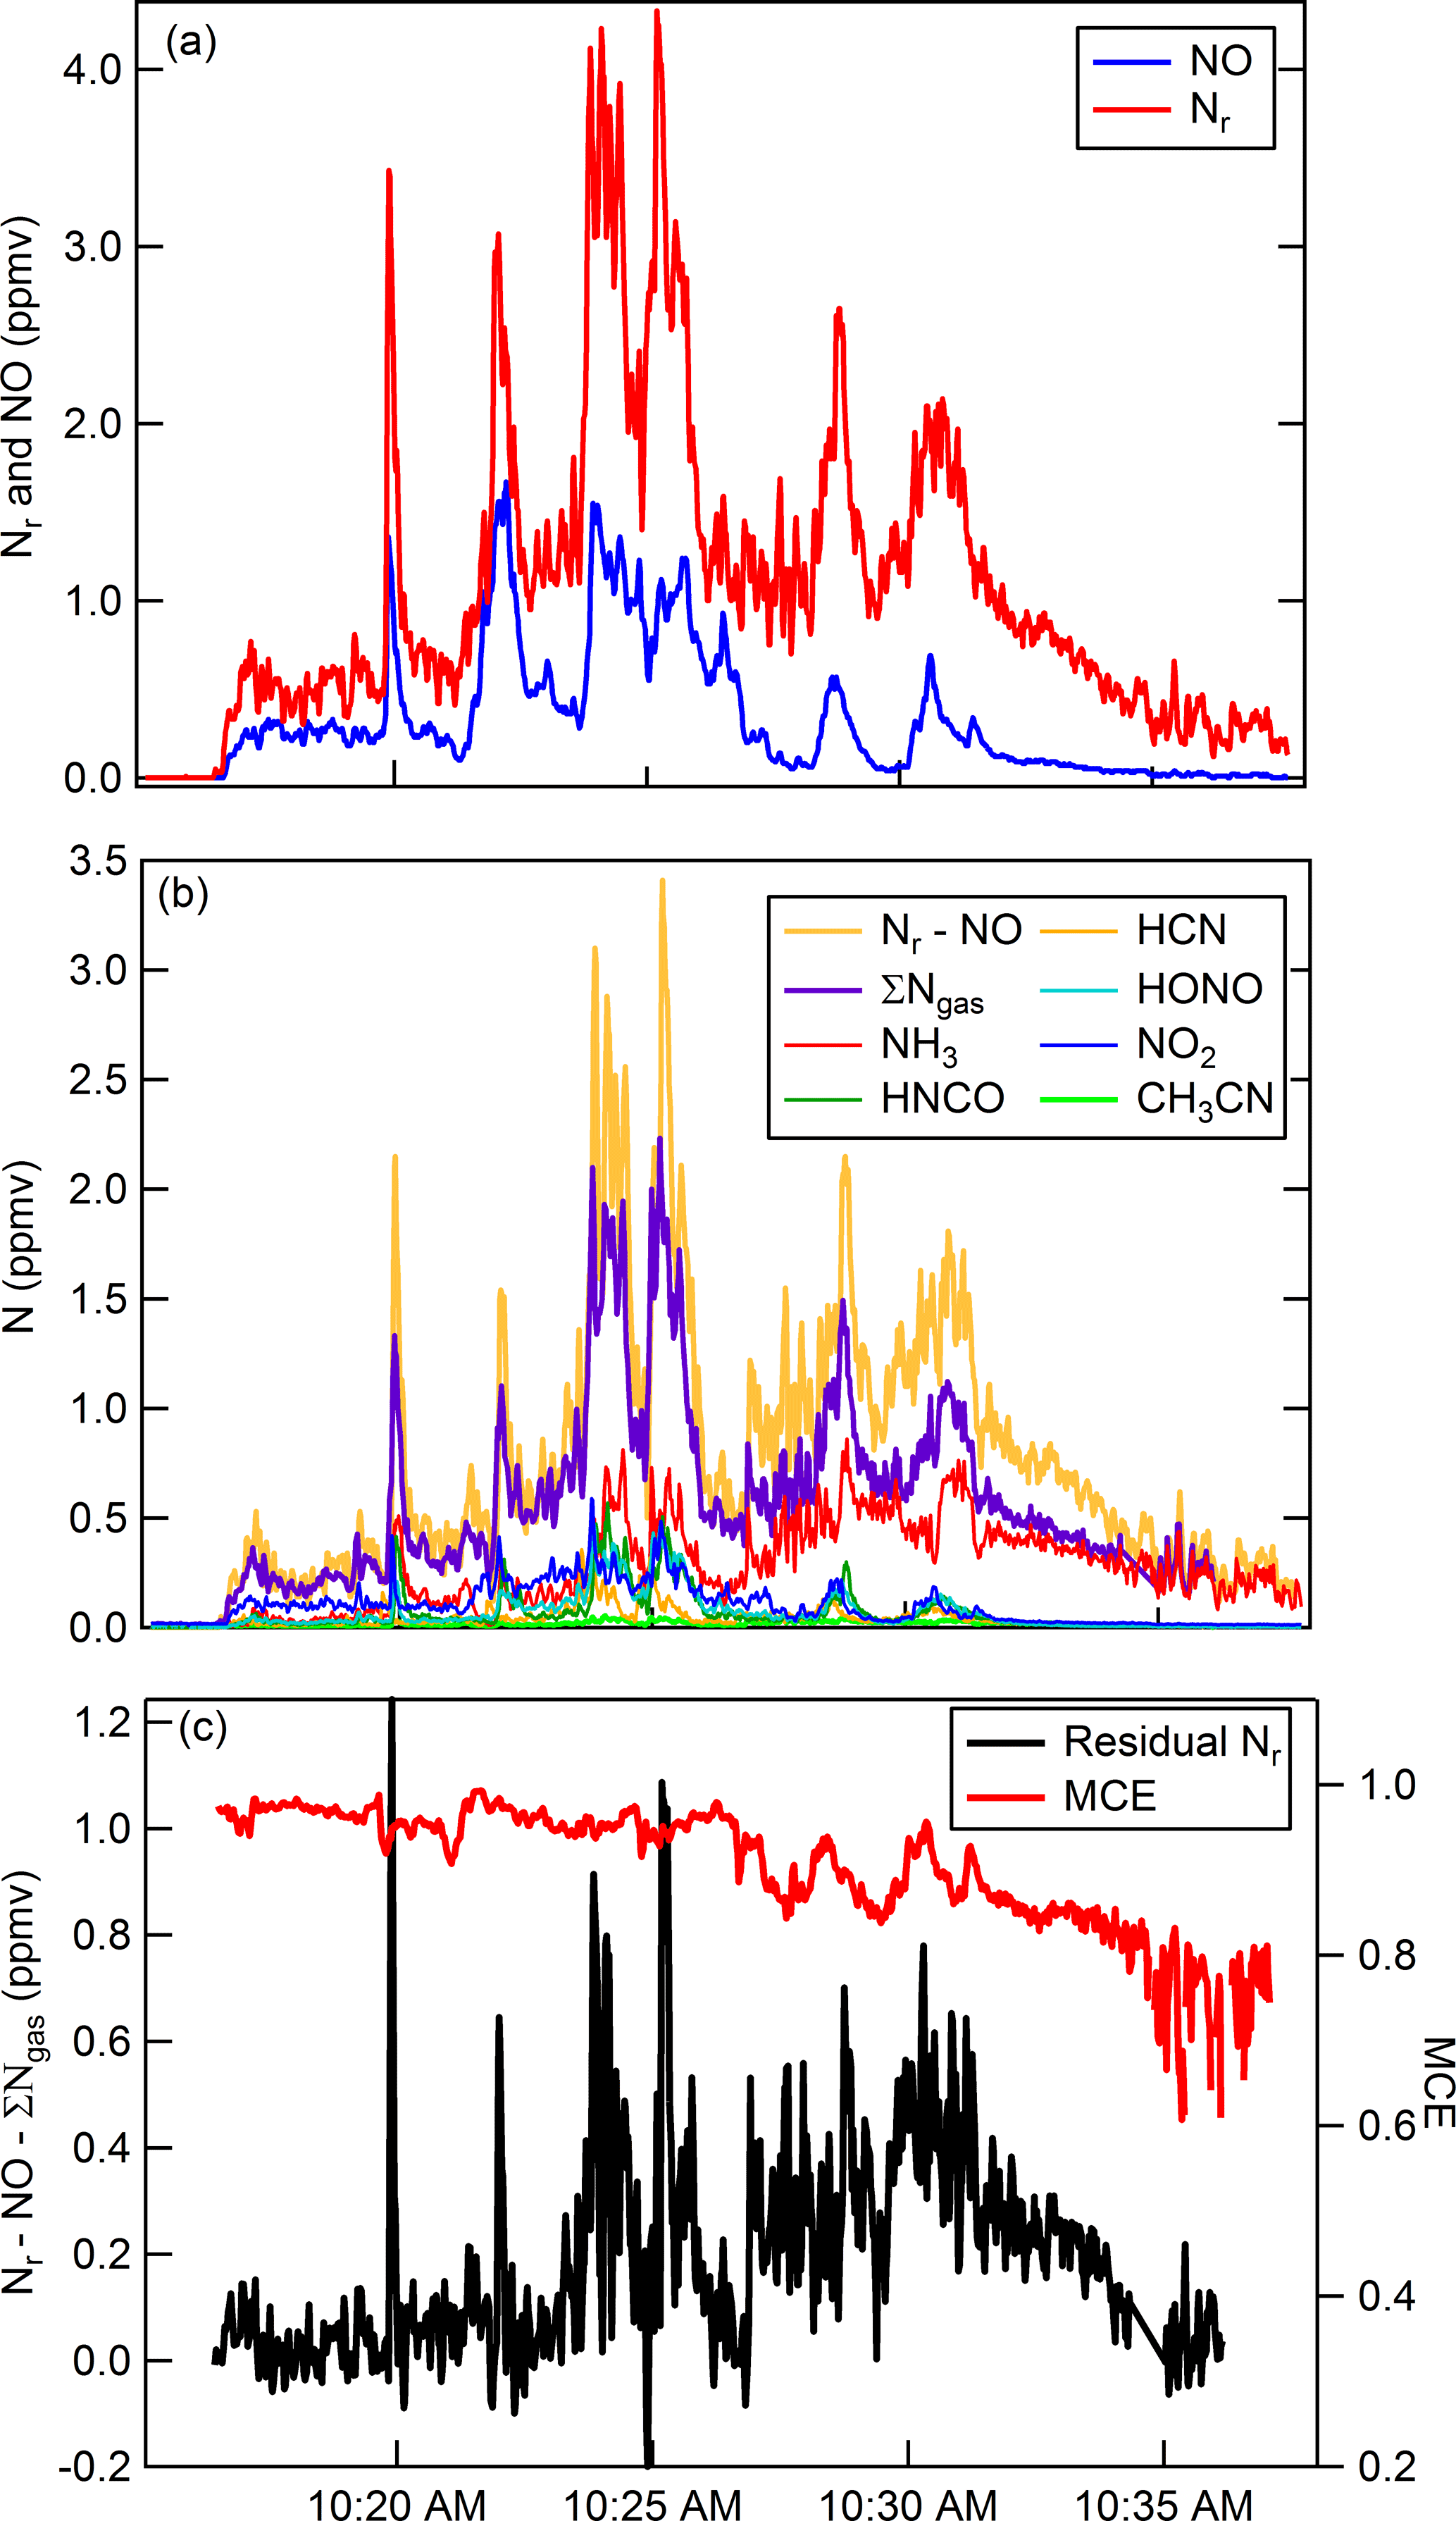
Figure 7Time series for Fire Sciences Lab 2016 measurements of emissions from a subalpine fir canopy sample (Fire 047). (a) Total reactive nitrogen (Nr, red) and nitric oxide (NO, blue) measurements. (b) Comparison of the difference (Nr-NO, gold) with the sum of the measured gas-phase Nr species (purple). The sum of individually measured gas-phase species in order of abundance include NH3, HNCO, HCN, HONO, NO2, CH3NO2, and 40 minor organic nitrogen species. NO2 and HONO were measured with a broadband cavity-enhanced extinction spectrometer, HCN and NH3 were measured with a FTIR spectrometer, and all remaining organic species were measured with a H3O+ CIMS. (c) Residual Nr (black) in parts per million volume with modified combustion efficiency overlaid (MCE, red).
Here we demonstrate the capability of the total nitrogen system as an independent calibration method for other aerosol measurement systems. Nr measurements of laboratory-generated single-component inorganic and organic aerosol particles were used to characterize the PILS–ESI/MS. The strength of using the Nr system to calibrate the PILS–ESI/MS and other aerosol mass instruments is that it is a direct method to calibrate the entire coupled online system. The current calibration approach for nearly all detectors used with the PILS involves liquid-phase standards to calibrate the detection method independently from the PILS.
The inorganic salts selected for the comparison between the Nr and the PILS–ESI/MS instruments all contained N atoms, either in the cation, anion, or both. The total Nr measured as NO (ppbv) included all the N atoms atomized from the single-component solution. Dividing the total Nr measurement by the number of N atoms in the parent molecule gives the standard concentration (ppbv) of the corresponding anion (e.g., Cl−, , , ). The mixing ratios (ppbv) are converted to micrograms per cubic meter from the molecular weight of the corresponding anion. We refer to these mass concentrations as “X measured as equivalent Nr” in the remainder of the text, where X is the corresponding anion of the aerosol particle. The anion mass calculated in this way was only necessary when comparing directly to PILS–ESI/MS measurements of ammonium salts of nitrate, sulfate, chloride, and oxalate.
Nr and PILS–ESI/MS mass concentration comparisons
To compare to the calibration approaches using liquid-phase standards described in Sect. 2.1.3 for the PILS–ESI/MS, we performed particle mass comparisons using these methods with anion-specific mass concentrations derived from the Nr measurement system. A single-component aerosol was used to minimize complex matrix effects including ion suppression and enhancement common in ESI.
An example of the Nr system and PILS–ESI/MS co-sampling a laboratory-generated polydisperse aerosol stream is shown in Fig. 8. Here we did not size-select aerosols but measured all particle sizes below a 2.5 µm cutoff (URG cyclone, Chapel Hill, NC). There are two reasons for this experimental setup: (1) generating a sufficient aerosol mass concentration to calibrate the PILS–ES/MS was challenging because it requires a minimum flow of 11 L min−1, while the DMA output flow is < 1 L min−1; therefore the DMA aerosol flow required a large dilution. (2) Conventionally, the PILS instrument samples with a cyclone with a 1 or 2.5 µm cutoff, which is similar to other mass measurement instruments including the aerosol mass spectrometer (AMS) and filter collection.
Figure 8 shows the aerosol nitrate (blue) trace from NaNO3 particles measured by the PILS–ESI/MS shifted in time to account for the system delay time so that it aligns with the relatively steady concentration periods with the Nr trace (black). The PILS–ESI/MS had a response time of roughly 4–5 min in its current configuration. Several stages in the PILS system included mixing volumes (e.g., syringe pumps and mixing vessels) that prevented rapid response to rapidly changing concentrations and smeared the response. For instrument comparisons 60 s data were averaged and compared during periods with relatively steady concentrations (generally lasting 5–10 min). Examples of PILS–ESI/MS traces aligned such that the initial response of both instruments coincides and is shown in Fig. S2.
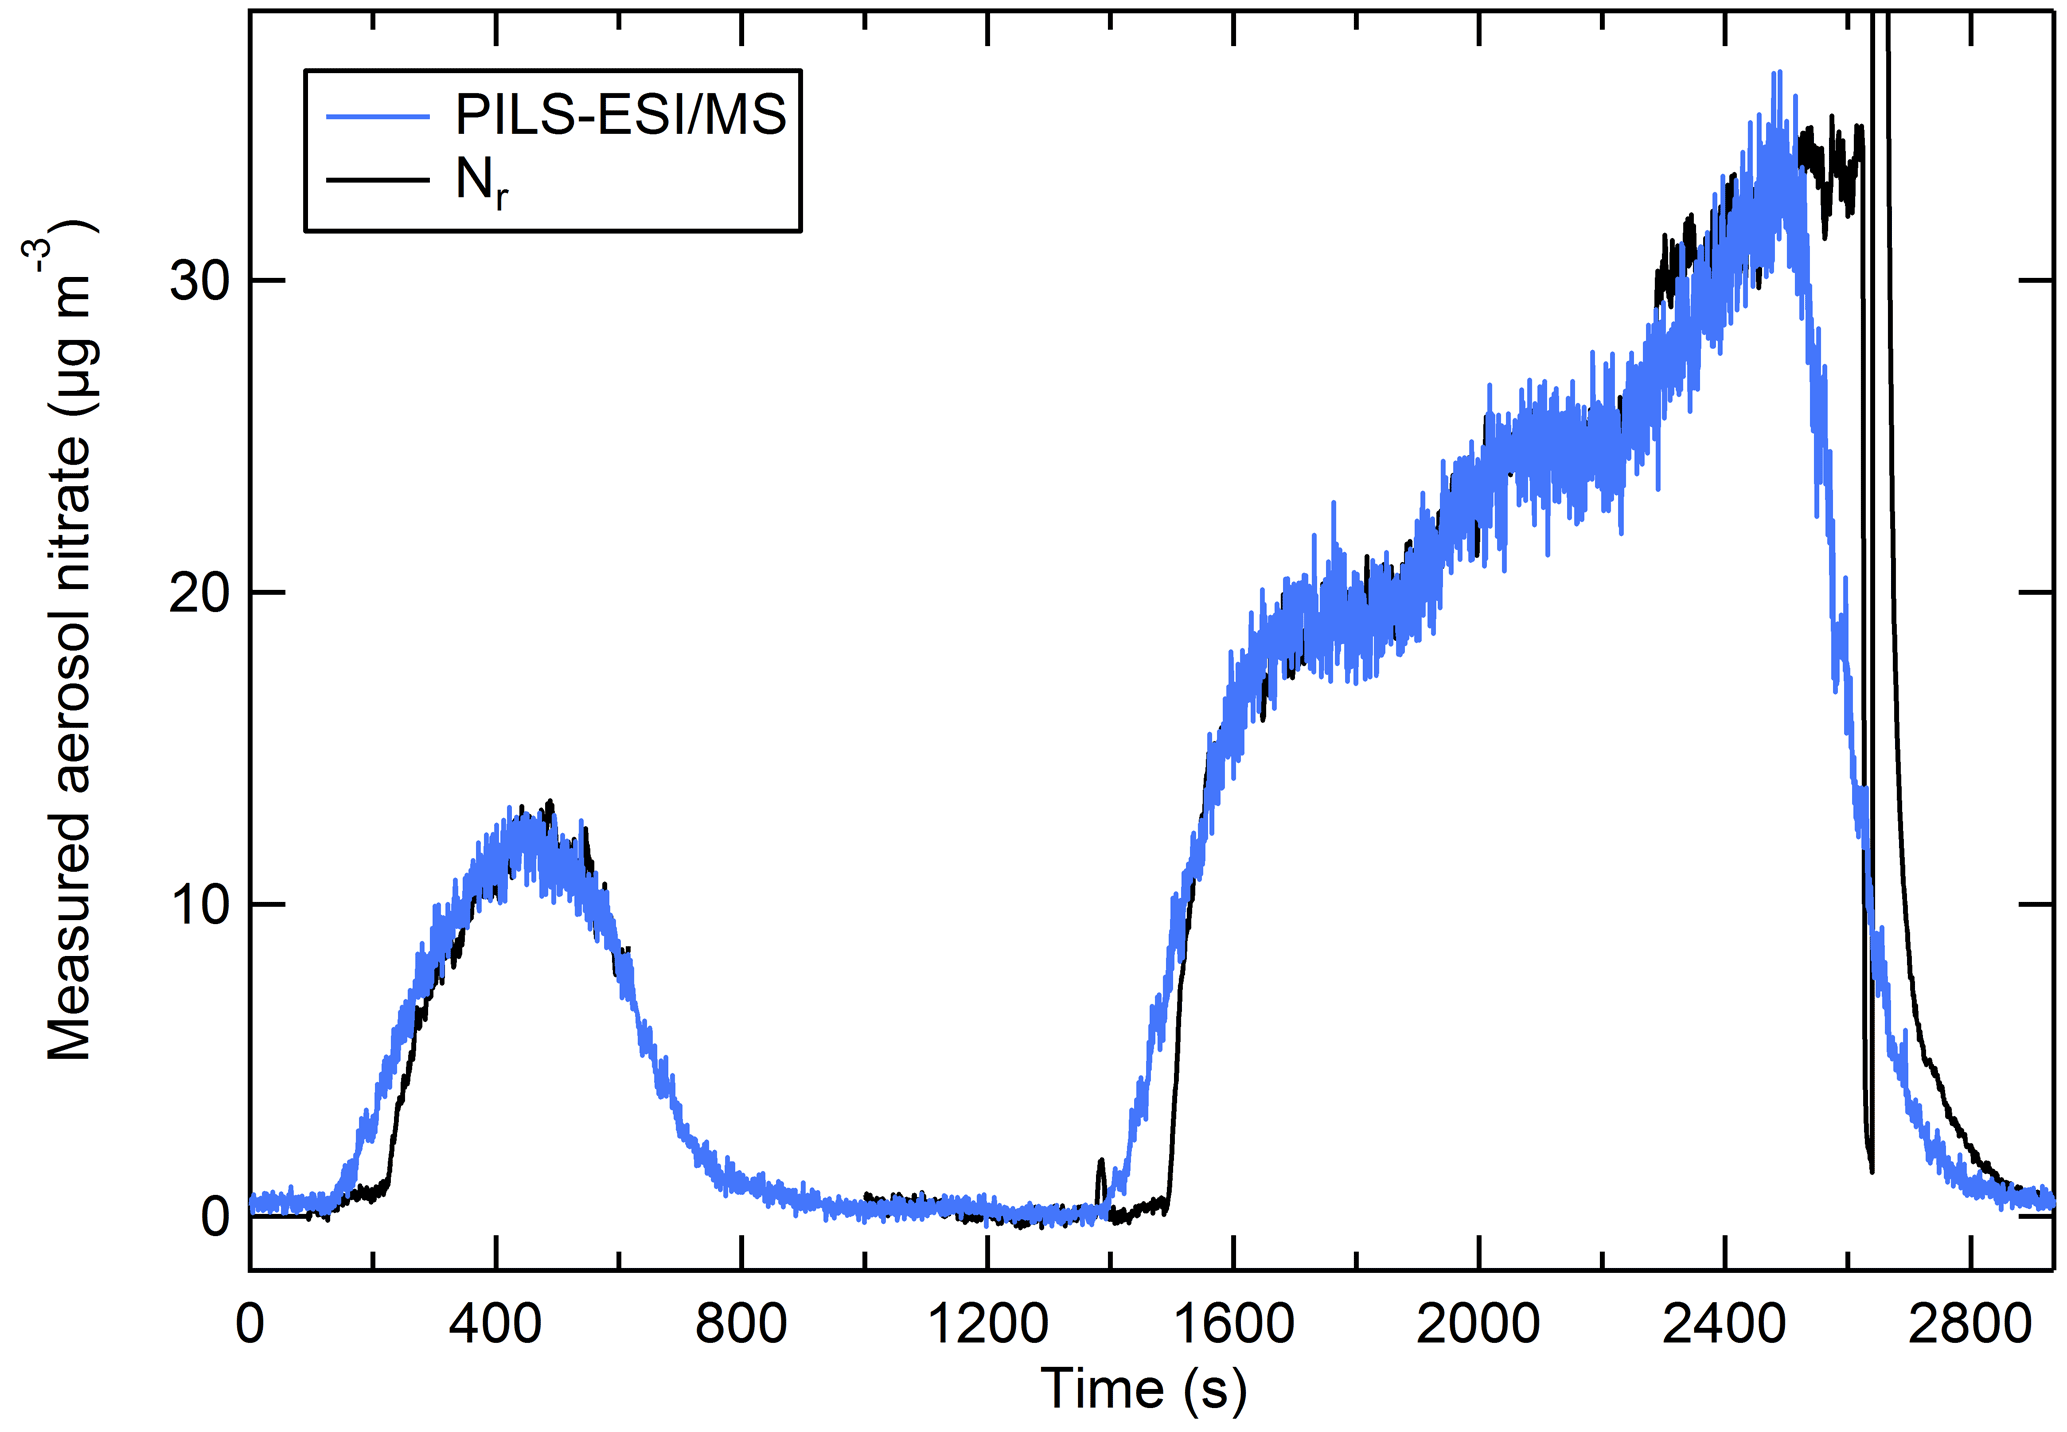
Figure 8The PILS–ESI/MS-measured aerosol nitrate mass (blue) and the nitrate measured as Nr (black) (µg m−3) for an atomized solution of NaNO3 (polydisperse). The PILS–ESI/MS trace is shifted to account for the delayed response and the instrument time constant.
The correlation plot of PILS–ESI/MS to equivalent anion mass measured as Nr for each aerosol type (NaNO3, (NH4)2SO4, NH4Cl, and NH4NO3) is shown in Fig. 9a–d. The concentrations ranged from ∼ 10 to 120 µg m−3 and the standard linear regression fits for each aerosol type are included in Fig. 9, and were highly correlated with a R2 = 0.99. For (NH4)2SO4, the concentration exceeded the linear dynamic range of the PILS–ESI/MS for sulfate (see Fig. S2a; > 130 µg m−3) as determined by liquid-standard calibration curves. The linear range of ESI is limited at high concentrations due to limited surface sites available for ionization (Tang et al., 2004). For this reason values outside the linear dynamic range of the PILS–ESI/MS (> 130 µg m−3) for sulfate were excluded from the linear regression fit. NH4NO3 shows a similar, less pronounced trend; however, it is still included in the regression plot as it was difficult to isolate whether this was analyte suppression during electrospray ionization or a linear dynamic range issue. Based on the regression fits in Fig. 9, the difference between the PILS–ESI/MS and Nr system for each inorganic component is less than 6 %. The uncertainty in the ESI signal varies by compound and averaging time; however from the tests described here the maximum uncertainty is estimated at ∼ 15 %. Combining this uncertainty with the uncertainty in the ESI calibrations (maximum ±10 %), the air and liquid flow rate (both ∼ ±4 %) and dilution (∼ ±5 %) in quadrature gives a total maximum uncertainty associated with mass measurements of ±20 %. Thus, while the slope of the correlations of the two instruments (based on 60 s averages during periods with constant concentrations) shows a relative difference of less than ∼ 6 %, the uncertainty in the PILS/ESI measurement of single-component aerosols is closer to ∼ 20 % and could be greater if the transmission and ionization efficiencies of the ESI differ from the efficiencies present during calibration periods. This uncertainty is greater than the uncertainty (±10 %) reported for the PILS–IC instrument for ionic species in Weber et al. (2001) but lower than the AMS uncertainty for nitrate (33 %) and sulfate (35 %) estimated by Bahreini et al. (2009), though the AMS has a much faster time response.
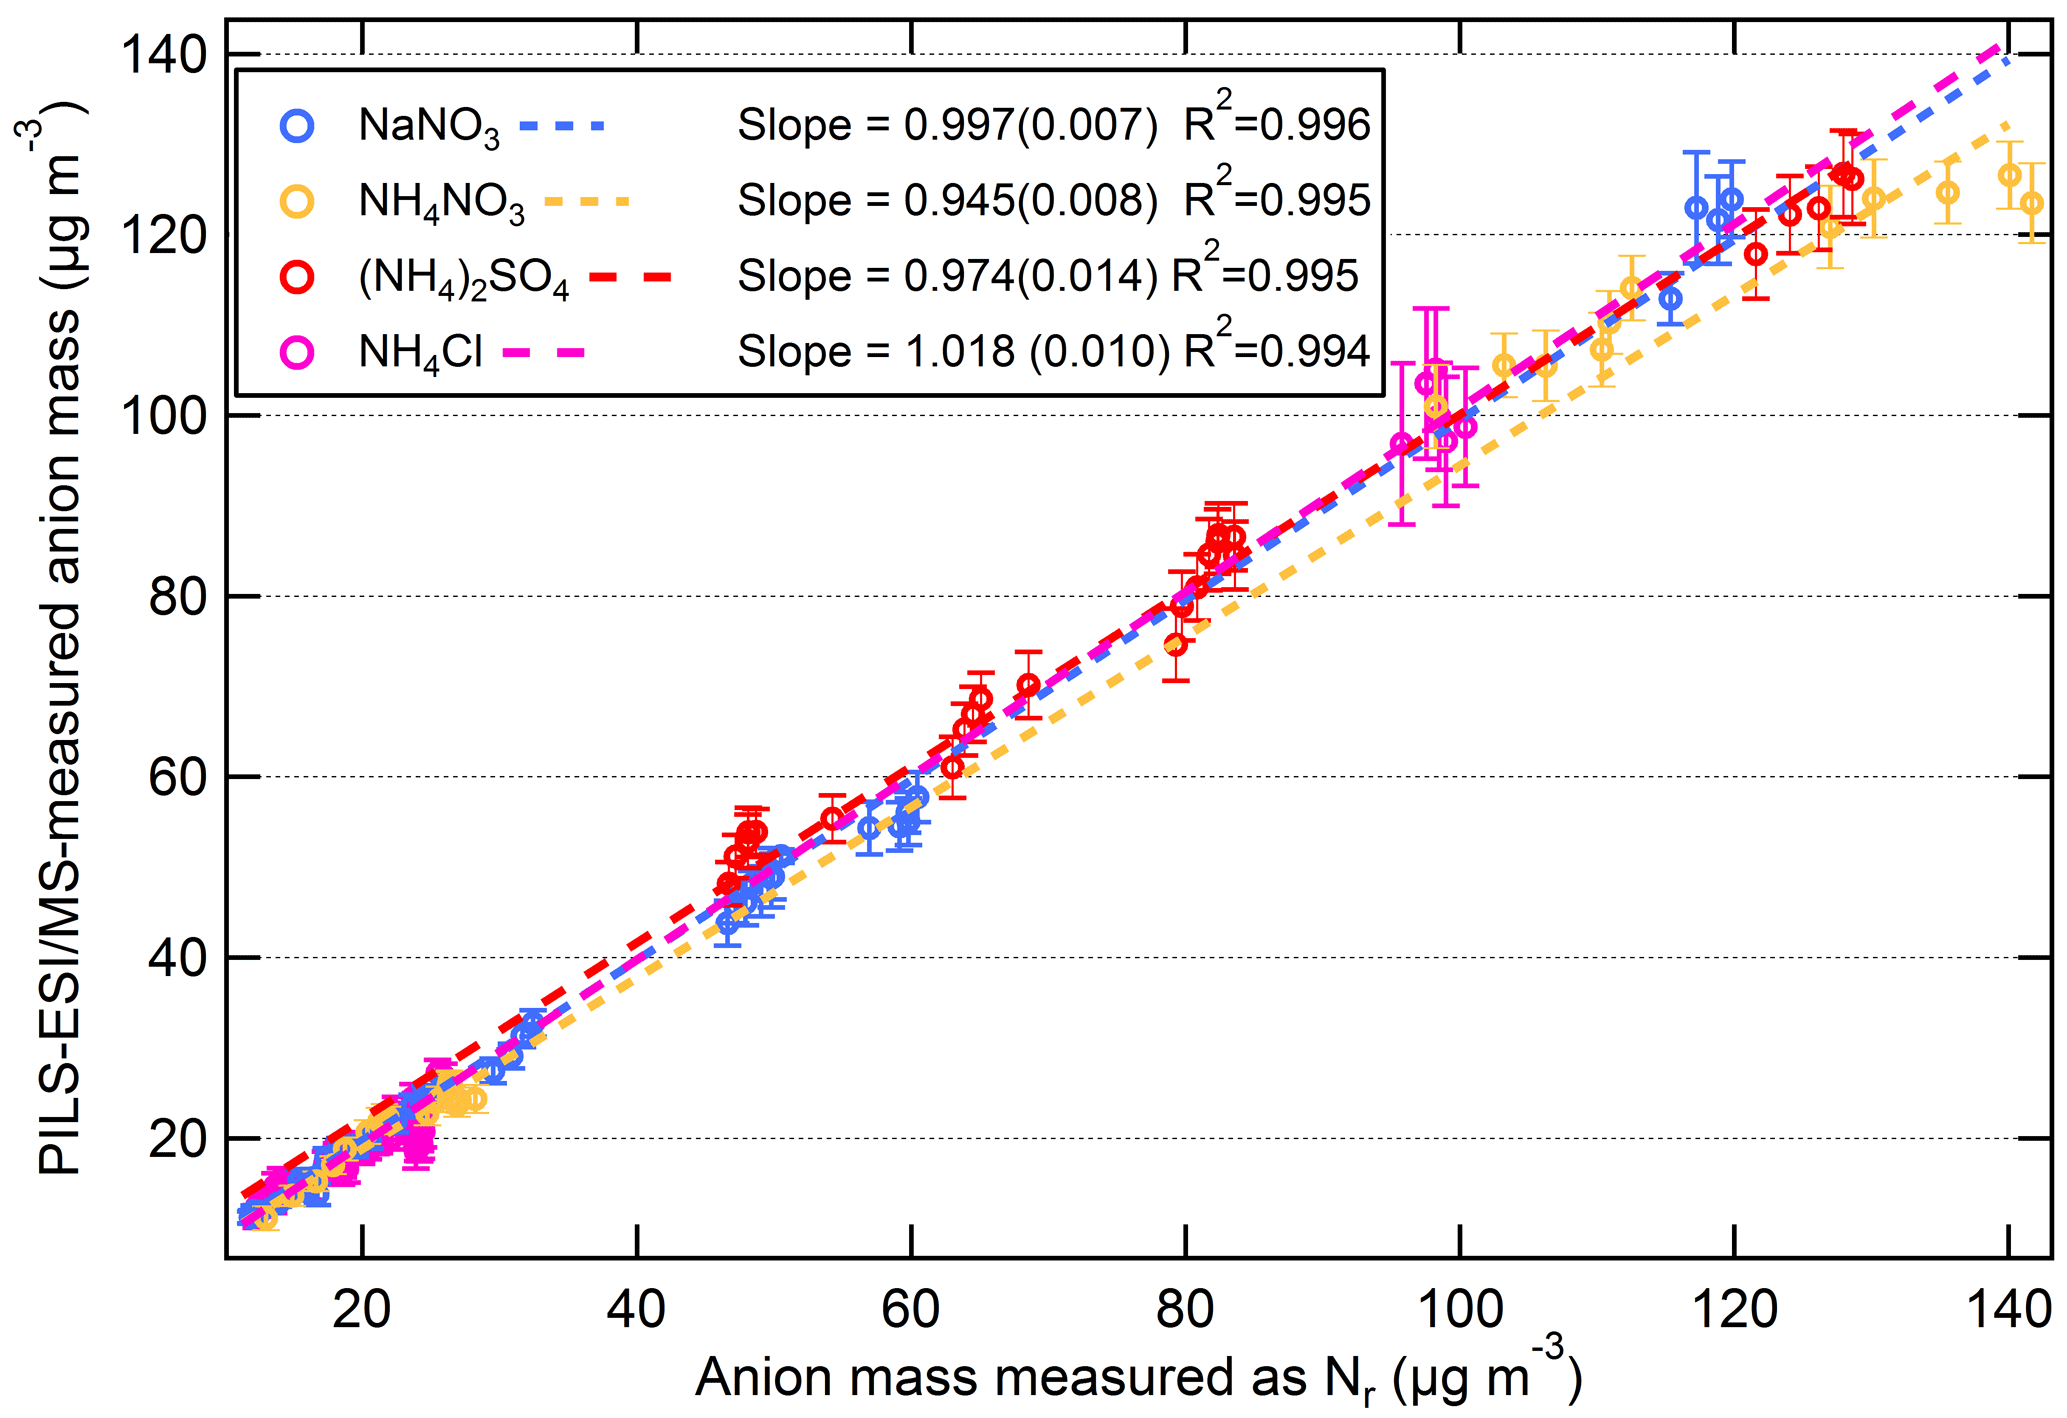
Figure 9Scatter plots of PILS–ESI/MS measured versus equivalent anion mass measured as Nr for salts NaNO3 (blue), NH4NO3 (gold), (NH4)2SO4 (red), and NH4Cl (magenta). The data are 60 s averages and only include times when the atomized aerosol output was relatively constant (i.e., not when concentrations were rising or falling). The slope (1σ) and R2 are shown.
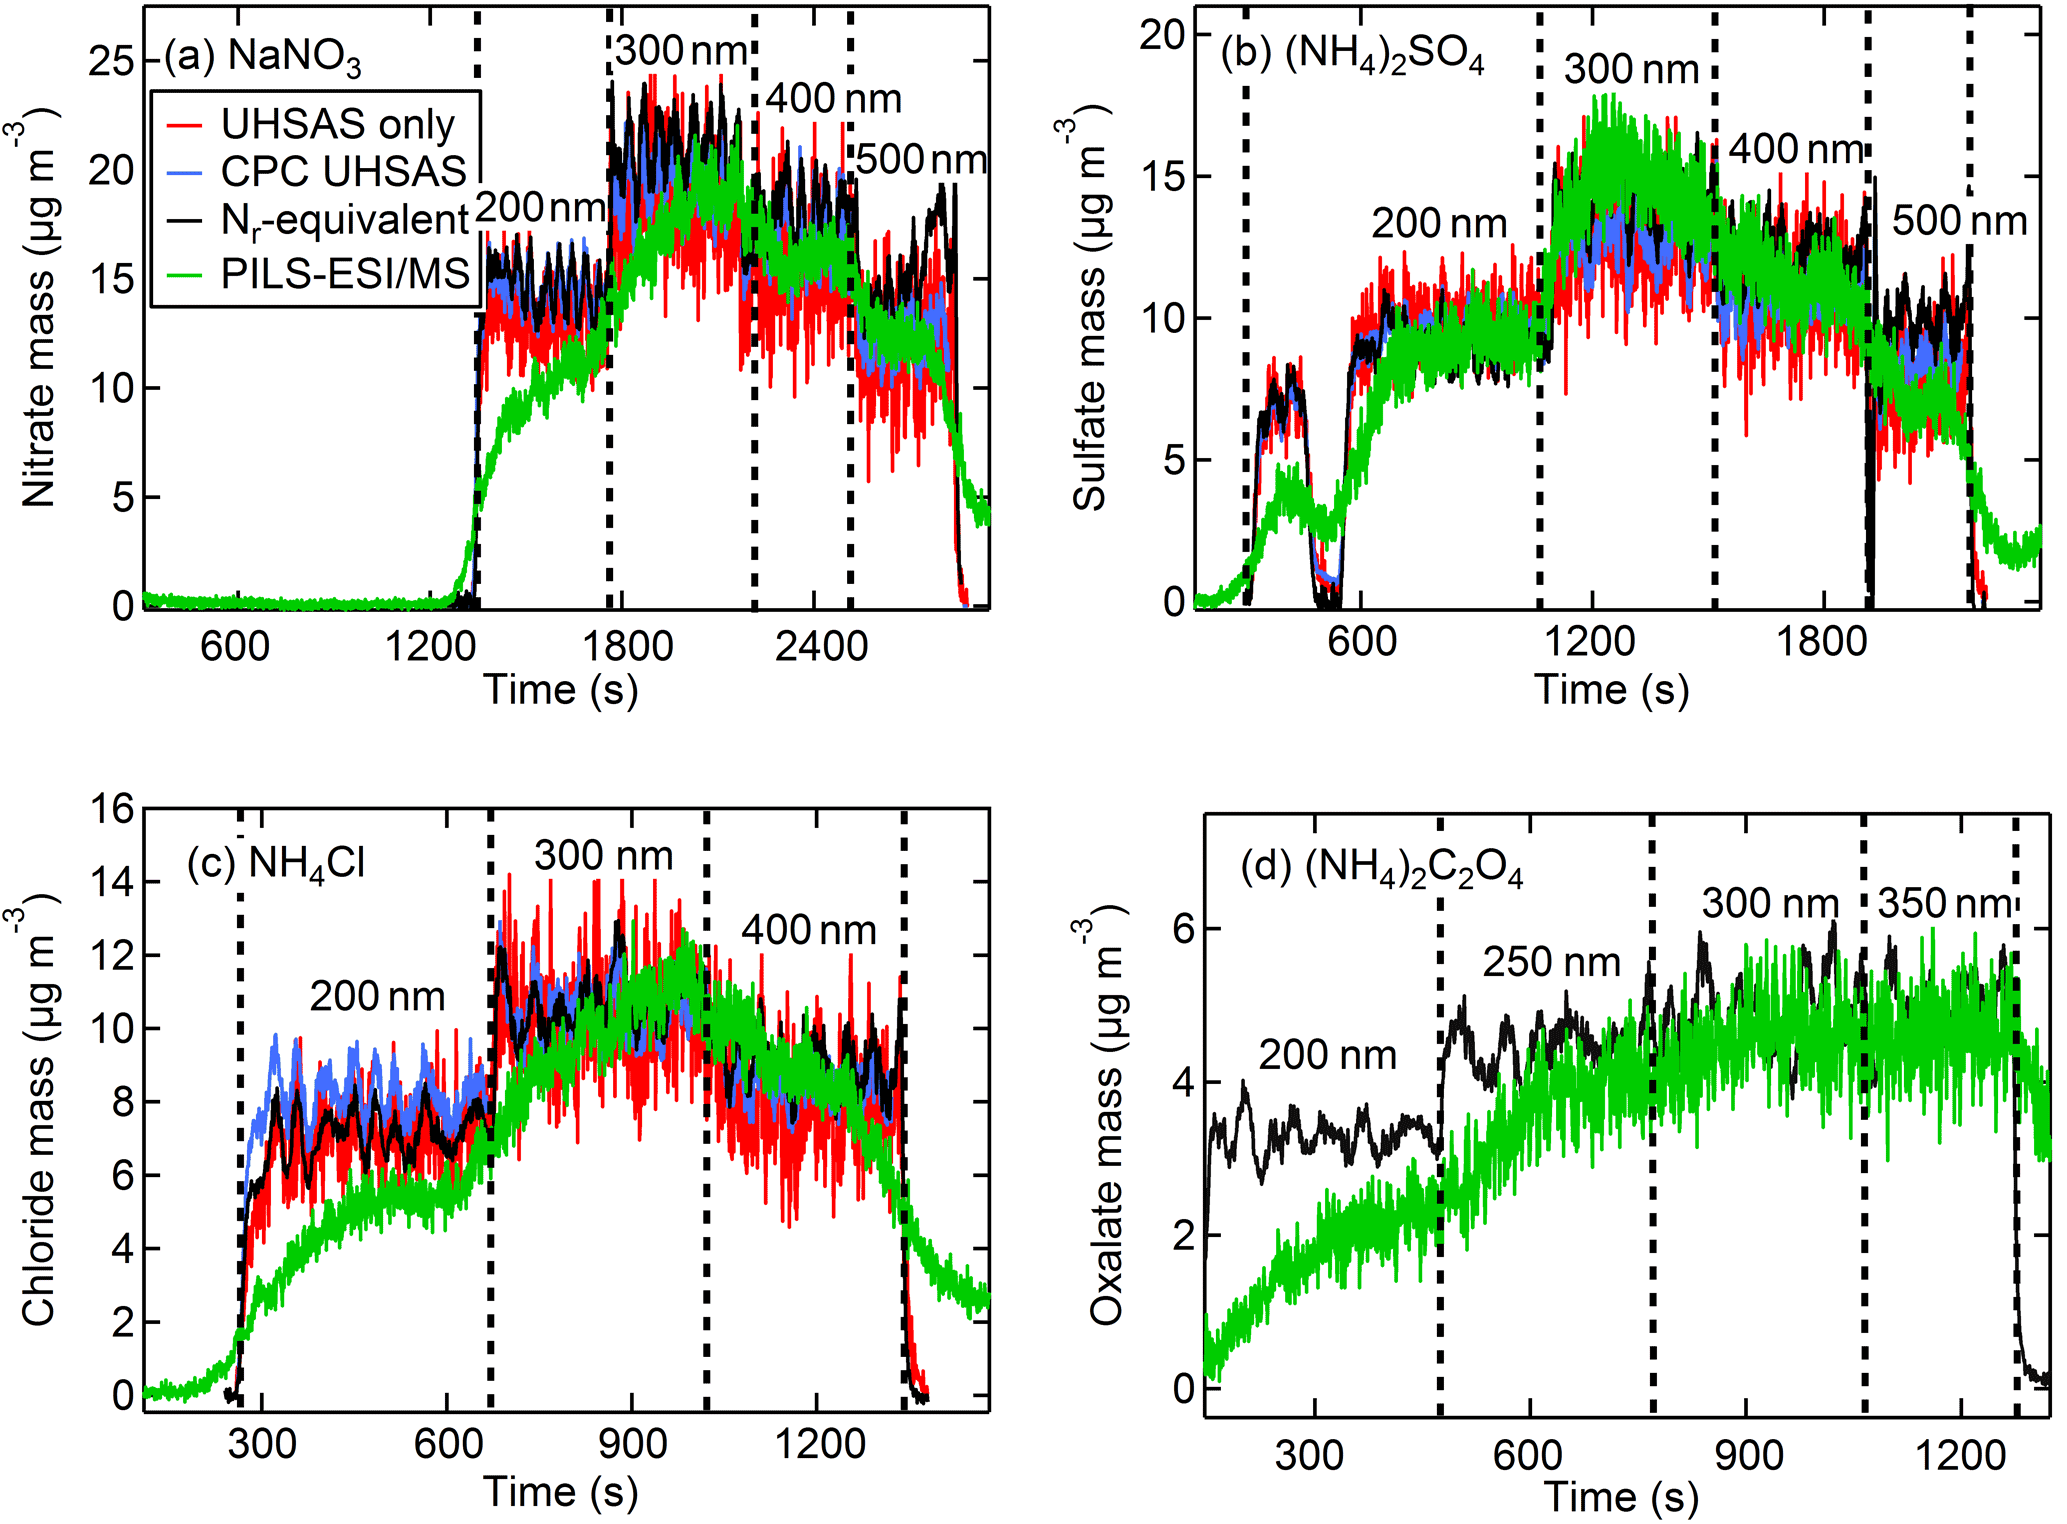
Figure 10The Nr-measured (black) CPC number with UHSAS size (blue) calculated, UHSAS number and size (red) calculated, and PILS–ESI/MS-measured (green) aerosol concentrations (µg m−3) for anions of DMA size-selected aerosol for salts of (a) NaNO3, (b) (NH4)2SO4, (c) NH4Cl, and (d) (NH4)2C2O4. The PILS–ESI/MS traces were shifted in time several minutes early to account for the delayed instrument response time.
Even though greater aerosol particle mass could be produced by directly sampling the polydisperse output of the atomizer, our analysis also included measurements using the DMA size-selected output. During these tests the flow was divided between the Nr system, CPC, UHSAS, and PILS–ESI/MS with a large dilution flow that resulted in turbulent mixing (Re > 4000). The CPC and UHSAS particle number concentrations showed improved agreement with turbulent mixing compared to earlier differences of up to 10 % at high concentrations discussed in Sect. 2.2.2 and were within a few percent of each other. Examples of the real-time temporal profiles for these measurements are shown in Fig. 10a–d with the PILS–ESI/MS time offset by several minutes to account for its delayed response. The calculated and measured aerosol mass time traces in Fig. 10 show agreement for all measurement techniques tested in this study. The figures indicate that the PILS–ESI/MS was not given sufficient time to rise to a steady constant concentration for the first diameter selected. This is confirmed in Fig. 10b when 200 nm particles were size selected twice in succession, with the first selection lasting only ∼ 2 min before flushing with water quickly followed by a longer period of sampling at the same diameter. The PILS–ESI/MS concentration during this longer sampling period does reach the expected concentration as indicated by the Nr (black) and CPC (blue) concentrations. The time series of oxalate in Fig. 10d shows agreement for the equivalent Nr- and PILS–ESI/MS-measured mass, indicating these same calibration methods are effective for organic compounds, although the UHSAS was not sampling during this experiment. We conclude that the PILS–ESI/MS quantitatively measures single-component inorganic aerosol for a range of sizes; however, the low particle throughput hindered our ability to evaluate the quantitative abilities of the PILS–ESI/MS system for particles < 200 nm diameter.
These results establish the quantitative abilities of this novel configuration (PILS–ESI/MS) for sampling simple single-component laboratory-generated aerosol. However, our current ESI/MS calibration methods are sensitive to the experimental conditions, which must be precisely maintained during ESI calibrations and throughout the entire sampling period. Changes in flow rate, interface positioning, or solvent composition have significant impacts on both the transmission and ionization efficiency, ultimately effecting pre-determined ESI calibration factors. In general, PILS characterization has been limited to theoretical predictions or experimental comparisons that involve coupling the PILS with a mass analyzer (e.g., IC; Orsini et al., 2003; Sorooshian et al., 2006). Here we show experimentally that the Nr system can be used as a mass calibration method for pure Nr-containing polydisperse aerosol.
We report the successful application of a total reactive nitrogen (Nr) system for conversion of gas-phase and particle-bound Nr compounds. The Nr system was tested using laboratory-generated aerosol from solutions of (NH4)2SO4, NH4Cl, NaNO3, and (NH4)2C2O4. The particle conversion efficiency of each compound was calculated at each size-selected diameter by the ratio of the concentration measured as Nr to mass concentrations calculated from number concentration and size distribution measurements using a CPC and UHSAS. Overall, the particle conversion efficiency for a selection of Nr-containing aerosols ranged from 93 to 101 % with an overall estimated uncertainty of ∼ 10 %. The Nr particles tested span the range of N oxidation states, and therefore we are confident these results extend to other Nr-containing particles. Most catalyst-based Nr systems measure total gas-phase Nr-only, individual Nr compounds (e.g., NH3), or ignore the contribution of particulate Nr to total signal completely. However, it is useful to measure the total unspeciated Nr signal, which includes both gases and particles, to improve our understanding of total N emissions and their deposition, loss, and availability in ecosystems (e.g., McCalley and Sparks, 2009). We have presented a rapid, robust measurement technique that quantitatively measures particle Nr mass that allows for accurately interpreting ambient measurements and allows improved mass closure of the N budget to be constructed for the 2016 Fire Sciences Laboratory measurements of wildfire emissions. Future applications of this custom system aim to distinguish gas- and particle-phase nitrogen contributions from total measured Nr signal using upstream filters and denuders.
Additional characterization tests showed the platinum catalyst in the Nr system quantitatively converts both gaseous- and particulate-organic carbon (OC) to CO2 to within the propagated uncertainties of each detection method (±10 % each). The resulting Nr and Cy signals from each detector are in proportion with the number of carbon and nitrogen atoms in the parent molecule. In order for this to be a reliable total particulate carbon measurement system under ambient conditions, a highly accurate and precise CO2 measurement system is imperative to measure the signal above ambient CO2, CO, and CH4 backgrounds. Alternatively, ambient gas-phase constituents could be effectively eliminated from the sampling matrix. For these reasons, the application of the system is currently limited to calibration of single-component OC- and/or Nr-containing particles.
After establishing efficient conversion of Nr particles, we experimentally demonstrated that the Nr conversion technique can be used to calibrate aerosol particle mass measurement methods when sampling pure Nr-containing polydisperse aerosol. The Nr equivalent mass measurements of pure atomized polydisperse aerosol showed an agreement within ±6 % with the PILS–ESI/MS measurements of the corresponding anion for the salts (NH4)2SO4, NH4Cl, NaNO3, and NH4NO3. There is a clear advantage to calibrating the entire PILS–ESI/MS system altogether as this avoids complications arising from calibrating the ESI/MS and PILS independently. We conclude that the Nr system is an effective measurement technique that can be used to directly calibrate aerosol mass measurement instruments. With this direct mass calibration method, complications that arise due to optical (e.g., refractive index) and physical properties (e.g., morphologies) in particle number calibration methods are avoided. Additionally, this method is an online technique that provides a rapid measurement of particle mass unlike offline mass measurement methods such as filter analyses. The Nr converter described followed by NO and CO2 detection constitute a viable new approach for calibrating aerosol mass instrumentation for both N-containing and organic carbon particles.
The data from the laboratory tests are available on request. Data from the 2016 Missoula Fire lab are available here: https://esrl.noaa.gov/csd/groups/csd7/measurements/2016firex/FireLab/DataDownload/index.php?page=/csd/groups/csd7/measurements/2016firex/FireLab/DataDownload/ (National Oceanic and Atmospheric Administration, 2018). Authentication is required until approximately November 2018 and can be obtained by contacting either corresponding author.
The supplement related to this article is available online at: https://doi.org/10.5194/amt-11-2749-2018-supplement.
CES wrote the paper with help from JMR. CES performed the particle calibrations with help from RAW and AK. JMR and YL built the Nr catalyst and performed the tests to verify gas-phase conversion of Nr species. AMM advised on operation of the PILS. BW, RKT, and CES designed, constructed, and characterized the ESI interface. VS, RJY, KJZ, CW, and KS made measurements of individual N species during the FIREX campaign.
The authors declare that they have no conflict of interest.
Mention of commercial products is for identification purposes only and does not imply endorsements.
This work was supported by NOAA's Climate and Health of the Atmosphere
initiatives. Chelsea E. Stockwell acknowledges support from the National Research Council
Research Associateship Program. Bartlomiej Witkowski was supported by the Kościuszko
Foundation Program for Advanced Study, Research and/or Teaching in the
United States 2014–2015. Agnieszka Kupc is supported by the Austrian Science Fund
FWF's Erwin Schrodinger Fellowship J-3613. The FIREX Fire Lab study was
supported in part by the NOAA Climate Office's Atmospheric Chemistry, Carbon
Cycle, and Climate program. We thank Brad Hall for the use of his
nitrous oxide standard. We thank Staci N. Anthony and the Jarrold Group for
giving us an ion carpet board for the ESI interface. We thank Matthew Coggon, Abigail Koss, and Joost de Gouw for their H3O+ CIMS data
and Steven Brown for his cavity-enhanced spectrometer data. We would like to
thank Katherine Manfred, Alessandro Franchin, and Charles Brock for their
useful discussions.
Edited by: Hartmut Herrmann
Reviewed by: Jeffrey Collett and one anonymous referee
Anthony, S. N., Shinholt, D. L., and Jarrold, M. F.: A simple electrospray interface based on a DC ion carpet, Int. J. Mass Spectrom., 371, 1–7, https://doi.org/10.1016/j.ijms.2014.06.007, 2014.
Bahreini, R., Ervens, B., Middlebrook, A. M., Warneke, C., de Gouw, J. A., DeCarlo, P. F., Jimenez, J. L., Brock, C. A., Neuman, J. A., Ryerson, T. B., Stark, H., Atlas, E., Brioude, J., Fried, A., Holloway, J. S., Peischl, J., Richter, D., Walega, J., Weibring, P., Wollny, A. G., and Fehsenfeld, F. C.: Organic aerosol formation in urban and industrial plumes near Houston and Dallas, Texas, J. Geophys. Res., 114, D00F16, https://doi.org/10.1029/2008JD011493, 2009.
Bauer, S. E., Koch, D., Unger, N., Metzger, S. M., Shindell, D. T., and Streets, D. G.: Nitrate aerosols today and in 2030: a global simulation including aerosols and tropospheric ozone, Atmos. Chem. Phys., 7, 5043–5059, https://doi.org/10.5194/acp-7-5043-2007, 2007.
Bellouin, N., Rae, J., Jones, A., Johnson, C., Haywood, J., and Boucher, O.: Aerosol forcing in the Climate Model Intercomparison Project (CMIP5) simulations by HadGEM2-ES and the role of ammonium nitrate, J. Geophys. Res., 116, D20206, https://doi.org/10.1029/2011JD016074, 2011.
Benedict, K. B., Prenni, A. J., Carrico, C. M., Sullivan, A. P., Schichtel, B. A., and Collett Jr., J. L.: Enhanced concentrations of reactive nitrogen species in wildfire smoke, Atoms. Environ., 148, 8–15, https://doi.org/10.1016/j.atmosenv.2016.10.030, 2017.
Bohren, C. F. and Huffman, D. R.: Absorption and scattering of light by small particles, Wiley, New York, USA, 1983.
Breitenbach, L. P. and Shelef, M.: Development of a method for the analysis of NO2 and NH3 by NO-measuring instruments, J. Air Pollut. Contr. Assoc., 23, 128–131, https://doi.org/10.1080/00022470.1973.10469752, 1973.
Burling, I. R., Yokelson, R. J., Griffith, D. W. T., Johnson, T. J., Veres, P., Roberts, J. M., Warneke, C., Urbanski, S. P., Reardon, J., Weise, D. R., Hao, W. M., and de Gouw, J.: Laboratory measurements of trace gas emissions from biomass burning of fuel types from the southeastern and southwestern United States, Atmos. Chem. Phys., 10, 11115–11130, https://doi.org/10.5194/acp-10-11115-2010, 2010.
Cai, Y., Montague, D. C., Mooiweer-Bryan, W., and Deshler, T.: Performance characteristics of the ultra high sensitivity aerosol spectrometer for particles between 55 and 800 nm: Laboratory and field studies, J. Aerosol Sci., 39, 759–769, https://doi.org/10.1016/j.jaerosci.2008.04.007, 2008.
Canagaratna, M. R., Jayne, J. T., Jimenez, J. L., Allan, J. D., Alfarra, M. R., Zhang, Q., Onasch, T. B., Drewnick, F., Coe, H., Middlebrook, A., Delia, A., Williams, L. R., Trimborn, A. M., Northway, M. J., DeCarlo, P. F., Kolb, C. E., Davidovits, P., and Worsnop, D. R.: Chemical and microphysical characterization of ambient aerosols with the Aerodyne aerosol mass spectrometer, Mass Spectrom. Rev., 26, 185–222, https://doi.org/10.1002/mas.20115, 2007.
Cape, J. N., Cornell, S. E., Jickells, T. D., and Nemitz, E.: Organic nitrogen in the atmosphere-Where does it come from? A review of sources and methods, Atmos. Res., 102, 30–48, https://doi.org/10.1016/j.atmosres.2011.07.009, 2011.
Chen, B., T., Fletcher, R. A., and Cheng, Y.,-S.: Calibration of Aerosol Instruments, in: Aerosol Measurement: Principles, Techniques, and Applications, Third Edition, edited by: Kulkarni, P., Baron, P. A., and Willeke, K., John Wiley & Sons, Inc., Hoboken, NJ, USA, https://doi.org/10.1002/9781118001684.ch21, 2011.
Collins, D. R., Flagan, R. C., and Seinfeld, J. H.: Improved inversion of scanning DMA data, Aerosol Sci. Tech., 36, 1–9, https://doi.org/10.1080/027868202753339032, 2002.
Cornell, S. E.: Atmospheric nitrogen deposition: revising the question of the importance of the organic component, Environ. Pollut., 159, 2214–2222, https://doi.org/10.1016/j.envpol.2010.11.014, 2010.
DeCarlo, P. F., Slowik, J. G., Worsnop, D. R., Davidovits, P., and Jimenez, J. L.: Particle morphology and density characterization by combined mobility and aerodynamic diameter measurements. Part 1: Theory, Aerosol Sci. Tech., 38, 1185–1205, https://doi.org/10.1080/027868290903907, 2004.
Drewnick, F., Schwab, J. J., Hogrefe, O., Peters, S., Husain, L., Diamnon, D., Weber, R., and Demerjian, K. L.: Intercomparison and evaluation of four semi-continuous PM2.5 sulfate instruments, Atmos. Environ., 37, 3335–3350, https://doi.org/10.1016/S1352-2310(03)00351-0, 2003.
Dunlea, E. J., Herndon, S. C., Nelson, D. D., Volkamer, R. M., San Martini, F., Sheehy, P. M., Zahniser, M. S., Shorter, J. H., Wormhoudt, J. C., Lamb, B. K., Allwine, E. J., Gaffney, J. S., Marley, N. A., Grutter, M., Marquez, C., Blanco, S., Cardenas, B., Retama, A., Ramos Villegas, C. R., Kolb, C. E., Molina, L. T., and Molina, M. J.: Evaluation of nitrogen dioxide chemiluminescence monitors in a polluted urban environment, Atmos. Chem. Phys., 7, 2691–2704, https://doi.org/10.5194/acp-7-2691-2007, 2007.
Fahey, D., Eubank, C., Hübler, G., and Fehsenfeld, F.: Evaluation of a catalytic reduction technique for the measurement of total reactive odd-nitrogen NOy in the atmosphere, J. Atmos. Chem., 3, 435–468, https://doi.org/10.1007/BF00053871, 1985.
Fahey, D. W., Hübler, G., Parrish, D. D., Williams, E. J., Norton, R. B., Ridley, B. A., Singh, H. B., Liu, S. C., and Fehsenfeld, F. C.: Reactive nitrogen species in the troposphere: Measurements of NO, NO2, HNO3, particulate nitrate, peroxyacetyl nitrate (PAN), O3, and total reactive odd nitrogen (NOy) at Niwot Ridge, Colorado, J. Geophys. Res., 91, 9781–9793, https://doi.org/10.1029/JD091iD09p09781, 1986.
Farmer, D. K., Matsunaga, A., Docherty, K. S., Surratt, J. D., Seinfeld, J. H., Ziemann, P. J., and Jimenez, J. L.: Response of an aerosol mass spectrometer to organonitrates and organosulfates and implications for atmospheric chemistry, P. Natl. Acad. Sci. USA, 107, 6670–6675, https://doi.org/10.1073/pnas.0912340107, 2010.
Forster, P., Ramaswamy, V., Artaxo, P., Berntsen, T., Betts, R., Fahey, D. W., Haywood, J., Lean, J., Lowe, D. C., Myhre, G., Nganga, J., Prinn, R., Raga, G., Schulz, M., and Van Dorland, R.: Changes in Atmospheric Constituents and in Radiative Forcing, in: Climate Change 2007: The Physical Science Basis. Contribution of Working Group I to the Fourth Assessment Report of the Intergovernmental Panel on Climate Change, edited by: Solomon, S., Qin, D., Manning, M., Chen, Z., Marquis, M., Averyt, K. B., Tignor, M., and Miller, H. L., Cambridge University Press, Cambridge, UK and New York, NY, USA, 2007.
Froyd, K. D.: Ion induced nucleation in the atmosphere: Studies of ammonia, sulfuric acid, and water cluster ions, PhD, Department of Chemistry, University of Colorado, Boulder, Colorado, USA, 282 pp., 2002.
Fuzzi, S., Baltensperger, U., Carslaw, K., Decesari, S., Denier van der Gon, H., Facchini, M. C., Fowler, D., Koren, I., Langford, B., Lohmann, U., Nemitz, E., Pandis, S., Riipinen, I., Rudich, Y., Schaap, M., Slowik, J. G., Spracklen, D. V., Vignati, E., Wild, M., Williams, M., and Gilardoni, S.: Particulate matter, air quality and climate: lessons learned and future needs, Atmos. Chem. Phys., 15, 8217–8299, https://doi.org/10.5194/acp-15-8217-2015, 2015.
Griffith, D. W. T., Mankin, W. G., Coffey, M. T., Ward, D. E., and Riebau, A.: FTIR remote sensing of biomass burning emissions of CO2, CO, CH4, CH2O, NO, NO2, NH3, and N2O, in: Global Biomass Burning: Atmospheric, Climatic, and Biospheric Implications, edited by: Levine, J. S., MIT Press, Cambridge, MA, USA, 230–239, 1991.
Hallquist, M., Wenger, J. C., Baltensperger, U., Rudich, Y., Simpson, D., Claeys, M., Dommen, J., Donahue, N. M., George, C., Goldstein, A. H., Hamilton, J. F., Herrmann, H., Hoffmann, T., Iinuma, Y., Jang, M., Jenkin, M. E., Jimenez, J. L., Kiendler-Scharr, A., Maenhaut, W., McFiggans, G., Mentel, Th. F., Monod, A., Prévôt, A. S. H., Seinfeld, J. H., Surratt, J. D., Szmigielski, R., and Wildt, J.: The formation, properties and impact of secondary organic aerosol: current and emerging issues, Atmos. Chem. Phys., 9, 5155–5236, https://doi.org/10.5194/acp-9-5155-2009, 2009.
Hand, J. L. and Kreidenweis, S. M.: A new method for retrieving particle refractive index and effective density from aerosol size distribution data, Aerosol Sci. Tech., 36, 1012–1026, https://doi.org/10.1080/02786820290092276, 2002.
Hardy, J. E. and Knarr, J. J.: Technique for measuring the total concentration of gaseous fixed nitrogen species, J. Air Pollut. Contr. Assoc., 32, 376–379, https://doi.org/10.1080/00022470.1982.10465412, 1982.
Hauglustaine, D. A., Balkanski, Y., and Schulz, M.: A global model simulation of present and future nitrate aerosols and their direct radiative forcing of climate, Atmos. Chem. Phys., 14, 11031–11063, https://doi.org/10.5194/acp-14-11031-2014, 2014.
Haywood, J., Bush, M., Abel, S., Claxton, B., Coe, H., Crosier, J., Harrison, M., Macpherson, B., Naylor, M., and Osborne, S.: Prediction of visibility and aerosol within the operational Met Office Unified Model II: Validation of model performance using observational data, Q. J. Roy. Meteor. Soc., 134, 1817–1832, https://doi.org/10.1002/qj.275, 2008.
Horstman, D. W.: A technique for measuring total oxides of nitrogen and ammonia by chemiluminescent detection, Analysis Instr., edited by: Iverson, A., Instrument Society of America, Research Triangle Park, USA, 93–98, 1982.
Hu, D., Chen, J., Ye, X., and Yang, X.: Hygroscopicity and evaporation of ammonium chloride and ammonium nitrate: Relative humidity and size effects on the growth factor, Atmos. Environ., 45, 2349–2355, https://doi.org/10.1016/j.atmosenv.2011.02.024, 2011.
Huffman, J. A., Docherty, K. S., Aiken, A. C., Cubison, M. J., Ulbrich, I. M., DeCarlo, P. F., Sueper, D., Jayne, J. T., Worsnop, D. R., Ziemann, P. J., and Jimenez, J. L.: Chemically-resolved aerosol volatility measurements from two megacity field studies, Atmos. Chem. Phys., 9, 7161–7182, https://doi.org/10.5194/acp-9-7161-2009, 2009.
IPCC: Climate Change 2013, The Physical Science Basis, Bern, Switzerland, 2013.
Jayne, J. T., Leard, D. C., Zhan, X., Davidovits, P., Smith, K. A., Kolb, C. E., and Worsnop, D. R.: Development of an aerosol mass spectrometer for size and composition analysis of submicron particles, Aerosol Sci. Tech., 33, 49–70, https://doi.org/10.1080/027868200410840, 2000.
Jickells, T., Baker, A., R., Cape, J., N., Cornell, S., E., and Nemitz, E.: The cycling of organic nitrogen through the atmosphere, Philos. T. R. Soc. Lon. B, 368, 1621, https://doi.org/10.1098/rstb.2013.0115, 2013.
Jimenez, J. L., Canagaratna, M. R., Donahue, N. M., Prevot, A. S. H., Zhang, Q., Kroll, J. H., DeCarlo, P. F., Allan, J. D., Coe, H., Ng, N. L., Aiken, A. C., Docherty, K. S., Ulbrich, I. M., Grieshop, A. P., Robinson, A. L., Duplissy, J., Smith, J. D., Wilson, K. R., Lanz, V. A., Hueglin, C., Sun, Y. L., Tian, J., Laaksonen, A., Raatikainen, T., Rautiainen, J., Vaattovaara, P., Ehn, M., Kulmala, M., Tomlinson, J. M., Collins, D. R., Cubison, M. J., Dunlea, E. J., Huffman, J. A., Onasch, T. B., Alfarra, M. R., Williams, P. I., Bower, K., Kondo, Y., Schneider, J., Drewnick, F., Borrmann, S., Weimer, S., Demerjian, K., Salcedo, D., Cottrell, L., Griffin, R., Takami, A., Miyoshi, T., Hatakeyama, S., Shimono, A., Sun, J. Y., Zhang, Y. M., Dzepina, K., Kimmel, J. R., Sueper, D., Jayne, J. T., Herndon, S. C., Trimborn, A. M., Williams, L. R., Wood, E. C., Middlebrook, A. M., Kolb, C. E., Baltensperger, U., and Worsnop, D. R.: Evolution of organic aerosols in the atmosphere, Science, 326, 1525–1529, https://doi.org/10.1126/science.1180353, 2009.
Jimenez, J. L., Canagaratna, M. R., Drewnick, F., Allan, J. D., Alfarra, M. R., Middlebrook, A. M., Slowik, J. G., Zhang, Q., Coe, H., Jayne, J. T., and Worsnop, D. R.: Comment on “The effects of molecular weight and thermal decomposition on the sensitivity of a thermal desorption aerosol mass spectrometer”, Aerosol Sci. Tech., 50, i–xv, https://doi.org/10.1080/02786826.2016.1205728, 2016.
Kamal, M. S., Razzak, S. A., and Hossain, M. M.: Catalytic oxidation of volatile organic compounds (VOCs) – A review, Atmos. Environ., 140, 117–134, https://doi.org/10.1016/j.atmosenv.2016.05.031, 2016.
Kiyoura, R. and Urano, K.: Mechanism, kinetics and equilibrium of thermal decomposition of ammonium sulfate, Ind. Eng. Chem. Proc. DD, 9, 489–494, https://doi.org/10.1021/i260036a001, 1970.
Knutson, E. O. and Whitby, K. T.: Aerosol classification by electric mobility: Apparatus, theory, and applications, J. Aerosol Sci., 6, 443–451, https://doi.org/10.1016/0021-8502(75)90060-9, 1975.
Koss, A. R., Sekimoto, K., Gilman, J. B., Selimovic, V., Coggon, M. M., Zarzana, K. J., Yuan, B., Lerner, B. M., Brown, S. S., Jimenez, J. L., Krechmer, J., Roberts, J. M., Warneke, C., Yokelson, R. J., and de Gouw, J.: Non-methane organic gas emissions from biomass burning: identification, quantification, and emission factors from PTR-ToF during the FIREX 2016 laboratory experiment, Atmos. Chem. Phys., 18, 3299–3319, https://doi.org/10.5194/acp-18-3299-2018, 2018.
Kostiainen, R. and Kauppila, T. J.: Effect of eluent on the ionization process in liquid chromatography-mass spectrometry, J. Chrom. A., 1216, 685–699, https://doi.org/10.1016/j.chroma.2008.08.095, 2009.
Kuhlbusch, T. A., Lobert, J. M., Crutzen, P. J., and Warneck, P.: Molecular nitrogen emissions from denitrifcation during biomass burning, Nature, 351, 135–137, https://doi.org/10.1038/351135a0, 1991.
Kupc, A., Williamson, C., Wagner, N. L., Richardson, M., and Brock, C. A.: Modification, calibration, and performance of the Ultra-High Sensitivity Aerosol Spectrometer for particle size distribution and volatility measurements during the Atmospheric Tomography Mission (ATom) airborne campaign, Atmos. Meas. Tech., 11, 369–383, https://doi.org/10.5194/amt-11-369-2018, 2018.
Lee, B. H., Mohr, C., Lopez-Hilfiker, F. D., Lutz, A., Hallquist, M., Lee, L., Romer, P., Cohen, R. C., Iyer, S., Kurten, T., Hu, W. W., Day, D. A., Campuzano-Jost, P., Jimenez, J. L., Xu, L., Ng, N. L., Guo, H., Weber, R. J., Wild, R. J., Brown, S. S., Koss, A., de Gouw, J., Olson, K., Goldstein, A. H., Seco, R., Kim, S., McAvey, K. M., Shepson, P. B., Starn, T., Baumann, K., Edgerton, E., Liu, J., Shilling, J. E., Miller, D. O., Brune, W. H., Schobesberger, S., D'Ambro, E. L., and Thornton, J. A.: Highly functionalized organic nitrates in the Southeast U.S.: contribution to secondary organic aerosol and reactive nitrogen budgets, P. Natl. Acad. Sci. USA, 113, 1516–1521, https://doi.org/10.1073/pnas.1508108113, 2016.
Li, J., Wang, W-C., Liao, H., and Chang, W.: Past and future direct radiative forcing of nitrate aerosol in East Asia, Theor. Appl. Climatol., 121, 445–458, https://doi.org/10.1007/s00704-014-1249-1, 2015.
Liao, H., Adams, P. J., Chung, S. H., Seinfeld, J. H., Mickley, L. J., and Jacob, D. J.: Interactions between tropospheric chemistry and aerosols in a unified general circulation model, J. Geophys. Res., 108, 4001, https://doi.org/10.1029/2001JD001260, 2003.
Lin, M., Walker, J., Geron, C., and Khlystov, A.: Organic nitrogen in PM2.5 aerosol at a forest site in the Southeast US, Atmos. Chem. Phys., 10, 2145–2157, https://doi.org/10.5194/acp-10-2145-2010, 2010.
Liu, Y. and Daum, P. H.: The effect of refractive index on size distributions and light scattering coefficients derived from optical particle counters, J. Aerosol Sci., 31, 945–957, https://doi.org/10.1016/S0021-8502(99)00573-X, 2000.
Liu, B. Y. H. and Lee, K.W.: An aerosol generator of high stability, Am. Ind. Hyg. Assoc. J., 36, 861–865, https://doi.org/10.1080/0002889758507357, 1975.
Lobert, J. M., Scharffe, D. H., Hao, W.-M., and Crutzen, P. J.: Importance of biomass burning in the atmospheric budgets of nitrogen-containing gases, Nature, 346, 552–554, https://doi.org/10.1038/346552a0, 1990.
Lobert, J. M., Scharffe, D. H., Hao, W.-M., Kuhlbusch, T. A., Seuwen, R., Warneck, P., and Crutzen, P. J.: Experimental evaluation of biomass burning emissions: Nitrogen and carbon containing compounds. In: Global Biomass Burning: Atmospheric, Climatic, and Biospheric Implications, edited by: Levine, J. S., The MIT Press, Cambridge, MA, USA, 1991.
Lovejoy, E. R.: Ion trap studies of H+(H2SO4)m(H2O)n reactions with water, ammonia, and a variety of organic compounds, Int. J. Mass Spectrom., 190/191, 231–241, 1999.
Ma, Y.: Developments and Improvements to the Particle-Into-Liquid Sampler (PILS) and its Application to Asian Outflow Studies, PhD Dissertation, Georgia Institute of Technology, Atlanta, GA, USA, 2004.
Maris, C., Chung, M. Y., Lueb, R., Krischke, U., Meller, R., Fox, M. J., and Paulson, S. E.: Development of instrumentation for simultaneous analysis of total non-methane organic carbon and volatile organic compounds in ambient air, Atmos. Environ., 37, S149–S158, https://doi.org/10.1016/S1352-2310(03)00387-X, 2003.
Marx, O., Brümmer, C., Ammann, C., Wolff, V., and Freibauer, A.: TRANC – a novel fast-response converter to measure total reactive atmospheric nitrogen, Atmos. Meas. Tech., 5, 1045–1057, https://doi.org/10.5194/amt-5-1045-2012, 2012.
McCalley, C. K. and Sparks, J. P.: Abiotic gas formation drives nitrogen loss from a desert ecosystem, Science, 326, 837–840, https://doi.org/10.1126/science.1178984, 2009.
McMeeking, G. R., Kreidenweis, S. M., Baker, S., Carrico, C. M., Chow, J. C., Collet Jr., J. L., Hao, W. M., Holden, A. S., Kirchstetter, T. W., Malm, W. C., Moosmüller, H., Sullivan, A. P., and Wold, C. E.: Emissions of trace gases and aerosols during the open combustion of biomass in the laboratory, J. Geophys. Res., 114, D19210, https://doi.org/10.1029/2009JD011836, 2009.
Min, K.-E., Washenfelder, R. A., Dubé, W. P., Langford, A. O., Edwards, P. M., Zarzana, K. J., Stutz, J., Lu, K., Rohrer, F., Zhang, Y., and Brown, S. S.: A broadband cavity enhanced absorption spectrometer for aircraft measurements of glyoxal, methylglyoxal, nitrous acid, nitrogen dioxide, and water vapor, Atmos. Meas. Tech., 9, 423–440, https://doi.org/10.5194/amt-9-423-2016, 2016.
Murphy, D. M.: The effects of molecular weight and thermal decomposition on the sensitivity of a thermal desorption aerosol mass spectrometer, Aerosol Sci. Tech., 50, 118–125, https://doi.org/10.1080/02786826.2015.1136403, 2016a.
Murphy, D. M.: Reply to Comment on “The effects of molecular weight and thermal decomposition on the sensitivity of a thermal desorption aerosol mass spectrometer”, by Jimenez et al., Aerosol Sci. Tech., 50, 1277–1283, 2016b.
Neff, J. C., Holland, E. A., Dentener, F. J., McDowell, W. H., and Russell, K. M.: The origin, composition and rates of organic nitrogen deposition: A missing piece of the nitrogen cycle?, Biogeochemistry, 57, 99–136, 2002.
Neuman, J. A., Huey, L. G., Ryerson, T. B., and Fahey, D. W.: Study of inlet materials for sampling atmospheric nitric acid, Environ. Sci. Technol., 33, 1133–1136, https://doi.org/10.1021/es980767f, 1999.
Neuman, J. A., Ryerson, T. B., Huey, L. G., Jakoubek, R., Nowak, J. B., Simons, G., and Fehsenfeld, F. C.: Calibration and evaluation of nitric acid and ammonia permeation tubes by UV optical absorption, Environ. Sci. Technol., 37, 2975–2981, https://doi.org/10.1021/es026422l, 2003.
NIST: Chemical Kinetics Database, Standard Reference Database 17, Version 7.0 Web Version, available at: https://webbook.nist.gov/chemistry/, last access: 18 September 2017.
National Oceanic and Atmospheric Administration: Fire Lab Study, Earth System Laboratory, Chemical Sciences Division, available at: https://esrl.noaa.gov/csd/groups/csd7/measurements/2016firex/FireLab/DataDownload/index.php?page=/csd/groups/csd7/measurements/2016firex/FireLab/DataDownload/, last access: 6 May 2018.
Orsini, D. A., Ma, Y., Sullivan, A., Sierau, B., Baumann, K., and Weber, R. J.: Refinements to the particle-into-liquid sampler (PILS) for ground and airborne measurements of water-soluble aerosol composition, Atmos. Environ., 37, 1243–1259, https://doi.org/10.1016/S1352-2310(02)01015-4, 2003.
Park, R. S., Lee, S., Shin, S.-K., and Song, C. H.: Contribution of ammonium nitrate to aerosol optical depth and direct radiative forcing by aerosols over East Asia, Atmos. Chem. Phys., 14, 2185–2201, https://doi.org/10.5194/acp-14-2185-2014, 2014.
Parrish, D. D. and Fehsenfeld, F. C.: Methods for gas-phase measurements of ozone, ozone precursors and aerosol precursors, Atmos. Environ., 34, 1921–1957, https://doi.org/10.1016/S1352-2310(99)00454-9, 2000.
Pöschl, U.: Atmospheric aerosols: Composition, transformation, climate and health effects, Angew. Chem. Int. Edit., 44, 7520–7540, https://doi.org/10.1002/anie.200501122, 2005.
Prenni, A. J., Levin, E. J. T., Benedict, K. B., Sullivan, A. P., Schurman, M. I., Gebhart, K. A., Day, D. E., Carrico, C. M., Malm, W. C., Schichtel, B. A., Collet Jr., J. L., and Kreidenweis, S. M.: Gas-phase reactive nitrogen near Grand Teton National Park: Impacts of transport, anthropogenic emissions, and biomass burning, Atmos. Environ., 89, 749–756, https://doi.org/10.1016/j.atmosenv.2014.03.017, 2014.
Roberts, J. M., Bertman, S. B., Jobson, T., Niki, H., and Tanner, R.: Measurement of total nonmethane organic carbon (Cy): development and application at Chebogue Point, Nova Scotia, during the 1993 North Atlantic Regional Experiment campaign, J. Geophys. Res.-Atmos., 103, 13581–13592, https://doi.org/10.1029/97JD02240, 1998.
Roberts, J. M., Veres, P., Warneke, C., Neuman, J. A., Washenfelder, R. A., Brown, S. S., Baasandorj, M., Burkholder, J. B., Burling, I. R., Johnson, T. J., Yokelson, R. J., and de Gouw, J.: Measurement of HONO, HNCO, and other inorganic acids by negative-ion proton-transfer chemical-ionization mass spectrometry (NI-PT-CIMS): application to biomass burning emissions, Atmos. Meas. Tech., 3, 981–990, https://doi.org/10.5194/amt-3-981-2010, 2010.
Rosenberg, P. D., Dean, A. R., Williams, P. I., Dorsey, J. R., Minikin, A., Pickering, M. A., and Petzold, A.: Particle sizing calibration with refractive index correction for light scattering optical particle counters and impacts upon PCASP and CDP data collected during the Fennec campaign, Atmos. Meas. Tech., 5, 1147–1163, https://doi.org/10.5194/amt-5-1147-2012, 2012.
Russell, L. M., Flagan, R. C., and Seinfeld, J. H.: Asymmetric instrument response resulting from mixing effects in accelerated DMA-CPC measurements, Aerosol Sci. Tech., 23, 491–509, https://doi.org/10.1080/02786829508965332, 1995.
Saylor, R. D., Edgerton, E. S., Hartsell, B. E., Baumann, K., and Hansen, D. A.: Continuous gaseous and total ammonia measurements from the southeastern aerosol research and characterization (SEARCH) study, Atmos. Environ., 44, 4994–5004, https://doi.org/10.1016/j.atmosenv.2010.07.055, 2010.
Schwab, J. J., Li, Y., Bae, M.-S., Demerjian, K. L., Hou, J., Zhou, X., Jensen, B., and Pryor, S.: A laboratory intercomparision of real-time gaseous ammonia measurement methods, Environ. Sci. Technol., 41, 8412–8419, https://doi.org/10.1021/es070354r, 2007.
Schwartz, A., Holbrook, L. L., and Wise, H.: Catalytic oxidation studies with platinum and palladium, J. Catal., 21, 199–207, https://doi.org/10.1016/0021-9517(71)90138-2, 1971.
Selimovic, V., Yokelson, R. J., Warneke, C., Roberts, J. M., de Gouw, J., Reardon, J., and Griffith, D. W. T.: Aerosol optical properties and trace gas emissions by PAX and OP-FTIR for laboratory-simulated western US wildfires during FIREX, Atmos. Chem. Phys., 18, 2929–2948, https://doi.org/10.5194/acp-18-2929-2018, 2018.
Sorooshian, A., Brechtel, F. J., Ma, Y., Weber, R. J., Corless, A., Flagan, R. C., and Seinfeld, J. H.: Modeling and characterization of a Particle-into-Liquid Sampler (PILS), Aerosol Sci. Tech., 40, 396–409, https://doi.org/10.1080/02786820600632282, 2006.
Stockwell, C. E., Yokelson, R. J., Kreidenweis, S. M., Robinson, A. L., DeMott, P. J., Sullivan, R. C., Reardon, J., Ryan, K. C., Griffith, D. W. T., and Stevens, L.: Trace gas emissions from combustion of peat, crop residue, domestic biofuels, grasses, and other fuels: configuration and Fourier transform infrared (FTIR) component of the fourth Fire Lab at Missoula Experiment (FLAME-4), Atmos. Chem. Phys., 14, 9727–9754, https://doi.org/10.5194/acp-14-9727-2014, 2014.
Stockwell, C. E., Veres, P. R., Williams, J., and Yokelson, R. J.: Characterization of biomass burning emissions from cooking fires, peat, crop residue, and other fuels with high-resolution proton-transfer-reaction time-of-flight mass spectrometry, Atmos. Chem. Phys., 15, 845–865, https://doi.org/10.5194/acp-15-845-2015, 2015.
Stolzenburg, M.: An Ultrafine Aerosol Size Distribution Measuring System, PhD thesis, Mechanical Engineering Department, University of Minnesota, Minneapolis, Minnesota, USA, 1988.
Stolzenburg, M. R. and McMurry, P. H.: An ultrafine aerosol condensation nucleus counter, Aerosol Sci. Tech., 14, 48–65, https://doi.org/10.1080/02786829108959470, 1991.
Takegawa, N., Miyazaki, Y., Kondo, Y., Komazaki, Y., Miyakawa, T., Jimenez, J. L., Jayne, J. T., Worsnop, D. R., Allan, J. D., and Weber, R. J.: Characterization of an Aerodyne aerosol mass spectrometer (AMS): Intercomparison with other aerosol instruments, Aerosol Sci. Tech., 39, 760–770, https://doi.org/10.1080/02786820500243404, 2005.
Tang, K., Page, J. S., and Smith, R. D.: Charge competition and the linear dynamic range of detection in electrospray ionization mass spectrometry, J. Am. Soc. Mass Spectr., 15, 1416–1423, https://doi.org/10.1016/j.jasms.2004.04.034, 2004.
Tannenbaum, E., Coffin, E. M., and Harrison, A. J.: The far ultraviolet absorption spectra of simple alkyl amines, J. Chem. Phys., 21, 311–318, https://doi.org/10.1063/1.1698878, 1953.
Usherenko, L. N., Fialko, M. B., Kumok, V. N., and Skorik, A. I.: Mechanism and kinetics of thermal-decomposition of ammonium oxalate, J. Appl. Chem. USSR, 61, 1559–1563, 1988.
Valentour, J. C., Aggarwal, V., and Sunshine, I.: Sensitive gas chromatographic determination of cyanide, Anal. Chem., 46, 924–925, https://doi.org/10.1021/ac60343a048, 1974.
Veres, P., Gilman, J. B., Roberts, J. M., Kuster, W. C., Warneke, C., Burling, I. R., and de Gouw, J.: Development and validation of a portable gas phase standard generation and calibration system for volatile organic compounds, Atmos. Meas. Tech., 3, 683–691, https://doi.org/10.5194/amt-3-683-2010, 2010.
Veres, P. V., Roberts, J. M., Warneke, C., and deGouw, J.: Development of negative-ion proton-transfer chemical-ionization mass spectrometry (NI-PT-CIMS) for the measurement of gas-phase organic acids in the atmosphere, Int. J. Mass Spectrom., 274, 48–55, https://doi.org/10.1016/j.ijms.2008.04.032, 2008.
Vieno, M., Heal, M. R., Twigg, M. M., MacKenzie, I. A., Braban, C. F., Lingard, J. J. N. Ritchie, S., Beck, R. C., A., M., Ots, R., DiMarco, C. F., Nemitz, E., Sutton, M. A., and Reis, S.: The UK particulate matter air pollution episode of March-April 2014: more than Saharan dust, Environ. Res. Lett., 11, 040440, https://doi.org/10.1088/1748-9326/11/4/044004, 2016.
Wang, S. C. and Flagan, R. C.: Scanning electrical mobility spectrometer, Aerosol Sci. Tech., 13, 230–240, https://doi.org/10.1080/02786829008959441, 1990.
Weber, R. J., Orsini, D., Daun, Y., Lee, Y. N., Klotz, P. J., and Brechtel, F. J.: A particle-into-liquid collector for rapid measurement of aerosol bulk chemical composition, Aerosol Sci. Tech. 35, 718–727, https://doi.org/10.1080/02786820152546761, 2001.
Wiedensohler, A.: An approximation of the bipolar charge distribution for particles in the sub-micron size range, J. Aerosol Sci., 19, 387–389, https://doi.org/10.1016/0021-8502(88)90278-9, 1988.
Williams, E. J., Baumann, K., Roberts, J. M., Bertman, S. B., Norton, R. B., Fehsenfeld, F. C., Springston, S. R., Nunnermacker, L. J., Newman, L., Olszyna, K., Meagher, J., Hartsell, B., Edgerton, E., Pearson, J. R., and Rodgers, M. O.: Intercomparison of ground-based NOy measurement techniques, J. Geophys. Res.-Atmos., 103, 22261–22280, https://doi.org/10.1029/98JD00074, 1998.
Winer, A. M., Peters, J. W., Smith, J. P., and Pitts, J. N.: Response of commercial chemiluminescent nitric oxide-nitrogen dioxide analyzers to other nitrogen-containing compounds, Environ. Sci. Technol., 8, 1118–1121, https://doi.org/10.1021/es60098a004, 1974.
Womack, C. C., Neuman, J. A., Veres, P. R., Eilerman, S. J., Brock, C. A., Decker, Z. C. J., Zarzana, K. J., Dube, W. P., Wild, R. J., Wooldridge, P. J., Cohen, R. C., and Brown, S. S.: Evaluation of the accuracy of thermal dissociation CRDS and LIF techniques for atmospheric measurement of reactive nitrogen species, Atmos. Meas. Tech., 10, 1911–1926, https://doi.org/10.5194/amt-10-1911-2017, 2017.
Xu, L. and Penner, J. E.: Global simulations of nitrate and ammonium aerosols and their radiative effects, Atmos. Chem. Phys., 12, 9479–9504, https://doi.org/10.5194/acp-12-9479-2012, 2012.
Yokelson, R. J., Griffith, D. W. T., and Ward, D. E.: Open path Fourier transform infrared studies of large-scale laboratory biomass fires, J. Geophys. Res., 101, 21067–21080, https://doi.org/10.1029/96jd01800, 1996.
Yokelson, R. J., Christian, T. J., Bertschi, I. T., and Hao, W. M.: Evaluation of adsorption effects on measurements of ammonia, acetic acid, and methanol, J. Geophys. Res., 108, 4649, https://doi.org/10.1029/2003JD003549, 2003.