the Creative Commons Attribution 4.0 License.
the Creative Commons Attribution 4.0 License.
 | 26 Jul 2018
Data inversion methods to determine sub-3 nm aerosol size distributions using the particle size magnifier
Runlong Cai
Dongsen Yang
Lauri R. Ahonen
Linlin Shi
Frans Korhonen
Yan Ma
Jiming Hao
Tuukka Petäjä
Juha Kangasluoma
Jingkun Jiang
Measuring particle size distribution accurately down to approximately 1 nm is needed for studying atmospheric new particle formation. The scanning particle size magnifier (PSM) using diethylene glycol as a working fluid has been used for measuring sub-3 nm atmospheric aerosol. A proper inversion method is required to recover the particle size distribution from PSM raw data. Similarly to other aerosol spectrometers and classifiers, PSM inversion can be deduced from a problem described by the Fredholm integral equation of the first kind. We tested the performance of the stepwise method, the kernel function method (Lehtipalo et al., 2014), the H&A linear inversion method (Hagen and Alofs, 1983), and the expectation–maximization (EM) algorithm. The stepwise method and the kernel function method were used in previous studies on PSM. The H&A method and the expectation–maximization algorithm were used in data inversion for the electrical mobility spectrometers and the diffusion batteries, respectively (Maher and Laird, 1985). In addition, Monte Carlo simulation and laboratory experiments were used to test the accuracy and precision of the particle size distributions recovered using four inversion methods. When all of the detected particles are larger than 3 nm, the stepwise method may report false sub-3 nm particle concentrations because an infinite resolution is assumed while the kernel function method and the H&A method occasionally report false sub-3 nm particles because of the unstable least squares method. The accuracy and precision of the recovered particle size distribution using the EM algorithm are the best among the tested four inversion methods. Compared to the kernel function method, the H&A method reduces the uncertainty while keeping a similar computational expense. The measuring uncertainties in the present scanning mode may contribute to the uncertainties of the recovered particle size distributions. We suggest using the EM algorithm to retrieve the particle size distributions using the particle number concentrations recorded by the PSM. Considering the relatively high computation expenses of the EM algorithm, the H&A method is recommended for preliminary data analysis. We also gave practical suggestions on PSM operation based on the inversion analysis.


The particle size magnifier (PSM) using diethylene glycol as a working fluid (Vanhanen et al., 2011) is widely used in new particle formation studies (Kulmala et al., 2012, 2013; Kontkanen et al., 2017) and other industrial applications (Nosko et al., 2016; Ahonen et al., 2017). A PSM can report particle size distributions in the 1–3 nm size range, which is a key size region in the nucleation study. Particles in the PSM grow to larger sizes due to the condensation of supersaturated diethylene glycol, and after the initial growth these particles are detected using a downstream condensation particle counter (CPC). The PSM detection efficiency (the CPC is included if not specially mentioned) of particles with a certain diameter is a function of the supersaturation ratio of diethylene glycol. Increasing the flow rate passing through the chamber containing saturated diethylene glycol vapour, i.e. the saturator flow rate, can enhance the supersaturation ratio and thus the particle detection efficiencies. The total particle number concentration detected by the PSM varies with the varying saturator flow rate, and one can determine the particle size distribution according to the observed relationship between the particle number concentration and the saturator flow rate.
A proper inversion method is required to recover the particle size distribution using the recorded relationship between the particle number concentration and the saturator flow rate. The stepwise method and the kernel function method were used in previous studies for PSM inversion (Lehtipalo et al., 2014). The stepwise method is a one-to-one linear inversion method using the relationship between the 50 % cut-off size and the saturator flow rate, which essentially assumes infinite sizing resolutions; i.e. the particles of a specific size are activated at a certain saturator flow rate. However, such an approximation may lead to non-negligible errors due to the relatively low resolution of the PSM. The kernel function method accounts for the detection efficiency curves, and the particle size distribution is recovered using the non-negative least squares method.
Although the uncertainties of the particle size distribution determined using the PSM was discussed recently (Kangasluoma and Kontkanen, 2017), the uncertainties introduced during the data inversion have not been systematically addressed. There are always measuring uncertainties in practical conditions; thus one should account for the measuring errors when evaluating the performance of a data inversion method. Because of the relatively low resolution of the PSM, the matrix connecting the particle size distribution and the observed total number concentration is usually ill-conditioned. The kernel function method may theoretically recover the observed particle size distribution when there are no random errors. However, it sometimes leads to large uncertainties when there are small random errors because of the instability of the least squares method at a near-collinear data set (Ellis, 1998).
The equation mapping the particle size distribution to the particle number concentration detected by the PSM is the Fredholm integral equation of the first kind, which arises in many fields, e.g. when studying the molecular dynamics in complex systems (Schäfer et al., 1996) and characterizing the transfer function of an ion drift tube (Buckley and Hogan, 2017). Various types of aerosol spectrometers or classifiers, e.g. cascade impactors, optical particle spectrometers, electrical mobility spectrometers, and diffusional barriers, classify particles according to the signals recorded by a number of channels. There is no strict one-to-one relationship between the particle number concentration in a certain size range and the detected signal in a certain channel because of the finite sizing resolutions. The inversion methods used in the previous aerosol spectrometers can possibly be applied to address the PSM inversion problem. The review of the inversion methods for aerosol spectrometers can be found in Kandlikar and Ramachandran (1999), Knutson (1999), and Ramachandran and Cooper (2011).
An inversion method with less prior information on the particle size distribution is preferable for the PSM inversion problem. It is impossible to obtain a continuous particle size distribution using a finite number of the detected signals without any constraints, e.g. a known analytical expression to describe the size distribution. Some inversion methods rely on a presumed particle size distribution formula (Fuchs et al., 1962; Raabe, 1978; Ramachandran and Kandlikar, 1996) or prior information on the detection efficiencies (e.g. Onischuk et al., 2018). However, approximating various shapes of the observed sub-3 nm particle size distributions or the PSM detection efficiency curves using a specific formula may lead to relatively large uncertainties. Some methods are feasible in certain conditions; however, sometimes they are not convergent or may lead to high-frequency oscillations (Twomey, 1975; Ferri et al., 1989) due to practical random errors. Some methods use smoothing criterions to deal with the oscillations (Markowski, 1987; Winklmayr et al., 1990). However, they occasionally report an over-smoothed size distribution because of the relatively low resolution and limited size bins of the PSM. The Tikhonov regularization (Tikhonov, 1963) uses a regularization parameter to determine the balance of smoothing and the agreement with the recorded signals; thus the method may cause the inverted result to determine the regularization parameter (e.g. Wahba, 1977; Hansen, 1992).
Based on the reasons mentioned above, we chose the H&A linear inversion method (Hagen and Alofs, 1983) and the expectation–maximization algorithm, and tested the feasibility to apply these methods in the PSM inversion problem. The H&A method is a linear inversion method used in size distribution multicharge correction which has a relatively low computational expense. The expectation–maximization algorithm is an iterative method based on probability theory (Dempster et al., 1977), and it was used to reconstruct particle size distributions from diffusion battery data (Maher and Laird, 1985; Wu et al., 1989).
In this study, we tested the performance of the stepwise method, the kernel function method, the H&A method, and the expectation–maximization algorithm in the PSM inversion. Experiments and Monte Carlo simulations accounting for random errors were used to evaluate the sizing accuracies and the uncertainties of the particle size distributions recovered using four inversion methods. The influence of particles larger than 3 nm on the reported sub-3 nm particle size distributions was discussed. Based on the comparison, the methods with comparatively low uncertainties and high stabilities were recommended to address the PSM inversion problem.
2.1 PSM measuring theory
A PSM measures the total particle number concentration of the activated particles. The sampled aerosol flow is mixed with a high-temperature flow containing saturated diethylene glycol coming from the saturator, and then the mixed flow passes through a low-temperature growth tube. The particles large than a specific diameter can overcome the Kelvin effect and grow to larger sizes due to the condensation of supersaturated diethylene glycol. The detection efficiency is mainly determined by the particle diameter and the saturator flow rate. The chemical compositions and charging state may affect the detection efficiencies (Kangasluoma et al., 2013, 2016a) and lead to errors in the reported particle size distributions (Kangasluoma and Kontkanen, 2017). However, we mainly focus on the inversion method in this study and assume the detection efficiency is only size dependent at a certain saturator flow rate. Since the temperatures in the saturator and the growth tube are fixed, a higher saturator flow rate leads to a higher supersaturation ratio of diethylene glycol in the growth tube and hence higher detection efficiencies (Fig. 1a). See Sect. 3.1 for the details on how to obtain the detection efficiency curves. The detected total particle number concentration varies with the varying saturator flow rate when the particle size distribution is unchanged. The relationship between the detected total particle concentration, R, the saturator flow rate, s, and the particle size distribution function, n, can be expressed in the Fredholm integral equation of the first kind:
where Ri is the number concentration recorded at the ith saturator flow rate, si; dp is the electrical mobility diameter since the calibrating particles are classified according to their electrical mobility; η is the overall detection efficiency determined by s and dp, including the detection efficiency and the sampling efficiency; n is the probability density of particle number concentration (particle size distribution function), dN∕ddp and N is the accumulated number concentration of particles smaller than dp; and εi is the error in the recorded particle concentration at si.
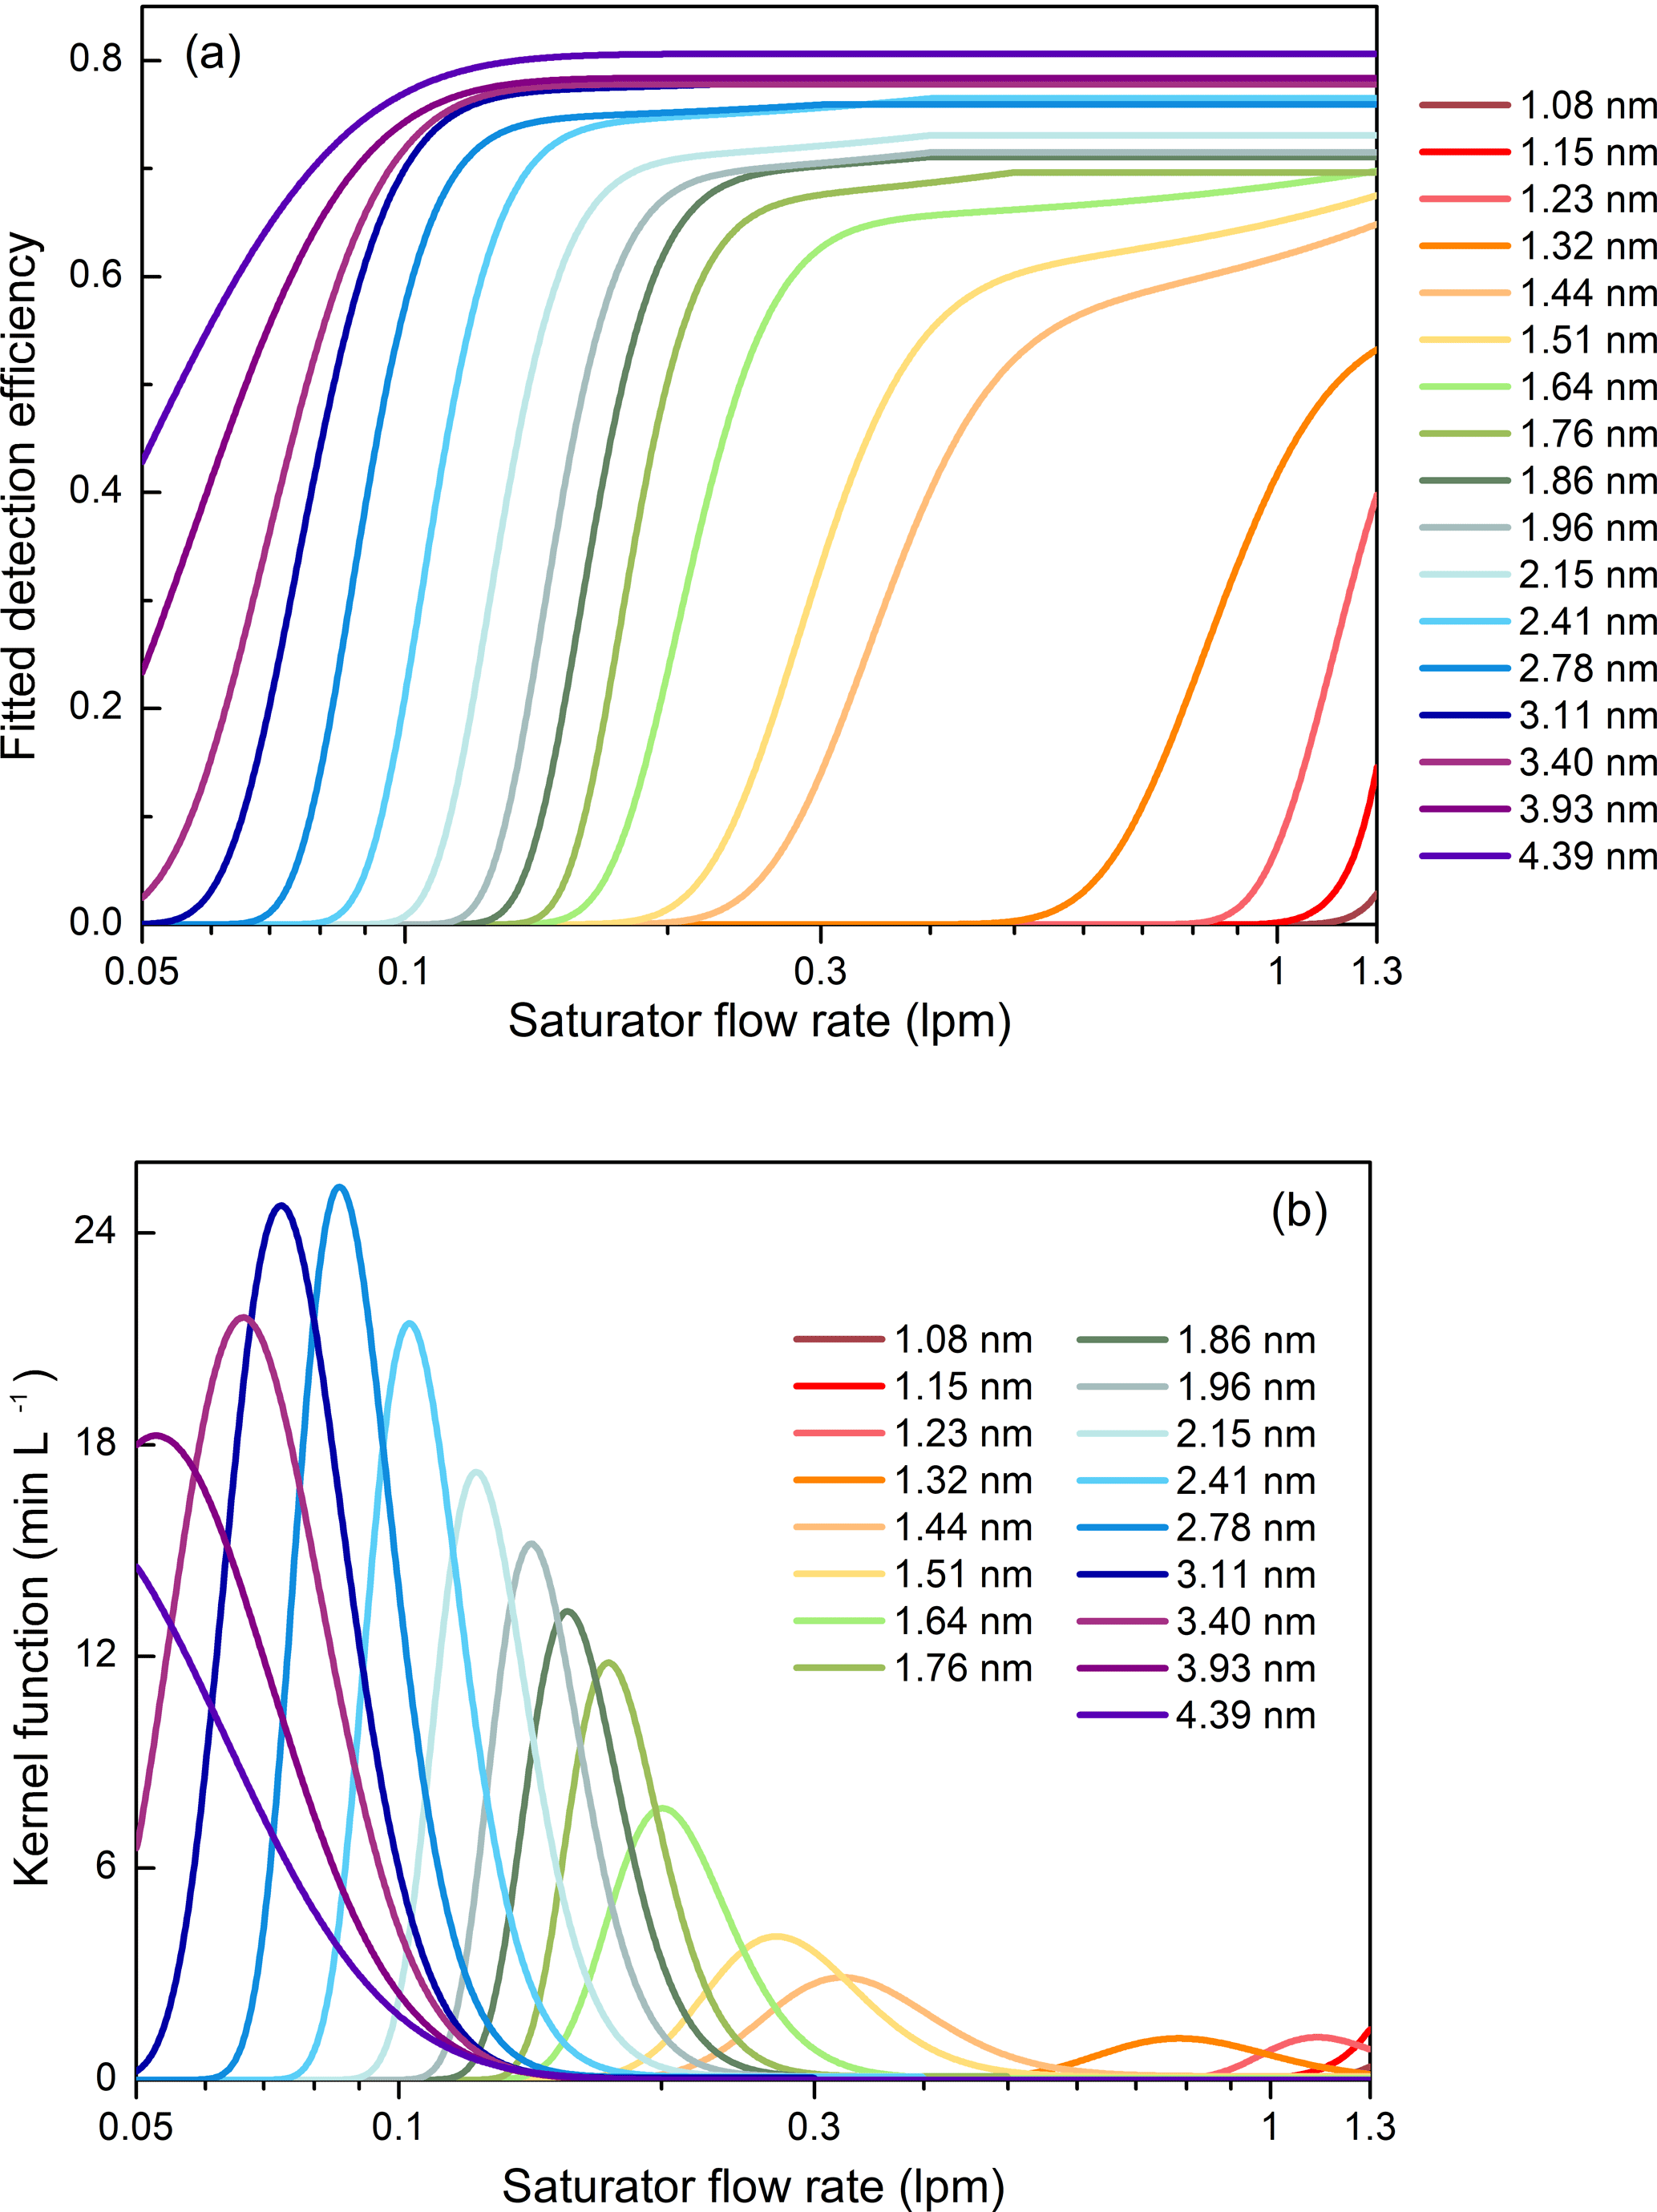
Figure 1(a) The fitted detection efficiency curves according to calibration data. (b) The estimated kernel function curves according to the fitted detection efficiencies. The kernel function is equal to the derivative of the detection efficiency with the respect to the saturator flow rate.
There are many potential sources of the error, ε. For instance, the uncertainties in the calibrated detection efficiencies, the systematic errors caused by the non-ideal fitting formula of the detection efficiency curves, the CPC counting uncertainties, the uncertainties in the supersaturation ratio due to fluctuations in the flow rate and temperature, and the unstable aerosol source will all contribute to the difference between the detected number concentration and the expected particle concentration assuming there is no error.
As shown in Fig. 1b, the kernel function of the PSM, K, is defined as the derivative of the detection efficiency, η, with respect to the saturator flow rate, s. The area of the kernel function is equal to the difference between the detection efficiencies at the maximum and minimum saturator flow rates. Here we define r as the derivative of the detected number concentration, R, with respect to s. According to Eq. (1), the relationship between r and s is also a Fredholm integral equation of the first kind:
where rm is the r at the mth saturator flow rate, sm; and is the error in rm. Although r is theoretically defined as the derivative of R, practically one can only approximate r using the difference between two adjacent Ri over the increment in si and approximate sm with the mean value of the two corresponding si. These approximations also contribute to the uncertainties, in addition to the aforementioned sources for εi.
When using a PSM to determine particle size distributions, the PSM records the varying total particle concentration, Ri, and the corresponding saturator flow rate, si. The saturator flow rate may vary continuously in the scanning mode or fixed at different flow rates in the stepping mode. The particle size distributions are recovered using the recorded relationship between Ri and si or the relationship between the approximated rm and sm.
The sizing ability of the PSM can be described using the size resolution. Similarly to defining the sizing resolution of a differential mobility analyser (DMA, Flagan, 1999) to classify particles according to their electrical mobility, we define the resolution of a PSM as
where Res is the resolution at s∗, s∗ is the peak saturator flow rate of a kernel function, and Δs is the full width at half maximum of the kernel function peak. A relationship between the saturator flow rate and the electrical mobility diameter is defined to straightforwardly relate the resolution and the particle diameter. The peak saturator flow rate, s∗ is defined as the corresponding saturator flow rate of the particle diameter. This definition is similar but different from the definition using the saturator flow rate at the half maximum detection efficiency in Lehtipalo et al. (2014) and in the commercialized PSM. The sizing resolution of a PSM can be estimated according to the relationship between s and dp, as shown in Fig. 2. However, the resolution alone is not sufficient to indicate the possible reported size range when the PSM is measuring monodisperse particles because the kernel functions are asymmetric and the inversion method also affects the reconstructed peaks. One should especially keep in mind that the PSM does not measure particle diameter because the relationship between s and dp is only a definition rather than an intrinsic correlation. A PSM only records the varying particle concentration against the varying saturator flow rate (as indicated in Eqs. 1 and 2). One can only obtain the particle diameters via proper data inversion.
2.2 The stepwise method
The resolution of the PSM is assumed infinite in the stepwise method. Thus, the integral equation relating n and r collapses into a one-to-one corresponding relationship (Lehtipalo et al., 2014).
where nm is the particle size distribution function (dN∕ddp) at dm; dm, di, and di+1 are the corresponding half-maximum cut-off diameters of sm, si, and si+1; and sm is the mean value of si and si+1. The relationship between particle diameter and the saturator flow rate is determined using the saturator flow rate at the half maximum detection efficiency (Lehtipalo et al., 2014). The stepwise method does not magnify the relative error in measurement since it is a one-to-one inversion method. However, the inverted results using the stepwise method are perhaps non-negligibly affected by the relatively low resolutions of the PSM.
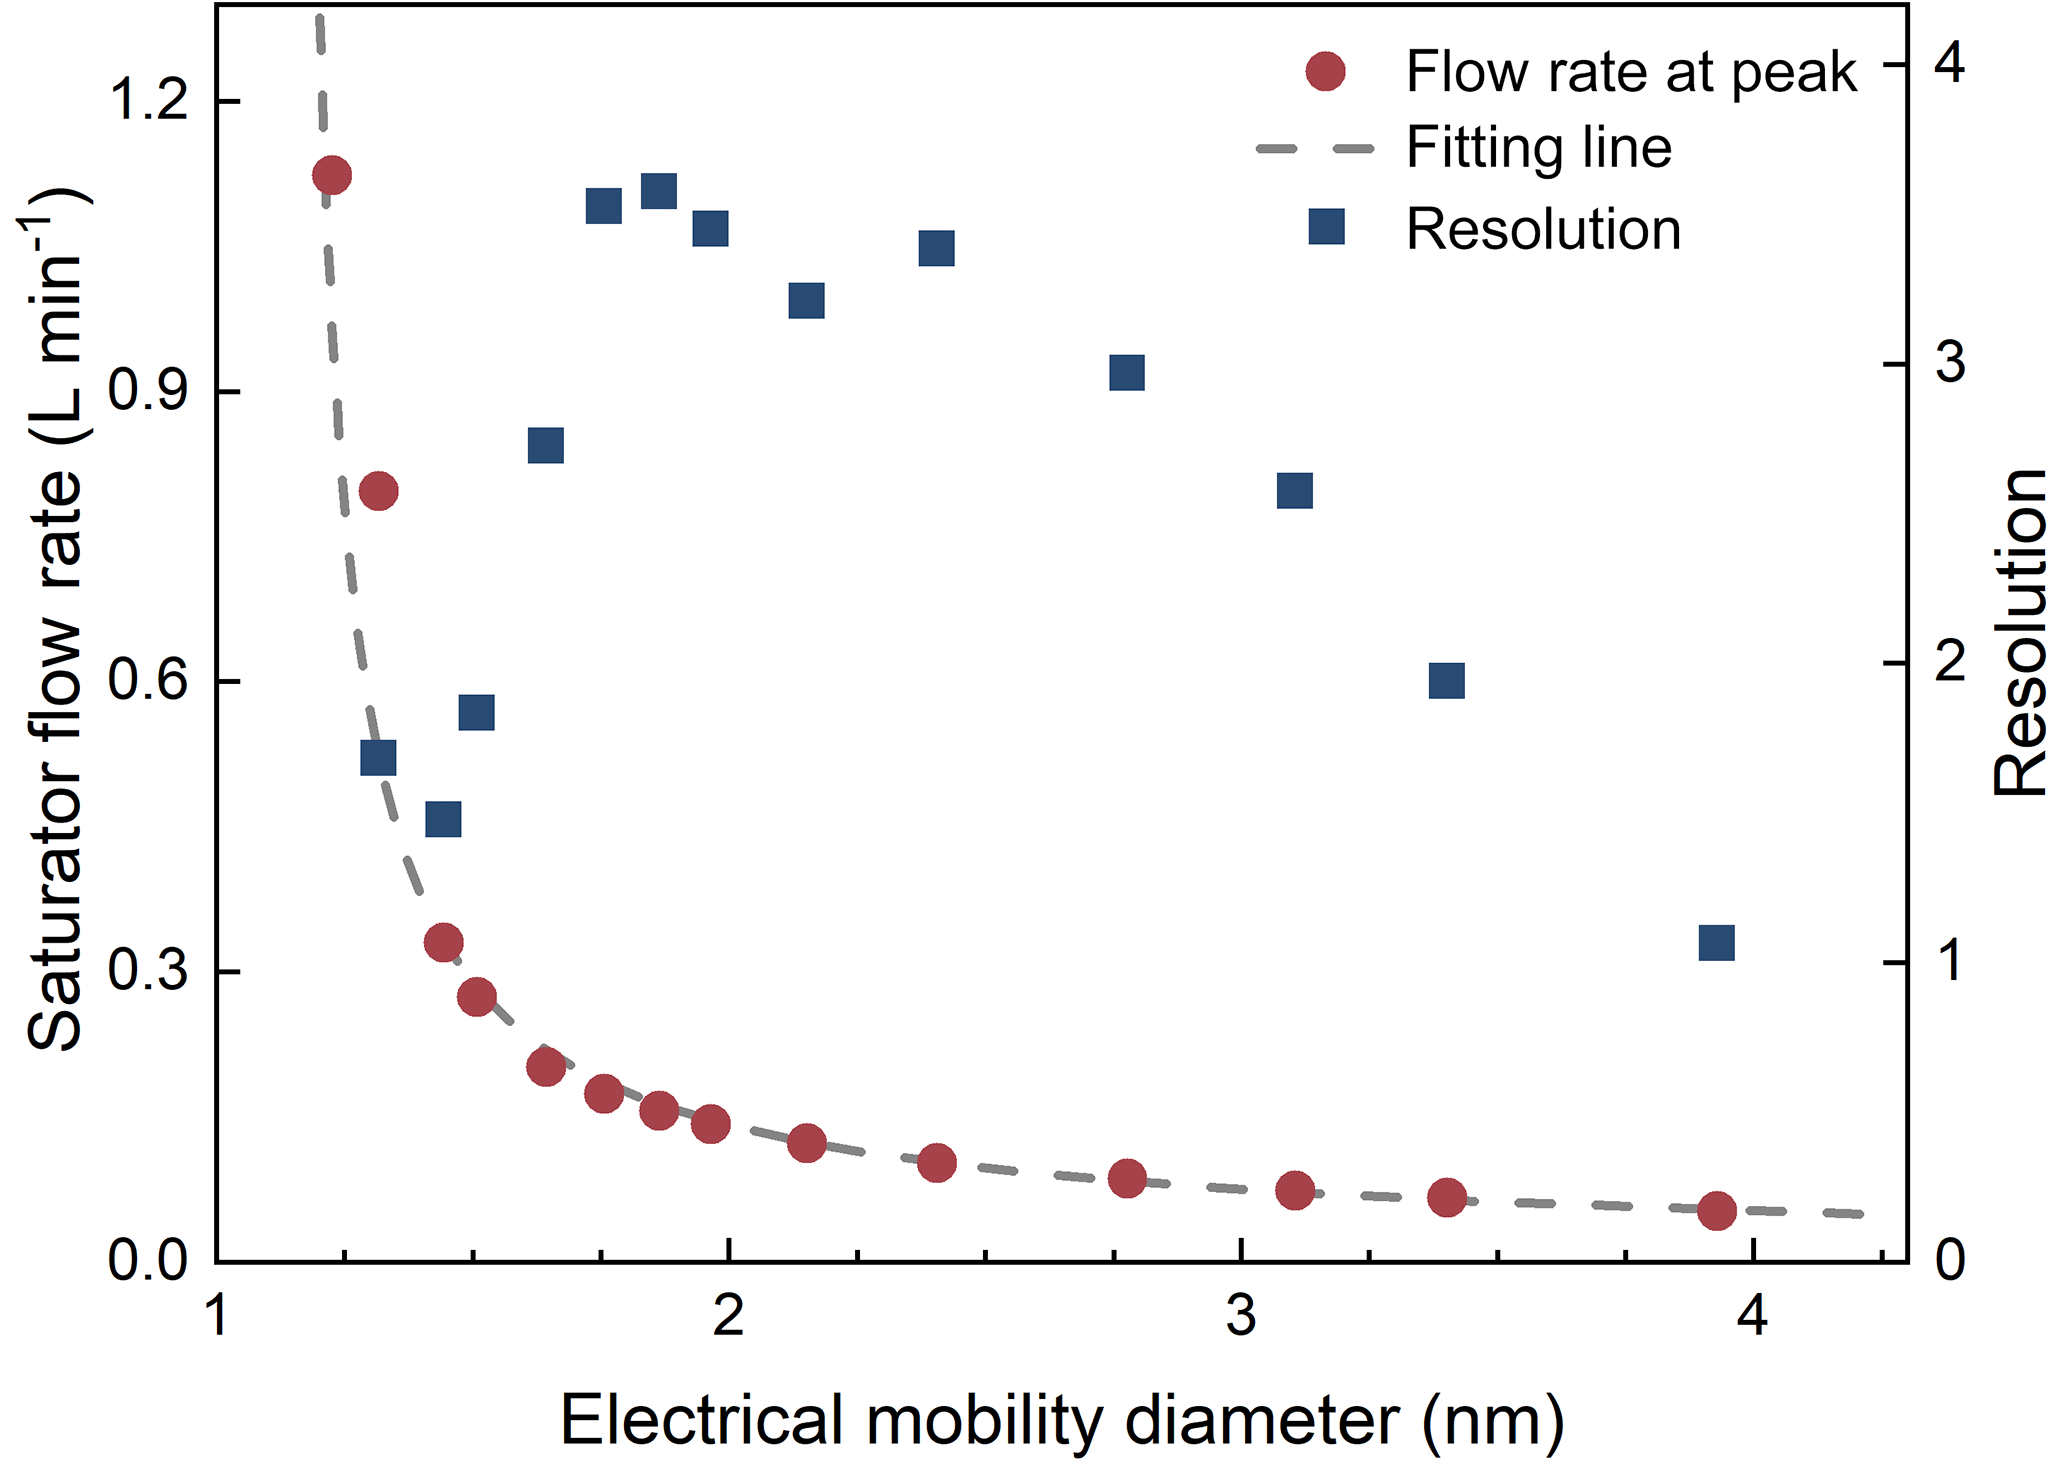
Figure 2The saturator flow rate at kernel function peak and the resolution as functions of the particle diameter. Note that the resolution is defined using the saturator flow rate, but the horizontal axis is shown in the particle diameter corresponding to the peak saturator flow rate for a more straightforward understanding.
2.3 The kernel function method
The kernel function method assumes that the particle size distribution can be approximated using several particle size bins and the detection efficiencies of particles in each size bin are the same. The mathematical description of this approximation is
where dj is the representing particle diameter of each size bin; J is the number of dj; nj is the particle size distribution function (dN∕ddp) at dj; Δdj is the length of each size bin; and I is the number of Ri. The symbol of ≈ is to emphasize that Eq. (5) is an approximation even if there are no measuring errors because it approximates the integral with a finite discrete sum and estimates rm using the recorded Ri. Using a matrix, Eq. (5) can be rewritten as
where
The upper case letters in Eq. (6) indicate the dimensions of the matrix and the vectors, while the lower case letters in Eq. (7) represent the corresponding element. The particle size distribution is obtained via solving Eq. (6) using the non-negative least squares method.
2.4 The Hagen & Alofs method
The H&A method (Hagen and Alofs, 1983) was proposed to deal with the multicharging correction problem when using a DMA. It can also be used to solve the PSM inversion problem. Similarly to the kernel function method, a discrete sum is used to approximate the integral:
Equation (9) is the vector form for Eq. (8) and P is the matrix relating nj and R. We use the symbol of = in Eqs. (8) and (9) rather than ≈ because the H&A method requires a J much larger than I. One should increase J if the error in approximating the integral with the discrete sum is still large. Usually, J is determined as 30 times that of I considering the computational expenses. However, Eq. (8) itself is not solvable because there are more unknown variables than the equations. Thus, additional constraints are required. The H&A method assumes that any nj can be approximated using ni, i.e.
where f is the function relating nj and ni (ni is a vector); ni is the particle size distribution function at di; nj is estimated using more than one single ni; and Eq. (11) is the vector form for Eq. (10). The determination of di is theoretically arbitrary as long as the number of di is the same as the number of Ri. For the details on determining f, please refer to Hagen and Alofs (1983).
Similarly to the kernel function method, the relationship between the particle size distribution and the number concentration recorded by the PSM can be described in the vector form:
P and F are determined according to Eqs. (8)–(11) and thus Q is determined by η, f, and Δdj. One can directly solve Eq. (10) (e.g. via Gaussian elimination) since Q is usually non-singular. However, in contrast to the matrix obtained from a DMA, the matrix Q in PSM inversion problem is usually not a positive-definite matrix because the detected particle concentration sometimes decreases with the increasing saturator flow rate due to random errors. Simply solving Eq. (12) often obtains negative values in particle size distributions. Thus, the non-negative least squares method is suggested to determine the particle size distribution in the PSM inversion problem. The H&A methods can also reconstruct the particle size distribution according to the relationship between rm and sm. However, using the kernel functions instead of the detection efficiencies does not necessarily improve the accuracy or precision of the results. On the contrary, we found that using the kernel functions usually leads to larger uncertainties than when using the detection efficiencies, because of the errors caused by approximating rm.
The H&A method is theoretically more stable than the kernel function method because of the more accurate assumption of the true aerosol size distribution. However, the H&A method adapted for PSM inversion may still report size distributions with large uncertainties because of the least squares method. The computational expense of the H&A method is similar to that of the kernel function method because the rate-limiting step is to solve the least square question. Their low computational expense is an advantage over other non-linear inversion methods.
2.5 The expectation–maximization algorithm
The EM algorithm is a statistical method dealing with inversion problems with unobserved latent variables. An explanation of the EM algorithm can be found in Do and Batzoglou (2008). In the PSM inversion problem, the latent variable is Ri,j, defined as the contribution of particles with the diameter of dj to the detected number concentration, Ri (Maher and Laird, 1985). The algorithm obtains the recovered particle size distribution using two steps: the expectation step and the maximization step. In the expectation step, the values of Ri,j are estimated according to Bayesian theorem:
In the maximization step, the particle size distribution function is estimated according to the maximum likelihood:
The EM algorithm obtains the recovered particle size distribution by repeating the expectation step and the maximization step until convergence. The convergence can be measured by the likelihood function (Maher and Laird, 1985). The values and the number of dj are not limited when using the EM algorithm, and a larger J can reduce the errors in approximating the integral using the discrete sum. Thus, the EM algorithm is able to report particle size distributions with more size bins compared to the stepwise method, the kernel function method, and the H&A method.
The EM algorithm is more stable compared to the algorithms based on the least squares methods (Maher and Laird, 1985). The convergence of the EM algorithm has been proved (Dempster et al., 1977), but the convergence speed is not mathematically guaranteed. Compared to the kernel function method and the H&A method, the computational expense of the EM algorithm is much higher. In addition, the EM algorithm is a greedy algorithm in that the iteration is easily trapped in a local optimum. To start the first expectation step, an initial guess of the particle size distribution is required. We suggest the initial guess to be a vector of all of them. Note that the EM algorithm is sensitive to the initial guess and uses a recovered particle size distribution obtained from another method; i.e. the stepwise method does not necessarily improve the iteration results.
3.1 Experiments
Laboratory experiments using particles with known peak sizes or size distributions were conducted to test the inversion methods (Fig. 3). Sub-10 nm tungsten oxide particles were generated using a wire generator (Peineke et al., 2006; Kangasluoma et al., 2015). In the narrow peak measurement, the negatively charged particles were classified using a high-resolution Herrmann DMA. The sizing resolutions of the Herrmann DMA in the experimental conditions were no smaller than 25 (Kangasluoma et al., 2016b). Thus, the classified aerosols out of the Herrmann DMA can be approximately regarded as monodisperse. The relationship between the Herrmann DMA voltage and the classified particle size was calibrated using standard molecular ions (Ude and de la Mora, 2005). A TSI 3068B aerosol electrometer using the same aerosol flow rate with the PSM (2.5 L min−1) was used as the reference.
In the wide peak measurement, the particle size distributions classified using a TSI nanoDMA have wider peaks than those generated in the narrow peak measurement. The aerosol and sheath flow rates of the nanoDMA were 2 and 10 L min−1. It should be clarified that the particle size distributions classified using the nanoDMA in the wide peak measurement were still narrow due to the limitation of the nanoDMA. A lower sizing resolution either achieved by a higher aerosol-to-sheath flow ratio will cause the nanoDMA to be out of work due to significant turbulence. A half-mini DMA (Fernández de la Mora and Kozlowski, 2013) with calibrated penetration efficiency and a downstream Faraday cage electrometer (FCE) was used to measure the classified particle size distributions in parallel.
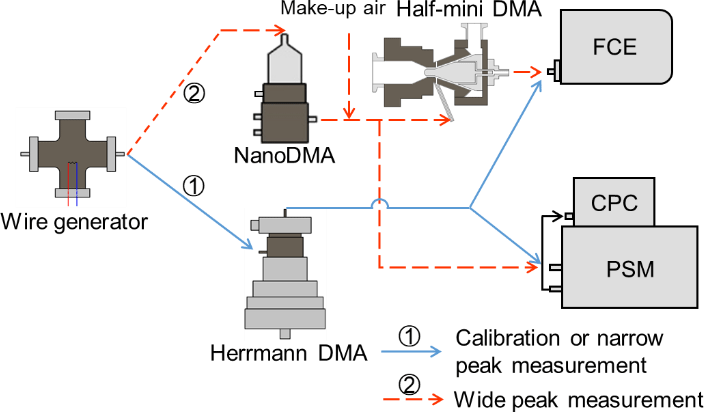
The PSM (Airmodus A11) was calibrated using negatively charged tungsten oxide particles before the test. The experimental set-up for the calibration was the same as that used in the narrow peak measurement. The influence of the finite resolution of the Herrmann DMA on the calibrated efficiency curves was negligible. The saturator flow rate of the tested PSM varied from 0.05 to 1.3 L min−1. This saturator flow rate range is wider than that of a typical PSM and obtains a complete kernel function curve of 3 nm particles. The maximum background noise of the PSM was approximately 1 cm−3, which was negligible compared to the usually detected particle concentrations. The detection efficiency is determined as the ratio of the particle number concentrations reported by PSM over the number concentration reported by the electrometer. The detection efficiency curves of the PSM were fitted using a function (Eq. 15) modified from the Chapman–Richards growth curve (Richards, 1959), which fitted better than other tested functions for the tested PSM.
where smax is the maximum saturator flow rate (1.3 L min−1); a, b, c, and d are the fitting parameters. If not specially mentioned, the PSM was fixed at 18 different saturator flow rates when measuring the particle size distributions in this study. This operation in the stepping mode was to avoid the potential uncertainties introduced in the scanning mode. The stability of the particle size distribution was monitored using the reference FCE during the relatively long measuring period.
3.2 Simulation
The performance of the four inversion methods was also studied using Monte Carlo simulations. The detection efficiencies used in the simulations were determined according to the calibrated efficiencies but slightly adjusted towards smoother curves. The uncertainties in practical calibration were neglected in the simulation.
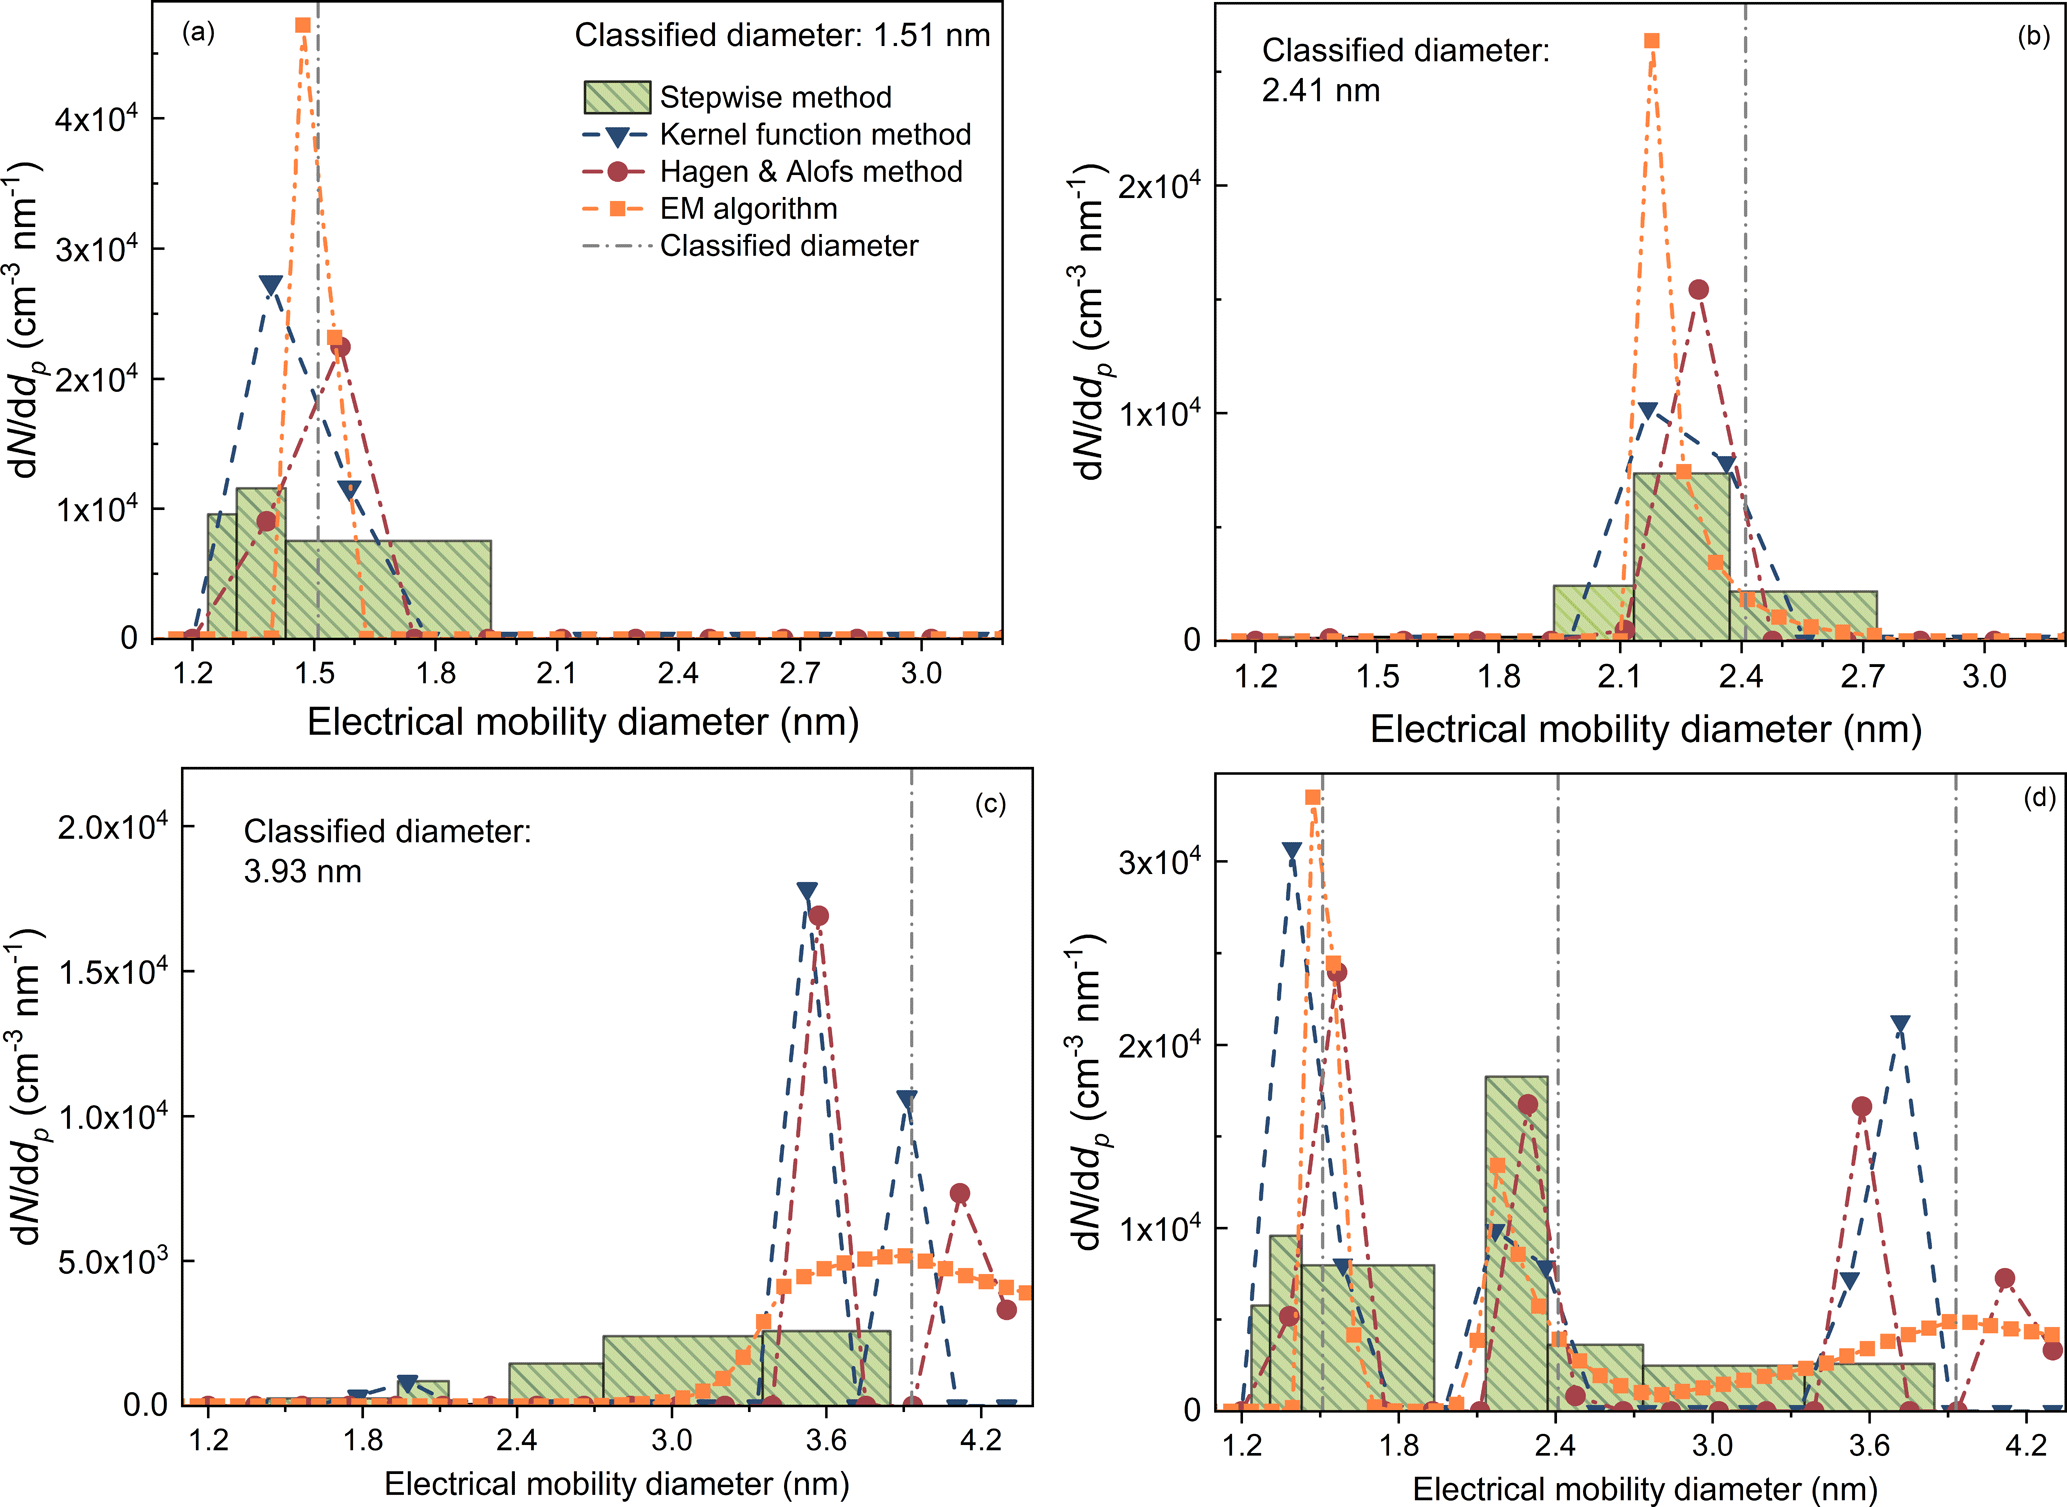
Figure 4The recovered particle size distributions using different inversion methods when measuring monodisperse particles. FCE, SW, kernel, H&A, and EM are short for the Faraday cage electrometer, the stepwise method, the kernel function method, the H&A method, and the expectation–maximization algorithm, respectively. The number concentration detected by the reference FCE and the sum of recovered sub-3 nm particle concentration in each size bin are shown in the text. The size distributions in panel (d) were recovered using the sum of the recorded number concentrations in panels (a), (b), and (c), i.e. assuming the PSM was measuring 1.51, 2.41, and 3.93 nm particles simultaneously. The sub-3 nm particle concentrations reported by different inversion methods are summarized in Table 1.
The particle number concentrations detected at different saturator flow rates were simulated using a certain initial particle size distribution. The random error, εi, was inserted into the simulated particle concentration, Ri. The random errors were determined experimentally. The relative random errors were larger than the statistical relative errors predicted using Poisson distribution (Iida, 2008; Kuang et al., 2012; Kangasluoma and Kontkanen, 2017) and independent of the particle concentrations at a certain instrumental configuration, indicating that random errors were governed by the fluctuations of the source and/or the instrumental parameters (e.g. flow rate). We used the mean relative random standard deviation observed in the experimental tests with 3.7 % as the representative value. In total 10 data points were assumed to be collected at each saturator flow rate. Thus, the random errors inserted into the simulated particle concentrations; i.e. the relative standard deviations of the mean particles concentrations, were assumed to be 1.2 % (). A relatively large random error of 10 % obtained from the ambient measurements was also tested. The Monte Carol simulation was conducted 10 000 times using each inversion method to estimate the accuracy and precision of the recovered particle size distribution indicated by the mean values and the standard deviations of the inverted results.
4.1 Sizing accuracy
The inversion methods tested in this study, i.e. the stepwise method, the kernel function method, the H&A method, and the EM algorithm, are able to estimate the classified particle diameters when the PSM was measuring nearly monodisperse sub-3 nm particles. When the classified particle diameters were 1.51 and 2.41 nm, all of the four inversion methods could recover single peaks around the classified diameter (Fig. 4a, b). The size distribution reported by the stepwise method was the largest because the stepwise method does not account for the resolution of the PSM. Note that the peak diameters reported by the kernel function method and the H&A method were also affected by the selection of the particle size bins. The total particle concentrations obtained via inversion were similar to the number concentration detected by the reference FCE, except for the number concentration of 1.51 nm particles reported by the kernel function method.
Table 1The inverted particle concentrations (in cm−3) using different inversion methods and the total particle number concentration (in cm−3) recorded by the Faraday cage electrometer when measuring monodisperse particles.
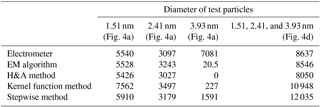
None of the four inversion methods could size particles larger than 3 nm with relatively good sizing accuracies. When the classified particle diameter was 3.93 nm, the four inversion methods failed to report narrow peaks with peak diameters approximating 3.93 nm (Fig. 4c). This is because the PSM resolution for particles larger than 3 nm is low; i.e. the resolution was ∼1.0 when measuring the classified 3.93 nm particles (Fig. 2). The 3.93 nm particles contribute to the signal for 2.17 nm particles when using the stepwise method (inferred from Figs. 1 and 2). When focusing on the sub-3 nm particle size range, the kernel function method, the H&A method, and the EM algorithm reported nearly no sub-3 nm particles. However, the stepwise method reported a non-negligible number of sub-3 nm particles with a total number concentration of 1591 cm−3 due to the low size resolution.
We further tested the sizing ability of the four inversion methods using the sum of the recorded particle concentrations when the PSM was measuring 1.51, 2.41, and 3.93 nm particles (Fig. 4d). The kernel function method, the H&A method, and the EM algorithm distinguished the particles with different sizes, and the reconstructed peaks were similar to the corresponding peaks when the PSM was measuring monodisperse particles. The inverted results using the stepwise method was also unaffected by the summation; however, it was difficult to distinguish the isolated peaks from the recovered particle size distribution due to the broadened size distribution.
The size distributions of particles larger than 3 nm could not be successfully retrieved via data inversion because of the low resolution of PSM for these particles. However, it helped to recover sub-3 nm particle size distributions. Most of the reported particle sizes using the kernel function method, the H&A method, and the EM algorithm were larger than 3 nm when the PSM was measuring 3.93 nm particles (Fig. 4c). This estimation of particles larger than 3 nm ensured a relatively accurate sizing of sub-3 nm particle size distribution (Fig. 4d). Thus, we recovered the particle size distribution up to 5 nm using different inversion methods but focus only on the sub-3 nm size range.
4.2 Uncertainties using different inversion methods
The stepwise method, the kernel function method, and the H&A method may report false sub-3 nm particles when there are only particles are larger than 3 nm in the input aerosol. A particle size distribution with a peak diameter of 5 nm and nearly no sub-3 nm particles was simulated (Fig. 5a). The detected particle concentrations were assumed to fluctuate with a 1.2 % relative standard deviation due to measuring uncertainties (Fig. 5b). The EM algorithm reported nearly no sub-3 nm particles except for the smallest size bin at 1.16 nm (Fig. 5c). The expected values of particle concentrations in the bins smaller than 3 nm recovered using the H&A method were near zero; however, false sub-3 nm particle concentrations were occasionally reported (Fig. 5d). Compared to the H&A method, the size distribution recovered using the kernel function method was more unstable, especially in the sub-2 nm size range (Fig. 5e). The simulated uncertainty is the main cause of the false sub-3 nm particle concentrations reported by the H&A method and the kernel function method in Fig. 5. When assuming that there is no error in the particle concentration detected by the PSM, the H&A method and the kernel function method report nearly no particles in the sub-3 nm size range. In contrast to the H&A method and the kernel function method that reported false results due to their instability, the stepwise method reported false particle size distributions when assuming there are no uncertainties (Fig. 5f). This is because the stepwise method assumes a simple one-to-one relationship between the saturator flow rate and the recovered particle diameter instead of accounting for the wide kernel function peaks. For sub-1.5 nm particles, the non-zero mean particle concentration reported by the stepwise method is due to the simulated uncertainties.
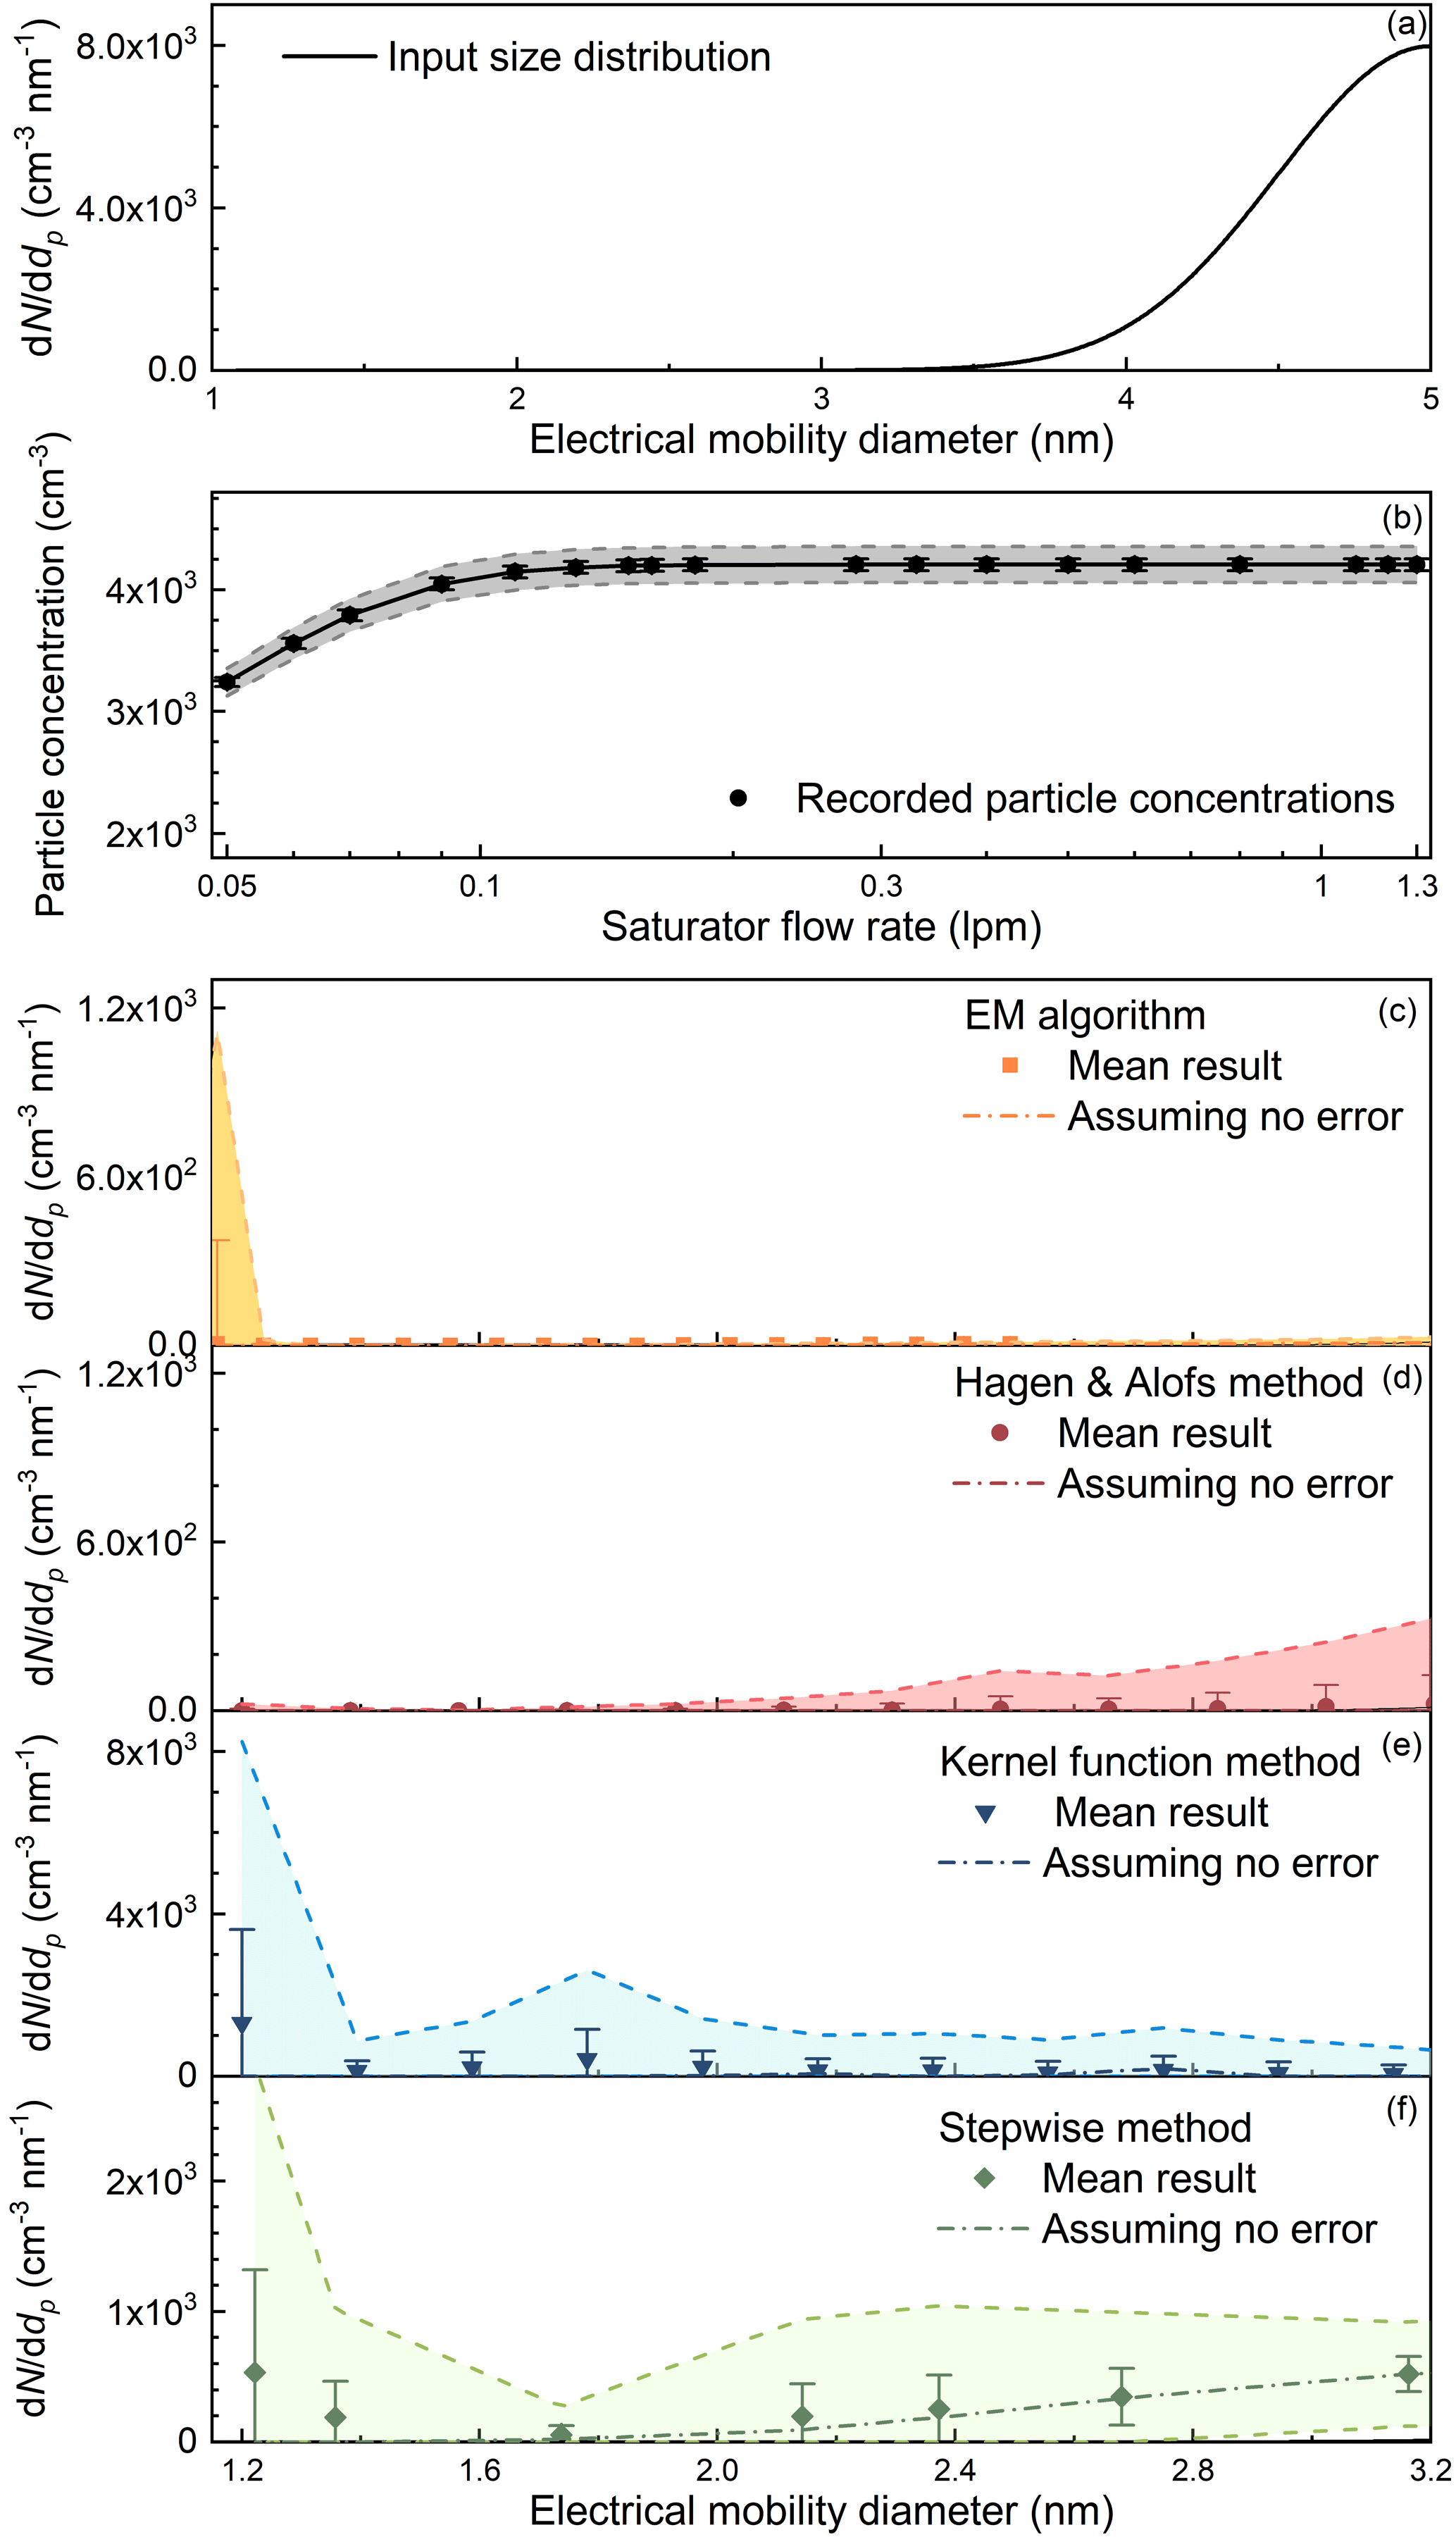
Figure 5The recovered sub-3 nm particle size distributions simulated using the Monte Carlo method when the detected particles were larger than 3 nm. (a) The assumed true particle size distribution. (b) The simulated particle concentrations recorded by the PSM. The concentrations were assumed to fluctuate due to random errors. The particle size distributions were recovered using (c) the EM algorithm, (d) the H&A method, (e) the kernel function method, and (f) the stepwise method. The error bar represents the standard deviation of the recorded particle concentration or the recovered size distribution, and the shaded area indicates the range determined by 3 times the standard deviation. The dashed lines represent the inverted results assuming there were no random errors in the recorded particle number concentrations. Note that the scale of the vertical axis in panels (c)–(f) is different and the appearing possibility of recorded counts or the recovered size distribution is not uniform in the shaded area.
The false sub-3 nm particle concentrations due to improper inversion methods were tested experimentally. Particles larger than 5 nm were classified using the nanoDMA (Fig. 6a). No sub-3 nm particles were reported using the EM algorithm and the H&A method. On the contrary, the kernel function method and the stepwise method reported approximately 3×10³ particles when the total particle concentration measured using the DMA–FCE system was approximately 2.4×10⁴. Based on both the simulating and experimental results, we conclude that the PSM may report false sub-3 nm particle size distributions when there are actually no sub-3 nm particles because of the uncertainties and the non-ideal data inversion methods, especially the stepwise method. Note that large particles with detection efficiencies that do not vary with the saturator flow rate do not lead to a bias in the recovered sub-3 nm particle concentrations. We examined this theoretical deduction experimentally using a PSM to measure ambient particles in the room air and the recorded particle concentration did not significantly vary with the saturator flow rate.
The performance of the four inversion methods in the sub-3 nm size range under the influence of larger particles was tested using a bimodal distribution (Fig. 7a). Similar particle size distributions are usually observed in the atmospheric new particle formation events (Jiang et al., 2011) and in flame (Tang et al., 2017). As shown in Fig. 7, the particle size distribution recovered using the EM algorithm had the highest accuracy and the smallest uncertainties among the four methods. The recovered particle size distribution using the EM algorithm had a slightly different shape compared to the initial distribution because the results were trapped in the local optimum. However, the differences between the recovered and the initial size distributions were the smallest. The standard deviations of the size distribution recovered using the H&A method and the kernel function method were relatively large due to the unstable least squares method. Because of a better assumption of the initial particle size distribution, the H&A method resulted in smaller uncertainties compared to the kernel function method, especially in the sub-2 nm size range. The size distribution recovered using the EM algorithm has higher accuracy and stability compared to both the H&A method and the kernel method because the one-to-one inversion method does not magnify relative errors.
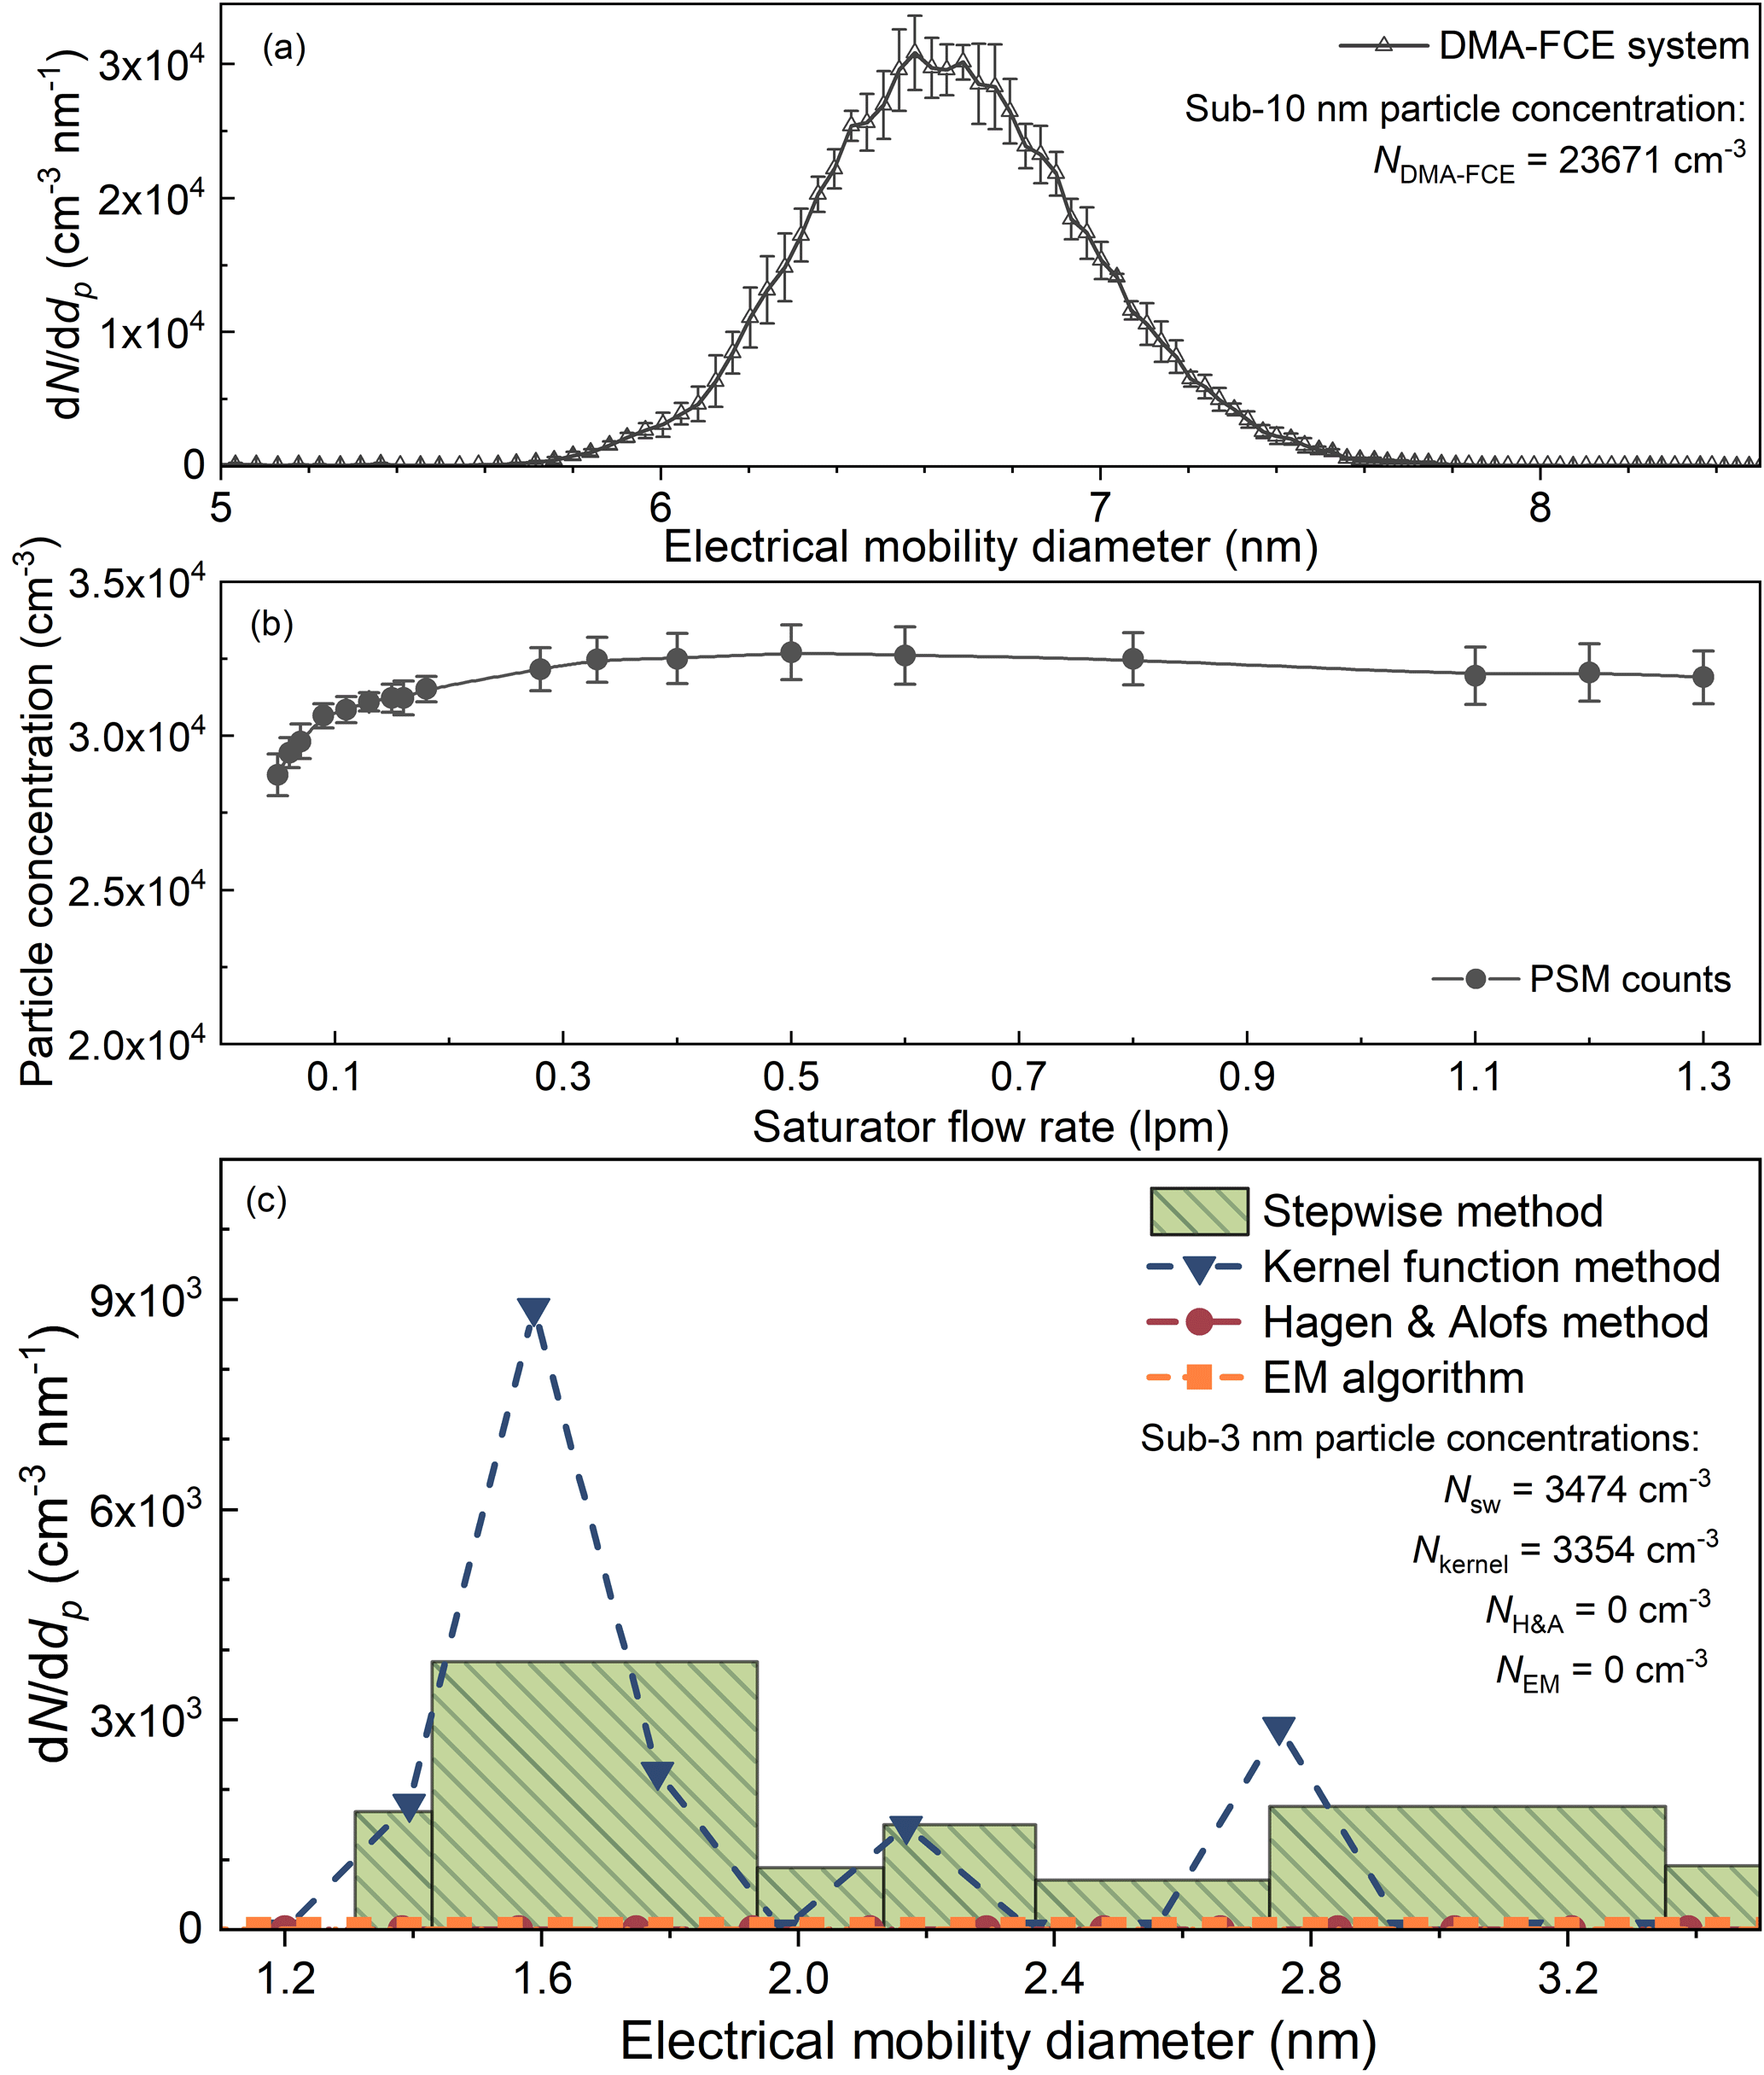
Figure 6The experimental testing results of the four inversion methods when the PSM was measuring particles larger than 3 nm. (a) The particle size distribution detected by the reference half-mini DMA–FCE system. (b) The particle concentrations recorded by the PSM. The error bars indicate the standard deviations of the recorded particle concentrations. (c) The recovered particle distributions using different inversion methods.
Figure 7The input and recovered sub-3 nm particle size distributions simulated using the Monte Carlo method. Note the vertical axes in panels (c)–(f) are not the same.
The experimental tests using bimodal distributions agreed with the simulation results. The particles with a peak diameter at approximately 2.3 nm were classified using the nanoDMA. We added the observed number concentration to those detected in Fig. 6a (particles larger than 5 nm) to account for the influence of large particles. Unfiltered room air served as the make-up flow to provide background particles. As shown in Fig. 8, all the four inversion methods recovered the peak around 2.3 nm, while the results reported by the H&A method and the kernel function method were less smooth compared to the EM algorithm and the stepwise method.
Smoothing the size distribution recovered using the H&A method and the kernel function method into fewer size bins can reduce the uncertainties. We determined the number of the size bins of the recovered distributions according to the number of the fixed saturator flow rates. Too many size bins will lead to relatively large uncertainties, but the uncertainties can be reduced by sacrificing the resolution, i.e. reporting the size distribution in fewer bins. The size distributions recovered using the kernel function method were typically reported in 4–6 bins (Lehtipalo et al., 2014). This was achieved by assuming fewer discrete particle diameters in Eq. (5). Another option is to merge bins into fewer numbers after inversion rather than assume fewer bins at the beginning. Note that the H&A method cannot assume fewer discrete size bins at the beginning. Instead, the H&A method assumes an adequate number of size bins to guarantee a relatively smooth distribution (Eq. 8). As shown in Fig. 9, the standard deviations of the reported size distribution with fewer size bins were comparatively smaller than the corresponding standard deviations with more size bins shown in Fig. 7. The H&A method reported size distributions with smaller standard deviations than the kernel function method, and the kernel function reported in merged size bins had smaller standard deviations than the kernel function method using fewer size bins at the beginning. This is because approximating the true particle size distribution, which is usually a smooth curve, with fewer discrete size bins will lead to larger uncertainties. Thus, we suggest merging the recovered particle size distribution into a few size bins to reduce the uncertainties when using the H&A method and the kernel function method.
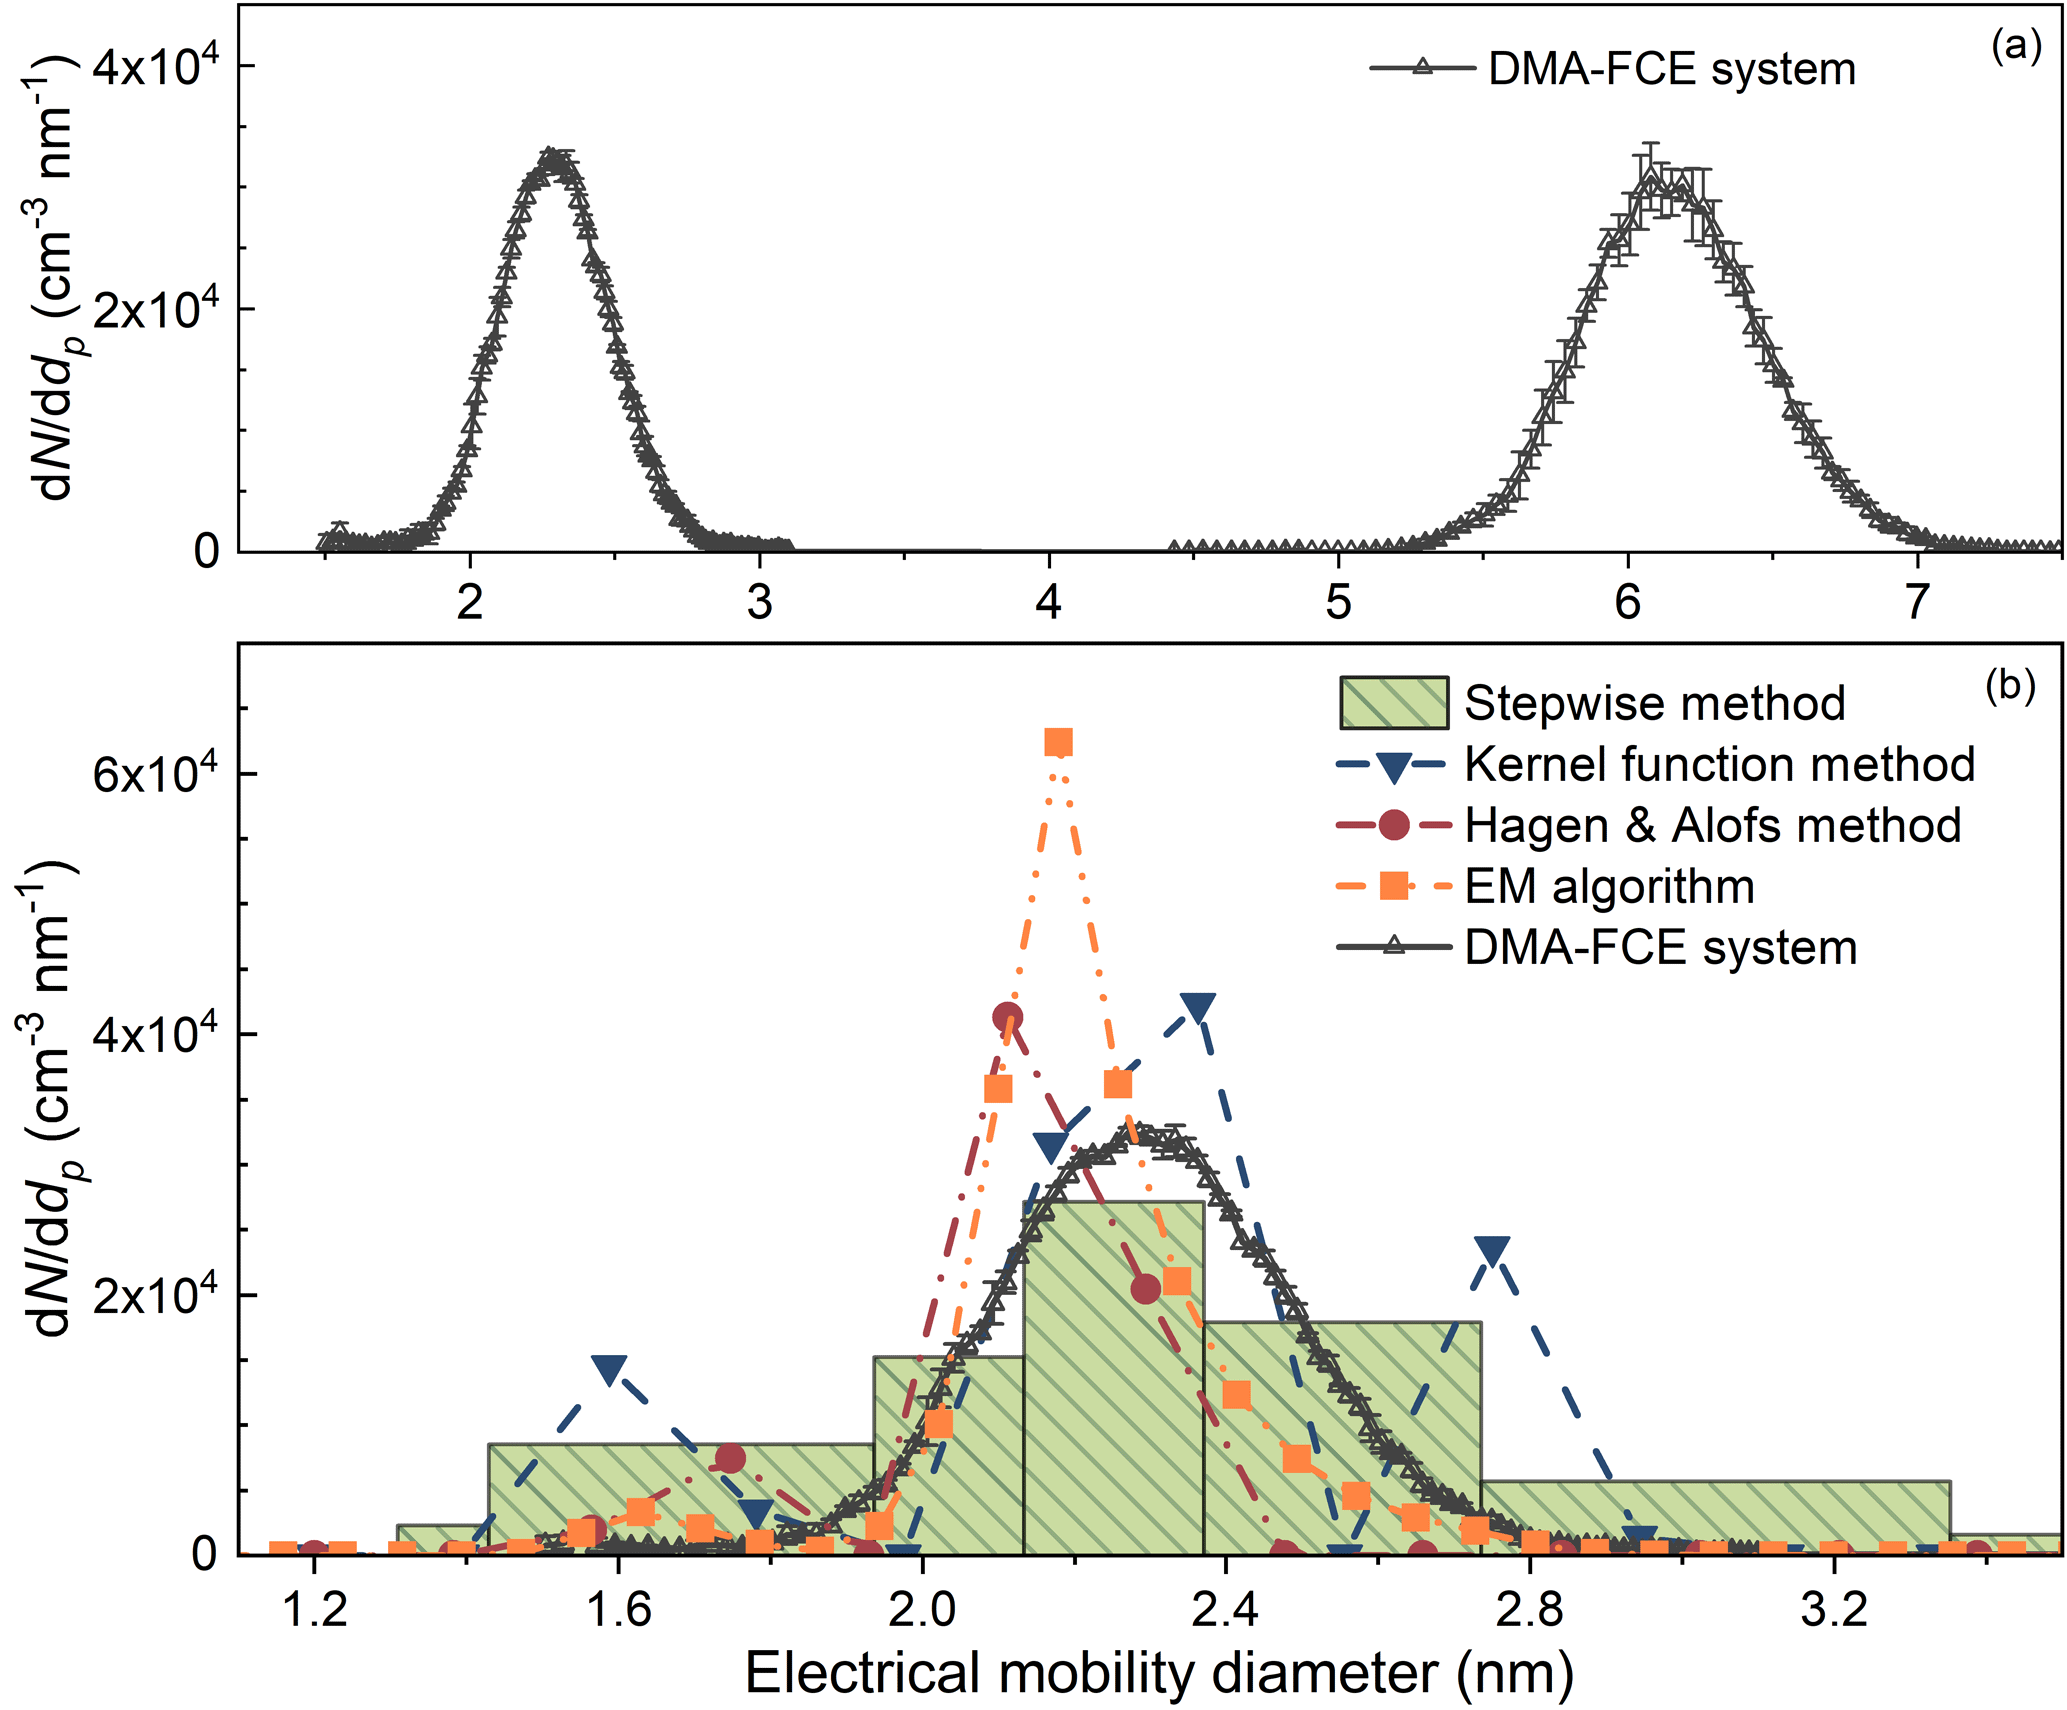
Figure 8The experimental testing results of the four inversion methods when the PSM was measuring sub-3 nm particles with the influence of larger particles. The particle number concentrations for the inversion and the particle size distribution detected using the DMA–FCE system were the sums of two separate experiments rather than real data obtained in a single experiment.
Relatively large uncertainties were found when recovering sub-1.3 nm particle size distributions. A particle size distribution with an increasing dN∕ddp as a function of the decreasing particle diameter, which is a typical particle size distribution observed in the atmospheric new particle formation events (Jiang et al., 2011), was used to test the four inversion methods (Fig. 10). None of the inversion methods reported a particle size distribution with relatively small uncertainties comparable to the inverted results shown in Fig. 7c, especially in the sub-1.3 nm size range. Similarly to the results for particles larger than 3 nm, the low resolution of particles smaller than 1.3 nm (Fig. 2) is possibly the cause of the large uncertainties. In addition, incomplete kernel function peaks and the relatively low detection efficiencies of sub-1.3 nm particles may also contribute to the uncertainties (Fig. 1).
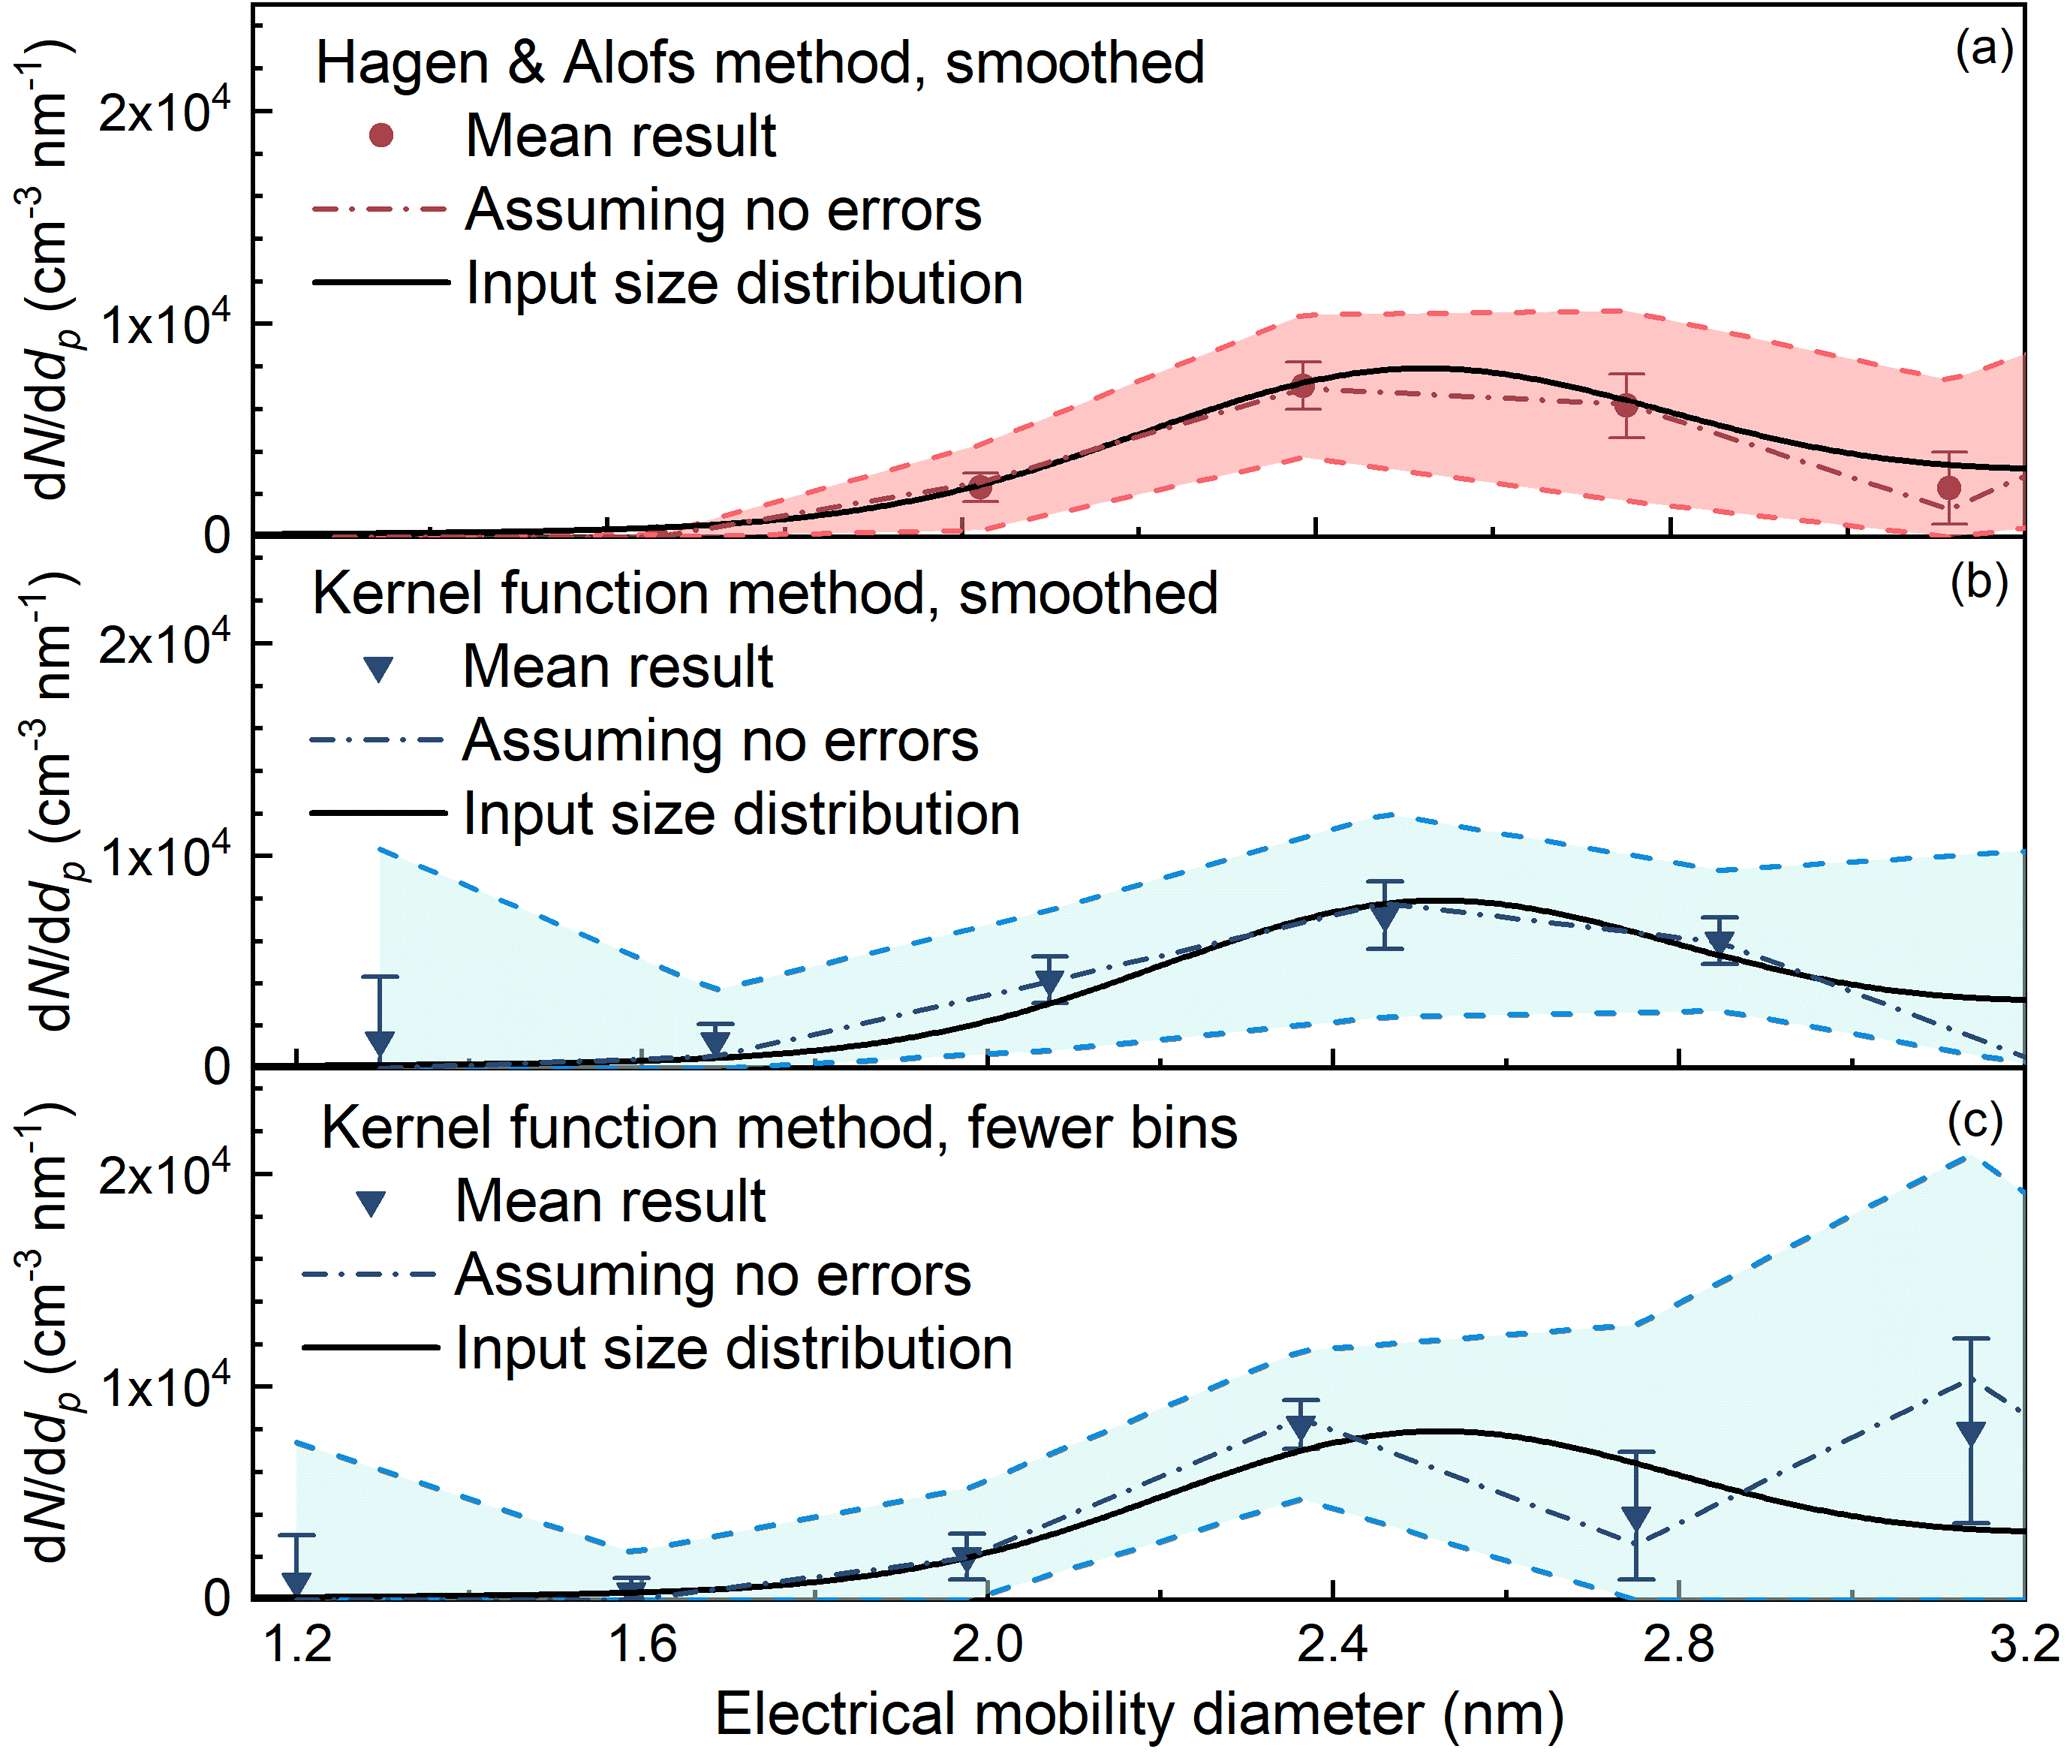
Figure 9Comparisons of the inverted results using (a) the H&A method smoothing the particle size distribution via merging size bins; (b) the kernel function method smoothing the particle size distribution via merging size bins; and (c) the kernel function method assuming fewer discrete particle sizes in Eq. (5).
The performance of the inversion methods under relatively large random errors was also tested. The relative standard deviation used in the above simulations, 3.7 %, was estimated according to laboratory experiments. The relative standard deviations of the recorded particle number concentration obtained from the atmospheric measurement were usually similar to the value obtained in the laboratory, indicating that the random errors were governed by instrumental factors. However, relatively large uncertainties in the recorded particle number concentrations were sometimes observed due to the unstable atmospheric aerosol source. Thus, we simulated the performance of the four inversion methods using a relative standard deviation of 10 %. It should be clarified that the value 10 % only characterizes the random errors in the CPC since it was estimated using the data when the recorded particle number concentration did not vary with the saturator flow rate. Compared to the results in Fig. 7 simulated using the same aerosol size distribution, the uncertainties in the recovered particle size distributions using the larger relative standard deviation of 10 % was larger (Fig. 11). The EM algorithm still reported smaller uncertainties compared to the H&A method and the kernel function method. Note the expected value of sub-2 nm particle size distribution recovered using the kernel method was close to the input size distribution when the uncertainty was 3.7 % (Fig. 7); however, the recovered size distribution in the sub-2 nm size range was non-negligibly overestimated when the uncertainty was 10 % (Fig. 11).
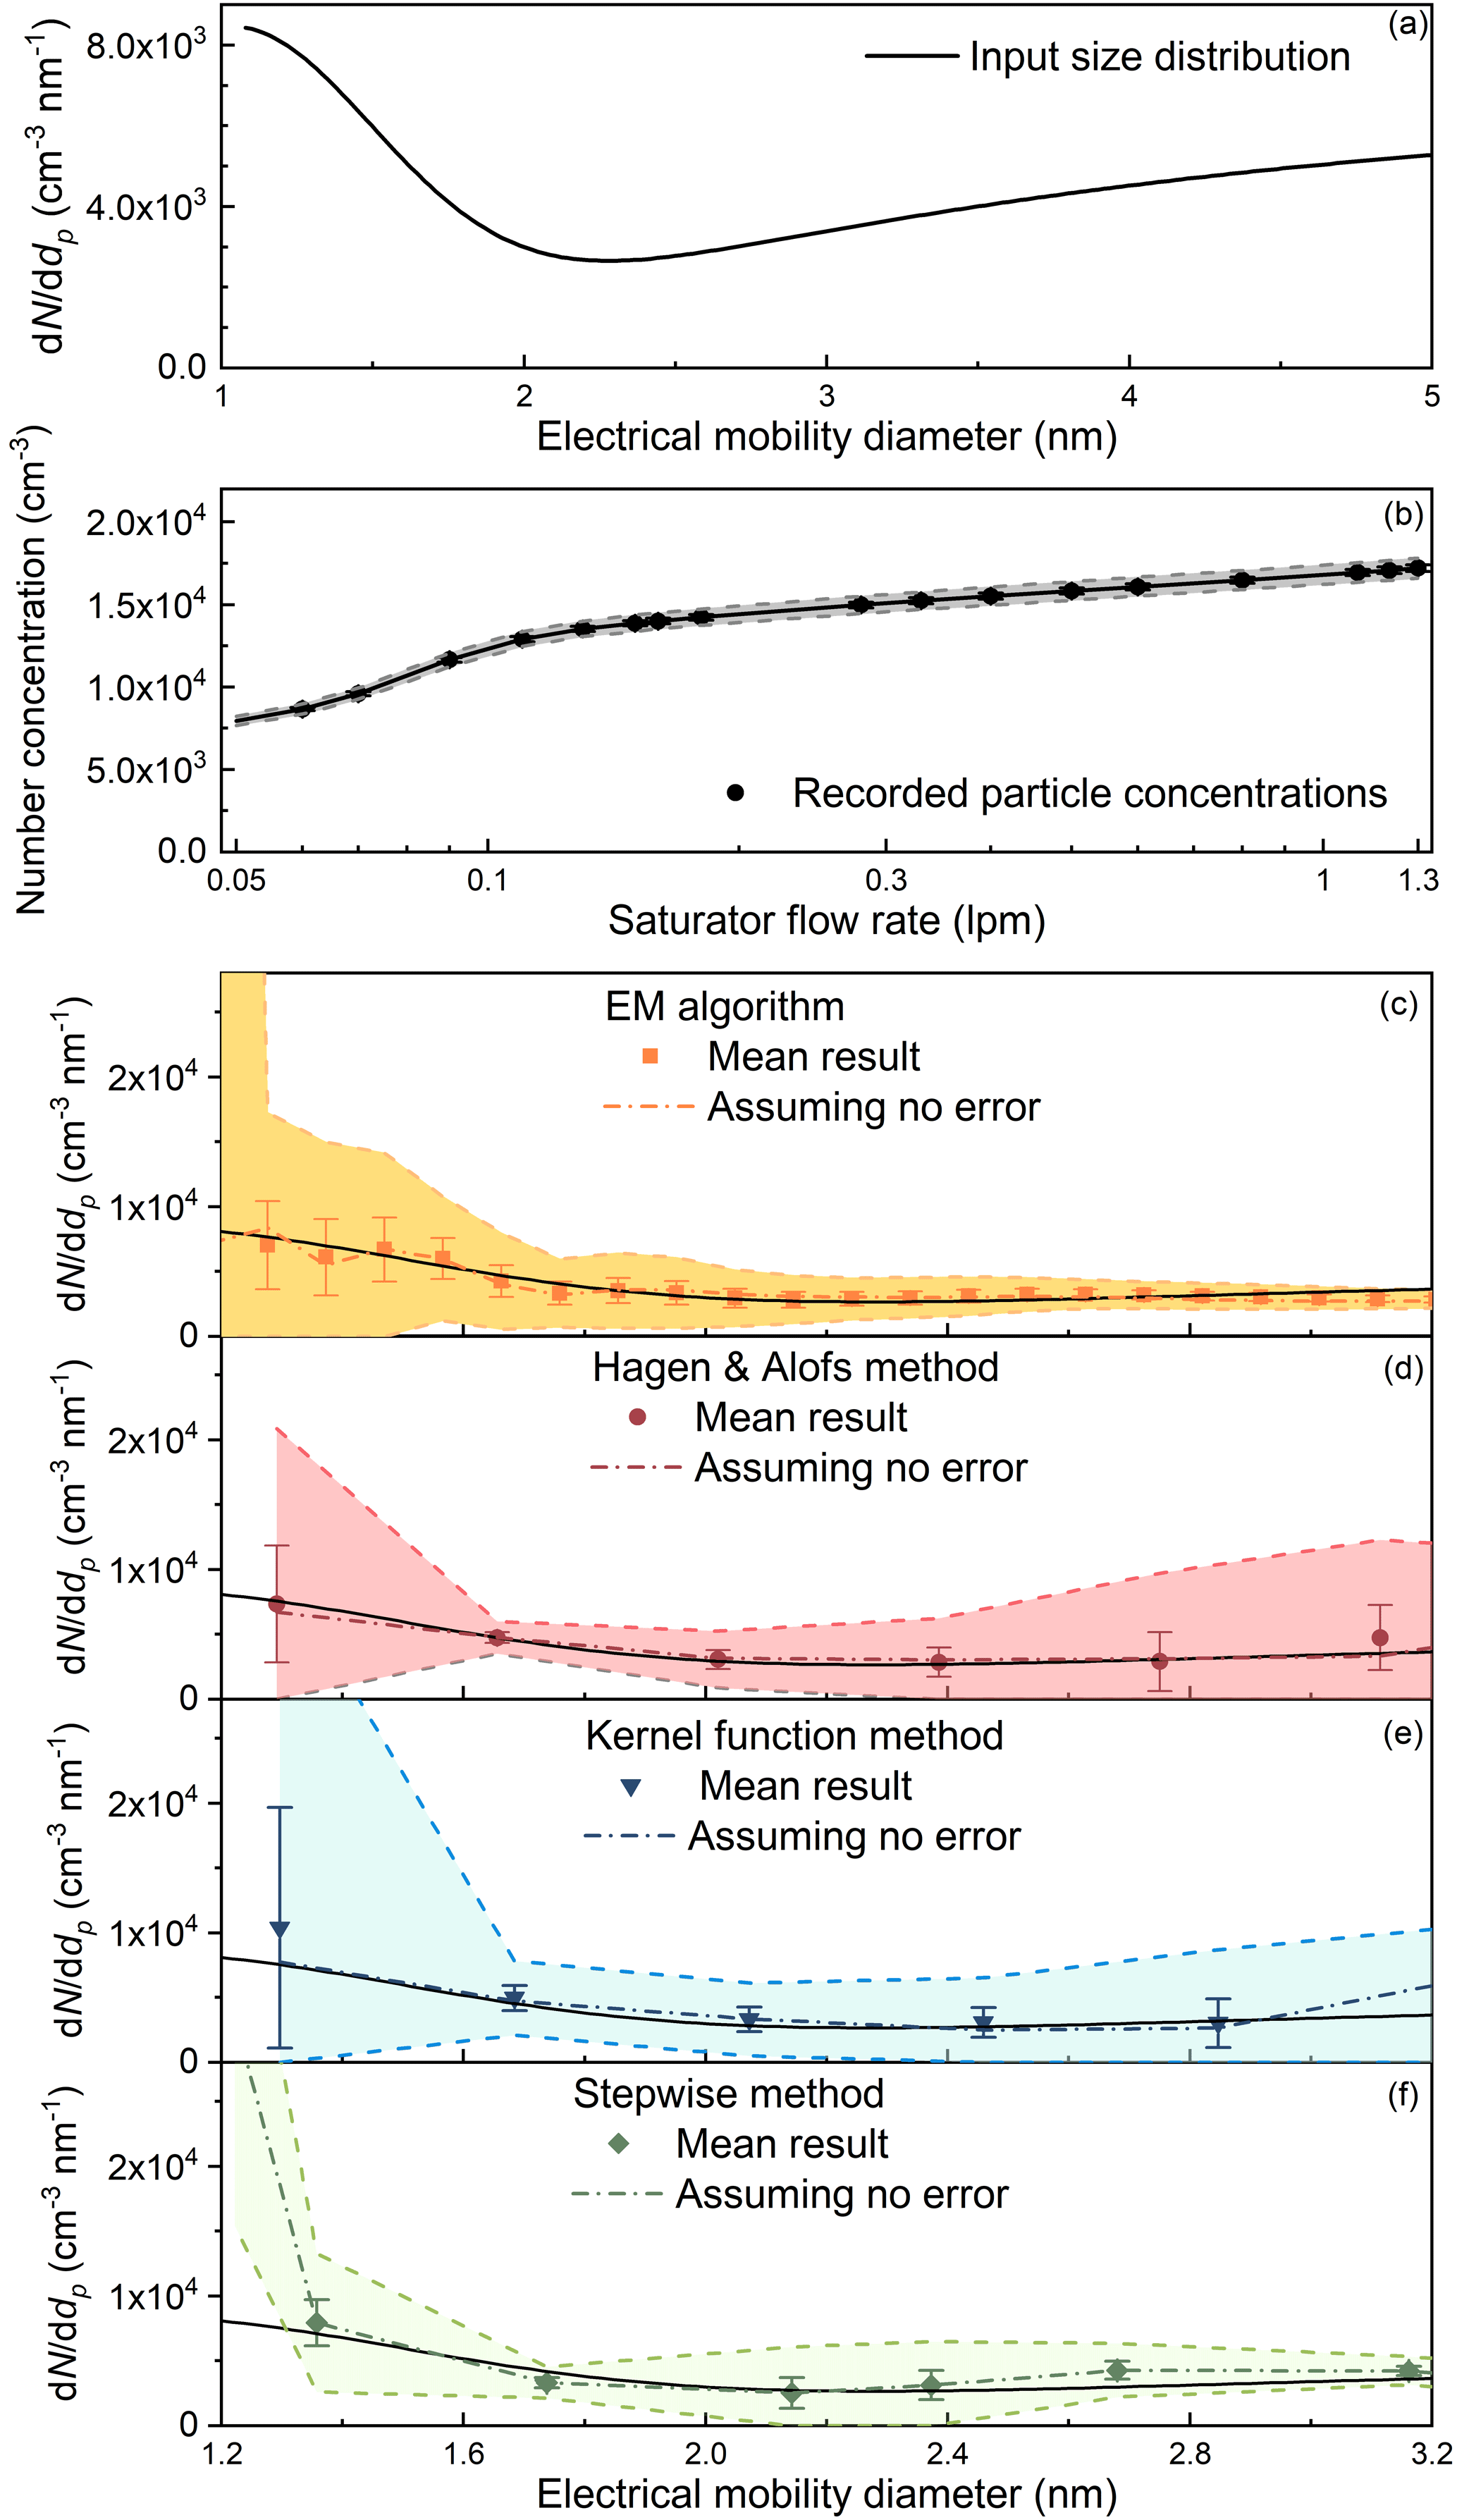
Figure 10The input and recovered sub-3 nm particle size distributions simulated using the Monte Carlo method when the particle size distribution increases with decreasing particle diameter.

Figure 11The recovered particle size distributions simulated using the Monte Carlo method when assuming the relative standard deviation of the recorded particle number concentration are 10 %. The reported size bins smaller than 1.3 nm recovered using the kernel function method and the stepwise method are not shown because of the large uncertainties.
4.3 Uncertainties in the scanning mode
The PSM instrumental factors limiting the accuracy of the inversion were also tested. Although using the EM algorithm and the H&A method can reduce the errors in the recovered size distributions compared to the kernel function method and the stepwise method, relatively small measuring uncertainties are still vital to retrieve a particle size distribution with relatively high accuracy. The uncertainty in the scanning mode, for example, is one of the potential sources of the measuring uncertainties. The saturator flow rate of a scanning PSM increases linearly with time in previous studies. However, the relationship between the particle diameters and the saturator flow rates at the kernel function peaks is non-linear (Fig. 2). The detection efficiencies of particles larger than 1.6 nm vary mainly in the flow rate range from 0.05 to 0.3 L min−1, while the corresponding scanning time is only 20 % of the whole scanning cycle. This non-linear relationship may result in non-negligible uncertainties in the recovered particle size distributions (Fig. 12). The EM algorithm recovered the single peak when using the particle concentrations recorded in the stepping mode. However, the recovered particle size distribution using the EM algorithm was not a single smooth peak when using data recorded in the scanning mode (Fig. 12). This difference can be illustrated using the raw data. The curves of the particle number concentration recorded in the stepping mode and the scanning mode are similar to each other and they both appear to be smooth (Fig. 13a). When presenting in the derivate of the particle number concentration with the respect to saturator flow rate, however, the curve corresponding to the stepping mode appeared to be a single peak, while the other curve corresponding to the scanning mode seemed to be composed of multiple single peaks (Fig. 13b). Since none of the four inversion methods tested in this study add smoothing constraints when solving the Fredholm integral equation of the first kind, this roughness in the raw data will lead to split peaks in the recovered particle size distribution unless one reports the size distribution using only a few size bins.
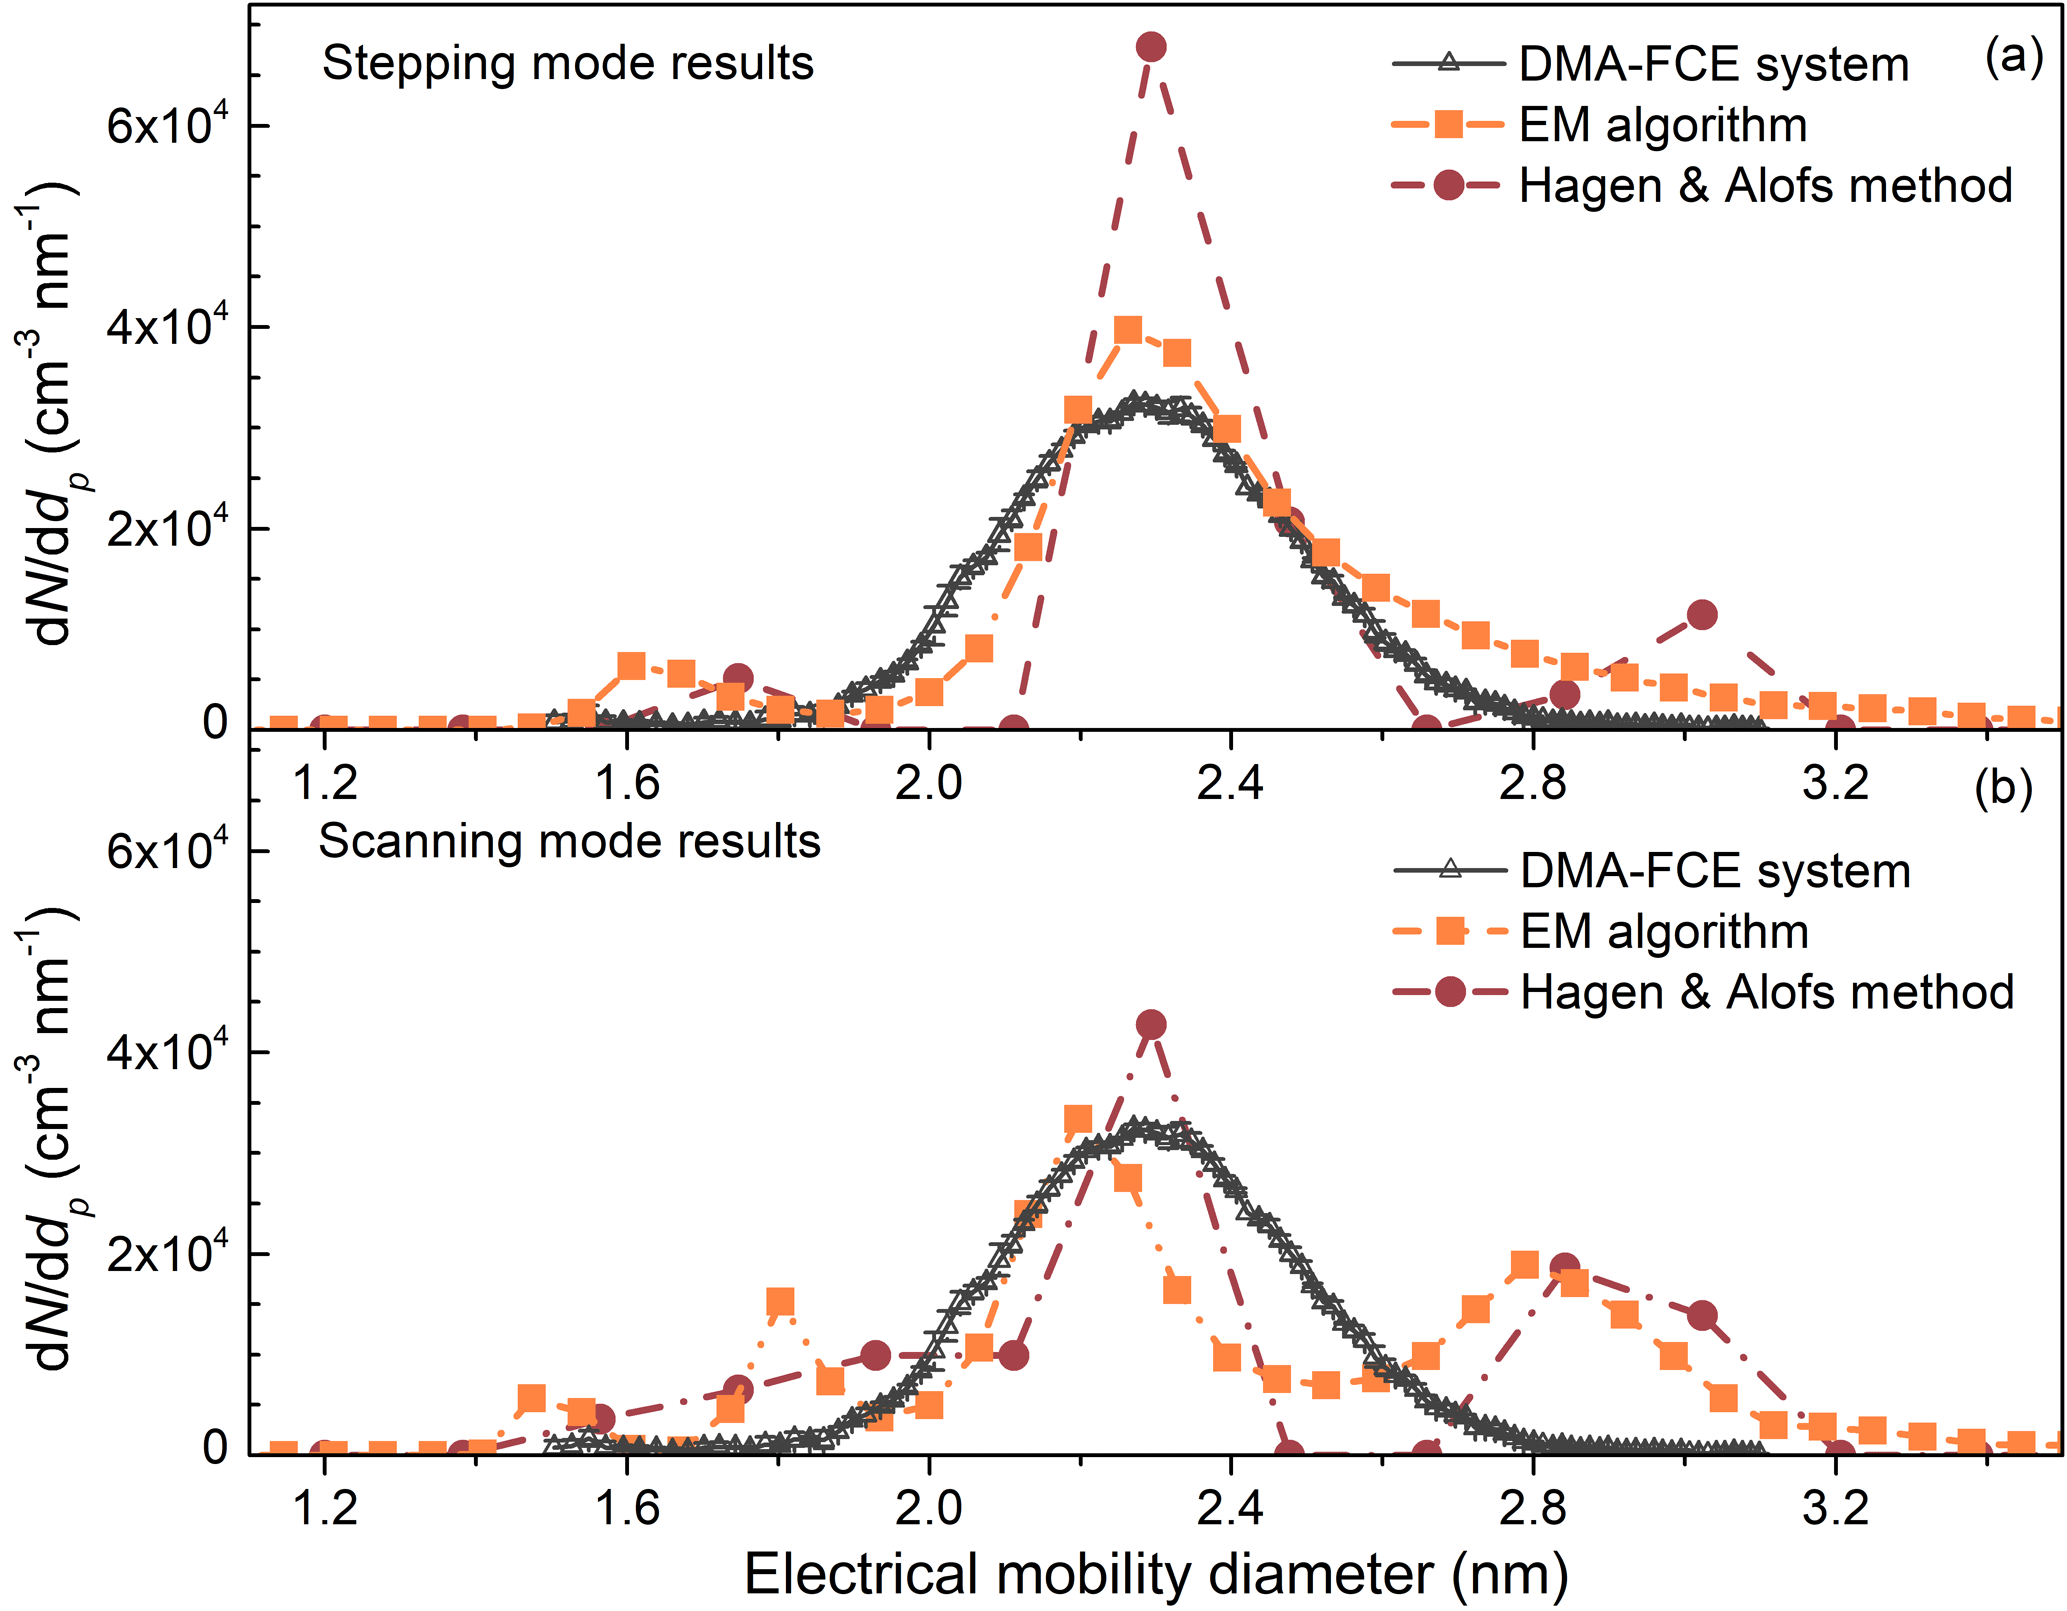
Figure 12The recovered particle size distributions using the particle number concentration recorded in (a) the stepping mode and (b) the scanning mode.
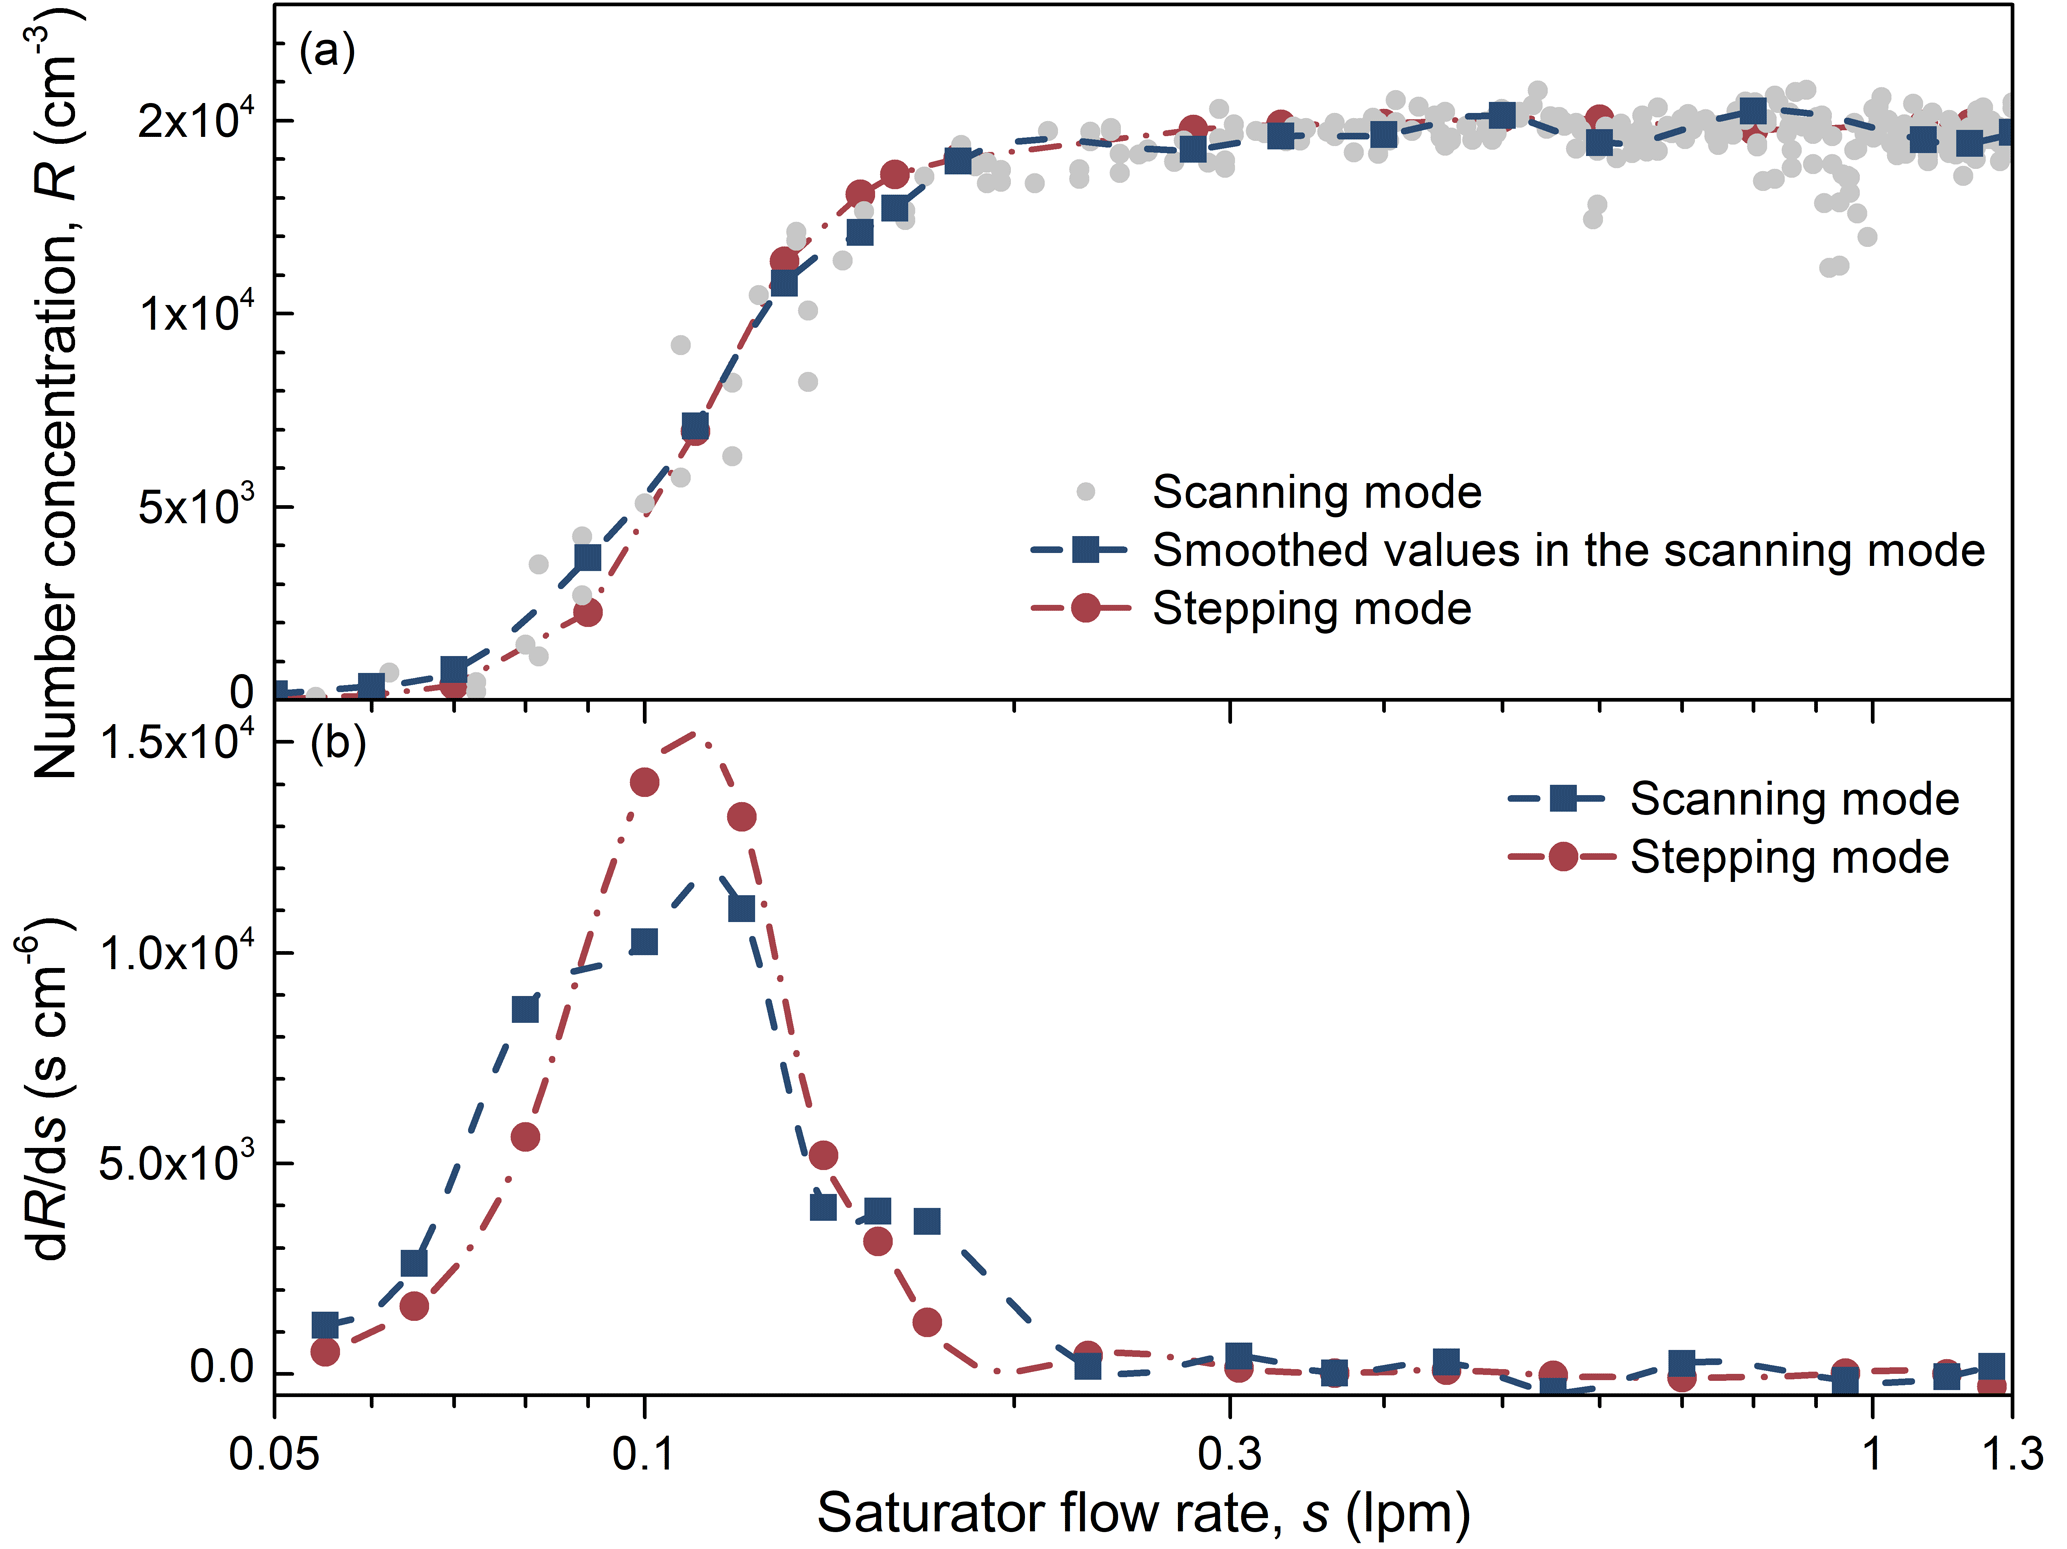
Figure 13(a) The relationship between the recorded particle number concentration and the saturator flow rate in the scanning mode and the stepping mode. (b) The derivative of number concentration with the respect to the saturator flow rate.
4.4 Implications on using the PSM
According to the discussion above, we provide the following suggestions on using a PSM to determine particle size distributions:
- a.
Particle size range and saturator flow rate range
Complete efficiency curves are preferable to determine the particle size distribution in a certain size range. For example, to reduce the uncertainties in the recovered size distribution of ∼3 nm particles, the saturator flow rate in this study was extended from the commonly used 0.1 to 0.05 L min−1 where the detection efficiency of 3.11 nm particles was almost zero. The detection efficiency curves of particles larger than the maximum concerned diameter should also be calibrated to reduce the influence of large particles on the recovered particle size distribution and total concentration. The PSM can theoretically estimate particle size distributions larger than 3 nm or smaller than 1.3 nm; however, the uncertainties are usually large due to the low resolution and the incomplete detection efficiency curves. The particles with detection efficiency of constant values in the measuring saturator flow rate range cannot be determined using a PSM and they do not influence the recovered particle size distributions if their concentrations are stable during each scanning cycle.
- b.
Scanning scheme
The scanning scheme of the saturator flow rate is suggested to be improved to reduce the measuring uncertainties. The scanning scheme is preferably determined to ensure that the particle diameter corresponding to the saturator flow rate increases linearly with time so that the numbers of the recorded particle number concentration at each saturator flow rate are the same when the recovered particle size increases linearly. A convex function between the saturator flow rate and the scanning time, e.g. an exponentially increasing saturator flow rate, is also better than the linear scanning scheme. This improvement may require both the hardware and the software to be updated.
- c.
Inversion method
We suggest using the EM algorithm to address the PSM inversion problem because the particle size distributions recovered using the EM algorithm have the best accuracy and stability among the four tested methods. However, considering the relatively high computational expense of the EM algorithm, the H&A method reporting in merged size bins is recommended to be used for preliminary data analysis and to meet the need of fast inversion, e.g. real-time display on the instrumental screen. The accuracy of the recovered size distribution is also determined by the uncertainties in the recorded number concentration rather than the inversion method alone. The inversion methods suggested in this study do not necessarily ensure an accurate inverted result without properly determined detection efficiencies and an improved scanning scheme.
- d.
Uncertainties in atmospheric measurement
One should be always aware of the potential uncertainties in the recovered particle size distribution, especially when conducting atmospheric measurement. The reported sub-3 nm particle concentrations may give false results due to systematic and random errors, especially when using the stepwise method. The number of the reported size bins should also be carefully limited. For example, the EM algorithm can theoretically provide infinite size bins; however, we suggest reducing the reported size bins to avoid false fluctuations.
We tested the performance of four inversion methods to recover particle size distributions from the particle size magnifier data using a Monte Carlo simulation and experiments. The four inversion methods are the stepwise method, the kernel function method, the H&A method, and the EM algorithm. The stepwise method may report false sub-3 nm particle concentrations when there are no sub-3 nm particles in the input aerosol because it does not account for the influence of particles larger than 3 nm. The kernel function method and the H&A method may lead to relatively large uncertainties in the recovered particle size distribution because of the unstable least squares method, and they occasionally report false sub-3 nm concentrations due to the large uncertainties. Compared to the kernel function method, the H&A leads to smaller uncertainties while having a similar computation expense. This is because the H&A method assumes a near-continuous size distribution rather than a discrete distribution with limited size bins. One can reduce the uncertainties via merging the particle size distribution reported by the H&A method into fewer size bins. Among the tested inversion methods, the EM algorithm has the highest accuracy and stability. Another advantage of the EM algorithm over the other three methods is that it does not limit the number of the particle size bins. The instrumental factors also limit the accuracy and precision of the recovered particle size distribution. The uncertainties of the recovered size distributions of particle smaller than 1.3 nm or larger than 3 nm may be significant due to the incomplete kernel function curves, the low resolution, and/or the low detection efficiency. The measuring uncertainties in the scanning mode may also increase the uncertainties of the recovered size distribution.
Based on this study, we suggest that (a) the EM algorithm is used to recover the particle size distribution measured by the PSM and the H&A method can be used for preliminary data analysis and fast inversion purposes; (b) the hardware and software of the PSM should be improved to reduce the measuring uncertainties, e.g. via changing the scanning scheme of the saturator flow rate; and (c) one should carefully distinguish the false inverted results from the true sub-3 nm particles, especially in the sub-2 nm size range and/or when using the stepwise method.
The characterizations of the tested PSM are shown in the figures. The Matlab scripts for the inversion methods are available upon request.
RC, DY, JZ, and JJ conceived the study. RC and DY conducted the experiments at Tsinghua University with contributions from LS, YM, JH, JZ, and JJ. RC conducted similar experiments at the University of Helsinki with contributions from LRA, FK, TP, and JK. RC analysed data using various inversion methods with contributions from DY and all other co-authors. RC, DY, JZ, and JJ wrote the paper with contributions from all other co-authors.
The authors declare that they have no conflict of interest.
Financial support from the National Key R&D Program of China
(2017YFC0209503), the National Natural Science Foundation of China (21521064
& 41730106), ACTRIS-2 (grant agreement no. 654109), the Academy of
Finland (project no. 307331), and Faculty of Science, University of
Helsinki is acknowledged. Runlong Cai appreciates the support from China
Scholarship Council (CSC) and is grateful for his visit to University of Helsinki.
Edited by: Bin Yuan
Reviewed by: two anonymous referees
Ahonen, L. R., Kangasluoma, J., Lammi, J., Lehtipalo, K., Hämeri, K., Petäjä, T., and Kulmala, M.: First measurements of the number size distribution of 1–2 nm aerosol particles released from manufacturing processes in a cleanroom environment, Aerosol Sci. Tech., 51, 685–693, 2017.
Buckley, D. T. and Hogan, C. J.: Determination of the transfer function of an atmospheric pressure drift tube ion mobility spectrometer for nanoparticle measurements, Analyst, 142, 1800–1812, 2017.
Dempster, A. P., Laird, N. M., and Rubin, D. B.: Maximum likelihood from incomplete data via the EM algorithm, J. Roy. Stat. Soc. B Met., 39, 1–38, 1977.
Do, C. B. and Batzoglou, S.: What is the expectation maximization algorithm?, Nat. Biotechnol., 26, 897–899, 2008.
Ellis, S. P.: Instability of least square, least absolute deviation and least median of squares linear regression, Stat. Sci., 13, 337–350, 1998.
Fernández de la Mora, J. and Kozlowski, J.: Hand-held differential mobility analyzers of high resolution for 1–30 nm particles: Design and fabrication considerations, J. Aerosol Sci., 57, 45–53, 2013.
Ferri, F., Giglio, M., and Perini, U.: Inversion of light scattering data from fractals by the Chahine iterative algorithm, Appl. Optics, 28, 3074–3082, 1989.
Flagan, R. C.: On Differential Mobility Analyzer Resolution, Aerosol Sci. Tech., 30, 556–570, 1999.
Fuchs, N. A., Stechkina, I. B., and Starosselskii, V. I.: On the determination of particle size distribution in polydisperse aerosols by the diffusion method, Brit. J. Appl. Phys., 13, 280–281, 1962.
Hagen, D. E. and Alofs, D. J.: Linear inversion method to obtain aerosol size distributions from measurements with a differential mobility analyzer, Aerosol Sci. Tech., 2, 465–475, 1983.
Hansen, P. C.: Analysis of discrete ill-posed problems by means of the L-curve, SIAM Review, 34, 561–580, 1992.
Iida, K.: Atmospheric nucleation: Development and application of nanoparticle measurements to assess the roles of ion-induced and neutral processes, PhD, University of Minnesota, Minneapolis, USA, 2008.
Jiang, J., Zhao, J., Chen, M., Eisele, L. F., Scheckman, J., Williams, J. B., Kuang, C., and McMurry, H. P.: First Measurements of Neutral Atmospheric Cluster and 1–2 nm Particle Number Size Distributions During Nucleation Events, Aerosol Res. Lett., 45, ii–v, https://doi.org/10.1080/02786826.2010.546817, 2011.
Kandlikar, M. and Ramachandran, G.: Inverse methods for analysing aerosol spectrometer measurements: a critical review, J. Aerosol Sci., 30, 413–437, 1999.
Kangasluoma, J. and Kontkanen, J.: On the sources of uncertainty in the sub-3 nm particle concentration measurement, J. Aerosol Sci., 112, 34–51, 2017.
Kangasluoma, J., Junninen, H., Lehtipalo, K., Mikkilä, J., Vanhanen, J., Attoui, M., Sipilä, M., Worsnop, D., Kulmala, M., and Petäjä, T.: Remarks on Ion Generation for CPC Detection Efficiency Studies in Sub-3-nm Size Range, Aerosol Sci. Tech., 47, 556–563, 2013.
Kangasluoma, J., Attoui, M., Junninen, H., Lehtipalo, K., Samodurov, A., Korhonen, F., Sarnela, N., Schmidt-Ott, A., Worsnop, D., Kulmala, M., and Petäjä, T.: Sizing of neutral sub 3 nm tungsten oxide clusters using Airmodus Particle Size Magnifier, J. Aerosol Sci., 87, 53–62, 2015.
Kangasluoma, J., Samodurov, A., Attoui, M., Franchin, A., Junninen, H., Korhonen, F., Kurtén, T., Vehkamäki, H., Sipilä, M., Lehtipalo, K., Worsnop, D. R., Petäjä, T., and Kulmala, M.: Heterogeneous Nucleation onto Ions and Neutralized Ions: Insights into Sign-Preference, J. Phys. Chem. C, 120, 7444–7450, 2016a.
Kangasluoma, J., Attoui, M., Korhonen, F., Ahonen, L., Siivola, E., and Petäjä, T.: Characterization of a Herrmann-type high-resolution differential mobility analyzer, Aerosol Sci. Tech., 50, 222–229, 2016b.
Knutson, E. O.: History of Diffusion Batteries in Aerosol Measurements, Aerosol Sci. Tech., 31, 83–128, 1999.
Kontkanen, J., Lehtipalo, K., Ahonen, L., Kangasluoma, J., Manninen, H. E., Hakala, J., Rose, C., Sellegri, K., Xiao, S., Wang, L., Qi, X., Nie, W., Ding, A., Yu, H., Lee, S., Kerminen, V.-M., Petäjä, T., and Kulmala, M.: Measurements of sub-3 nm particles using a particle size magnifier in different environments: from clean mountain top to polluted megacities, Atmos. Chem. Phys., 17, 2163–2187, https://doi.org/10.5194/acp-17-2163-2017, 2017.
Kuang, C., Chen, M., Zhao, J., Smith, J., McMurry, P. H., and Wang, J.: Size and time-resolved growth rate measurements of 1 to 5 nm freshly formed atmospheric nuclei, Atmos. Chem. Phys., 12, 3573–3589, https://doi.org/10.5194/acp-12-3573-2012, 2012.
Kulmala, M., Petäjä, T., Nieminen, T., Sipilä, M., Manninen, H. E., Lehtipalo, K., Dal Maso, M., Aalto, P. P., Junninen, H., Paasonen, P., Riipinen, I., Lehtinen, K. E., Laaksonen, A., and Kerminen, V. M.: Measurement of the nucleation of atmospheric aerosol particles, Nat. Protoc., 7, 1651–1667, 2012.
Kulmala, M., Kontkanen, J., Junninen, H., Lehtipalo, K., Manninen, H. E., Nieminen, T., Petaja, T., Sipila, M., Schobesberger, S., Rantala, P., Franchin, A., Jokinen, T., Jarvinen, E., Aijala, M., Kangasluoma, J., Hakala, J., Aalto, P. P., Paasonen, P., Mikkila, J., Vanhanen, J., Aalto, J., Hakola, H., Makkonen, U., Ruuskanen, T., Mauldin, R. L., Duplissy, J., Vehkamaki, H., Back, J., Kortelainen, A., Riipinen, I., Kurten, T., Johnston, M. V., Smith, J. N., Ehn, M., Mentel, T. F., Lehtinen, K. E., Laaksonen, A., Kerminen, V. M., and Worsnop, D. R.: Direct observations of atmospheric aerosol nucleation, Science, 339, 943–946, 2013.
Lehtipalo, K., Leppä, J., Kontkanen, J., Kangasluoma, J., Franchin, A., Wimmer, D., Schobesberger, S., Junninen, H., Petäjä, T., Sipilä, M., Mikkilä, J., Vanhanen, J., Worsnop, D. R., and Kulmala, M.: Methods for determining particle size distribution and growth rates between 1 and 3 nm using the Particle Size Magnifier, Boreal Environ. Res., 19, 215–236, 2014.
Maher, E. F. and Laird, N. M.: EM algorithm reconstruction of particle size distributions from diffusion battery data, J. Aerosol Sci., 16, 557–570, 1985.
Markowski, G. R.: Improving Twomey's Algorithm for Inversion of Aerosol Measurement Data, Aerosol Sci. Tech., 7, 127–141, 1987.
Nosko, O., Vanhanen, J., and Olofsson, U.: Emission of 1.3–10 nm airborne particles from brake materials, Aerosol Sci. Tech., 51, 91–96, 2016.
Onischuk, A. A., Baklanov, A. M., Valiulin, S. V., Moiseenko, P. P., and Mitrochenko, V. G.: Aerosol diffusion battery: The retrieval of particle size distribution with the help of analytical formulas, Aerosol Sci. Tech., 52, 165–181, https://doi.org/10.1080/02786826.2017.1387642, 2018.
Peineke, C., Attoui, M. B., and Schmidt-Ott, A.: Using a glowing wire generator for production of charged, uniformly sized nanoparticles at high concentrations, J. Aerosol Sci., 37, 1651–1661, 2006.
Raabe, O. G.: A general method for fitting size distributions to multicomponent aerosol data using weighted least-squares, Environ. Sci. Technol., 12, 1162–1167, 1978.
Ramachandran, G. and Cooper, D. W. (Eds.): Size distribution data analysis and presentation, John Wiley & Sons, New York, USA, 2011.
Ramachandran, G. and Kandlikar, M.: Bayesian analysis for inversion of aerosol size distribution data, J. Aerosol Sci., 27, 1099–1112, 1996.
Richards, F. J.: A flexible growth function for empirical use, J. Exp. Bot., 10, 290–301, 1959.
Schäfer, H., Sternin, E., Stannarius, R., Arndt, M., and Kremer, F.: Novel Approach to the Analysis of Broadband Dielectric Spectra, Phys. Rev. Lett., 76, 2177–2180, 1996.
Tang, Q., Cai, R., You, X., and Jiang, J.: Nascent soot particle size distributions down to 1 nm from a laminar premixed burner-stabilized stagnation ethylene flame, P. Combust. Inst., 36, 993–1000, 2017.
Tikhonov, A. N.: On the solution of ill-posed problems and the method of regularization, Dokl. Akad. Nauk SSSR+, 151, 501–504, 1963.
Twomey, S.: Comparison of constarined linear inversion and an iterative nonlinear algorithm allplied to the indirect estimation of particle size distributions, J. Comput. Phys., 18, 188–200, 1975.
Ude, S. and de la Mora, J. F.: Molecular monodisperse mobility and mass standards from electrosprays of tetra-alkyl ammonium halides, J. Aerosol Sci., 36, 1224–1237, 2005.
Vanhanen, J., Mikkilä, J., Lehtipalo, K., Sipilä, M., Manninen, H. E., Siivola, E., Petäjä, T., and Kulmala, M.: Particle Size Magnifier for Nano-CN Detection, Aerosol Sci. Tech., 45, 533–542, 2011.
Wahba, G.: Practical approximate solutions to linear operator equations when the data are noisy, SIAM J. Numer. Anal., 14, 651–667, 1977.
Winklmayr, W., Wang, H.-C., and John, W.: Adaptation of the Twomey Algorithm to the Inversion of Cascade Impactor Data, Aerosol Sci. Tech., 13, 322–331, 1990.
Wu, J. J., Cooper, D. W., and Miller, R. J.: Evaluation of aerosol deconvolution algorithms for determining submicron particle size distribution with diffusion battery and condensation nucleus counter, J. Aerosol Sci., 20, 477–482, 1989.