the Creative Commons Attribution 4.0 License.
the Creative Commons Attribution 4.0 License.
 | 08 Aug 2018
NO2 and HCHO measurements in Korea from 2012 to 2016 from Pandora spectrometer instruments compared with OMI retrievals and with aircraft measurements during the KORUS-AQ campaign
Elena Spinei
Alan Fried
Jhoon Kim
Jae Kim
Woogyung Kim
Alexander Cede
Nader Abuhassan
Michal Segal-Rozenhaimer
Nine Pandora spectrometer instruments (PSI) were installed at eight sites in South Korea as part of the KORUS-AQ (Korea U.S.-Air Quality) field study integrating information from ground, aircraft, and satellite measurements for validation of remote sensing air-quality studies. The PSI made direct-sun measurements of total vertical column NO2, C(NO2), with high precision (0.05 DU, where 1 DU molecules cm−2) and accuracy (0.1 DU) that were retrieved using spectral fitting techniques. Retrieval of formaldehyde C(HCHO) total column amounts were also obtained at five sites using the recently improved PSI optics. The C(HCHO) retrievals have high precision, but possibly lower accuracy than for NO2 because of uncertainty about the optimum spectral window for all ground-based and satellite instruments. PSI direct-sun retrieved values for C(NO2) and C(HCHO) are always significantly larger than OMI (AURA satellite Ozone Monitoring Instrument) retrieved C(NO2) and C(HCHO) for the OMI overpass local times ( h). In urban areas, PSI C(NO2) 30-day running averages are at least a factor of two larger than OMI averages. Similar differences are seen for C(HCHO) in Seoul and nearby surrounding areas. Late afternoon values of C(HCHO) measured by PSI are even larger, implying that OMI early afternoon measurements underestimate the effect of poor air quality on human health. The primary cause of OMI underestimates is the large OMI field of view (FOV) that includes regions containing low values of pollutants. In relatively clean areas, PSI and OMI are more closely in agreement. C(HCHO) amounts were obtained for five sites, Yonsei University in Seoul, Olympic Park, Taehwa Mountain, Amnyeondo, and Yeoju. Of these, the largest amounts of C(HCHO) were observed at Olympic Park and Taehwa Mountain, surrounded by significant amounts of vegetation. Comparisons of PSI C(HCHO) results were made with the Compact Atmospheric Multispecies Spectrometer CAMS during overflights on the DC-8 aircraft for Taehwa Mountain and Olympic Park. In all cases, PSI measured substantially more C(HCHO) than obtained from integrating the CAMS altitude profiles. PSI C(HCHO) at Yonsei University in Seoul frequently reached 0.6 DU and occasionally exceeded 1.5 DU. The semi-rural site, Taehwa Mountain, frequently reached 0.9 DU and occasionally exceeded 1.5 DU. Even at the cleanest site, Amnyeondo, C(HCHO) occasionally exceeded 1 DU.


The purpose of this paper is to present the retrieved total column amounts of nitrogen dioxide and formaldehyde, C(NO2) and C(HCHO), obtained from Pandora spectrometer instruments (PSI) direct-sun observations during the KORUS-AQ campaign (Korea US Air Quality: May–June 2016). Quoting from a NASA website:
Korea U.S.-Air Quality (KORUS-AQ) is a joint field study between NASA and the Republic of Korea to advance the ability to monitor air pollution from space. The campaign will assess air quality across urban, rural, and coastal South Korea using observations from aircraft, ground sites, ships, and satellites to test air quality models and remote sensing methods. Findings will help develop observing systems using models and data to improve air quality assessments for decision makers.
A thorough description of the KORUS-AQ campaign and its motivations is given in a pre-campaign white paper, https://espo.nasa.gov/korus-aq/content/KORUS-AQ_White_Paper (last access: 31 July 2018).
Assessing air quality in South Korea is of interest because of the levels of pollution arising from high densities of population and intense industrial activity associated with the production of NO2. Recent measurements of surface concentrations of NO2 and comparisons with satellite data demonstrate the need for high quality ground-based measurements to augment satellite observations (Kim et al., 2017; Jung et al., 2017). The driving reason behind the interest is the effect of elevated levels of NO2 in Korea on human health (Kim and Song, 2017 and references therein). Measurements of NO2 from aircraft have been used to obtain altitude profiles to compare with data obtained from fixed site measurements and to obtain a national scale estimate of pollutant exposure (Lee et al., 2016; Kim and Song, 2017).
In addition to NO2, PSI measurements were used to assess the amount of formaldehyde (HCHO) present in the air. This is important because of HCHO's potential impact on health (Zhang et al., 2013; Zhu et al., 2017) and because it plays a strong role in tropospheric reactions leading to the formation of boundary layer ozone. Sources of HCHO are from atmospheric reactions with volatile organic compounds (VOC) emitted from ground sources and industrial activities (Lei at al., 2009). A previous paper describes HCHO retrievals from a PSI located at Yonsei University in Seoul using a similar spectral fitting retrieval algorithm used in the current study (Park et al., 2018), but using a different wavelength fitting range, 335–358 nm instead of 332–359 nm used in this study. The choice of spectral fitting window is discussed in Spinei et al. (2018).
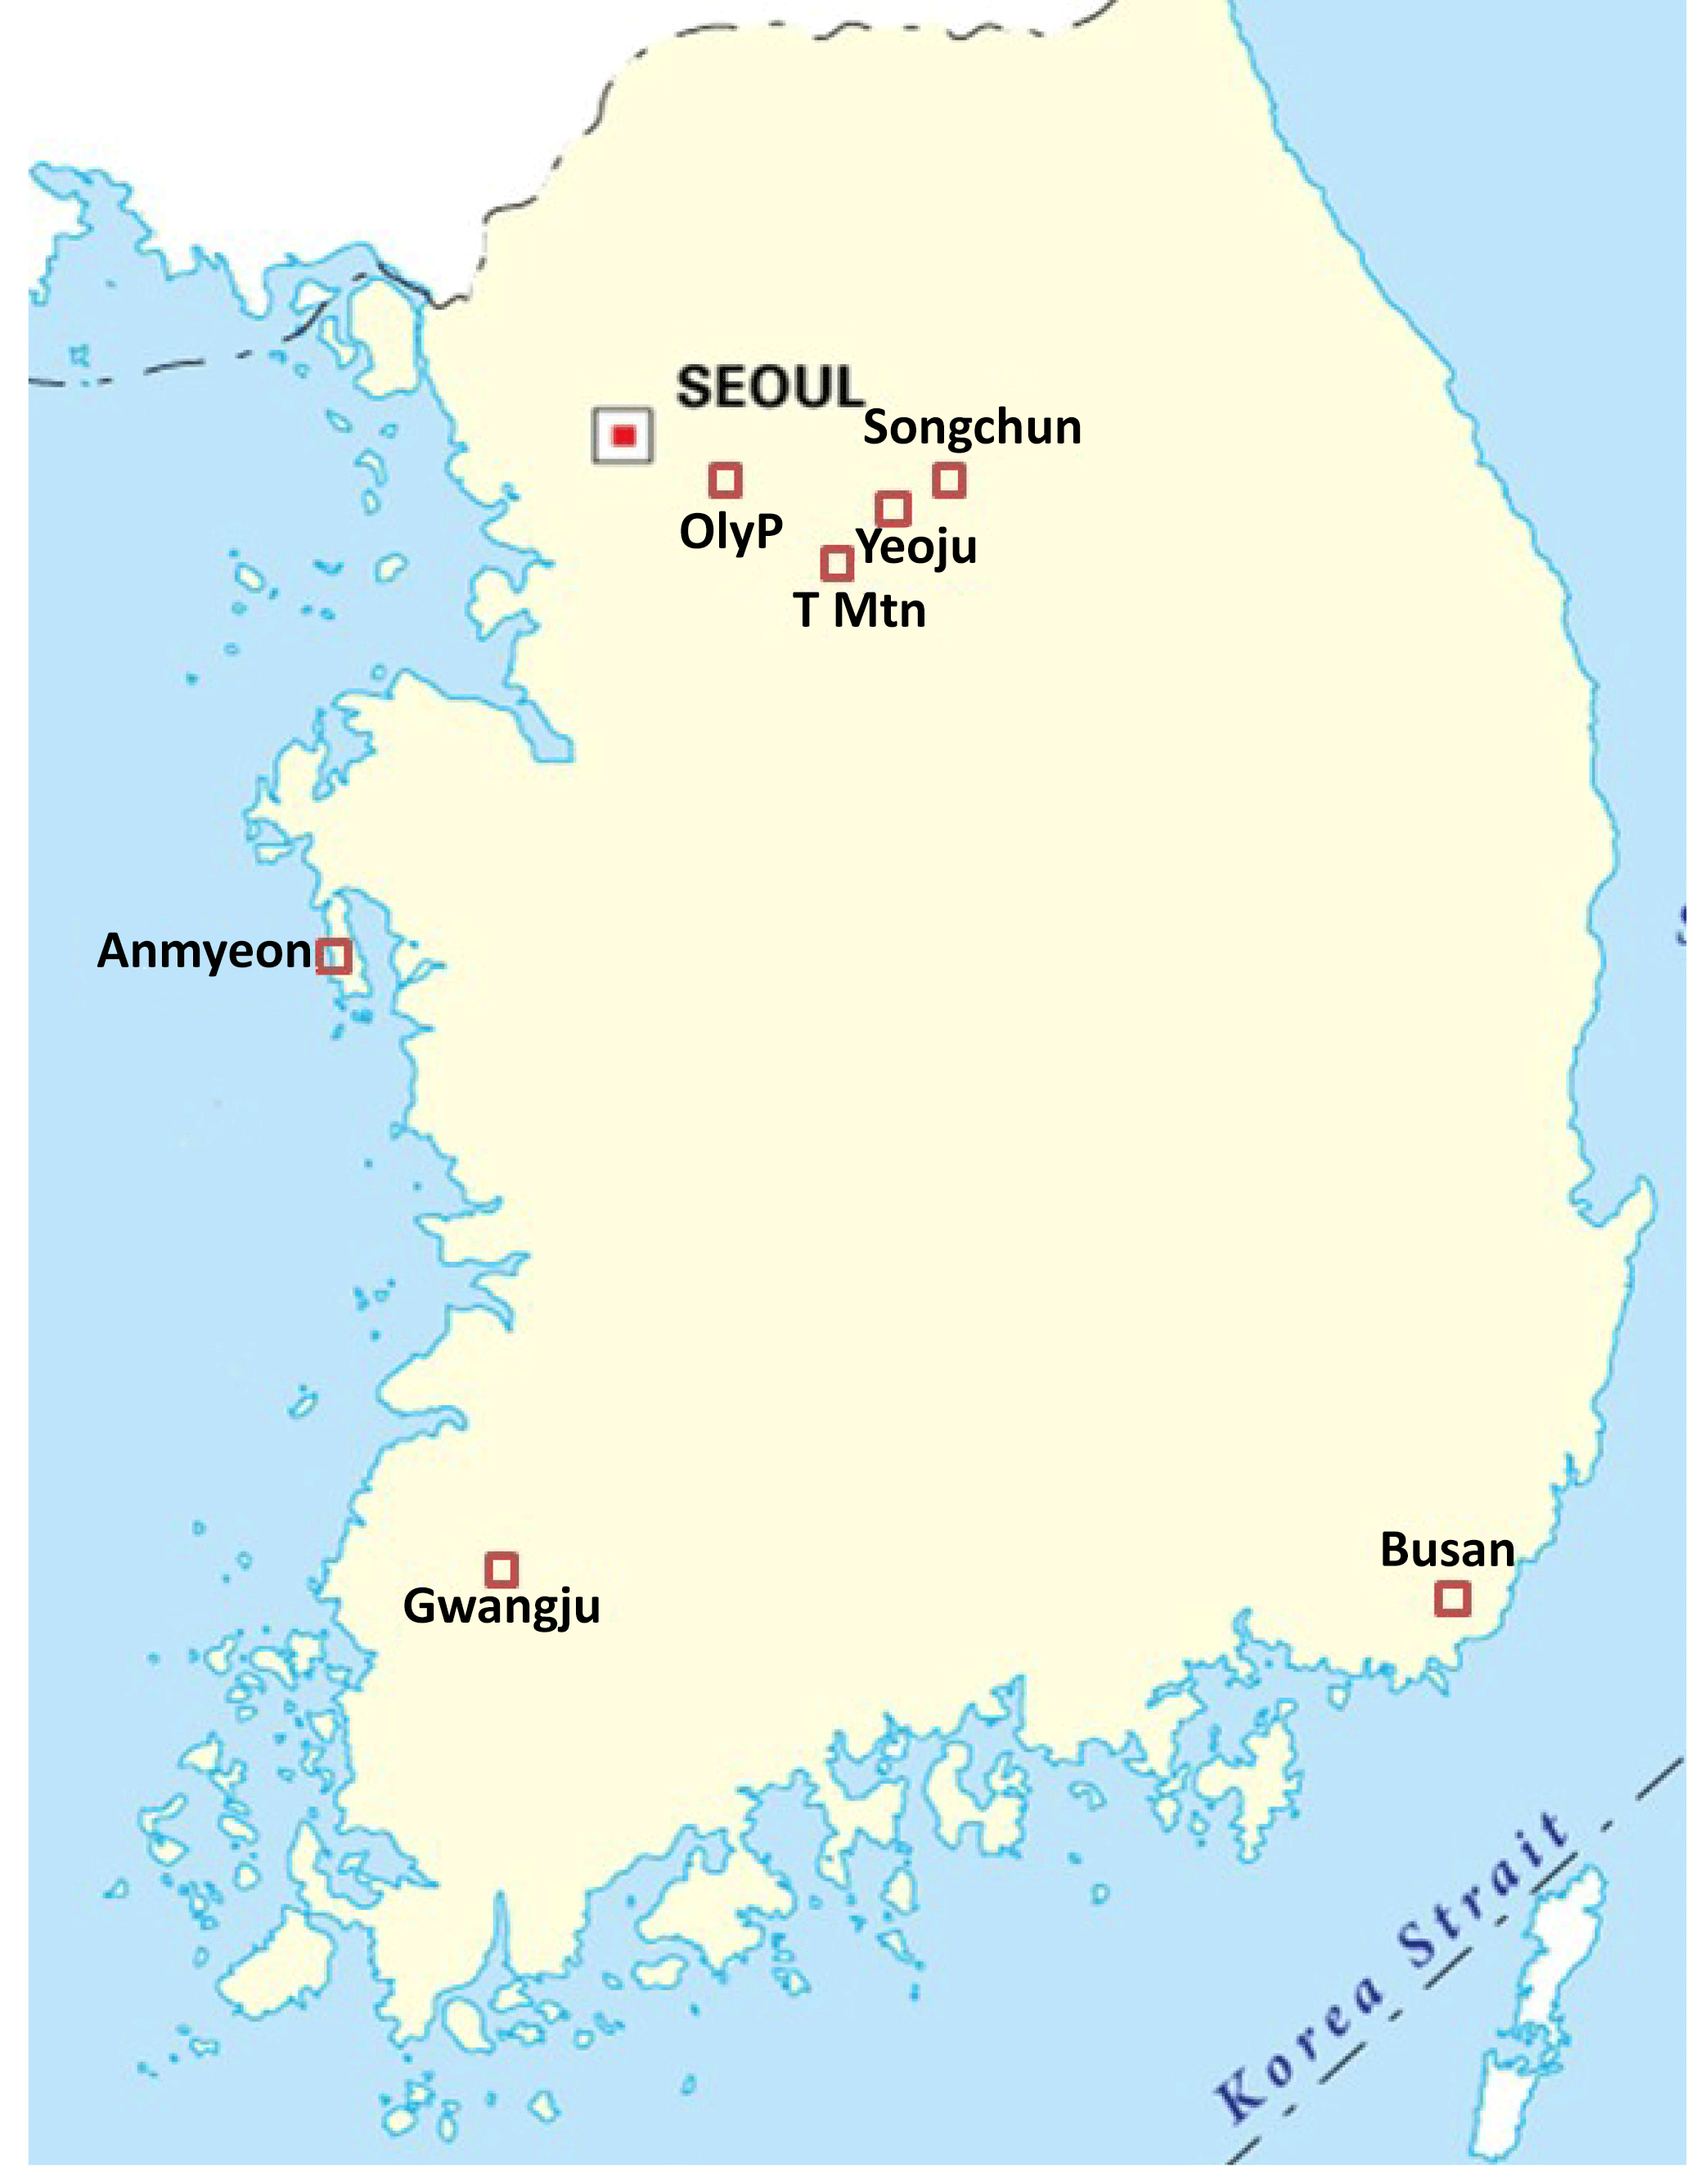
As part of the KORUS-AQ campaign, a network of nine PSI was installed in Korea at eight locations (Fig. 1 and Table 1). Five of the sites were selected to be “down-wind” from Seoul, an area of very high NO2 pollution. The intent of the network was to integrate direct-sun column density observations of NO2 and HCHO into a multi-perspective framework of observations including ground-based, satellite, and airborne measurements of air quality. Viewing air quality through these multiple perspectives is important for connecting observations from future geostationary satellites to air quality networks such that conditions, both at the surface and aloft, can be better understood and represented across unmonitored areas. The data are especially important for computer models used for forecasts and decision making. Five of the KORUS-AQ PSI had recently improved optics that permitted retrieval of total vertical column formaldehyde (C(HCHO)). Part of the network was installed in April 2015, a year before the start of the campaign. Three PSI continue to operate in Korea, one each, in Busan and Seoul since 2012, and one in Gwangju operating since April 2015.
Measurements of daytime total columns in Dobson Units, where 1 DU molecules cm−2, C(NO2), C(O3), and C(HCHO) are obtained every 80 s, which enables the PSI to show rapid short term (minutes to hours) variations in most locations with significant pollution (e.g., C(NO2) > 0.2 DU). PSI measurements of the visible and UV wavelengths are obtained separately (40 s each). A visible wavelength blocking filter, U340, reduces stray light for UV measurements originating from the much brighter visible wavelength range.
Details on the Pandora spectrometer instrument can be found in Herman et al. (2009, 2015) as well as a NASA Pandora website https://avdc.gsfc.nasa.gov/pub/DSCOVR/Pandora/Web_Pandora/index.html (last access: 31 July 2018) and the data used are available from https://avdc.gsfc.nasa.gov/pub/DSCOVR/Pandora/DATA/KORUS-AQ/ (last access: 31 July 2018).
The PSI consists of a small Avantes low stray light spectrometer (280–525 nm with 0.6 nm spectral resolution with 4 times oversampling) connected to an optical head by a 400 µm single strand fiber optic cable. The spectrometer is temperature stabilized at 20 ∘C (68 ∘F) inside of two weather resistant containers. The optical head consists of a collimator and lens giving rise to a 1.6∘ FOV (field of view) FWHM (Full Width Half Maximum) with light passing through two filter wheels containing diffusers, a UV340 filter (blocks visible light), neutral density filters, and an opaque position (dark current measurement). When the diffuser is used, the FOV is increased to over 2∘ and becomes less sensitive to the sun's exact position in the FOV. The optical head is connected to a small suntracker capable of accurately following the sun's center using software running on a small computer-data logger contained in a weatherproof outer box along with the spectrometer in a second inner temperature controlled box. The PSI is capable of obtaining C(NO2), C(HCHO), and C(O3) amounts sequentially over a period of 80 s including two dark current determinations. The integration time for NO2 in bright sun is about 4 ms that is repeated and averaged for 20 s (up to 4000 measurements) to obtain very high signal to noise ratios and very high precision (precision < 0.01 DU). Similar comments apply to C(O3), but not to C(HCHO), as formaldehyde absorption spectrum is mixed in with absorption from NO2, O3 and BrO (when present). This causes cross-correlation effects in the retrieval algorithm that make C(HCHO) retrievals sensitive to the selection of the wavelength range. The main source of noise in the measurement comes from the presence of clouds or haze in the FOV, which increases the exposure time and reduces the number of measurements in 20 s.
The retrieval algorithm is based a direct-sun spectral fitting method similar to the well-accepted DOAS (Differential Optical Absorption Spectroscopy, Platt et al., 1979 and Platt, 1994). NO2 absorption cross sections were obtained from the laboratory measurements of Vandaele et al. (1998), and HCHO cross sections from Meller and Moortgat (2000). For ozone, the PSI reference solar spectrum is constructed from a high resolution extraterrestrial spectrum (270 to 1000 nm) merged from different sources (Bernhard et al., 2004; Herman et al., 2015). For NO2 and HCHO, the reference spectrum is obtained from a Modified Langley Extrapolation method (Herman et al., 2009; Spinei et al., 2018). One of the advantages of using direct-sun observations is the accurate conversion to vertical column based on a geometric calculation of the slant path air mass factor AMF for a known solar zenith angle SZA with a slight correction to the function secant (SZA) (Herman et al., 2009, Eq. 3). A complete description of the retrieval algorithms and PSI operations are given in the PSI software manual (Cede, 2017). Accuracy in the DOAS-type retrieval is obtained using careful measurements of the spectrometer's slit function, wavelength calibration, knowledge of atmospheric absorption cross sections, and the solar spectrum at the top of the atmosphere. Accuracy for C(NO2) has been estimated to be ±0.05 DU. A recent addition of anti-reflection coatings to the PSI optics has improved accuracy and precision by reducing the residuals associated with spectral fitting using trace gas absorption cross sections. The reduced residuals are necessary for the retrieval of formaldehyde and bromine oxide that absorb in spectral regions dominated by ozone and NO2. Other DOAS-type measurements have been made in Korea based on observations of sky radiance ratios (e.g., multi axis MAX-DOAS: Kanaya, et al., 2014) and direct-sun DOAS using a PSI in Seoul, Korea (Park et al., 2018).
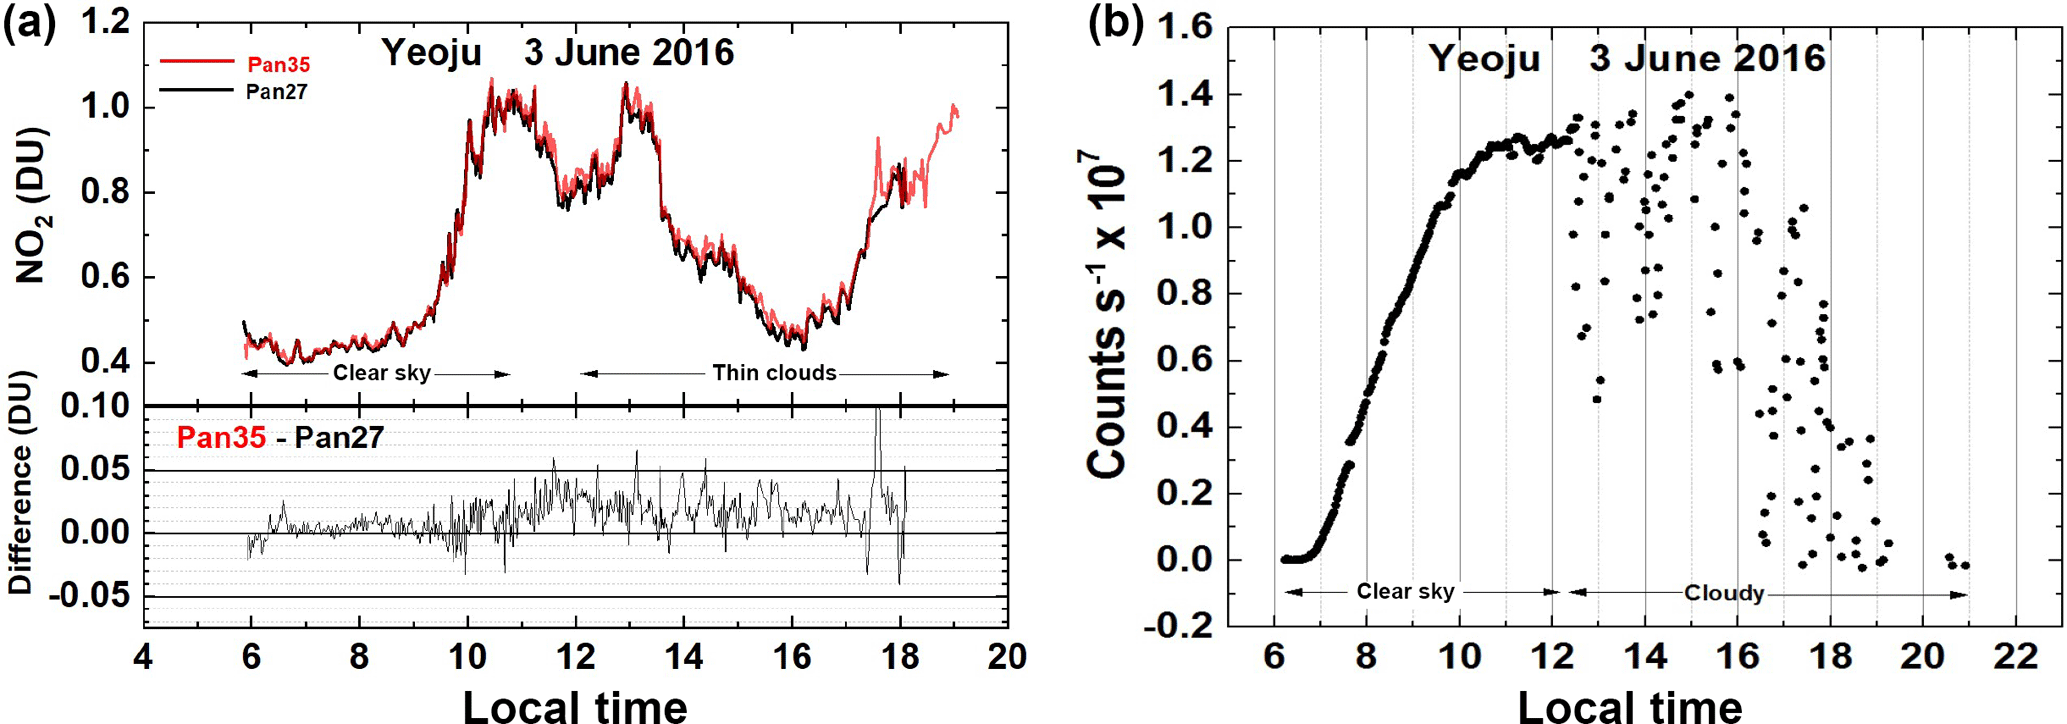
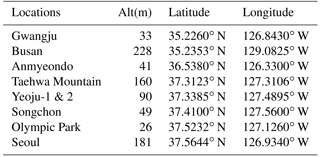
Figure 2(a) C(NO2) amounts from Pandora 27 and 35 in Yeoju, Korea during 3 June 2016 and their difference |Pan35–Pan27| < 0.05 DU. (b) Pandora 35 estimate of cloud or aerosol reduced measured counts s−1 at approximately 500 nm.
This paper discusses the distribution of C(NO2) and C(HCHO) over Korea at the sites where the PSI were located (Fig. 1). Section 2 shows the amounts of NO2 observed by PSIs at the eight KORUS-AQ sites. Section 3 discusses the diurnal variation of NO2. Section 4 looks at longer term changes in NO2 obtained from PSIs that were deployed before the beginning of the KORUS-AQ campaign. Section 5 evaluates the disagreement with Ozone Monitoring Instrument (OMI) satellite C(NO2) retrievals (Kramer et al., 2008). Section 6 compared PSI C(NO2) retrievals with the aircraft overpass retrievals from the 4STAR instrument (Segal-Rozenhaimer et al., 2014). Section 6 discusses retrievals of C(HCHO) amounts for five PSI sites, the diurnal variation of C(HCHO), and comparisons with the Compact Atmospheric Multispecies Spectrometer CAMS (Richter et al., 2015) from DC-8 aircraft overflights of five PSI sites.
An example of NO2 retrieval from two independently calibrated Pandoras, which were initially located at the same site (Yeoju, Korea, 37.3385∘ N, 127.4895∘ W), are compared in Fig. 2a showing that the differences in C(NO2) amounts are less than 0.05 DU, even in the presence of thin afternoon clouds (Fig. 2b) that decrease the measured solar irradiance by more than a factor of 2. Though Yeoju is a relatively clean site in Korea (located to the southeast of Seoul, 37.5644∘ N, 126.934∘ W), C(NO2) amounts frequently reach moderately high values (e.g., 1 DU on 3 June 2016), and occasionally even higher (2–3 DU). However, Yeoju has much less C(NO2) compared to Seoul, less than 30 km distant, where PSI measurements were found to reach over 3 DU (Fig. 3) during the campaign period from mid-April to early June, 2016. Typical C(NO2) amounts are 0.3 to 0.5 DU in polluted regions.
Figure 3Frequency distributions of C(NO2) across the KORUS-AQ PSI network: 20 April to 6 June 2016, except as labeled. The axes vary for different sites.
In a manner similar to Fig. 2a, C(NO2) amounts can show large variability from day-to-day and intra-day, as well as between different sites. The largest amounts of C(NO2) are in the north (Seoul and Olympic Park) associated with the largest population and industry concentrations, while the southern cities of Busan and Gwangju have smaller amounts of C(NO2). The smallest C(NO2) amounts are at Anmyeondo (an island on west coast of Korea 42 km south of Seoul, usually not downwind of Seoul), and Songchon to the east of Seoul.
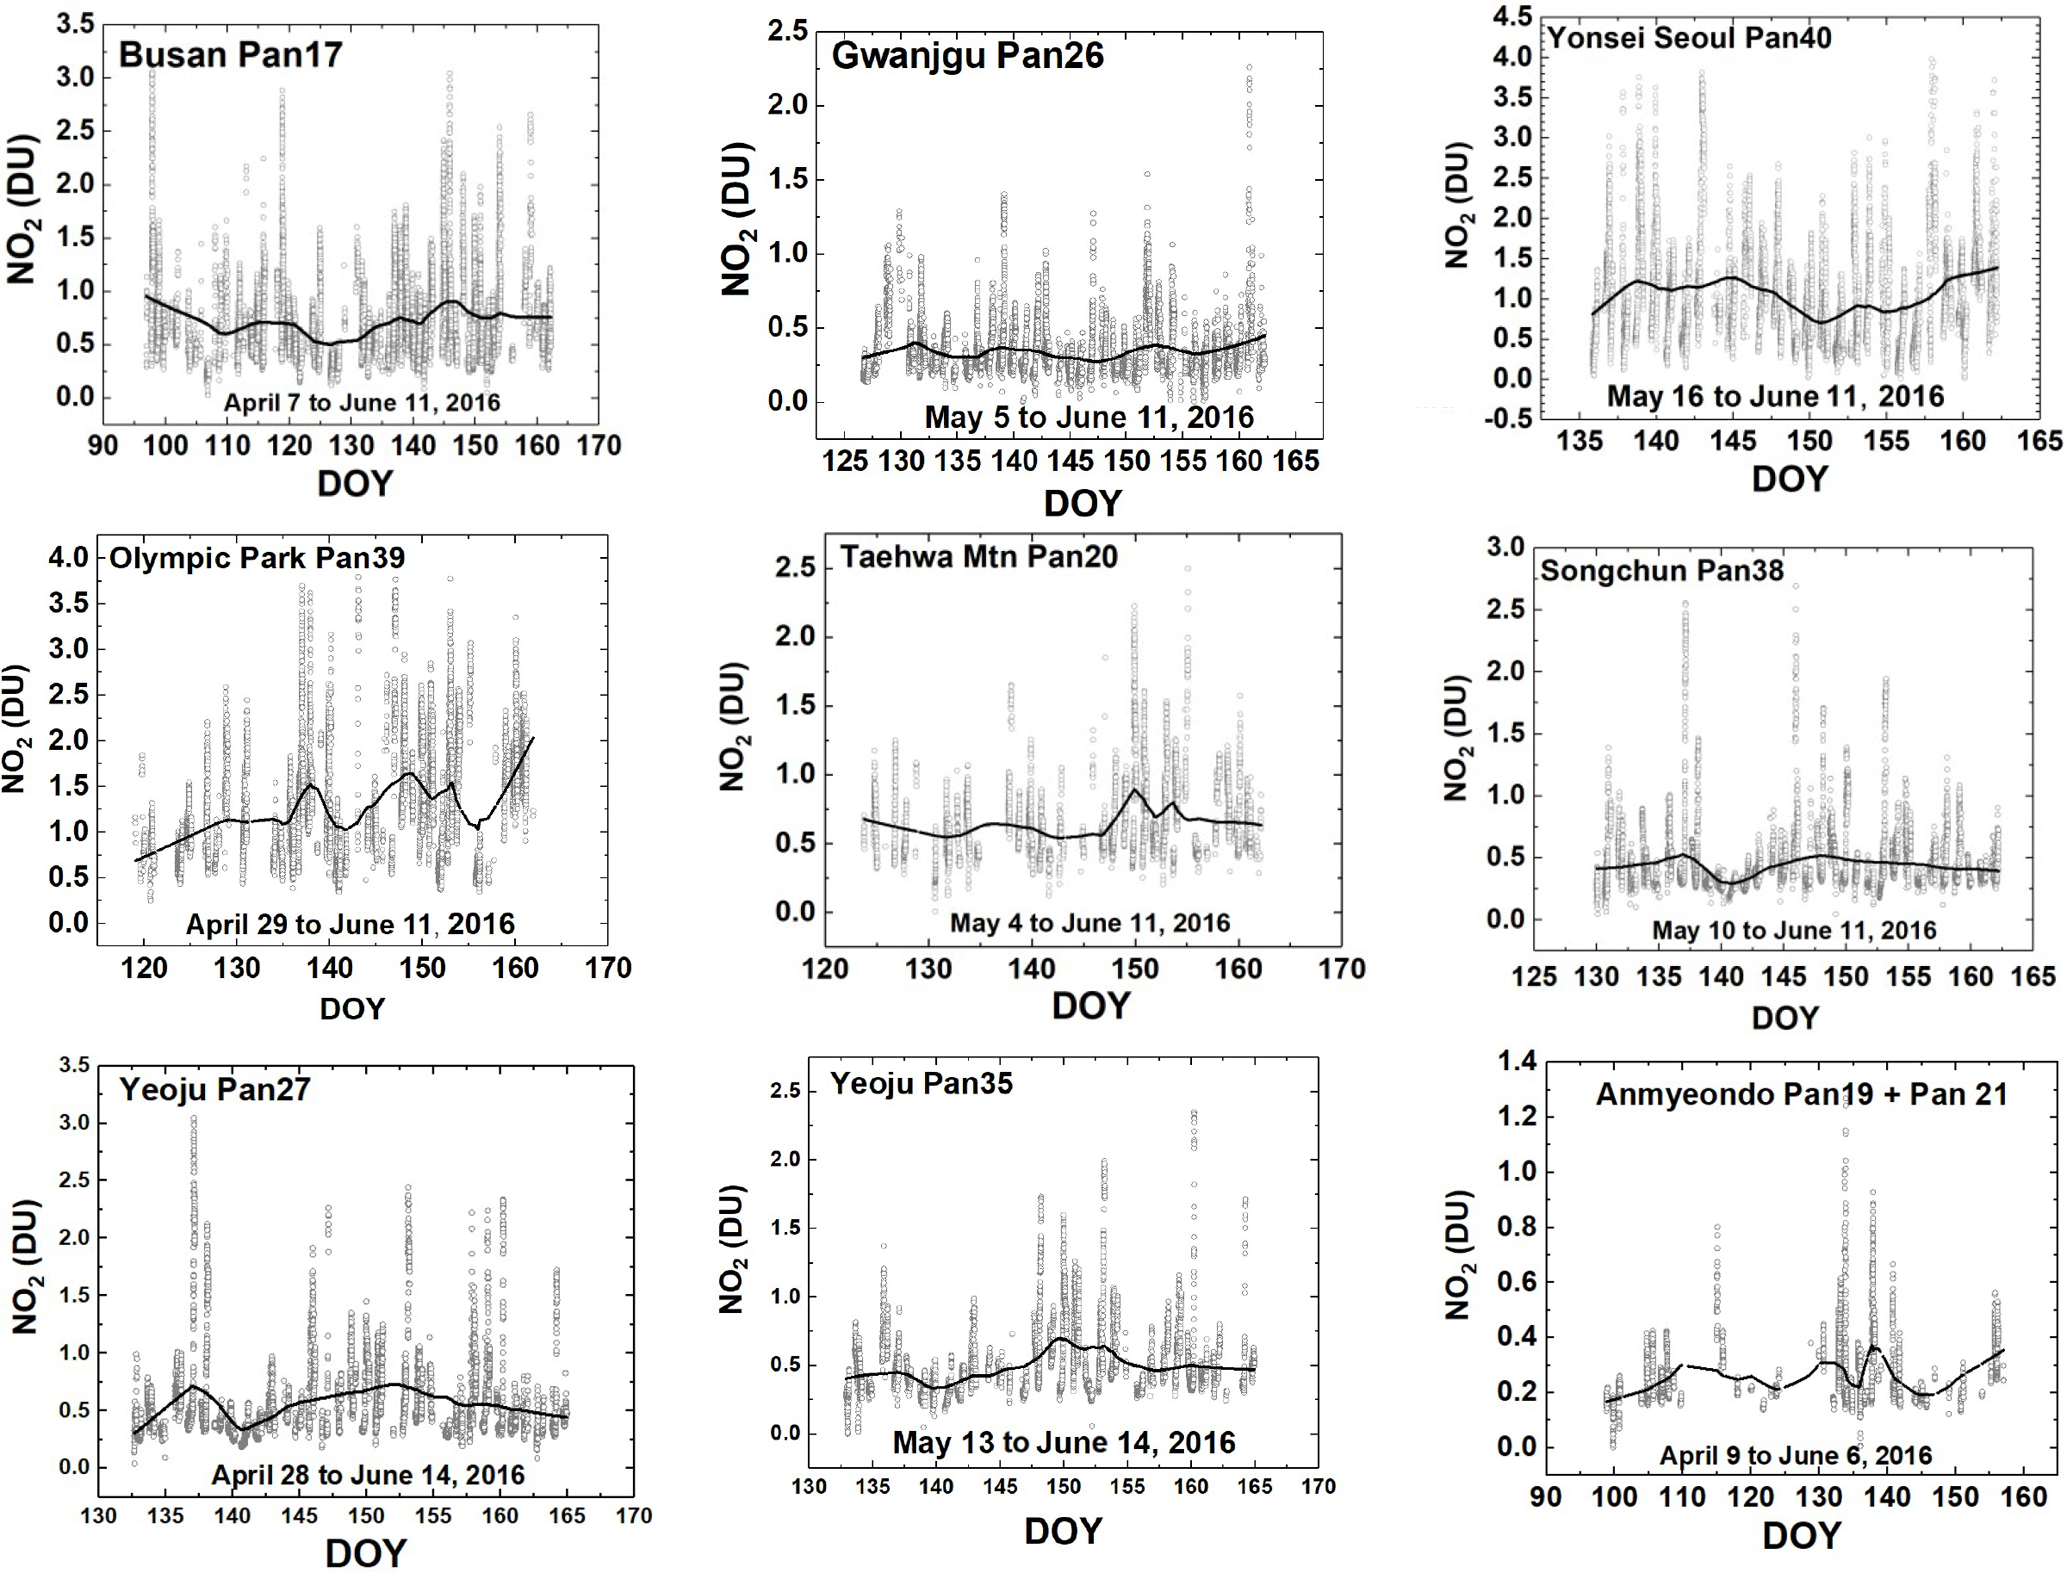
Figure 4NO2 time series vs. day of the year (DOY) and diurnal variability (daily vertical extent) at nine Pandora sites. Notice the very high NO2 amounts in Seoul and nearby Olympic Park. The black curves are approximate weekly least squares running averages. Note that the vertical scales are different for each site to show the daily variability relative to the running average.
Figure 2b shows the effect of thin clouds in terms of reduced measured count rates for a single spectrometer pixel near 500 nm showing a near noon count rate of 1.26×10⁷ counts s−1 followed by a reduced count rate as clouds move in front of the sun. The cloud plus aerosol cover estimate is from the same date 3 June 2016 as the C(NO2) amounts shown in Fig. 2a. The effect of thin clouds for C(NO2) retrieval (Fig. 2a) is increased noise (reduced precision) with a very small impact on accuracy. There are two effects on PSI observations to consider in association with thin clouds. First, is multiple scattering within the cloud affecting the optical path and effective air mass factor AMF. This has a very small effect on AMF, as most of the NO2 is near the surface well below the clouds. Second, is the reduction in the number of measurements during a fixed 20 s measuring period causing a decrease in the signal to noise ratio. The weather during the campaign was occasionally very cloudy, which caused some missing NO2 and O3 data. However, most of the cloudy days were light to moderate cloud cover, which permitted C(NO2) amounts to be determined, but with lower precision compared to clear-sky direct sun measurements (e.g., Fig. 2a and b). When the cloud cover becomes sufficiently thick, precision is reduced (increased point-to-point scatter) and the spectral fitting error increases. A small percentage of data points with high retrieval error, C(NO2Error) > 0.1 DU, have been removed from the data set.
Figures 3 and 4 summarize all of the Pandora C(NO2) data obtained during the KORUS-AQ campaign. Figure 3 presents histograms in percent frequency of occurrence for all nine sites. All of the sites located within or downwind of major cities have production of NOx mainly from transportation and power generation as its major sources. The ratio of transportation NOx production is a factor of 3 larger compared to all other sources (Kim et al., 2013). Of these sites, the Anmyeondo PSI frequently (40 %) retrieves values of C(NO2) that are close to the typical stratospheric values of 0.1±0.05 DU. Other sites occasionally have clean days with similarly low values.
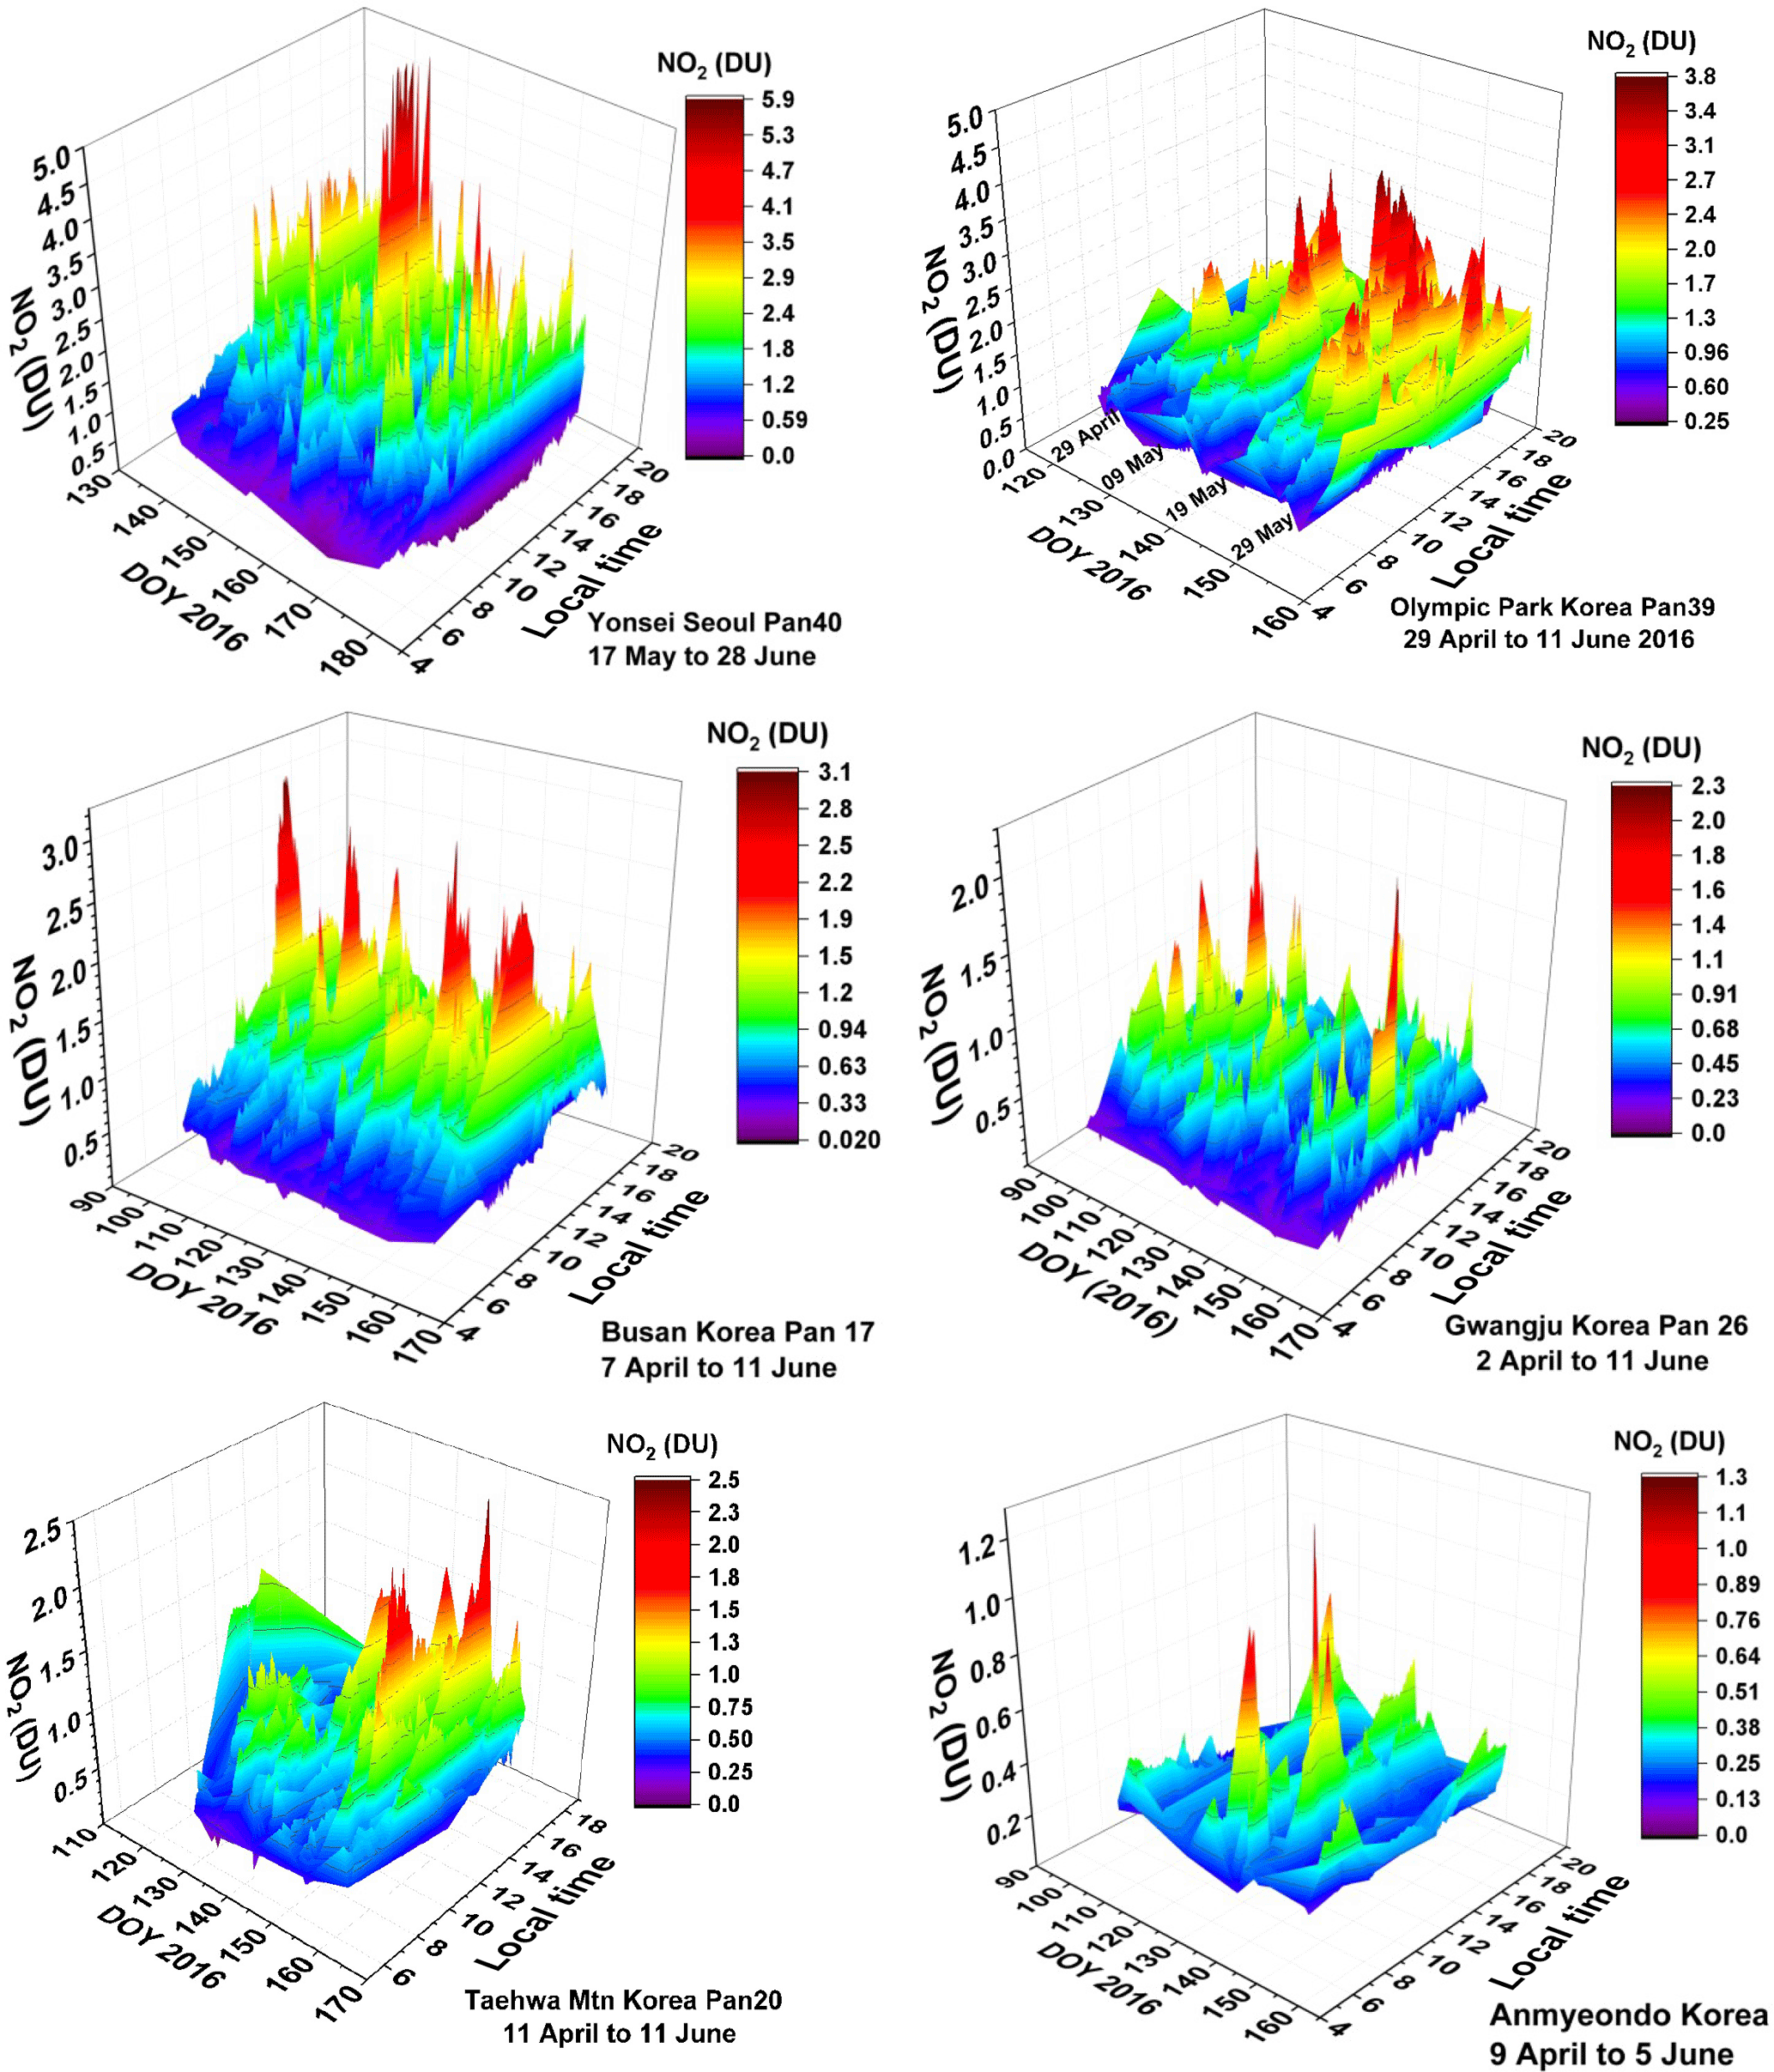
Figure 5NO2 amounts vs. day of the year (DOY) and local time (KST) for six sites as labeled in each panel. Day 120 is 29 April, Day 130 is 9 May, Day 140 is 19 May, Day 150 is 29 May, Day 160 is 8 June, Day 170 is 18 June.
The Seoul site frequently has amounts of C(NO2) greater than 2 DU. The same is true of Olympic Park, located in the eastern part of the Seoul metropolitan area. For locations increasingly distant from Seoul, the amount of C(NO2) decreases in response to smaller local emissions, as the short chemical lifetime of NO2 normally precludes long-distance transport. Compared to Seoul, the two smaller southern cities, Gwangju and Busan, have relatively low levels of C(NO2) on most days, with the most typical values ranging from 0.3 to 0.5 DU, although high values exceeding 2 DU can occur on rare occasions.
Figure 4 shows the same data as Fig. 3, but in the form of a time series covering the KORUS-AQ period. The daily variation (at least one point every 2 min) is shown in the vertical extent corresponding to each day's data. Figures 3 and 4 show that sites near the Seoul metropolitan (e.g., Olympic Park) area have larger amounts of pollution compared to those further away (Taehwa, Songchon, and Yeoju). Even though average C(NO2) amounts are much lower at Songchon and Yeoju, there are times when the pollution levels are quite high (C(NO2) > 2 DU, Figs. 4 and 5). There are days when the amount of C(NO2) gets close to 4 DU in Seoul, 3 DU in Olympic Park and Busan, and 4 DU for one day in Yeoju (27 April). The southern cities, Busan and Gwangju are much less polluted on average, which results in a much smaller effect on adjacent regions. Busan is located on the southeastern coastline, so that some of its NO2 pollution dissipates over the ocean, except for occasional days when very high amounts (3 DU) occur. Anmyeondo is quite clean, as it is located on the western coast well south of Seoul. The most frequently occurring C(NO2) value at Anmyeondo is 0.15–0.2 DU, which means that the measured NO2 amount are partly from the stratosphere (0.1±0.05 DU) with very little tropospheric or boundary layer NO2. There are occasional C(NO2) plumes that could be from industrial activity to the north, and, perhaps, from China. Transport of NO2 from China occurs episodically in significant amounts (Lee et al., 2014).
Grouping the diurnal variation together from multiple days (Fig. 5) reveals a pattern to NO2 emissions and accumulation related to the main NO2 emission sources (automobiles and power generation) for the three largest cities in Korea: Seoul (Pan40), Busan (Pan17), and Gwangju (Pan26). For Seoul, the amounts of C(NO2) during the morning (1 DU at 10:00 KST; all times are specified as Korean standard time (KST) in this paper) are much lower than later in the afternoon (over 2–3 DU at 16:00) on almost every day with values occasionally reaching as high as 6 DU. Even the relatively low morning values of C(NO2) represent a significant amount of pollution. The 6 DU C(NO2) amount in Seoul is unusual, but coincides with the peak values frequently occurring in the late afternoon. C(NO2) behavior at nearby Olympic Park to the east of Seoul is very similar to Yonsei University in the heart of Seoul, even though Olympic Park's traffic density is lower than Seoul. Olympic Park is close enough to the metropolitan Seoul area for the transport of NO2 combined with local production from traffic to produce a very similar diurnal pattern. The moderately large city of Busan also has high values of NO2, occasionally reaching 3 DU in the afternoon. Busan has relatively low values of NO2 in the morning, having peaks in the mid-afternoon and declining in the late afternoon. Gwangju, located in the southwest, is a smaller city with less pollution (peak values = 1.6 DU) and does not have as distinct an afternoon maximum.
The panels in Fig. 5 for Taehwa Mountain and Anmyeondo show regions outside the Seoul metropolitan area that still show substantial amounts of NO2. Compared to Seoul, the Taehwa site is a semi-rural location with only a modest amount of car traffic in the immediate area. However, there are major highways about 6 km from the site that are close enough to permit transport of NO2 to the Taehwa Mountain site. All of the sites showed a tendency to have peak NO2 occur in the late afternoon. Anmyeondo on the west central coast of Korea shows C(NO2) amounts that are quite low with occasional plumes arriving from the north or the west (China).
The basic daily pattern of C(NO2) in urban Korea arises from large amounts of automobile traffic and power plants emitting NOx (for modern automobiles, roughly 99 % NO and 1 % NO2). An FTIR analysis of automobile exhaust shows that NO is emitted at 127 ppm, NO2 at 1.6 ppm, HCHO at 39 ppm, and CH3OH at 139 ppm as part of the main emissions containing H2O (144 ppm) and CO2 (122 ppm) (https://tools.thermofisher.com/content/sfs/brochures/D10248~.pdf, last access: 31 July 2018; see also Walters et al., 2015).

Figure 6Approximately 1 year of daily column C(NO2) amount data (a, d) and the monthly running average amount (dark plot in panels a and d). The data are from GIST at Gwangju and Amnyeondo. Panels (a) and (d) are the original time series with one data point every 80 s, panels (b) and (e) are the deseasonalized time series. Panels (c) and (f) are an expanded scale of the monthly running averages M(t) of C(NO2) that are identical to the solid lines in panels (a) and (d). The vertical extent (a, b, d, e) on a given day is the range of diurnal variation from early morning to late afternoon.
NO quickly converts into NO2 in the presence of ozone and volatile organic compounds VOCs in the atmosphere and can convert back to NO by solar photolysis. KORUS-AQ results frequently show increasing NO2 during the day with peaks in the afternoon. For these days the measurements imply that the amount of locally produced NOx and conversion into NO2 dominates the losses of NO2 through photolysis and transport out of the region. Other days occasionally show a different behavior, with NO2 peaks in the morning and a decline thereafter suggesting transport out of the region.
Some of the sites used for the KORUS-AQ campaign (Gwangju and Amnyeondo) had PSIs set up in April 2015, about 1 year before the start of the campaign. Two other sites (Seoul and Busan) have PSI C(NO2) data starting in 2012. The extended data sets for Seoul and Busan provide the opportunity to estimate 5-year changes in C(NO2) amount and seasonal dependence.
In Fig. 6, the daily variation over one year at Gwangju and Anmyeondo are evaluated to estimate one year secular trends. The vertical extent in the time series is not noise or uncertainty, but rather the 80 s per data point variability throughout each day (e.g., see Fig. 2). Before calculating linear least squares slopes, the unadjusted time series (grey data points in panels a and d) were deseasonalized (grey data points in panels b and e) by subtracting a function with zero slope derived from a 30 day running average (dark line in panels a and d or the identical curves in panels c and f). The running average curves in panels (a) and (d) are shown with expanded scale in panels (c) and (f) to clearly show the seasonal variation. The “zero slope functions” ZM(t) are obtained by subtracting a linear least squares fit L(t) to monthly running average curves M(t) in panels (c) and (f) to form zero slope functions . The results ZM(t) are functions that look similar to the M(t) plots in panels (c) and (f), but with zero slopes. The resulting ZM(t) are then subtracted from the respective original time series (grey circles) in panels (a) and (d). The results are the grey circles in panels (b) and (e). Similar monthly running means are shown in panels (b) and (e) that have almost no monthly variations (see Appendix Fig. A1).
The linear trends in Fig. 6b and e suggest that there was an increase in pollution levels in Gwangju and Anmyeondo over the period of observation. The southern city of Gwangju (Pan 26) has higher average C(NO2) amounts, 0.34±0.19 DU, compared to the relatively clean coastal site Amnyeondo, 0.26±0.14 DU. Gwangju seasonal cycle has a minimum in C(NO2) amount in September–October and a very broad maximum from December to May. The Gwangju PSI is located away from major city traffic on a university campus (Gwangju Institute of Science and Technology, GIST) so that the average amount of NO2 (about 0.34 DU) is moderate with some days reaching 1.5 DU. The slopes are statistically significant at the 2-standard deviation level (p<0.05) and imply that C(NO2) was increasing at a substantial rate. However, the period of observation was too short to estimate multi-year long-term trends. Additional long-term monitoring of these sites would be desirable for air quality purposes.
The PSI on Anmyeondo was located away from a commercial area with moderate traffic and very near the shore of the Yellow Sea at a regional Global Atmosphere Watch (GAW) station. For Amnyeondo there is a clear seasonal cycle similar to that in Gwangju with a minimum in September–October and a broad maximum during the winter–spring months. Amnyeondo had an average amount of 0.25 DU, which is lower than observed at Gwangju.
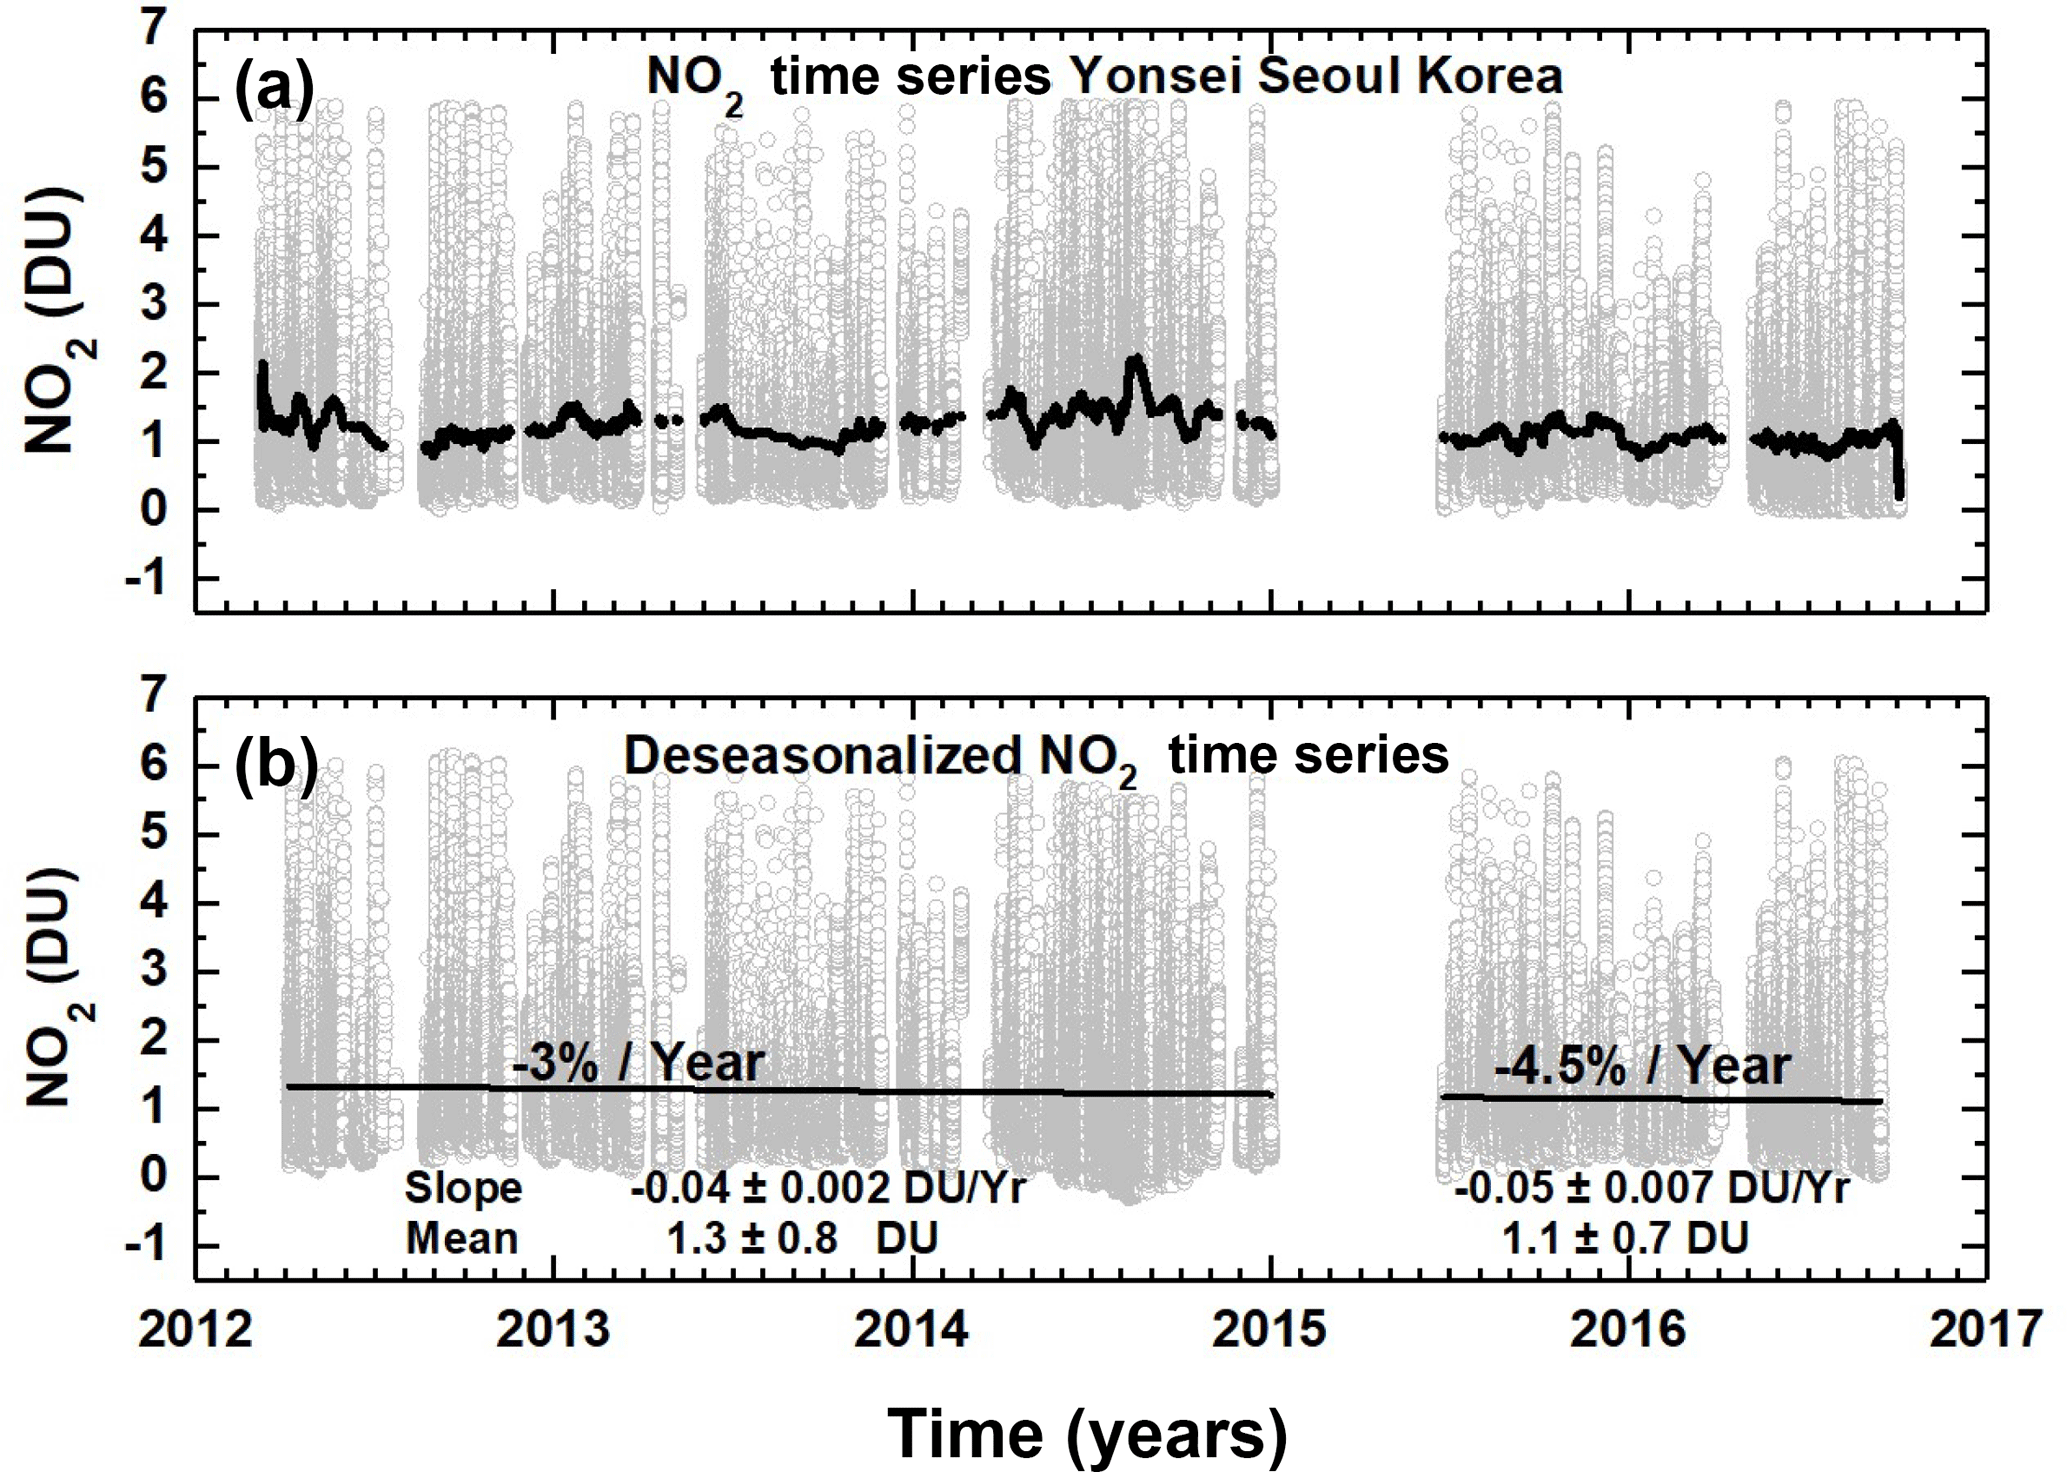
Figure 7(a) C(NO2) time series at Yonsei University in Seoul NO2(grey) and (b) deseasonalized time series. Combined slope DU yr−1 and mean DU or the decrease is % yr−1. Seoul has no clear seasonal cycle.
Figures 7 and 8 each contain an approximately 5-year daily time series (grey) for Seoul (Yonsei University) and Busan (Pusan University) and a linear fit to a deseasonalized version of the time series. As the observations at both sites had an extended period of missing data, the slopes were estimated separately for each segment and for the combined time series. Both Seoul and Busan show a steady reduction in NO2 air pollution with an average reduction of about −4 % per year. A recent paper by Duncan et al. (2016) estimated a decrease in C(NO2) for Seoul in about a 10×10 km box of about 1.6±1.4 % per year over the 2004 to 2013 period based on a 2014 average C(NO2) amount of 0.6 DU, or about half of the average value 1.3±0.8 DU observed by the PSI. The larger reduction in C(NO2) measured by the PSI is caused by a reduction in higher than average afternoon C(NO2) amounts that are rarely observed by OMI overpass at 13:30 KST. OMI is a polar orbiting push broom hyperspectral instrument (300–500 nm with a spectral resolution of 0.45 nm in the UV and 1 nm in the visible, and a spatial resolution of 13×24 km2) onboard the AURA satellite. The high observed late afternoon values are not restricted to Seoul, but occur for all of the urban areas where the PSI has been deployed. The high late afternoon values do not regularly occur in remote rural areas such as Amnyeondo.
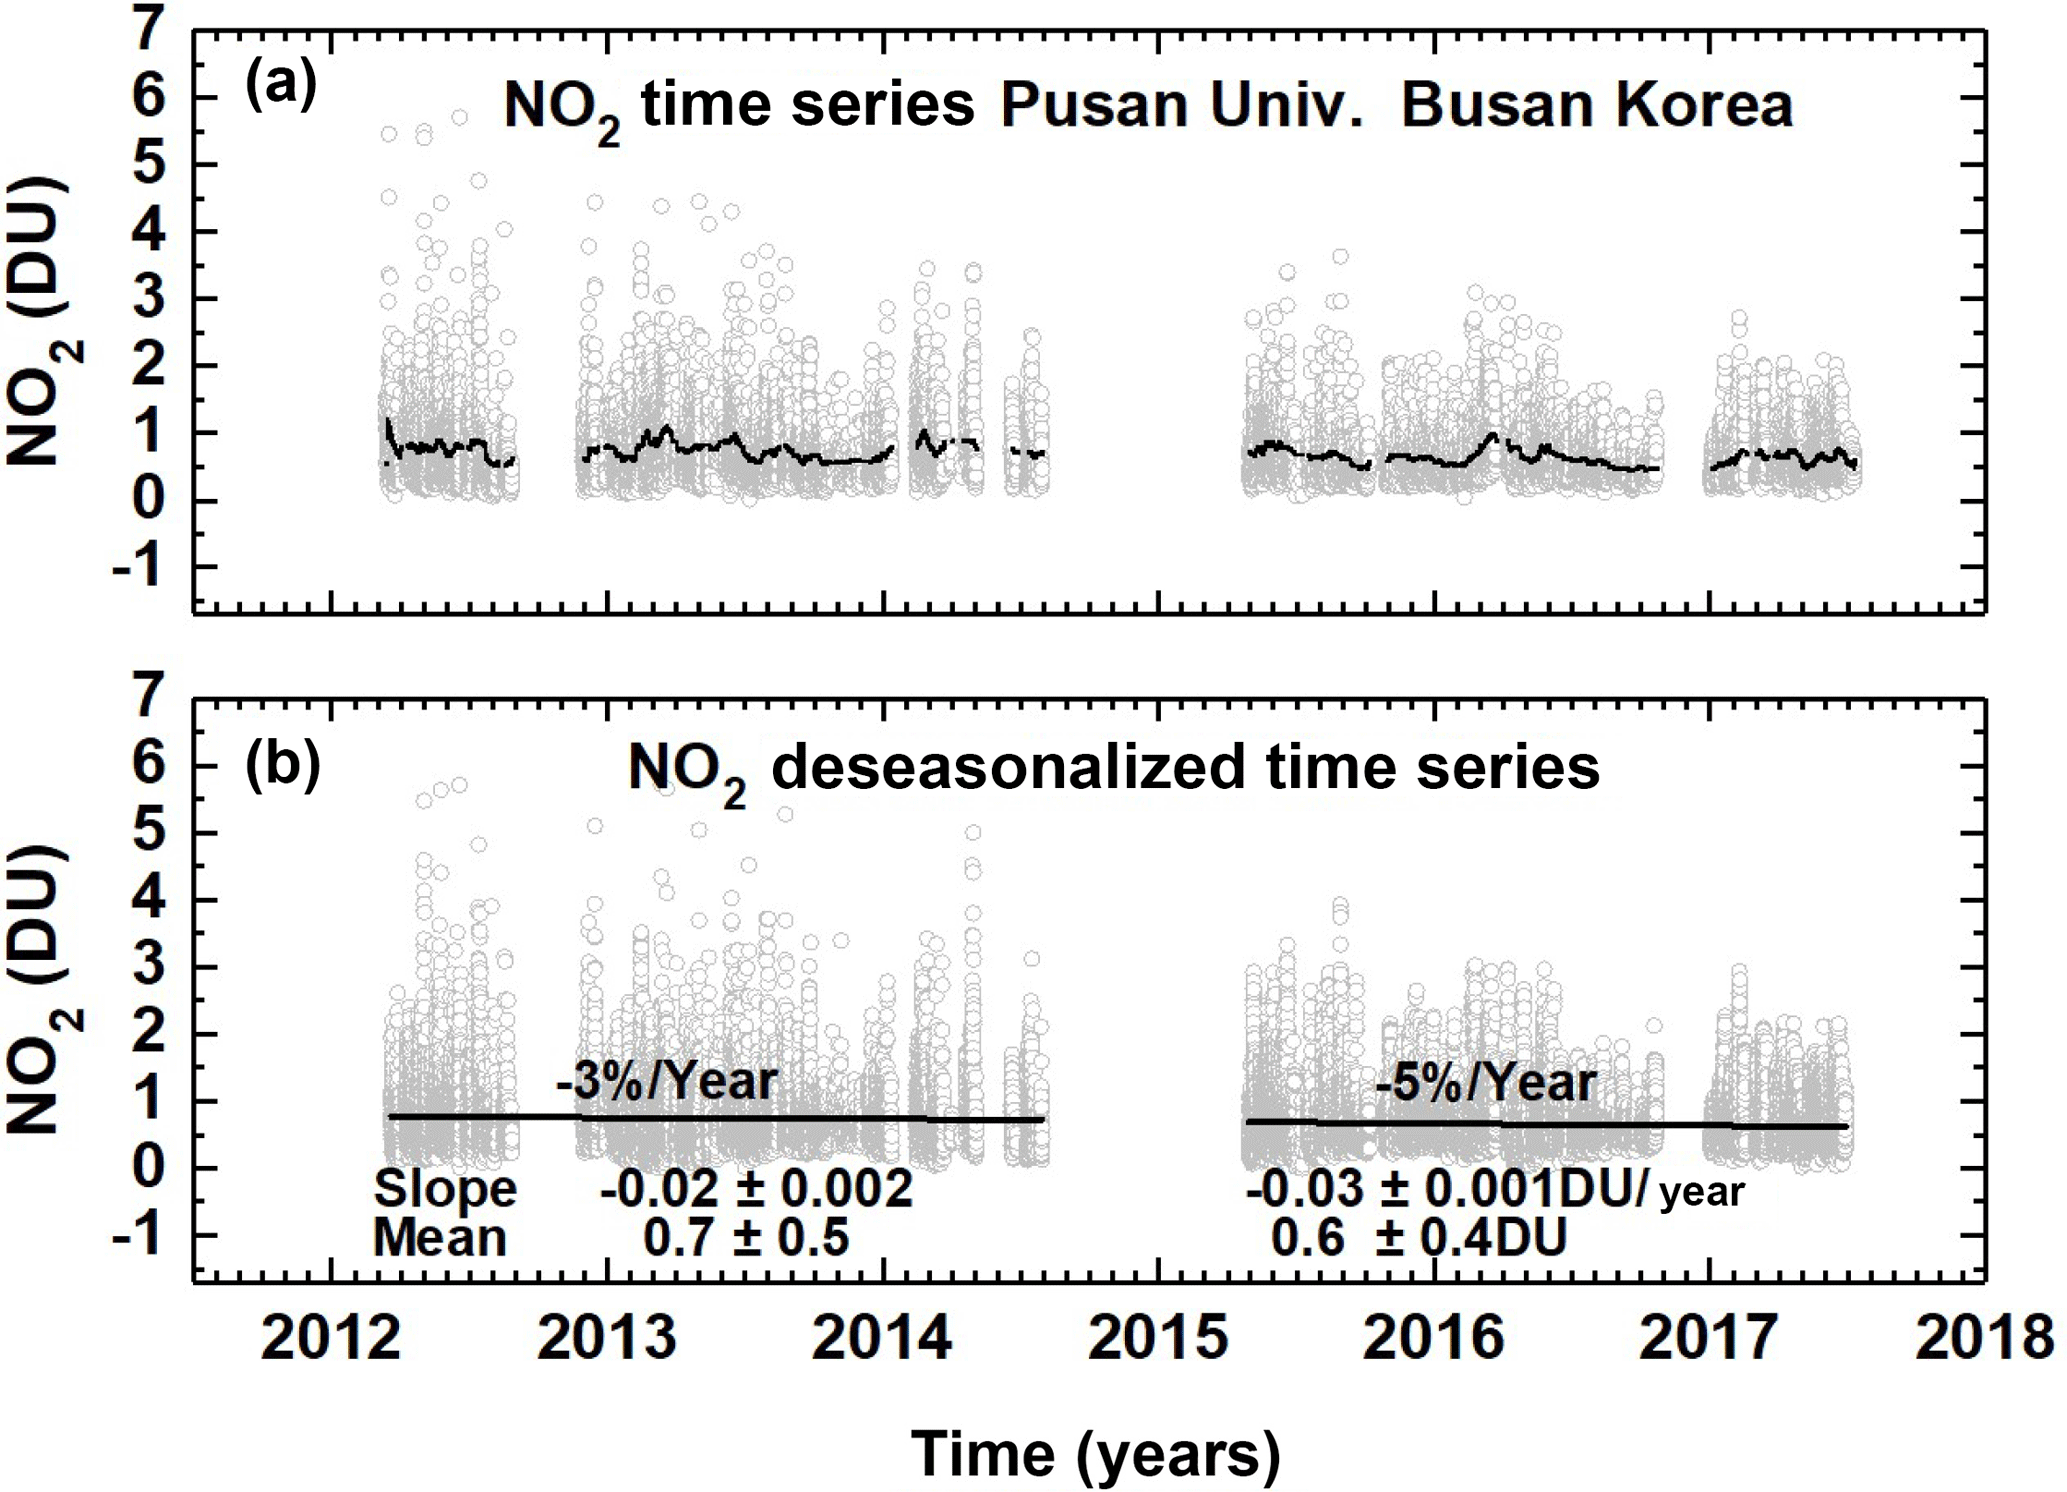
Figure 8(a) Pusan University in Busan C(NO2) daily time series (grey) and (b) deseasonalized time series with linear trends.
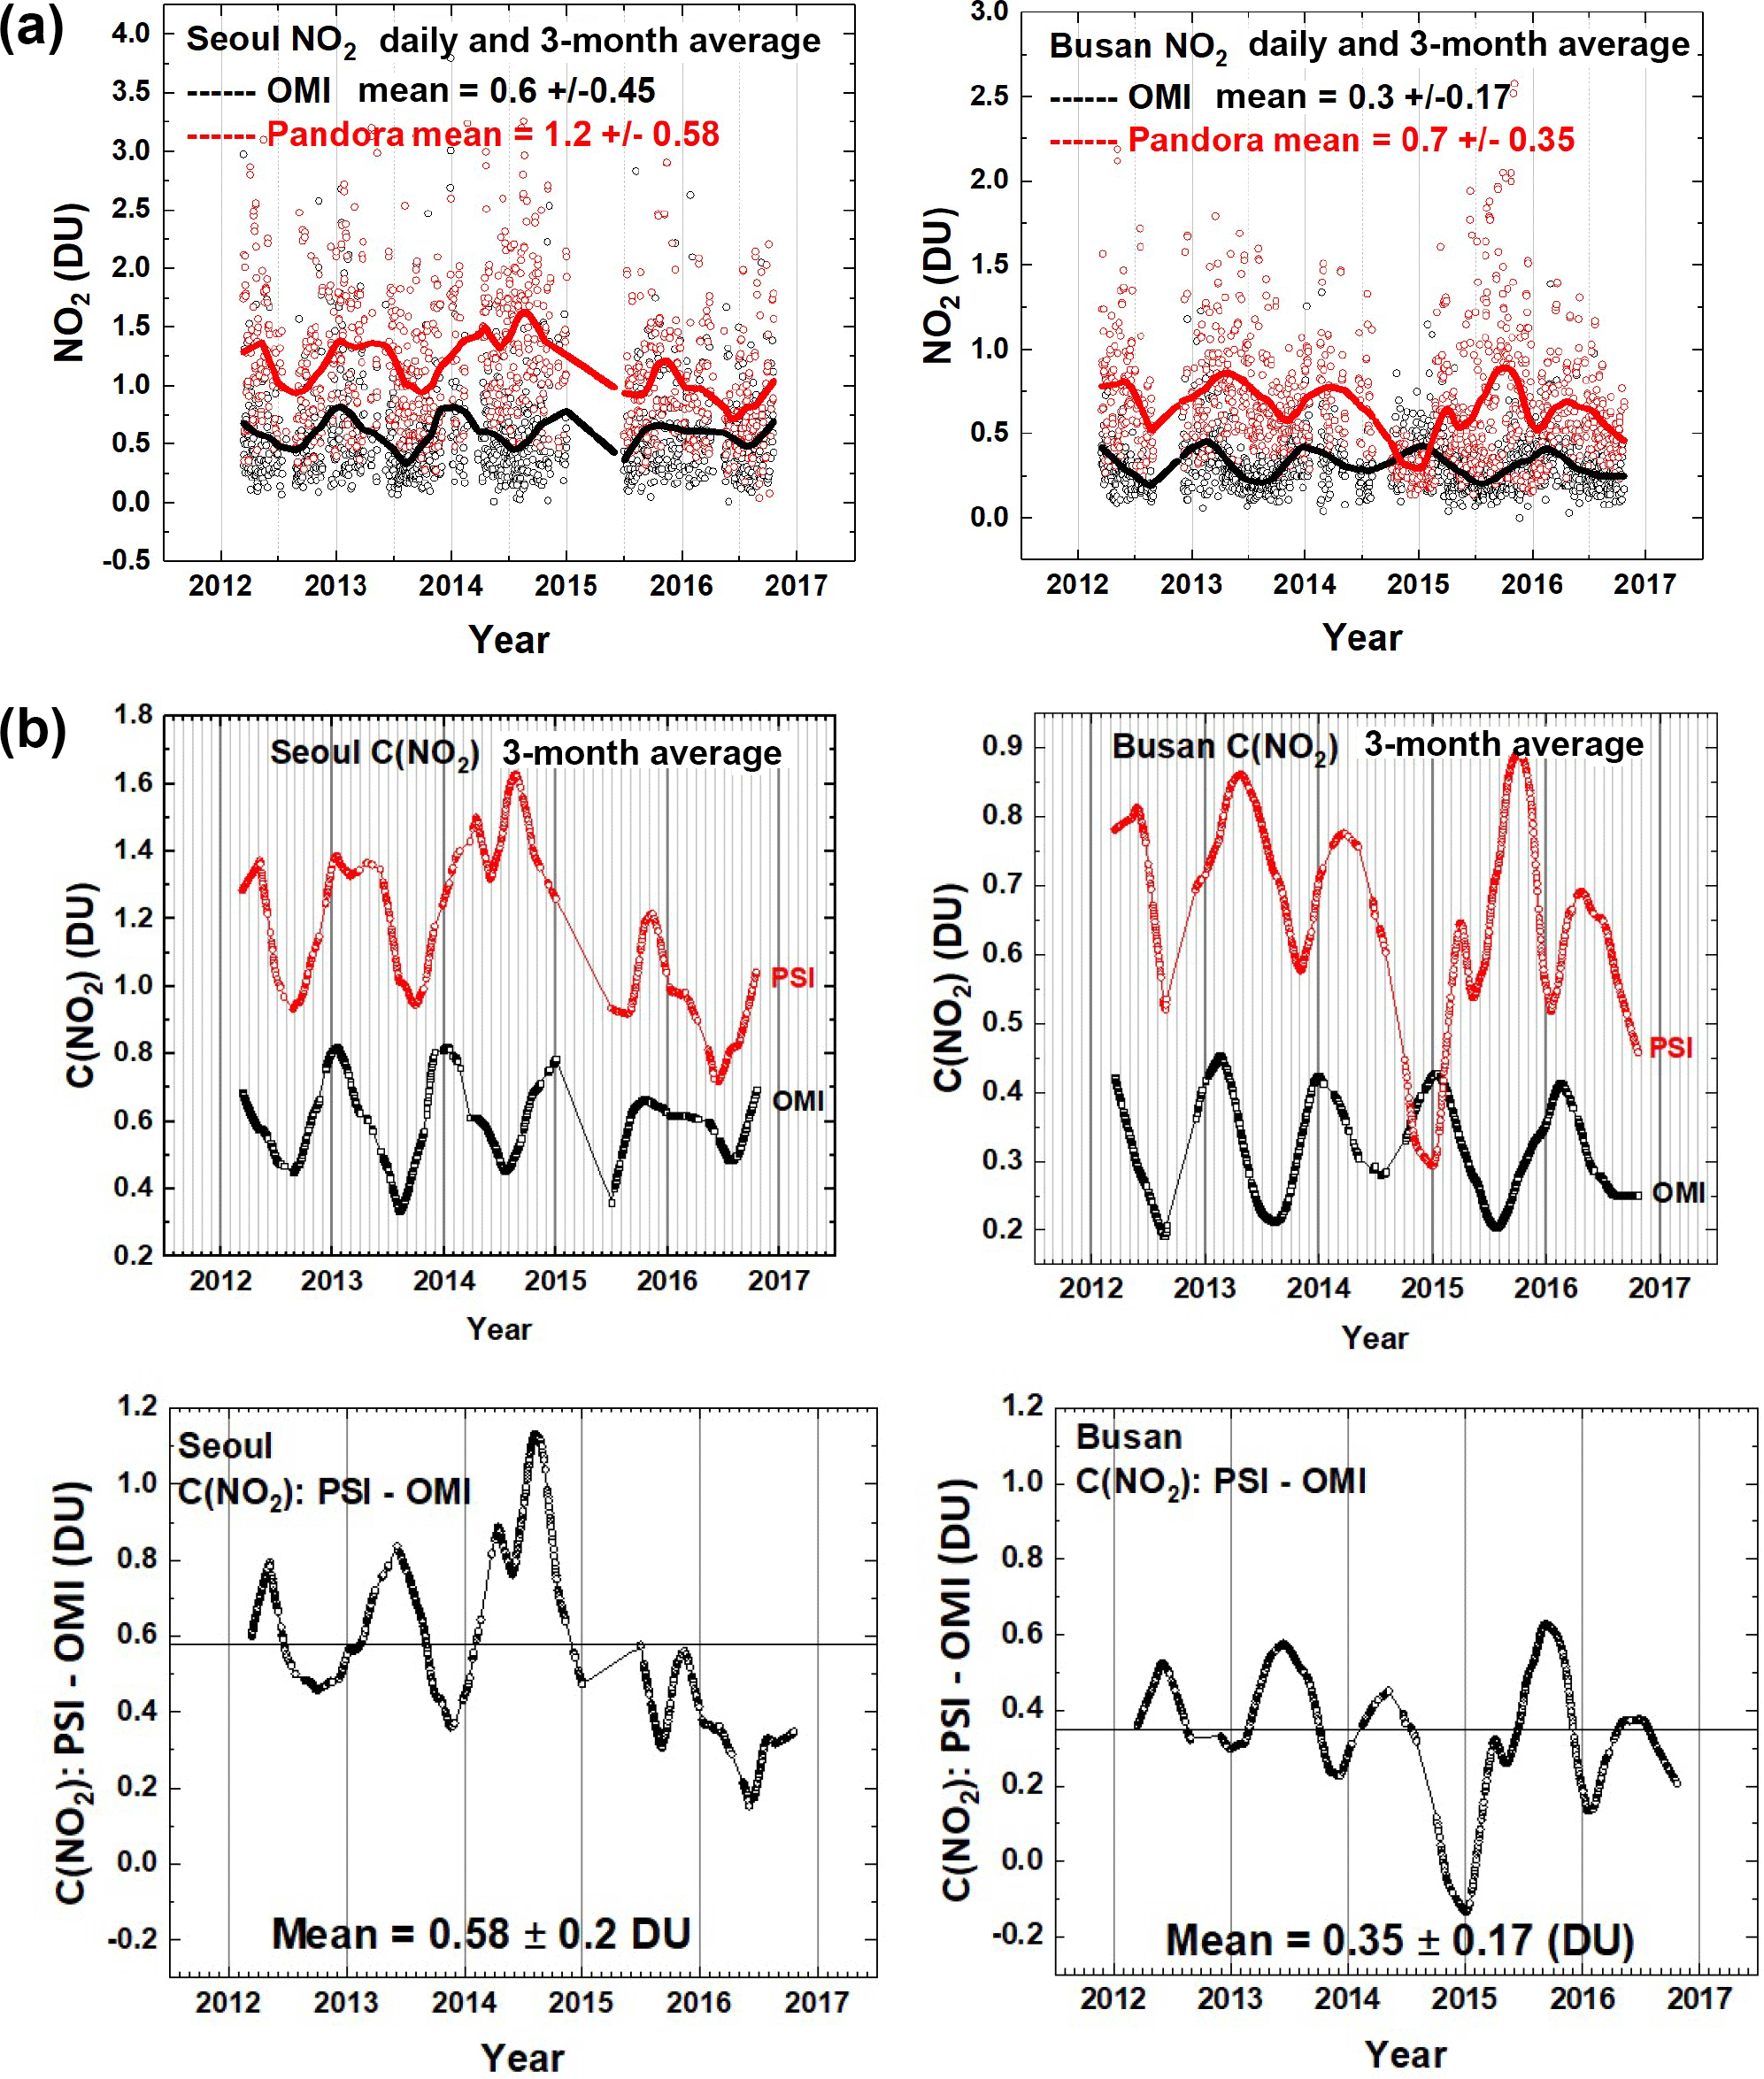
Figure 9(a) Comparisons between the daily values of C(NO2) for OMI (black) and PSI (red) at Seoul and Busan for a 5-year period. Solid lines show the average seasonal variation (Lowess(0.1)), see also panel (b). Linear interpolation is used where there are missing data points. (b) Comparisons between the seasonal averages for C(NO2) from OMI (black) and PSI (red) at Seoul and Busan for a 5-year period. The lower panels show the seasonal difference between the PSI and OMI. The individual data points are shown derived from a Lowess(0.1) smoothing, approximately a 3-month running averages of the daily data. Interpolation has been used where there are missing data points.
Seoul and Busan C(NO2) measurements are remarkable for the large peak amounts that are seen on many days compared to the 1.5 to 2 DU peak values for Gwangju and Amnyeondo. For Yonsei, the peak values range above 5 to 6 DU in the years 2012 to 2015, but decrease somewhat in 2015 to 2016. In 2015–2016, the decrease appears to be large, but is only 0.2 DU relative to a mean of about 1.2 DU. A smaller decrease appears for Busan (Fig. 8) relative to a mean of about 0.6 DU. All of the PSI measurements show very high values of NO2 during almost every day when measurements were possible. As the NO2 concentrations represented by these large column amounts are probably in the boundary layer near the sources of NO2, there is a strong effect on local air quality.
Seoul and Busan have 5-year PSI data records (Fig. 9a and b), and Gwangju has a 1-year data record (Figs. 6 and 10) spanning the KORUS-AQ campaign. The PSI C(NO2) can be matched in time (±8 min) with the overpass time from OMI onboard the AURA satellite (mid-day overpass times min). Figure 9a shows the C(NO2) daily variation at the OMI overpass time with far more high values of C(NO2) from the PSI than observed by OMI. The solid lines represent the seasonal dependence, which are shown separately in Fig. 9b along with the C(NO2) differences, PSI - OMI. The result is that the average PSI values are double those observed by OMI's large FOV (OMI Version 03: https://avdc.gsfc.nasa.gov/index.php?site=666843934&id=13, last access: 31 July 2018).
The seasonal dependence (Fig. 9b) of C(NO2) from OMI for both Seoul and Busan is fairly regular, with maxima in January of each year and minima in July–August. The seasonal behavior of C(NO2) obtained from the PSI in Seoul varies with high values extending from January into the summer months and with minima varying from August in 2012, September–October in 2013, missing in 2014, July in 2015, and June in 2016. For Busan, the maxima occur in the spring for 2013 and 2014, October for 2015, and in the spring for 2016. The minima are also variable. The difference between OMI and PSI retrievals depends on local conditions for PSI and on an area average for OMI.
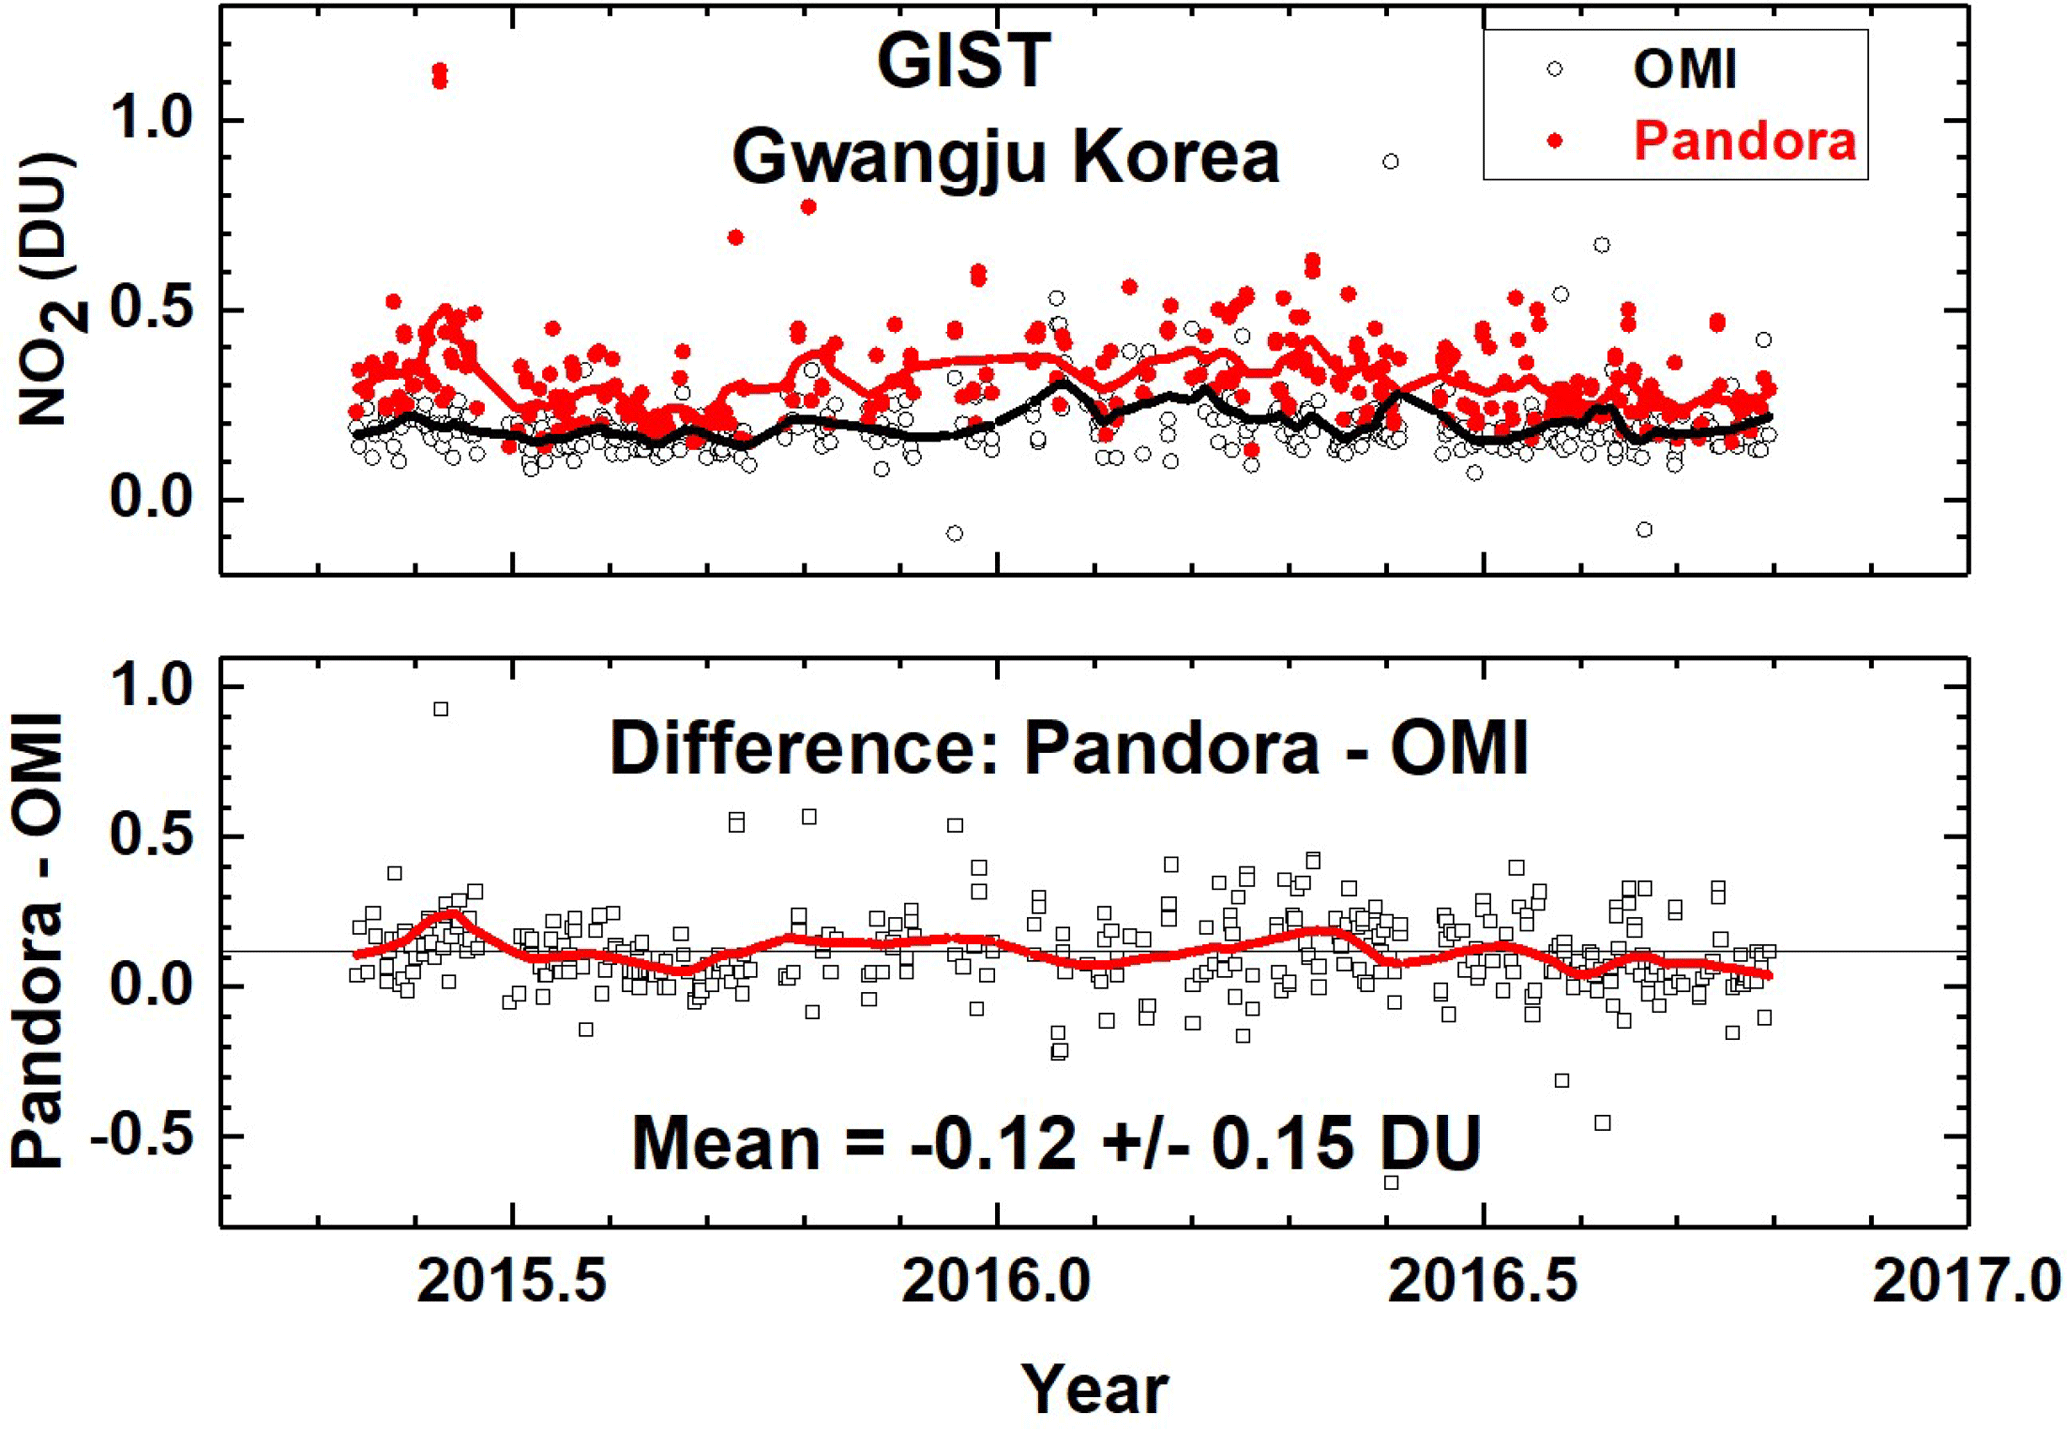
Figure 10C(NO2) time series from Pandora (red) and OMI (black) for GIST University in Gwangju Korea and their differences. The comparison is formed from time coincidences between Pandora and OMI.
Figure 9b shows that the PSI has a mean difference compared to OMI in Busan of 0.35 DU and peak values (up to 2.5 DU at 13:30 and 4 DU in the late afternoon). The differences are important when considering pollution effects on human health (Krafta et al., 2005; Latza et al., 2009). Even larger differences are observed in Seoul, where the mean difference is 0.58 DU between Pandora and OMI at the satellite overpass time. The results from PSI suggest that local ground-based monitoring of pollution is important for estimating their impact on human health, particularly as amounts of C(NO2) occurring later in the afternoon exceed the amounts at the time of the satellite overpass.
A comparison with Lowess(0.1) fits (Locally Weighted least squares fit to 0.1 of the data points; Cleveland, 1981) to the matched Pandora vs. OMI overpass data (about 3-month averages) shows that PSI C(NO2) is larger than OMI measured C(NO2) mostly because of its much smaller 2∘ field of view (a circle of 35 m diameter at 1 km altitude) compared to OMI's FOV of 13×24 km2 at nadir, which may encompass areas outside of the city or the adjacent ocean areas. For example, the center of Seoul is about 48 km from the Yellow Sea, while the OMI overpass file lists FOV center distances of over 60 km from Seoul. Another possible reason for the differences is that OMI C(NO2) retrievals use NO2 vertical profile shape factors from the low resolution ( km) Global Model Initiative (GMI) model simulation to calculate air mass factors that are used to determine observed tropospheric NO2 vertical columns, while much finer resolution profiles are needed to more accurately represent highly polluted urban areas such as Seoul. Increases in OMI retrieved tropospheric column NO2 up to 160 % are found when using model derived 1.33×1.33 km2 profile shape factors (Goldberg et al., 2017). The effect of moderate amounts of cloud or aerosol have little effect on the PSI direct -sun spectral fitting retrieval of C(NO2) as shown in Fig. 2. OMI and MAXDOAS retrievals are sensitive to the presence of aerosols and clouds (Kanaya et al., 2014), which may contribute to the underestimate of C(NO2) by OMI even after corrections are made for retrieved aerosol and cloud amounts (Chimot et al., 2016).
The implications for assessing clean air indices suggest that OMI underestimates the human health effect from trace gases such as NO2, especially in highly populated urban areas. Figure 5 gives a much clearer picture of the degree of pollution than is possible with just the 13:30 OMI comparison measurements, as the late afternoon is the time of maximum pollution.
The city of Gwangju is much smaller than Busan, with less industrial activity, especially automobiles. PSI observations at GIST show much closer agreement with OMI (Fig. 10), especially as GIST is located within the city boundaries, but in an area with much less concentrated industrial activity compared to the center of Gwangju. The large OMI FOV over a relatively clean area reduce the OMI difference in measured NO2 amount compared to the PSI C(NO2) amounts. OMI still measures less than the PSI (0.12±0.15 DU), but the mean difference is not statistically significant. However, OMI clearly misses the high values of C(NO2) that are present in the PSI observations.
Comparison with 4STAR DC-8 overpass data
C(NO2) results were obtained by the Spectrometer for Sun-tracking Sky-Scanning Atmospheric Research (4STAR) flown on-board the DC-8 during KORUS-AQ and compared with the PSI (Fig. 11). The 4STAR is an airborne sunphotometer, capable of measuring total C(NO2), C(O3), water vapor and AOD columns in its direct-sun mode (Segal-Rozenhaimer et al., 2014; Shinozuka et al., 2013), which is similar to the mode used by the PSI network.
A detailed description of 4STAR is given in Dunagan et al. (2013). In brief, the instrument has two structurally rigid grating array spectrometers that are combined to yield continuous spectra between 300 and 700 nm. The instrument sampling rate is 1 Hz, and the nominal integration time used for C(NO2) retrievals is 50 ms (with six spectra averaged per one sampling period). Dark counts are measured every 20 min using a shutter mechanism. The 4STAR light collection system has fiber optic bundle foreoptics that is connected to the spectrometers. A two axis motion control system with analog feedback provides active tracking of the solar disk. The instrument full field of view (FOV) is ∼1.25∘. C(NO2) is retrieved following a method described in Segal-Rozenhaimer et al. (2014), but using the 460–490 nm spectral range. A series of 4STAR columnar NO2 values above aircraft (for legs below 300 m) taken from DC-8 “missed approach” maneuvers flying over Olympic Park PSI station, within a radius of 5 km, are shown in Fig. 11. There is a relatively good correlation (R2=0.7), with a slight positive bias of 4STAR compared with the PSI values. This might result from higher noise effects (i.e., small amount of spectra averages) for 4STAR during the fast change of altitude when the aircraft performs its “missed approach” overpasses over the PSI stations. Relaxing the altitude constraint to include legs below 500 m showed good agreement with the PSI station at Taehwa Mountain, but with an overall lower correlation coefficient (R2=0.54), which is expected due to averaging of larger vertical range. As with PSI, 4STAR shows better agreement with OMI C(NO2) for low values of C(NO2), but considerable differences over polluted areas (Segal-Rozenhaimer et al., 2018), when 4STAR C(NO2) values are averaged within each of the OMI pixels corresponding to the flight path for each of the days.
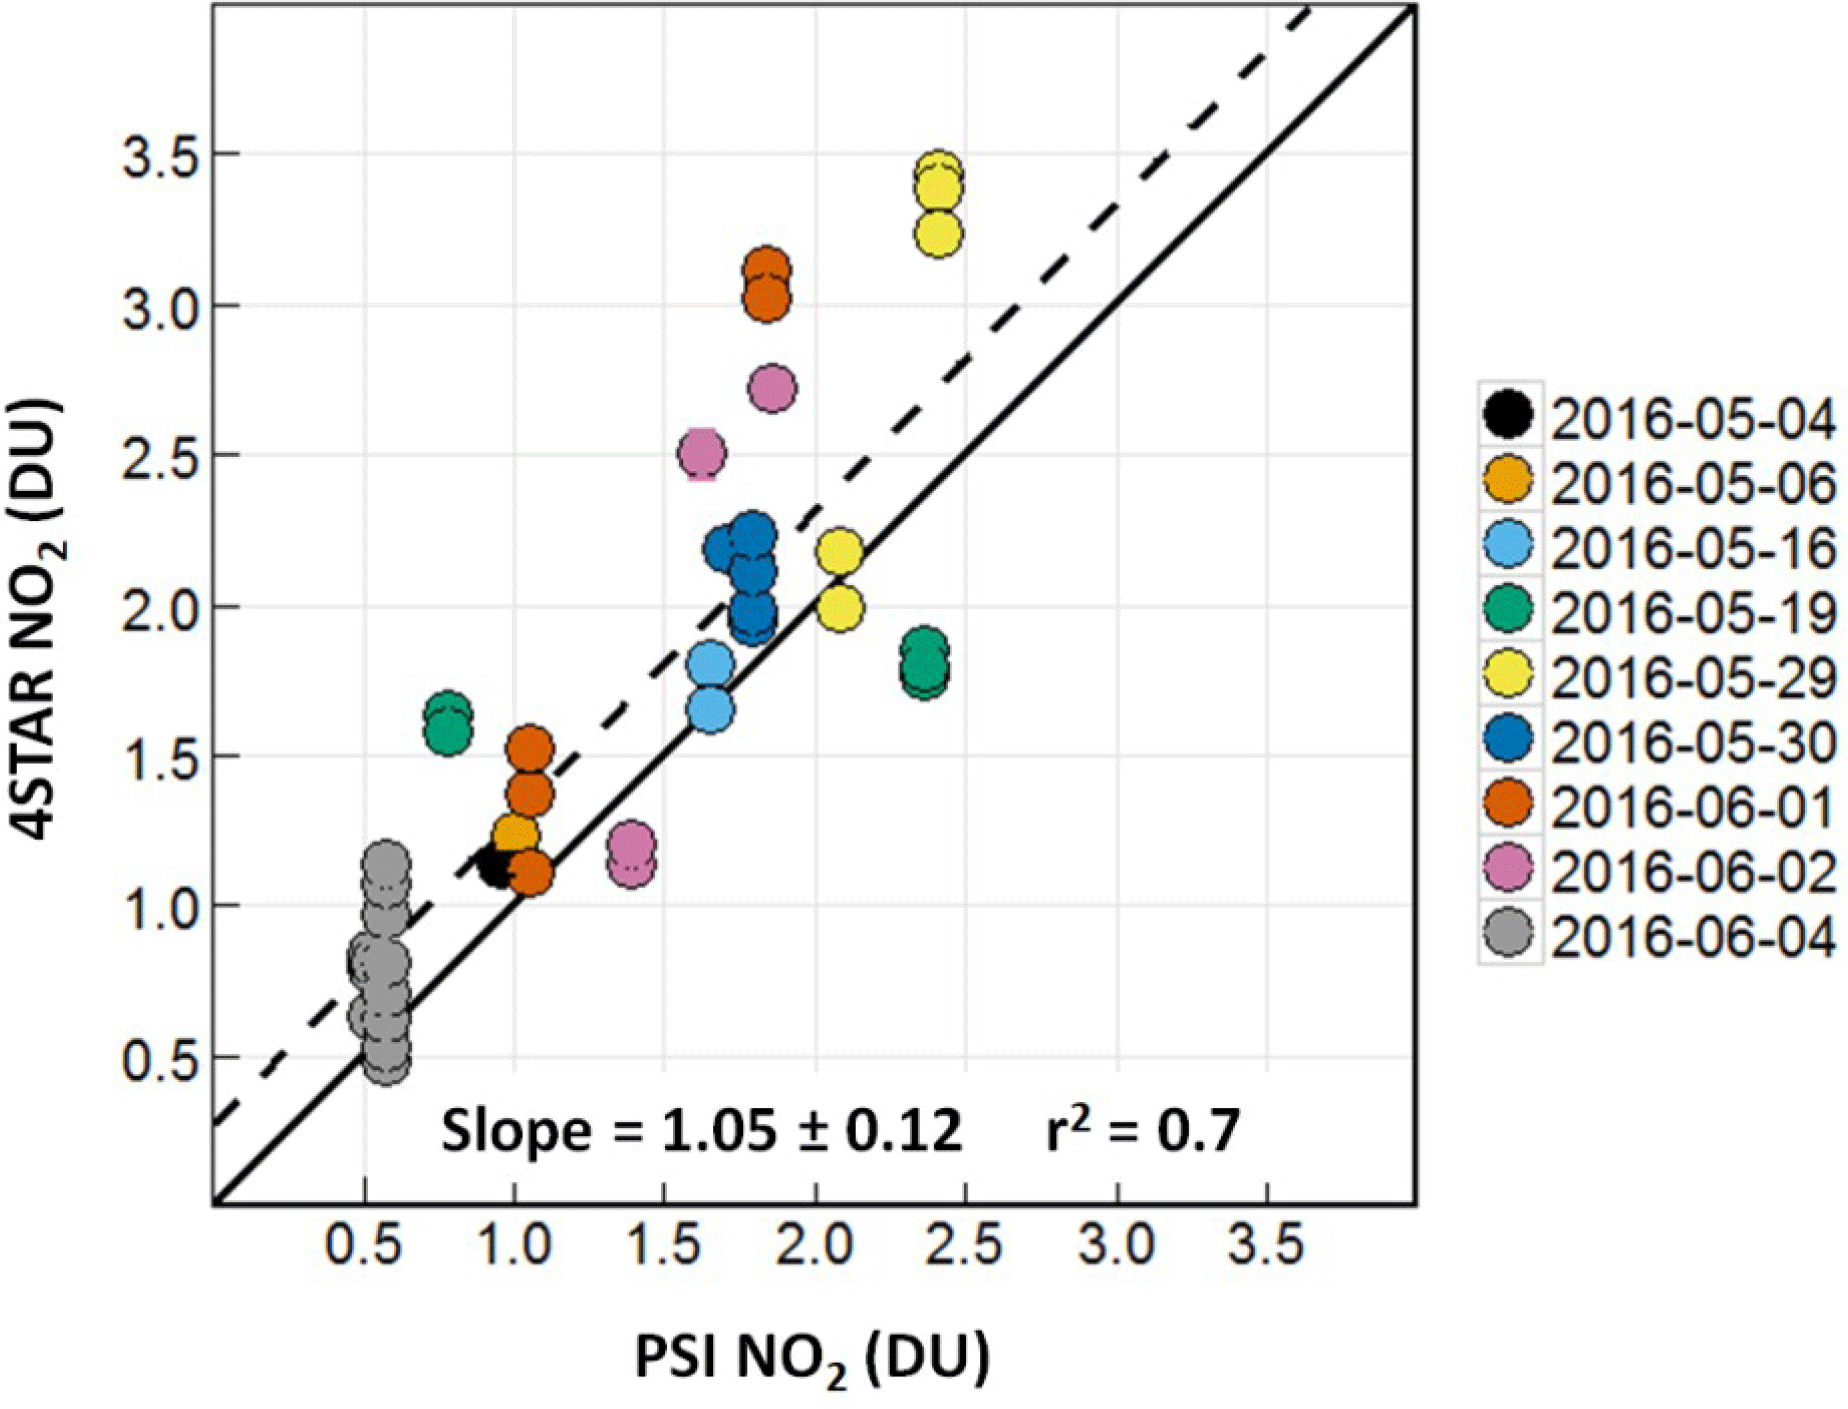
Figure 11A correlation plot of C(NO2) from 4STAR onboard the DC-8 compared to the C(NO2) amount measured by the PSI at Olympic Park on nine different days. The solid black line is the 1 : 1 line drawn for reference. The dashed line represents the data linear fit, with a slope of 1.05, and a correlation coefficient r2=0.7, as shown on the plot.
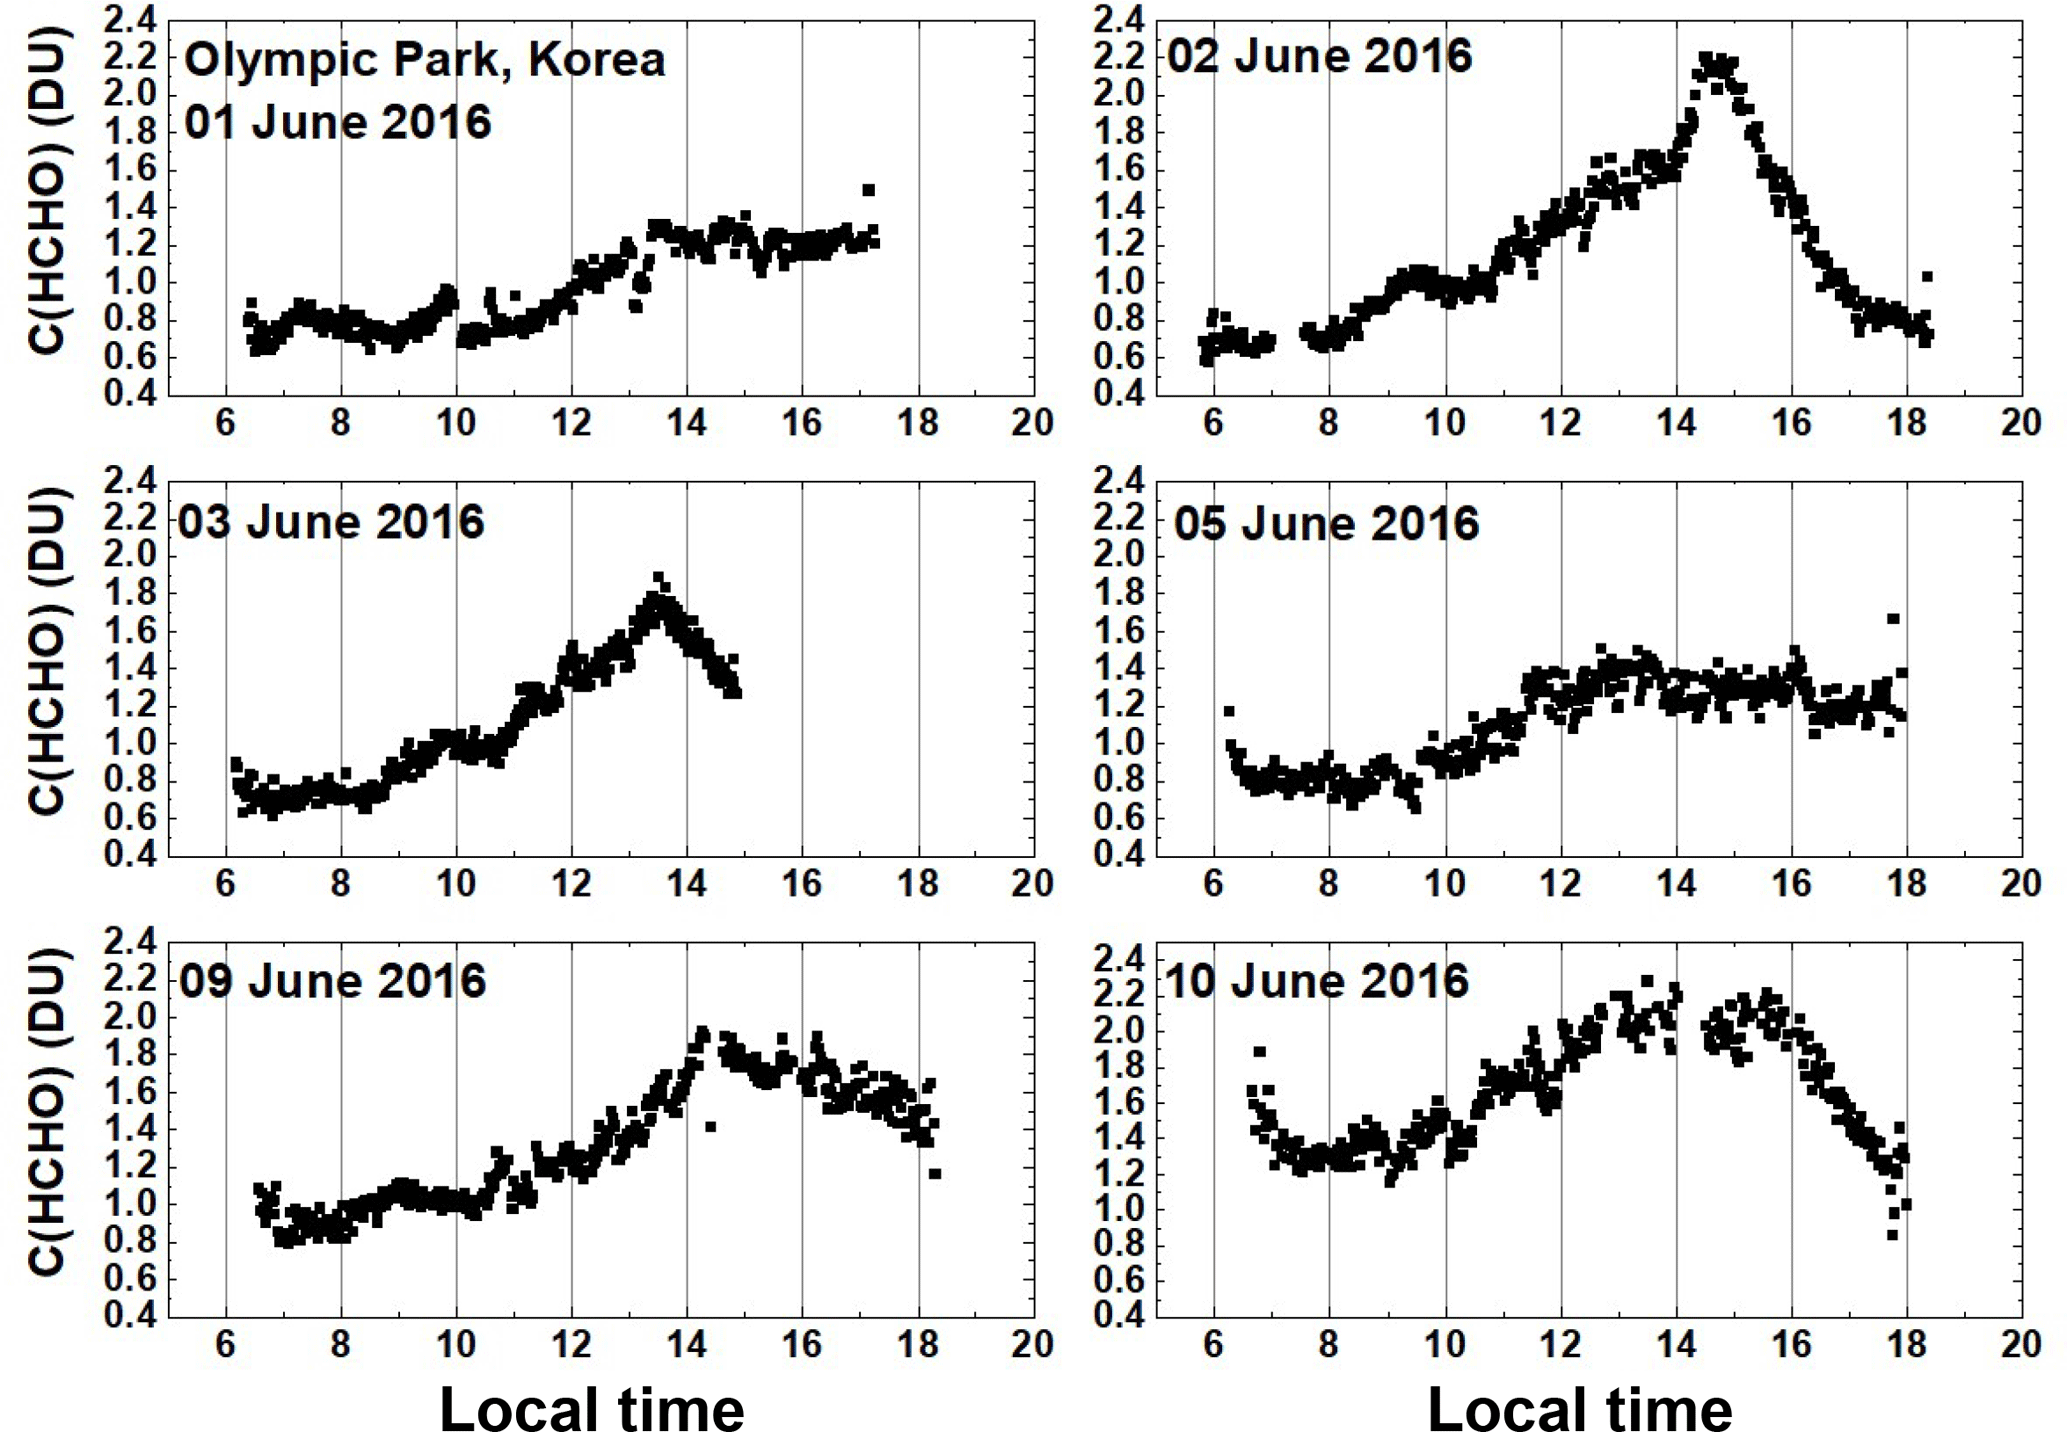
Figure 12C(HCHO) from PSI at Olympic Park for 6 days in June 2016. C(HCHO) on 2 June 2016 has a peak value of 2.3 DU at 14:30 KST.
PSI makes two sets of direct-sun measurements every 80 s. One set is for measurements in the visible range (380–525 nm used for NO2) and the other is for the UV range (290–380 nm with a filter, U340, which blocks visible light). Formaldehyde is derived from the same set of spectral measurements used for ozone (i.e., with a U340 blocking filter), but using the spectral range 332–359 nm. Sources of error in the C(HCHO) retrieval arise from the selection of the fitting window and the amount of C(HCHO) remaining in the reference spectrum after application of the modified Langley estimation (MLE) method of calibration (Herman et al., 2009; Spinei et al., 2018). The MLE extrapolation to zero C(HCHO) could have an offset error of 0.1 to 0.2 DU. Selecting different fitting windows can also cause the C(HCHO) retrievals to differ. For example, a wider alternate fitting window, 324–360 nm, retrieves HCHO values that are about 8 % higher because of different amounts of interference from overlapping absorption by O3, NO2, and BrO at the spectral resolution of 0.5 to 0.6 nm currently in use. Absolute offset errors do not affect the retrieval precision (relative column amounts), which is approximately 0.1 DU. A detailed analysis of the algorithms and uncertainties is discussed by Spinei et al. (2018).
The Olympic Park area has much more vegetation than central Seoul for the production of isoprene (http://www.olympicpark.co.kr, last access: 31 July 2018), which is a significant source of the chemicals needed for formaldehyde production in the atmosphere (Luecken et al., 2012). Observations from PSI show that C(HCHO) starts out every day at low levels 0.6 DU at about 08:00 and increases to over 2 DU until 18:00 (Figs. 12 and 13). Most HCHO arises from photochemical production, while a significant fraction is chemically derived from automotive emissions in densely populated urban areas (Friedfeld et al., 2002; Garcia et al., 2006; Lei et al., 2009; Liteplo et al., 2010). Regardless of the precursor source, HCHO forms in the atmosphere primarily though photochemistry, which causes HCHO to usually be at a minimum early in the day, increase into the afternoon, and decline towards evening. The PSI C(HCHO) observations (Figs. 12 and 13) support this pattern of daily variation.
A summary of the daily time dependence of C(HCHO) at Olympic Park during the entire KORUS-AQ campaign is shown in Fig. 13. As in Fig. 12, minimum values are observed in the morning (06:00–08:00) before the chemical and direct sources of HCHO are significant. There is strong buildup during the day that reached a maximum between 15:00 to 16:00, and then diminished towards sunset. As with NO2, the daily pattern of late afternoon peaking of HCHO amounts presents a problem for polar orbiting satellite observations (e.g., OMI observations at 13:30) assessing air quality.
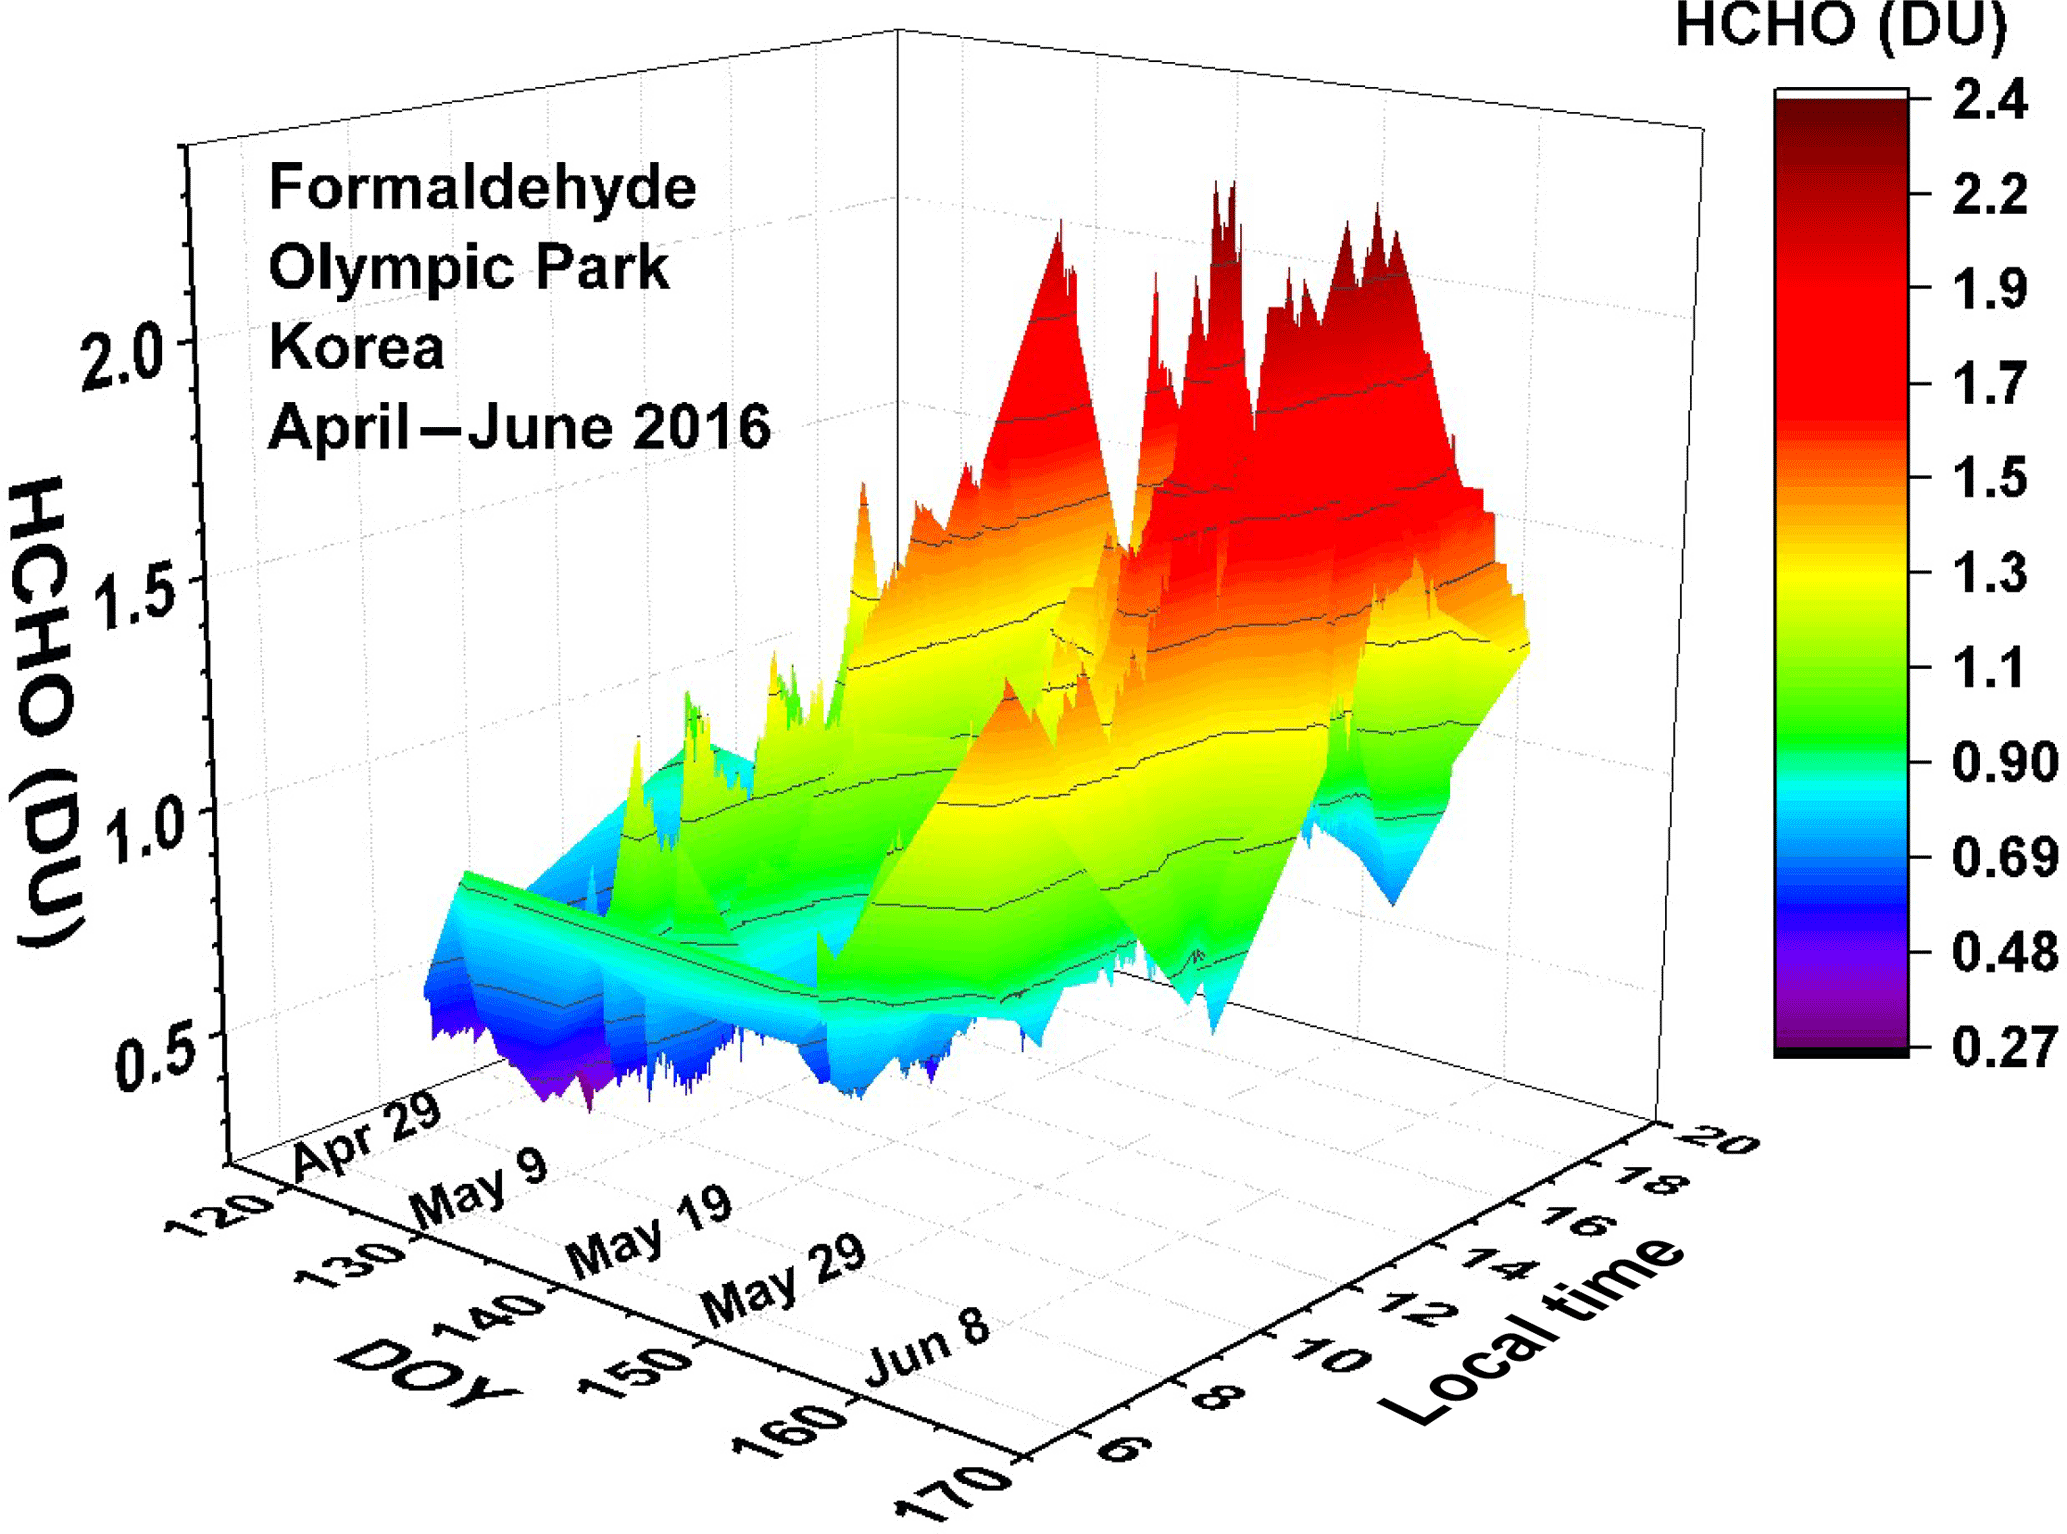
Figure 13Pandora measured formaldehyde amounts vs. day of the year and local time for 29 April 2016 to 11 June 2016 in Olympic Park.
Figure 14 shows two altitude profiles acquired by the Compact Atmospheric Multispecies Spectrometer (CAMS) (Richter et al., 2015) onboard the DC-8 aircraft as it spiraled over the Olympic Park area on 4 May 2016 in the morning and at midday. Quoting from Richter et al. (2015):
CAMS is a multi-species spectrometer configured for the simultaneous detection of ethane (C2H6) and formaldehyde (CH2O). The spectrometer utilizes a tunable, fiber optically pumped difference frequency generation laser source in combination with a Herriott type multi-pass absorption cell with an effective path length of 89.6 m.
The morning integrated amount on 4 May was 1.02×10¹⁶ molecules cm−2 (0.38 DU) and the afternoon amount was 6.95×10¹⁵ molecules cm−2 (0.26 DU), both substantially less than the PSI measured values of 0.48 and 0.42 DU, respectively. There were no surface measurements of HCHO mixing ratio on 4 May at Olympic Park. On 2 June at 11:40 there was a surface measurement 3.94 ppb. Including the surface measurement in the profile integral yields Integ(0.026, 7.2 km) = 0.55 DU, while PSI measured 1.2 DU, which is consistent with the differences shown in Fig. 14. The notation in Fig. 14 is for the altitudes z1 to z2, where z is in km.

Figure 14HCHO altitude profile measured by CAMS onboard the DC-8 on 4 May at 07:54 KST (a) and 11:54 KST (b) over Olympic Park, Korea. (c) PSI measurements of total column HCHO. Vertical bars (c) mark the DC-8 flight duration for the profiles yielding altitude integrated column amounts of 0.38 and 0.26 DU.
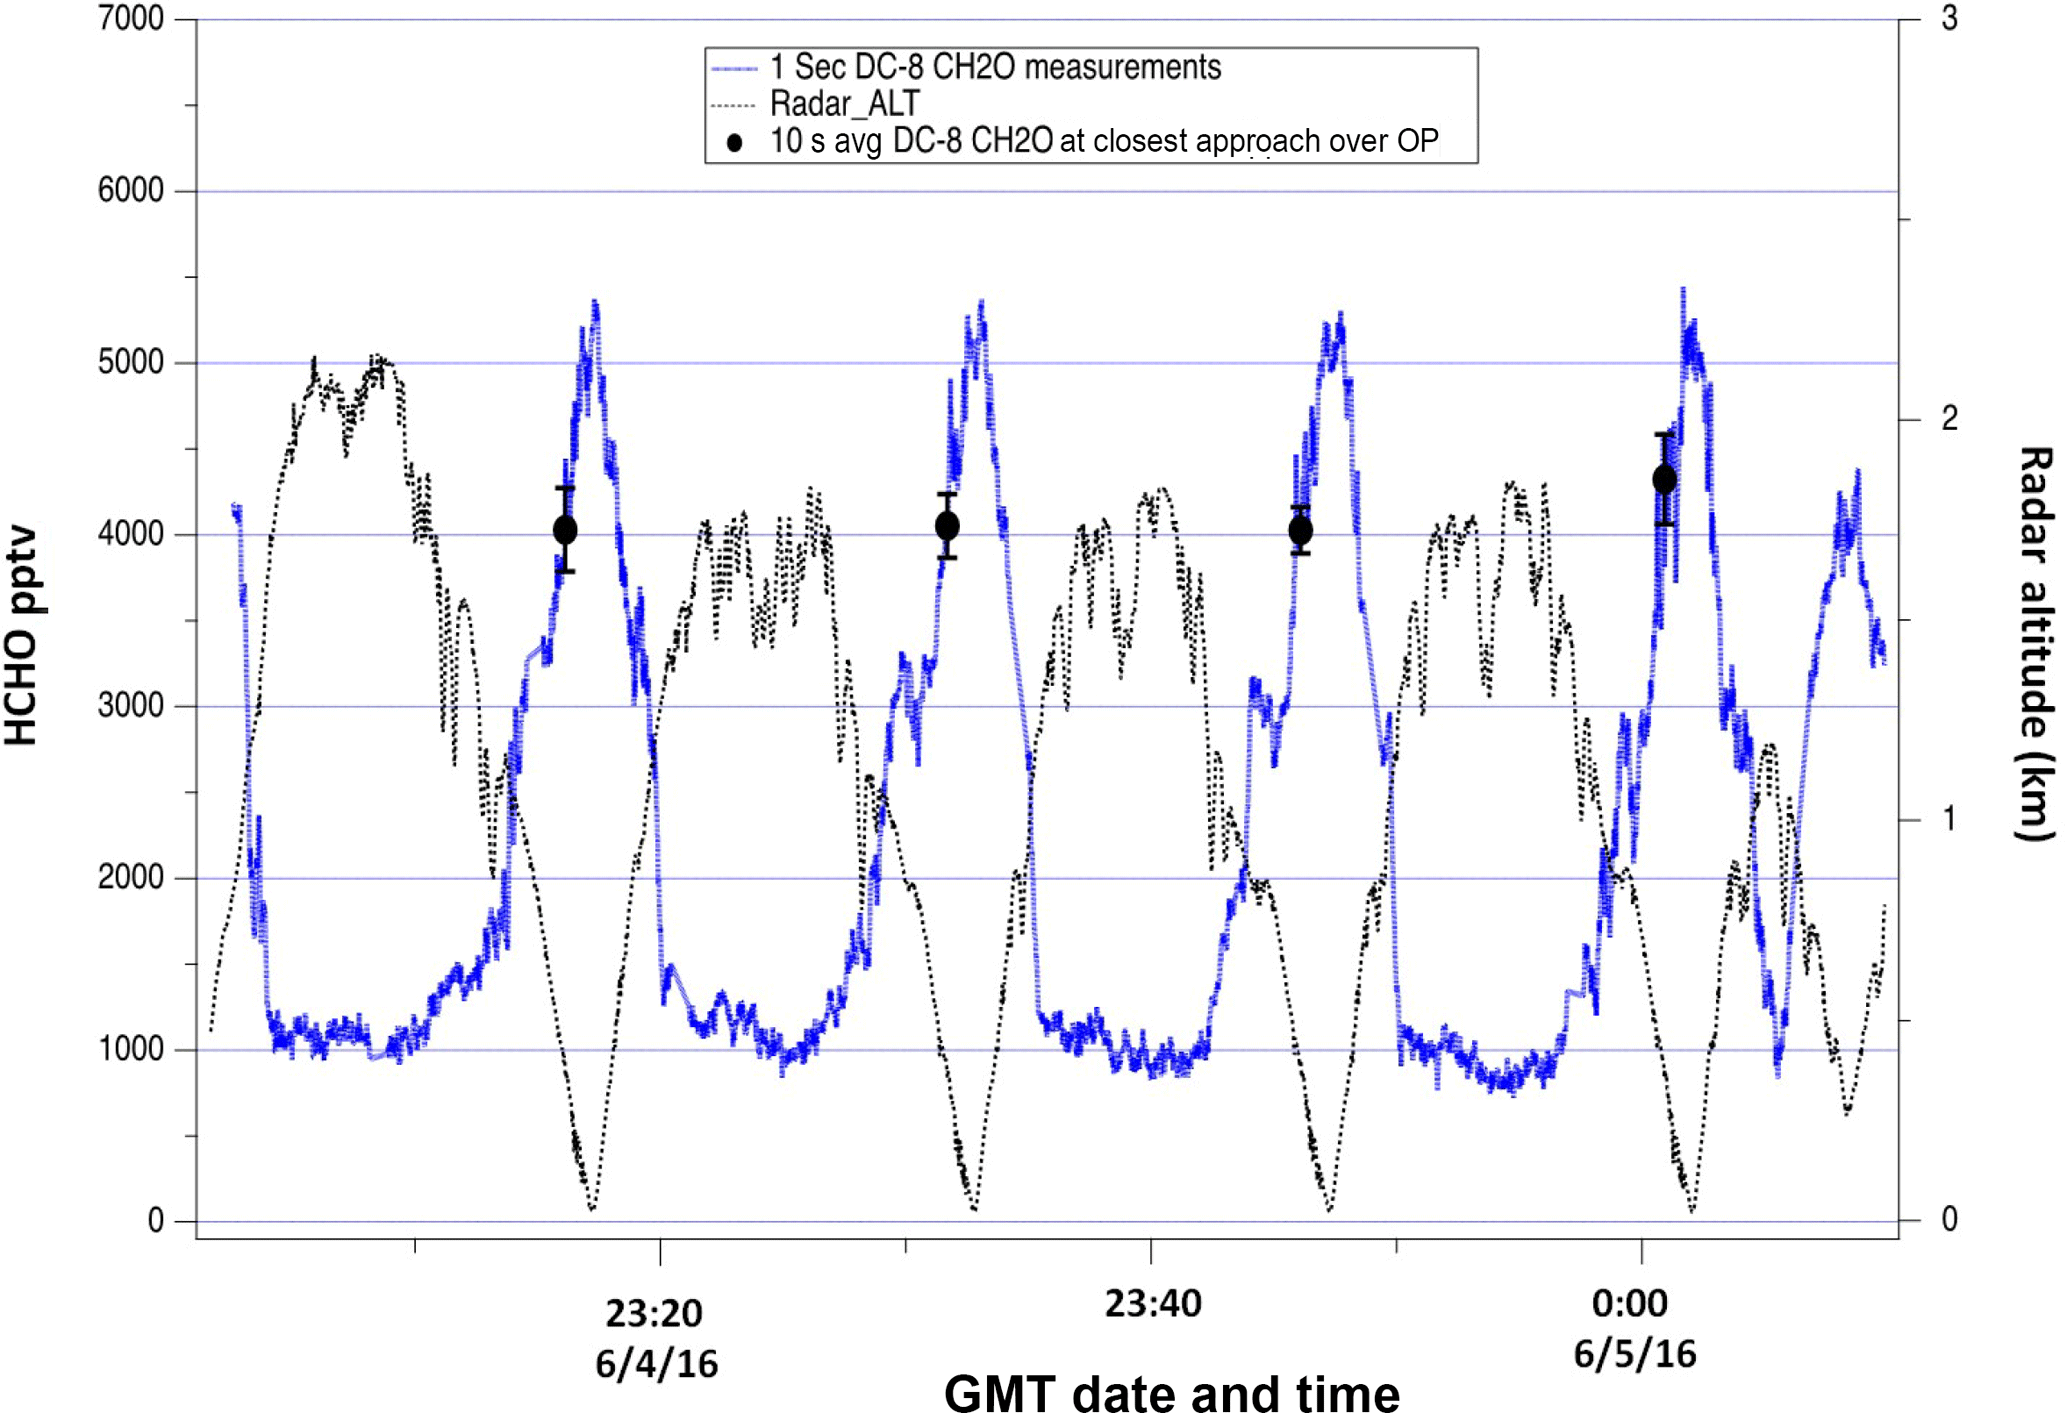
Figure 15DC-8 CAMS HCHO mixing ratio measurements over Olympic Park on 4 June. The continuous blue profiles show the 1 s HCHO data while the black points with error bars show the 10 s average and standard deviation of this data at points of closest approach above the Olympic Park site.
The profiles used data for lower altitudes obtained from aircraft “missed approach” maneuvers at a nearby Seoul Airbase, 8.5 km from Olympic Park, (Fig. 15). When available, a single surface altitude point was added using ground-based volume mixing ratio measurements obtained from US Environmental Protection Agency measurements using quantum cascade laser instruments (Fried et al., 2008; Hottle et al., 2009; Richter et al., 2015; Spinei et al., 2018 and references therein). The DC-8 minimum altitude exactly over Olympic Park was typically around 0.4 km above the surface (black circles Fig. 15). Large vertical CAMS retrieved HCHO gradients were observed as the DC-8 descended to lower altitudes over Seoul Airbase. A comparison of 10 s DC-8 HCHO averages at the points of closest spatial approach to the Olympic Park (black circles) site on 4 June, for example, to peak HCHO measurements during missed approaches at the nearby Seoul Airbase (20–40 m above the ground) revealed ratios in the observed HCHO (black circles) ranging between 75 % to 83 % of the maximum values near the surface. As Olympic Park DC-8 overpasses miss significant near-surface HCHO amounts, the profiles shown in Figs. 14 and 16 incorporate the HCHO amounts down to the surface at an altitude of 0.026 km a.s.l (above sea level) derived from the “missed approach” at Seoul airbase. HCHO measurements above the maximum altitude over Olympic Park (see Figs. 14 and 16) were taken from the closest time over the Taewha Mountain site, 28 km from Olympic Park. The assumption is that the horizontal gradients above 2.2 km (Fig. 15) can be neglected.
After conversion from mixing ratio to molecules cm−3 using the measured atmospheric density, the resulting profile data were integrated from the minimum (0.026 km asl, Table 1) to the maximum heights indicated in Fig. 14. The result is 0.38 DU at 07:54 and 0.26 DU at 11:54 compared to the measurements from the Pandora instrument 0.48 and 0.38 DU The derived vertical HCHO columns from the DC-8 data in Fig. 14a and b are 79 % of PSI measured C(HCHO) in the morning and 68 % of PCI C(HCHO) at midday (Fig. 14c).
A similar comparison is shown in Fig. 16 for 5 June 2016 where the amount of C(HCHO) is much larger than on 4 May. Integration of the measured profiles yields column densities of 0.60 and 0.82 DU at 08:30 and 15:21 h. For this case, at both times the CAMS DC-8 values are about 77 % and 63 % of the PSI measured column amounts, 0.78 and 1.3 DU. For both cases in Figs. 14 and 15 the 23 % to 37 % differences are outside of the expected error from PSI fitting window selection and from residual HCHO included in the MLE calibration method.
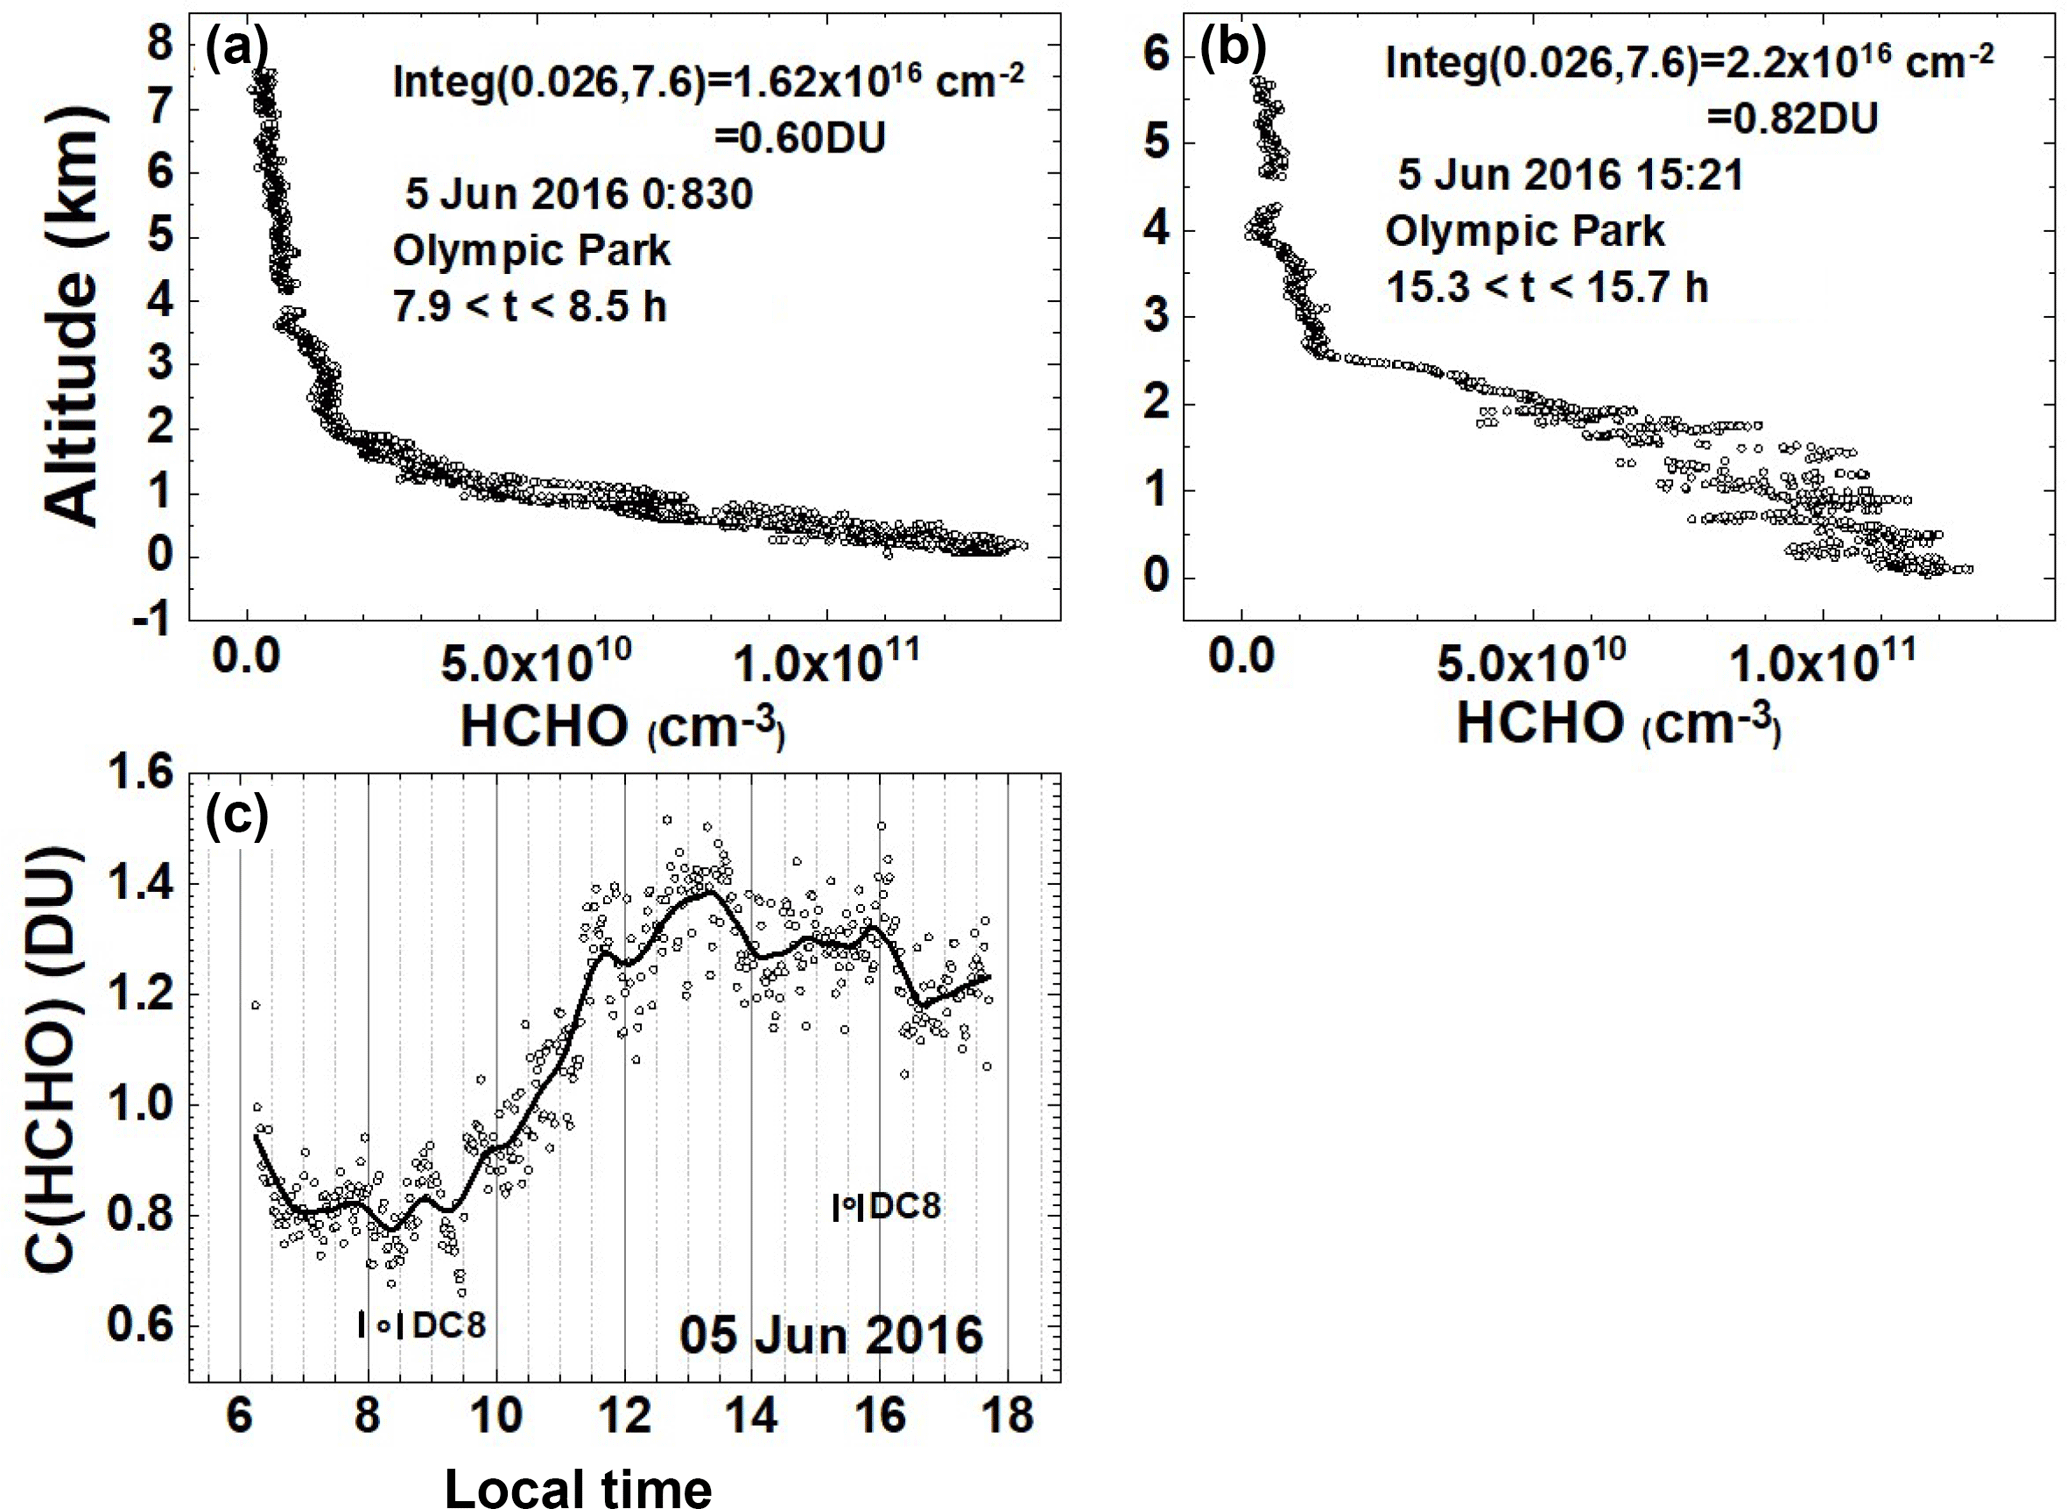
Figure 16HCHO altitude profiles measured by CAMS onboard the DC-8 on 5 June at 08:30 KST (a) and 15:21 KST (b) over Olympic Park, Korea. (c) PSI measurements of total column HCHO. Vertical bars mark the DC-8 flight duration for the profiles yielding column amounts of 0.60 and 0.82 DU.
Another Olympic Park case on 9 June 2016 shows CAMS = 0.79 vs. PSI = 1 DU at 08:06, CAMS = 0.74 vs. PSI = 1.3 DU at 12:12, and CAMS = 1.13 vs. PSI = 1.9 DU, or the CAMS measurements on the DC-8 are 79 % and 57 % less than the PSI total column HCHO. All of the remaining comparisons of CAMS DC-8 profile results with PSI C(HCHO) show similar results. The reasons for the disagreement between C(HCHO) measured by direct sun observations (PSI) and the integrated column density from aircraft measurements of HCHO VMR are not known. Contributions to the differences include the selection of the PSI wavelength window (332–359 nm) and possible interference from overlapping NO2 and O3 absorption that are not properly included, and, more likely, the use of CAMS measured volume mixing ratios at the lowest altitudes from the nearby Seoul airbase, 8.5 km from Olympic Park, where spatial variation may affect the calculation of C(HCHO). The use of Taehwa Mountain data for higher altitudes over Olympic Park contributes 25 % for 3 of the above cases and 50 % for 4 May 2016 at 07:54 (Fig. 14a). This is probably not the reason for the disagreement between CAMS and PSI, as the percent underestimate for CAMS over Taewha is about the same magnitude (Table 2) as over Olympic Park.
Table 2Taehwa Mountain. DC-8 compared to PSI measurements in Fig. 18.
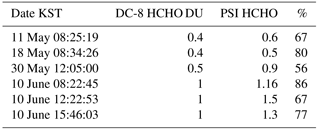
PSI measurements show that Olympic Park produces more HCHO almost every day than observed at the Yonsei University in Seoul and Taehwa Mountain sites (Figs. 12, 17, 18). The hourly variations observed during the KORUS-AQ campaign at the Yonsei University in Seoul and at Taehwa Mountain sites are similar to Olympic Park even though most of the HCHO is locally produced by photochemistry, but has a relatively short lifetime of a few hours in polluted air where there is significant ozone and OH. However, at typical wind speeds of 10–20 km h−1 and a chemical lifetime of 2.5 h (Dufour et al., 2009), HCHO can be transported about 25–50 km, which is far enough for some transport of HCHO between the PSI sites at Yonsei, Olympic Park, and Taewha Mountain DC-8 CAMS results over the Taehwa Mountain site compared to PSI are given in Table 2 with differences similar to Olympic Park.
Figure 19a and b summarizes all of the C(HCHO) data obtained during KORUS-AQ at the five sites. The graphs on the left show all of the data points (light gray circles) as a function of the local time and a Lowess(0.1) fit to the data showing the average hourly behavior. The spread of the data about the Lowess(0.1) fit represents the day-to-day variation at a given local time. On average, Mt. Taehwa tends to increase throughout each day, while Yonsei and Olympic Park show maxima at 14:00 and 15:30 KST, respectively. Similarly, in Fig. 18b Yeogju increases during the day having a maximum at 17:42 KST while Anmyeondo has a broad peak with maxima at 12:00 and 13:42 KST.
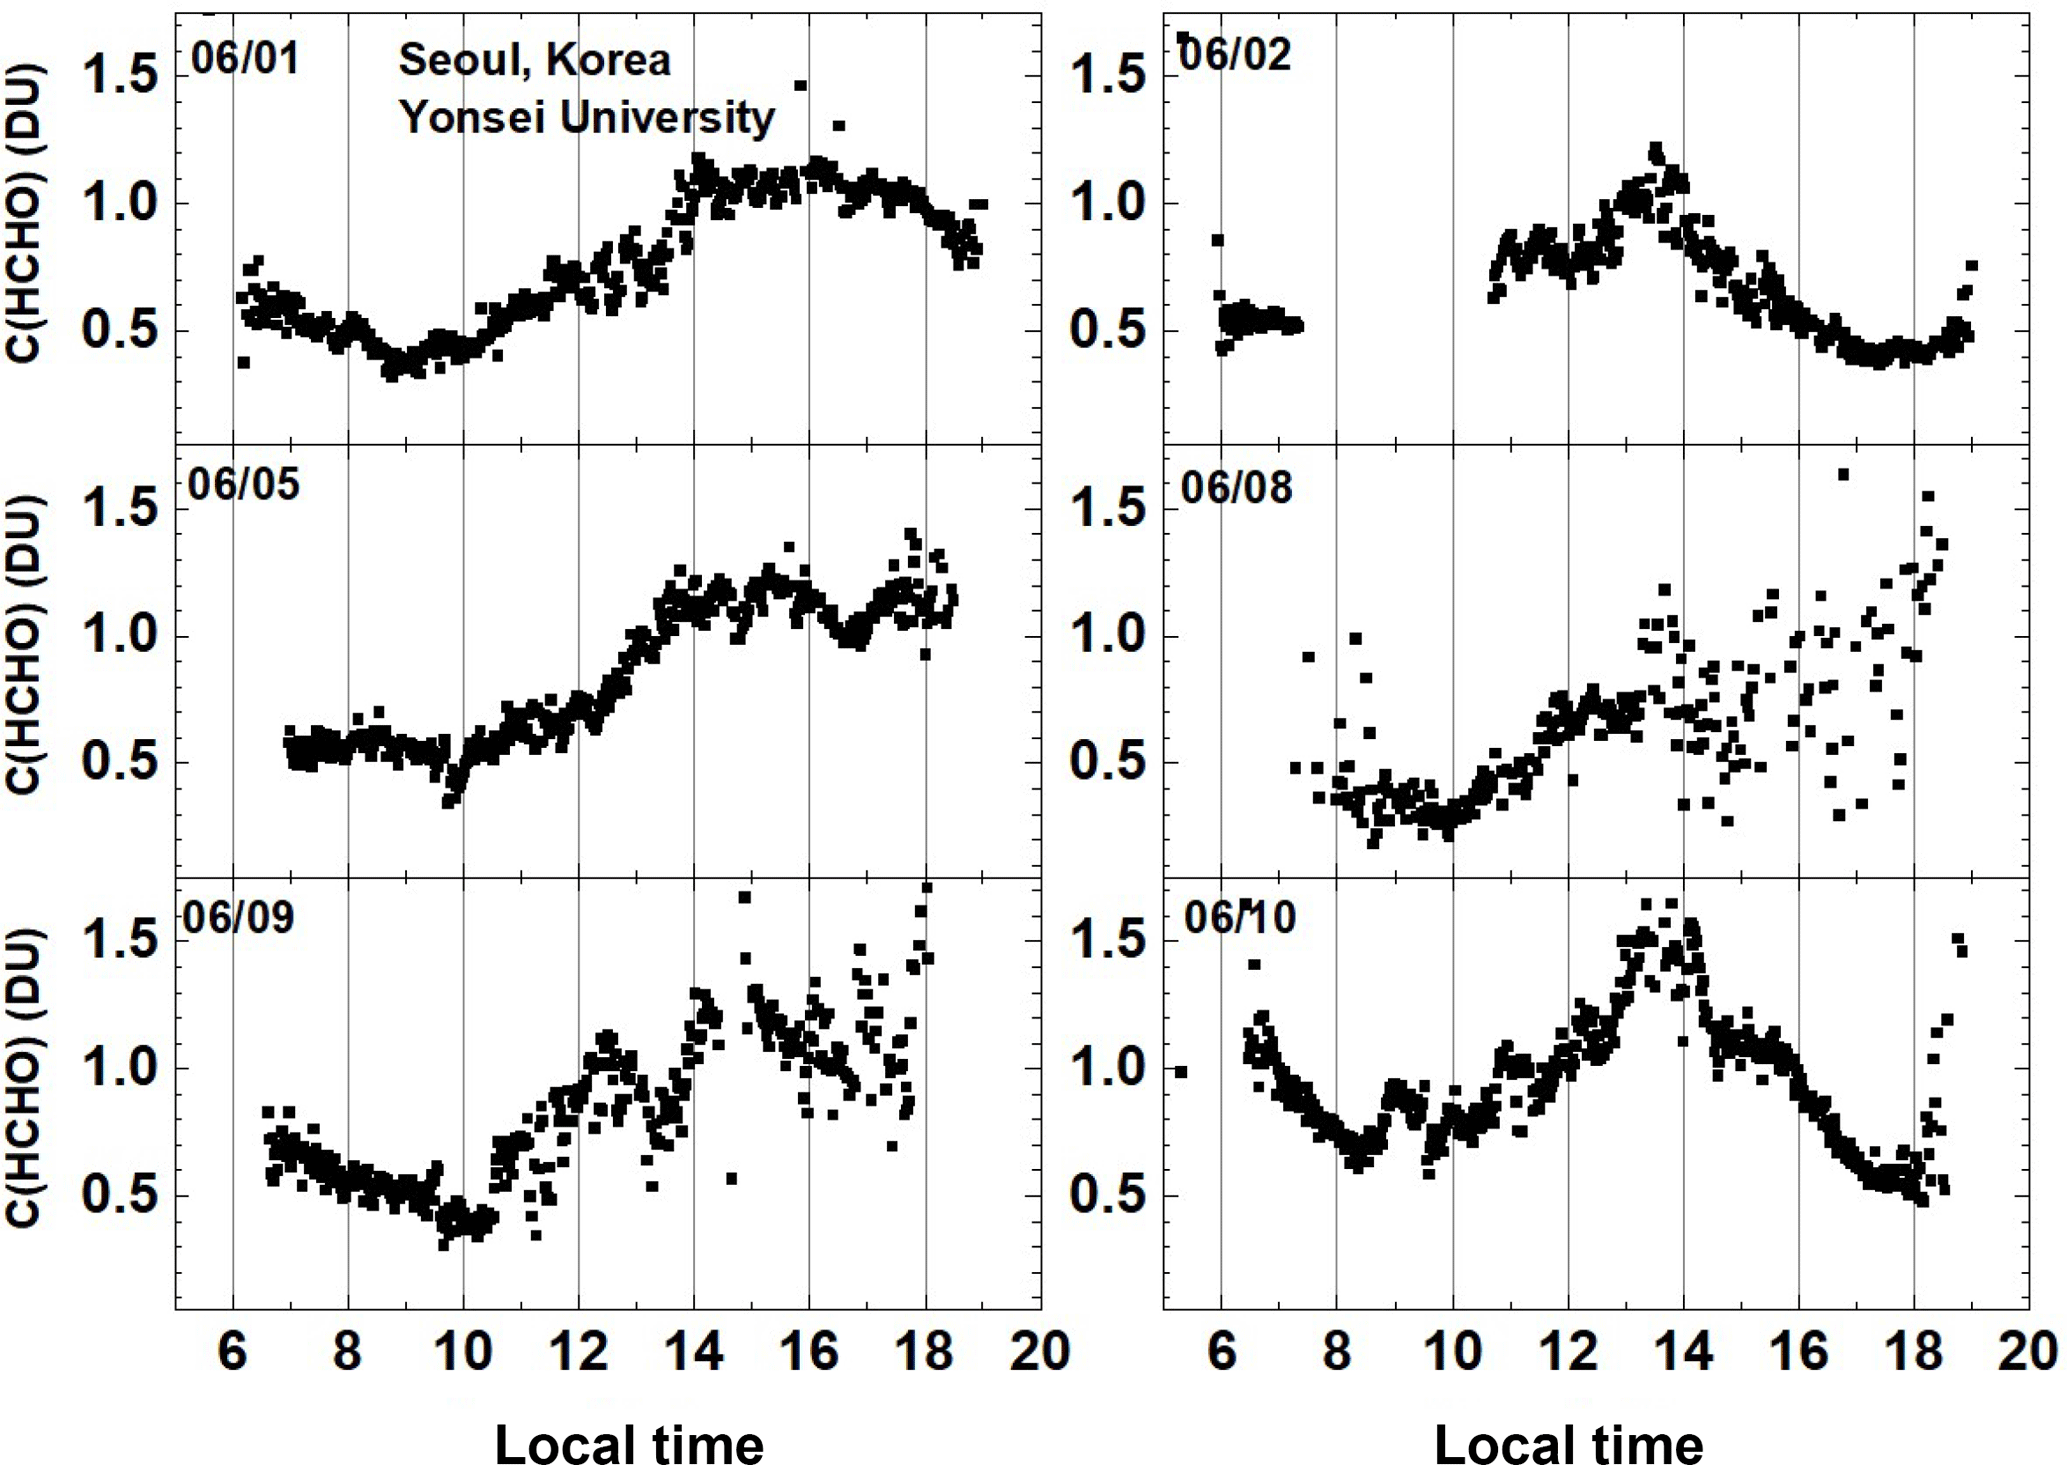
Figure 17Total column HCHO from Pandora Yonsei University, Seoul for 6 days in June 2016. C(HCHO) on 2 June 2016 has a peak value of 1.2 DU at 13:30.
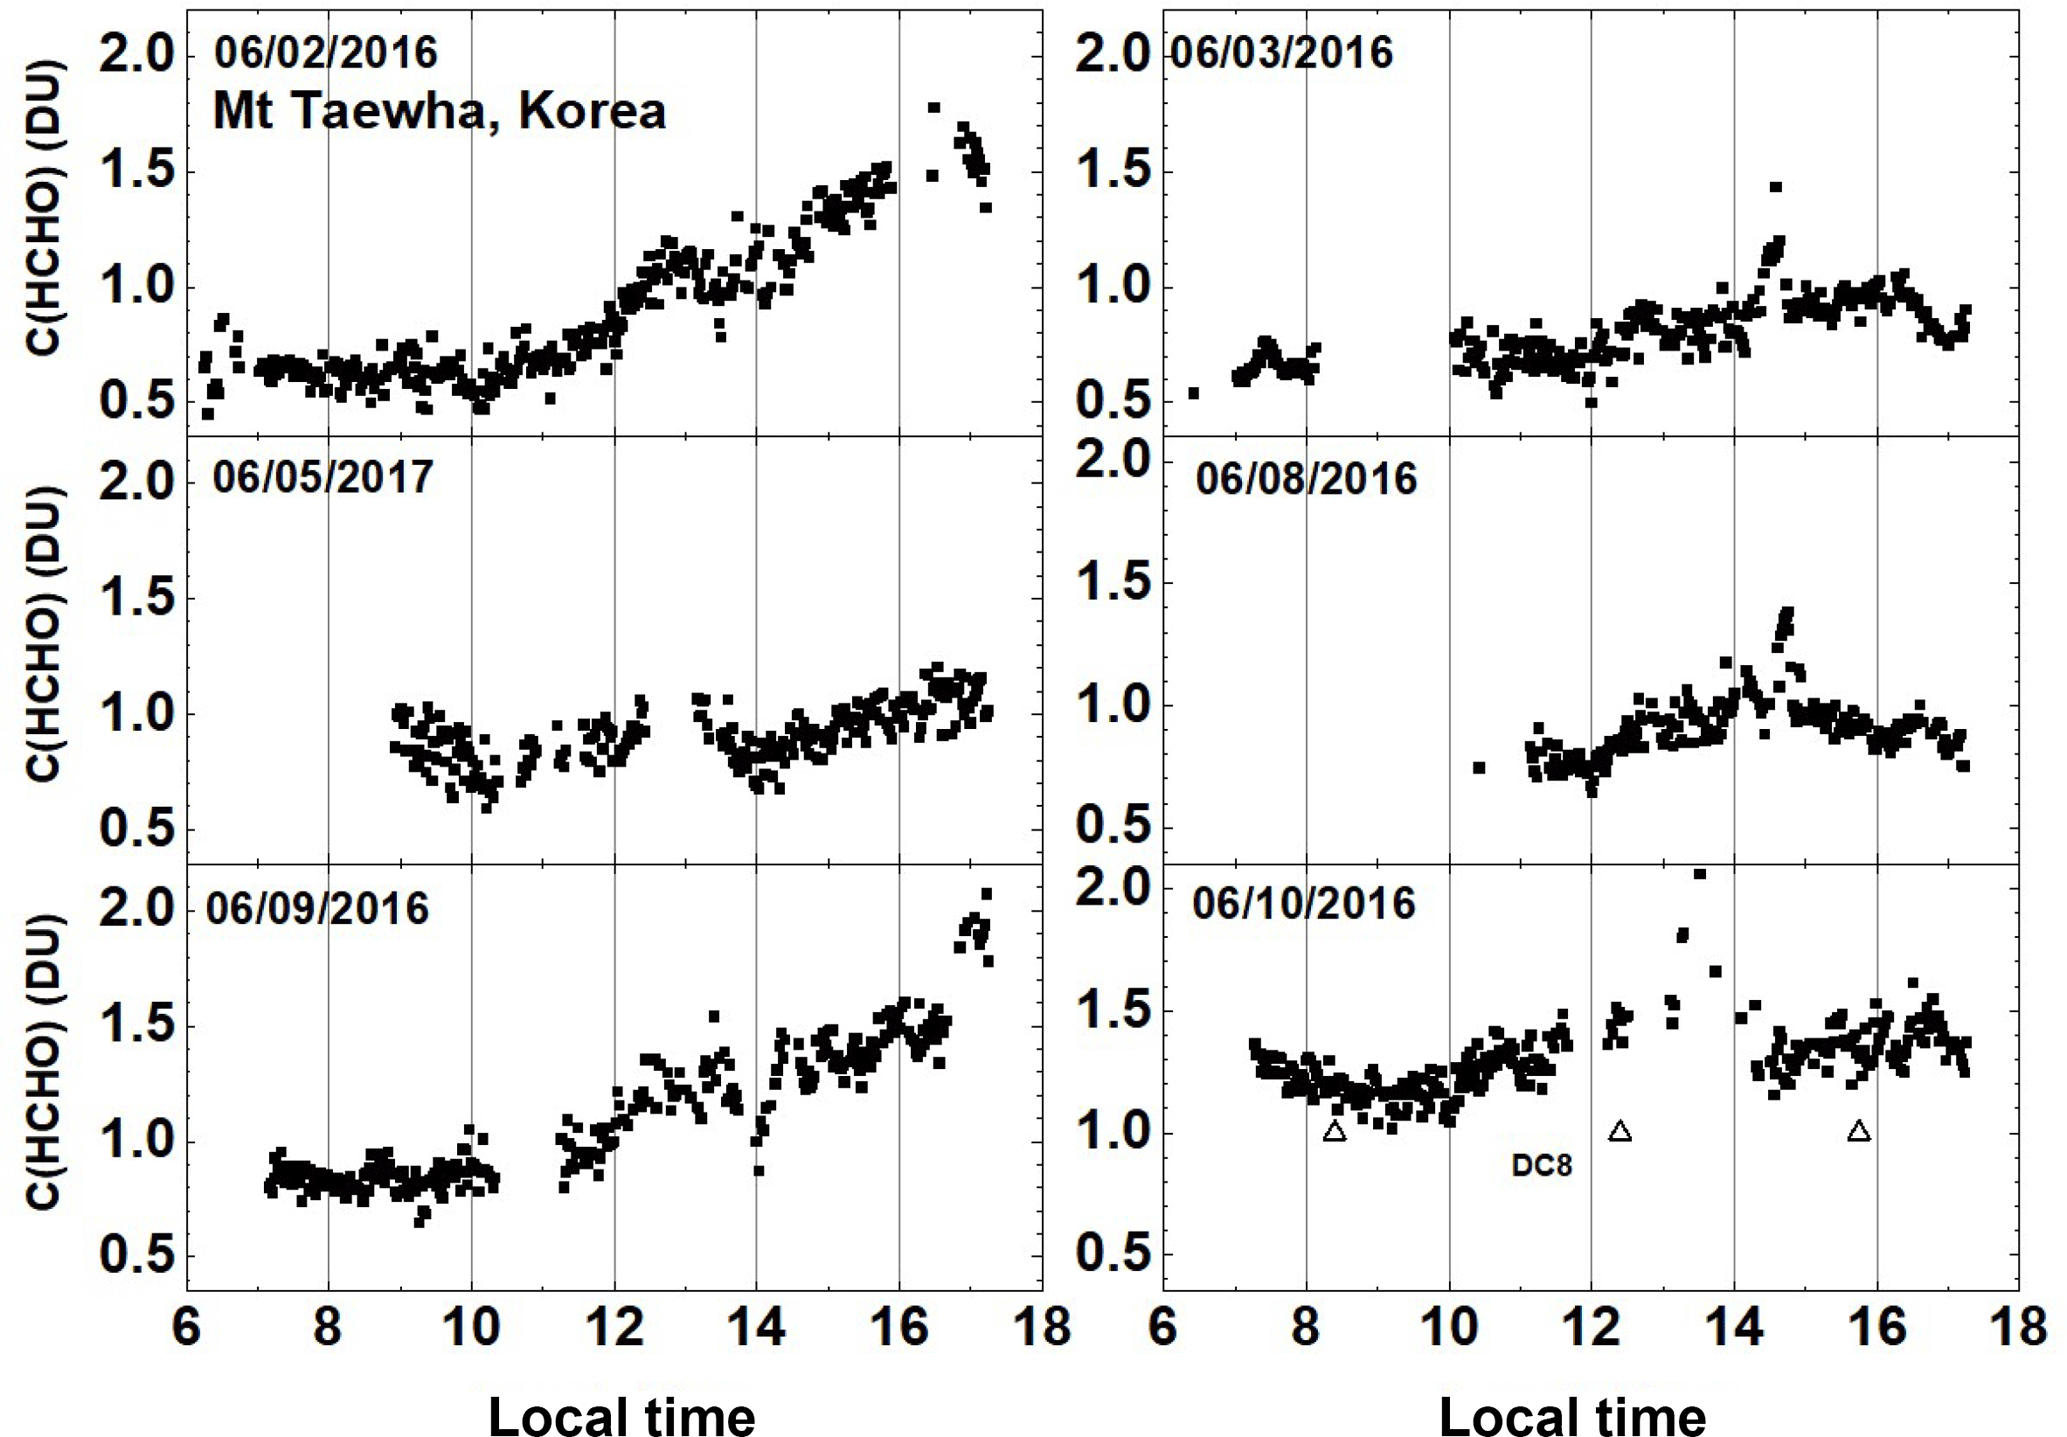
Figure 18Total column HCHO from Pandora Taehwa Mountain for 6 days in June 2016. C(HCHO) on 2 June 2016 has a peak value of 1.2 DU at 12:45. Δ are DC-8 CAMS measurements on 10 June.

Figure 19(a) Summary of total column HCHO for the stated dates during the KORUS-AQ campaign. The solid line is a Lowess(0.1) fit to the data. The sharp cutoffs in panels (a), (b), and (c) were caused obstructions of the direct sun from the PSI FOV in the afternoon. (b) Summary of total column HCHO for the stated dates during the KORUS-AQ campaign. Panels (a) and (b) represent the daily variation at a given local time. The solid line is a Lowess(0.1) fit to the data. Panels (c) and (d) show the frequency of occurrence (%) for different amounts of C(HCHO).
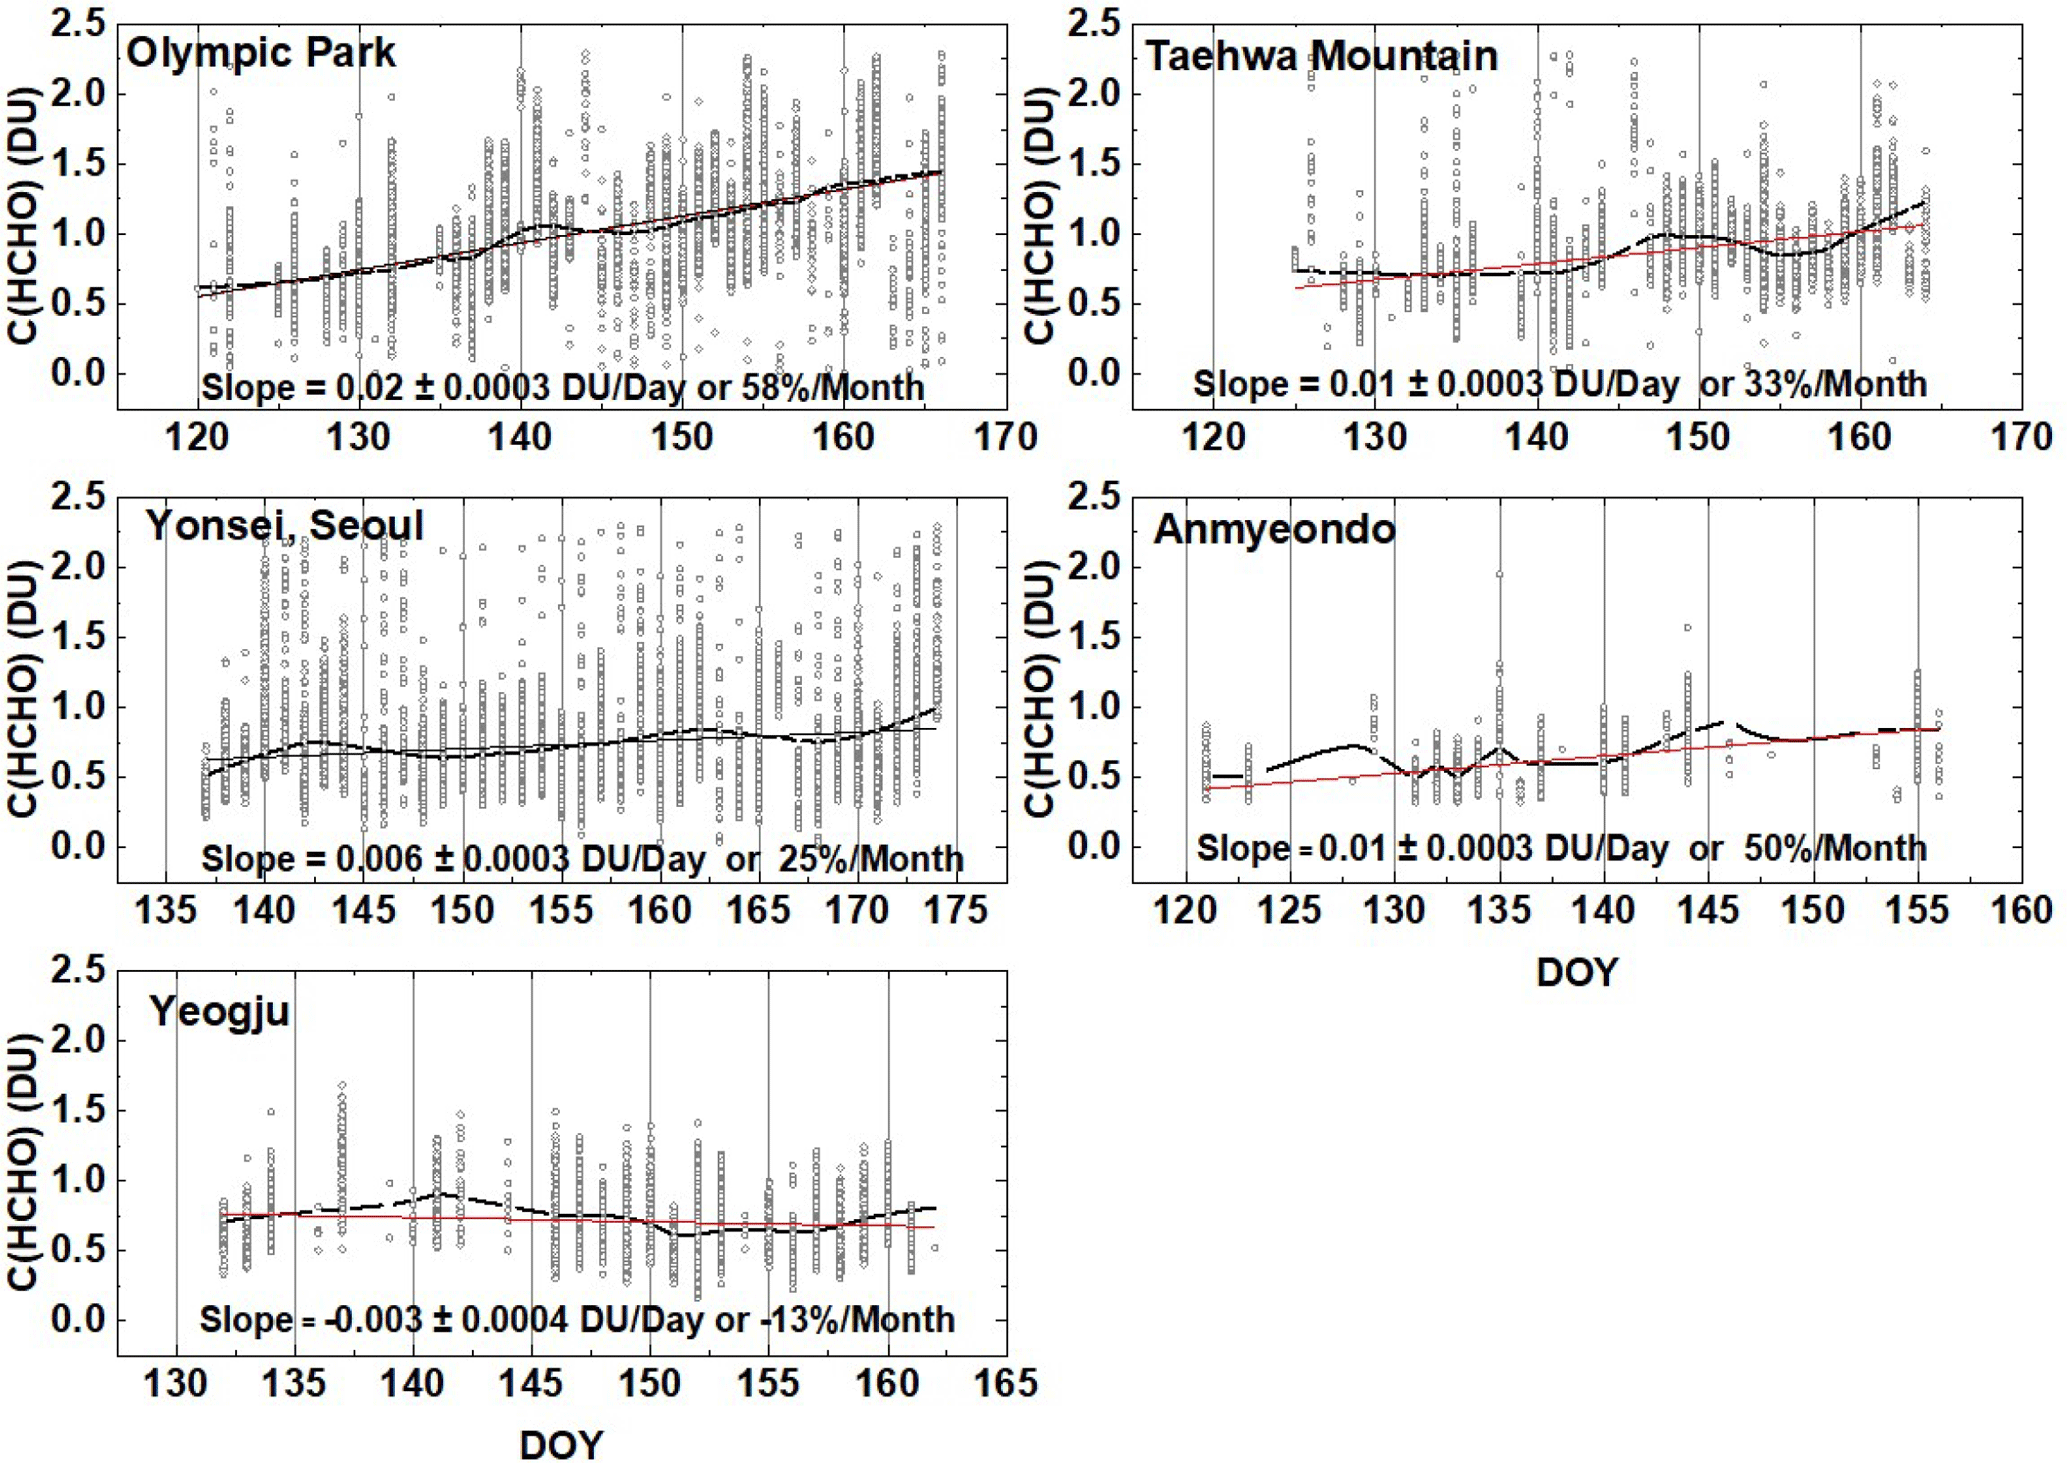
Figure 20The springtime change in C(HCHO) over about a 40 day period depending on the site. The “vertical bars” are the diurnal variation within each day of data. The thicker red curve is a Lowess(0.3) fit to the data, while the thin red line is a linear least squares fit. The Lowess(0.3) fit is approximately a 10-day local least-squares average.
The histograms on the right side of Fig. 19 represent the percent frequency of occurrence of C(HCHO) in 0.1 DU bins. C(HCHO) at Mt. Taehwa and Seoul rarely exceeds 1.5 DU compared to Olympic Park where C(HCHO) > 2 DU for a significant fraction of time. The most frequent values are 0.6 DU for Seoul, 0.9 DU for Mt. Taehwa, and over 1 DU for Olympic Park. Olympic Park also has a broader distribution towards higher values of C(HCHO) than other sites.
The general intra-day C(HCHO) time dependence and C(HCHO) percent occurrence are shown for two additional sites (Fig. 19b), Yeogju and Amnyeondo. Yeogju shows an increase in C(HCHO) from morning to a peak value of 0.85 DU at 14:42 KST, which then declines after 16:00 KST. In contrast, Amnyeondo is almost symmetric with the sun position, having a maximum of about 0.77 DU near 12:00 and 13:42 KST.
The average change in C(HCHO) during the spring campaign at the five sites is summarized in Fig. 20. Of the sites, Olympic Park showed the largest change rate, 58 % month−1 followed by Amnyeondo at 50 % month−1, then Taehwa (33 % month−1), Yonsei Seoul (25 % month−1), and Yeogju (−13 % month−1). Amnyeondo tends to have lower C(HCHO) amounts because of its relatively isolated coastal location. These 2-month trends include seasonal increases during the campaign months May and June, 2016.
It is difficult to compare PSI C(HCHO) with OMI for the KORUS-AQ period, as OMI overpass C(HCHO) data for 2016 have some missing days (Fig. 21). For days with matching data points over Seoul, PSI C(HCHO) (approximately 0.8 DU) is almost always larger than the OMI values (0.2 DU) plus a few very high PSI values and two high OMI values. The general day-to-day variations are similar.
Nine Pandora Spectrometer Instruments, PSI, were installed at eight sites in South Korea as part of the KORUS-AQ ground, aircraft, and satellite measurements for air-quality studies. The measurements made during the months of April to June by PSI showed very high amounts of urban pollution from NO2 and HCHO, and more moderate, but still high values in Mt Taewha and Yeogju, which are some distance from the major urban centers,. The urban areas show minimum values in the morning that rise rapidly throughout the day, peaking in the late afternoon for both C(NO2) and C(HCHO). An exceptionally clean location was Amnyeondo, which is located on a western coastal island adjacent to the Yellow Sea about 100 km south of Seoul.
PSI direct-sun retrieved values of C(NO2) and C(HCHO) are always larger than OMI retrieved C(NO2) and C(HCHO) for the OMI overpass times (13.5±0.5 h). In urban areas, PSI C(NO2) averages are at least a factor of two larger than OMI averages. Similar differences are seen for C(HCHO) in Seoul. However, late afternoon values measured by PSI are even larger, implying that OMI measurements underestimate the effect of poor air quality on human health. The primary cause of the OMI underestimate at its overpass time is the large OMI FOV that includes regions containing low values of pollutants. In relatively clean areas, PSI and OMI are more closely in agreement.
PSI retrieved C(NO2) amounts for Seoul frequently exceed 2 DU and occasionally reach 6 DU. Other urban centers in the south, Busan and Gwangju, have smaller C(NO2) amounts, but exhibit a similar strong diurnal pattern, namely low values in the morning and high values later during midday. This behavior is expected because of the large number of urban automobiles and concentrated industry. Urban areas downwind from Seoul show high C(NO2) amounts, but also show daily minimum amounts in the morning that increase later in the day. Two of the sites, Seoul and Busan, have long-term C(NO2) data records, 2012–2016, that suggest a gradual decrease in C(NO2) amounts in Korea. When compared with OMI, both ground-based PSI's and the 4STAR aircraft instrument onboard the DC-8 show that the correlation is best for small values of C(NO2) in the troposphere and stratosphere, and worst for high values that are usually in the boundary layer near their local sources. In Olympic Park, the measurements of significant values of C(HCHO) and high values of C(NO2) in the afternoon suggest that there are also increased boundary layer amounts of ozone.

Figure 21Compare PSI (bullet) and OMI (red circles) retrievals of C(HCHO) at 13.30±0.5 KST. OMI overpass data, V03, are from https://avdc.gsfc.nasa.gov/index.php?site=1113974256&id=81 (last access: 31 July 2018).
C(HCHO) amounts were obtained for five sites, Yonsei University in Seoul, Olympic Park, Taehwa Mountain, Amnyeondo, and Yeoju. Of these the largest amounts of C(HCHO) were observed at Olympic Park, and Taehwa Mountain, both surrounded by significant amounts of vegetation. Comparisons of PSI results were made with overflights on the DC-8 aircraft for Taehwa Mountain and Olympic Park showing a significant difference in total column HCHO. In all cases, PSI measured substantially more C(HCHO) than obtained from integrating the altitude profiles measured from the DC-8 overflights.
OMI Formaldehyde HCHO Version 03 data are available from: https://avdc.gsfc.nasa.gov/index.php?site=1113974256&id=81 (last access: 31 July 2018); OMI Nitrogen Dioxide NO2 Version 03 data are available from: https://avdc.gsfc.nasa.gov/index.php?site=666843934&id=13 (last access: 31 July 2018); Pandora KORUS-AQ NO2 and HCHO data are available from: https://avdc.gsfc.nasa.gov/pub/DSCOVR/Pandora/DATA/KORUS-AQ/ (last access: 31 July 2018). The OMI data were prepared by the Goddard Space Flight Center OMI processing team located in Greenbelt, Maryland, USA. The Pandora KORUS-AQ data were prepared by Elena Spinei and by Jay Herman.
Figure A1 illustrates the deseasonalization of the time series in Fig. 6. Panel (a) reproduces the solid black curve in Fig. 6a or c in the inset. Panel (b) reproduces the solid curve in Fig. 6b and is magnified in the inset. The seasonal dependence in the panel (a) inset is almost non-existent in the panel (b) inset.
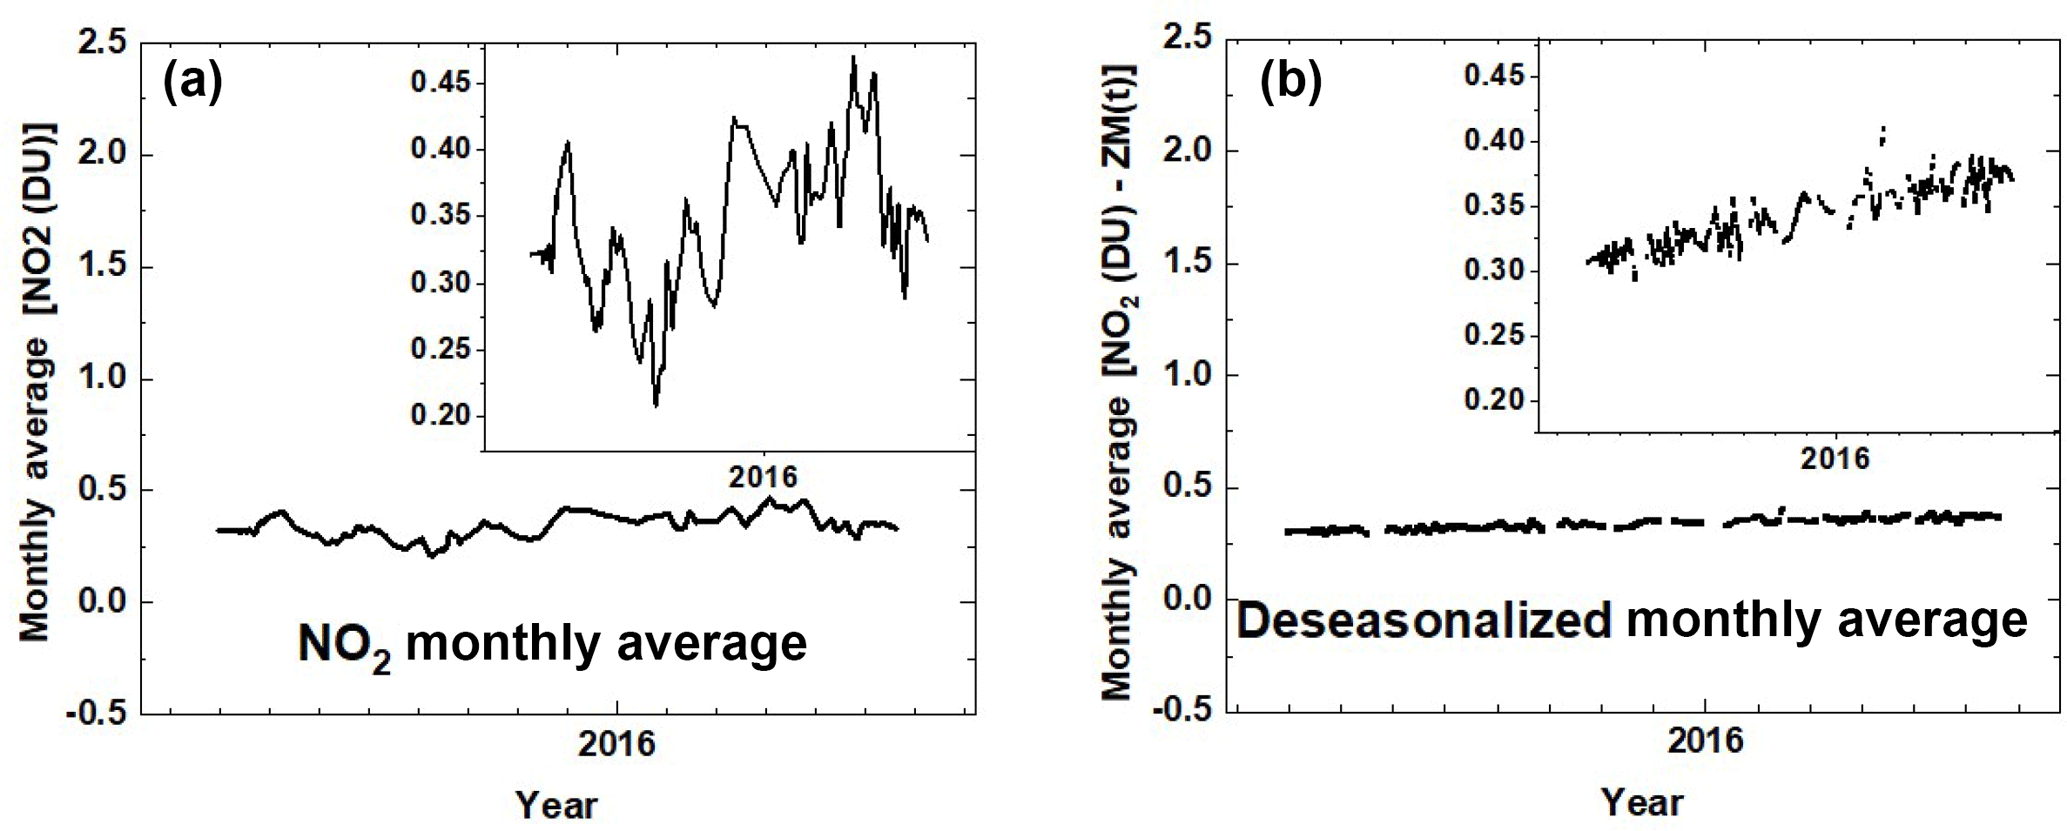
Figure A1An illustration of the deseasonalization (b) of the monthly running average of NO2 for the Gwangju site (a) shown in Fig. 6. The insets are magnifications of the main plots.
JH wrote most of the paper and performed the analysis and comparisons with the DC-8 aircraft measurements. ES derived the formaldehyde altitude profiles suitable for comparison with Pandora data. AF obtained the HCHO profile data from the DC-8 CAMS instrument. JhK provided support for the installation of Pandora instruments in Korea. JaK provided support for the Pandora located in Busan. WK provided support in installing the Pandoras and analyzing the raw data. AC provided calibration and data analysis support. NA provided Pandora setup in Korea and provided the maintenance of calibration. MSR provided the 4STAR NO2 data from the DC-8 flights and the comparison with Pandora.
The authors declare that they have no conflict of interest.
The author would like to thank the Pandora project for support in completing
this study as well as financial support from the KORUS-AQ project
NNH15ZDA001N-KORUS. Jae Kim and Jhoon Kim are supported by Korea
Ministry of Environment as Public Technology Program based on Environmental
Policy (2017000160001).
Edited by: Michel Van Roozendael
Reviewed by: two anonymous referees
Bernhard, G., Booth, C. R., and Ehramjian, J. C.: Version 2 data of the National Science Foundation's ultraviolet radiation monitoring network: South Pole, J. Geophys. Res.-Atmos., 109, D21207, https://doi.org/10.1029/2004JD004937, 2004.
Cede, A.: Manual for Blick Software Suite1.3 Version 7, 20 April 2017, available at: https://avdc.gsfc.nasa.gov/pub/DSCOVR/Pandora/Documents/BlickSoftwareSuite_Manual_v7.pdf (last access: 31 July 2018), 2017.
Chimot, J., Vlemmix, T., Veefkind, J. P., de Haan, J. F., and Levelt, P. F.: Impact of aerosols on the OMI tropospheric NO2 retrievals over industrialized regions: how accurate is the aerosol correction of cloud-free scenes via a simple cloud model?, Atmos. Meas. Tech., 9, 359–382, https://doi.org/10.5194/amt-9-359-2016, 2016.
Cleveland, W. S.: LOWESS: A program for smoothing scatterplots by robust locally weighted regression, Am. Stat., 35, 2683591, https://doi.org/10.2307/2683591, 1981.
Dufour, G., Wittrock, F., Camredon, M., Beekmann, M., Richter, A., Aumont, B., and Burrows, J. P.: SCIAMACHY formaldehyde observations: constraint for isoprene emission estimates over Europe?, Atmos. Chem. Phys., 9, 1647–1664, https://doi.org/10.5194/acp-9-1647-2009, 2009.
Dunagan, S. E., Johnson, R., Zavaleta, J., Russell, P. B., Schmid, B., Flynn, C., Redemann, J., Shinozuka, Y., Livingston, J., and Segal-Rosenhaimer, M.: 4STAR spectrometer for sky-scanning Sun-tracking atmospheric research: Instrument technology, Remote Sens., 5, 3872–3895, https://doi.org/10.3390/rs5083872, 2013.
Duncan, B. N., Lamsal, L. N., Thompson, A. M., Yoshida, Y., Lu, Z., Streets, D. G., Hurwitz, M. M., and Pickering, K. E.: A space-based, high-resolution view of notable changes in urban NOx pollution around the world (2005–2014), J. Geophys. Res. Atmos., 121, 976–996, https://doi.org/10.1002/2015JD024121, 2016.
Fried, A., Walega, J. G., Olson, J. R., Crawford, J. H., Chen, G., Weibring, P., Richter, D., Roller, C., Tittel, F. K., Heikes, B. G., Snow, J. A., Shen, H., O'Sullivan, D. W., Porter, M., Fuelberg, H., Halland, J., and Millet, D. B.: Formaldehyde over North America and the North Atlantic during the summer 2004 INTEX campaign: Methods, observed distributions, and measurement-model comparisons, J. Geophys. Res., 113, D10302, https://doi.org/10.1029/2007JD009185, 2008.
Friedfeld,S., Fraser, M., Ensor, K., Tribble, S., Rehle, D., Leleux, D., and Tittel, F.: Statistical analysis of primary and secondary atmospheric formaldehyde, Atmos. Environ., 36, 4767–4775, 2002.
Garcia, A. R., Volkamer, R., Molina, L. T., Molina, M. J., Samuelson, J., Mellqvist, J., Galle, B., Herndon, S. C., and Kolb, C. E.: Separation of emitted and photochemical formaldehyde in Mexico City using a statistical analysis and a new pair of gas-phase tracers, Atmos. Chem. Phys., 6, 4545–4557, https://doi.org/10.5194/acp-6-4545-2006, 2006.
Goldberg, D. L., Lamsal, L. N., Loughner, C. P., Swartz, W. H., Lu, Z., and Streets, D. G.: A high-resolution and observationally constrained OMI NO2 satellite retrieval, Atmos. Chem. Phys., 17, 11403–11421, https://doi.org/10.5194/acp-17-11403-2017, 2017.
Herman, J., Cede, A., Spinei, E., Mount, G., Tzortziou, M., and Abuhassan, N.: NO2 Column Amounts from Ground-based Pandora and MFDOAS Spectrometers using the Direct-Sun DOAS Technique: Intercomparisons and Application to OMI Validation, J. Geophys. Res., 114, D13307, https://doi.org/10.1029/2009JD011848, 2009.
Herman, J., Evans, R., Cede, A., Abuhassan, N., Petropavlovskikh, I., and McConville, G.: Comparison of ozone retrievals from the Pandora spectrometer system and Dobson spectrophotometer in Boulder, Colorado, Atmos. Meas. Tech., 8, 3407–3418, https://doi.org/10.5194/amt-8-3407-2015, 2015.
Hottle, J. R., Huisman, A. J., DiGangi, J. P., Kammrath, A., Galloway, M. M., Coens, K. L., and Keutsch, F. N.: A Laser Induced Fluorescence-Based Instrument for In-Situ Measurements of Atmospheric Formaldehyde, Environ. Sci. Technol., 43, 790–795, https://doi.org/10.1021/es801621f, 2009.
Jung, J., Lee, J., Kim, B., and Oh, S.: Seasonal variations in the NO2 artifact from chemiluminescence measurements with a molybdenum converter at a suburban site in Korea (downwind of the Asian continental outflow) during 2015–2016, Atmos. Environ., 165, 290–300, 2017.
Kanaya, Y., Irie, H., Takashima, H., Iwabuchi, H., Akimoto, H., Sudo, K., Gu, M., Chong, J., Kim, Y. J., Lee, H., Li, A., Si, F., Xu, J., Xie, P.-H., Liu, W.-Q., Dzhola, A., Postylyakov, O., Ivanov, V., Grechko, E., Terpugova, S., and Panchenko, M.: Long-term MAX-DOAS network observations of NO2 in Russia and Asia (MADRAS) during the period 2007–2012: instrumentation, elucidation of climatology, and comparisons with OMI satellite observations and global model simulations, Atmos. Chem. Phys., 14, 7909–7927, https://doi.org/10.5194/acp-14-7909-2014, 2014.
Kim, D., Lee, H., Hong, H., Choi, W., Lee, Y. G., and Park, J.: Estimation of Surface NO2 Volume Mixing Ratio in Four Metropolitan Cities in Korea Using Multiple Regression Models with OMI and AIRS Data, Remote Sens., 9, 627, https://doi.org/10.3390/rs9060627, 2017.
Kim, N. K., Kim, Y. P., Morino, Y., Kurokawa, J., and Ohara, T.: Verification of NOx emission inventory over South Korea using sectoral activity data and satellite observation of NO2 vertical column densities, Atmos. Environ., 77, 496–508, 2013.
Kim, S. Y. and Song, I.: National-scale exposure prediction for long-term concentrations of particulate matter and nitrogen dioxide in South Korea, Environ. Pollut., 226, 21–29, https://doi.org/10.1016/j.envpol.2017.03.056, 2017.
Kraft, M., Eikmann, T., Kappos, A., Künzli, N., Rapp, R., Schneider, K., Seitz, H., Voss, J.-U., and Wichmann, H.-E.: The German view: Effects of nitrogen dioxide on human health – derivation of health-related short-term and long-term values, Int. J. Hyg. Envir. Heal., 208, 305–318, 2005.
Kramer, L., Leigh, R. J., Remedios, J. J., and Monks, P. S.: Comparison of OMI and Ground-Based in situ and MAXDOAS Measurements of Tropospheric Nitrogen Dioxide in An Urban Area, J. Geophys. Res., 113, D16S39, https://doi.org/10.1029/2007JD009168, 2008.
Latza, U., Gerdes, S., and Baur, X.: Effects of nitrogen dioxide on human health: Systematic review of experimental and epidemiological studies conducted between 2002 and 2006, Int. J. Hyg. Envir. Heal., 212, 271–287, https://doi.org/10.1016/j.ijheh.2008.06.003, 2009.
Lee, G., Oh, H.-R., Ho, C.-H., Kim, J., Song, C.-K., Chang, L.-S., Lee, J.-B., and Lee, S.: Airborne Measurements of High Pollutant Concentration Events in the Free Troposphere over the West Coast of South Korea between 1997 and 2011, Aerosol Air Qual. Res., 16, 1118–1130, 2016.
Lee, H.-J., Kim, S.-W., Brioude, J., Cooper, O. R., Frost, G. J., Kim, C.-H., Park, R. J., Trainer, M., and Woo, J.-H.: Transport of NOx in East Asia identified by satellite and in situ measurements and Lagrangian particle dispersion model simulations, J. Geophys. Res., 119, 2574–2596, https://doi.org/10.1002/2013JD021185, 2014.
Lei, W., Zavala, M., de Foy, B., Volkamer, R., Molina, M. J., and Molina, L. T.: Impact of primary formaldehyde on air pollution in the Mexico City Metropolitan Area, Atmos. Chem. Phys., 9, 2607–2618, https://doi.org/10.5194/acp-9-2607-2009, 2009.
Liteplo, R. G., Beauchamp, R., Meek, M. E., and Chénier, R.: Formaldehyde, International Programme on Chemical Safety, Geneva, Switzerland, 2002, Concise International Chemical Assessment Document 40, available at: http://www.who.int/ipcs/publications/cicad/en/cicad40.pdf (last access: 31 July 2018), 2010.
Luecken, D. J., Hutzell, W. T., Strum, M. L., and Pouliot, G. A.: Regional sources of atmospheric formaldehyde and acetaldehyde, and implications for atmospheric modeling, Atmos. Environ., 47, 477–490, https://doi.org/10.1016/j.atmosenv.2011.10.005, 2012.
Meller, R. and Moortgat, G. K.: Temperature dependence of the absorption cross sections of formaldehyde between 223 and 323 k in the wavelength range 225–375 nm, J. Geophys. Res.-Atmos., 105, 7089–7101, https://doi.org/10.1029/1999JD901074, 2000.
Park, J., Lee, H., Kim, J., Herman, J., Kim, W., Hong, H., Choi, W., Yang, J., and Kim, D.: HCHO column density retrieval using Pandora measurements in Seoul, Korea: Temporal characteristics and comparison with OMI measurement, Remote Sens., 10, 173, https://doi.org/10.3390/rs10020173, 2018.
Platt, U.: Differential optical absorption spectroscopy (DOAS), Air monitoring by Spectroscopic Techiques, edited by: Sigrist, M., John Wiley & Sons, Inc., 27–84, 1994.
Platt, U., Perner, D., and Pätz, H. W.: Simultaneous measurements of atmospheric CH2, O3 and NO2 by differential optical absorption, J. Geophys. Res., 84, 6329–6335, 1979.
Richter, D., Weibring, P., Walega, J. G., Fried, A., Spuler, S. M., and Taubman, M. S.: Compact highly sensitive multi-species airborne mid-IR spectrometer, Appl. Phys. B, 119, 119–131, https://doi.org/10.1007/s00340-015-6038-8, 2015.
Segal-Rosenheimer, M., Russell, P. B., Schmid, B., Redemann, J., Livingston, J. M., Flynn, C. J., Johnson, R. R., Dunagan, S. E., Shinozuka, Y., Herman, J., Cede, A., Abuhassan, N., Comstock, J. M., Hubbe, J. M., Zelenyuk, A., and Wilson, J.: Tracking elevated pollution layers with a newly developed hyperspectral Sun/Sky spectrometer(4STAR): Results from the TCAP 2012 and 2013 campaigns, J. Geophys. Res.-Atmos., 119, 2611–2628, https://doi.org/10.1002/2013JD020884, 2014.
Segal-Rozenhaimer, M., Goldberg, D. L., Kacenelbogen, M., LeBlanc, S., Flynn, C., Redemann, J., Herman, J., Cede, A., Abuhassan, N., and Lamsal, L. N.: Assessing how aerosols effect OMI NO2 retrievals during KORUS-AQ, AOGS 2–8 June 2018, Honolulu, HI, USA, 2018.
Shinozuka, Y., Johnson, R. R., Flynn, C. J., Russell, P. B., Schmid, B., Redemann, J., Dunagan, S. E., Kluzek, C. D., Hubbe, J. M., Segal-Rosenheimer, M., Livingston, J. M., Eck, T. F., Wagener, R., Gregory, L., Chand, D., Berg, L. K., Rogers, R. R., Ferrare, R. A., Hair, J. W., Hostetler, C. A., and Burton, S. P.: Hyperspectral aerosol optical depths from TCAP flights, J. Geophys. Res.-Atmos., 118, 12180–12194, https://doi.org/10.1002/2013JD020596, 2013.
Spinei, E., Whitehill, A., Fried, A., Tiefengraber, M., Knepp, T. N., Herndon, S., Herman, J. R., Müller, M., Abuhassan, N., Cede, A., Weibring, P., Richter, D., Walega, J., Crawford, J., Szykman, J., Valin, L., Williams, D. J., Long, R., Swap, R. J., Lee, Y., Nowak, N., and Poche, B.: The First Evaluation of Formaldehyde Column Observations by Pandora Spectrometers during the KORUS-AQ Field Study, Atmos. Meas. Tech. Discuss., https://doi.org/10.5194/amt-2018-57, in review, 2018.
Vandaele, A. C., Hermans, C., Simon, P. C., Carleer, M., Colin, R., Fally, S., Mérienne, M. F., Jenouvrier, A., and Coquart, B.: Measurements of the NO2 absorption cross-section from 42,000 cm−1 to 10,000 cm−1 (238–1000 nm) at 220 K and 294 K, J. Quant. Spectrosc. Ra., 59, 171–184, https://doi.org/10.1016/S0022-4073(97)00168-4, 1998.
Walters, W., Goodwin, S., and Michalski, G.: The Nitrogen Stable Isotope Composition (δ15N) of Vehicle Emitted NOx, Environ. Sci. Technol., 49, 2278–2285, https://doi.org/10.1021/es505580v, 2015.
Zhang, H., Li, J., Ying, Q., Guven, B. B., and Olaguer, E. P.: Source apportionment of formaldehyde during TexAQS 2006 using a source-oriented chemical transport model, J. Geophys. Res., 118, 1525–1535, https://doi.org/10.1002/jgrd.50197, 2013.
Zhu, L., Jacob, D. J., Keutsch, F. N., Mickley, L. J., Scheffe, R., Strum, M., Abad, G. G., Chance, K., Yang, K., Rappenglück, B., Millet, D. B., Baasandorj, M., Jaeglé, L., and Shah, V.: Formaldehyde (HCHO) As a Hazardous Air Pollutant: Mapping Surface Air Concentrations from Satellite and Inferring Cancer Risks in the United States, Environ. Sci. Technol., 51, 5650–5657, https://doi.org/10.1021/acs.est.7b01356, 2017.
- Abstract
- Introduction
- NO2 during the KORUS-AQ campaign (May–June 2016)
- Diurnal variation of C(NO2)
- Longer-term changes in C(NO2)
- Comparison with OMI satellite overpass data
- Formaldehyde from five Korus-AQ sites
- Summary
- Data availability
- Appendix A
- Author contributions
- Competing interests
- Acknowledgements
- References