the Creative Commons Attribution 4.0 License.
the Creative Commons Attribution 4.0 License.
 | 14 Aug 2018
Airborne limb-imaging measurements of temperature, HNO3, O3, ClONO2, H2O and CFC-12 during the Arctic winter 2015/2016: characterization, in situ validation and comparison to Aura/MLS
Wolfgang Woiwode
Michael Höpfner
Felix Friedl-Vallon
Anne Kleinert
Erik Kretschmer
Thomas Latzko
Johannes Orphal
Peter Preusse
Jörn Ungermann
Michelle L. Santee
Tina Jurkat-Witschas
Andreas Marsing
Christiane Voigt
Andreas Giez
Martina Krämer
Christian Rolf
Andreas Zahn
Andreas Engel
Björn-Martin Sinnhuber
Hermann Oelhaf
The Gimballed Limb Observer for Radiance Imaging of the Atmosphere (GLORIA) was operated on board the German High Altitude and Long Range Research Aircraft (HALO) during the PGS (POLSTRACC/GW-LCYCLE/SALSA) aircraft campaigns in the Arctic winter 2015/2016. Research flights were conducted from 17 December 2015 until 18 March 2016 within 25–87∘ N, 80∘ W–30∘ E. From the GLORIA infrared limb-emission measurements, two-dimensional cross sections of temperature, HNO3, O3, ClONO2, H2O and CFC-12 are retrieved. During 15 scientific flights of the PGS campaigns the GLORIA instrument measured more than 15 000 atmospheric profiles at high spectral resolution. Dependent on flight altitude and tropospheric cloud cover, the profiles retrieved from the measurements typically range between 5 and 14 km, and vertical resolutions between 400 and 1000 m are achieved. The estimated total (random and systematic) 1σ errors are in the range of 1 to 2 K for temperature and 10 % to 20 % relative error for the discussed trace gases. Comparisons to in situ instruments deployed on board HALO have been performed. Over all flights of this campaign the median differences and median absolute deviations between in situ and GLORIA observations are K for temperature, ppbv for HNO3, ppbv for O3, pptv for ClONO2, ppmv for H2O and pptv for CFC-12. Seventy-three percent of these differences are within twice the combined estimated errors of the cross-compared instruments. Events with larger deviations are explained by atmospheric variability and different sampling characteristics of the instruments. Additionally, comparisons of GLORIA HNO3 and O3 with measurements of the Aura Microwave Limb Sounder (MLS) instrument show highly consistent structures in trace gas distributions and illustrate the potential of the high-spectral-resolution limb-imaging GLORIA observations for resolving narrow mesoscale structures in the upper troposphere and lower stratosphere (UTLS).
- Article
(6954 KB) - Full-text XML
-
Supplement
(25952 KB) - BibTeX
- EndNote


The upper troposphere and lower stratosphere (UTLS) is a key region for climate on Earth (Gettelman et al., 2011). The extratropical UTLS is influenced by vertical downward transport from the stratosphere by the Brewer–Dobson circulation, by horizontal transport from the upper tropical troposphere by isentropic mixing, by convective overshooting and by mixing with the troposphere (Bönisch et al., 2011; Holton et al., 1995). The UTLS is challenging to observe. Isentropic mixing in this region happens via very long filaments with small vertical and horizontal extent (Konopka and Pan, 2012). This requires a large horizontal coverage on the one hand and high spatial resolution on the other hand. Aircraft infrared limb-emission measurements can fill the gap between airborne in situ instruments and spaceborne remote-sensing satellites. Airborne in situ instruments provide a high accuracy, high temporal resolution and along-track sampling, but they are limited to the vertical and horizontal dimensions of the aircraft's flight track. Current spaceborne measurements can provide global coverage but are limited in terms of spatial sampling and accuracy. Aircraft and balloon measurement campaigns with infrared limb-emission remote-sensing instruments have been a source of vertically, spatially and/or temporally resolved observations of temperature and a wealth of trace gases (Friedl-Vallon et al., 2004; Piesch et al., 1996) as well as important steps for demonstration of technology for future satellite missions (Fischer et al., 2008).
The Gimballed Limb Observer for Radiance Imaging of the Atmosphere (GLORIA) instrument (Friedl-Vallon et al., 2014) continues the heritage of the series of MIPAS (Michelson Interferometer for Passive Atmospheric Sounding; Fischer and Oelhaf, 1996; Friedl-Vallon et al., 2004; Piesch et al., 1996) and CRISTA (CRyogenic Infrared Spectrometers and Telescopes for the Atmosphere; Offermann et al., 1999; Ungermann et al., 2012) instruments. One major improvement of GLORIA compared to its limb-scanning precursors is the usage of an imaging array detector for significantly higher spatial sampling and precise relative pointing. A wider overview of scientific objectives for these altitudes and the potential of the GLORIA instrument for such science questions is given by Riese et al. (2014).
Measurements with the airborne MIPAS-STR (MIPAS- STRatospheric aircraft) instrument provided precise and accurate temperature and trace gas profiles (Woiwode et al., 2012). The GLORIA measurements aim for significantly higher vertical resolutions. Due to the higher spatial sampling along the flight track, a larger set of profiles is measured. Ungermann et al. (2015) discussed and validated GLORIA temperature, H2O, HNO3 and O3 retrievals from the GLORIA high-spatial-resolution mode. Woiwode et al. (2015) described the first GLORIA high-spectral-resolution observations captured in 2011 during the ESA Sounder Campaign (ESSenCe). They compared temperature, HNO3, O3, H2O, CFC-11 and CFC-12 profiles with in situ profiles and MIPAS-STR co-located profiles, and they found that GLORIA, at this stage of development, showed an agreement with MIPAS-STR and in situ instruments, within the profile-to-profile variations of GLORIA. After this campaign, aero-acoustical modifications of the aircraft and of the GLORIA instrument improved the precision of GLORIA measurements. Here, a much higher number of profiles were measured; the instrument has been technically improved; ClONO2 is presented as an additional trace gas; and the results at flight altitude are compared to in situ observations from the same platform, HALO (High Altitude and Long Range Research Aircraft). Additionally a first comparison of GLORIA and Aura/MLS (Microwave Limb Sounder) data is presented.
The PGS mission is the combination of the POLSTRACC (Polar Stratosphere in a Changing Climate) aircraft campaign (Oelhaf et al., 2015) together with GW-LCYCLE II (Gravity Wave Life Cycle Experiment) and SALSA (Seasonality of Air mass transport and origin in the Lowermost Stratosphere using the HALO Aircraft) campaigns. The combined mission took place in the Arctic winter 2015/2016 with bases in Oberpfaffenhofen (Germany) and Kiruna (Sweden). Among the scientific objectives of the PGS campaign are investigation of chemical processes such as ozone depletion, chlorine de-activation and de-nitrification in the lowermost stratosphere; mixing and dynamical linkages between the upper troposphere, the lower stratosphere, and between high latitudes and middle latitudes over the course of the winter; and gravity waves. For that purpose, nine in situ and three remote-sensing instruments probed the UTLS region during 18 HALO research flights between December 2015 and March 2016. The flight paths are shown in Fig. 1. These 18 PGS research flights, each with a duration of approximately 10 h, cover the whole time of the Arctic winter and provide a unique data set.
The goal of the paper at hand is to characterize and validate the GLORIA observations during the course of the Arctic winter, involving measurements under cloud-free conditions and conditions affected by polar stratospheric clouds (PSCs). The data product is characterized considering random and systematic errors, and an approach for correcting systematic line-of-sight errors in limb-imaging observations is presented. Finally, the GLORIA observations are brought into a broader perspective by comparisons with Aura/MLS observations and demonstrate the capability of GLORIA to resolve mesoscale structures in the UTLS. This paper shall provide the baseline and reference for scientific studies using GLORIA measurements.
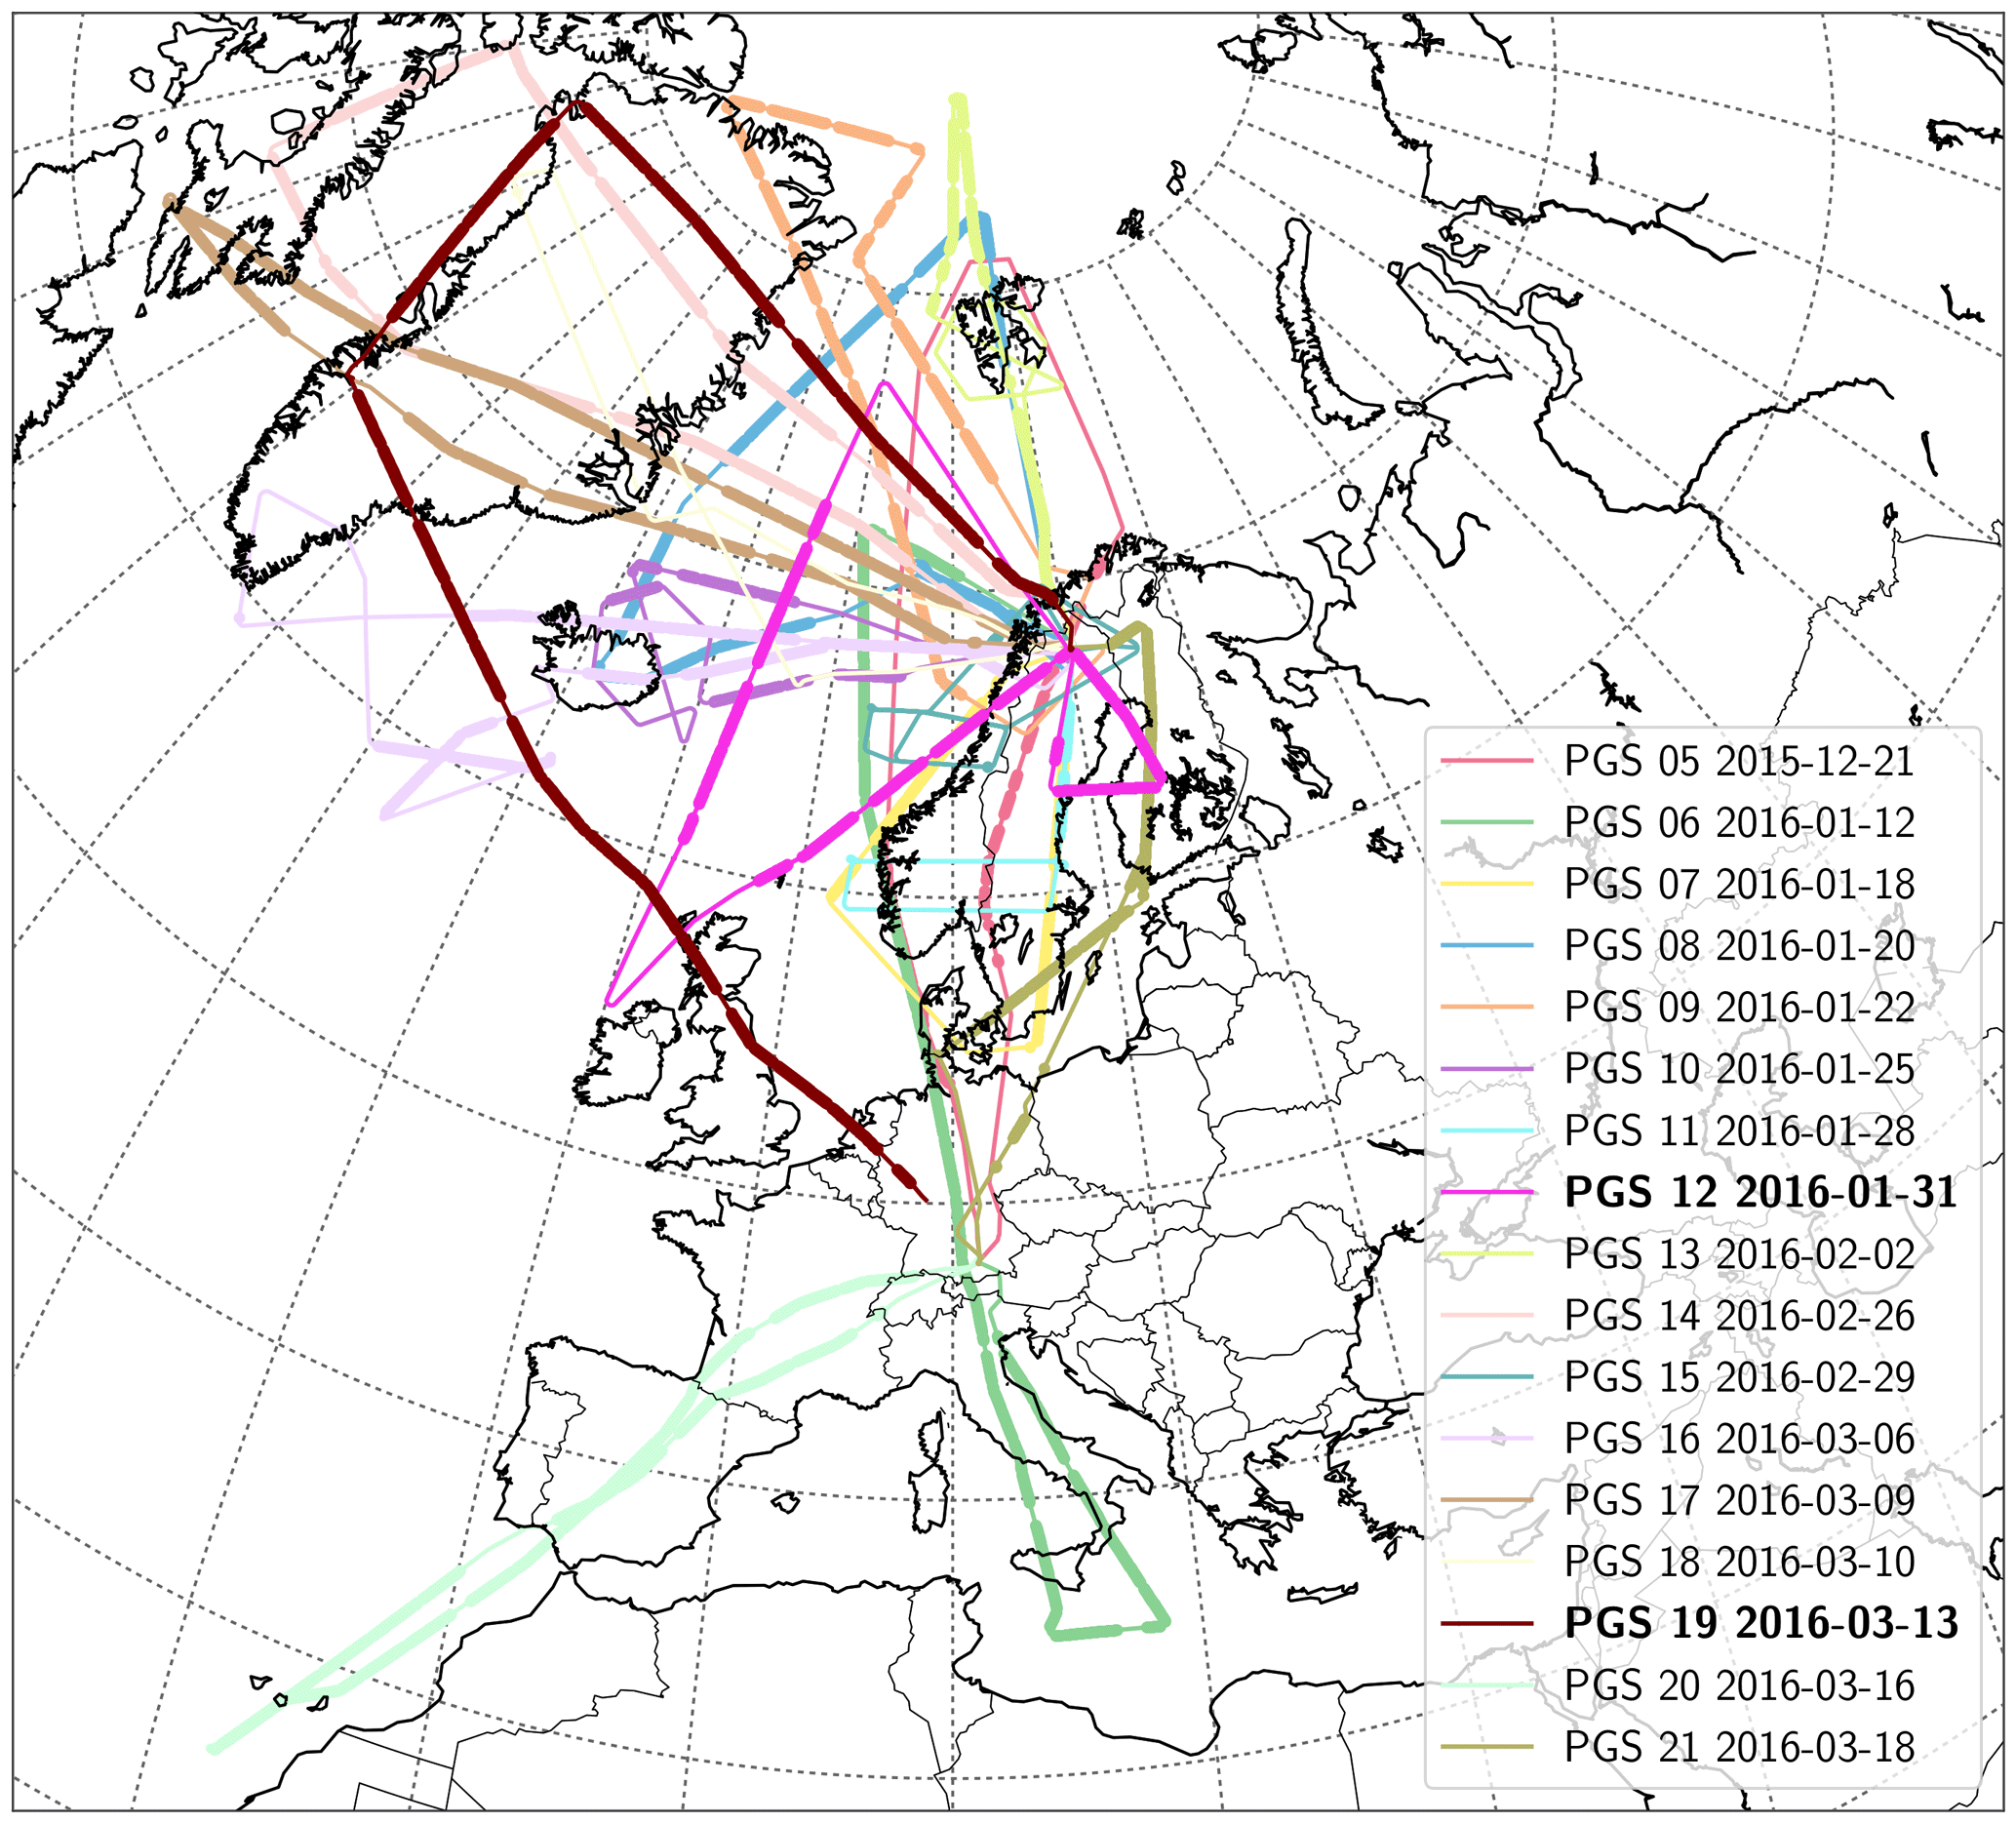
Figure 1Flight paths of all PGS flights with GLORIA measurements. The parts of the flights with GLORIA high-spectral-resolution-mode measurements are represented in bold lines. Flight PGS19 (13 March 2016) is discussed in detail in this paper and is highlighted on the map, together with flight PGS12, which is discussed incidentally.
2.1 GLORIA
The essential parts of the GLORIA instrument (Friedl-Vallon et al., 2014) are an imaging spectrometer, a gimballed frame for pointing and line-of-sight stabilization and two blackbodies for radiometric calibration. The spectrometer is a Fourier transform spectrometer (FTS) with a HgCdTe infrared detector array. A total of 48×128 (horizontal×vertical) pixels of this imaging detector are used to record the same number of interferograms simultaneously. In order to reduce thermal noise, the spectrometer is cooled down to −50 ∘C (Piesch et al., 2015). Depending on the scientific goals, the GLORIA spectrometer can be operated in two different measurement modes: the high-spatial-resolution mode with a spectral sampling of 0.625 cm−1, and a temporal resolution of 2 s and the high-spectral-resolution mode with a sampling of 0.0625 cm−1 and 13 s. In this paper, results of measurements at high spectral resolution are discussed. In this measurement, configuration 48×128 interferograms are recorded every 13 s, which corresponds to displacement of the platform of ≈3 km considering typical HALO cruise speed. The gimbal frame is used to compensate for the movements of the carrying aircraft and also offers the possibility to point at azimuth angles between 45 and 135∘ relative to the aircraft for measurements in across-track limb geometry. These different azimuth pointing angles are desired to avoid stray sunlight, to correct for movements of the carrying aircraft due to cross winds or to adopt the measurement line of sight (LOS) for expected horizontal gradients in temperature or trace gases. Another application of the adjustable azimuth angle is the feasibility of tomographic measurements (Ungermann et al., 2011).
The level 1 processing comprises the generation of radiometrically and spectrally calibrated spectra from raw measurement data (Kleinert et al., 2014). At first, the interferograms are corrected for spikes and for the nonlinearity of the detector and readout system. Then, they are resampled from the time-equidistant measurement grid onto a space-equidistant grid using information of a reference laser (Brault, 1996). During resampling, the interferograms are corrected for possible shifts due to linear phase drifts, and the optical path difference of each pixel is determined according to its off-axis angle, in order to sample each interferogram onto the correct abscissa in space. After the Fourier transform, a complex calibration according to Revercomb et al. (1988) is performed. Gain and offset are determined from regular in-flight measurements of the two on-board blackbodies (Olschewski et al., 2013). The temperature difference between the two blackbodies is about 30 to 40 K, with the cold blackbody being around or slightly below ambient temperature. The spectra are apodized using the Norton–Beer “strong” apodization (Norton and Beer, 1976, 1977). This processing is done individually for each of the 48×128 interferograms. For noise reduction, the pixels of each detector row are averaged after filtering of bad pixels (typically 5 % to 10 %). As measurements are smeared along track due to the horizontal movement of the aircraft, this averaging does not result in a loss of information. This process results in 128 row-averaged spectra with different elevation angles. After cloud filtering, this set of spectra serves as input for the retrieval of atmospheric parameters. All atmospheric parameters are retrieved from the same set of averaged spectra.
GLORIA was deployed during the HALO campaigns TACTS/ESMVal (2012), POLSTRACC/GW-LCYCLE/SALSA (2015/2016) and WISE (2017), and during the M55 Geophysica campaigns ESSenCe (2011) and StratoClim (2016/2017). During these campaigns, the instrument was constantly improved (Kretschmer et al., 2015), the data processing was revised (Guggenmoser et al., 2015; Kleinert et al., 2014), the level 2 products were validated (Kaufmann et al., 2015; Ungermann et al., 2015; Woiwode et al., 2015), and GLORIA data proved to be useful for model validation (Khosrawi et al., 2017) and case studies (Krisch et al., 2017; Rolf et al., 2015). Improvements to the instrument (reduced aero-acoustic noise in the spectra) compared to the results of Woiwode et al. (2015) also increase the quality of the measured infrared spectra, resulting in different characteristics of the retrieved temperature and trace gas profiles.
2.2 In situ instruments
On board HALO, several in situ instruments were deployed during the PGS campaign. These in situ instruments measure temperature and trace gases at the position of the aircraft with high precision and temporal resolution. Calibration measurements with reference gases or calibration units assure a high accuracy of the measurements.
The Atmospheric chemical Ionization Mass Spectrometer (AIMS) measures HCl, SO2, HNO3 and ClONO2 at a time resolution of 1.7 s with a detection limit of 6–20 pptv, 10 %–15 % precision and an accuracy of 12 %–20 % (Jurkat et al., 2016, 2017). In addition, water vapor in low concentrations is measured in a second configuration (Kaufmann et al., 2016; Voigt et al., 2017).
Water vapor measurements between 1 and 1000 ppmv are performed with the Fast In situ Stratospheric Hygrometer (FISH), which is based on Lyman-α photo-fragment fluorescence (Zöger et al., 1999). FISH is one of the core airborne in situ instruments for measuring water vapor in the UTLS (Fahey et al., 2014). FISH has a time resolution of 1 s and achieved a precision of 0.7 % × vmr (volume mixing ratio; relative part of the precision) +0.35 ppmv (absolute part of the precision) with an overall accuracy of 6.6 % × vmr during PGS (Meyer et al., 2015).
The Basic HALO Measurement and Data System (BAHAMAS) consists of a sensor package for basic meteorological parameters – such as temperature, pressure, airflow, wind and humidity – and a data acquisition system which provides additional interfaces into the aircraft avionic system and to an inertial reference system (Giez et al., 2017; Krautstrunk and Giez, 2012). Sensor data are available with a time resolution of 100 Hz; standard processing is based on a 10 Hz time resolution. The temperature measurement is based on an open-wire resistance temperature sensor, which is contained in a special total air temperature (TAT) inlet located in the nose section of the aircraft. These housings are heated to prevent ice formation and designed to separate droplets and particles from the probed airflow ahead of the sensor. The airflow is slowed down inside the housing in order to approach TAT via adiabatic heating. Data processing contains several corrections to account for deviations from ideal inlet behavior (Bange et al., 2013). These corrections limit the accuracy of the temperature determination to about 0.5 K, while the precision of the measurement is estimated to be about 0.03 K by means of auto-covariance function analysis.
The ozone detector FAIRO (Fast Airborne Ozone instrument) was deployed on HALO with a time resolution of 10 Hz (Zahn et al., 2012). The O3 volume mixing ratio has a precision of ≈0.3 ppbv (at 10 Hz) and an accuracy (based on systematic errors) of ≈1.5 %.
Additionally the Gas Chromatograph for the Observation of Stratospheric Tracers–Mass Spectrometer (GhOST-MS) provides measurements of CFC-12 in the electron capture detector channel (Obersteiner et al., 2016).
2.3 Aura/MLS
The NASA Earth Observing System Aura satellite was launched in July 2004 into a near-polar, sun-synchronous 705 km altitude orbit with the Microwave Limb Sounder (MLS) deployed on board. The Aura satellite flies in formation in the “A-Train” constellation of satellites and has an approximately 13:45 local Equator-crossing time. The Aura/MLS instrument is a successor to the MLS instrument on the Upper Atmosphere Research Satellite (UARS) and is a limb sounder analyzing the thermal emission (wavelengths from 2.5 to 0.1 mm) of the atmosphere using seven radiometers to cover five spectral bands (Waters et al., 2006). The along-track scanning radiometers scan the limb every 165 km. According to the orbit of the Aura spacecraft, the global coverage of measurements is from 82∘ S to 82∘ N . In this work, MLS version 4.2 (Livesey et al., 2017) HNO3 (Manney et al., 2015) and O3 (Schwartz et al., 2015) data are used. These data products have a vertical resolution of 3.0–4.5 km for HNO3 and 2.5–3.5 km for O3 and a horizontal resolution of 350–450 and 300–550 km, respectively, in the UTLS. Both trace gas products have been validated for previous data versions (Froidevaux et al., 2008; Jiang et al., 2007; Santee et al., 2007).
2.4 ECMWF meteorological analysis
The input profiles for temperature, pressure and water vapor for GLORIA retrievals are taken from analysis data of the European Centre for Medium-Range Weather Forecasts (ECMWF). These meteorological analyses from the “atmospheric model high resolution” (HRES) are available every 6 h with a horizontal resolution of 1∘ and 137 vertical levels up to a top pressure level of 0.1 hPa. The global fields of temperature, pressure and potential vorticity (PV) are interpolated on a vertical grid of absolute altitude.
In order to retrieve trace gas distributions from the calibrated spectral radiances, an inverse problem has to be solved. To this end, we used the retrieval software KOPRAFIT (Höpfner, 2000), in which the forward radiative transfer is calculated by the radiative transfer model KOPRA (Karlsruhe Optimized and Precise Radiative transfer Algorithm; Stiller, 2000). KOPRA is a line-by-line radiative transfer model, which is optimized for computationally efficient analyses of highly resolved spectral measurements. This software is used in the processing of MIPAS-Envisat, MIPAS-Balloon and MIPAS-STR limb measurements (Wetzel et al., 2002; Woiwode et al., 2012; von Clarmann et al., 2003). KOPRAFIT employs the Jacobians (derivatives of the radiance with respect to the fitted atmospheric parameters) provided by KOPRA to fit the selected atmospheric parameters to the measured set of spectra. The inverse problem is solved by the Gauss–Newton iterative algorithm (Rodgers, 2000) with Tikhonov–Phillips regularization (Phillips, 1962; Tikhonov and Arsenin, 1977):
Here i denotes the iteration index, xi the vector containing the atmospheric state of step i, y the radiance measurement vector, f the radiative transfer function, xa the a priori profile, Ki the Jacobian of f for xi, Sy the co-variance matrix of the measurement, L the first-order differential operator and γ the regularization parameter. The regularization term γLTL constrains the retrieval result to a smooth profile of the retrieved atmospheric quantity. In the applied formulation, the regularization avoids a bias to the retrieval result from an a priori profile (Eriksson, 2000). The regularization parameters are chosen such that high vertical resolutions are obtained while unrealistic oscillations of the retrieved quantity are avoided.
The retrieval strategy in this work follows closely the one described by Woiwode et al. (2012). For the retrieval, the atmospheric parameters are represented on a discrete altitude grid with 250 m spacing in the region of interest (3–17 km) and coarser grid width below and above (1.5 km for 0–3 km, 2 km for 18–20 km, 2.5 km for 20–30 km and 50 km for 50–100 km). For the first step of the retrieval, trace gas profiles from the climatology by Remedios et al. (2007) are used for all important trace gases in the selected spectral range. Temperature, pressure and water vapor are taken from an interpolation of ECMWF analysis data to the GLORIA tangent points. For the water vapor retrieval, a constant profile of 10 ppmv is used as an initial guess, in order to assure independence of derived vertical and horizontal structures in the water vapor distribution, for example, compared to initial-guess profiles from meteorological analysis. The retrieval quantity is the LOS, temperature, vmr of HNO3, O3, ClONO2 and CFC-12 or the logarithm of vmr of H2O. To consider atmospheric aerosols and transparent clouds, the logarithm of an artificial continuum is part of the retrieval vector as described in Woiwode et al. (2015).
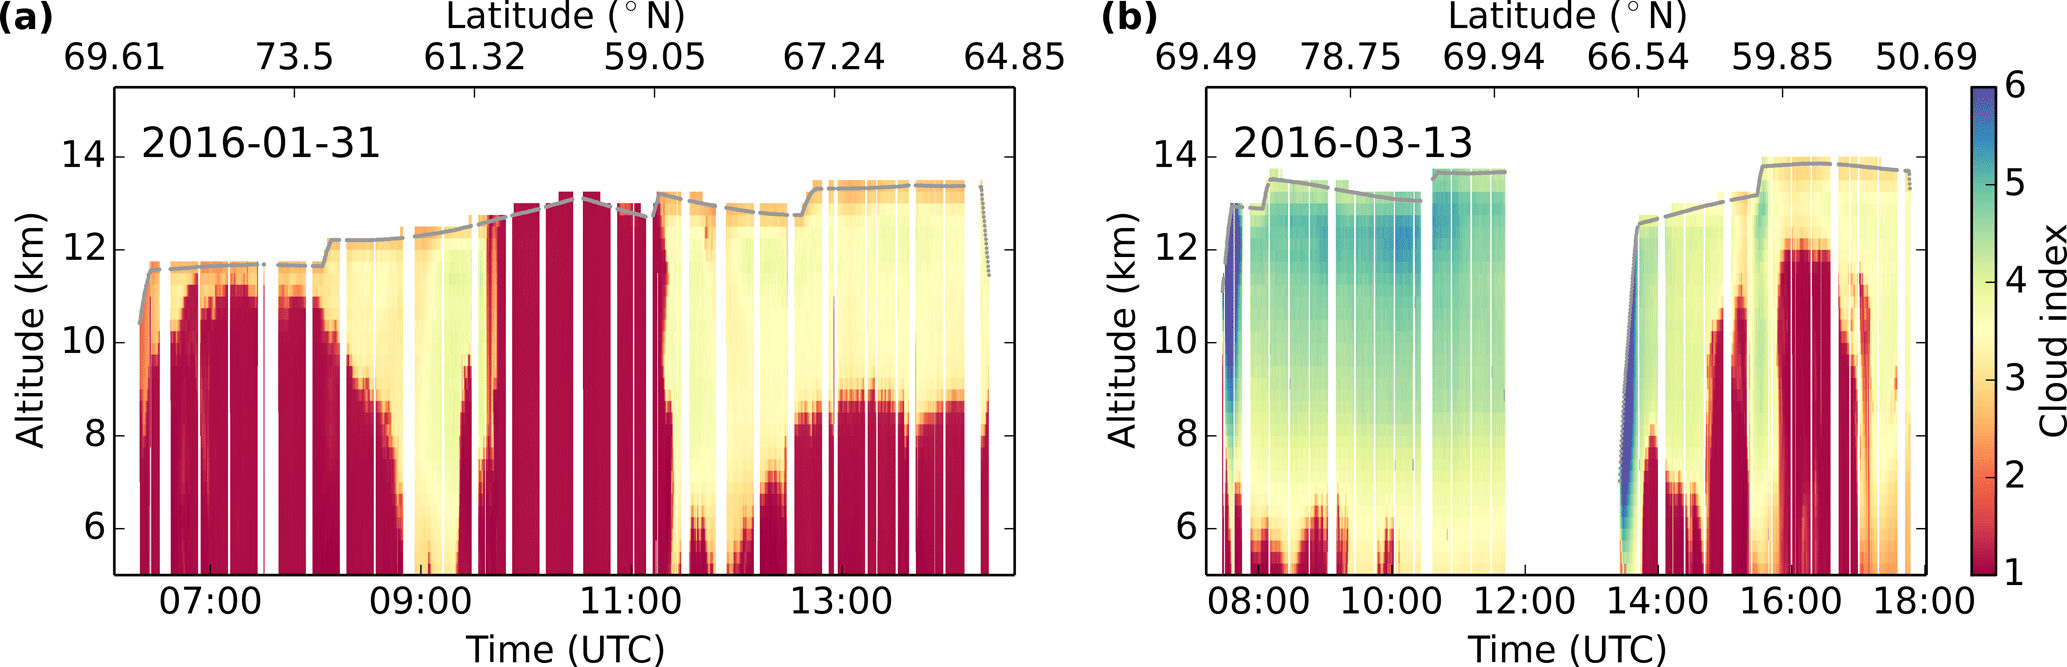
Figure 2Vertical distribution of cloud indices along flights PGS12 (a, 31 January 2016) and PGS19 (b, 13 March 2016). The lower the cloud index, the more the measured spectrum is affected by clouds. Between 12:00 and 14:00 UTC in PGS19 no atmospheric data were measured due to a refueling stop of the aircraft.
For the preparation of the retrieval, cloud-affected spectra are filtered. For that purpose, the cloud index (CI) introduced by Spang et al. (2004) is calculated for each measured spectrum as the color ratio between the micro-windows 788.20 to 796.25 cm−1 and 832.30 to 834.40 cm−1. The CI is shown in Fig. 2 for the flights on 31 January 2016 and on 13 March 2016. Lower CI values indicate a larger influence of clouds on the spectrum. In previous studies using comparable airborne limb-emission observations, typically fixed cloud index thresholds between 2 and 4 were used (Ungermann et al., 2012; Woiwode et al., 2012, 2015). In this work, a CI threshold of 3 is used for the lowest and 1.8 for the highest limb tangent altitude to account also for observations moderately affected by PSCs. The CI thresholds for points in between are linearly interpolated. This approach is chosen to effectively filter out tropospheric clouds at lower altitudes while optically thin cirrus or polar stratospheric clouds still are allowed for the retrieval.
In the first step, the line of sight is determined to correct a possible misalignment of the GLORIA gimbal frame. From this retrieval a correction for the line of sight is calculated and applied to all of the following steps. Then temperature, HNO3, O3, CFC-12, ClONO2 and H2O are sequentially retrieved. After each step, the values retrieved for the previous quantities are kept fixed.
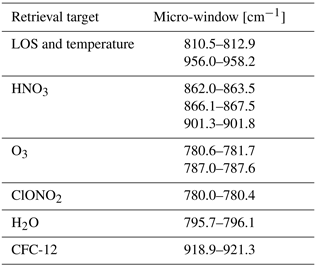
The spectral windows for the retrieval of the different trace gases are shown in Table 1. These spectral ranges were selected to minimize the cross talk of emission lines of other trace gases, and saturation of spectral lines, particularly at low limb views, is minimized.
Table 1Spectral windows for the different target species of the GLORIA high-spectral-resolution-mode PGS retrieval.
3.1 Error analysis
For the characterization of the results, possible error sources are estimated, and their influences on the retrieval are calculated. In this work, we estimate systematic and noise errors. Considered errors are spectroscopic uncertainties (as reported in previous work), radiometric calibration errors (multiplicative gain and additive offset), residual pointing uncertainty and a temperature error for vmr retrievals, and an error of the CO2 climatology profile (accounting also for errors in the CO2 spectroscopic line data).
The spectroscopic error is estimated as 8 % for HNO3 (Wetzel et al., 2002), 5.5 % for ClONO2 (Wagner and Birk, 2003) and 10 % for CFC-12 (Moore et al., 2006). For O3 and H2O, uncertainties in line intensities are reported (Flaud et al., 2002, 2006), and the spectroscopic error is estimated as 7 % for O3 and 10 % for H2O. Considering the temperature retrieval, the spectroscopic error can be estimated by assuming an error in the CO2 profiles as high as 5.0 %, according to Wetzel et al. (2002). In order to quantify the influence of the assumed CO2 profile, the temperature retrieval has been repeated with a CO2 profile uniformly decreased by 5 %. The differences between these retrievals at each grid point show the sensitivity of the retrieval to the modified CO2 profile.
In the same way, the impacts of further error sources on the retrieval are quantified. The results of a retrieval with a perturbed radiometric calibration, LOS or temperature are subtracted from the standard retrieval to estimate the error of each individual retrieval grid point. With this method, uncertainties in the radiometric calibration are calculated considering uncertainties in the multiplicative gain of 2 % and uncertainties in the additive radiance offset of 50.0 nW cm−2 sr−1 cm. LOS errors are estimated by retrievals assuming a 0.05∘ LOS offset. This estimation is based on the short-term profile-to-profile variability found in the LOS retrievals (see Sect. 4.3.1) and systematic uncertainties inherent to the LOS retrieval, such as uncertainties in ECMWF atmospheric temperature and pressure. For trace gas retrievals, the retrieved temperature is used to describe the atmospheric state. The effect of uncertainties in the retrieved temperatures on the trace gas retrievals is estimated by modifying the retrieved temperature profile systematically with the related temperature error (estimated for the temperature retrieval). The retrieval noise is calculated according to Rodgers (2000):
Here, Δxnoise denotes the noise error, Gy the retrieval gain matrix, ϵ the measurement error and K the Jacobian for the last iteration step. This measurement error is estimated as the spectral variance in the micro-window of the imaginary part of the calibrated spectrum (Kleinert et al., 2014).
The total estimated error for each altitude of each retrieved profile is calculated as the square root of the sum of the squares of each error contribution, as is shown for vmr in Eq. (3) and for temperature in Eq. (4).
3.2 Vertical resolution and degrees of freedom
An important diagnostic measure is the vertical resolution, which is calculated by using the averaging kernel of the retrieval. The averaging kernel matrix is defined as (Rodgers, 2000)
The vertical resolution at a retrieval grid point is calculated as the full width at half maximum of the averaging kernel row. Another important quantity for a retrieval is the number of degrees of freedom. These are calculated as the trace of the averaging kernel matrix (Rodgers, 2000), since the diagonal elements of the averaging kernel are measures of how much measurement information is contained in the retrieval result per level.
The results of the GLORIA measurements for the flight on 13 March 2016 (PGS19) are shown in the following part. Flight PGS19 is selected as an example of continuous measurements in high-spectral-resolution mode, and as an example of an illustrative amount of atmospheric variability within the measured air masses. Results for all of the other 14 PGS research flights with GLORIA measurements at high spectral resolution are shown in the Supplement. First, the meteorological and chemical background situation of this flight day and region is discussed on the basis of MLS measurements at a level corresponding with a typical flight altitude for this specific flight. Then one example temperature and HNO3 profile is characterized in detail. The main part of this section is the discussion of the GLORIA retrieval results for flight PGS19. For the discussion of the elevation angle correction, results for the flight on 31 January 2016 (PGS12) are also shown as an example of a different type of LOS distortion and correction. In order to provide a survey of all GLORIA measurements and their quality during the whole PGS campaign, comparisons to in situ and MLS measurements are presented as an overview.
4.1 Meteorological situation for flight PGS19 on 13 March 2016
The flight PGS19 on 13 March 2016 was the transfer back from the campaign base in Kiruna, Sweden, to Oberpfaffenhofen, Germany. This flight was planned to sample aged vortex air over the northwestern part of Greenland and to cross a region of subtropical air associated with a high tropopause between the east coast of Greenland and Ireland. Takeoff in Kiruna was at 07:08 UTC, and touchdown in Oberpfaffenhofen at 18:28 UTC. The first part of the flight was directed towards the northwestern coast of Greenland (see Fig. 3, way point “A”), flying over the Norwegian Sea and then in a southern direction to a refueling stop at Kangerlussuaq Airport in Greenland (way point “B”). HALO reaches its peak ceiling altitude immediately before each refueling stop, when the air frame is at its lightest. At these phases of the flight, the flight altitude is high enough to sample subsided polar air masses over the northern part of Greenland. After this stop, the aircraft passed the northern Atlantic Ocean and the British Isles towards Oberpfaffenhofen in southern Germany.
The meteorological situation during this flight is shown in Fig. 3 (top row) with temperature (a) and PV (b) at a level corresponding to a typical flight altitude of 13 km for this specific flight. At this altitude and time of the winter, the PV determining the edge of the polar vortex according to Nash et al. (1996) is estimated as ≈ 9 PVU. The first part of the flight (until way point A) took place in relatively warm (220 to 230 K) air masses compared to the rest of the flight. PV increased along the flight track towards maximum values of more than 12 PVU. This indicates that the flight entered the late-winter polar stratosphere and presumably even aged subsided polar vortex air. During the flight leg between the way points A and B, the aircraft remained within these stratospheric air masses with relatively warm temperatures and high PV. On the flight leg from way point B towards the final destination, Oberpfaffenhofen, HALO left these air masses, with temperatures decreasing to 200 K and PV down to 4 PVU over the northern Atlantic Ocean. The air masses above the British Isles and central Europe showed temperatures of up to 210 K and PV of 6 to 9 PVU with fine filaments visible on the PV map. This might point to air masses remaining from the dissolving late-winter polar vortex.
For a comparison of the MLS measurements with GLORIA, the MLS data were selected for dates and times of PGS flights, filtered by data quality as recommended by Livesey et al. (2017) and interpolated onto a regular horizontal grid (2∘ latitude × 4∘ longitude) using a squared cosine as the weighting function. The width of this squared cosine function was chosen to be 1.5∘ for latitudes and 8.0∘ for longitudes, and a minimum threshold of 0.75 was selected. Additionally, the pressure coordinate of the MLS data is interpolated to geometric altitude for an easier comparison to the GLORIA data. This interpolation method does not provide meaningful comparisons of water vapor because tropospheric H2O (in contrast to stratospheric HNO3 and O3) is likely to vary significantly within the time range of Aura/MLS-measured profiles, which are selected for this type of interpolation. For this reason, no comparison of GLORIA and Aura/MLS H2O measurements is shown.
An overview of these gridded MLS HNO3 and O3 horizontal distributions is shown in Fig. 3 (bottom row) at a typical flight altitude of 13.0 km for PGS flight 19 on 13 March 2016. The HALO flight track and geolocations (position and altitude) of GLORIA tangent points are also shown on these maps. Along the flight track, local minima in MLS HNO3 are observed above the Norwegian Sea and south of Iceland. Local maxima in MLS HNO3 and O3 are present above the northern part of Greenland at way point A.
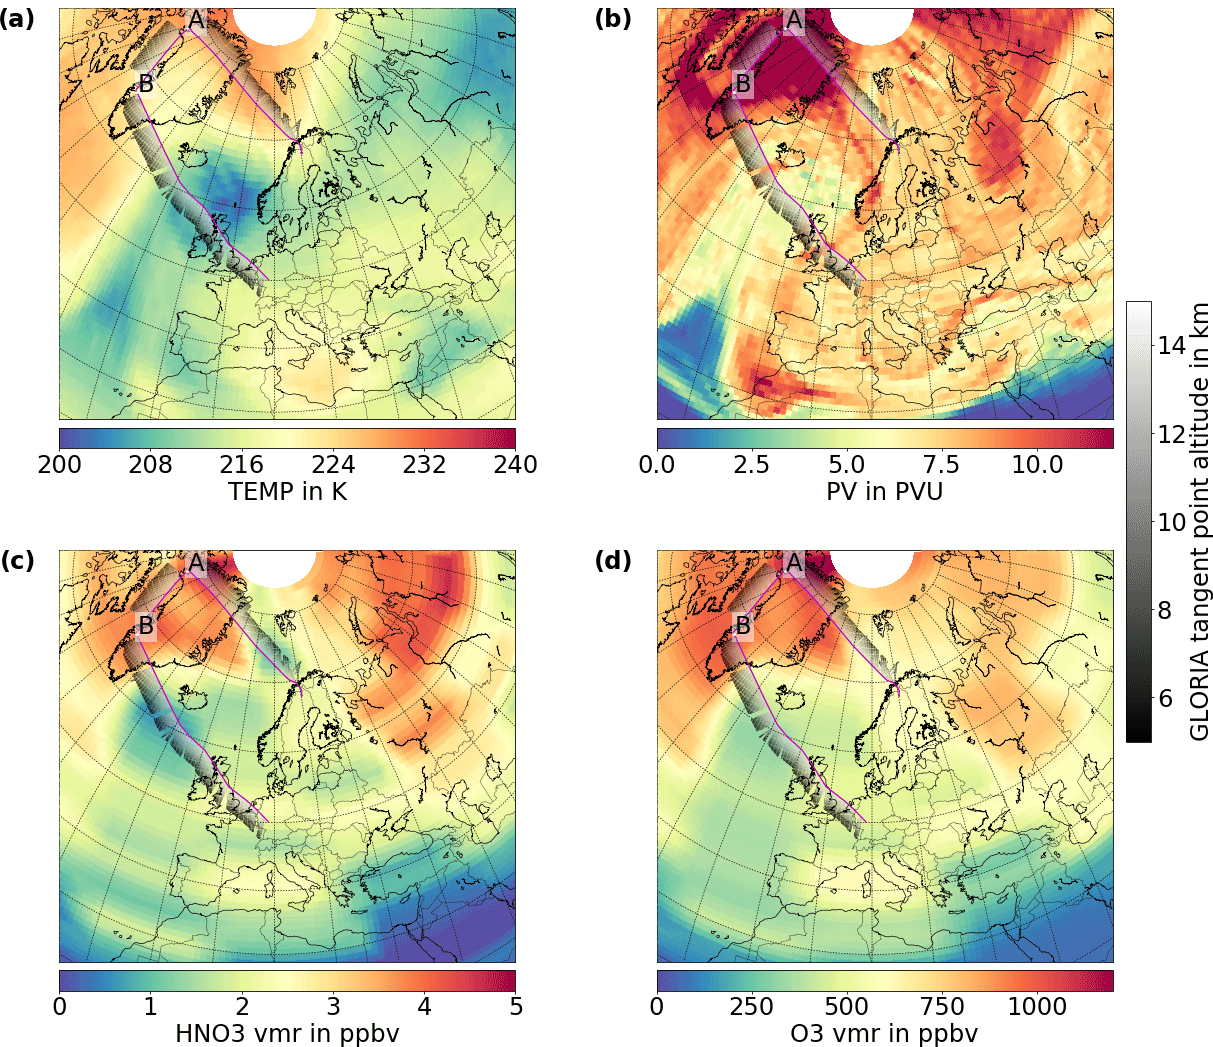
Figure 3(a) Temperature and (b) potential vorticity (PV) from ECMWF meteorological analysis on 13 March 2016 at 12:00 UTC at 13.0 km, and (c) MLS HNO3 and (d) O3 measurements on 13 March 2016 between 06:00 and 18:00 UTC (approximation for the time period of flight PGS19) interpolated to a regular latitude–longitude grid and typical HALO cruising altitude of 13.0 km. For flight PGS19 on this day, the ground track of the HALO aircraft is shown with a magenta line, and the geolocations of GLORIA tangent points are shown along the flight track with points in the grayscale color map. Way points of this flight are marked with capital letters.
4.2 Characterization of example profiles
The quality of the retrieved GLORIA data can be assessed by the estimated errors (see Sect. 3.1) and by the vertical resolution (see Sect. 3.2). These quantities are shown in Fig. 4 as an example of the retrieval result of a temperature and nitric acid profile. In the left column (a, d) of this figure the retrieval results and the initial-guess profiles are shown; the right panel (c, f) shows the vertical resolution. For these retrievals vertical resolutions of 400 to 750 m are achieved. It can be seen that the shapes of the retrieved temperature and vmr profiles differ significantly from the initial-guess profiles at an altitude range between 5.5 and 13.5 km, reflecting the weak influence by the Tikhonov regularization. Below these altitude ranges the profile shapes resemble those of the initial-guess profile, and no information is contributed by the measurement. Above 13.5 km, the retrieved profiles are also influenced by measurements with upward-looking lines of sight, which explains the small differences in shape at these altitudes. In this region the vertical resolution is poor, and thus little measurement information is obtained for these parts of the profiles.
In the second column (b, e) of Fig. 4, individual 1σ error contributions are shown. For the temperature the total estimated error is predominantly influenced by radiometric gain calibration (up to 1.0 K) and pointing uncertainties (in the range of 0.5 to 1.5 K). In the case of HNO3, the total estimated error is dominated by the spectroscopy error estimated as a constant relative fraction of 8.0 % (as assumed in Sect. 3.1) and the uncertainties due to the previously retrieved temperature data (up to 0.3 ppbv). The pointing error has large contributions (up to 0.6 ppbv) to the total estimated error at altitude ranges where large vertical gradients in the profiles occur. At these altitude ranges with large vertical gradients even small changes in the elevation pointing have large influence on the absolute differences between the perturbed and the reference retrieval result. The radiometric offset and the retrieval noise error only contribute a minor part of the total error (≤0.5 K for temperature and up to ≤0.2 ppbv for HNO3).
In the following discussion of the results, the retrieved profile, vertical resolution and total estimated error are presented as curtain plots for a whole research flight. This simultaneously illustrates the amount of data that have been measured by GLORIA and allows the characteristics of the results to be shown in detail.
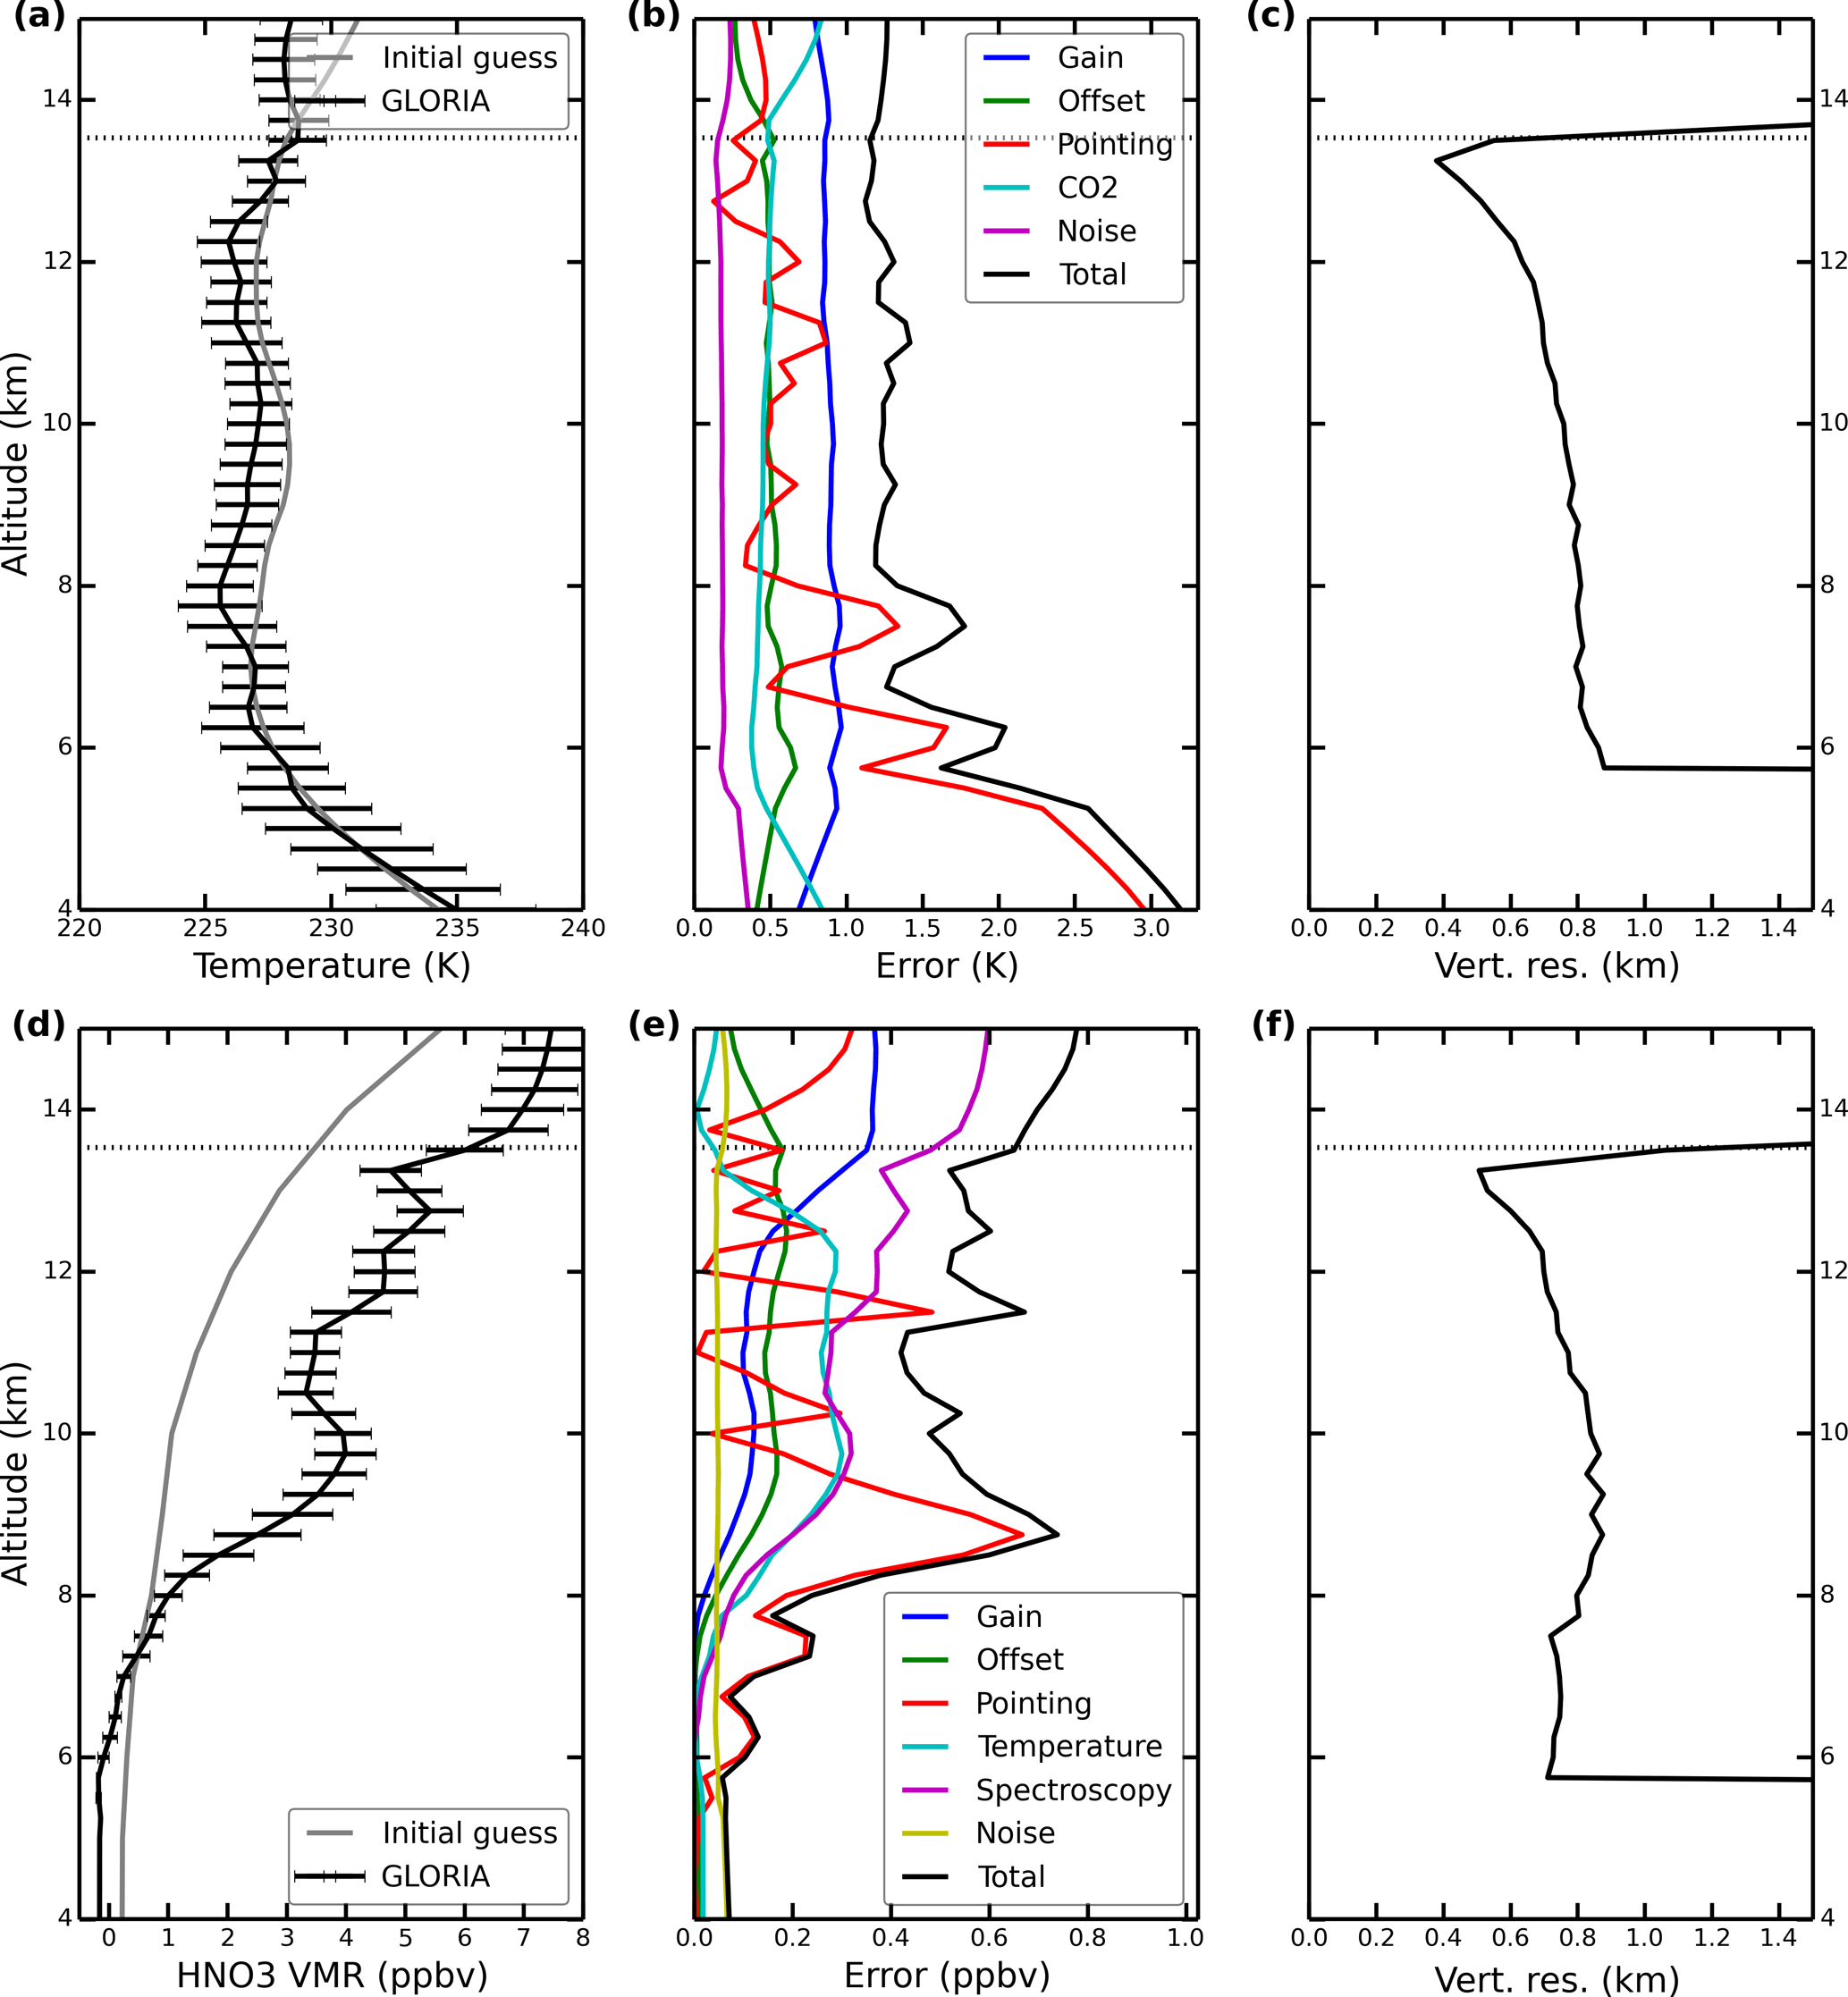
Figure 4Illustration of the error budget of the temperature and HNO3 retrieval of flight 19 on 13 March 2016 for a selected profile at 10:37:06 UTC. (a, d) retrieved vertical profile of temperature (a–c) and HNO3 (d–f) with total estimated error (black) and initial-guess profile (gray). The retrieved profile has 14.9 and 12.5∘ of freedom for temperature and HNO3, respectively. (b, e) Different total error contributions and estimated total error. (c, f) Vertical resolution of this retrieval result. The dotted line represents the flight altitude of the aircraft.
4.3 GLORIA results
4.3.1 Line of sight
For each flight, one systematic pointing correction is derived from the retrieval. The pointing elevation angle is retrieved to compensate for systematic misalignment of the pointing system of GLORIA. The LOS retrieval results for the flights on 31 January and on 13 March 2016 are shown as the difference between expected and retrieved elevation angle (black dots in Fig. 5). This difference in the retrieved LOS can be caused by differences in the atmospheric state compared to the ECMWF fields (which also affects the intensity of the CO2 spectral lines that are used for the LOS retrieval), thermal deformation of the instrument and a systematic error of the pointing calibration on ground. Fluctuations in the retrieved LOS are attributed to the changes of the atmospheric state not resolved or reproduced by the ECMWF fields and the thermal deformation, while the systematic error of the calibration is expected to result in a time-independent LOS offset. With the diagnostic data available, it is not possible to distinguish between atmospheric variations and thermal deformations of the instrument. Ground-based measurements suggest that the thermal deformations of the instrument are an important cause of these variations, but the atmospheric variation of temperature and pressure is also estimated to have a major impact. For that reason generally, only one average LOS correction value per flight is used. For future campaigns it is planned to ensure the quality of the pointing by ground-based absolute pointing calibrations and by in-flight measurements of the moon on a regular basis. An example of this average correction, which is applied for flights between 2 February and 18 March 2016, is shown in Fig. 5b (red dots).
For flights between 21 December 2015 and 31 January 2016 a software malfunction of the pointing control software caused the LOS to drift away from the commanded elevation. At certain points the software changed the instrument elevation back to its correct value, and steep steps in the retrieved pointing elevation angle are observed on these flights (see Fig. 5a, enlargement: “Drift” and “Jump”). A correction of this artifact can be calculated by interpolating the LOS between the points immediately after a steep step. This interpolated line between the correct elevation angles approximates the LOS that would have been retrieved for a measurement without this software malfunction. The same average LOS correction, which is used for other flights, can be calculated from this interpolated LOS (Fig. 5a, green points). This is the first part of the LOS correction for these flights. In the second part, the influence of the software malfunction can be extracted by subtraction of the interpolated LOS from the retrieved LOS. For an idealized measurement (without any further error in the LOS), this method separates the effect of the software malfunction from long-term variations (which have been corrected for in the first part). For subsequent retrievals of temperature and volume mixing ratios, both corrections, the average LOS correction and the correction of the steps, have been applied (Fig. 5a, red points).
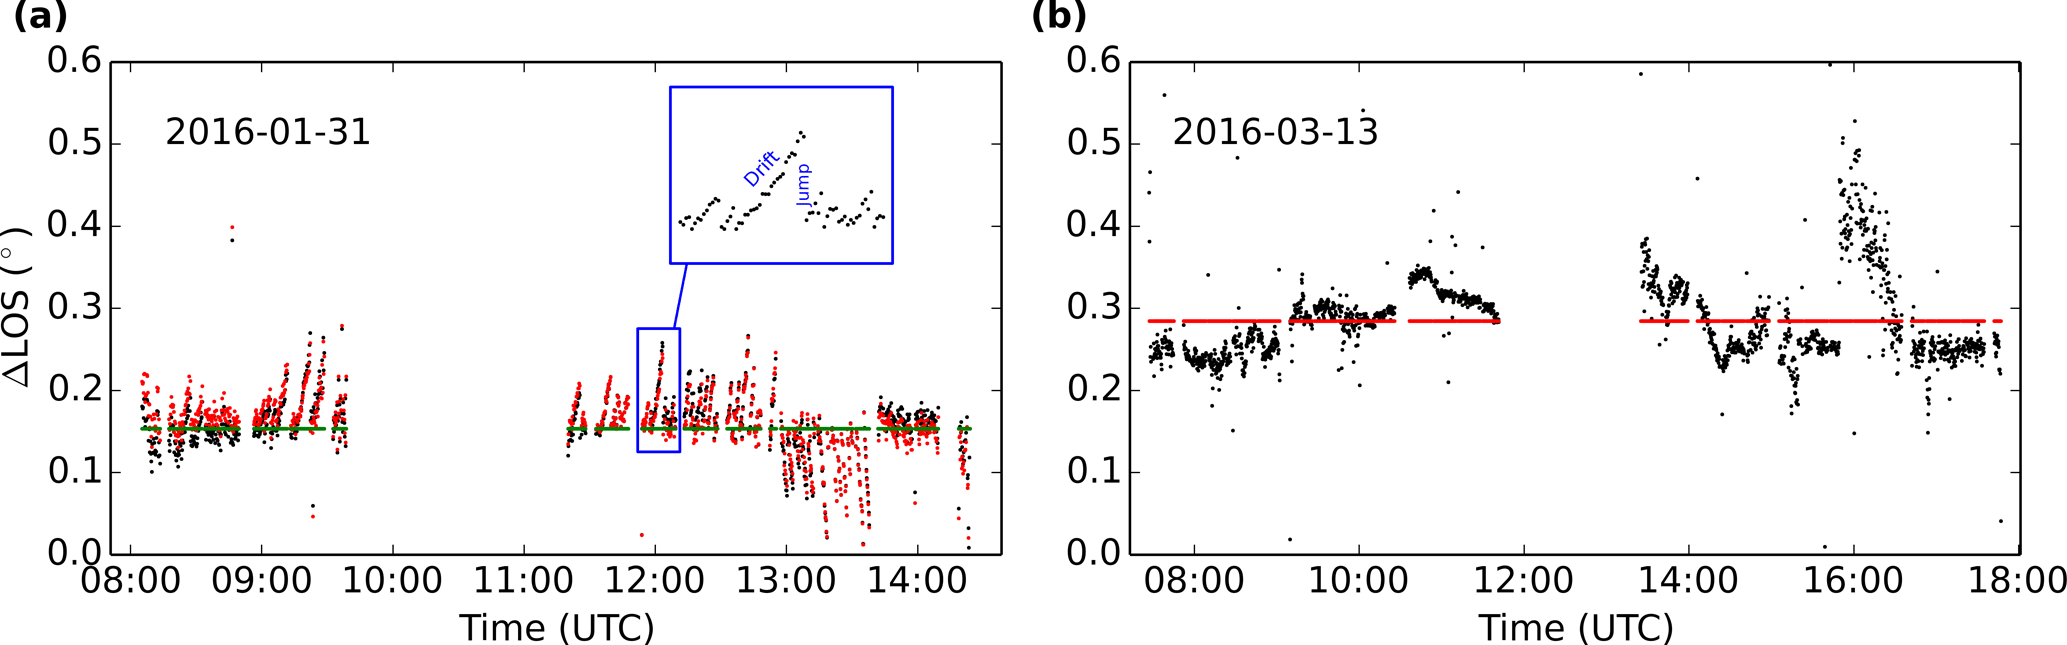
Figure 5Line-of-sight correction of two flights (a: PGS12; b: PGS19) during the PGS campaign. The retrieved deviation of the LOS from the nominally set value is shown in black, the applied correction in red and for flight PGS12 the averaged LOS (before applying the correction of the drift) in green.
4.3.2 Temperature
The retrieved temperature along with characterization diagnostics and comparison to
in situ observations for flight PGS19 is shown in Fig. 6. The
retrieval results in panel a show the temperature profiles in a color-coded
curtain plot. This type of plot is also used to present the curtains of volume mixing
ratio results. The lower horizontal axis indicates the measurement time, and the upper
horizontal axis the corresponding latitude of the aircraft. The vertical axis shows
the absolute altitude of the retrieval grid points. The retrieval result is filtered
according to the vertical resolution. Only data points with a vertical resolution
better than 2 km are presented. For that reason, the data above flight level
are filtered out. The measured spectra below cloud tops were also filtered out
prior to the retrieval. The time between 12:00 and 13:00 UTC was spent on the ground
due to a refueling stop of the aircraft. Smaller gaps between the profiles are due
to radiometric calibration measurements. As a measure for the dynamical tropopause,
the ECMWF potential vorticity interpolated to the GLORIA tangent points is shown in
magenta dashed lines, marking the values of 2.0 and 4.0 PVU. In the first part of
the flight (until way point B), high temperatures are observed. The dynamical
tropopause is at low altitudes down to 6 km, and mainly stratospheric air masses
are sampled by GLORIA during this part of the flight. These stratospheric air masses
at low altitudes suggest subsidence of air masses from the polar vortex during the
late winter. The second part of this flight shows the transition to a higher tropopause
up to 12 km and also stronger vertical gradients from higher temperatures (240 K) at
lower altitudes, down to temperatures as low as 205 K at flight altitude. The last hour
of measurements shows again a lower tropopause and less steep vertical gradients.
The total estimated error (b) indicates for most data points values in the
range of 1.0 to 1.3 K. Especially in regions with higher temperature, the
retrieval results are less accurate due to higher gain error contributions.
The main error contribution is the pointing error due to vertical gradients.
The vertical resolution (c) of the temperature retrieval is between 500 and
800 m. Altitudes closer to the aircraft usually show a better vertical
resolution due to denser
spacing of the tangent points.
In situ measurements taken at flight level are compared to the GLORIA retrieval results obtained close to the flight altitude. From each vertical profile retrieved from GLORIA the grid point which is closest to the flight altitude (i.e., between 0 and 250 m underneath the flight altitude) and which has a vertical resolution better than 2 km is chosen for comparison. This assures the best possible match of sampled air masses with the in situ instrument. It is important to keep in mind that the data sets do not probe exactly the same air masses, since GLORIA measures at the limb and thus collects the radiation from a long path of ≈100 km through the atmosphere (Ungermann et al., 2011, 2012). In Fig. 6d the comparison of GLORIA temperatures (green dots) to the BAHAMAS in situ measurements (blue dots) is presented. The two measurements show agreement to within 1.3 K, which is the estimated error of the GLORIA temperature retrieval.
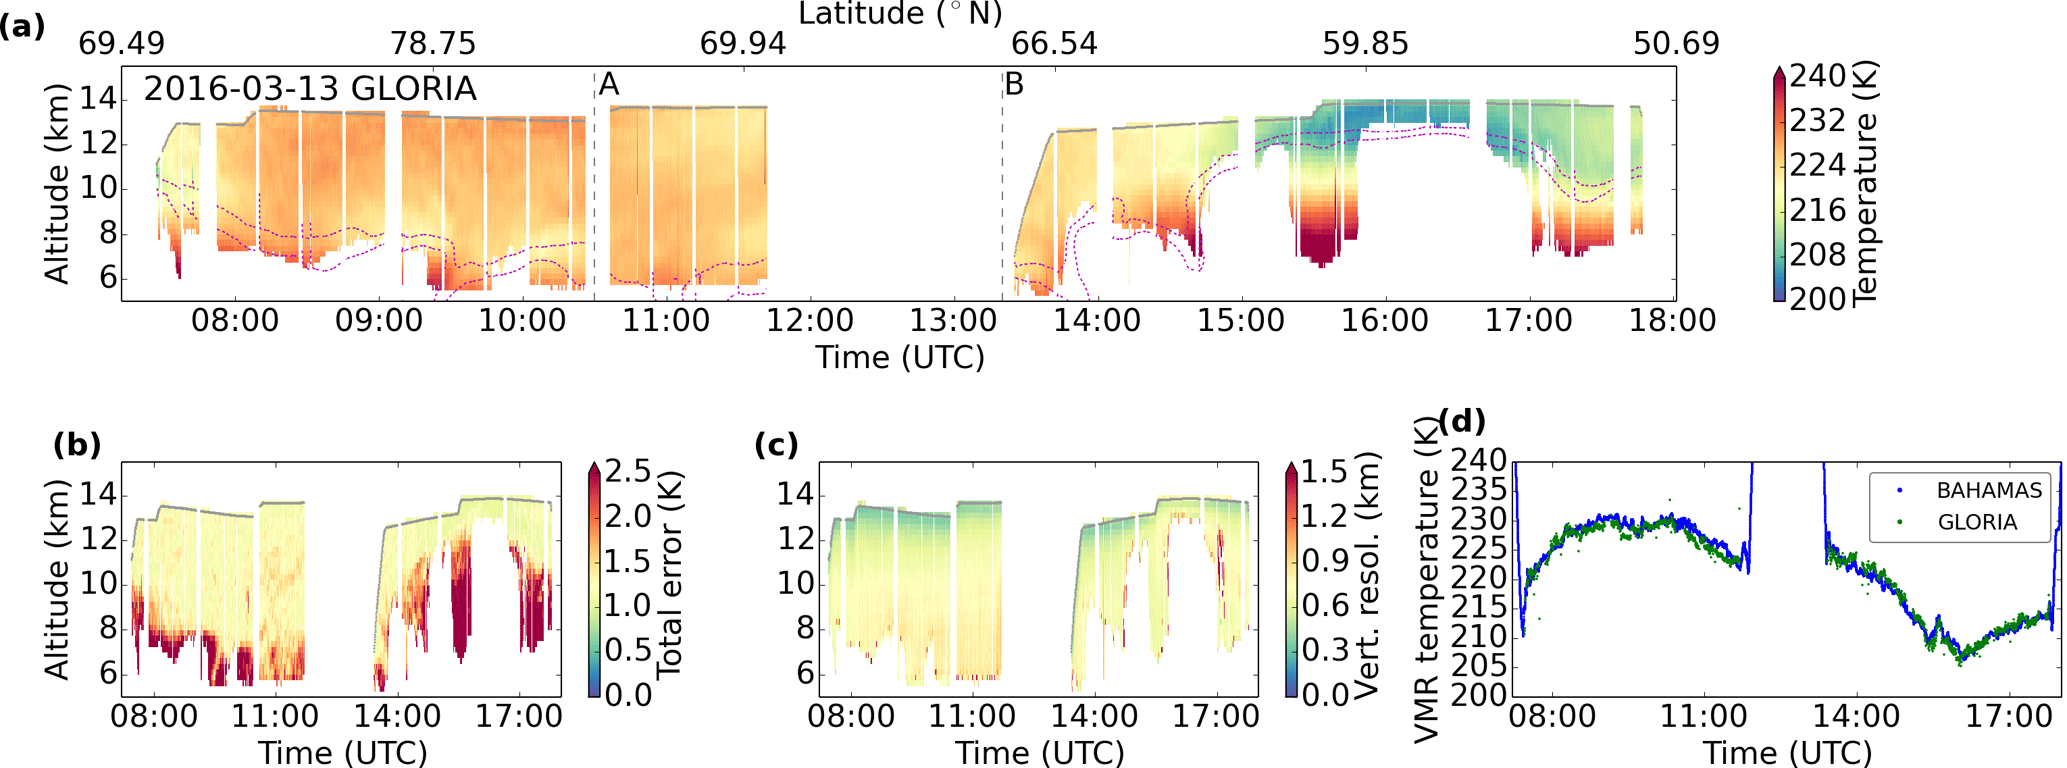
Figure 6Temperature from flight PGS19: cross section of (a) retrieved temperature (the flight altitude is marked with a gray line, white spaces mark regions without data, the ECMWF potential vorticities of 2 and 4 PVU are marked with magenta dashed lines, and way points are marked with gray vertical dashed lines) and cross sections of (b) estimated total error and (c) vertical resolution, followed by (d) comparison of the GLORIA measurements (green) to the BAHAMAS in situ measurement (blue).
4.3.3 Nitric acid
Due to the formation and sedimentation of polar stratospheric clouds and the resulting de- or re-nitrification (Peter and Grooß, 2011), nitric acid (HNO3) is expected to display irregularly small structures in the UTLS region. For that reason, it is important to achieve spatially highly resolved and validated measurements of HNO3 in the UTLS. The GLORIA retrieval results for flight PGS19 are presented in Fig. 7. The two-dimensional distribution of HNO3 volume mixing ratios shows fine structures with maximum values up to 7 ppbv. The retrieval has a typical vertical resolution of 500 to 800 m, and the error is typically 0.5 ppbv. The comparison to the in situ measurements by AIMS is given in Fig. 7e. The strong fluctuations of HNO3 are captured simultaneously by both instruments. The agreement between the instruments is often better than 0.5 ppbv. However, at some locations their differences reach up to 2.0 ppbv. These discrepancies reflect the large atmospheric variability in the horizontal direction due to de-nitrification processes along the GLORIA line of sight. The horizontal distribution of PV (Fig. 3b) suggests that at this part of the flight (from way point B to the final destination, Oberpfaffenhofen) air masses influenced by outflow of the polar vortex are sampled, which explains higher variability in trace gas distributions. This atmospheric variability is also visible in the MLS HNO3 horizontal distribution along the GLORIA viewing direction as shown in Fig. 3c. For a qualitative comparison to the GLORIA measurements, the gridded MLS HNO3 data have been interpolated to the GLORIA tangent points (Fig. 7b). Considering the different spatial resolutions of the GLORIA and the MLS data, both HNO3 distributions show relative minima and maxima at the same locations, and the absolute values are on the same order of magnitude. Due to the lower vertical resolution of MLS HNO3 measurements, they are more influenced by air masses at higher altitudes, and small structures cannot be resolved. This difference in spatial resolution explains lower absolute HNO3 in MLS compared to GLORIA. The advantage of the satellite product, though, is information about air masses above the HALO flight altitude and how these large-scale structures of HNO3 are connected with the filaments measured by GLORIA.
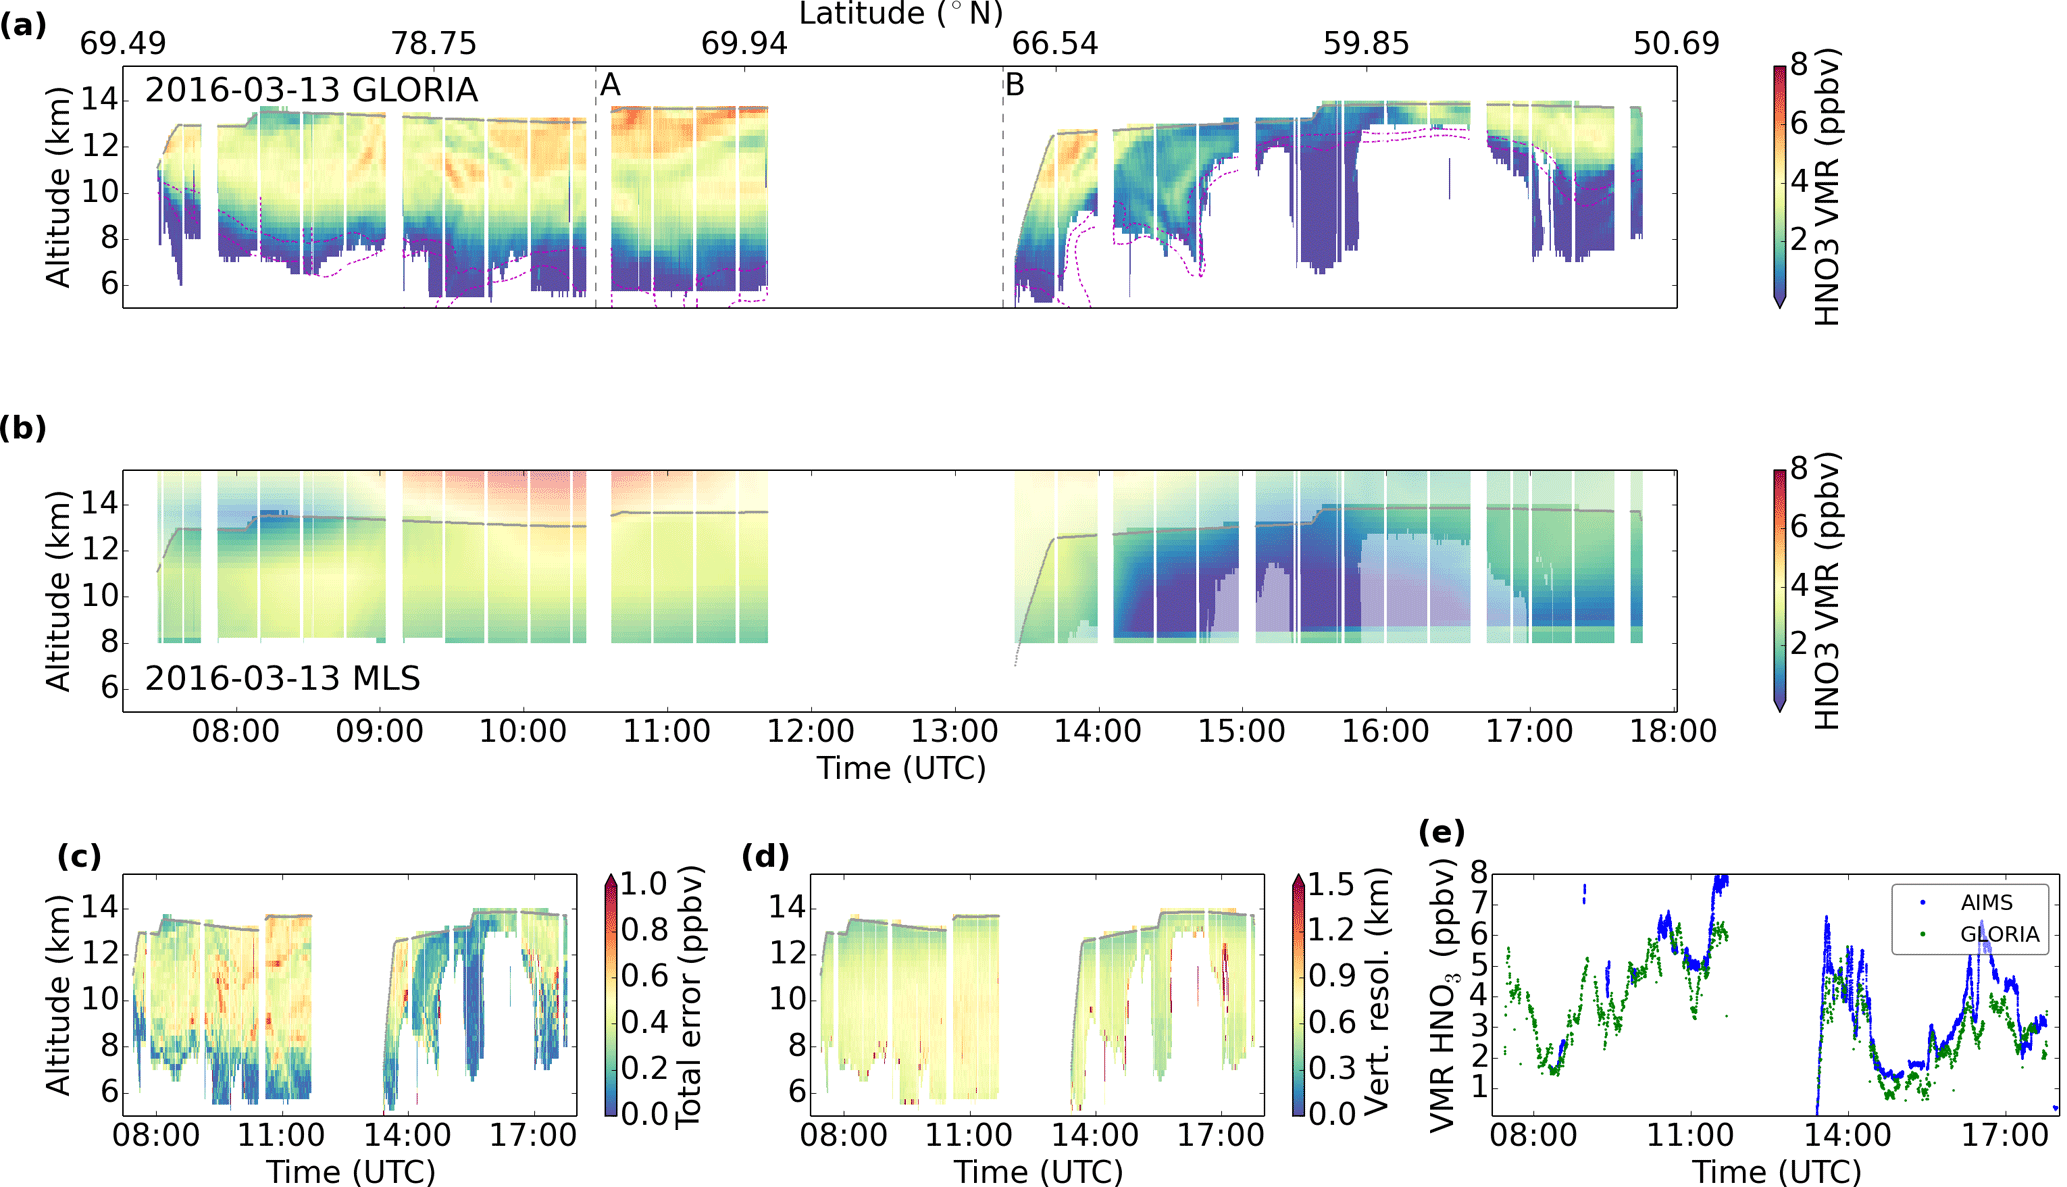
Figure 7HNO3 from flight PGS19: cross section of (a) retrieved HNO3 volume mixing ratio (the flight altitude is marked with a gray line, the ECMWF potential vorticities of 2 and 4 PVU are marked with magenta dashed lines, and way points are marked with gray vertical dashed lines). Cross section of (b) MLS HNO3 data interpolated to the GLORIA tangent points and above the aircraft. Regions with no corresponding GLORIA measurement are marked with fainter colors. Cross sections of (c) total estimated error, (d) vertical resolution and (e) comparison of the GLORIA measurements (green) to the AIMS in situ measurement (blue).
4.3.4 Ozone
The measured ozone (O3) distribution during flight PGS19 can be found in Fig. 8, where maximum values up to 1600 ppbv at altitudes of 13 km are observed. Below this maximum, finer structures are present. Spatial features are in agreement with the ones observed in HNO3 (see Fig. 7), which is expected from atmospheric chemistry (Popp et al., 2009). This close correlation between the GLORIA measurements of both trace gases is an additional self-check for the validity of our results. The total estimated error (up to 150 ppbv) is dominated by spectroscopic and gain uncertainties. Vertical resolutions from 500 to 900 m are achieved. In comparison to the FAIRO in situ measurements, the GLORIA retrieval results follow the long-term as well as the short-term variations. The agreement of the two measurements is typically better than 100 ppbv. In regions of maximum observed O3 mixing ratios high profile-to-profile variations up to 200 ppbv are visible. These variations are explained by the estimated total error and by the expected atmospheric variability along the GLORIA line of sight. In the second part of the flight, GLORIA and FAIRO ozone data show different structures and differences between the measurements up to 300 ppbv. This is the same region where the HNO3 in situ comparison shows differences and where an inhomogeneous horizontal distribution is suspected to distort the comparison of these measurements. The horizontal distribution of O3 at 13 km altitude as derived from MLS measurements is illustrated in Fig. 3d. A horizontal gradient is seen above Baffin Bay (the region covered by the GLORIA tangent points between way points A and B; higher O3 volume mixing ratios in the GLORIA line of sight compared to the aircraft position). The comparison of GLORIA O3 to the MLS distributions interpolated to the GLORIA geolocations shows very similar large-scale structures in both data sets. Again, small-scale structures which are visible in GLORIA measurements are not captured in the lower-resolution MLS data.
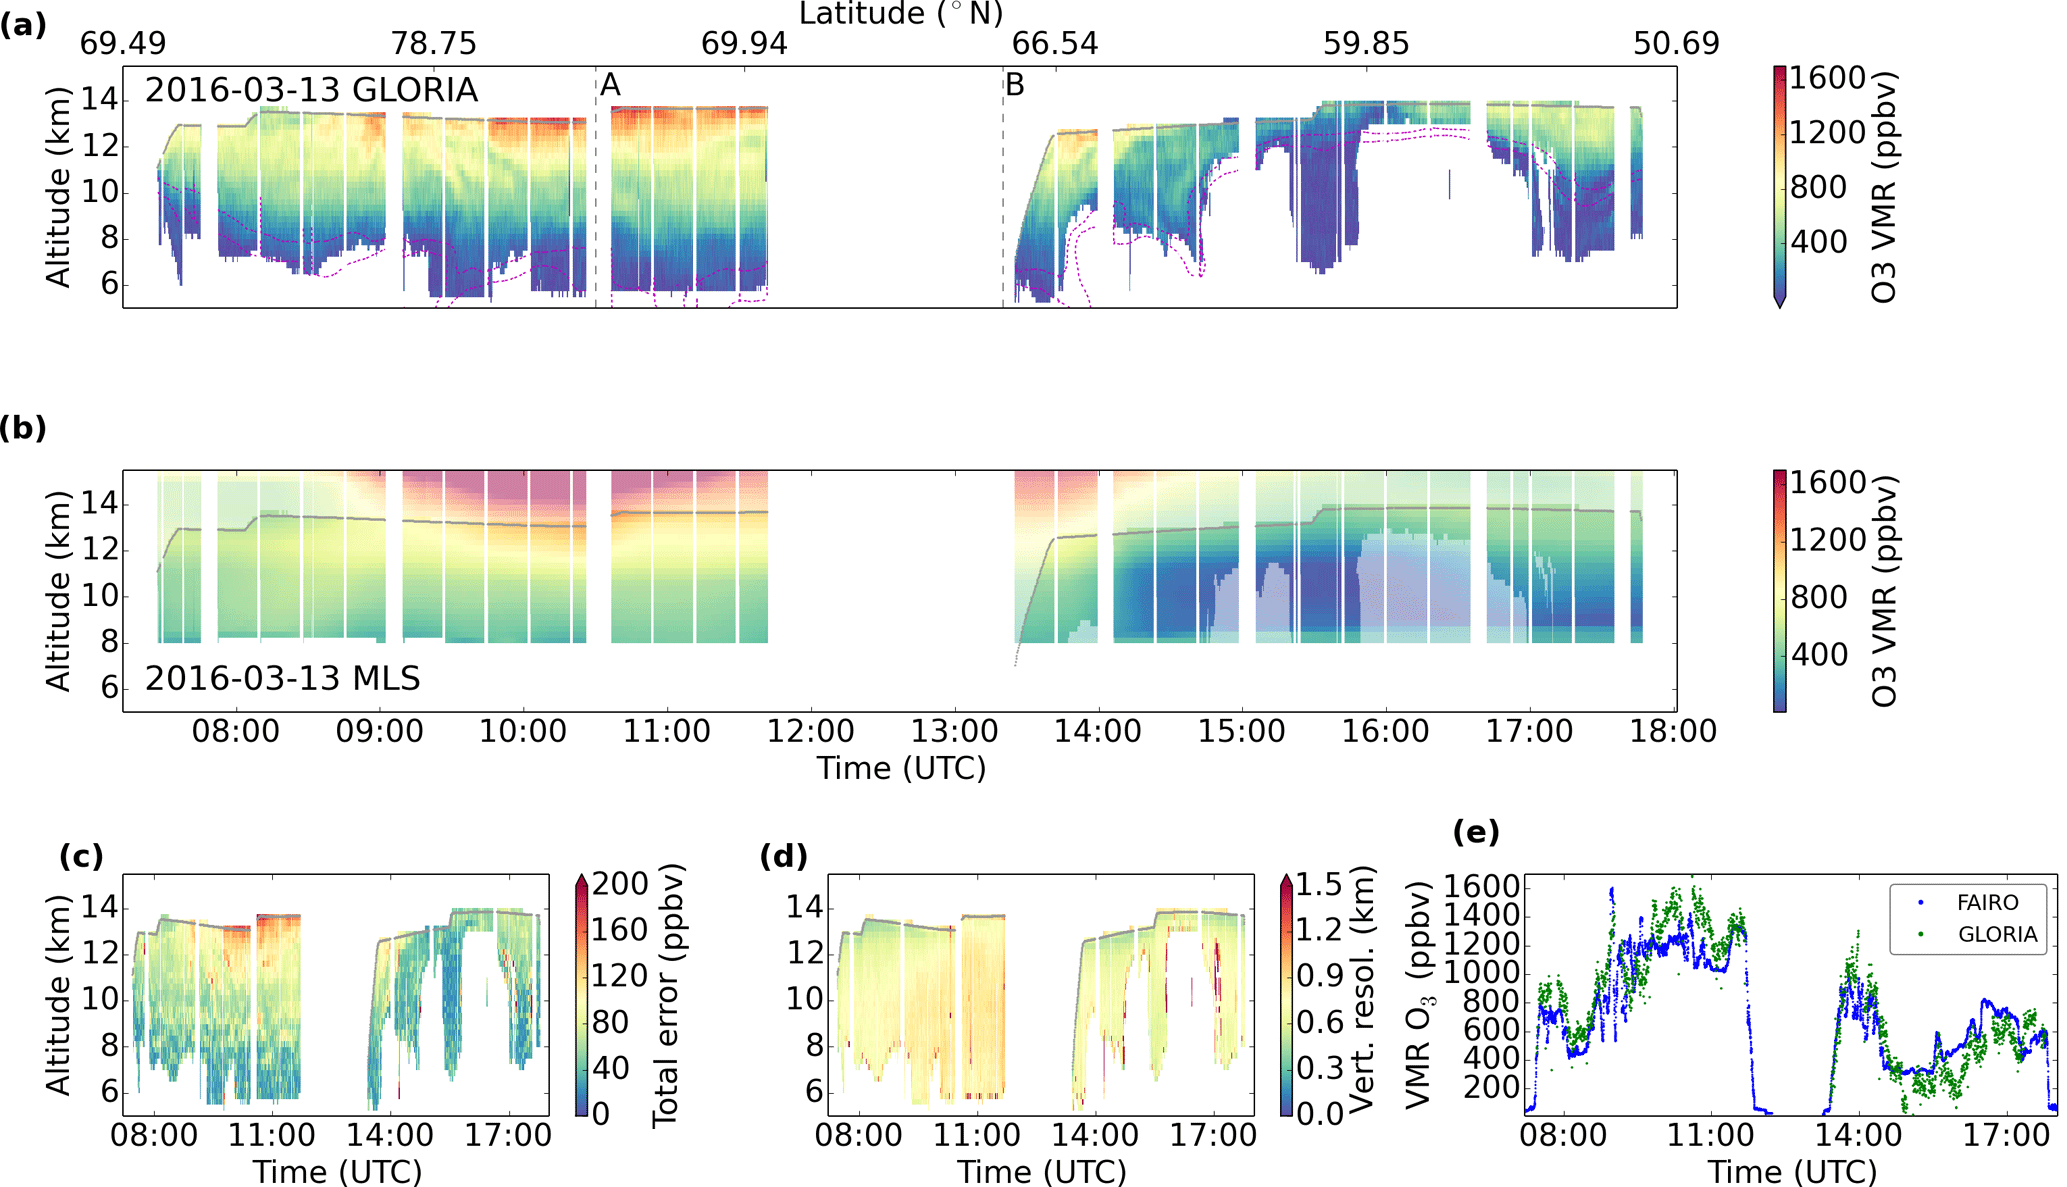
Figure 8O3 from flight PGS19: cross section of (a) retrieved O3 volume mixing ratio (the flight altitude is marked with a gray line, the ECMWF potential vorticities of 2 and 4 PVU are marked with magenta dashed lines, and way points are marked with gray vertical dashed lines). Cross section of (b) MLS O3 data interpolated to the GLORIA tangent points and above the aircraft. Regions with no corresponding GLORIA measurement are marked with fainter colors. Cross sections of (c) total estimated error, (d) vertical resolution and (e) comparison of the GLORIA measurements (green) to the FAIRO in situ measurement (blue).
4.3.5 Chlorine nitrate
Chlorine nitrate (ClONO2) is one of the two reservoir species (the other being HCl) of chlorine in the stratosphere. As was initially shown by infrared limb-emission observations (Clarmann et al., 1993; Oelhaf et al., 1994; Roche et al., 1994), chlorine deactivation in the Arctic spring region results in strong enhancement of ClONO2. The retrieved ClONO2 distribution in Fig. 9 shows several fine structures and maximum values up to 1500 pptv in the flight section (way point A to way point B) that reached the highest PV values (see Fig. 3b), which can be interpreted as subsided deactivated chlorine in the form of ClONO2. The corresponding values of total estimated error are 150 pptv. In the case of background values (<100 pptv), the estimated errors are 30 pptv. The increased errors for enhanced values are caused by the impact of relatively increased gain errors. Vertical resolutions of 500 to 900 m are calculated for this retrieval. The comparison to the AIMS in situ measurements of ClONO2 shows agreement of the two data products to within 200 pptv, except for the maximum values, where differences are up to 500 pptv. Here, the GLORIA retrieval shows a lower absolute vmr but a similar structure. Again, we attribute this difference to an offset in altitude and a possible horizontal gradient, which is measured as an average along the GLORIA line of sight.

Figure 9ClONO2 from flight PGS19: cross section of (a) retrieved ClONO2 volume mixing ratio (the flight altitude is marked with a gray line, the ECMWF potential vorticities of 2 and 4 PVU are marked with magenta dashed lines, and way points are marked with gray vertical dashed lines). (b) Cross sections of total estimated error, (c) vertical resolution and (d) in situ comparison of the GLORIA measurements (green) to the AIMS in situ measurement (blue).
4.3.6 Water vapor
Water vapor (H2O) is mainly present in the troposphere. GLORIA H2O distributions are interesting for investigations of mesoscale structures such as tropopause folds (Shapiro, 1980). In polar studies, H2O is of interest because these distributions are used to understand the formation and decay of polar stratospheric ice clouds (de-/hydration) (Fahey et al., 1990). The distribution of H2O reflects the tropopause altitude with very low stratospheric values (≈5 ppmv) in the region of the aged vortex (way point A to way point B) and high values (10–20 ppmv) above the intrusion of subtropical air where HALO was close to the tropopause (way point B to the final destination, Oberpfaffenhofen). The total estimated error shows higher values (>5 ppmv) in regions with enhanced H2O vmr compared to errors lower than 1 ppmv in regions with measured stratospheric background values. The vertical resolution is between 400 and 700 m. The comparison to the FISH in situ measurement shows agreement to within the GLORIA error of typically 1 ppmv. The enhancement at flight altitude at 15:30 UTC is well captured in both data sets.
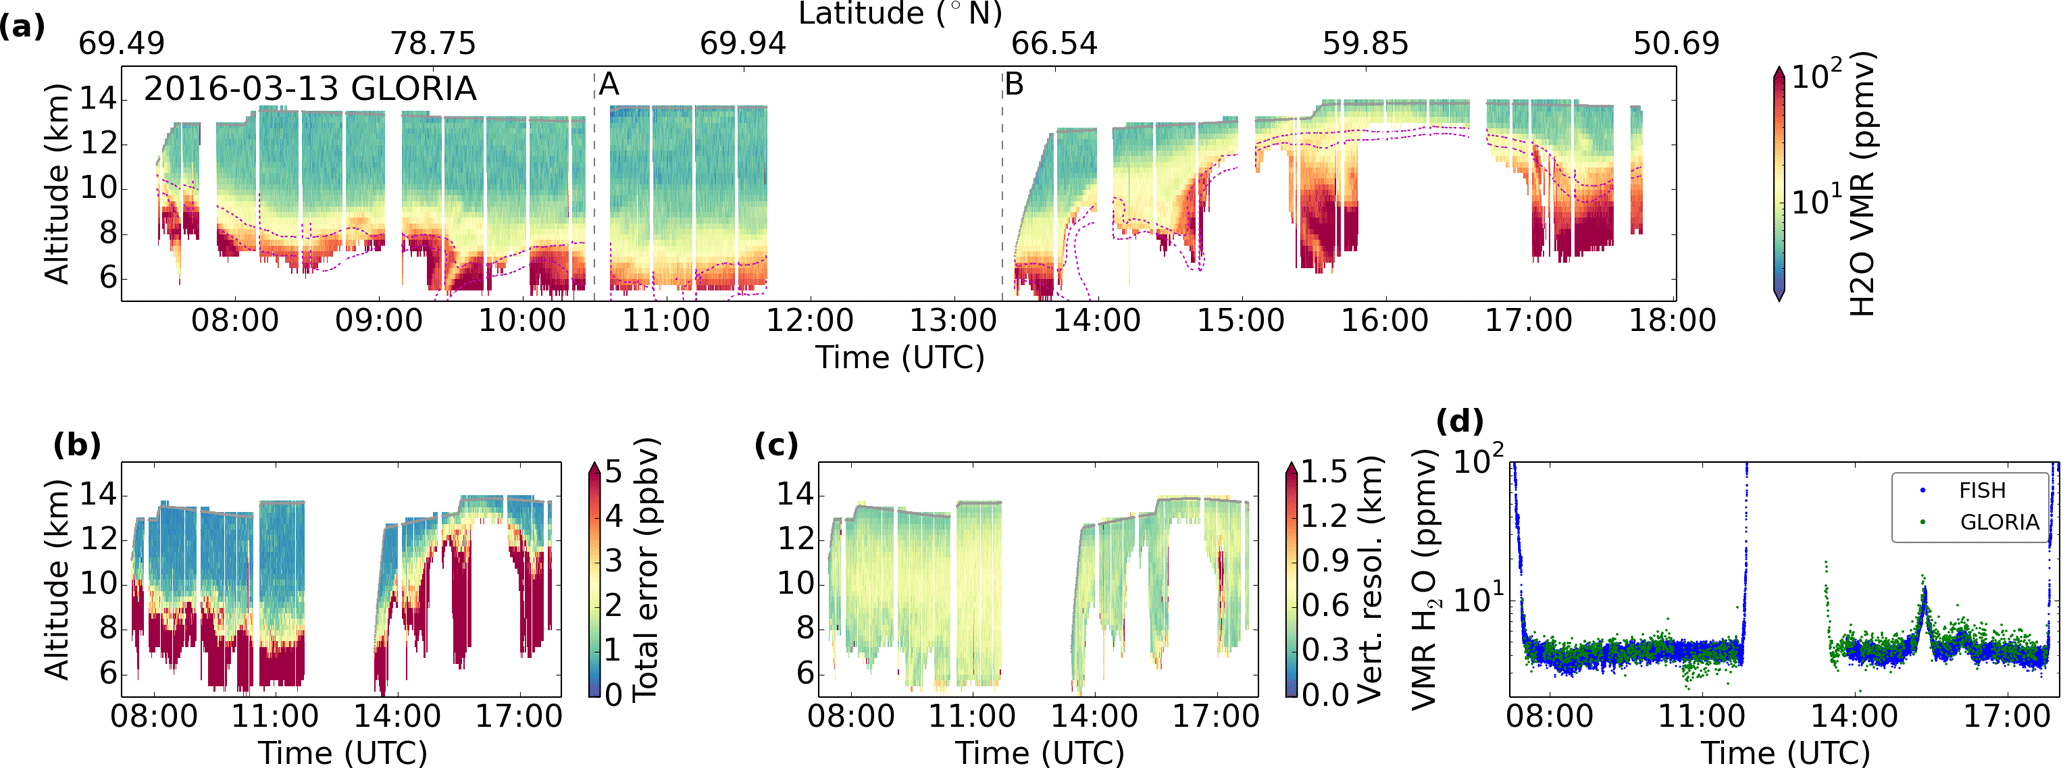
Figure 10H2O from flight PGS19: cross section of (a) retrieved H2O volume mixing ratio (the flight altitude is marked with a gray line, the ECMWF potential vorticities of 2 and 4 PVU are marked with magenta dashed lines, and way points are marked with gray vertical dashed lines). Cross sections of (b) total estimated error, (c) vertical resolution and (d) comparison of the GLORIA measurements (green) to the FISH in situ measurement (blue).
4.3.7 Chlorofluorocarbon 12
Dichlorodifluoromethane (CFC-12) is a chlorofluorocarbon that has been artificially produced for usage as refrigerants and aerosols. Its production is regulated by the Montreal Protocol due to its potential for ozone depletion (WMO, 2015). Because of its vertical gradient, CFC-12 can be used as a tracer for tropospheric air and for the altitude of the air masses (Greenblatt et al., 2002). The vmr distribution along flight PGS19 of CFC-12 is presented in Fig. 11. Here, mainly volume mixing ratios of about 500 pptv are observed in the troposphere. In the area where aged subsided vortex air was reached (way point A to way point B), values as low as 320 pptv were found. The error is between 40 and 130 pptv. The vertical resolution is in the range of 500 to 1000 m. The comparison to the in situ measurements by GhOST-MS shows agreement to within 70 pptv. The high profile-to-profile variation up to 100 pptv of GLORIA CFC-12 that can be seen in this in situ comparison plot exceeds the total estimated error at flight altitude of ≈70 pptv. So it is likely that atmospheric variability along the GLORIA line of sight might cause these fluctuations. This variability is also present in all other flights of this campaign (see Table 2). Also, compared to other GLORIA retrievals, a higher number of extreme outlier points are observed in the GLORIA data. This is an indication that the retrieval for CFC-12 is more sensitive to perturbations in the spectra (e.g., high-altitude clouds that have not been effectively filtered) compared to the retrievals of temperature and other trace gases.

Figure 11CFC-12 from flight PGS19: cross section of (a) retrieved CFC-12 volume mixing ratio (the flight altitude is marked with a gray line, the ECMWF potential vorticities of 2 and 4 PVU are marked with magenta dashed lines, and way points are marked with gray vertical dashed lines). Cross sections of (b) total estimated error, (c) vertical resolution and (d) comparison of the GLORIA measurements (green) to the GhOST-MS in situ measurement (blue).
4.4 Overview of in situ comparisons for the PGS campaign
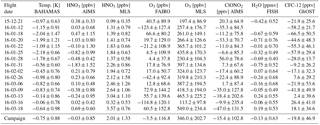
For an overview of comparisons of GLORIA high-spectral-resolution retrieval results to in situ measurements for all PGS flights, the median difference and the median absolute deviation (Rousseeuw and Croux, 1993) are presented in Table 2. The median difference gives a measure of the accuracy of the match between the data sets, and the median absolute deviation is a method for describing the spread around this median value. Both measures are robust methods, and for that reason a few extreme mismatches do not have a large influence. Detailed plots for flights that are not described as thoroughly as flight PGS19 are provided as a supplement. Those plots also help to elucidate larger deviations (e.g., in temperature) between GLORIA and in situ measurements that are present in numerous flights in January 2016, which have been strongly affected by PSCs at and above flight level. From the HALO flight crew, PSCs were reported at these altitudes for PGS flights until PGS14 (26 February 2016). The influence of PSC and high-altitude cirrus clouds on the spectra are shown in Fig. 2a as lower CI values at and below flight altitude. The comparisons of GLORIA and in situ instruments over the whole campaign show that there are reasonably low biases between the data sets. Atmospheric conditions that influence the measurement conditions for remote-sensing change during the winter: in January many PSCs occur, which influence the measured infrared spectra and make temperature and trace gas retrievals challenging. Towards the end of the Arctic winter, more delicate structures in trace gases are present due to nitrification and related events, which make comparisons of measurements at different geolocations more difficult. These changing atmospheric conditions are also visible in the comparisons in Table 2: deviations between GLORIA and BAHAMAS temperatures are larger for flights in January (due to the influence of PSCs). Another measure for the agreement between GLORIA and in situ instruments is the part of co-located measurements, of which the differences are within twice the combined estimated errors of the cross-compared instruments. For temperature 88 %, for HNO3 73 %, for O3 63 %, for ClONO2 53 %, for H2O 90 %, for CFC-12 77 % and in total 73 % of the comparisons show this agreement. ClONO2, O3, and HNO3 show substantial variations at flight altitude (e.g., Figs. 9, 8, 7). We attribute the lower fraction of agreement to the higher atmospheric variability of those trace gases, thereby complicating the comparison due to the strongly differing instrumental sampling characteristics. MLS O3 and HNO3 values become increasingly smaller compared to the corresponding GLORIA measurements towards the end of the Arctic winter. This is explained by the fine structures which are visible in the GLORIA measurements but not resolved in Aura/MLS data due to their lower vertical resolution and horizontal gridding.
Table 2Median differences between GLORIA and in situ and Aura/MLS measurements with the median absolute deviation (as a measure of the spread of the difference around the median value) for each flight and the whole campaign. For the flight on 12 January 2016 (PGS06) no in situ water vapor measurements are available.
We discuss a survey of recent measurements in the high-spectral-resolution mode of the imaging FTS limb sounder GLORIA, which was deployed on the German research aircraft HALO during the PGS field campaign in the Arctic winter 2015/2016. As an example, we discuss flight PGS19 on 13 March 2016 in detail, showing the retrieval results of temperature and the trace gases HNO3, O3, ClONO2, H2O and CFC-12, which we compare to in situ measurements and to MLS where applicable. We demonstrate that valuable information at high spatial resolution can be retrieved from infrared limb imaging data even in the UTLS with high clouds and PSCs present. Fine vertical structures can be examined thanks to vertical resolutions of 400 to 1000 m. Typical estimated errors are in the range of 1–2 K for temperature and 10 %–20 % relative error for the discussed trace gases. An approach for post-flight LOS correction was successfully established to account for limited in-flight LOS knowledge and stabilization due to technical and software problems.
The comparisons of the MLS and GLORIA HNO3 and O3 measurements show the advantage of airborne measurements: the aircraft measurements with high spatial resolution reveal small-scale structures in the trace gas distributions. In contrast, the satellite measurements provide a continuous time series of global measurements up to high altitudes, which helps to put the structures observed by GLORIA into context. The qualitative comparison shows that the same structures in O3 and HNO3 are visible in both data sets, and the measured mixing ratios are on the same order of magnitude. Towards the end of the winter, O3 and HNO3 are underestimated by MLS, which is an effect of lower vertical resolution of the spaceborne instrument and horizontal gridding. This lower resolution does not resolve spatially confined enhancements in these trace gases. Due to only partial overlap of vertically resolved information from GLORIA and the width of the MLS averaging kernels, it is not possible to perform a more quantitative comparison.
Comparisons of the GLORIA retrieval results with in situ measurements on board HALO show the consistency of these data sets, taking into account the error, vertical and horizontal resolutions of GLORIA and atmospheric variability, which are pronounced by the different measurement techniques and the inferred different geolocations of the measurements.
This newly presented GLORIA data set benefits from aero-acoustic improvements of the instrument compared to a previous GLORIA campaigns (Kaufmann et al., 2015; Ungermann et al., 2015; Woiwode et al., 2015). It is based on a much higher number of measured profiles and also has been compared to additional in situ trace gas measurements. Compared to the data set by Woiwode et al. (2015), which is also based on measurements in the high-spectral-resolution mode, the vertical resolutions of this GLORIA data set are significantly better, and a more detailed approach for error estimation is introduced. Furthermore, GLORIA measurements discussed in the paper at hand provide temperature and trace gas information down to 5 km, which is lower compared to the majority of previously discussed infrared limb sounders, due to the much higher vertical and horizontal sampling of the limb-imaging spectrometer. In future retrieval setups we will aim to retrieve additional trace gases such as C2H6 and peroxyacetyl nitrate (PAN).
The results demonstrate the performance and quality of this GLORIA data set of the UTLS during the Arctic winter 2015/2016. GLORIA measurements with unprecedented spatial resolution over the Arctic region will form the basis for many future case studies on chlorine deactivation, denitrification and mesoscale structures.
The discussed GLORIA data set and in situ data sets are available at the HALO database (https://doi.org/10.17616/R39Q0T; HALO consortium, 2018). Aura/MLS data are available at the Goddard Earth Sciences Data and Information Services Center (https://doi.org/10.5067/Aura/MLS/DATA2012; Manney et al., 2015 and https://doi.org/10.5067/Aura/MLS/DATA2017; Schwartz et al., 2015). ECMWF analysis data are available (https://www.ecmwf.int/; ECMWF, 2018).
The supplement related to this article is available online at: https://doi.org/10.5194/amt-11-4737-2018-supplement.
The authors declare that they have no conflict of interest.
This article is part of the special issue “The Polar Stratosphere in a Changing Climate (POLSTRACC) (ACP/AMT inter-journal SI)”. It is not associated with a conference.
We thank both referees for their valuable and detailed feedback, which helped
to improve the manuscript. We gratefully thank the POLSTRACC/GW-LCYCLE
II/SALSA coordination team and DLR-FX (Deutsches Zentrum für Luft- und Raumfahrt – Flugexperimente) for
successfully conducting the field campaign. The results are based on the
efforts of all members of the GLORIA team, including the technology
institutes ZEA-1 and ZEA-2 (Zentralinstitut für Engineering, Elektronik und Analytik) at Forschungszentrum Jülich and the Institute
for Data Processing and Electronics at the Karlsruhe Institute of Technology.
We thank the European Centre for Medium-Range Weather Forecasts (ECMWF) for
providing their meteorological analyses. Sören Johansson
received funding from the
European Community's Seventh Framework Programme (FP7/2007-2013) under grant
agreement 603557. Andreas Marsing, Tina Jurkat-Witschas
and Christiane Voigt were
funded by the German Research Foundation (DFG) under contract number
JU 3059/1-1 and VO 1504/4-1. This work was partly supported by the
Bundesministerium für Bildung und Forschung (BMBF) under the project
ROMIC/GW-LCYCLE, subproject 2 (01LG1206B). Sören Johansson
gratefully thanks the
Graduate School for Climate and Environment (GRACE), Karlsruhe Institute of
Technology, for funding his visit to the Jet Propulsion Laboratory to discuss
the comparisons with the Aura/MLS measurements and the MLS team for the
hospitality during that time. Work at the Jet Propulsion Laboratory,
California Institute of Technology, was done under contract with the National
Aeronautics and Space Administration. This work was partly supported by the
DFG (Deutsche Forschungsgemeinschaft, DFG Priority Program SPP 1294). We
acknowledge support by the Deutsche Forschungsgemeinschaft and the Open
Access Publishing Fund of the Karlsruhe Institute of Technology.
The article processing charges for this
open-access
publication were covered by a Research
Centre of the Helmholtz Association.
Edited by: Martyn Chipperfield
Reviewed by:
two anonymous referees
Bange, J., Esposito, M., Lenschow, D. H., Brown, P. R. A., Dreiling, V., Giez, A., Mahrt, L., Malinowski, S. P., Rodi, A. R., Shaw, R. A., Siebert, H., Smit, H., and Zöger, M.: Measurement of Aircraft State and Thermodynamic and Dynamic Variables, Wiley-Blackwell, 7–75, https://doi.org/10.1002/9783527653218.ch2, 2013. a
Bönisch, H., Engel, A., Birner, Th., Hoor, P., Tarasick, D. W., and Ray, E. A.: On the structural changes in the Brewer-Dobson circulation after 2000, Atmos. Chem. Phys., 11, 3937–3948, https://doi.org/10.5194/acp-11-3937-2011, 2011. a
Brault, J. W.: New approach to high-precision Fourier transform spectrometer design, Appl. Optics, 35, 2891–2896, https://doi.org/10.1364/AO.35.002891, 1996. a
Clarmann, T., Fischer, H., Friedl-Vallon, F., Linden, A., Oelhaf, H., Piesch, C., Seefeldner, M., and Völker, W.: Retrieval of stratospheric O3, HNO3 and ClONO2 profiles from 1992 MIPAS–B limb emission spectra: Method, results, and error analysis, J. Geophys. Res.-Atmos., 98, 20495–20506, https://doi.org/10.1029/93JD02261, 1993. a
ECMWF: European Centre for Medium-Range Weather Forecasts, available at: https://www.ecmwf.int/, last access: 7 August 2018. a
Eriksson, P.: Analysis and comparison of two linear regularization methods for passive atmospheric observations, J. Geophys. Res.-Atmos., 105, 18157–18167, https://doi.org/10.1029/2000JD900172, 2000. a
Fahey, D. W., Kelly, K. K., Kawa, S. R., Tuck, A. F., Loewenstein, M., Chan, K. R., and Heidt, L. E.: Observations of denitrification and dehydration in the winter polar stratospheres, Nature, 321–324, https://doi.org/10.1038/344321a0, 1990. a
Fahey, D. W., Gao, R.-S., Möhler, O., Saathoff, H., Schiller, C., Ebert, V., Krämer, M., Peter, T., Amarouche, N., Avallone, L. M., Bauer, R., Bozóki, Z., Christensen, L. E., Davis, S. M., Durry, G., Dyroff, C., Herman, R. L., Hunsmann, S., Khaykin, S. M., Mackrodt, P., Meyer, J., Smith, J. B., Spelten, N., Troy, R. F., Vömel, H., Wagner, S., and Wienhold, F. G.: The AquaVIT-1 intercomparison of atmospheric water vapor measurement techniques, Atmos. Meas. Tech., 7, 3177–3213, https://doi.org/10.5194/amt-7-3177-2014, 2014. a
Fischer, H. and Oelhaf, H.: Remote sensing of vertical profiles of atmospheric trace constituents with MIPAS limb-emission spectrometers, Appl. Optics, 35, 2787–2796, https://doi.org/10.1364/AO.35.002787, 1996. a
Fischer, H., Birk, M., Blom, C., Carli, B., Carlotti, M., von Clarmann, T., Delbouille, L., Dudhia, A., Ehhalt, D., Endemann, M., Flaud, J. M., Gessner, R., Kleinert, A., Koopman, R., Langen, J., López-Puertas, M., Mosner, P., Nett, H., Oelhaf, H., Perron, G., Remedios, J., Ridolfi, M., Stiller, G., and Zander, R.: MIPAS: an instrument for atmospheric and climate research, Atmos. Chem. Phys., 8, 2151–2188, https://doi.org/10.5194/acp-8-2151-2008, 2008. a
Flaud, J.-M., Piccolo, C., and Carli, B.: A Spectroscopic Database for MIPAS, in: Proceedings of the ENVISAT validation workshop, ESRIN, Italy, 2002. a
Flaud, J.-M., Brizzi, G., Carlotti, M., Perrin, A., and Ridolfi, M.: MIPAS database: Validation of HNO3 line parameters using MIPAS satellite measurements, Atmos. Chem. Phys., 6, 5037–5048, https://doi.org/10.5194/acp-6-5037-2006, 2006. a
Friedl-Vallon, F., Maucher, G., Seefeldner, M., Trieschmann, O., Kleinert, A., Lengel, A., Keim, C., Oelhaf, H., and Fischer, H.: Design and characterization of the balloon-borne Michelson Interferometer for Passive Atmospheric Sounding (MIPAS-B2), Appl. Optics, 43, 3335–3355, https://doi.org/10.1364/AO.43.003335, 2004. a, b
Friedl-Vallon, F., Gulde, T., Hase, F., Kleinert, A., Kulessa, T., Maucher, G., Neubert, T., Olschewski, F., Piesch, C., Preusse, P., Rongen, H., Sartorius, C., Schneider, H., Schönfeld, A., Tan, V., Bayer, N., Blank, J., Dapp, R., Ebersoldt, A., Fischer, H., Graf, F., Guggenmoser, T., Höpfner, M., Kaufmann, M., Kretschmer, E., Latzko, T., Nordmeyer, H., Oelhaf, H., Orphal, J., Riese, M., Schardt, G., Schillings, J., Sha, M. K., Suminska-Ebersoldt, O., and Ungermann, J.: Instrument concept of the imaging Fourier transform spectrometer GLORIA, Atmos. Meas. Tech., 7, 3565–3577, https://doi.org/10.5194/amt-7-3565-2014, 2014. a, b
Froidevaux, L., Jiang, Y. B., Lambert, A., Livesey, N. J., Read, W. G., Waters, J. W., Browell, E. V., Hair, J. W., Avery, M. A., McGee, T. J., Twigg, L. W., Sumnicht, G. K., Jucks, K. W., Margitan, J. J., Sen, B., Stachnik, R. A., Toon, G. C., Bernath, P. F., Boone, C. D., Walker, K. A., Filipiak, M. J., Harwood, R. S., Fuller, R. A., Manney, G. L., Schwartz, M. J., Daffer, W. H., Drouin, B. J., Cofield, R. E., Cuddy, D. T., Jarnot, R. F., Knosp, B. W., Perun, V. S., Snyder, W. V., Stek, P. C., Thurstans, R. P., and Wagner, P. A.: Validation of Aura Microwave Limb Sounder stratospheric ozone measurements, J. Geophys. Res.-Atmos., 113, D15S20, https://doi.org/10.1029/2007JD008771, 2008. a
Gettelman, A., Hoor, P., Pan, L. L., Randel, W. J., Hegglin, M. I., and Birner, T.: THE EXTRATROPICAL UPPER TROPOSPHERE AND LOWER STRATOSPHERE, Rev. Geophys., 49, RG3003, https://doi.org/10.1029/2011RG000355, 2011. a
Giez, A., Mallaun, C., Zöger, M., Dörnbrack, A., and Schumann, U.: Static Pressure from Aircraft Trailing-Cone Measurements and Numerical Weather-Prediction Analysis, J. Aircraft, 54, 1728–1737, https://doi.org/10.2514/1.C034084, 2017. a
Greenblatt, J. B., Jost, H.-J., Loewenstein, M., Podolske, J. R., Bui, T. P., Hurst, D. F., Elkins, J. W., Herman, R. L., Webster, C. R., Schauffler, S. M., Atlas, E. L., Newman, P. A., Lait, L. R., Müller, M., Engel, A., and Schmidt, U.: Defining the polar vortex edge from an N2O:potential temperature correlation, J. Geophys. Res.-Atmos., 107, 8268, https://doi.org/10.1029/2001JD000575, 2002. a
Guggenmoser, T., Blank, J., Kleinert, A., Latzko, T., Ungermann, J., Friedl-Vallon, F., Höpfner, M., Kaufmann, M., Kretschmer, E., Maucher, G., Neubert, T., Oelhaf, H., Preusse, P., Riese, M., Rongen, H., Sha, M. K., Suminska-Ebersoldt, O., and Tan, V.: New calibration noise suppression techniques for the GLORIA limb imager, Atmos. Meas. Tech., 8, 3147–3161, https://doi.org/10.5194/amt-8-3147-2015, 2015. a
HALO consortium: High Altitude and LOng Range database, https://doi.org/10.17616/R39Q0T, 2018. a
Holton, J. R., Haynes, P. H., McIntyre, M. E., Douglass, A. R., Rood, R. B., and Pfister, L.: Stratosphere–troposphere exchange, Rev. Geophys., 33, 403–439, https://doi.org/10.1029/95RG02097, 1995. a
Höpfner, M.: Derivatives and interface to the retrieval, in: The Karlsruhe Optimized and Precise Radiative transfer Algorithm (KOPRA), edited by: Stiller, G. P., Wissenschaftliche Berichte, Forschungszentrum Karlsruhe, 133–144, 2000. a
Jiang, Y. B., Froidevaux, L., Lambert, A., Livesey, N. J., Read, W. G., Waters, J. W., Bojkov, B., Leblanc, T., McDermid, I. S., Godin-Beekmann, S., Filipiak, M. J., Harwood, R. S., Fuller, R. A., Daffer, W. H., Drouin, B. J., Cofield, R. E., Cuddy, D. T., Jarnot, R. F., Knosp, B. W., Perun, V. S., Schwartz, M. J., Snyder, W. V., Stek, P. C., Thurstans, R. P., Wagner, P. A., Allaart, M., Andersen, S. B., Bodeker, G., Calpini, B., Claude, H., Coetzee, G., Davies, J., de Backer, H., Dier, H., Fujiwara, M., Johnson, B., Kelder, H., Leme, N. P., König-Langlo, G., Kyro, E., Laneve, G., Fook, L. S., Merrill, J., Morris, G., Newchurch, M., Oltmans, S., Parrondos, M. C., Posny, F., Schmidlin, F., Skrivankova, P., Stubi, R., Tarasick, D., Thompson, A., Thouret, V., Viatte, P., Vömel, H., von der Gathen, P., Yela, M., and Zablocki, G.: Validation of Aura Microwave Limb Sounder Ozone by ozonesonde and lidar measurements, J. Geophys. Res.-Atmos., 112, D24S34, https://doi.org/10.1029/2007JD008776, 2007. a
Jurkat, T., Kaufmann, S., Voigt, C., Schäuble, D., Jeßberger, P., and Ziereis, H.: The airborne mass spectrometer AIMS – Part 2: Measurements of trace gases with stratospheric or tropospheric origin in the UTLS, Atmos. Meas. Tech., 9, 1907–1923, https://doi.org/10.5194/amt-9-1907-2016, 2016. a
Jurkat, T., Voigt, C., Kaufmann, S., Grooß, J.-U., Ziereis, H., Dörnbrack, A., Hoor, P., Bozem, H., Engel, A., Bönisch, H., Keber, T., Hüneke, T., Pfeilsticker, K., Zahn, A., Walker, K. A., Boone, C. D., Bernath, P. F., and Schlager, H.: Depletion of ozone and reservoir species of chlorine and nitrogen oxide in the lower Antarctic polar vortex measured from aircraft, Geophys. Res. Lett., 44, 6440–6449, https://doi.org/10.1002/2017GL073270, 2017. a
Kaufmann, M., Blank, J., Guggenmoser, T., Ungermann, J., Engel, A., Ern, M., Friedl-Vallon, F., Gerber, D., Grooß, J. U., Guenther, G., Höpfner, M., Kleinert, A., Kretschmer, E., Latzko, Th., Maucher, G., Neubert, T., Nordmeyer, H., Oelhaf, H., Olschewski, F., Orphal, J., Preusse, P., Schlager, H., Schneider, H., Schuettemeyer, D., Stroh, F., Suminska-Ebersoldt, O., Vogel, B., M. Volk, C., Woiwode, W., and Riese, M.: Retrieval of three-dimensional small-scale structures in upper-tropospheric/lower-stratospheric composition as measured by GLORIA, Atmos. Meas. Tech., 8, 81–95, https://doi.org/10.5194/amt-8-81-2015, 2015. a, b
Kaufmann, S., Voigt, C., Jurkat, T., Thornberry, T., Fahey, D. W., Gao, R.-S., Schlage, R., Schäuble, D., and Zöger, M.: The airborne mass spectrometer AIMS – Part 1: AIMS-H2O for UTLS water vapor measurements, Atmos. Meas. Tech., 9, 939–953, https://doi.org/10.5194/amt-9-939-2016, 2016. a
Khosrawi, F., Kirner, O., Sinnhuber, B.-M., Johansson, S., Höpfner, M., Santee, M. L., Froidevaux, L., Ungermann, J., Ruhnke, R., Woiwode, W., Oelhaf, H., and Braesicke, P.: Denitrification, dehydration and ozone loss during the 2015/2016 Arctic winter, Atmos. Chem. Phys., 17, 12893–12910, https://doi.org/10.5194/acp-17-12893-2017, 2017. a
Kleinert, A., Friedl-Vallon, F., Guggenmoser, T., Höpfner, M., Neubert, T., Ribalda, R., Sha, M. K., Ungermann, J., Blank, J., Ebersoldt, A., Kretschmer, E., Latzko, T., Oelhaf, H., Olschewski, F., and Preusse, P.: Level 0 to 1 processing of the imaging Fourier transform spectrometer GLORIA: generation of radiometrically and spectrally calibrated spectra, Atmos. Meas. Tech., 7, 4167–4184, https://doi.org/10.5194/amt-7-4167-2014, 2014. a, b, c
Konopka, P. and Pan, L. L.: On the mixing–driven formation of the Extratropical Transition Layer (ExTL), J. Geophys. Res.-Atmos., 117, D18301, https://doi.org/10.1029/2012JD017876, 2012. a
Krautstrunk, M. and Giez, A.: The Transition From FALCON to HALO Era Airborne Atmospheric Research, in: Atmospheric physics, edited by: Schumann, U., Research topics in aerospace, Springer, Berlin, 609–624, https://doi.org/10.1007/978-3-642-30183-4_37, 2012. a
Kretschmer, E., Bachner, M., Blank, J., Dapp, R., Ebersoldt, A., Friedl-Vallon, F., Guggenmoser, T., Gulde, T., Hartmann, V., Lutz, R., Maucher, G., Neubert, T., Oelhaf, H., Preusse, P., Schardt, G., Schmitt, C., Schönfeld, A., and Tan, V.: In-flight control and communication architecture of the GLORIA imaging limb sounder on atmospheric research aircraft, Atmos. Meas. Tech., 8, 2543–2553, https://doi.org/10.5194/amt-8-2543-2015, 2015. a
Krisch, I., Preusse, P., Ungermann, J., Dörnbrack, A., Eckermann, S. D., Ern, M., Friedl-Vallon, F., Kaufmann, M., Oelhaf, H., Rapp, M., Strube, C., and Riese, M.: First tomographic observations of gravity waves by the infrared limb imager GLORIA, Atmos. Chem. Phys., 17, 14937–14953, https://doi.org/10.5194/acp-17-14937-2017, 2017. a
Livesey, N. J., Read, W. G., Wagner, P. A., Froidevaux, L., Lambert, A., Manney, G. L., Millán, L. F., Pumphrey, Hugh, C., Santee, M. L., Schwartz, M. J., Wang, S., Fuller, R. A., Jarnot, R. F., Knosp, B. W., and Martinez, E.: Version 4.2x Level 2 data quality and description document. Earth Observing System (EOS) Aura Microwave Limb Sounder (MLS), available at: https://mls.jpl.nasa.gov/data/v4-2_data_quality_document.pdf, last access: 9 February 2017. a, b
Manney, G., Santee, M., Froidevaux, L., Livesey, N., and Read, W.: MLS/Aura Level 2 Nitric Acid (HNO3) Mixing Ratio V004, Greenbelt, MD, USA, Goddard Earth Sciences Data and Information Services Center (GES DISC), https://doi.org/10.5067/Aura/MLS/DATA2012, 2015. a, b
Meyer, J., Rolf, C., Schiller, C., Rohs, S., Spelten, N., Afchine, A., Zöger, M., Sitnikov, N., Thornberry, T. D., Rollins, A. W., Bozóki, Z., Tátrai, D., Ebert, V., Kühnreich, B., Mackrodt, P., Möhler, O., Saathoff, H., Rosenlof, K. H., and Krämer, M.: Two decades of water vapor measurements with the FISH fluorescence hygrometer: a review, Atmos. Chem. Phys., 15, 8521–8538, https://doi.org/10.5194/acp-15-8521-2015, 2015. a
Moore, D. P., Waterfall, A. M., and Remedios, J. J.: The potential for radiometric retrievals of halocarbon concentrations from the MIPAS-E instrument, Adv. Space Res., 37, 2238–2246, https://doi.org/10.1016/j.asr.2005.06.058, 2006. a
Nash, E. R., Newman, P. A., Rosenfield, J. E., and Schoeberl, M. R.: An objective determination of the polar vortex using Ertel's potential vorticity, J. Geophys. Res.-Atmos., 101, 9471–9478, https://doi.org/10.1029/96JD00066, 1996. a
Norton, R. H. and Beer, R.: New apodizing functions for Fourier spectrometry, JOSA, 66, 259–264, https://doi.org/10.1364/JOSA.66.000259, 1976. a
Norton, R. H. and Beer, R.: Errata: New Apodizing Functions For Fourier Spectrometry, JOSA, 67, p. 419, https://doi.org/10.1364/JOSA.67.000419, 1977. a
Obersteiner, F., Bönisch, H., and Engel, A.: An automated gas chromatography time-of-flight mass spectrometry instrument for the quantitative analysis of halocarbons in air, Atmos. Meas. Tech., 9, 179–194, https://doi.org/10.5194/amt-9-179-2016, 2016. a
Oelhaf, H., v. Clarmann, T., Fischer, H., Friedl-Vallon, F., Fritzsche, C., Linden, A., Piesch, C., Seefeldner, M., and Völker, W.: Stratospheric ClONO2 and HNO3 profiles inside the Arctic vortex from MIPAS–B limb emission spectra obtained during EASOE, Geophys. Res. Lett., 21, 1263–1266, https://doi.org/10.1029/93GL01303, 1994. a
Oelhaf, H., Sinnhuber, B.-M., and Woiwode, W.: POLSTRACC – POLar STRAtosphere in a Changing Climate, available at: https://www.polstracc.kit.edu/ (last access: 7 August 2018), 2015. a
Offermann, D., Grossmann, K.-U., Barthol, P., Knieling, P., Riese, M., and Trant, R.: Cryogenic Infrared Spectrometers and Telescopes for the Atmosphere (CRISTA) experiment and middle atmosphere variability, J. Geophys. Res.-Atmos., 104, 16311–16325, https://doi.org/10.1029/1998JD100047, 1999. a
Olschewski, F., Ebersoldt, A., Friedl-Vallon, F., Gutschwager, B., Hollandt, J., Kleinert, A., Monte, C., Piesch, C., Preusse, P., Rolf, C., Steffens, P., and Koppmann, R.: The in-flight blackbody calibration system for the GLORIA interferometer on board an airborne research platform, Atmos. Meas. Tech., 6, 3067–3082, https://doi.org/10.5194/amt-6-3067-2013, 2013. a
Peter, T. and Grooß, J.-U.: Chapter 4: Polar Stratospheric Clouds and Sulfate Aerosol Particles: Microphysics, Denitrification and Heterogeneous Chemistry, The Royal Society of Chemistry, 108–144 https://doi.org/10.1039/9781849733182-00108, 2011. a
Phillips, D. L.: A Technique for the Numerical Solution of Certain Integral Equations of the First Kind, J. ACM, 9, 84–97, https://doi.org/10.1145/321105.321114, 1962. a
Piesch, C., Gulde, T., Sartorius, C., Friedl-Vallon, F., Seefeldner, M., Wölfel, M., Blom, C. E., and Fischer, H. (Eds.): Design of a MIPAS instrument for high-altitude aircraft, Proc. of the 2nd Internat. Airborne Remote Sensing Conference and Exhibition, 1996. a, b
Piesch, C., Sartorius, C., Friedl-Vallon, F., Gulde, T., Heger, S., Kretschmer, E., Maucher, G., Nordmeyer, H., Barthel, J., Ebersoldt, A., Graf, F., Hase, F., Kleinert, A., Neubert, T., and Schillings, H. J.: The mechanical and thermal setup of the GLORIA spectrometer, Atmos. Meas. Tech., 8, 1773–1787, https://doi.org/10.5194/amt-8-1773-2015, 2015. a
Popp, P. J., Marcy, T. P., Gao, R. S., Watts, L. A., Fahey, D. W., Richard, E. C., Oltmans, S. J., Santee, M. L., Livesey, N. J., Froidevaux, L., Sen, B., Toon, G. C., Walker, K. A., Boone, C. D., and Bernath, P. F.: Stratospheric correlation between nitric acid and ozone, J. Geophys. Res.-Atmos., 114, D03305, https://doi.org/10.1029/2008JD010875, 2009. a
Remedios, J. J., Leigh, R. J., Waterfall, A. M., Moore, D. P., Sembhi, H., Parkes, I., Greenhough, J., Chipperfield, M. P., and Hauglustaine, D.: MIPAS reference atmospheres and comparisons to V4.61/V4.62 MIPAS level 2 geophysical data sets, Atmos. Chem. Phys. Discuss., 7, 9973–10017, https://doi.org/10.5194/acpd-7-9973-2007, 2007. a
Revercomb, H. E., Buijs, H., Howell, H. B., LaPorte, D. D., Smith, W. L., and Sromovsky, L. A.: Radiometric calibration of IR Fourier transform spectrometers: Solution to a problem with the High-Resolution Interferometer Sounder, Appl. Optics, 27, 3210–3218, https://doi.org/10.1364/AO.27.003210, 1988. a
Riese, M., Oelhaf, H., Preusse, P., Blank, J., Ern, M., Friedl-Vallon, F., Fischer, H., Guggenmoser, T., Höpfner, M., Hoor, P., Kaufmann, M., Orphal, J., Plöger, F., Spang, R., Suminska-Ebersoldt, O., Ungermann, J., Vogel, B., and Woiwode, W.: Gimballed Limb Observer for Radiance Imaging of the Atmosphere (GLORIA) scientific objectives, Atmos. Meas. Tech., 7, 1915–1928, https://doi.org/10.5194/amt-7-1915-2014, 2014. a
Roche, A. E., Kumer, J. B., Mergenthaler, J. L., Nightingale, R. W., Uplinger, W. G., Ely, G. A., Potter, J. F., Wuebbles, D. J., Connell, P. S., and Kinnison, D. E.: Observations of Lower-Stratospheric CIONO2, HNO3, and Aerosol by the UARS CLAES Experiment between January 1992 and April 1993, J. Atmos. Sci., 51, 2877–2902, https://doi.org/10.1175/1520-0469(1994)051<2877:OOLSCH>2.0.CO;2, 1994. a
Rodgers, C. D.: Inverse Methods for Atmospheric Sounding, WORLD SCIENTIFIC, https://doi.org/10.1142/3171, 2000. a, b, c, d
Rolf, C., Afchine, A., Bozem, H., Buchholz, B., Ebert, V., Guggenmoser, T., Hoor, P., Konopka, P., Kretschmer, E., Müller, S., Schlager, H., Spelten, N., Suminska-Ebersoldt, O., Ungermann, J., Zahn, A., and Krämer, M.: Transport of Antarctic stratospheric strongly dehydrated air into the troposphere observed during the HALO-ESMVal campaign 2012, Atmos. Chem. Phys., 15, 9143–9158, https://doi.org/10.5194/acp-15-9143-2015, 2015. a
Rousseeuw, P. J. and Croux, C.: Alternatives to the Median Absolute Deviation, J. Am. Stat. Assoc., 88, 1273–1283, https://doi.org/10.1080/01621459.1993.10476408, 1993. a
Santee, M. L., Lambert, A., Read, W. G., Livesey, N. J., Cofield, R. E., Cuddy, D. T., Daffer, W. H., Drouin, B. J., Froidevaux, L., Fuller, R. A., Jarnot, R. F., Knosp, B. W., Manney, G. L., Perun, V. S., Snyder, W. V., Stek, P. C., Thurstans, R. P., Wagner, P. A., Waters, J. W., Muscari, G., de Zafra, R. L., Dibb, J. E., Fahey, D. W., Popp, P. J., Marcy, T. P., Jucks, K. W., Toon, G. C., Stachnik, R. A., Bernath, P. F., Boone, C. D., Walker, K. A., Urban, J., and Murtagh, D.: Validation of the Aura Microwave Limb Sounder HNO3 measurements, J. Geophys. Res.-Atmos., 112, D24S40, https://doi.org/10.1029/2007JD008721, 2007. a
Schwartz, M., Froidevaux, L., Livesey, N., and Read, W.: MLS/Aura Level 2 Ozone (O3) Mixing Ratio V004, Greenbelt, MD, USA, Goddard Earth Sciences Data and Information Services Center (GES DISC), https://doi.org/10.5067/Aura/MLS/DATA2017, 2015. a, b
Shapiro, M. A.: Turbulent Mixing within Tropopause Folds as a Mechanism for the Exchange of Chemical Constituents between the Stratosphere and Troposphere, J. Atmos. Sci., 37, 994–1004, https://doi.org/10.1175/1520-0469(1980)037<0994:TMWTFA>2.0.CO;2, 1980. a
Spang, R., Remedios, J. J., and Brarkley, M. P.: Colour indices for the detection and differentiation of cloud types in infra-red limb emission spectra, Adv. Space Res., 33, 1041–1047, https://doi.org/10.1016/S0273-1177(03)00585-4, 2004. a
Stiller, G. P. (Ed.): The Karlsruhe Optimized and Precise Radiative transfer Algorithm (KOPRA), vol. FZKA 6487 of Wissenschaftliche Berichte, Forschungszentrum Karlsruhe, 2000. a
Tikhonov, A. N. and Arsenin, V. I.: Solutions of ill-posed problems, Scripta series in mathematics, Winston and Distributed solely by Halsted Press, Washington and New York, 1977. a
Ungermann, J., Blank, J., Lotz, J., Leppkes, K., Hoffmann, L., Guggenmoser, T., Kaufmann, M., Preusse, P., Naumann, U., and Riese, M.: A 3-D tomographic retrieval approach with advection compensation for the air-borne limb-imager GLORIA, Atmos. Meas. Tech., 4, 2509–2529, https://doi.org/10.5194/amt-4-2509-2011, 2011. a, b
Ungermann, J., Kalicinsky, C., Olschewski, F., Knieling, P., Hoffmann, L., Blank, J., Woiwode, W., Oelhaf, H., Hösen, E., Volk, C. M., Ulanovsky, A., Ravegnani, F., Weigel, K., Stroh, F., and Riese, M.: CRISTA-NF measurements with unprecedented vertical resolution during the RECONCILE aircraft campaign, Atmos. Meas. Tech., 5, 1173–1191, https://doi.org/10.5194/amt-5-1173-2012, 2012. a, b, c
Ungermann, J., Blank, J., Dick, M., Ebersoldt, A., Friedl-Vallon, F., Giez, A., Guggenmoser, T., Höpfner, M., Jurkat, T., Kaufmann, M., Kaufmann, S., Kleinert, A., Krämer, M., Latzko, T., Oelhaf, H., Olchewski, F., Preusse, P., Rolf, C., Schillings, J., Suminska-Ebersoldt, O., Tan, V., Thomas, N., Voigt, C., Zahn, A., Zöger, M., and Riese, M.: Level 2 processing for the imaging Fourier transform spectrometer GLORIA: derivation and validation of temperature and trace gas volume mixing ratios from calibrated dynamics mode spectra, Atmos. Meas. Tech., 8, 2473–2489, https://doi.org/10.5194/amt-8-2473-2015, 2015. a, b, c
Voigt, C., Dörnbrack, A., Wirth, M., Groß, S. M., Pitts, M. C., Poole, L. R., Baumann, R., Ehard, B., Sinnhuber, B.-M., Woiwode, W., and Oelhaf, H.: Widespread polar stratospheric ice clouds in the 2015/2016 Arctic winter – Implications for ice nucleation, Atmos. Chem. Phys. Discuss., https://doi.org/10.5194/acp-2017-1044, in review, 2017. a
von Clarmann, T., Glatthor, N., Grabowski, U., Höpfner, M., Kellmann, S., Kiefer, M., Linden, A., Tsidu, G. M., Milz, M., Steck, T., Stiller, G. P., Wang, D. Y., Fischer, H., Funke, B., Gil-López, S., and López-Puertas, M.: Retrieval of temperature and tangent altitude pointing from limb emission spectra recorded from space by the Michelson Interferometer for Passive Atmospheric Sounding (MIPAS), J. Geophys. Res.-Atmos., 108, 4736, https://doi.org/10.1029/2003JD003602, 2003. a
Wagner, G. and Birk, M.: New infrared spectroscopic database for chlorine nitrate, J. Quant. Spectrosc. Ra., 82, 443–460, https://doi.org/10.1016/S0022-4073(03)00169-9, 2003. a
Waters, J. W., Froidevaux, L., Harwood, R. S., Jarnot, R. F., Pickett, H. M., Read, W. G., Siegel, P. H., Cofield, R. E., Filipiak, M. J., Flower, D. A., Holden, J. R., Lau, G. K., Livesey, N. J., Manney, G. L., Pumphrey, H. C., Santee, M. L., Wu, D. L., Cuddy, D. T., Lay, R. R., Loo, M. S., Perun, V. S., Schwartz, M. J., Stek, P. C., Thurstans, R. P., Boyles, M. A., Chandra, K. M., Chavez, M. C., Chen, G.-S., Chudasama, B. V., Dodge, R., Fuller, R. A., Girard, M. A., Jiang, J. H., Jiang, Y., Knosp, B. W., LaBelle, R. C., Lam, J. C., Lee, K. A., Miller, D., Oswald, J. E., Patel, N. C., Pukala, D. M., Quintero, O., Scaff, D. M., van Snyder, W., Tope, M. C., Wagner, P. A., and Walch, M. J.: The Earth observing system microwave limb sounder (EOS MLS) on the aura Satellite, IEEE T. Geosci. Remote, 44, 1075–1092, https://doi.org/10.1109/TGRS.2006.873771, 2006. a
Wetzel, G., Oelhaf, H., Ruhnke, R., Friedl-Vallon, F., Kleinert, A., Kouker, W., Maucher, G., Reddmann, T., Seefeldner, M., Stowasser, M., Trieschmann, O., von Clarmann, T., and Fischer, H.: NOy partitioning and budget and its correlation with N2O in the Arctic vortex and in summer midlatitudes in 1997, J. Geophys. Res.-Atmos., 107, https://doi.org/10.1029/2001JD000916, 2002. a, b, c
WMO: Scientific assessment of Ozone depletion: 2014. Pursuant to Article 6 of the Montreal Protocol on substances that deplete the ozone layer, vol. 55 of Report/World Meteorological Organization, Global Ozone Research and Monitoring Project, World Meteorological Organization, Geneva, available at: http://www.wmo.int/pages/prog/arep/gaw/ozone_2014/documents/Full_report_2014_Ozone_Assessment.pdf (last access: 7 August 2018), 2015. a
Woiwode, W., Oelhaf, H., Gulde, T., Piesch, C., Maucher, G., Ebersoldt, A., Keim, C., Höpfner, M., Khaykin, S., Ravegnani, F., Ulanovsky, A. E., Volk, C. M., Hösen, E., Dörnbrack, A., Ungermann, J., Kalicinsky, C., and Orphal, J.: MIPAS-STR measurements in the Arctic UTLS in winter/spring 2010: instrument characterization, retrieval and validation, Atmos. Meas. Tech., 5, 1205–1228, https://doi.org/10.5194/amt-5-1205-2012, 2012. a, b, c, d
Woiwode, W., Suminska-Ebersoldt, O., Oelhaf, H., Höpfner, M., Belyaev, G. V., Ebersoldt, A., Friedl-Vallon, F., Grooß, J.-U., Gulde, T., Kaufmann, M., Kleinert, A., Krämer, M., Kretschmer, E., Kulessa, T., Maucher, G., Neubert, T., Piesch, C., Preusse, P., Riese, M., Rongen, H., Sartorius, C., Schardt, G., Schönfeld, A., Schuettemeyer, D., Sha, M. K., Stroh, F., Ungermann, J., Volk, C. M., and Orphal, J.: Validation of first chemistry mode retrieval results from the new limb-imaging FTS GLORIA with correlative MIPAS-STR observations, Atmos. Meas. Tech., 8, 2509–2520, https://doi.org/10.5194/amt-8-2509-2015, 2015. a, b, c, d, e, f, g
Zahn, A., Weppner, J., Widmann, H., Schlote-Holubek, K., Burger, B., Kühner, T., and Franke, H.: A fast and precise chemiluminescence ozone detector for eddy flux and airborne application, Atmos. Meas. Tech., 5, 363–375, https://doi.org/10.5194/amt-5-363-2012, 2012. a
Zöger, M., Afchine, A., Eicke, N., Gerhards, M.-T., Klein, E., McKenna, D. S., Mörschel, U., Schmidt, U., Tan, V., Tuitjer, F., Woyke, T., and Schiller, C.: Fast in situ stratospheric hygrometers: A new family of balloon–borne and airborne Lyman alpha photofragment fluorescence hygrometers, J. Geophys. Res.-Atmos., 104, 1807–1816, https://doi.org/10.1029/1998JD100025, 1999. a