the Creative Commons Attribution 4.0 License.
the Creative Commons Attribution 4.0 License.
 | 16 Aug 2018
Portable ozone calibration source independent of changes in temperature, pressure and humidity for research and regulatory applications
John W. Birks
Craig J. Williford
Peter C. Andersen
Andrew A. Turnipseed
Stanley Strunk
Christine A. Ennis
A highly portable ozone (O3) calibration source that can serve as a U.S. EPA level 4 transfer standard for the calibration of ozone analyzers is described and evaluated with respect to analytical figures of merit and effects of ambient pressure and humidity. Reproducible mixing ratios of ozone are produced by the photolysis of oxygen in O3-scrubbed ambient air by UV light at 184.9 nm light from a low-pressure mercury lamp. By maintaining a constant volumetric flow rate (thus constant residence time within the photolysis chamber), the mixing ratio produced is independent of both pressure and temperature and can be varied by varying the lamp intensity. Pulse width modulation of the lamp with feedback from a photodiode monitoring the 253.7 nm emission line is used to maintain target ozone mixing ratios in the range 30–1000 ppb. In order to provide a constant ratio of intensities at 253.7 and 184.9 nm, the photolysis chamber containing the lamp is regulated at a temperature of 40 ∘C. The resulting O3 calibrator has a response time for step changes in output ozone mixing ratio of < 30 s and precision (σp) of 0.4 % of the output mixing ratio for 10 s measurements (e.g., ppb for 100 ppb of O3). Ambient humidity was found to affect the output mixing ratio of ozone primarily by dilution of the oxygen precursor. This potential humidity interference could be up to a few percent in extreme cases but is effectively removed by varying the lamp intensity to compensate for the reduced oxygen concentration based on feedback from a humidity sensor.


Ozone (O3) is a key constituent throughout the atmosphere. In the lower atmosphere, it is a secondary air pollutant formed by the interaction of sunlight with primary pollutants consisting of oxides of nitrogen, carbon monoxide and volatile organic compounds (e.g., Haagen-Smit and Fox, 1954; Birks, 1998; Sillman, 1999). Because of its adverse health effects, ozone is one of six criteria pollutants designated by the U.S. Environmental Protection Agency (U.S. EPA, 2018). Although ground-level ambient ozone levels have improved over the past few decades, many regions in the USA are still out of compliance with the National Ambient Air Quality Standard (NAAQS) for ozone, and monitoring of ozone at hundreds of State and Local Air Monitoring Sites (SLAMS) is mandated by the EPA.
In the stratosphere ozone is continuously formed in the photolysis of oxygen by UV light having wavelengths less than 242 nm. The ozone produced absorbs UV light, protecting the Earth from harmful UV-B radiation in the wavelength range 280–320 nm. Monitoring of the protective ozone layer is done by use of ground-based spectroscopic methods (Gotz, et al., 1934; Stone et al., 2015) along with balloon-launched ozonesondes (Komhyr, 1969), occasional aircraft measurements and satellites.
Ozone has also long been used industrially for treatment of drinking water (Guinvarch, 1959; Lebout, 1959; Peleg, 1976; Rice, 1996), and there is a rapidly growing number of other applications involving food processing, deodorization, sanitization and sterilization (e.g., Jordan and Carlson, 1913; Kim, 1999; Wu et al., 2007). As a result, ozone measurements are required for monitoring industrial processes and ensuring the health and safety of workers.
All of these areas of study require monitoring of ozone levels in either air or water. Although there are numerous methods for measuring ozone, the UV absorbance technique at the 253.7 nm emission line of a low-pressure mercury lamp is now almost universally used. Absorbance has the advantage of being an “absolute” method (in theory relying only on the optical path length and absorption cross section of the analyte); however, UV photometers used to measure ozone do still require periodic calibration. Since environmental ozone-monitoring applications often require relatively long-term, continuous measurements, systematic errors can arise due to drift of electrical components (e.g., A/D converters, temperature and pressure sensors) or degradation of instrument components such as the sampling pump or O3 scrubber. Errors due to incomplete flushing of the detection cell between analyte and reference measurements of light intensity can result from reduced pumping efficiency. Incomplete scrubbing of ozone during the reference light intensity measurement, as well as adsorption/desorption of UV-absorbing species such as aromatic volatile organic compounds (VOCs) and elemental mercury from the ozone scrubber (Spicer et al., 2010; Turnipseed et al., 2017), and the effects of changing humidity levels on light transmission through the detection cell (Wilson and Birks, 2006) can all affect the photometer's linearity and offset. Ozone instruments based on other techniques such as electrochemical ozonesondes (Komhyr, 1969) or solid-phase or gas-phase chemiluminescence (Regener, 1964; Güsten et al., 1992) are also known to be sensitive to many variables that can induce systematic errors and often require even more frequent calibration checks. As a result, periodic calibrations of ozone monitors of all types are required, and a portable calibrator is highly desirable, especially for instruments deployed in remote locations.
Because ozone is an unstable gas, easily decomposing to molecular oxygen in gas cylinders, calibrations require generating ozone at known concentrations at the site of the ozone monitor to be calibrated. This is done almost universally by use of an ozone calibration source in which ozone is generated by photolysis of O2 at 184.9 nm using a low-pressure mercury lamp. Most commonly, the calibrator dries the ambient air or uses dry air from a compressed gas cylinder to eliminate biases due to water vapor and incorporates an ozone photometer that continuously measures the ozone produced. The target output mixing ratio of ozone is then controlled in a feedback loop that regulates the lamp intensity. Such calibrators are relatively large, heavy and have high power requirements. A more portable instrument such as the one described here can regulate ozone output mixing ratios solely based on feedback from measurements of the lamp intensity and does not require dry air or a built-in photometer.
For regulatory purposes, ozone measurements must be traceable to a fundamental reference standard. In the USA, the EPA originally prescribed a wet chemical technique for ozone calibrations based on the spectrophotometric analysis of iodine generated by O3 in a neutral potassium iodide solution (NBKI method) that itself was referenced to an arsenious oxide primary standard (Beard et al., 1977). That method was replaced in 1979 with direct absorbance in the gas phase, now using an accepted value for the absorption cross section for O3 at 253.7 nm of cm2 molec−1 (Burkholder et al., 2015). The USA and many other nations are members of the Metre Convention, which makes use of the International Bureau of Weights and Measures (BIPM) Standard Reference Photometer no. 27 as the world's ozone reference standard (Paur et al., 2003). Each member state of the Metre Convention has one laboratory designated to provide traceability to that country. For the USA that laboratory is the National Institute for Standards and Technology (NIST). Standard Reference Photometers (SRPs) are maintained by both NIST and the EPA. The calibrations of regulatory ozone monitors in the USA are traceable to these level 1 SRPs via transfer standards, as detailed in Fig. 1. This figure also shows how EPA-maintained SRPs trace back through the NIST Standard Reference Photometer no. 0 (SRP no. 0) to the world standard, SRP no. 27. Once every 2 years, the NIST SRP no. 2 is calibrated against the NIST SRP no. 0. The EPA Office of Research and Development Metrology maintains EPA SRP no. 1 and no. 7, and these are verified against the NIST SRP no. 2 once each year. Verification requires that a linear regression of the photometer ozone output plotted against the NIST SRP has a slope of 1.00±0.01 and intercept of ±1 ppb; i.e., 1 % agreement. Upon verification, EPA SRP no. 7 is sent to the different EPA regions for verification of their respective SRPs. As further verification, EPA SRP no. 7 is occasionally compared to EPA SRP no. 1.

Transfer standards are defined as “a transportable device or apparatus which, together with associated operation procedures, is capable of accurately reproducing pollutant concentration standards or produce accurate assays of pollutant concentrations which are quantitatively related to a higher level and more authoritative standard” (U.S. EPA, 2013). Thus, a transfer standard for ozone can be either an ozone source or an ozone analyzer. The EPA accepts up to four levels of ozone transfer standards for calibration of an ozone monitoring site or field ozone analyzer, as shown in Fig. 1. Also, as illustrated in this figure, the uncertainty increases with each level of transfer standard. Typically, a level 2 “uncompromised standard” is maintained in the laboratory where conditions of use may be carefully controlled. This transfer standard is used to calibrate level 3 transfer standards that encounter frequent use and potentially rough treatment in the field. The level 3 transfer standards may be returned on a frequent basis for verification by the level 2 standard. Level 4 standards, calibrated against level 3 standards, also are allowed. Often, level 3 and 4 standards are more portable and designed to be more rugged and/or less sensitive to environmental conditions than higher-level transfer standards. They may be used for calibrating instruments deployed in remote locations, for example.
An EPA level 2 transfer standard must include both an ozone generation device and an analyzer. A level 3 transfer standard can be a combination of an ozone generator and analyzer or only an analyzer. A level 4 transfer standard can be an ozone analyzer or only an ozone generation device. Thus, the ozone calibration source described here qualifies as a level 4 transfer standard. Levels 2–4 Transfer Standards must undergo a “6×6” verification in which six calibration curves, each consisting of six approximately equally spaced ozone concentrations in a range including 0 % and 90 % (±5 %) of the upper range of the reference standard, is obtained on six different days (U.S. EPA, 2013). The relative standard deviations of the six slopes of the calibration plots must not exceed 3.7 %, and the standard deviation of the six intercepts cannot exceed 1.5 ppb.
Here we describe a portable, low-cost ozone calibrator that meets the specifications as an EPA level 4 transfer standard. The calibrator uses little power, requiring only 18 watts of power, and does not require the inlet air to be dried. It is independent of both temperature and pressure and corrections due to humidity are easily incorporated. Therefore, it can provide accurate and precise ozone mixing ratios for calibration of field analyzers or can be used as a reliable ozone source in laboratory experiments.
The 2B Technologies Model 306 Ozone Calibration Source™ described here makes use of a low-pressure mercury (Hg) lamp to photolyze oxygen in ambient air to produce known mixing ratios of ozone. The vacuum UV lines at 184.9 nm are absorbed by O2 to produce oxygen atoms. The oxygen atoms rapidly attach to O2 to form ozone molecules according to the same mechanism that is responsible for the presence of Earth's protective ozone layer:
where hν symbolizes a photon of light and M is any molecule (e.g., N2, O2, Ar). Absorption of one photon of 184.9 nm light by O2 results in the formation of two ozone molecules. The concentration of ozone produced in a flowing stream of air depends on the intensity of the photolysis lamp, the concentration of oxygen (determined by pressure, temperature and its mixing ratio in air), and the residence time in the photolysis cell (determined by volumetric flow rate and cell volume). As will be discussed below, pressure and temperature affect the concentration of the ozone produced (e.g., molec cm−3) but do not affect the output mixing ratio (e.g., ppb). Thus, by holding the volumetric flow rate constant, it is possible to produce a flow of air containing a constant mixing ratio of ozone that can be varied most conveniently by changing and controlling the lamp intensity.
Figure 2 is a schematic diagram of the 2B Technologies Model 306 Ozone Calibration Source. Ambient air is forced by an air pump through a particulate filter, a mass flowmeter and a chemical scrubber to remove ozone and NO (which can react relatively rapidly with the ozone produced). The scrubber consists of Carulite® (a combination of manganese and copper oxides), which catalytically destroys ozone and oxidizes NO to NO2. NO2 is not removed. Air then enters the photolysis chamber containing a low-pressure mercury lamp (BHK, #81-1025-51) where absorption of 184.9 nm photons by oxygen produces ozone. The lamp intensity at 253.7 nm is monitored by a photodiode (Hamamatsu, S12742-254) having a built-in interference filter centered at 254 nm and is controlled by the microprocessor in a feedback loop to maintain a target output ozone mixing ratio. Solid-state silicon photodiodes are known to maintain their original sensitivity longer than any other photodetector and, as such, are used as NIST transfer standards (Ryer, 1998). This translates to long-term stability in the ozone output of the ozone calibrator. Note that the lamp emission at 253.7 nm, which is not absorbed by oxygen to make ozone, is monitored instead of the 184.9 nm line. This is because the window that separates the photodiode from the photolysis chamber is much more susceptible to changes in transmission due to deposition of UV-absorbing materials at 184.9 nm than at 253.7 nm. In order to maintain a constant ratio of emission intensities of the Hg lamp at 184.9 and 253.7 nm, the photolysis chamber temperature is regulated at 40 ∘C by means of a temperature sensor and heating cartridge. Pressure within the gas stream is measured but not controlled. The residence time (∼0.06 s) is held constant by ensuring a constant volumetric flow rate using a mass flowmeter (TSI Instruments, Model 4041, accuracy of ±2 %) converted to volumetric flow using the measured temperature and pressure of the photolysis cell. A microprocessor reads the output of the mass flowmeter, temperature and pressure of the photolysis chamber and regulates the volumetric flow rate to be 3.0 L min−1 (±1 %) by means of pulse-width modulation of the power supplied to the pump. In addition to controlling the volumetric flow rate, the target photodiode signal (corresponding to the target output ozone) is scaled to the instantaneously measured volumetric flow rate in order to compensate for flow rate fluctuations (e.g., higher flow rates require higher target photodiode signals).
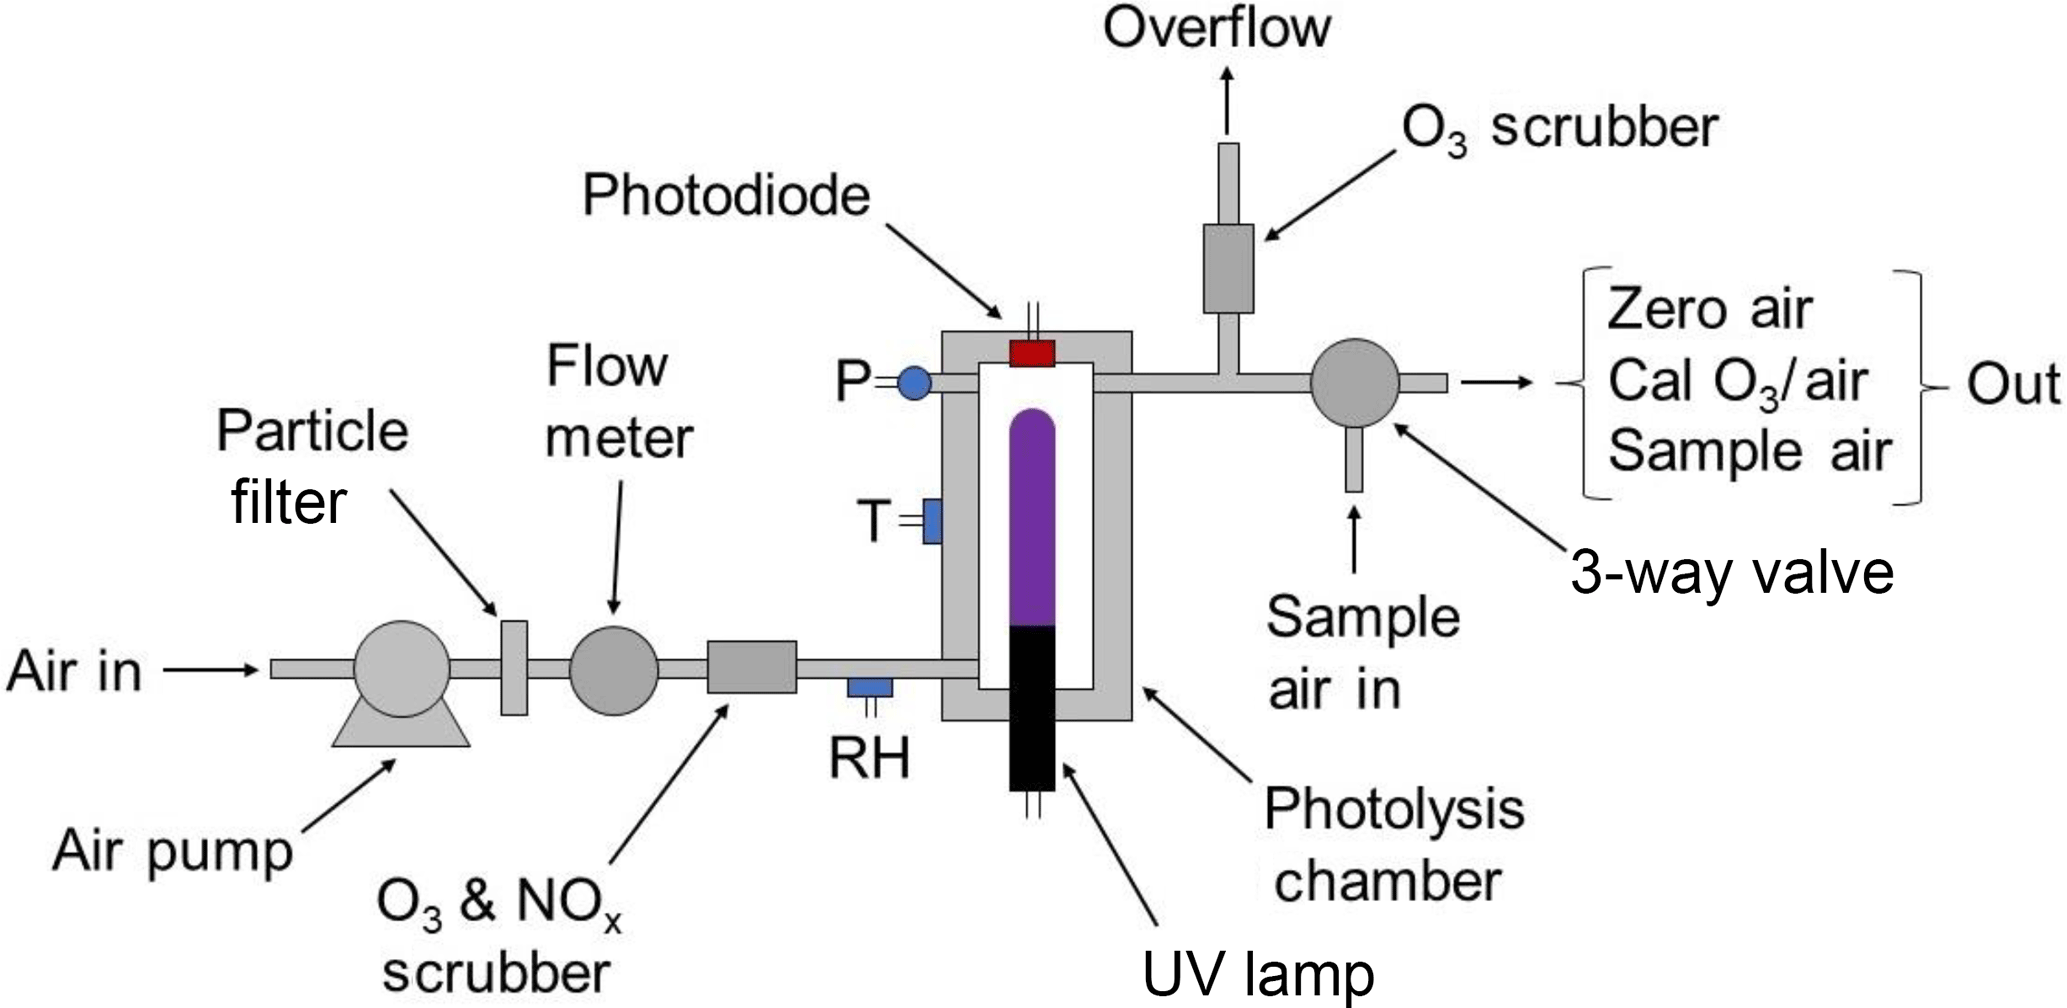
Air containing ozone exits the photolysis cell through an overflow tee, where excess air that is not drawn by the ozone monitor being calibrated is exhausted through an internal ozone scrubber. The output of the ozone calibration source may be attached directly to any ozone monitor (providing that its sampling rate is less than 3.0 L min−1); excess ozone flow is diverted through the ozone scrubber internal to the calibrator, and any perturbation in total flow rate is automatically adjusted by the microprocessor using feedback from the mass flowmeter. A three-way solenoid valve (Parker, nickel-plated V2 miniature valve) is installed just before the exit of the calibrator that allows the ozone calibration source to be plumbed in line with the sampling inlet to an ozone monitor, so that the monitor can sample either ambient air or the output of the calibrator. The output of the ozone source is calibrated using a reference ozone monitor with traceability to NIST, and slope and offset calibration parameters are determined from linear regression and applied to the target photodiode voltages to achieve target ozone mixing ratios.
3.1 Linearity, reproducibility and precision of output concentration
An example of stepwise outputs of a Model 306 Ozone Calibration Source is provided in Fig. 3. The target output ozone mixing ratio was varied in the range of 0 to 1000 in steps of 0, 50, 100, 200, 400, 600, 800 and 1000 ppb. This was followed by a series of decreasing steps back to 0 ppb. A second set of stepwise increases and decreases in target ozone concentrations followed. Each step concentration was maintained for ∼5 min (30 measurements). Output ozone concentrations were measured and logged every 10 s by a 2B Technologies Model 202 Ozone Monitor, a U.S. EPA Federal Equivalent Method (FEM). Note that the response time to achieve a new target concentration is 3 or fewer data points (< 30 s). The response of the calibration source is actually faster considering that it is convolved with the Model 202 Ozone Monitor, which outputs the average of the two most recent 10 s measurements. Figure 4 is a plot of average measured ozone concentration vs. target concentration for the data of Fig. 3. Linear regression lines are drawn for the two stepwise increases and two stepwise decreases in target ozone concentration. The data points and four regression lines overlap so well that they cannot be distinguished on the graph. The equations for the linear regression lines have slopes that agree to better than ±1 %, and the standard deviation of the four intercepts is 1.3 ppb. The coefficients of determination (R2) are all 0.9999 or 1.0000. Past work has shown that the “effective” absorption cross section of O2 using a Hg lamp at 184.9 nm varies with O2 concentration (Cantrell et al., 1997; Lanzendorf et al., 1997, Hofzumahaus et al., 1997; Creasey et al., 2000). This has been shown to be due to poor overlap between the Hg lamp emission lines and the highly structured O2 absorption in the Schumann–Runge bands (Lanzendorf et al., 1997). Both the O2 absorption lines and the broadening of the Hg emission lines are sensitive to temperature and, therefore, control of the photolysis cell temperature at 40 ∘C (±1 ∘C) is critical to maintaining constant spectral overlap. A changing spectral overlap could result from self-heating within the Hg lamp as the intensity is increased, causing nonlinear ozone production. However, the high degree of linearity observed (Fig. 4) suggests that the lamp temperature (thus the spectral overlap) remains constant over the range of lamp intensities employed.
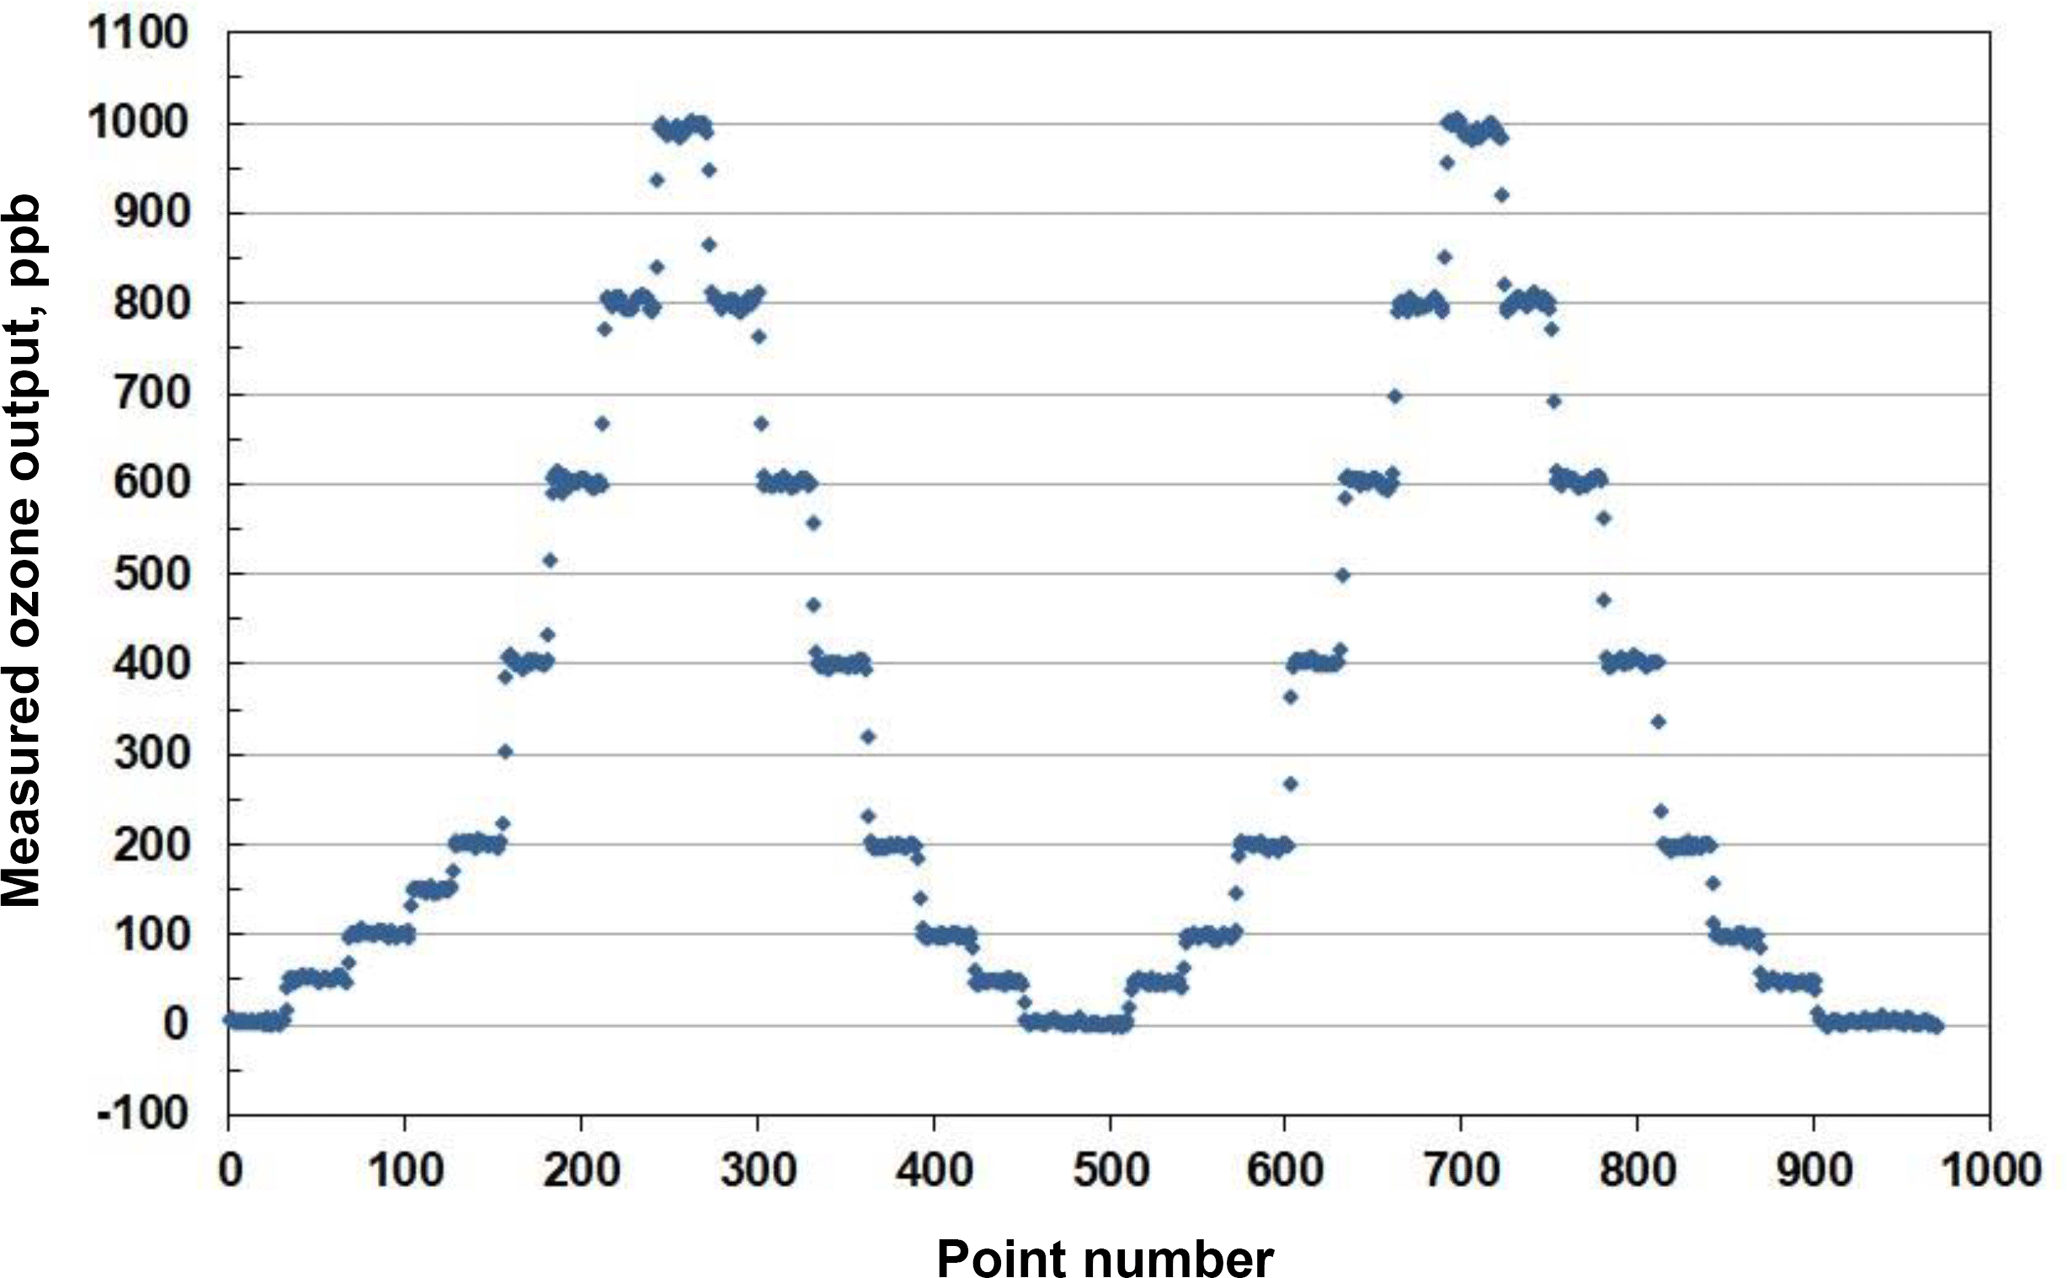
Figure 3Measured output of a Model 306 Ozone Calibration Source where the ozone mixing ratio was systematically varied in steps of 50 and 200 ppb (30 points =5 min), as described in the text.
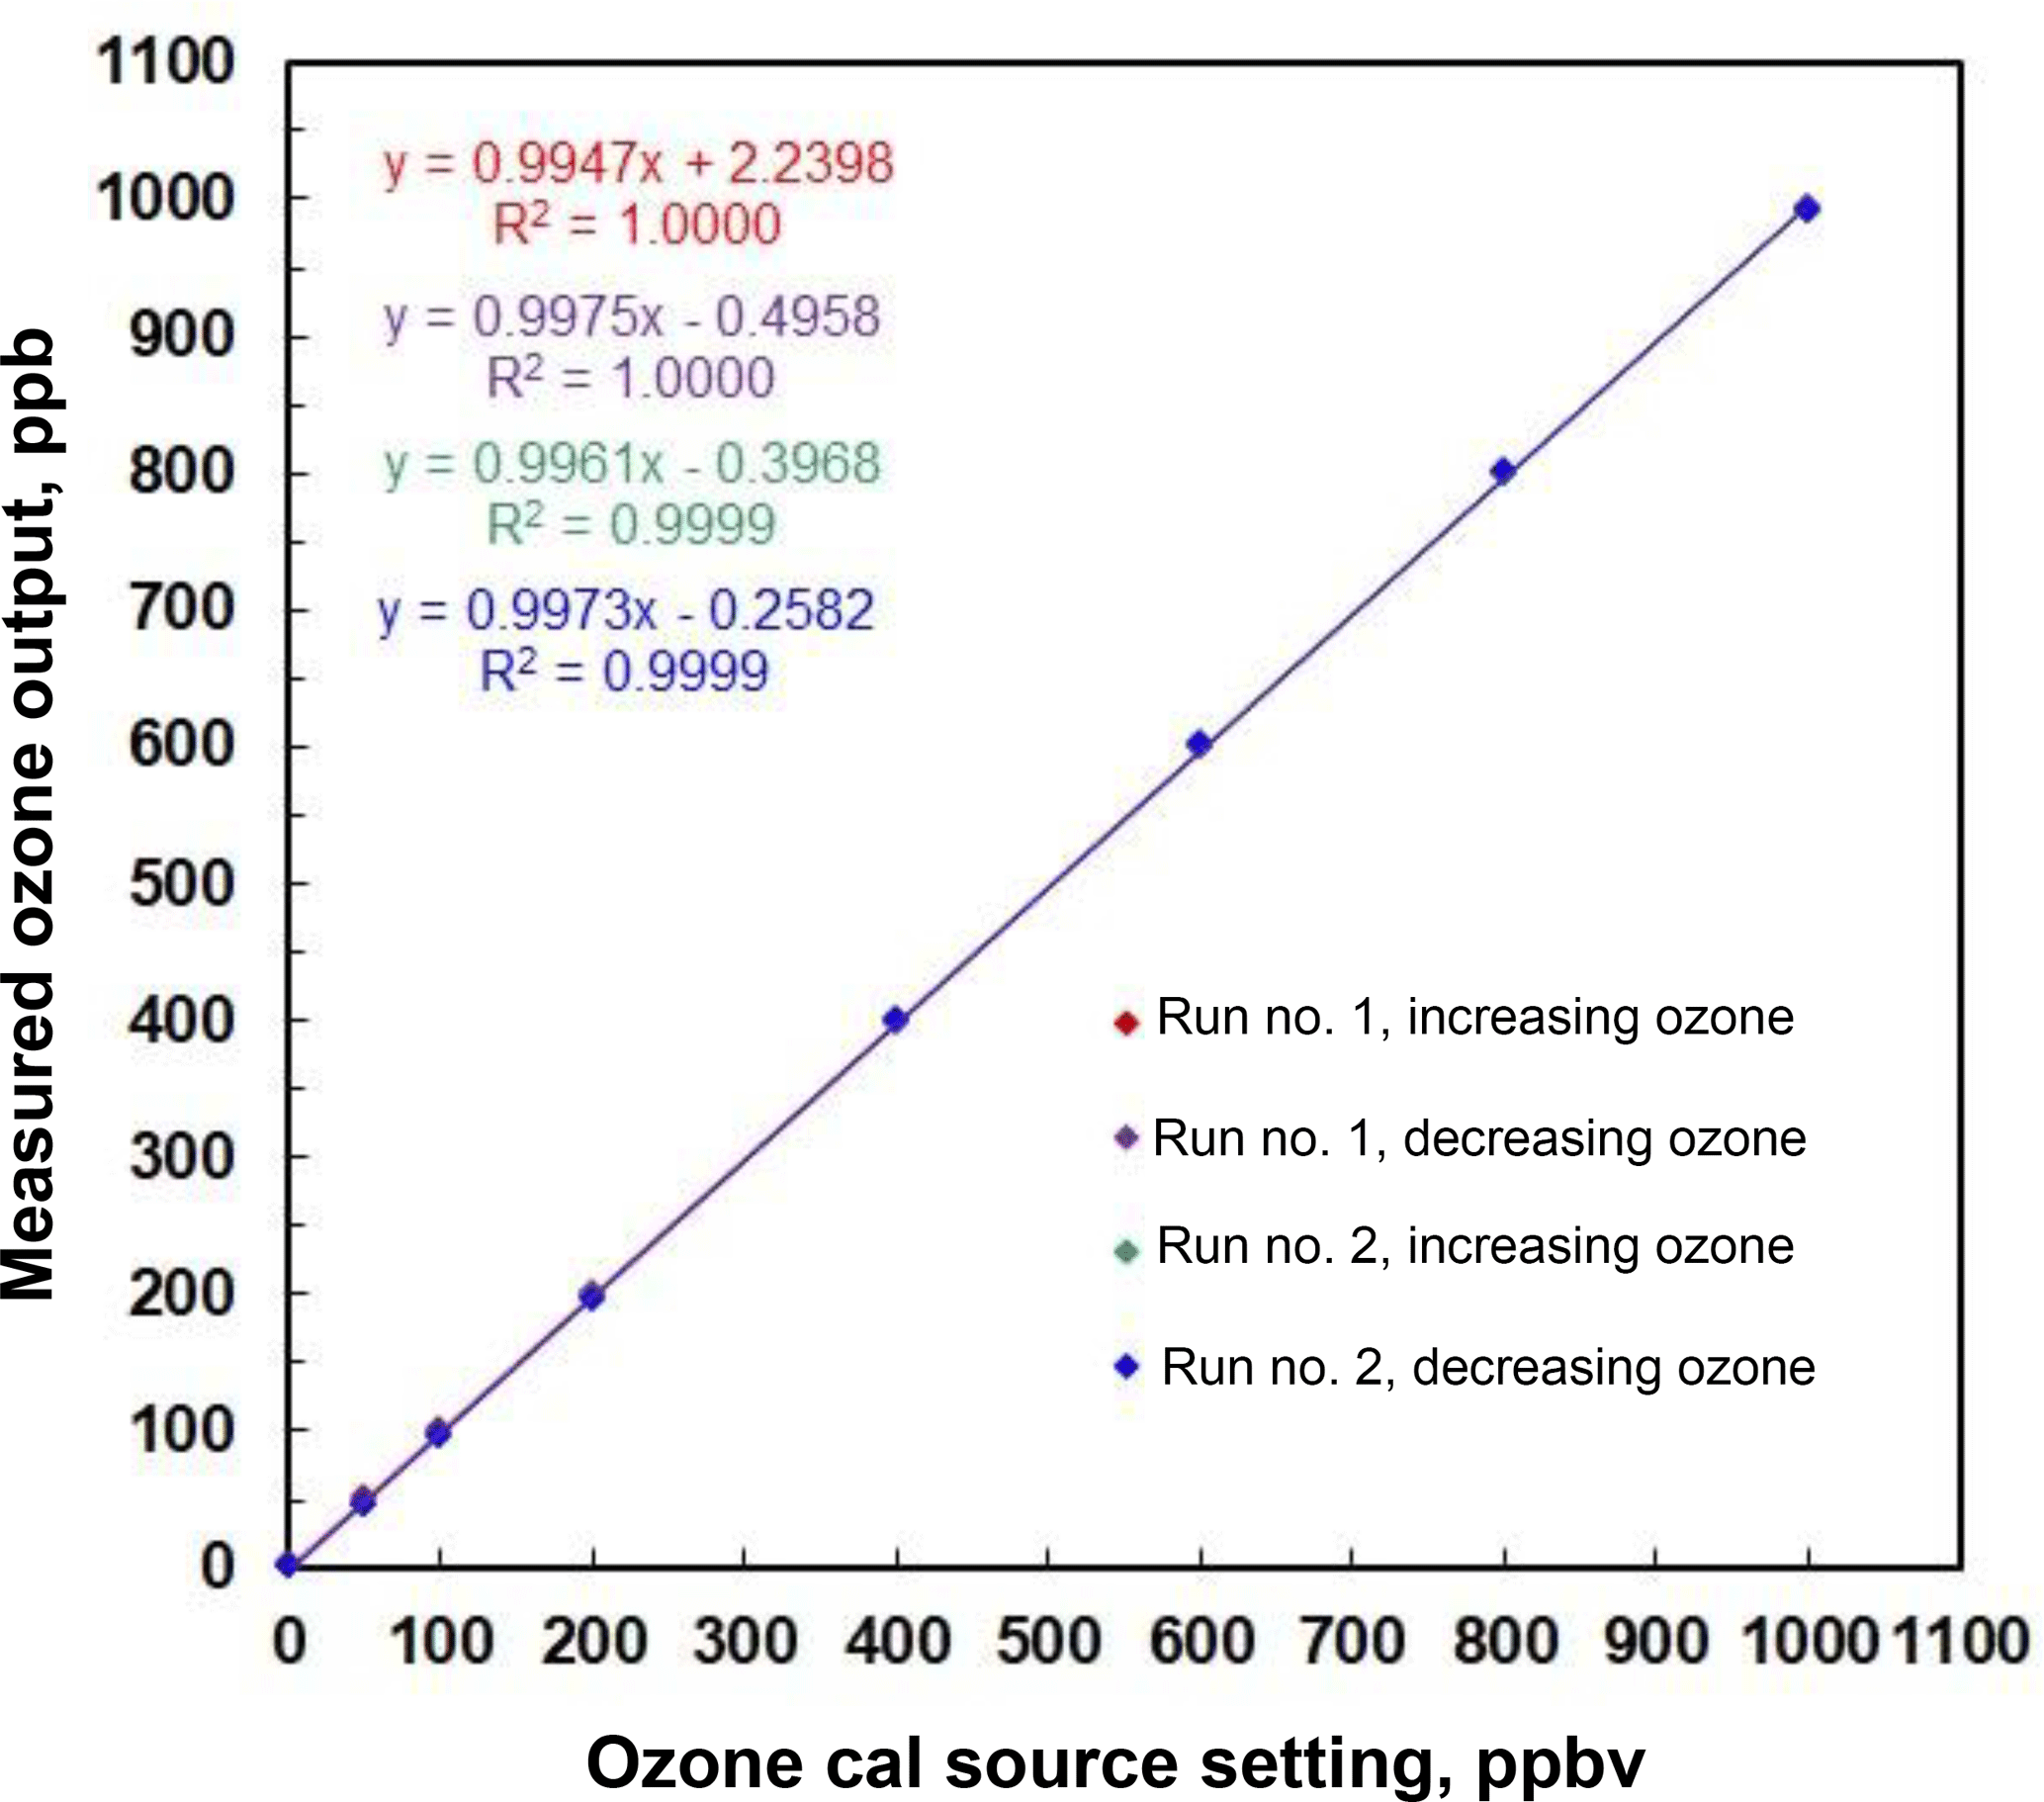
Figure 4Linear regression for the measured outputs of a Model 306 Ozone Calibration Source in Fig. 3. Note the excellent agreement among the four data sets of increasing and decreasing ozone output concentration. Note that the four regression lines are indistinguishable.
The precisions (1σp) of the measured output ozone mixing ratios vary from 2.1 ppb at 0 ppb ozone (i.e., the measurement precision of the Model 202 ozone monitor) to 6.2 ppb at 1000 ppb ozone. A plot of precision vs. ozone concentration (data not shown) gives a straight line with an intercept of 1.8 ppb, slope of 0.0042 ppb ppb−1 O3 and R2 of 0.9586. Thus, assuming this increase is due solely to the ozone calibrator (and not the Model 202 monitor), the precision of the ozone output is about 0.4 % of the target concentration (e.g., ±0.4 ppb at 100 ppb O3 and ±4 ppb at 1000 ppb O3).
In order to verify the ability of the Model 306 Ozone Calibration Source to qualify as a US EPA level 4 Transfer Standard (US EPA, 2013), we carried out a “6×6” calibration in which we measured the output of the ozone calibration source at six different target ozone concentrations (50, 100, 150, 200, 250 and 300 ppb) in addition to a zero ozone measurement on six consecutive days. The ozone output mixing ratios were measured using a 2B Technologies Model 205 FEM ozone monitor. As can be seen in Table 1, the instrument easily met the requirements (given in Table 3-1 of US EPA, 2013) of a level 4 standard with a measured relative standard deviation (RSD) of 0.26 % for the slopes of the regression plots vs. the requirement of ≤3.7 % and a measured standard deviation of 0.33 ppb of the intercepts vs. the requirement of ≤1.5 ppb. Values for the coefficient of determination (R2) were in the range of 0.9998 to 1.0000 with an average of 0.9999 for the six calibration plots.
Other specifications that are of interest for portability (such as the size, weight and power requirements) are given in Table 2.
Table 1Results of a US EPA “6×6” calibration of the Model 306 Ozone Calibration Source.
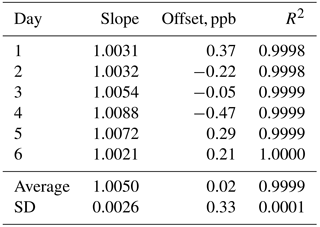
Table 2Analytical and physical specifications for ozone calibration source.
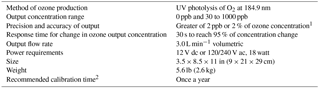
1 The 2B Technologies specification for precision and accuracy of the Model 306 Ozone Calibration Source given here is larger than found in this work and accounts for potential variability among individual instruments. 2 The recommended calibration time is the maximum time between validation of the Ozone Calibration Source with an independent EPA-certified standard.
3.2 Effect of pressure on the ozone output mixing ratio
As described earlier, the target mixing ratio output of the ozone calibration source is achieved by varying the photolysis lamp intensity and maintaining a constant volumetric flow rate. Pressure within the gas stream is measured to correct the mass flow measurements but not controlled, since the goal is to produce a constant mixing ratio (mole fraction) of ozone rather than a constant concentration. The absorption cross section () for O2 at the 184.9 nm Hg line is still poorly known due to significant fine structure in the spectrum but is approximately cm2 molec−1 (Yoshino et al., 1992; Creasey et al., 2000), and the oxygen concentration () in dry air at a temperature of 40 ∘C and pressure of 1 atm (101.325 kPa) is 4.9×10¹⁸ molec cm3. The average path length (l) of the ozone calibration source was designed to be ∼0.25 cm, making the absorbance (lc) optically thin with a single path absorbance of ; i.e., only 1.2 % of the 184.9 nm light emitted by the lamp is absorbed by oxygen. Under optically thin conditions, the ozone production rate () within the photolysis chamber is given by
where I is the lamp intensity (photons cm−2 s−1) at 184.9 nm, and is the concentration of oxygen molecules (molec cm−3), which make up 20.95 % of dry air. The factor of 2 accounts for the production of two ozone molecules for every oxygen molecule photolyzed. The output mixing ratio of ozone (fraction of air molecules that are ozone), in ppb is then given by
where τcell is the residence time of the photolysis cell, which is equal to the cell volume (V) divided by the volumetric flow rate, F, and is given by Eq. (4). Note that the total molecular concentration of air in the denominator of Eq. (5) cancels out with the air concentration in the numerator, so the ozone mixing ratio output is independent of molecular concentration and therefore independent of chamber pressure and temperature (although chamber temperature is controlled for a separate reason described in Sect. 2). The only parameters that affect the ozone output mixing ratio are the lamp intensity and volumetric flow rate. As mentioned before, the volumetric flow rate is computed from the measured mass flow rate, temperature and pressure and is maintained at 3 L min−1.
In order to test for the predicted independence of ambient pressure, the output of a calibrated Model 306 Ozone Calibration Source was measured at six programmed ozone concentrations (0, 100, 200, 300, 400 and 500 ppb) in Boulder, Colorado (5430 ft, 1655 m altitude; P≅0.82 atm) and at Fritz Peak (9020 ft, 2749 m altitude; P≅0.71 atm) in the mountains west of Boulder. The results are shown in Fig. 5. The output ozone mixing ratios at these two altitudes are indistinguishable (within 2 %), as predicted by theory. The ozone calibrator has been tested up to 1 atm (101.3 kPa). Based on Eq. (5), it should be functional above ambient pressure; however, it is currently limited by the range of the pressure sensor (115 kPa, NXP USA, Inc., #MPX5100AP).
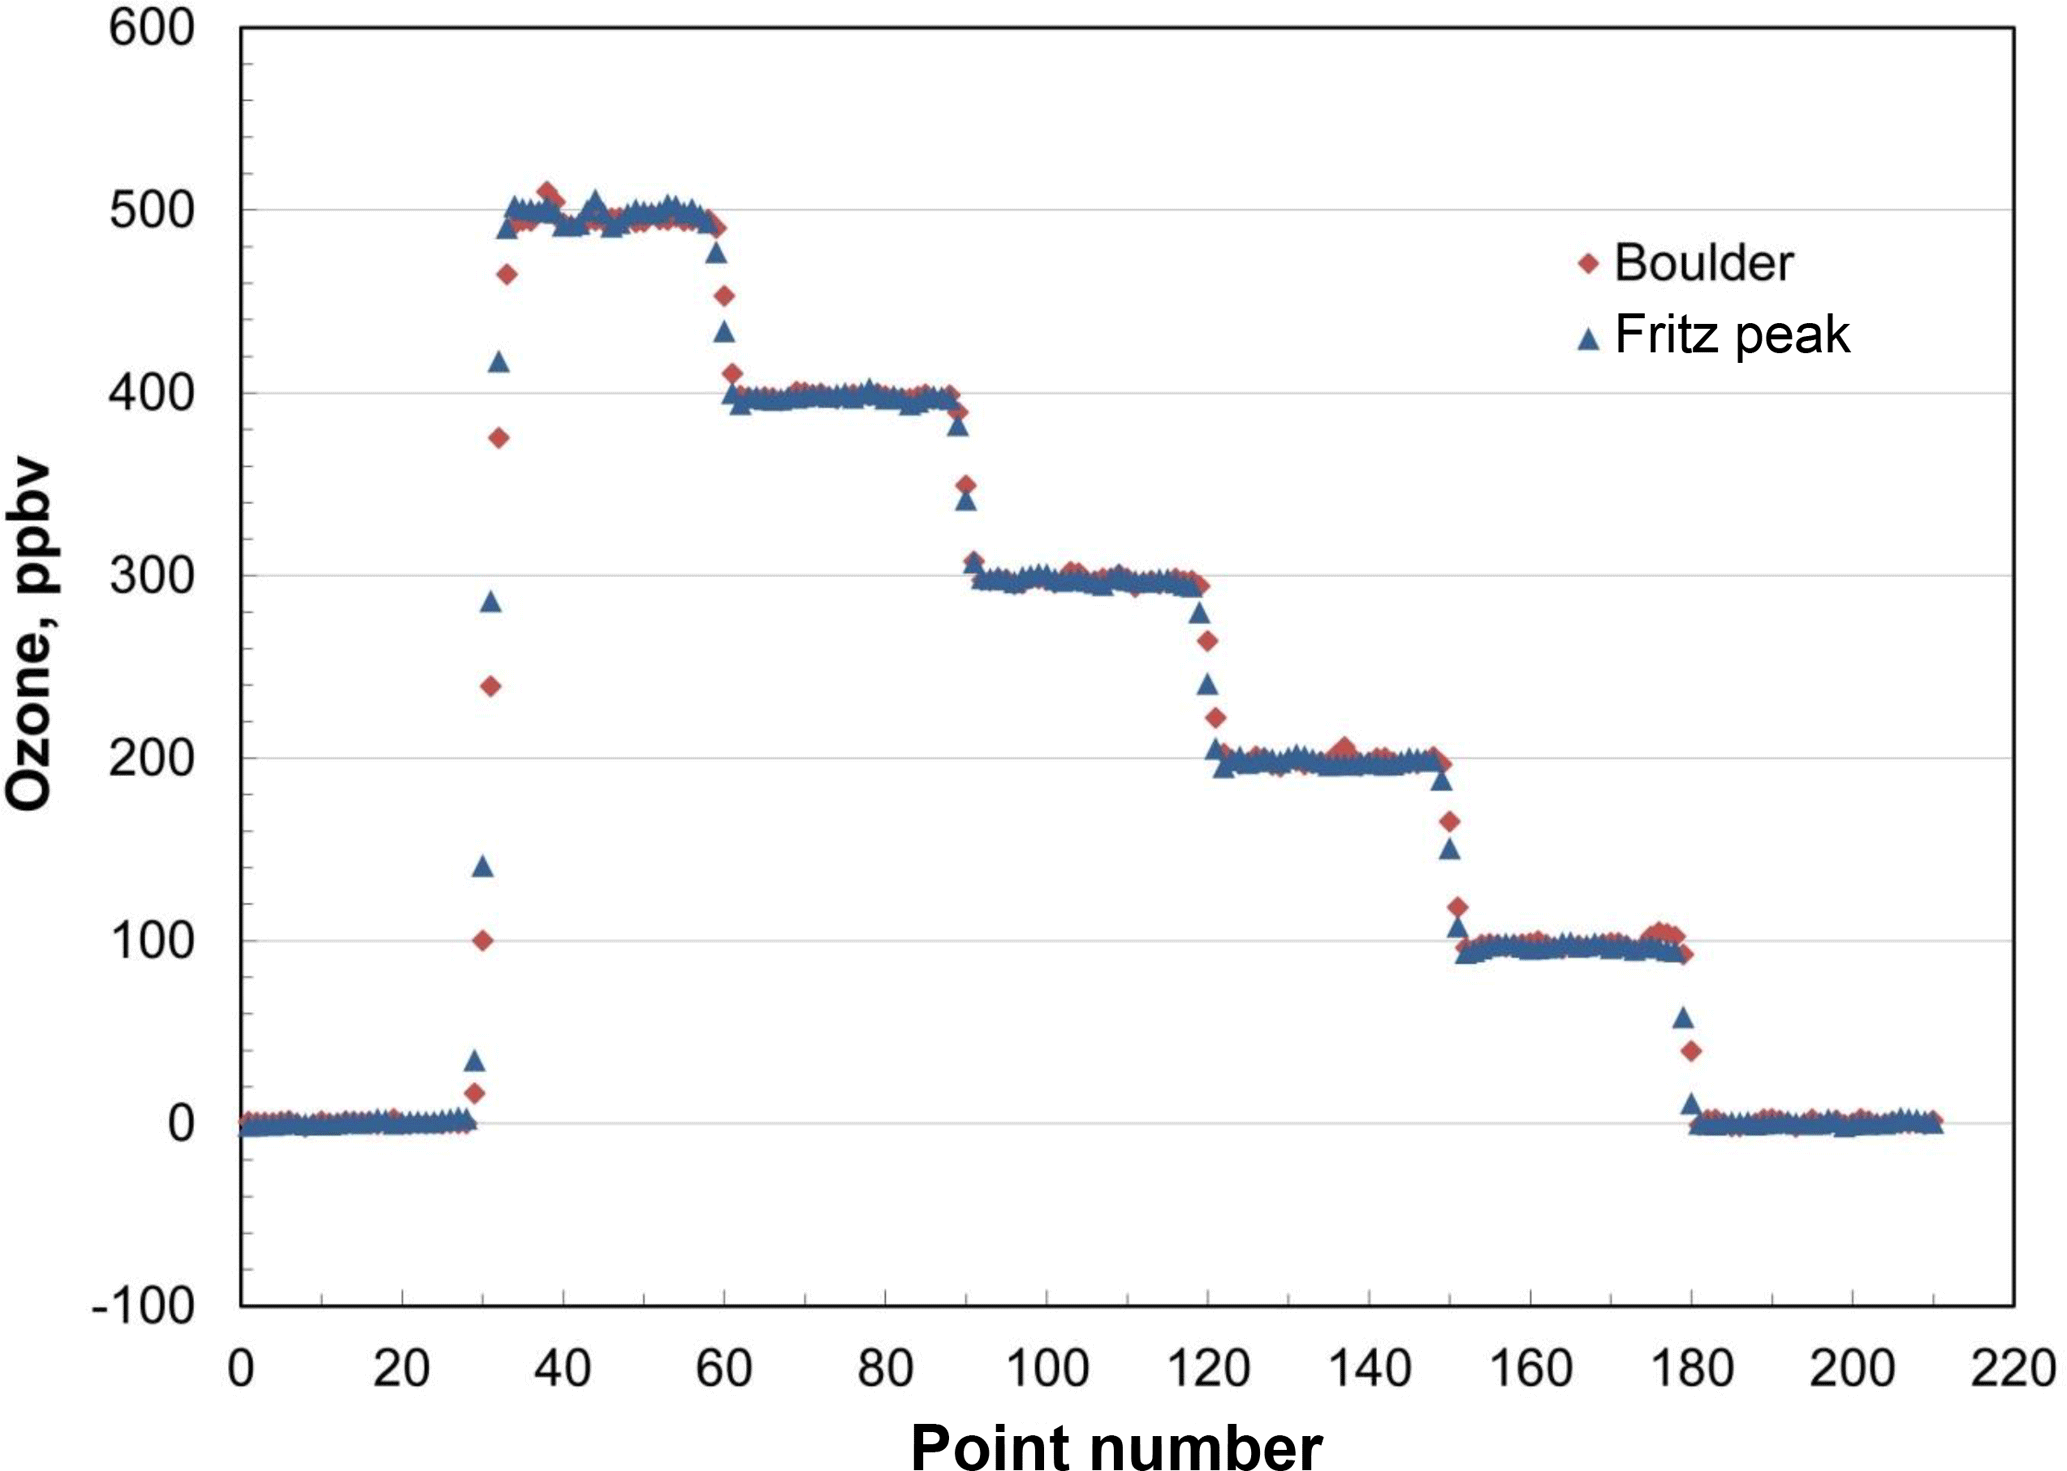
Figure 5Comparison of ozone output mixing ratios in Boulder, Colorado (5430 ft, 1655 m altitude) and Fritz Peak (9020 ft, 2749 m altitude) as measured by a 2B Model 202 Ozone Monitor (30 points =5 min).
3.3 Effect of trace gases and water vapor on the ozone output mixing ratio
Trace gases that are not removed by the inlet scrubber can affect the ozone output in two ways: (1) direct chemical reaction with the ozone produced or (2) light absorption that can affect either the overall light intensity (reducing O2 photolysis) or producing reactive photoproducts. NO2 and VOCs are of primary concern (water vapor is a special case and considered separately below). Chemical loss of ozone in the photolysis cell is limited by the short residence time (τres ∼0.06 s); however, one must also consider the transit time to an analyzer which is to be calibrated. For a typical transit time of ∼1 s (1 m length of 4 mm i.d. tubing and an analyzer flow rate of 1 L min−1) and assuming an NO2 or VOC concentration of 500 ppb (extremely polluted urban area), a rate coefficient of > cm3 molec−1 s−1 is required to remove 1 % of the ozone produced. Rate coefficients for NO2 and relatively stable VOCs (atmospheric lifetime > 3 h) with ozone are typically more than an order of magnitude smaller (Burkholder et al., 2015; Finlayson-Pitts and Pitts, 2000). There are VOCs that are much more reactive with ozone (most notably terpenoid compounds in forested areas), but due to this high reactivity, their ambient concentrations are rarely above 1 or 2 ppb (e.g., Yee et al., 2018). Furthermore, these reactive VOCs have been shown to be effectively removed by MnO2-type scrubbers (Pollmann et al., 2005).
Photolysis of NO2 and possible VOCs cannot compete with O2 photolysis due to the overwhelming concentration difference. Even though aromatic VOCs typically have large absorption cross sections at 184.9 nm ( cm2 molec−1, Keller-Rudek et al., 2013), a mixing ratio of 200 ppb results in a VOC photolysis rate (= IσVOC[VOC]) that is only 1 % of the O2 photolysis rate (Eq. 4). Therefore, the presence of trace VOCs and NO2 are not large enough to either affect the light intensity or generate substantial amounts of photoproducts that could impact the ozone concentration produced.
Due to its high ambient concentration, water vapor is unique and could potentially affect the output ozone concentration in several ways. The first is simply by dilution. As the relative humidity increases, the partial pressure and therefore molecular concentration of O2 decreases, resulting in a reduced production rate of ozone. The water vapor mixing ratio in the atmosphere is typically ∼2 % by volume but could be as high as 7.3 % (100 % RH at 40 ∘C), resulting in a 7.3 % reduction in ozone output in highly humid air if the ozone calibration source were originally calibrated in dry air.
Another way that water vapor can reduce the output ozone mixing ratio is by attenuating the lamp intensity through absorbance. The absorption cross section for H2O at 184.9 nm is cm2 molec−1 (Cantrell et al., 1997). In the extreme case mentioned above of a water vapor mixing ratio of 7.3 % ([H2O] molec cm−3), the average fraction of 184.9 nm light absorbed by water vapor at atmospheric pressure and 40 ∘C integrated over the 0.25 cm path length is 1.6 %. An offsetting factor is that the mass flow controller is 15.4 % more sensitive to water vapor (Cp=33.59 J K−1 mol−1) than to air (Cp=29.10 J K−1 mol−1) due to the higher molar heat capacity (NIST, 2018). Increasing the water vapor mixing ratio results in a positive error in the measured flow rate, with the result that the air pump is slowed down in the feedback loop to maintain a constant apparent flow rate and the residence time in the photolysis cell is increased. For a 7.3 % increase in water vapor, this effect results in a 1.1 % increase in ozone output. Thus, these two factors – the attenuation of 184.9 nm light by water vapor and the reduced flow rate due to a change in heat capacity of the sample air – offset one another to within ∼0.5 % in the expected ozone output.
Yet another way that humidity could affect ozone production is through secondary photochemical reactions. The photochemistry of water vapor is rather complicated, especially in the presence of ozone. HOx radicals (OH and HO2) are produced directly by photolysis of water vapor,
and indirectly in the reaction of O(1D2) with water vapor. O(1D2) is produced in the photolysis of ozone at the principal mercury line of 253.7 nm where ozone has a strong absorption:
Although most of the O(1D2) is quenched by oxygen and nitrogen in the airstream, a small fraction can react with water, producing OH:
Hydroxyl radicals participate in a well-known, yet relatively slow, catalytic cycle for ozone destruction (Bates and Nicolet, 1950):
However, the concentration of hydroxyl radicals that build up inside the photolysis chamber is limited by its self-reaction, which actually produces ozone,
and by the very fast chain termination reaction of OH and HO2:
Reaction (14) limits the importance of the self-reaction of HO2,
which also serves to remove HO2. Subsequent photolysis of the H2O2 product could regenerate OH, but this was found to have no significant effect on the output mixing ratio of ozone in the model calculations discussed below, likely due to the low amounts of H2O2 produced.
Table 3Thermal and photochemical reactions used in modeling the effects of water vapor on the output of the ozone calibration source at 40 ∘C and 1 atm. Units are cm2 molec−1 for absorption cross sections, cm3 molec−1 s−1 for second-order reactions and cm6 molec−2 s−1 for third-order reactions.
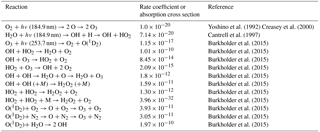
Note: Ground state hydrogen and oxygen atoms are assumed to instantaneously attach to O2 under the photolysis conditions. Photolysis of the H2O2 product at both 184.9 and 253.7 nm is an insignificant source of OH compared to the photolysis of water and reaction of O(1D2) with water. Photolysis of O3 at 184.9 nm is only ∼5 % of that at 253.7 nm, and the quantum yield for O(1D2) production is only about 50 % of that at 253.7 nm and is ignored in the model.
The photochemistry within the photolysis chamber was modeled using current recommendations for the absorption cross sections and reaction rate constants of relevant reactions summarized in Table 3. Light intensity at 184.9 nm was adjusted in the model to produce desired output mixing ratios of ozone in the range 0–1000 ppb in the absence of water vapor. Model results for a target output concentration of 100 ppb ozone are summarized in Fig. 6. In the extreme case of a temperature of 40 ∘C and 100 % RH (water mixing ratio of 7.3 %), the ozone output mixing ratio increases by 0.9 % (0.9 ppb) due to production of O atoms in the OH self-reaction, Reaction (13). For more typical conditions of 25 ∘C and 50 % RH, the increase in ozone production is only 0.2 % for a target mixing ratio of 100 ppb. For a target of 1000 ppb, the percentage increase in ozone production is slightly smaller, being only 0.06 % (0.6 ppb) at 40 ∘C and 100 % RH. Under these conditions the catalytic ozone destruction cycle of Reactions (9) and (10) begin to offset ozone production in the OH self-reaction. Under more typical conditions of 25 ∘C and 50 % RH, the increase in ozone concentration is modeled to be less than 0.01 % (less than 0.1 ppb) for a target of 1000 ppb ozone.

Figure 6Calculated percent increases in the ozone mixing ratio output (for a target of 100 ppb of O3) from the ozone calibration source due to photochemical reactions as a function of temperature and relative humidity.
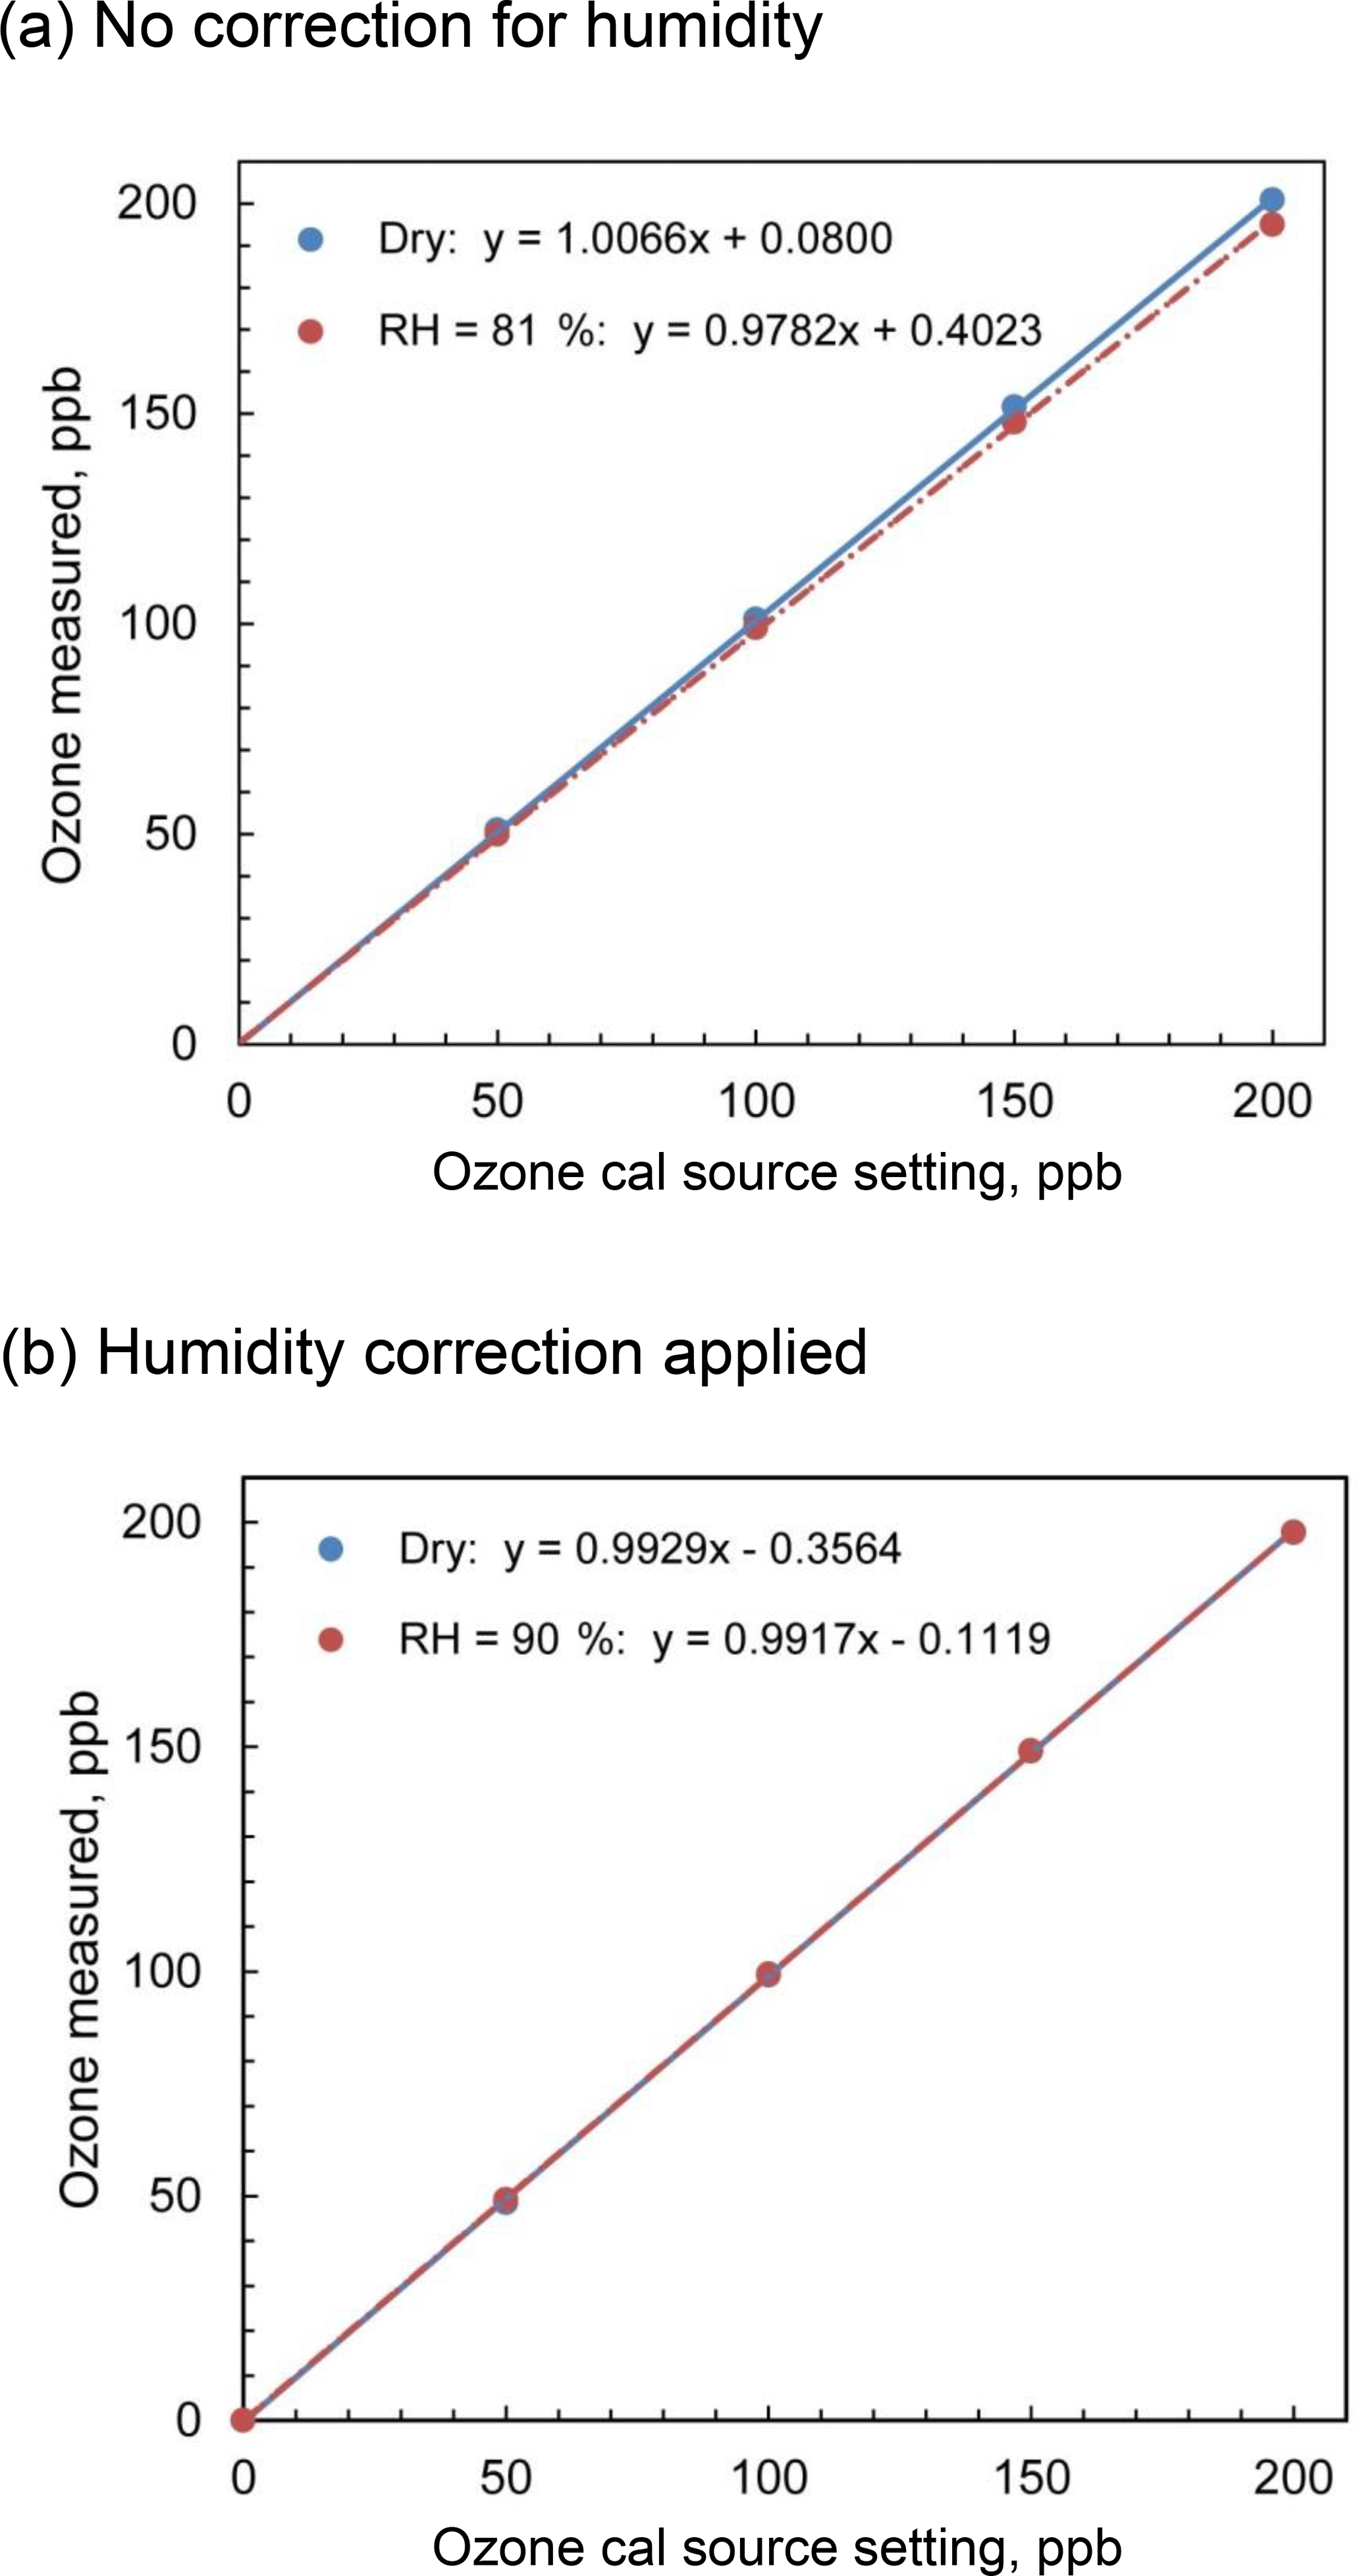
Figure 7Comparison of the output of the Model 306 Ozone Calibrator for dry and humid air for (a) no firmware corrections for humidity and (b) firmware corrections applied based on inline humidity measurements.
Based on the analysis given above, the only significant effect of water vapor (> 1 %) on the output of the ozone calibration source is the dilution of oxygen in the inlet air. In order to correct for the dilution effect, a humidity sensor (Honeywell, HIH8000) was installed in the flow path via a tee with the sensor head protruding into the main flow immediately upstream of the photolysis cell, and feedback from that sensor was used to adjust the lamp intensity to compensate for the dilution of oxygen by water vapor. The sensor provides simultaneous measurements of relative humidity (RH) and temperature with a response time of ∼10 s so that mixing ratios of water vapor may be calculated. Several empirical equations have been developed to fit the vapor pressure of water as a function of RH and temperature. The Magnus–Tetens equation (Tetons, 1930; Montieth and Unsworth, 2008) is sufficiently accurate (within 1 Pa up to T= 35 ∘C, Montieth and Unsworth, 2008) while being simple:
The mixing ratio of water is then given by
Water dilutes the oxygen in the photolysis chamber and therefore reduces the output of the ozone source by the same factor. In order to compensate, we may increase the lamp target intensity by a factor of ), and the overall factor we need to multiply the target lamp intensity by is as follows:
In order to test this algorithm, we measured the output of a 2B Technologies Model 306 Ozone Calibration Source with and without water vapor added. A three-way valve directed a volumetric flow rate of 3 L min−1 of dry zero air (US Welding) from a compressed gas cylinder to either bypass or pass through a Nafion® tube immersed in a temperature-controlled water bath to provide either dry air or humidified air to the inlet of the Model 306. The output of the ozone calibration source was sampled with a 2B Technologies Model 211 Ozone Monitor, which because of its gas-phase-scrubber technology and internal DewLine™ (Nafion® tube) that equilibrates humidity levels of ozone scrubbed and unscrubbed air, has no significant sensitivity to water vapor. Experiments were performed with and without lamp intensity adjustment controlled by the instrument firmware to correct the presence of water vapor. Figure 7a shows the calibration curves obtained for ozone in the range 0–200 ppb at 0 % RH (bypass) and an average of 82 % RH (water vapor added via Nafion® tube) under ambient conditions of 875 mbar pressure and temperature of 23.6 ∘C and with no lamp intensity adjustment for humidity. The slope of the regression line in the presence of humidity is 2.8 % lower than that for dry air, which agrees extremely well with the mixing ratio of water calculated to be 2.7 %. Figure 7b shows the calibration curves obtained for zero air and for humid air (90 % RH at 23.8 ∘C, 3.2 % water vapor) where the calibrator lamp intensity is corrected for the dilution due to humidity. As seen in the figure, the slopes are now within 0.1 % of each other (0.9929 for dry air and 0.9917 for humid air, i.e., no statistical difference).
The 2B Technologies Model 306 Ozone Calibration Source is capable of producing ozone in ozone-scrubbed ambient air with accuracy and precision better than 1 ppb in the range 30–100 ppb ozone or 1 % in the range 100–1000 ppb. The volumetric flow rate of 3 L min−1 allows calibration of virtually any ozone monitor via sampling from a built-in overflow tee. The instrument is made independent of ambient pressure and temperature by feedback control of the air pump to produce a constant volumetric flow rate through the photolysis chamber. Regulation of the photolysis chamber temperature, typically at 40 ∘C, ensures a constant ratio of lamp intensities at 184.9 nm (used to photolyze O2) and 253.7 nm (monitored for feedback control of the lamp intensity). The effect of ambient humidity on ozone production is primarily that of dilution of the O2 photochemical precursor. This dilution effect is completely eliminated by means of feedback control of the photolysis source intensity based on real-time measurements of humidity. Photochemical reactions involving HOx species due to the presence of water vapor only contribute to ozone production by a small amount (< 1 % at 40 ∘C and 100 % RH). The ozone calibration source described here is low powered (∼18 W) and highly portable, weighing only 2.6 kg and requiring no compressed or dry gas sources. Yet it still meets the requirements of an EPA level 4 transfer standard that can be used in the calibration of compliance-monitoring ozone monitors.
Experimental data presented here are available upon request to the authors (johnb@twobtech.com).
John Birks, Peter Andersen, Craig Williford, Andrew Turnipseed, Stanley Strunk and Christine Ennis are employed by 2B
Technologies, Inc., the manufacturer of the Model 306 Ozone Calibrator
described in this paper.
Edited by: Andreas Hofzumahaus
Reviewed by: three anonymous referees
Bates, D. R., and Nicolet, M.: The photochemistry of atmospheric water vapor, J. Geophys. Res., 55, 301–307, 1950.
Beard, M. E., Margeson, J. H., and Ellis, E. C.: Evaluation of 1 percent neutral buffered potassium iodide solution for calibration of ozone monitors, Report No. EPA-600/4-77-005, Office of Research and Development, U.S. Environmental Protection Agency, Research Triangle Park, North Carolina, 1977.
Birks, J. W.: Oxidant formation in the troposphere, in: Perspectives in Environmental Chemistry, edited by: Macalady, D. L., Oxford University Press, 233–256, 1998.
Burkholder, J. B., Sander, S. P., Abbatt, J., Barker, J. R., Huie, R. E., Kolb, C. E., Kurylo, M. J., Orkin, V. L., Wilmouth, D. M., and Wine, P. H.: Chemical Kinetics and Photochemical Data for Use in Atmospheric Studies, Evaluation No. 18, JPL Publication 15-10, Jet Propulsion Laboratory, Pasadena, 2015.
Cantrell, C. A., Zimmer, A., and Tyndall, G. S.: Absorption cross sections for water vapor from 183 to 193 nm, Geophys. Res. Lett., 24, 2195–2198, 1997.
Creasey, D. J., Heard, D. E., and Lee, J. D.: Absorption cross-section measurements of water vapour and oxygen at 185 nm. Implications for the calibration of field instruments to measure OH, HO2 and RO2 radicals, Geophys. Res. Lett., 27, 1651–1654, 2000.
Finlayson-Pitts, B. J. and Pitts, J. N.: Chemistry of the Upper and Lower Atmosphere: Theory, Experiments and Applications, Academic Press, San Diego, 2000.
Gotz, F., Meetham, A. R., and Dobson, G. B.: The vertical distribution of ozone in the atmosphere, P. Roy. Soc. A, 145, 416–446, 1934.
Guinvarch, P.: Three years of ozone sterilization of water in Paris, in Ozone Chemistry and Technology, Adv. Chem., 21, American Chemical Society, 416–429, 1959.
Güsten, H., Heinrich, G., Schmidt, R. W. H., and Schurath, U.: A novel ozone sensor for direct eddy flux measurements, J. Atmos. Chem., 14, 73–84, 1992.
Haagen-Smit, A. J. and Fox, M. M.: Photochemical ozone formation with hydrocarbons and automobile exhaust, J. Air Pollut. Control Assoc., 4, 105–108, 1954.
Hofzumahaus, A., Brauers, T., Aschmutat, U., Brandenburger, U., Dorn, H.-P., Hausmann, M., Heßling, F., Holland, C., Plass-Dulmer, C., Sedlacek, M., Weber, M., and Ehhalt, D. H.: Reply to comment by Lanzendorf et al. (1997), Geophys. Res. Lett., 24, 3039–3040, 1997.
Jordan, E. O. and Carlson: A. J., Ozone: Its bactericidal, physiologic and deodorizing action, J. Am. Medical. Assoc., 61, 1007–1012, 1913.
Kim, J.-G., Yousef, A. E., and Dave, S.: Application of ozone for enhancing the microbiological safety and quality of foods: a review, J. Food Prot., 62, 1071–1087, 1999.
Komhyr, W. D.: Electrochemical concentration cells for gas analysis, Ann. Geophys., 25, 203–210, 1969.
Keller-Rudek, H., Moortgat, G. K., Sander, R., and Sörensen, R.: The MPI-Mainz UV/VIS Spectral Atlas of Gaseous Molecules of Atmospheric Interest, Earth Syst. Sci. Data, 5, 365–373, https://doi.org/10.5194/essd-5-365-2013, 2013.
Lanzendorf, E. J., Hanisco, T. F., Donahue, N. M., and Wennberg, P. O.: Comment on: “The measurement of tropospheric OH radicals by laser-induced fluorescence spectroscopy during the POPCORN field campaign” by Hofzumashaus et al and “Intercomparison of tropopspheric OH radical measurements by multiple folder long-path laser absorption and laser-induced fluorescence” by Brauers et al., Geophys Res. Lett., 24, 3037–3038, 1997.
Lebout, H. K: Fifty years of ozonation at Nice, Advances in Chemistry, vol. 21, Ozone Chemistry and Technology, American Chemical Society, 450–452, 1959.
Monteith, J. L. and Unsworth, M. H.: Principles of Environmental Physics, Third Ed., AP, Amsterdam, 2008.
NIST: National Institute of Standards and Technology, NIST Chemistry WebBook, NIST Standard Reference Database Number 69, available at: http://webbook.nist.gov, last access: 2 April 2018.
Paur, R. J., Bass, A. M., Norris, J. E., and Buckley, T. J.: Standard reference photometer for the assay of ozone in calibration atmospheres, NISTIR 6369, Natl. Inst. of Stand. and Technol., Gaithersburg, Maryland, 2003.
Peleg, M.: The chemistry of ozone in the treatment of water, Water Res. 10, 361–365, 1976.
Pollmann, J., Ortega, J., and Helmig, D.: Analysis of Atmospheric Sesquiterpenes: Sampling losses and mitigation of ozone interference, Environ. Sci. Technol., 39, 9620–9629, 2005.
Regener, V. H.: Measurement of ozone with the chemiluminescent method, J. Geophys. Res., 69, 3795–3800, 1964.
Rice, R.: Applications of ozone for industrial wastewater treatment – a review, Ozone-Sci. Eng., 18, 477–515, 1996.
Ryer, A.: ILT Light Measurement Handbook. Newburyport: International Light, available at: http://www.intl-lighttech.com/services/ilt-light-measurement-handbook (last access: 26 June 2018), 1998.
Sillman, S.: The relation between ozone, NOx and hydrocarbons in urban and polluted rural environments, Atmos. Environ., 33, 1821–1845, 1999.
Spicer, C. W., Joseph, D. W., and Ollison, W. M.: A re-examination of ambient air ozone monitor interferences, J. Air Waste Manage. Assoc., 60, 1353–1364, 2010.
Stone, K., Tully, M. B., Rhodes, S. K., and Schofield, R.: A new Dobson Umkehr ozone profile retrieval method optimising information content and resolution, Atmos. Meas. Tech., 8, 1043–1053, https://doi.org/10.5194/amt-8-1043-2015, 2015.
Tetens, O.: Über einige meteorologische Begriffe, Z. Geophys., 6, 207–309, 1930.
Turnipseed, A. A., Andersen, P. C., Williford, C. J., Ennis, C. A., and Birks, J. W.: Use of a heated graphite scrubber as a means of reducing interferences in UV-absorbance measurements of atmospheric ozone, Atmos. Meas. Tech., 10, 2253–2269, https://doi.org/10.5194/amt-10-2253-2017, 2017.
U.S.-EPA: Transfer Standards for Calibration of Air Monitoring Analyzers for Ozone, Ozone Transfer Guidance Document 10/2013, Publication No. EPA-454/B-13-004, Office of Air Quality Planning Standards, Air Quality Assessment Division, Research Triangle Park, North Carolina, October 2013, available at: https://www3.epa.gov/ttn/amtic/files/ambient/qaqc/OzoneTransferStandardGuidance.pdf, (last access: 2 April 2018), 2013.
U.S.-EPA: Criteria Air Pollutants, available at: https://www.epa.gov/criteria-air-pollutants, last access: 2 February 2018.
Wilson, K. L. and Birks, J. W.: Mechanism and elimination of a water vapor interference in the measurement of ozone by UV absorbance, Environ. Sci. Technol., 40, 6361–6367, 2006.
Wu, J., Luan, T., Lan, C., Lo, T. W. H., and Chan, G. Y. S.: Removal of residual pesticides on vegetable using ozonated water, Food. Contr., 18, 466–472, 2007.
Yee, L. D., Isaacman-VanWertz, G., Wernis, R. A., Meng, M., Rivera, V., Kreisberg, N. M., Hering, S. V., Bering, M. S., Glasius, M., Upshur, M. A., Gray Bé, A., Thomson, R. J., Geiger, F. M., Offenberg, J. H., Lewandowski, M., Kourtchev, I., Kalberer, M., de Sá, S., Martin, S. T., Alexander, M. L., Palm, B. B., Hu, W., Campuzano-Jost, P., Day, D. A., Jimenez, J. L., Liu, Y., McKinney, K. A., Artaxo, P., Viegas, J., Manzi, A., Oliveira, M. B., de Souza, R., Machado, L. A. T., Longo, K., and Goldstein, A. H.: Observations of sesquiterpenes and their oxidation products in central Amazonia during the wet and dry seasons, Atmos. Chem. Phys., 18, 10433–10457, https://doi.org/10.5194/acp-18-10433-2018, 2018.
Yoshino, K., Esmond, J. R., Cheung, A. S.-C., Freeman, D. E., and Parkinson, W. H.: High resolution absorption cross sections in the transmission window region of the Schumann-Runge bands and Herzberg continuum of O2, Planet. Space Sci., 40, 185–192, 1992.