the Creative Commons Attribution 4.0 License.
the Creative Commons Attribution 4.0 License.
 | 17 Aug 2018
Viscosity of erythritol and erythritol–water particles as a function of water activity: new results and an intercomparison of techniques for measuring the viscosity of particles
Yangxi Chu
Erin Evoy
Saeid Kamal
Young Chul Song
Jonathan P. Reid
Chak K. Chan
A previous study reported an uncertainty of up to 3 orders of magnitude for the viscosity of erythritol (1,2,3,4-butanetetrol)–water particles. To help reduce the uncertainty in the viscosity of these particles, we measured the diffusion coefficient of a large organic dye (rhodamine B isothiocyanate–dextran, average molecular weight ∼70000gmol-1) in an erythritol–water matrix as a function of water activity using rectangular-area fluorescence recovery after photobleaching (rFRAP). The diffusion coefficients were then converted to viscosities of erythritol–water particles using the Stokes–Einstein equation. In addition, we carried out new viscosity measurements of erythritol–water particles using aerosol optical tweezers. Based on the new experimental results and viscosities reported in the literature, we conclude the following: (1) the viscosity of pure erythritol is 184+122-73 Pa s (2 standard deviations); (2) the addition of a hydroxyl (OH) functional group to a linear C4 carbon backbone increases the viscosity on average by a factor of 27+6-5 (2 standard deviations); and (3) the increase in viscosity from the addition of one OH functional group to a linear C4 carbon backbone is not a strong function of the number of OH functional groups already present in the molecule up to the addition of three OH functional groups, but the increase in viscosity may be larger when the linear C4 carbon backbone already contains three OH functional groups. These results should help improve the understanding of the viscosity of secondary organic aerosol particles in the atmosphere. In addition, these results show that at water activity>0.4 the rFRAP technique, aerosol optical tweezers technique, and bead-mobility technique give results in reasonable agreement if the uncertainties in the measurements are considered. At water activity<0.4, the mean viscosity values determined by the optical tweezers technique were higher than those determined by the bead-mobility and rFRAP techniques by 1–2 orders of magnitude. Nevertheless, the disagreement in viscosity measured using multiple techniques reported in this paper is smaller than reported previously.
- Article
(2922 KB) - Full-text XML
-
Supplement
(331 KB) - BibTeX
- EndNote


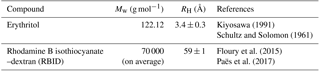
Table 1The molar masses (Mw) and hydrodynamic radii (RH) of erythritol and rhodamine B isothiocyanate–dextran (RBID), which are used as the matrix and diffusing fluorescent dye in this work, respectively.
Secondary organic aerosol (SOA) is produced by the oxidation of volatile organic compounds followed by the condensation of oxidation products (Hallquist et al., 2009). SOA contributes approximately 20 % to 70 % to the mass of fine aerosol particles, depending on location (Hallquist et al., 2009; Jimenez et al., 2009; Kanakidou et al., 2005; Zhang et al., 2007). Despite the abundance of SOA in the atmosphere, some physical and chemical properties of SOA remain poorly understood. An example is the diffusion of organic molecules within SOA particles (Cappa and Wilson, 2011; Mikhailov et al., 2009; Perraud et al., 2012; Reid et al., 2018; Vaden et al., 2011). Diffusion rates of organic molecules in SOA have implications for predicting the size and mass distribution of SOA particles (Lu et al., 2014; Saleh et al., 2013; Shiraiwa and Seinfeld, 2012; Zaveri et al., 2014, 2018). Diffusion rates of molecules in SOA also influence reaction rates (Berkemeier et al., 2016; Chu and Chan, 2017a, b; Gatzsche et al., 2017; Hinks et al., 2016; Houle et al., 2015; Kuwata and Martin, 2012; Li et al., 2015; Lignell et al., 2014; Liu et al., 2018; Steimer et al., 2015; Wang et al., 2015; Wong et al., 2015; Zhou et al., 2012), the long-range transport of pollutants (Bastelberger et al., 2017; Shrivastava et al., 2017; Zelenyuk et al., 2012), and optical properties of SOA particles (Adler et al., 2013; Robinson et al., 2014). Diffusion may also have implications for the ice-nucleating ability of SOA (Bodsworth et al., 2010; Ignatius et al., 2016; Ladino et al., 2014; Murray and Bertram, 2008; Schill et al., 2014; Wilson et al., 2012).
Diffusion limitations in SOA have been investigated through aerosol population mixing experiments, aerosol size change, and other approaches (Cappa and Wilson, 2011; Gorkowski et al., 2017; Liu et al., 2016; Perraud et al., 2012; Ye et al., 2016, 2018; Zaveri et al., 2018). In addition, researchers have used measurements of SOA viscosity together with the Stokes–Einstein equation to estimate diffusion rates of organics within SOA. The Stokes–Einstein equation is as follows:
where D is the diffusion coefficient (m2 s−1), kB is the Boltzmann constant (1.38×10⁻²³ J K−1), T is the temperature (K), η is the matrix viscosity (Pa s), and RH is the hydrodynamic radius (m) of the diffusing species.
Researchers have investigated the viscosity of SOA in the atmosphere (Bateman et al., 2016, 2017; O'Brien et al., 2014; Pajunoja et al., 2016; Virtanen et al., 2010), the viscosity of SOA material generated in environmental chambers (Grayson et al., 2016; Pajunoja et al., 2014; Renbaum-Wolff et al., 2013; M. Song et al., 2015, 2016; Virtanen et al., 2011), the viscosity of compounds identified in SOA particles (Abramson et al., 2013; Bateman et al., 2015; Hosny et al., 2016), and the viscosity of simple proxies of SOA material (Marshall et al., 2016; Power et al., 2013). In addition, researchers have investigated the dependence of viscosity on molar mass and the number and type of functional groups (Grayson et al., 2017; Rothfuss and Petters, 2017; Y. C. Song et al., 2016). For example, Grayson et al. (2017) investigated the dependence of viscosity on the number of hydroxyl (OH) functional groups on a carbon backbone and found that viscosity increased, on average, by a factor of 22–45 following the addition of an OH functional group to linear C3, linear C4, branched C5, and linear C6 carbon backbones. However, the study by Grayson et al. (2017) revealed a large discrepancy between the viscosity of erythritol (1,2,3,4-butanetetrol) measured with the bead-mobility technique (Grayson et al., 2017) and measured with the aerosol optical tweezers technique (Y. C. Song et al., 2016) at ≤25 % relative humidity (RH). This led to uncertainties when predicting the effect of adding OH functional groups to a linear C4 carbon backbone on viscosity. This also led to uncertainties regarding the viscosity of tetrols, which have been observed in ambient SOA particles and SOA particles generated in environmental chambers (Claeys, 2004; Edney et al., 2005; Surratt et al., 2006, 2010). An important formation pathway for tetrols is the hydrolysis of isoprene epoxidiol (IEPOX). IEPOX has been identified as a key intermediate during the oxidation of isoprene, an SOA precursor (Guenther et al., 2006; Surratt et al., 2010).
To help reduce the uncertainty in the viscosity of erythritol–water particles, we measured the diffusion coefficients of a large organic dye (rhodamine B isothiocyanate–dextran, referred to as RBID in the following; average molecular weight ∼70000gmol-1) in erythritol–water matrices as a function of water activity (aw) using the rectangular-area fluorescence recovery after photobleaching (rFRAP) technique (Deschout et al., 2010). The diffusion coefficients were then converted to viscosities using the Stokes–Einstein equation (Eq. 1). RBID has a hydrodynamic radius that is more than 16 times larger than that of erythritol (Table 1 and Fig. 1). We assume that the viscosity of an erythritol–water particle can be accurately calculated from the diffusion coefficient of RBID and the Stokes–Einstein equation, since the Stokes–Einstein equation accurately predicts diffusion coefficients when the diffusing molecules are large in size relative to the matrix molecules and when the matrix viscosity is comparable to or less than 104 Pa s (Chenyakin et al., 2017; Price et al., 2016), which is the case for erythritol–water particles (Grayson et al., 2017; Y. C. Song et al., 2016).
In addition to determining viscosities from the rFRAP diffusion measurements, we carried out new viscosity measurements for erythritol–water particles at aw<0.1 using the aerosol optical tweezers technique. The new viscosity results from the rFRAP and the aerosol optical tweezers measurements were then used to update our understanding of the viscosity of erythritol–water particles and the effect of adding OH functional groups to a linear C4 carbon backbone on viscosity. The new results also allowed us to perform an intercomparison between three techniques (rFRAP, aerosol optical tweezers, and bead mobility) used for measuring the viscosity of organic–water particles.
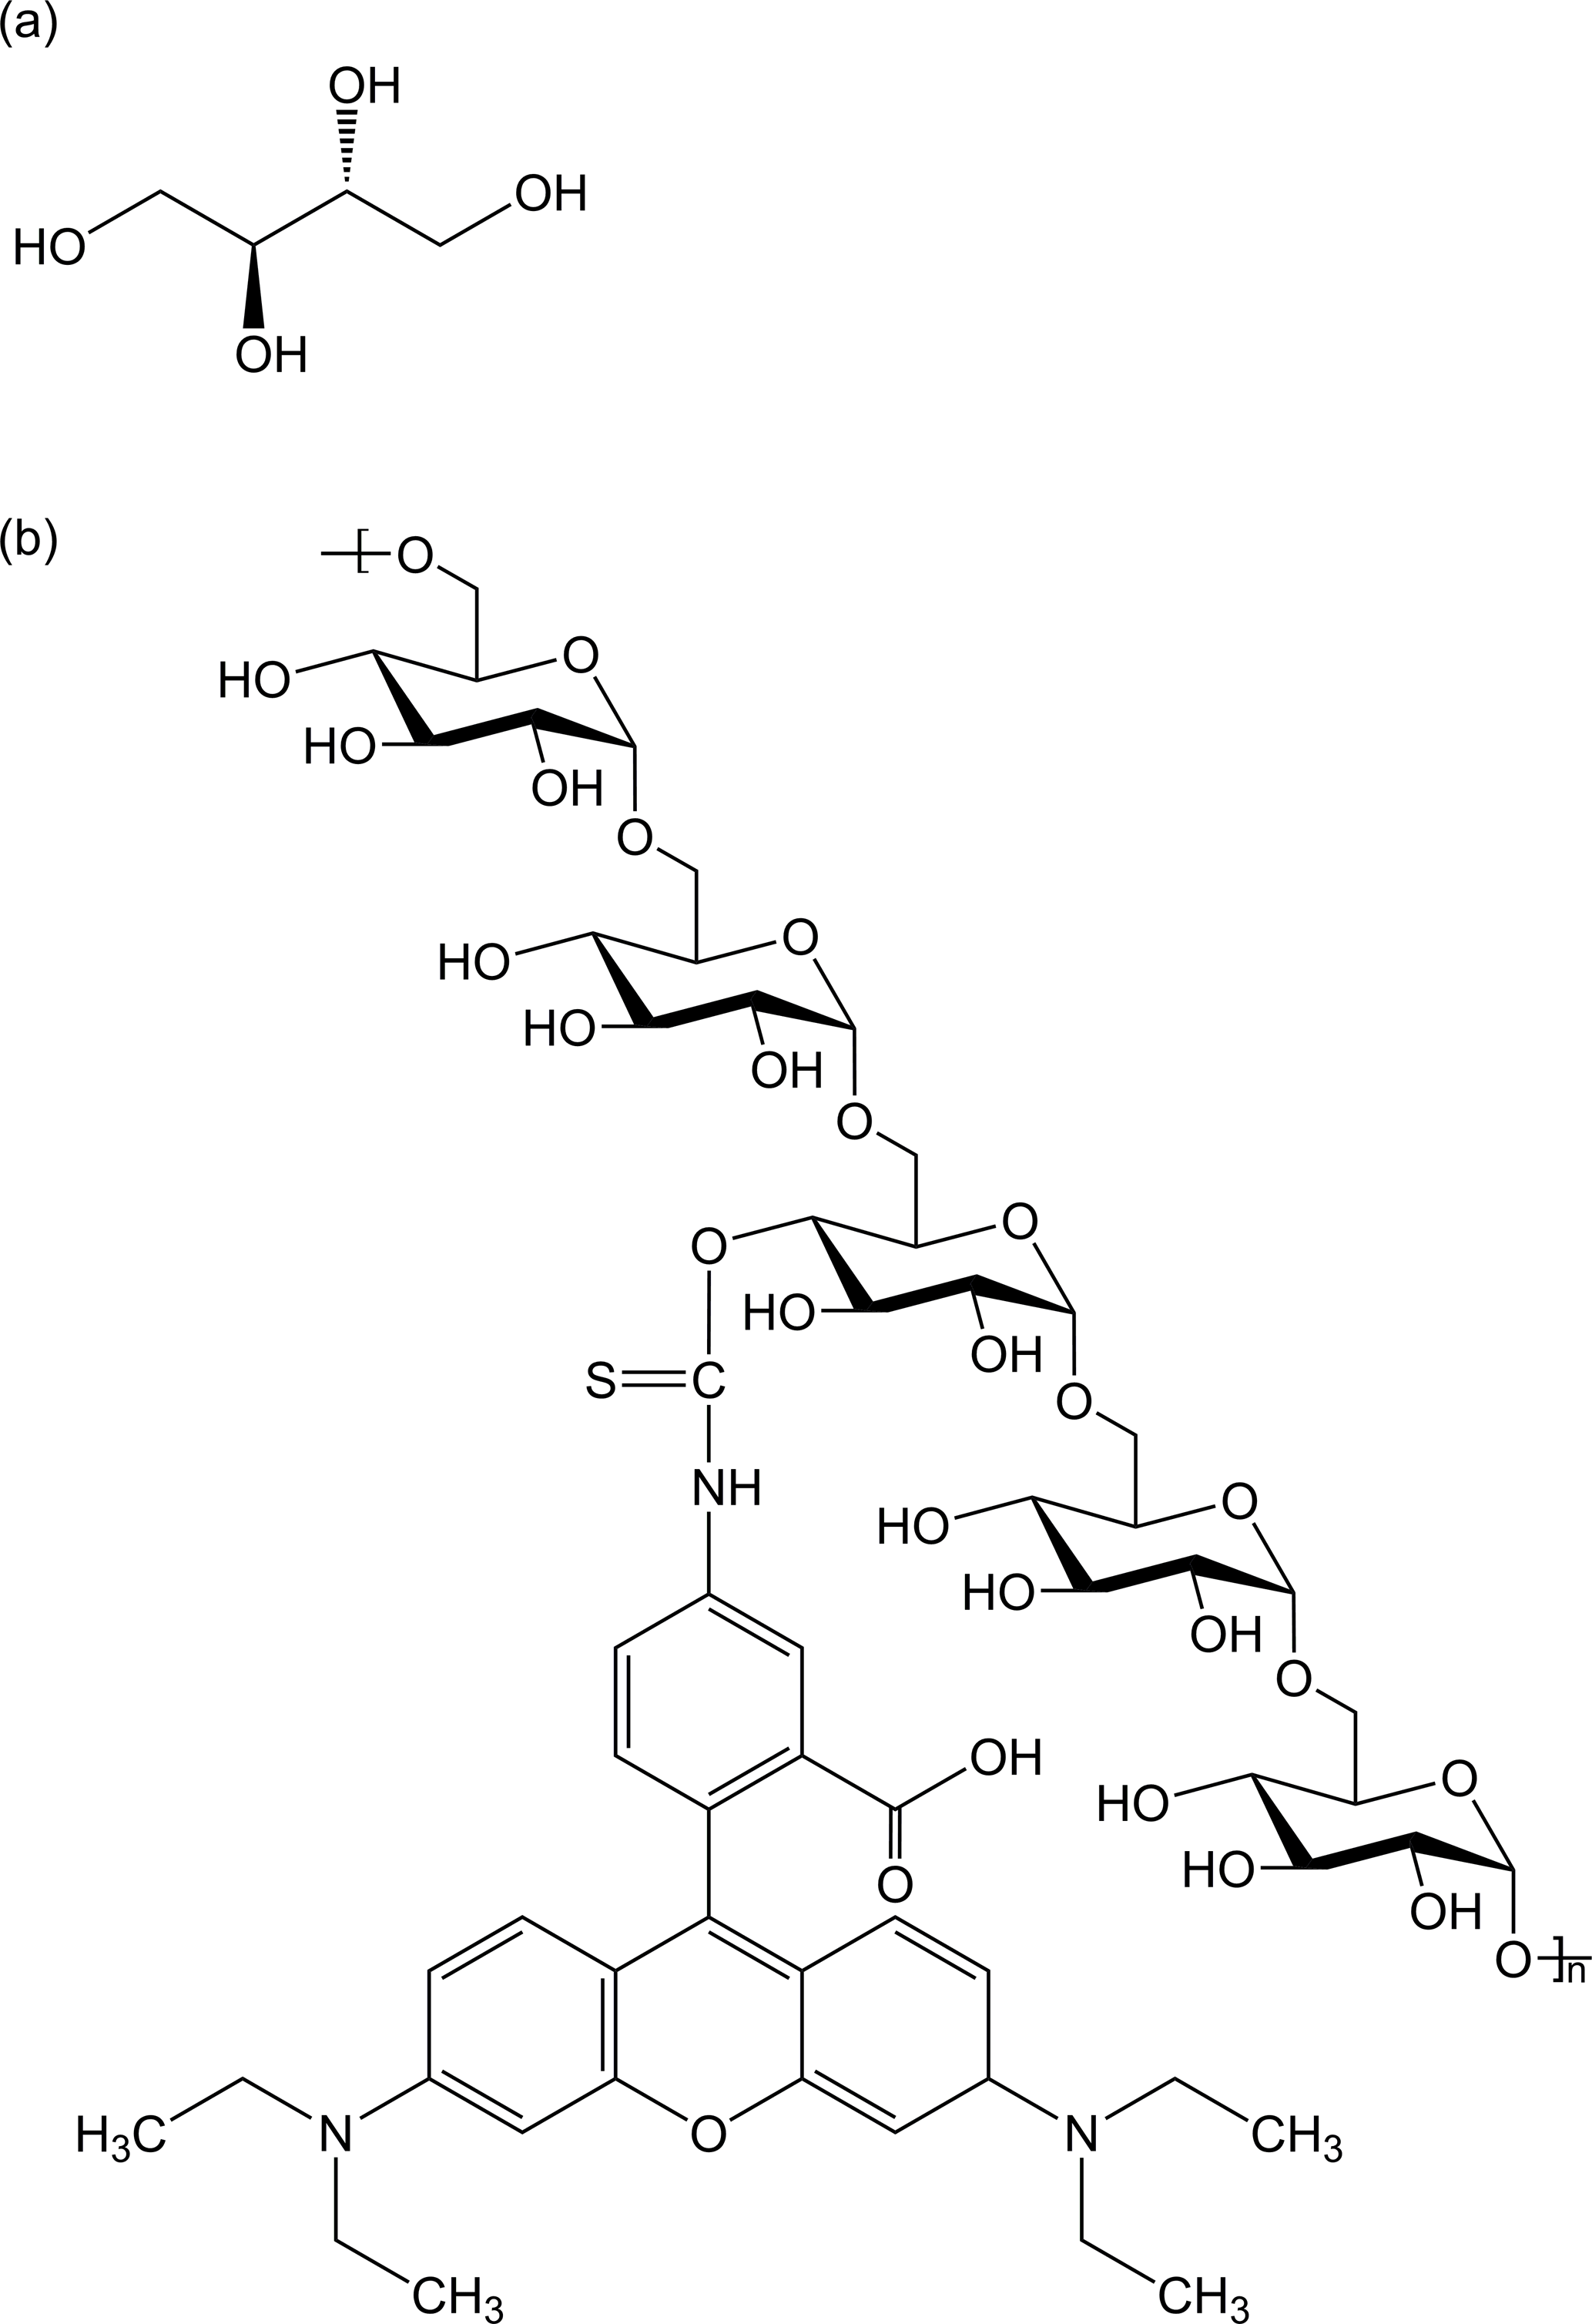
Figure 1Molecular structures of (a) erythritol and (b) rhodamine B isothiocyanate–dextran (RBID) in neutral form. On average, n≈429.
2.1 rFRAP
As mentioned above, the rFRAP technique was used to measure diffusion coefficients of RBID in erythritol–water matrices as a function of aw. The rFRAP experiments were similar to those described in Chenyakin et al. (2017). The current rFRAP experiments required thin films (30–50 µm thick) with a known aw, containing erythritol, water, and trace amounts of RBID. Section 2.1.1 describes the preparation of the thin films. Section 2.1.2 describes the rFRAP technique and the extraction of diffusion coefficients from the rFRAP data.
2.1.1 Preparation of thin films containing erythritol, water, and trace amounts of RBID with a known aw
The solubility of erythritol in water at 293 K is ∼38 wt % (Haynes, 2015), which corresponds to an aw≈0.92, based on Raoult's law and assuming erythritol does not dissociate in water (Koop et al., 2011). In our experiments, all thin films were conditioned at aw<0.92 and were therefore supersaturated with respect to crystalline erythritol. To prepare these supersaturated thin films, a bulk solution containing 20 wt % erythritol in water and 0.056 wt % (0.01 mmol L−1) RBID was prepared gravimetrically. The prepared bulk solution was then filtered using a 0.45 µm Millex®-HV syringe filter unit (Millipore Sigma Ltd., Etobikoe, ON, Canada) to eliminate solid impurities. Next, the solution was nebulized onto a siliconized hydrophobic glass slide (22×22 mm, VWR, Radnor, PA, USA), which had been rinsed with Milli-Q® water (18.2 MΩ cm). This resulted in droplets with radii ranging from 100 to 185 µm on the hydrophobic glass slide. For most of the experiments, the slide holding the droplets was then transferred into a flow cell in an inflatable glove bag (Glas-Col, Terre Haute, IN, USA) for conditioning at a particular aw. For some of the experiments, the slide holding the droplets was placed in a sealed container above a saturated inorganic salt solution with a known aw. A handheld hygrometer (OMEGA, Norwalk, CT, USA) with an accuracy of ±2.5 % was used to measure the RH at the flow cell outlet and in the glove bag or above the bulk solutions. The aw was calculated from the measured RH (aw=RH(%)/100) (Seinfeld and Pandis, 2006). The time used for conditioning droplets ranged from 21.5 to 96 h. See Sect. S1 and Table S1 in the Supplement for details. After conditioning the droplets at a particular aw, thin films were formed by placing a second hydrophobic glass slide on top of the original glass slide supporting the droplets. A pair of aluminum spacers, with a thickness of 30–50 µm, were placed between the two slides to control the thickness of the thin films. A seal was formed between the two slides by lining the perimeter of one slide with high-vacuum grease prior to sandwiching the droplets. Figure S1 in the Supplement shows a schematic of the thin films used in the rFRAP experiment. The process of creating the thin films was carried out inside the inflated glove bag, to prevent the sample from being exposed to the uncontrolled RH in the room. After conditioning the droplets to a known aw and creating the thin films, the concentration of RBID in the thin films ranged from 0.2 to 0.3 wt %. At this concentration, the fluorescence intensity of the thin films was proportional to the RBID concentration (Sect. S2 and Fig. S2 in the Supplement).
Even though all thin films were supersaturated with respect to crystalline erythritol, crystallization was not observed, likely because (1) the bulk solution was filtered to remove impurities and (2) the glass slides were highly hydrophobic, which reduced the possibility of heterogeneous nucleation of organic crystals (Bodsworth et al., 2010; Pant et al., 2004, 2006; Wheeler and Bertram, 2012; Yeung et al., 2009).
2.1.2 rFRAP technique and data extraction
In the rFRAP experiments, a confocal laser scanning microscope was used to photobleach RBID molecules in a small volume of the thin film. The photobleaching process occurs as follows. First, RBID molecules in the ground state absorb photons generated by the 543 nm laser and undergo an electronic transition from the ground state to the excited singlet state. Next, these excited molecules can either relax to the ground state via the emission of a photon (this process is fluorescence, which does not result in photobleaching) or undergo intersystem crossing from the excited singlet state to the excited triplet state. In the excited singlet or triplet state, RBID molecules may react with molecular oxygen, resulting in permanent destruction of the fluorophore (Song et al., 1995; Widengren and Rigler, 1996). After photobleaching, a gradual recovery of fluorescence within the photobleached region occurred due to the diffusion of unbleached fluorescent molecules from outside the bleached region into the bleached region. The diffusion coefficient of the fluorescent dye was determined by monitoring the time-dependent recovery of the fluorescence intensity using the same confocal laser scanning microscope used for photobleaching.
In this work, a Zeiss LSM510 confocal laser scanning microscope with a 10× objective and 0.30 numerical aperture was used. The pinhole was set at 120 µm. Photobleaching was performed using a helium–neon laser with an emission wavelength of 543 nm, at a power of 330 µW. The photobleached area ranged from 3×3 to 6×6 µm2. The bleach parameters, including the number of iterations and scanning speed of the laser, were adjusted to obtain a reduction in fluorescence intensity of ∼30 % in the bleached region, as recommended by Deschout et al. (2010). After photobleaching, images were taken using the same laser at a power of 4 µW, at time intervals ranging from 2 to 30 s, depending on the speed of recovery of the fluorescence signal, with longer intervals used when the fluorescence recovery was slower. All experiments were performed at room temperature (292–294 K).
Figure 2 shows an example of a series of images recorded during an rFRAP experiment. All of the images recorded after photobleaching were normalized against an image captured prior to photobleaching, using ImageJ software. After normalization, the images were downsized from 512×512 pixels to 128×128 pixels by averaging pixels to reduce the level of noise (Chenyakin et al., 2017).
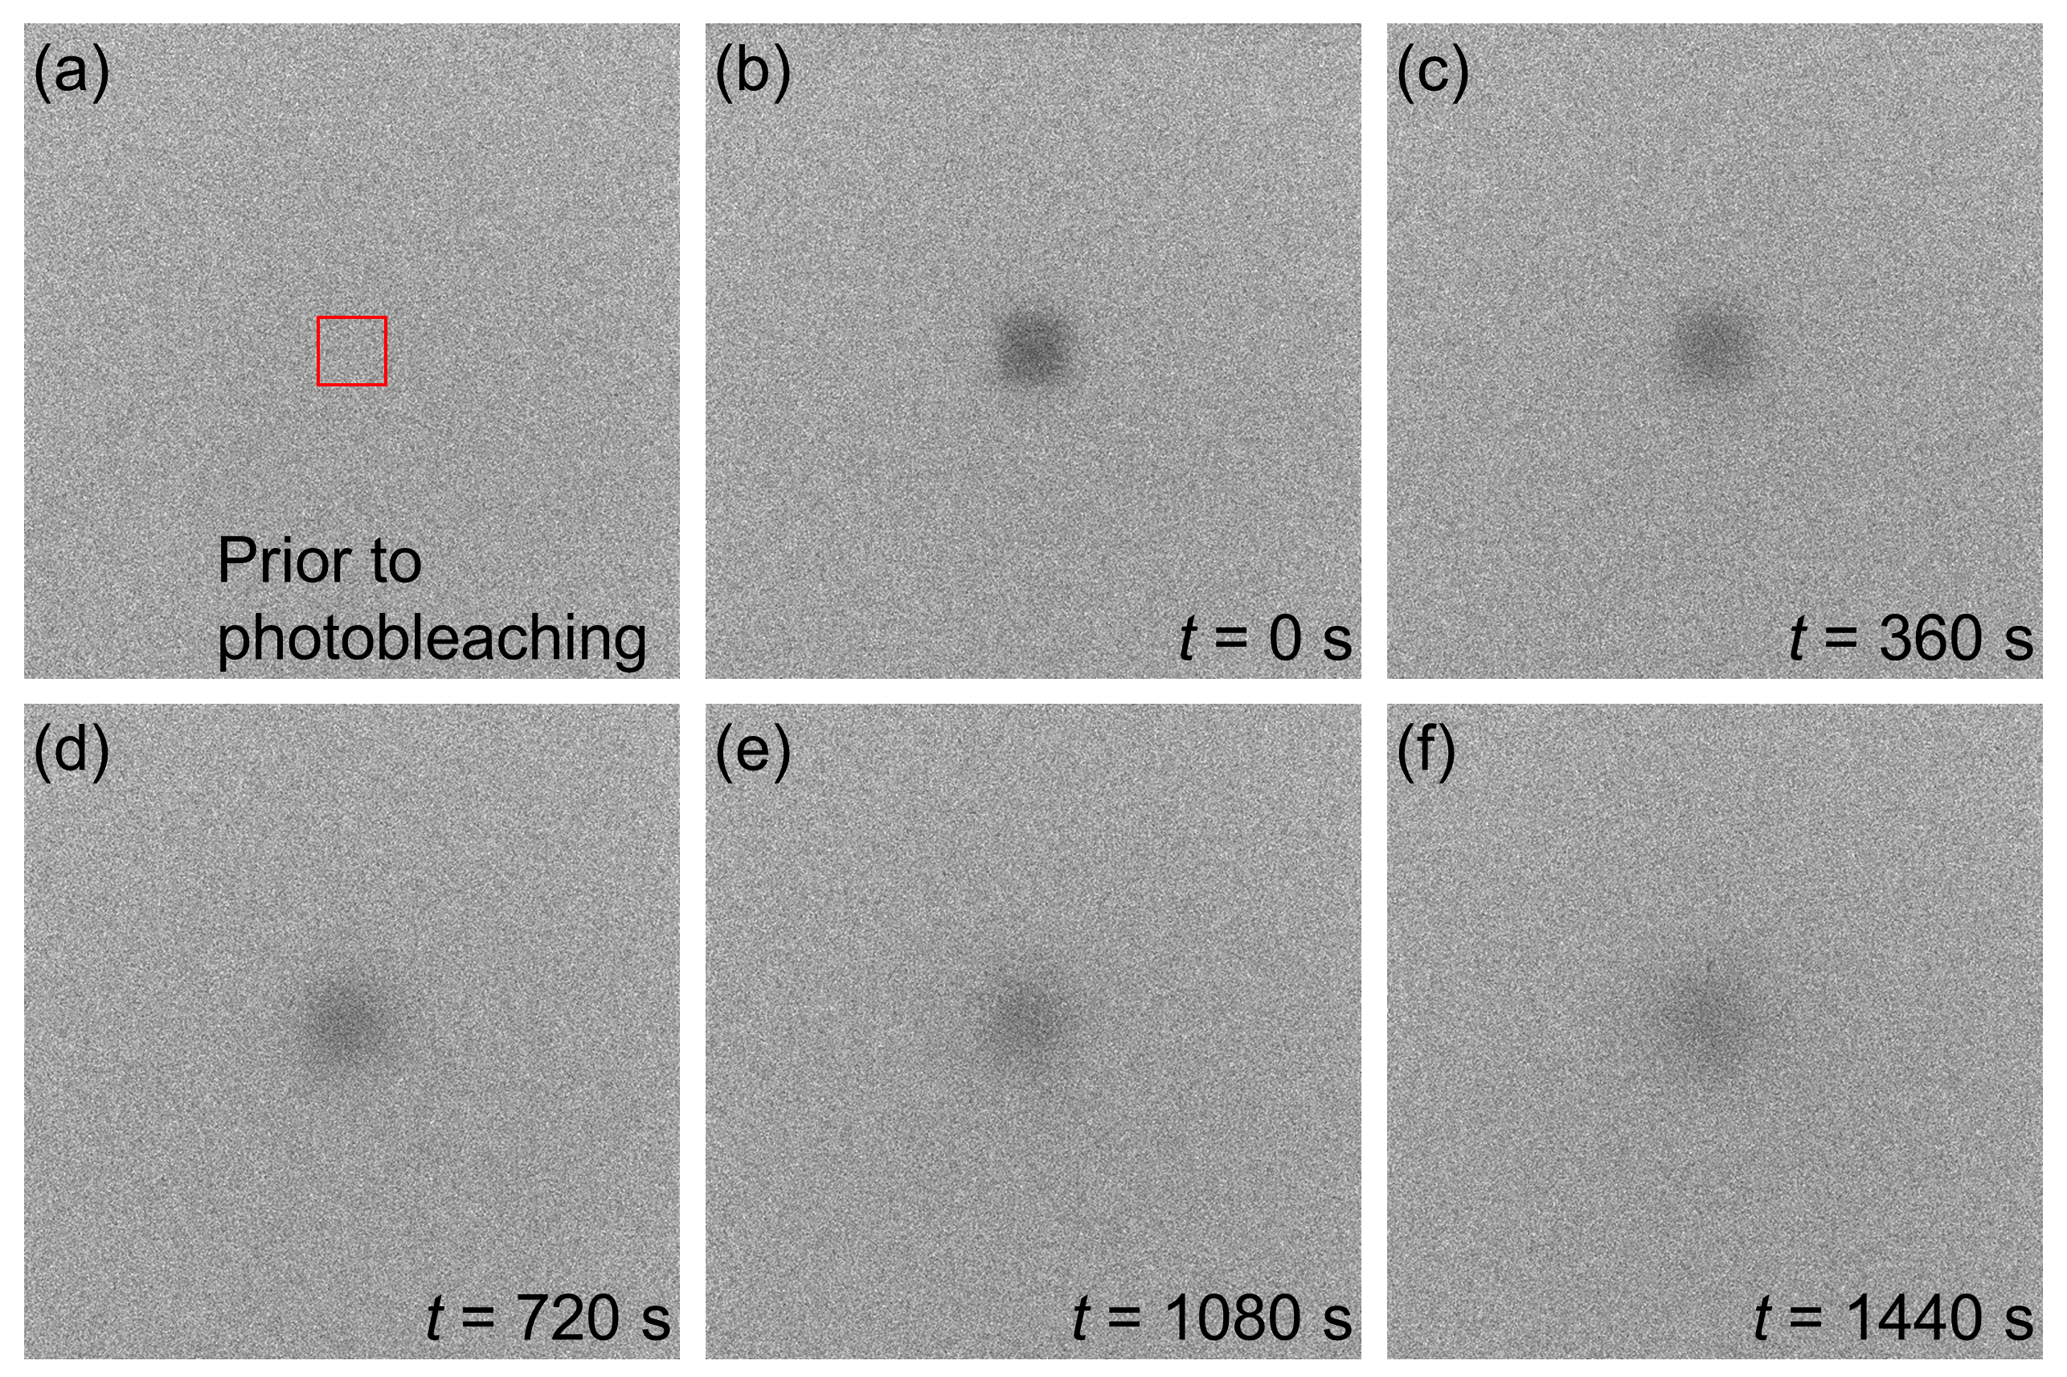
Figure 2Images captured during an rFRAP experiment for thin erythritol–water films conditioned at aw=0.023±0.023. RBID concentration in the films was approximately 0.3 wt %. The red square in (a) indicates the region selected for photobleaching. Images (b–f) were recorded at 0, 360, 720, 1080, and 1440 s after photobleaching. Dimensions of the images and the red square are 60×60 and 6×6 µm2, respectively.
The fluorescence intensity at position (x, y) and time t after photobleaching a rectangular area in a thin film can be described by the following equation (Deschout et al., 2010):
where F(x, y, t) is the fluorescence intensity at position (x, y) and time t after photobleaching, F0(x, y) is the fluorescence intensity at position (x, y) prior to photobleaching, lx and ly are the lengths of the rectangular photobleached area, K0 is related to the fraction of molecules photobleached in the bleach region, r is the resolution of the microscope, t is the time after photobleaching, and D is the diffusion coefficient of the fluorescent dye. B is a normalization constant, and “erf” is the error function.
Following the rFRAP experiments, individual images were fit to Eq. (2) using a Matlab script, with terms B and K0 left as free parameters. The combined term of r2+4 Dt was also left as a free parameter. Due to the normalization of images to a pre-bleached image, B returned a value close to 1, as expected. From Eq. (2), a value for the combined term r2+4 Dt was obtained for each image taken after photobleaching. Next, r2+4 Dt was plotted as a function of time after photobleaching, and a straight line was fit to the plotted data. An example plot of r2+4 Dt versus t and a linear fit to the data are shown in Fig. 3. Diffusion coefficients were determined from the slope of the fitted line. The diffusion coefficient at each aw reported in Sect. 3 is the average of at least four measurements.
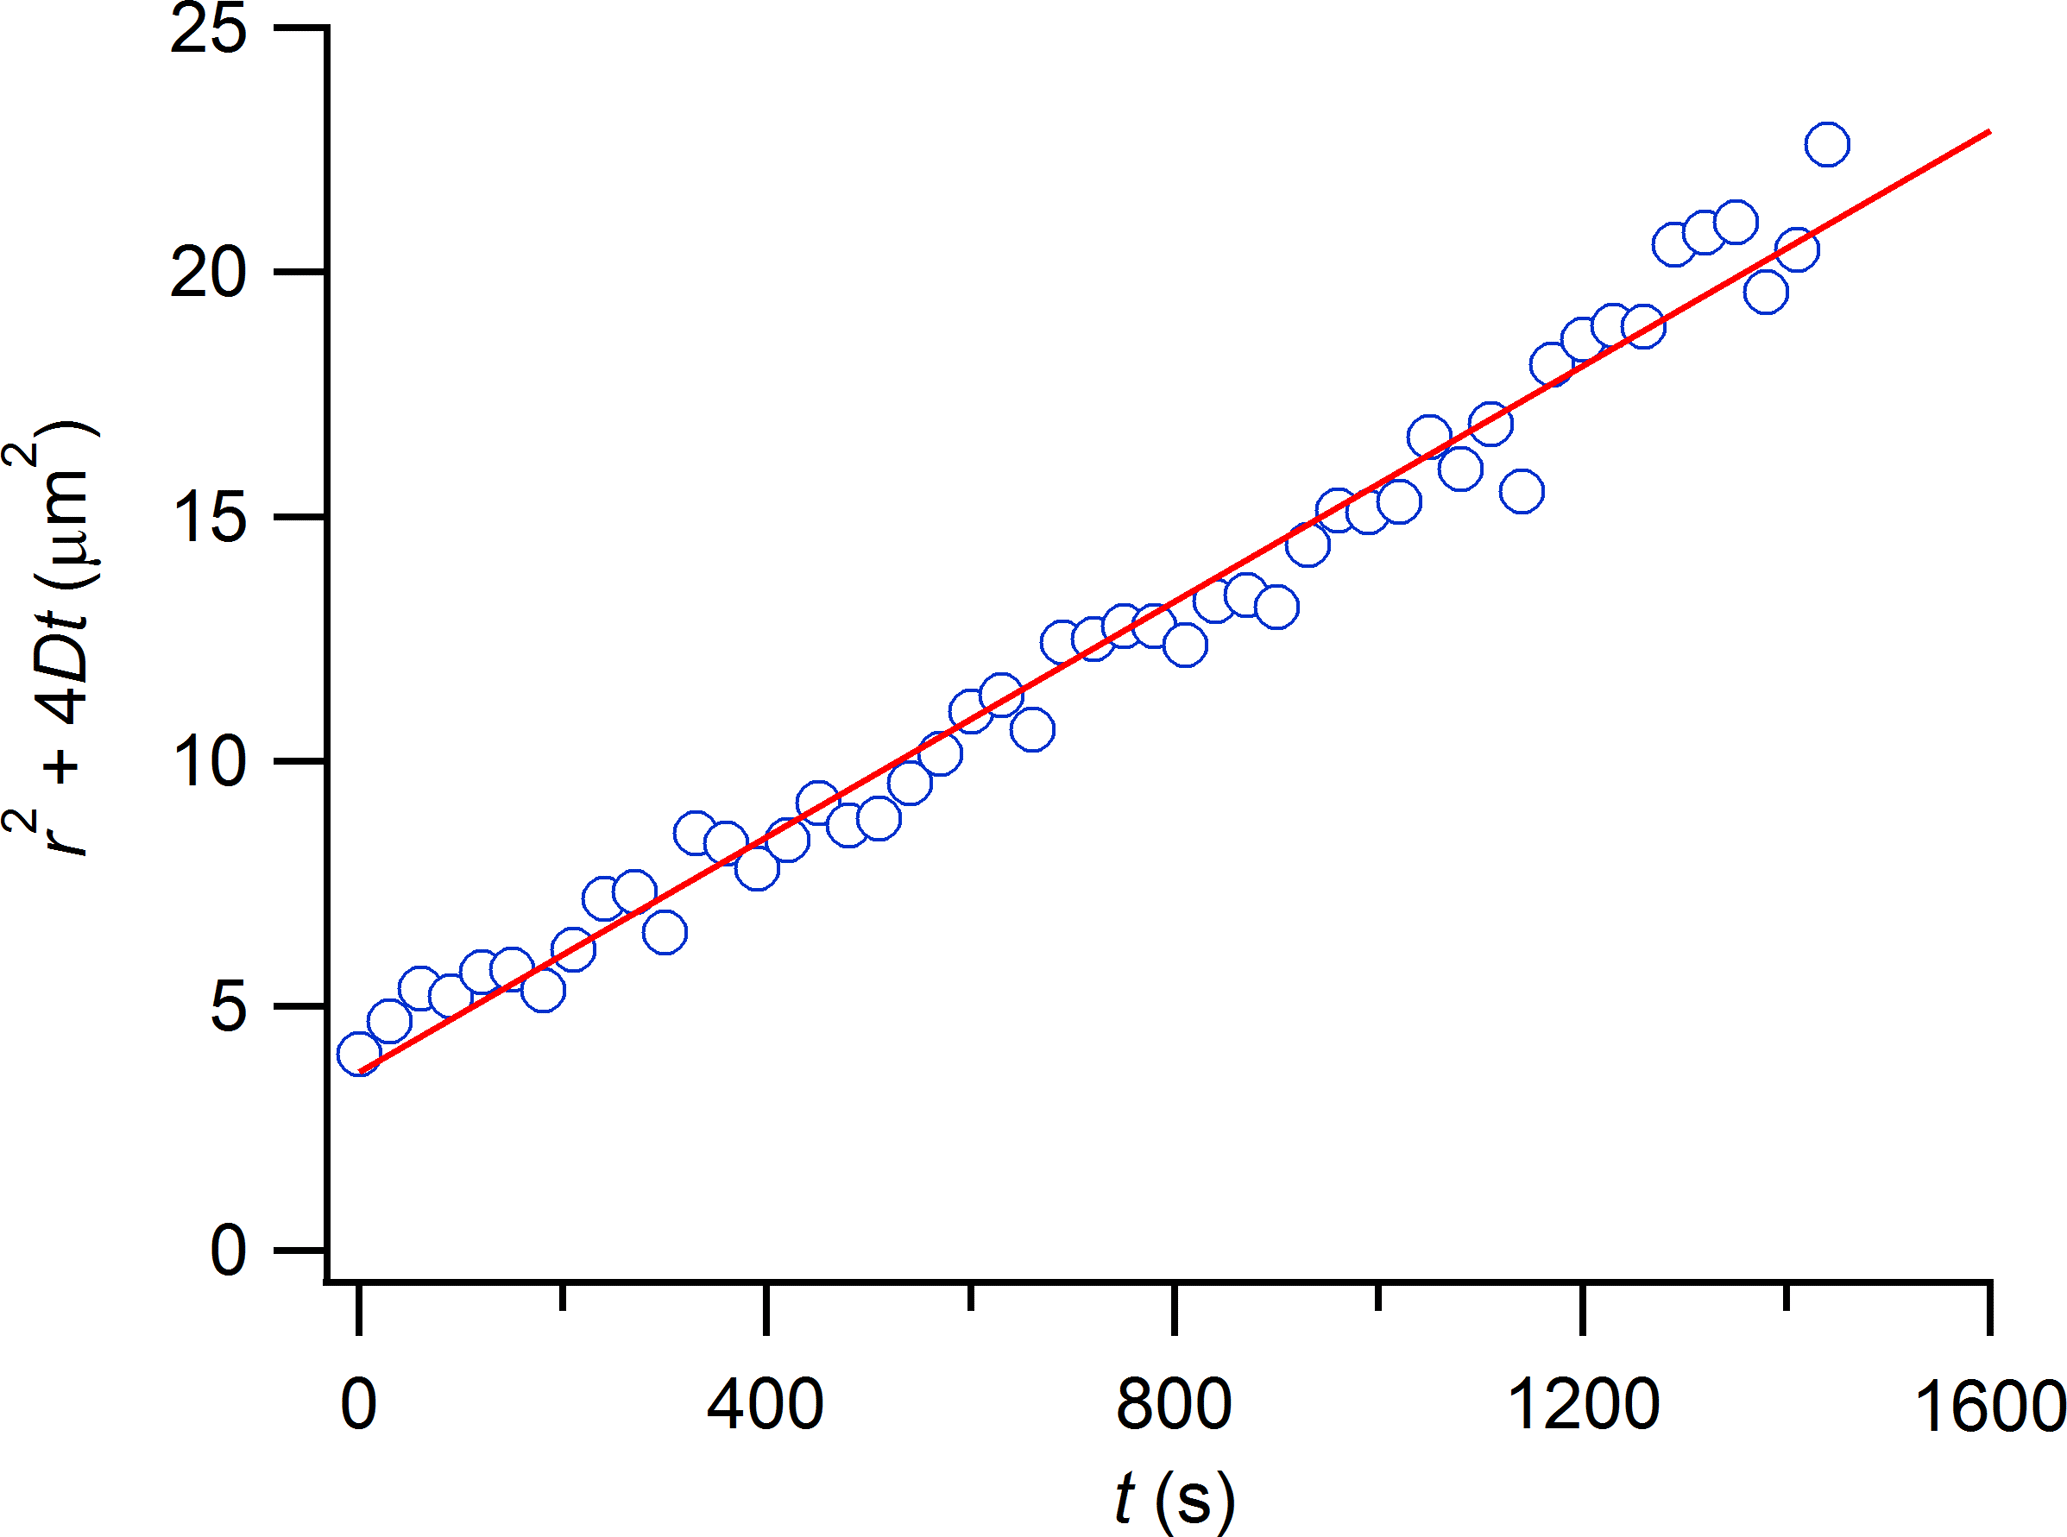
Figure 3r2+4 Dt as a function of t for the diffusion of RBID in erythritol–water matrix with aw=0.023±0.023. RBID concentration in the conditioned films was approximately 0.3 wt %. The red line represents a linear fit to the data.
Cross-sectional views of the fluorescence intensity along the x axis for different times after photobleaching are shown in Fig. 4. The cross sections for the measured intensities (blue dots) were generated by averaging the normalized fluorescence intensities (F∕F0) over the width of the photobleached region in the y direction, at each position x. Calculated cross sections of the fluorescence intensities (red lines) were generated from fits of Eq. (2) to the experimental data. The close agreement between the measured and calculated cross sections illustrates that Eq. (2) describes our experimental data well.
Equation (2) was derived by assuming no diffusion in the axial direction (i.e., z direction). Deschout et al. (2010) have shown that Eq. (2) gives accurate diffusion coefficients when the numerical aperture of the microscope is low (≤0.45) and the thickness of the films is small (≤120 µm), consistent with the numerical aperture of 0.30 and film thickness of 30–50 µm used in our experiments. Equation (2) also assumes that the only mechanism for recovery in the photobleached region is diffusion. An additional possible mechanism is reversible photobleaching (or photoswitching), where the fluorescent molecules convert between a fluorescent and a non-fluorescent state without being permanently photobleached (Fukaminato, 2011; Long et al., 2011; Sinnecker et al., 2005). To determine if reversible photobleaching was responsible for the recovery of fluorescence in the photobleached region, experiments with small droplets (10–30 µm in diameter) containing erythritol, water, and trace amounts of RBID (approximately 0.3 wt %) were carried out. In these experiments, we uniformly photobleached the entire droplet, resulting in ∼30 % reduction in fluorescence intensity. Uniform bleaching ensures that the diffusion of fluorescent RBID molecules will not result in a change in fluorescence intensity. After bleaching, the average fluorescence intensity of the entire droplet was monitored over time, as shown in Fig. S3 in the Supplement. The fluorescence intensity remained constant within the uncertainty of the measurements, indicating that reversible photobleaching was not an important mechanism in our rFRAP experiments.
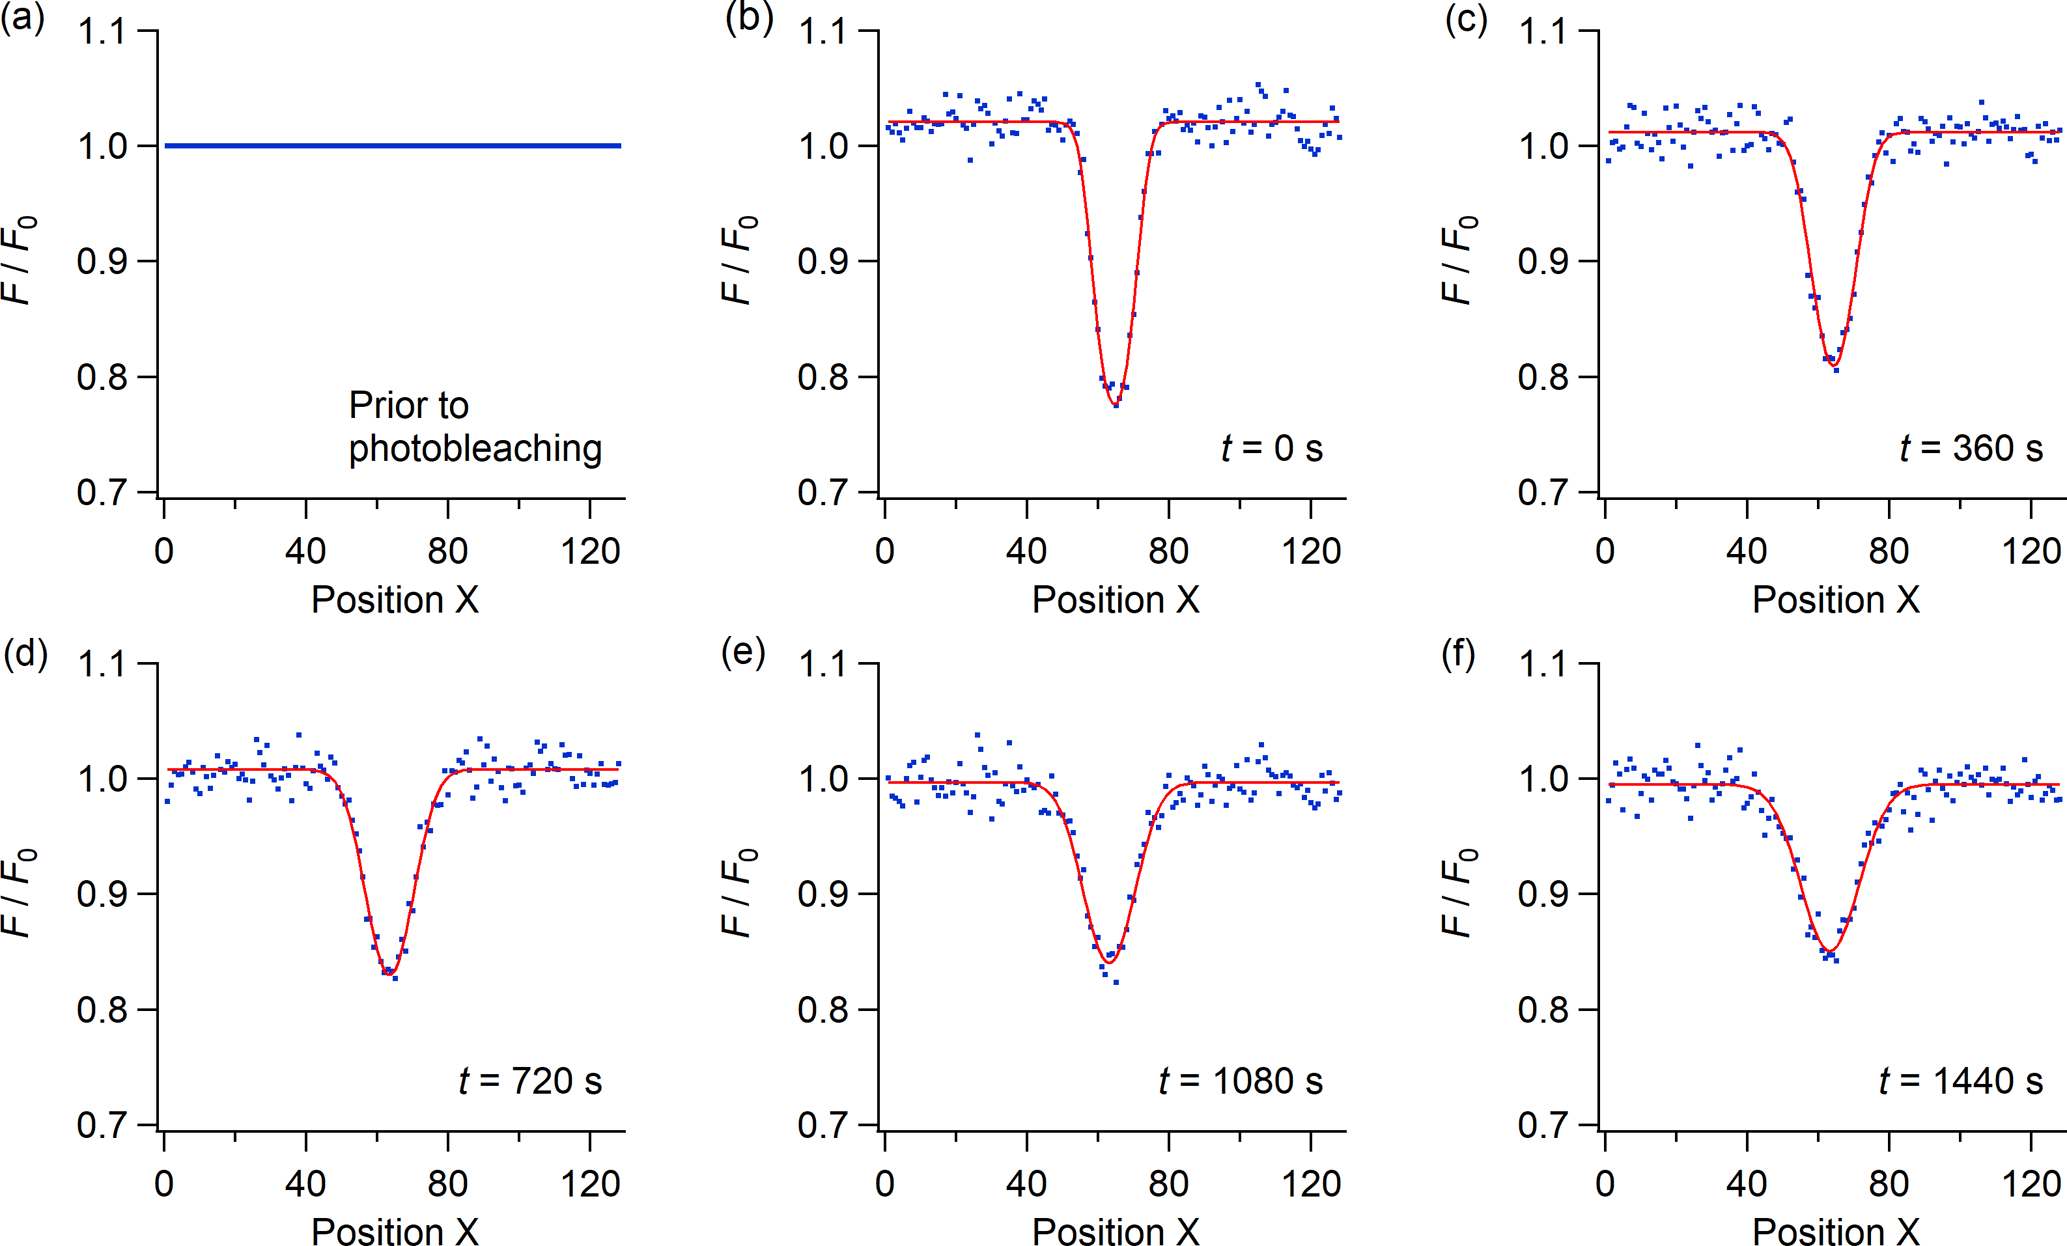
Figure 4Cross-sectional view of the normalized fluorescence intensities (F∕F0) along the x axis during an rFRAP experiment. Blue dots correspond to the measured data, while the red lines represent fits to the experimental data using Eq. (2). The sample films were conditioned at aw=0.023±0.023. RBID concentration in the conditioned films was approximately 0.3 wt % . Panel (a) shows the cross section prior to photobleaching. F∕F0 equals 1 because the image was normalized against itself. Panels (b–f) show the cross sections at 0, 360, 720, 1080, and 1440 s after photobleaching, corresponding to frames (b–f) in Fig. 2.
2.2 Aerosol optical tweezers
The application of the aerosol optical tweezers technique to measure the viscosity of aerosol particles has been discussed in detail in previous publications (Bzdek et al., 2016; Y. C. Song et al., 2016) and will only be briefly reviewed here. Two optical traps are formed using a holographic optical tweezers instrument equipped with a laser at 532 nm (Laser Quantum Opus 3W). The holographic arrangement uses a spatial light modulator (Hamamatsu, X10468) to encode phase information into the expanded laser-light wavefront, creating an interference pattern in the trapping plane that resembles two tightly focused beams. Aerosol droplets are captured from a cloud of aerosol generated from a medical nebulizer and introduced into a RH-controlled trapping cell with the RH recorded by a capacitance probe (Honeywell, HIH-4202A). Typical particle diameters are 9–16 µm. Experiments were performed at room temperature of 293 K. Droplet sizes and refractive indices are inferred from the discrete wavelengths commensurate with whispering gallery modes (WGMs) that are observed in the Raman scattering fingerprints recorded from the two droplets. Particle size and refractive index are estimated from comparison with calculated WGM wavelengths using Mie scattering theory and can be determined with an accuracy of <±2nm and <±0.0005, respectively (Preston and Reid, 2013).
Following a conditioning period of many hours, identified by a steady droplet size over a period of tens of minutes, the particles are coalesced by manipulating the optical trap positions. Once brought into contact, the shape of the composite particle relaxes over a timescale of microseconds to hours, dependent on the viscosity. One of three methods is then chosen to infer particle viscosity from the shape relaxation based on the relaxation timescale:
-
For relaxation timescales of <1 ms (equivalent to viscosities <10 Pa s) (Power and Reid, 2014), the time dependence of the backscattered light intensity can be used to monitor the change in shape using a silicon photodetector (Thorlabs, DET 110) and oscilloscope (LeCroy, HDO 6034-MS). At timescales longer than this, the movement of the trapped particle relative to the laser beam focus (i.e., the relaxation in trapped position) contributes to the change in light-scattering signal and becomes convoluted with the change arising from the relaxation in shape. Thus, light-scattering measurements cannot be used for viscosities >10 Pa s (Bzdek et al., 2016).
-
For longer timescales, the relaxation in shape can be directly viewed from bright-field microscopy over a period spanning from 5–10 ms (equivalent to viscosities >10 Pa s) to as long as 103 s (equivalent to viscosities ∼107 Pa s) (Bzdek et al., 2016). Images are recorded by a camera (Dalsa Genie HM 640, CMOS) with 5–10 ms time resolution. The change in aspect ratio for the relaxing particle is determined and used to determine the relaxation time constant (Y. C. Song et al., 2016).
-
The disappearance followed by the reappearance of WGMs from the Raman spectrum from the coalesced dimer (recorded with 1 s time resolution) can be used to infer the slow disappearance of a spherical cavity on one side of the dimer and reemergence of a single spherical particle at the end of the relaxation process (Power et al., 2013). With a coarse time resolution of 1 s, this method should only be used to infer the viscosity when higher than 104 Pa s (Power and Reid, 2014).
With three analysis methods, the optical tweezers technique can measure a wide range of viscosities, from 10−3 to >109 Pa s. However, it should be noted that there are ranges where two techniques may overlap but have varying accuracy (e.g., bright-field imaging and Raman for viscosities 104–105 Pa s with relaxation times of 1–10 s).
3.1 Diffusion coefficients in and viscosities of erythritol–water particles as functions of aw measured by the rFRAP technique
Shown in Fig. 5a and listed in Table S2 (Supplement) are the measured diffusion coefficients of RBID in erythritol–water matrices as a function of aw. The diffusion coefficient decreased by 2–3 orders of magnitude as aw decreased from approximately 0.5 to 0. This decrease in the diffusion coefficients with a decrease in aw is due to the plasticizing effect of water (Koop et al., 2011; Power et al., 2013).
The Stokes–Einstein equation and measured diffusion coefficients were used to calculate the viscosity of erythritol–water particles. It has been found that the Stokes–Einstein equation significantly underestimates the diffusion coefficients of small molecules such as water and ozone within a matrix containing larger molecules (Bastelberger et al., 2017; Davies and Wilson, 2016; Li et al., 2015; Marshall et al., 2016; Price et al., 2014; Shiraiwa et al., 2011). On the other hand, as discussed in Sect. 1, the Stokes–Einstein equation gives accurate diffusion coefficients when the diffusing species is similar in size to or larger than the matrix molecules and when the viscosity of the matrix is comparable to or lower than 104 Pa s (Chenyakin et al., 2017; Price et al., 2016). Hence, in this study, we assume that the viscosity of erythritol–water particles can be accurately calculated using the measured RBID diffusion coefficient and the Stokes–Einstein equation, because RBID is much larger than the matrix molecules (Table 1) and the highest reported viscosity of erythritol in the literature is on the order of 104 Pa s (Grayson et al., 2017; Y. C. Song et al., 2016).
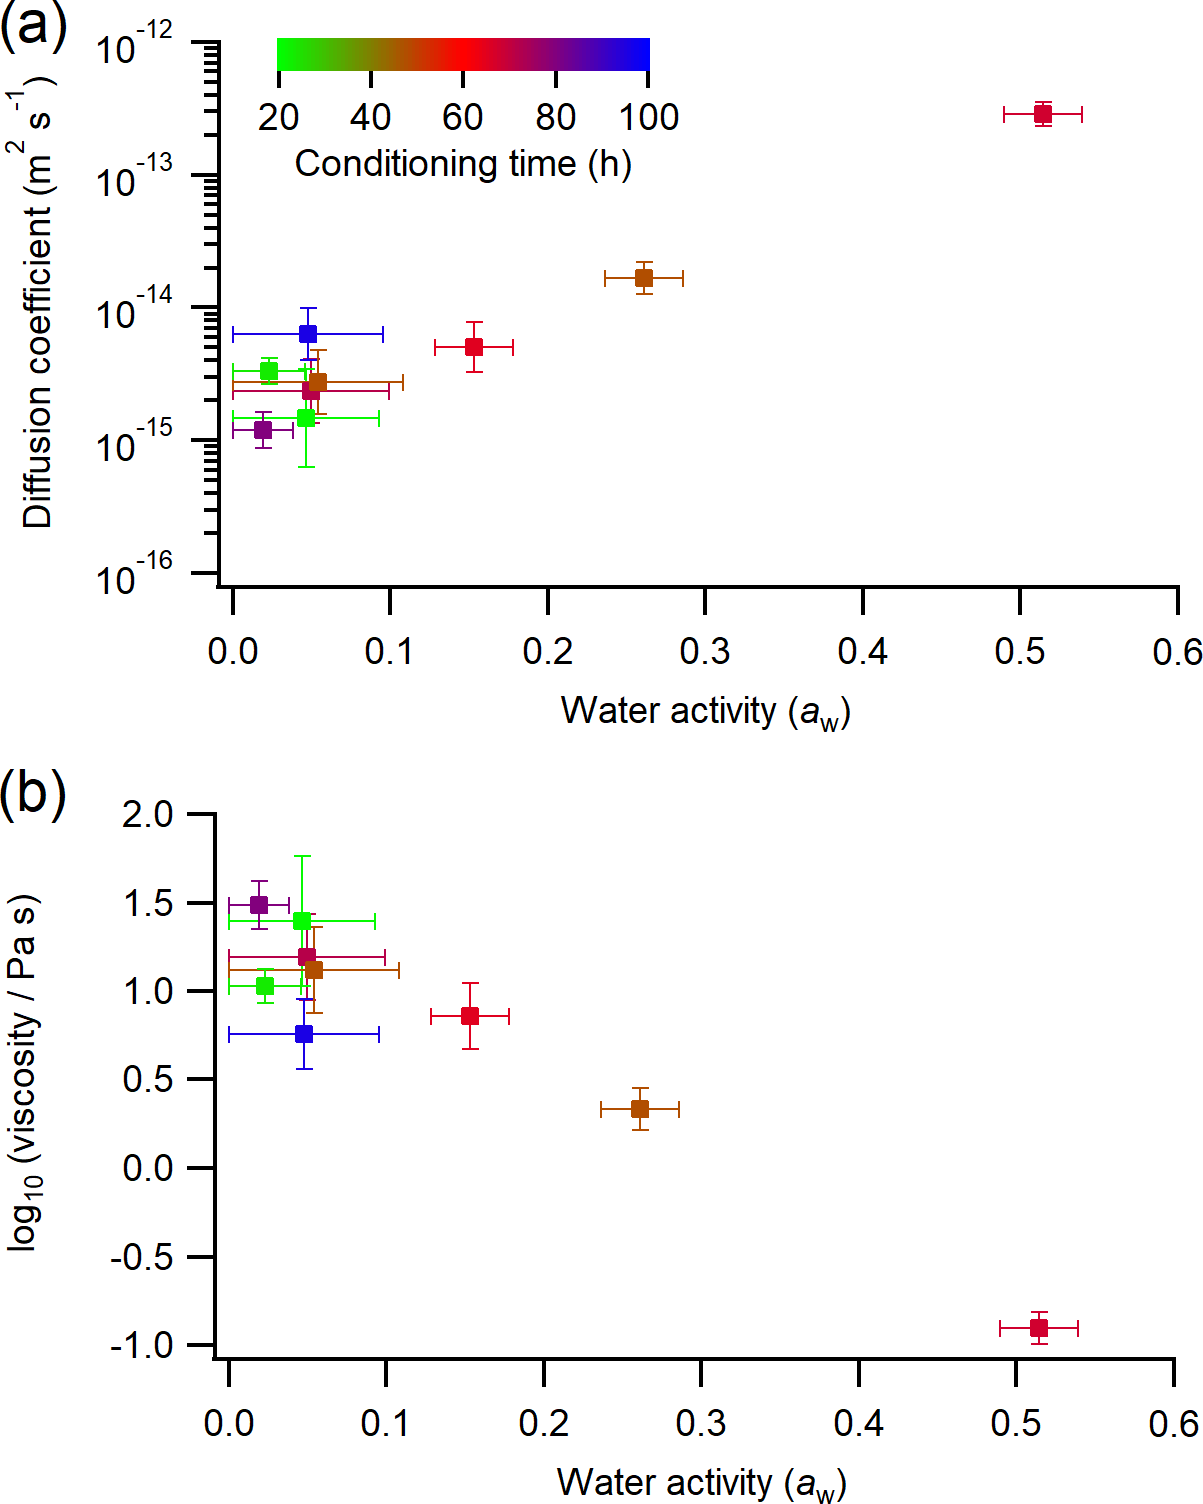
Figure 5(a) The measured diffusion coefficients of RBID as a function of aw. (b) The viscosity of erythritol–water particles as a function of aw based on the measured RBID diffusion coefficients and the Stokes–Einstein equation. Results from rFRAP measurements are color-coded by the sample conditioning time prior to the rFRAP experiments. The color scale applies to both panels. Horizontal error bars indicate the upper and lower limits of aw. Vertical error bars correspond to 2 standard deviations of diffusion coefficient (a) and log10(viscosity ∕ Pa s) (b).
Figure 5b and Table S2 show the viscosity of erythritol–water particles (calculated using diffusion coefficients from Fig. 5a and the Stokes–Einstein equation) as a function of aw. As aw decreased from approximately 0.5 to 0, the viscosity increased from approximately 1×10⁻¹ to 5×101 Pa s. The symbols in Fig. 5 are color-coded by the time allowed to condition the samples to a particular aw value before measuring the diffusion coefficient. The color scale in the top left corner applies to both panels (a, b). No clear trend is observed between the conditioning time and the diffusion coefficient or particle viscosity.
To further investigate the effect of the time used to condition the samples to a particular aw value, in Fig. 6 the measured RBID diffusion coefficients in erythritol–water matrices are plotted as a function of conditioning time at aw≤0.105. The data shown in Fig. 6 were taken from the data shown in Fig. 5a. Included as a secondary x axis is the sample conditioning time in multiples of τw, where τw is the characteristic time for water diffusion within the sample droplets used in the conditioning experiments (see Sect. S1 in the Supplement for details). Consistent with Fig. 5a, Fig. 6 illustrates that there is no clear trend between the diffusion coefficient and the time allowed for conditioning the samples prior to the diffusion measurements. Figure 6 also suggests that a sample conditioning time of ≥21.5 h, or ≥6.5 τw, was sufficient to reach near equilibrium between the RH used for conditioning and the aw in particles.
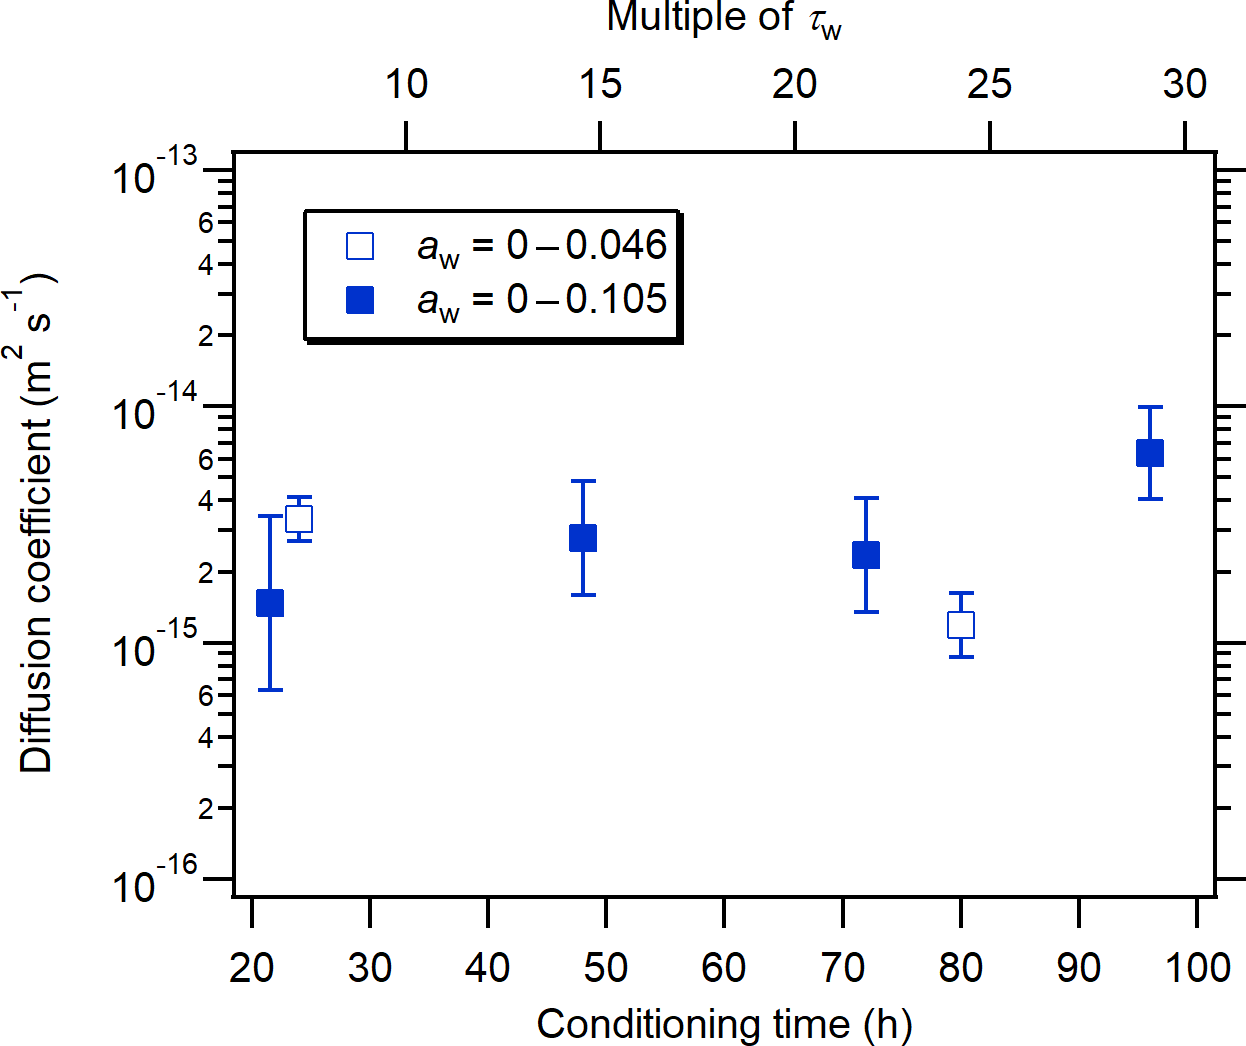
Figure 6The diffusion coefficient of RBID as a function of the time allowed for conditioning erythritol–water particles at aw=0–0.046 (open squares) and 0–0.105 (filled squares). The secondary (top) x axis represents the conditioning time expressed in multiples of τw (characteristic time for the diffusion of water molecules within the erythritol–water droplets). For the calculation of τw, the lower limit of aw (i.e., 0) was taken, leading to maximum τw values of 3.3 h for droplets with a radius of 100 µm. Error bars represent 2 standard deviations of RBID diffusion coefficients.
3.2 Viscosity of erythritol–water particles as a function of aw measured by the aerosol optical tweezers technique
Erythritol viscosity measurements using the aerosol optical tweezers technique are shown in Fig. 7. The viscosity of pure water at 293 K (Korson et al., 1969) is also included for comparison. The red circles represent the new aerosol optical tweezers measurements obtained in this work (also listed in Table S3 in the Supplement), based solely on bright-field images. The gray circles represent the viscosities reported in Y. C. Song et al. (2016). The new averaged viscosities reported here based on the aerosol optical tweezers technique are lower than those reported by Y. C. Song et al. (2016) at aw<0.1, although the error bars (representing 2 standard deviations) overlap.
In the previous aerosol optical tweezers measurements at aw<0.1 (Y. C. Song et al., 2016), the timescale for relaxation to a sphere was estimated from two methods: the change in coalesced particle shape as recorded by the bright-field images and the reappearance of WGMs in the Raman spectrum. Figure 8 shows an example of captured bright-field images as a function of time after the coalescence of two erythritol particles at aw=0.04±0.02. The relaxation to a spherical particle occurred within 56 ms, a timescale that is too short to be resolved by Raman spectral measurements (time resolution of 1 s; see Sect. 2.2). Therefore, previous erythritol viscosity measurements under dry conditions using the Raman spectral measurements (Y. C. Song et al., 2016) were compromised by the limited time resolution (1 s, equivalent to ∼104 Pa s) and higher than those estimated from bright-field imaging, yielding an overestimate of the viscosity. Since the new aerosol optical tweezers measurements in this work are based solely on the bright-field images, they are more accurate than the previous results at aw<0.1 as a consequence of the higher time resolution of the bright-field imaging measurements compared to the Raman spectroscopy measurements. The viscosity at aw=0.22±0.02 reported by Y. C. Song et al. (2016) was based on bright-field images alone, and those at aw≥0.43 were based on backscattered light intensity (where viscosities were <10 Pa s; see Sect. 2.2).
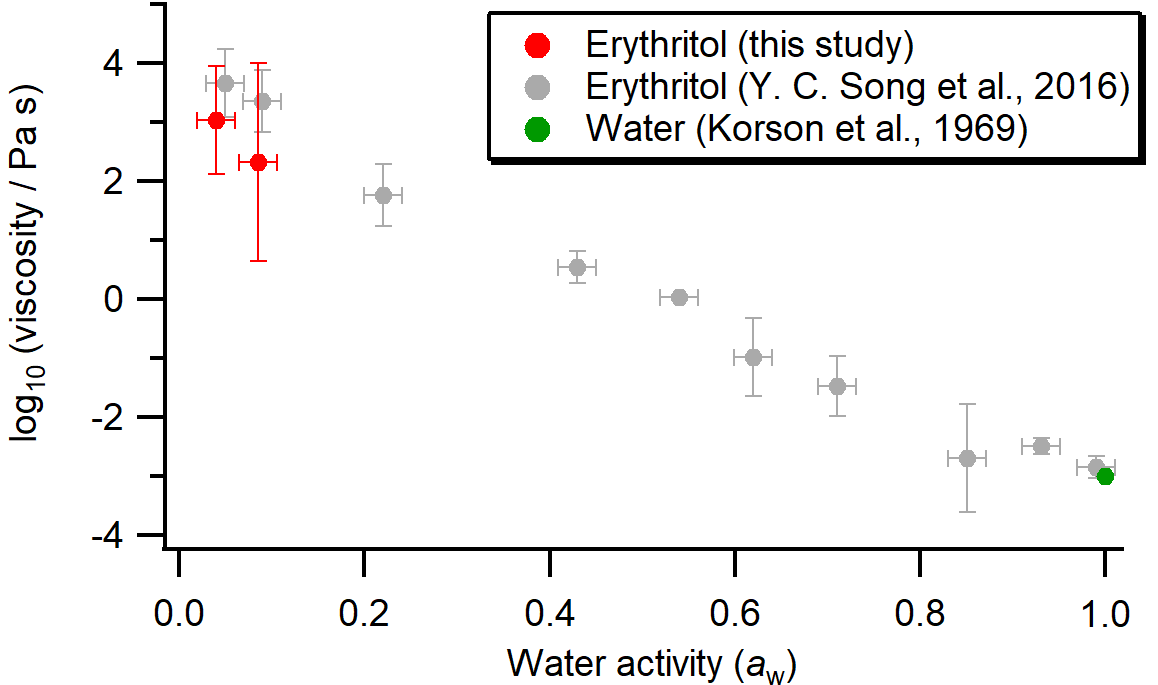
Figure 7Viscosity of erythritol–water particles (on a log10 scale) as a function of aw, determined using the aerosol optical tweezers technique. Red circles represent experimental results from this study. Gray circles represent experimental results from Y. C. Song et al. (2016). The green circle represents the viscosity of pure water at 293 K (Korson et al., 1969). Horizontal error bars indicate the upper and lower limits of aw. Vertical error bars represent 2 standard deviations of log10(viscosity ∕ Pa s).
3.3 Update on the viscosity of erythritol–water particles as a function of aw and an intercomparison of techniques for measuring the viscosity of particles
In Fig. 9, we have summarized the previous and current measurements of the viscosity of erythritol–water particles as a function of aw. The black triangles represent measurements by Grayson et al. (2017) using the bead-mobility technique. The blue squares represent the rFRAP results from this work, where experimental data at similar aw have been binned together so as not to give extra weight to the rFRAP data. The red circles indicate aerosol optical tweezers measurements from Y. C. Song et al. (2016) (open circles) and this study (solid circles). The previous measurements at aw≤0.1 by Y. C. Song et al. (2016) were excluded from Fig. 9, because the new aerosol optical tweezers measurements reported in this study at aw≤0.1 are thought to be more accurate. At aw>0.4, the viscosity measurements from the bead-mobility, rFRAP, and optical tweezers techniques are in reasonable agreement if the experimental uncertainties are considered. At aw<0.4, the mean viscosity values determined using optical tweezers are higher than those from rFRAP and bead-mobility measurements by 1–2 orders of magnitude. The error bars (2 standard deviations) overlap in some, but not all, cases. Nevertheless, the disagreement in viscosity measured using multiple techniques seen here is smaller than reported previously.
To determine the viscosity of pure erythritol under dry conditions (at aw=0), a straight line was fit to the data in Fig. 9 based on the orthogonal distance regression-fitting algorithm using IGOR Pro 6 and then extrapolated to aw=0. This algorithm weighted the fit based on the x and y uncertainties of each data point. The viscosity of pure water (aw=1) is well constrained (Korson et al., 1969), giving it a larger weighting than data points at aw<1. The intercept on the y axis was 2.27±0.22 (2 standard deviations), corresponding to a viscosity of pure erythritol of 184+122-73 Pa s.
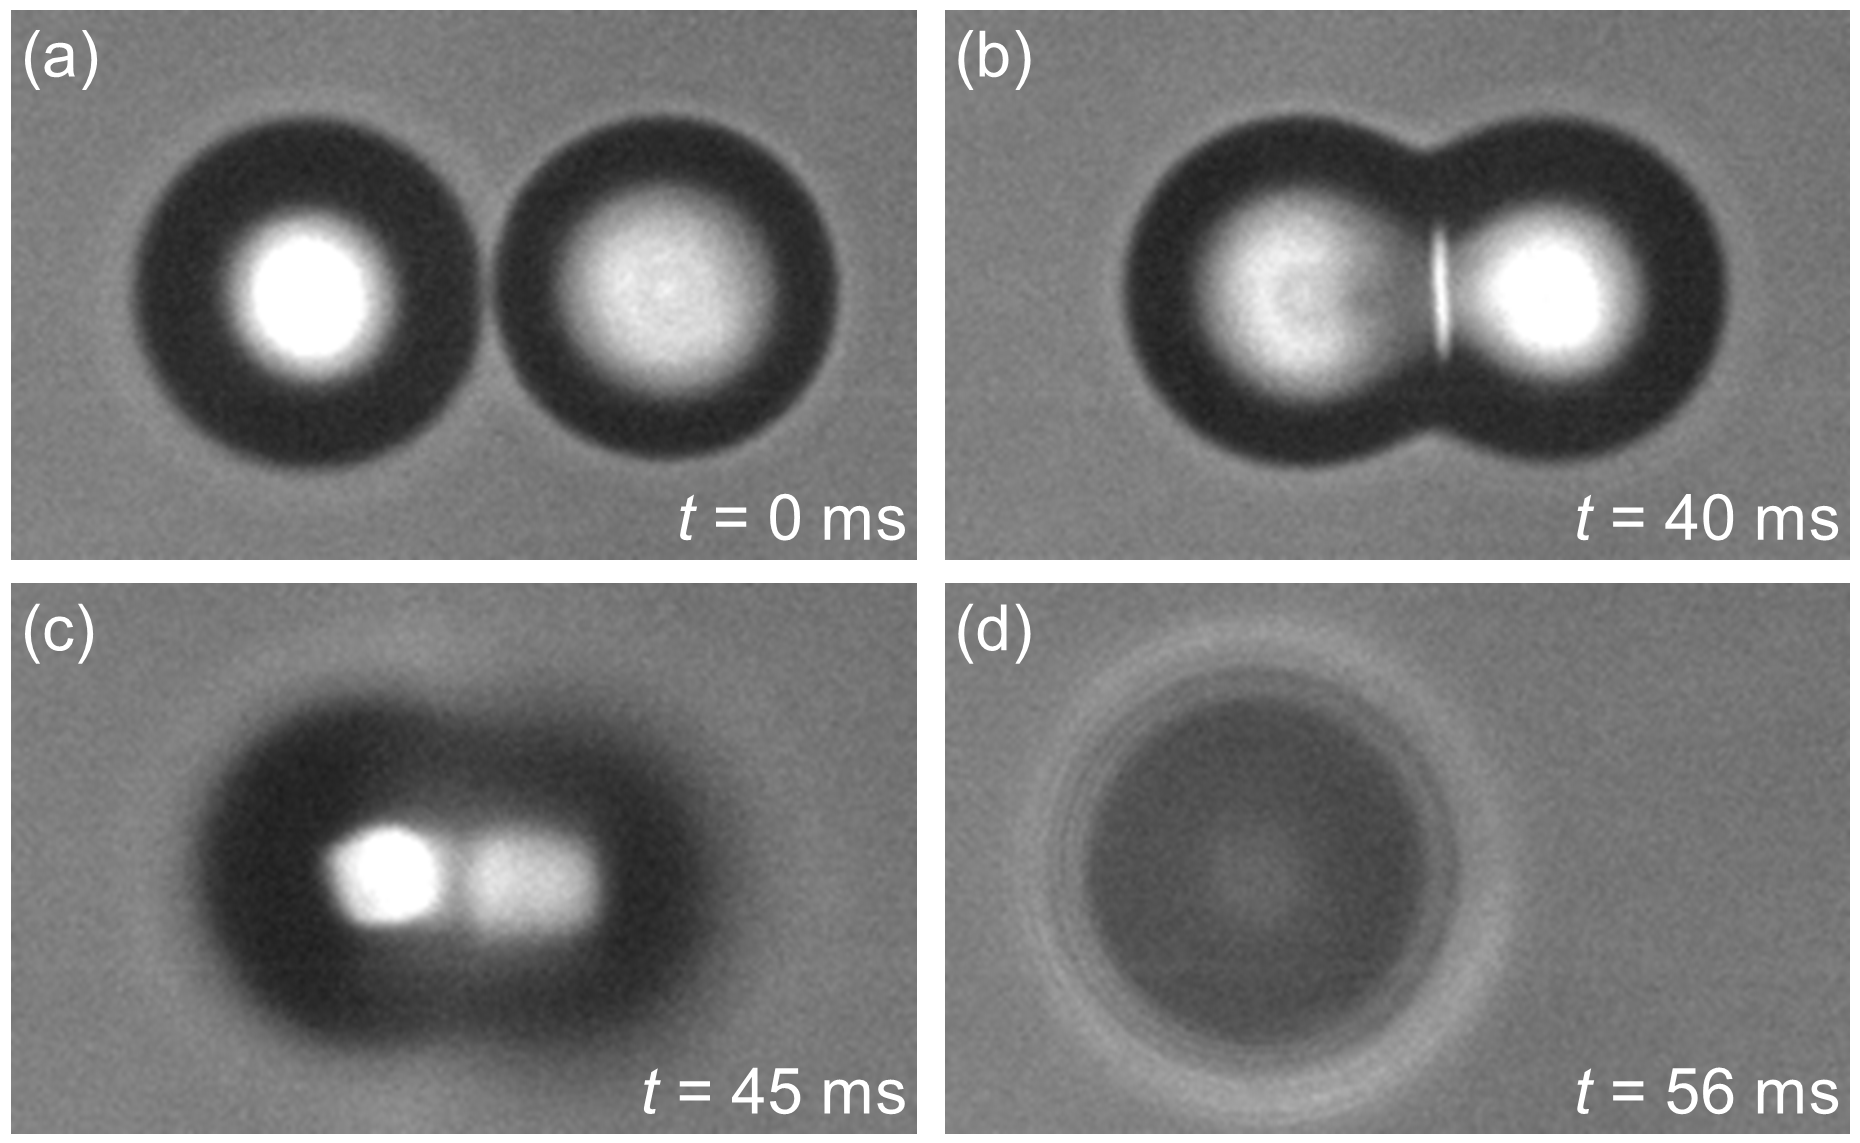
Figure 8An example of the captured bright-field images as a function of time after the coalescence of two erythritol particles in optical tweezers at aw=0.04±0.02. The relaxation to a spherical particle occurred within 56 ms.
3.4 Effect of the addition of OH functional groups to a linear C4 carbon backbone
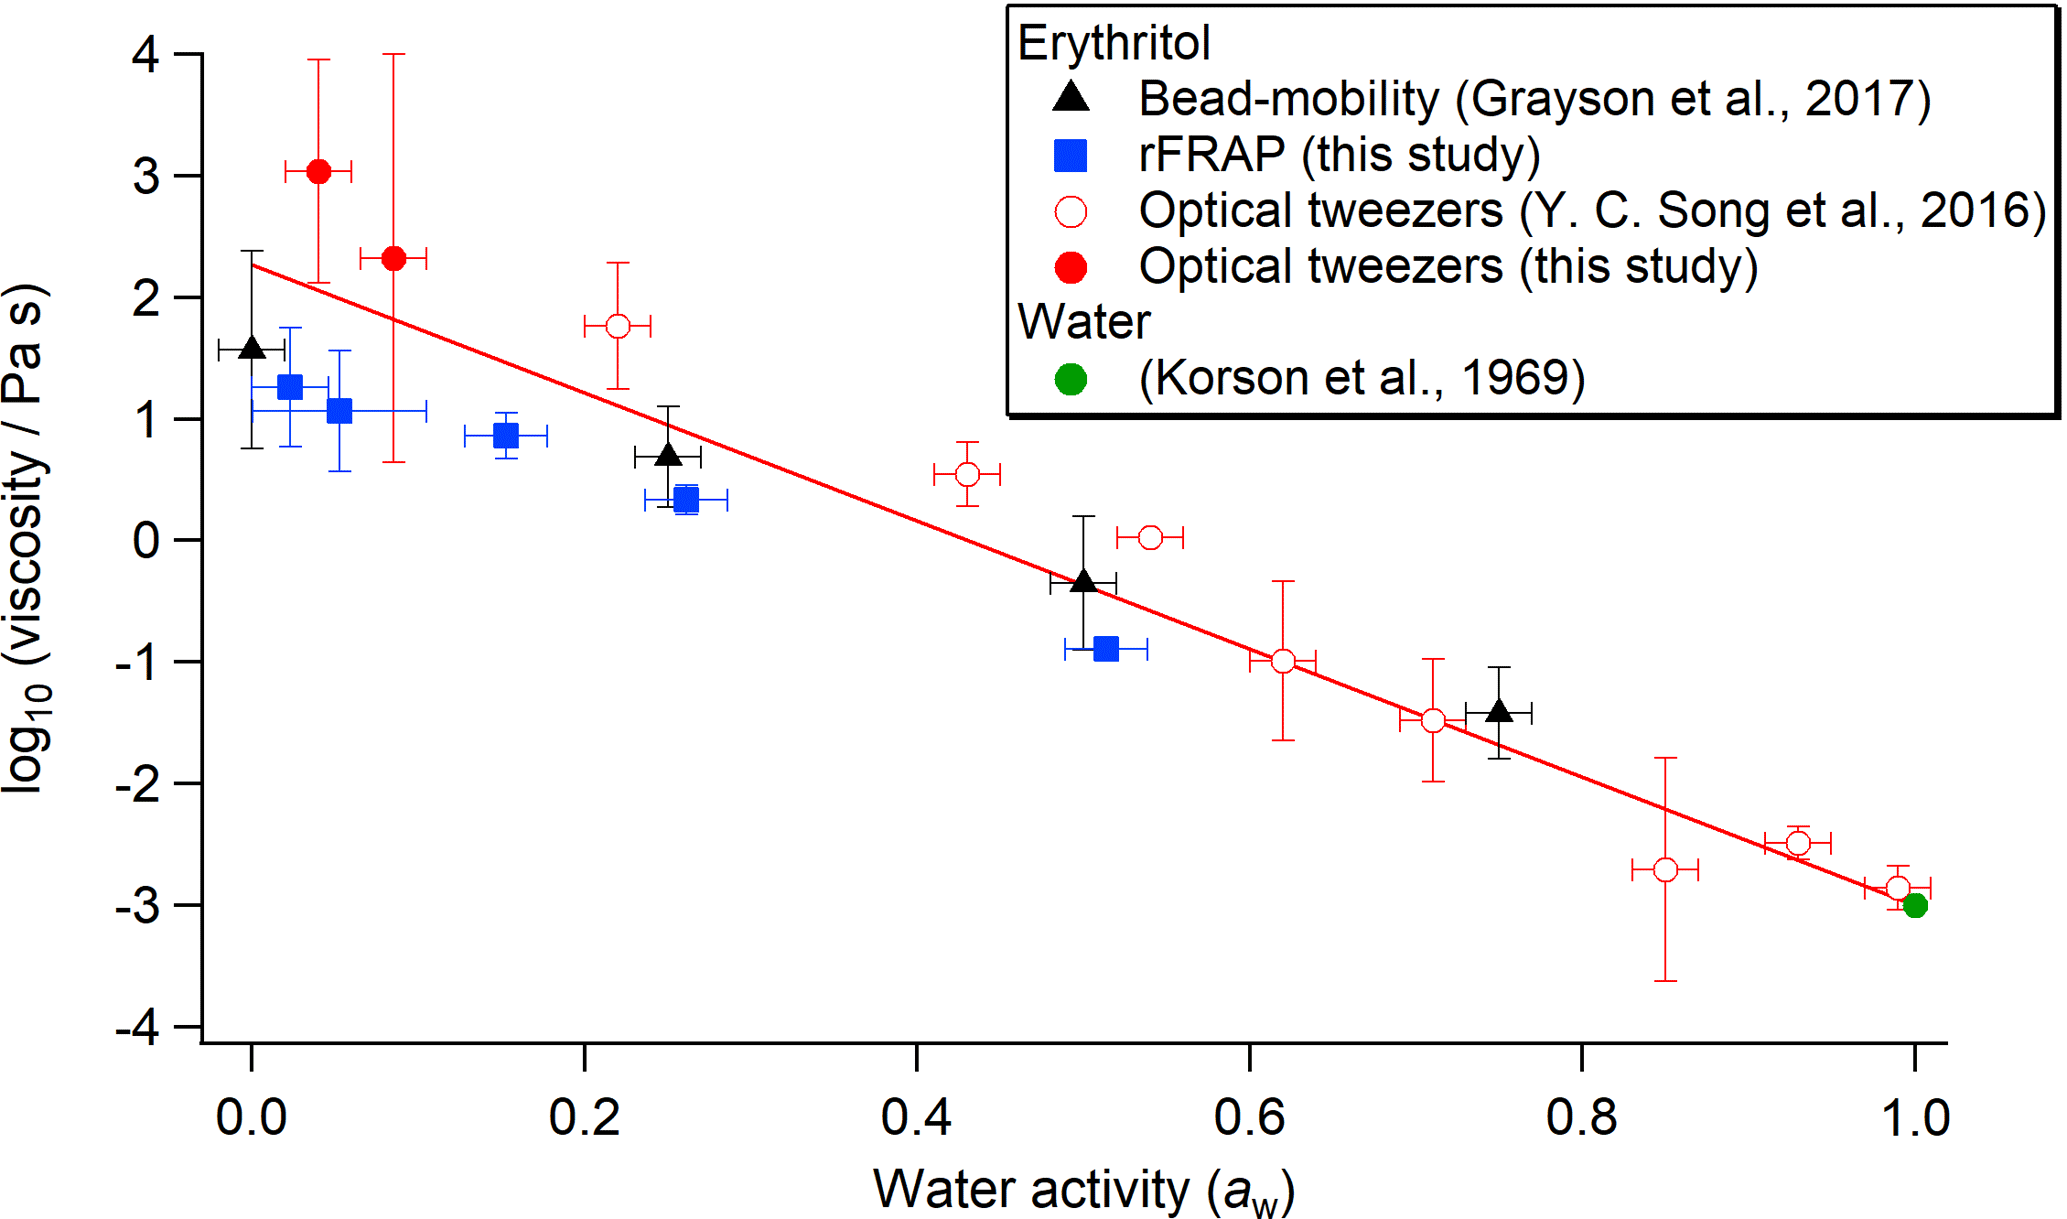
Figure 9Viscosity of erythritol–water particles as a function of aw measured by the bead-mobility technique (black triangles) (Grayson et al., 2017), the rFRAP technique (blue squares), and the aerosol optical tweezers technique (open red circles – from Y. C. Song et al., 2016; solid red circles – this study). The viscosity of pure water at 293 K (open green circle) (Korson et al., 1969) is also included for comparison. Horizontal error bars indicate the upper and lower limits of aw. Vertical error bars represent 2 standard deviations of log10(viscosity ∕ Pa s). The red line is a linear fit to the data points using the orthogonal distance regression-fitting algorithm in IGOR Pro 6, which is weighted based on the x and y uncertainties of each data point. The equation of the linear fit is log10(viscosity ∕ Pa s) = (2.27±0.22) + (-0.053±0.002) ⋅ (100 aw). Uncertainties in the slope and y-axis intercept correspond to 2 standard deviations.
Grayson et al. (2017) previously estimated the effect of adding OH functional groups on the viscosity of a linear C4 compound. Here we repeat this analysis (Fig. 10) based on the updated viscosity of pure erythritol (184+122-73 Pa s) determined above. For those compounds with the same number but different positions of OH functional groups, the average of their viscosities was taken from the literature (Grayson et al., 2017; Rothfuss and Petters, 2017; Y. C. Song et al., 2016). Table S4 (in the Supplement) lists the values and sources of literature data used. The data in Fig. 10 were fit to a linear equation, resulting in a slope of 1.43±0.08 (2 standard deviations), which indicates that the viscosity of a linear C4 molecule increases on average by a factor of 27+6-5 per addition of an OH functional group. The increase in viscosity with the addition of an OH functional group to a linear C4 backbone is attributed to the increased number of hydrogen bonds (H–O⋯H) formed between adjacent molecules, as discussed previously (Rothfuss and Petters, 2017). Similarly, the addition of carboxyl groups (–COOH) leads to an increase in viscosity due to enhanced formation of intermolecular hydrogen bonds (Rothfuss and Petters, 2017).
The viscosity increase from the addition of OH functional groups to a carbon backbone may depend on the level of prior functionalization. To investigate this aspect further, we calculated the viscosity sensitivity parameter (Sη) for a linear C4 carbon backbone using the viscosity data presented in Fig. 10 and the following equation (Rothfuss and Petters, 2017):
where Δlog10(η∕Pa s) is the change in viscosity on a log10 scale and ΔN is the change in the number of OH functional groups. Sη was estimated based on the addition of one OH functional group (ΔN=1), starting from n-butane. The relationship between Sη and N is shown in Fig. 11 for a linear C4 carbon backbone. Sη is between 0.7 and 1.9 for N=1–3. On the other hand, Sη is between 1.6 and 2.5 for N=4, suggesting Sη likely increases with the addition of the fourth OH functional group to the linear C4 carbon backbone. However, additional studies are needed in order to reduce the uncertainties of the measurements and make stronger conclusions.

Figure 10Viscosities of compounds with a linear C4 carbon backbone at 292–295 K on a log10 scale plotted against the number of OH functional groups. Black circles represent viscosities of the compounds with zero to three OH functional groups (i.e., n-butane, 1-butanol, 2-butanol, 1,2-butanediol, 1,4-butanediol, 2,3-butanediol, 1,2,3-butanetriol, and 1,2,4-butanetriol) taken from the literature (Grayson et al., 2017; Rothfuss and Petters, 2017; Y. C. Song et al., 2016). For the literature data points, the error bars are 2 standard deviations of log10(viscosity ∕ Pa s) of multiple compounds. The blue circle represents the viscosity of pure erythritol, with error bars of 2 standard deviations, based on the linear fit in Fig. 9. The red line is a linear fit to the data, which is weighted based on the uncertainties in viscosity data. The slope and regression coefficient (R2) are shown in the annotation. The uncertainty in the slope corresponds to 2 standard deviations.
In this work, viscosities of erythritol–water particles as a function of aw at 292–295 K were measured using the rFRAP and aerosol optical tweezers techniques. In the rFRAP measurements, a trace amount of RBID (0.2–0.3 wt %) was added to the erythritol–water matrix, and viscosities of erythritol–water particles were estimated based on the measured diffusion coefficients of RBID and the Stokes–Einstein equation. In the new measurements using the aerosol optical tweezers technique, viscosity was measured at aw<0.1 based solely on bright-field imaging (Y. C. Song et al., 2016).
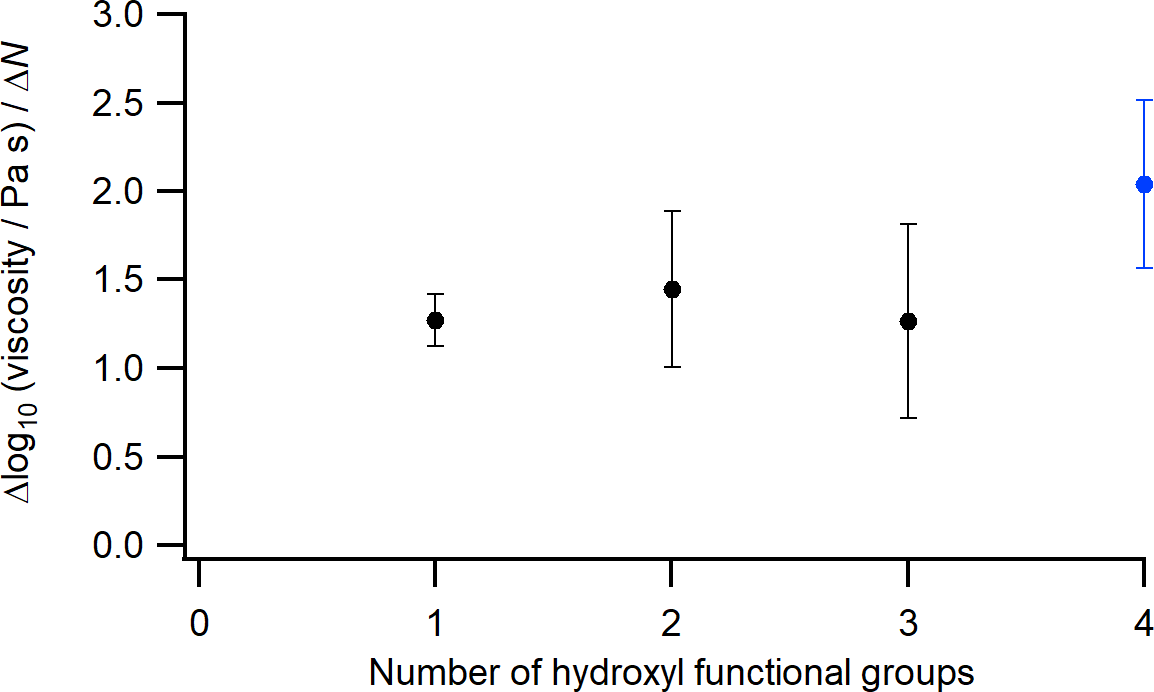
Figure 11The viscosity sensitivity parameter at 292–295 K plotted against the number of OH functional groups for linear C4 compounds (alkane, alcohol, and polyols). Black circles represent values estimated using literature data alone (Grayson et al., 2017; Rothfuss and Petters, 2017; Y. C. Song et al., 2016); the blue circle represents the value estimated using experimental results from this work and literature data (Grayson et al., 2017; Y. C. Song et al., 2016). The error bars are propagated from the uncertainties shown in Fig. 10.
In general, at aw>0.4, the viscosity measurements from the bead-mobility, rFRAP, and optical tweezers techniques are in reasonable agreement if the experimental uncertainties are considered. At aw<0.4, the mean viscosity values determined using optical tweezers are higher than those using the bead-mobility and rFRAP techniques by 1–2 orders of magnitude. Nevertheless, the disagreement in viscosity measured using multiple techniques seen here is smaller than reported previously. A linear fit was performed for the experimentally determined viscosities of erythritol–water particles against aw and extrapolated to aw=0. Based on the extrapolation, the viscosity of pure erythritol at 292–295 K is estimated at 184+122-73 Pa s (2 standard deviations). Based on these results, the addition of an OH functional group to a linear C4 carbon backbone increases the viscosity by a factor of 27+6-5 (2 standard deviations), on average. In comparison, Grayson et al. (2017) reported a factor of 41+27-16 based on previous measurements.
The viscosity sensitivity parameter was calculated to determine the dependency of viscosity on the degree of prior functionalization for a linear C4 carbon backbone. Based on the viscosity sensitivity parameter analysis, the increase in viscosity due to the addition of one OH functional group to a linear C4 carbon backbone is not a strong function of the number of OH groups already present in the molecule, up to the addition of three OH functional groups. On the other hand, the degree of increase in viscosity is likely larger when the linear C4 carbon backbone already contains three OH groups. These results should help improve the understanding of the viscosity of SOA particles in the atmosphere.
Data for this paper are available in the Supplement.
The supplement related to this article is available online at: https://doi.org/10.5194/amt-11-4809-2018-supplement.
AKB designed and oversaw this study. YC, EE, and YCS carried out the experiments. SK provided technical support. YC and EE wrote the manuscript with contributions from all authors.
The authors declare that they have no conflict of interest.
This work was carried out in the Laboratory for Advanced Spectroscopy and
Imaging Research (LASIR) at the University of British Columbia in Vancouver
and supported by the Natural Sciences and Engineering Research Council of
Canada. Yangxi Chu gratefully acknowledges the support from the Hong Kong
PhD Fellowship Scheme by the Hong Kong Research Grants Council and the Overseas
Research Award at the Hong Kong University of Science and Technology
(HKUST). Jonathan P. Reid and Young Chul Song gratefully acknowledge support
from the NERC through the award of grant NE/M004600/1.
Edited by: Mingjin Tang
Reviewed by: two anonymous referees
Abramson, E., Imre, D., Beránek, J., Wilson, J., and Zelenyuk, A.: Experimental determination of chemical diffusion within secondary organic aerosol particles, Phys. Chem. Chem. Phys., 15, 2983–2991, https://doi.org/10.1039/c2cp44013j, 2013.
Adler, G., Koop, T., Haspel, C., Taraniuk, I., Moise, T., Koren, I., Heiblum, R. H., and Rudich, Y.: Formation of highly porous aerosol particles by atmospheric freeze-drying in ice clouds, P. Natl. Acad. Sci. USA, 110, 20414–20419, https://doi.org/10.1073/pnas.1317209110, 2013.
Bastelberger, S., Krieger, U. K., Luo, B., and Peter, T.: Diffusivity measurements of volatile organics in levitated viscous aerosol particles, Atmos. Chem. Phys., 17, 8453–8471, https://doi.org/10.5194/acp-17-8453-2017, 2017.
Bateman, A. P., Bertram, A. K., and Martin, S. T.: Hygroscopic Influence on the Semisolid-to-Liquid Transition of Secondary Organic Materials, J. Phys. Chem. A, 119, 4386–4395, https://doi.org/10.1021/jp508521c, 2015.
Bateman, A. P., Gong, Z., Liu, P., Sato, B., Cirino, G., Zhang, Y., Artaxo, P., Bertram, A. K., Manzi, A. O., Rizzo, L. V, Souza, R. A. F., Zaveri, R. A., and Martin, S. T.: Sub-micrometre particulate matter is primarily in liquid form over Amazon rainforest, Nat. Geosci., 9, 34–37, https://doi.org/10.1038/ngeo2599, 2016.
Bateman, A. P., Gong, Z., Harder, T. H., de Sá, S. S., Wang, B., Castillo, P., China, S., Liu, Y., O'Brien, R. E., Palm, B. B., Shiu, H.-W., Cirino, G. G., Thalman, R., Adachi, K., Alexander, M. L., Artaxo, P., Bertram, A. K., Buseck, P. R., Gilles, M. K., Jimenez, J. L., Laskin, A., Manzi, A. O., Sedlacek, A., Souza, R. A. F., Wang, J., Zaveri, R., and Martin, S. T.: Anthropogenic influences on the physical state of submicron particulate matter over a tropical forest, Atmos. Chem. Phys., 17, 1759–1773, https://doi.org/10.5194/acp-17-1759-2017, 2017.
Berkemeier, T., Steimer, S. S., Krieger, U. K., Peter, T., Pöschl, U., Ammann, M., and Shiraiwa, M.: Ozone uptake on glassy, semi-solid and liquid organic matter and the role of reactive oxygen intermediates in atmospheric aerosol chemistry, Phys. Chem. Chem. Phys., 18, 12662–12674, https://doi.org/10.1039/C6CP00634E, 2016.
Bodsworth, A., Zobrist, B., and Bertram, A. K.: Inhibition of efflorescence in mixed organic-inorganic particles at temperatures less than 250 K, Phys. Chem. Chem. Phys., 12, 12259–12266, https://doi.org/10.1039/C0CP00572J, 2010.
Bzdek, B. R., Collard, L., Sprittles, J. E., Hudson, A. J., and Reid, J. P.: Dynamic measurements and simulations of airborne picolitre-droplet coalescence in holographic optical tweezers, J. Chem. Phys., 145, 54502, https://doi.org/10.1063/1.4959901, 2016.
Cappa, C. D. and Wilson, K. R.: Evolution of organic aerosol mass spectra upon heating: implications for OA phase and partitioning behavior, Atmos. Chem. Phys., 11, 1895–1911, https://doi.org/10.5194/acp-11-1895-2011, 2011.
Chenyakin, Y., Ullmann, D. A., Evoy, E., Renbaum-Wolff, L., Kamal, S., and Bertram, A. K.: Diffusion coefficients of organic molecules in sucrose-water solutions and comparison with Stokes-Einstein predictions, Atmos. Chem. Phys., 17, 2423–2435, https://doi.org/10.5194/acp-17-2423-2017, 2017.
Chu, Y. and Chan, C. K.: Reactive Uptake of Dimethylamine by Ammonium Sulfate and Ammonium Sulfate–Sucrose Mixed Particles, J. Phys. Chem. A, 121, 206–215, https://doi.org/10.1021/acs.jpca.6b10692, 2017a.
Chu, Y. and Chan, C. K.: Role of oleic acid coating in the heterogeneous uptake of dimethylamine by ammonium sulfate particles, Aero. Sci. Tech., 51, 988–997, https://doi.org/10.1080/02786826.2017.1323072, 2017b.
Claeys, M.: Formation of Secondary Organic Aerosols Through Photooxidation of Isoprene, Science, 303, 1173–1176, https://doi.org/10.1126/science.1092805, 2004.
Davies, J. F. and Wilson, K. R.: Raman Spectroscopy of Isotopic Water Diffusion in Ultraviscous, Glassy, and Gel States in Aerosol by Use of Optical Tweezers, Anal. Chem., 88, 2361–2366, https://doi.org/10.1021/acs.analchem.5b04315, 2016.
Deschout, H., Hagman, J., Fransson, S., Jonasson, J., Rudemo, M., Lorén, N., and Braeckmans, K.: Straightforward FRAP for quantitative diffusion measurements with a laser scanning microscope, Opt. Express, 18, 22886–22905, https://doi.org/10.1364/OE.18.022886, 2010.
Edney, E. O., Kleindienst, T. E., Jaoui, M., Lewandowski, M., Offenberg, J. H., Wang, W., and Claeys, M.: Formation of 2-methyl tetrols and 2-methylglyceric acid in secondary organic aerosol from laboratory irradiated isoprene/NOX/SO2/air mixtures and their detection in ambient PM2.5 samples collected in the eastern United States, Atmos. Environ., 39, 5281–5289, https://doi.org/10.1016/j.atmosenv.2005.05.031, 2005.
Floury, J., El Mourdi, I., Silva, J. V. C., Lortal, S., Thierry, A., and Jeanson, S.: Diffusion of solutes inside bacterial colonies immobilized in model cheese depends on their physicochemical properties: a time-lapse microscopy study, Front. Microbiol., 6, 366, https://doi.org/10.3389/fmicb.2015.00366, 2015.
Fukaminato, T.: Single-molecule fluorescence photoswitching: Design and synthesis of photoswitchable fluorescent molecules, J. Photochem. Photobiol. C Photochem. Rev., 12, 177–208, https://doi.org/10.1016/j.jphotochemrev.2011.08.006, 2011.
Gatzsche, K., Iinuma, Y., Tilgner, A., Mutzel, A., Berndt, T., and Wolke, R.: Kinetic modeling studies of SOA formation from a-pinene ozonolysis, Atmos. Chem. Phys., 17, 13187–13211, https://doi.org/10.5194/acp-17-13187-2017, 2017.
Gorkowski, K., Donahue, N. M., and Sullivan, R. C.: Emulsified and Liquid–Liquid Phase-Separated States of α-Pinene Secondary Organic Aerosol Determined Using Aerosol Optical Tweezers, Environ. Sci. Technol., 51, 12154–12163, https://doi.org/10.1021/acs.est.7b03250, 2017.
Grayson, J. W., Zhang, Y., Mutzel, A., Renbaum-Wolff, L., Böge, O., Kamal, S., Herrmann, H., Martin, S. T., and Bertram, A. K.: Effect of varying experimental conditions on the viscosity of a-pinene derived secondary organic material, Atmos. Chem. Phys., 16, 6027–6040, https://doi.org/10.5194/acp-16-6027-2016, 2016.
Grayson, J. W., Evoy, E., Song, M., Chu, Y., Maclean, A., Nguyen, A., Upshur, M. A., Ebrahimi, M., Chan, C. K., Geiger, F. M., Thomson, R. J., and Bertram, A. K.: The effect of hydroxyl functional groups and molar mass on the viscosity of non-crystalline organic and organic-water particles, Atmos. Chem. Phys., 17, 8509–8524, https://doi.org/10.5194/acp-17-8509-2017, 2017.
Guenther, A., Karl, T., Harley, P., Wiedinmyer, C., Palmer, P. I., and Geron, C.: Estimates of global terrestrial isoprene emissions using MEGAN (Model of Emissions of Gases and Aerosols from Nature), Atmos. Chem. Phys., 6, 3181–3210, https://doi.org/10.5194/acp-6-3181-2006, 2006.
Hallquist, M., Wenger, J. C., Baltensperger, U., Rudich, Y., Simpson, D., Claeys, M., Dommen, J., Donahue, N. M., George, C., Goldstein, A. H., Hamilton, J. F., Herrmann, H., Hoffmann, T., Iinuma, Y., Jang, M., Jenkin, M. E., Jimenez, J. L., Kiendler-Scharr, A., Maenhaut, W., McFiggans, G., Mentel, Th. F., Monod, A., Prévôt, A. S. H., Seinfeld, J. H., Surratt, J. D., Szmigielski, R., and Wildt, J.: The formation, properties and impact of secondary organic aerosol: current and emerging issues, Atmos. Chem. Phys., 9, 5155–5236, https://doi.org/10.5194/acp-9-5155-2009, 2009.
Haynes, W. M.: CRC Handbook of Chemistry and Physics, 96th Edn., CRC Press, Florida, 2015.
Hinks, M. L., Brady, M. V., Lignell, H., Song, M., Grayson, J. W., Bertram, A. K., Lin, P., Laskin, A., Laskin, J., and Nizkorodov, S. A.: Effect of viscosity on photodegradation rates in complex secondary organic aerosol materials, Phys. Chem. Chem. Phys., 18, 8785–8793, https://doi.org/10.1039/C5CP05226B, 2016.
Hosny, N. A., Fitzgerald, C., Vysniauskas, A., Athanasiadis, A., Berkemeier, T., Uygur, N., Pöschl, U., Shiraiwa, M., Kalberer, M., Pope, F. D., and Kuimova, M. K.: Direct imaging of changes in aerosol particle viscosity upon hydration and chemical aging, Chem. Sci., 7, 1357–1367, https://doi.org/10.1039/C5SC02959G, 2016.
Houle, F. A., Hinsberg, W. D., and Wilson, K. R.: Oxidation of a model alkane aerosol by OH radical: the emergent nature of reactive uptake, Phys. Chem. Chem. Phys., 17, 4412–4423, https://doi.org/10.1039/C4CP05093B, 2015.
Ignatius, K., Kristensen, T. B., Järvinen, E., Nichman, L., Fuchs, C., Gordon, H., Herenz, P., Hoyle, C. R., Duplissy, J., Garimella, S., Dias, A., Frege, C., Höppel, N., Tröstl, J., Wagner, R., Yan, C., Amorim, A., Baltensperger, U., Curtius, J., Donahue, N. M., Gallagher, M. W., Kirkby, J., Kulmala, M., Möhler, O., Saathoff, H., Schnaiter, M., Tomé, A., Virtanen, A., Worsnop, D., and Stratmann, F.: Heterogeneous ice nucleation of viscous secondary organic aerosol produced from ozonolysis of α-pinene, Atmos. Chem. Phys., 16, 6495–6509, https://doi.org/10.5194/acp-16-6495-2016, 2016.
Jimenez, J. L., Canagaratna, M. R., Donahue, N. M., Prevot, A. S. H., Zhang, Q., Kroll, J. H., DeCarlo, P. F., Allan, J. D., Coe, H., Ng, N. L., Aiken, A. C., Docherty, K. S., Ulbrich, I. M., Grieshop, A. P., Robinson, A. L., Duplissy, J., Smith, J. D., Wilson, K. R., Lanz, V. A., Hueglin, C., Sun, Y. L., Tian, J., Laaksonen, A., Raatikainen, T., Rautiainen, J., Vaattovaara, P., Ehn, M., Kulmala, M., Tomlinson, J. M., Collins, D. R., Cubison, M. J., Dunlea, J., Huffman, J. A., Onasch, T. B., Alfarra, M. R., Williams, P. I., Bower, K., Kondo, Y., Schneider, J., Drewnick, F., Borrmann, S., Weimer, S., Demerjian, K., Salcedo, D., Cottrell, L., Griffin, R., Takami, A., Miyoshi, T., Hatakeyama, S., Shimono, A., Sun, J. Y., Zhang, Y. M., Dzepina, K., Kimmel, J. R., Sueper, D., Jayne, J. T., Herndon, S. C., Trimborn, A. M., Williams, L. R., Wood, E. C., Middlebrook, A. M., Kolb, C. E., Baltensperger, U., and Worsnop, D. R.: Evolution of Organic Aerosols in the Atmosphere, Science, 326, 1525–1529, https://doi.org/10.1126/science.1180353, 2009.
Kanakidou, M., Seinfeld, J. H., Pandis, S. N., Barnes, I., Dentener, F. J., Facchini, M. C., Van Dingenen, R., Ervens, B., Nenes, A., Nielsen, C. J., Swietlicki, E., Putaud, J. P., Balkanski, Y., Fuzzi, S., Horth, J., Moortgat, G. K., Winterhalter, R., Myhre, C. E. L., Tsigaridis, K., Vignati, E., Stephanou, E. G., and Wilson, J.: Organic aerosol and global climate modelling: a review, Atmos. Chem. Phys., 5, 1053–1123, https://doi.org/10.5194/acp-5-1053-2005, 2005.
Kiyosawa, K.: Volumetric properties of polyols (ethylene glycol, glycerol, meso-erythritol, xylitol and mannitol) in relation to their membrane permeability: Group additivity and estimation of the maximum radius of their molecules, Biochim. Biophys. Acta-Biomembr., 1064, 251–255, https://doi.org/10.1016/0005-2736(91)90309-V, 1991.
Koop, T., Bookhold, J., Shiraiwa, M., and Pöschl, U.: Glass transition and phase state of organic compounds: dependency on molecular properties and implications for secondary organic aerosols in the atmosphere, Phys. Chem. Chem. Phys., 13, 19238–19255, https://doi.org/10.1039/c1cp22617g, 2011.
Korson, L., Drost-Hansen, W., and Millero, F. J.: Viscosity of water at various temperatures, J. Phys. Chem., 73, 34–39, https://doi.org/10.1021/j100721a006, 1969.
Kuwata, M. and Martin, S. T.: Phase of atmospheric secondary organic material affects its reactivity, P. Natl. Acad. Sci. USA, 109, 17354–17359, https://doi.org/10.1073/pnas.1209071109, 2012.
Ladino, L. A., Zhou, S., Yakobi-Hancock, J. D., Aljawhary, D., and Abbatt, J. P. D.: Factors controlling the ice nucleating abilities of α-pinene SOA particles, J. Geophys. Res.-Atmos., 119, 9041–9051, https://doi.org/10.1002/2014JD021578, 2014.
Li, Y. J., Liu, P., Gong, Z., Wang, Y., Bateman, A. P., Bergoend, C., Bertram, A. K., and Martin, S. T.: Chemical Reactivity and Liquid/Nonliquid States of Secondary Organic Material, Environ. Sci. Technol., 49, 13264–13274, https://doi.org/10.1021/acs.est.5b03392, 2015.
Lignell, H., Hinks, M. L., and Nizkorodov, S. A.: Exploring matrix effects on photochemistry of organic aerosols, P. Natl. Acad. Sci. USA, 111, 13780–13785, https://doi.org/10.1073/pnas.1322106111, 2014.
Liu, P., Li, Y. J., Wang, Y., Gilles, M. K., Zaveri, R. A., Bertram, A. K., and Martin, S. T.: Lability of secondary organic particulate matter, P. Natl. Acad. Sci., 113, 12643–12648, https://doi.org/10.1073/pnas.1603138113, 2016.
Liu, P., Li, Y. J., Wang, Y., Bateman, A. P., Zhang, Y., Gong, Z., Bertram, A. K., and Martin, S. T.: Highly Viscous States Affect the Browning of Atmospheric Organic Particulate Matter, ACS Cent. Sci., 4, 207–215, https://doi.org/10.1021/acscentsci.7b00452, 2018.
Long, D., Lin, H., and Scheblykin, I. G.: Carbon nanotubes as photoprotectors of organic dyes: reversible photoreaction instead of permanent photo-oxidation, Phys. Chem. Chem. Phys., 13, 5771–5777, https://doi.org/10.1039/C0CP02764B, 2011.
Lu, J. W., Rickards, A. M. J., Walker, J. S., Knox, K. J., Miles, R. E. H., Reid, J. P., and Signorell, R.: Timescales of water transport in viscous aerosol: measurements on sub-micron particles and dependence on conditioning history, Phys. Chem. Chem. Phys., 16, 9819–9830, https://doi.org/10.1039/C3CP54233E, 2014.
Marshall, F. H., Miles, R. E. H., Song, Y.-C., Ohm, P. B., Power, R. M., Reid, J. P., and Dutcher, C. S.: Diffusion and reactivity in ultraviscous aerosol and the correlation with particle viscosity, Chem. Sci., 7, 1298–1308, https://doi.org/10.1039/C5SC03223G, 2016.
Mikhailov, E., Vlasenko, S., Martin, S. T., Koop, T., and Pöschl, U.: Amorphous and crystalline aerosol particles interacting with water vapor: conceptual framework and experimental evidence for restructuring, phase transitions and kinetic limitations, Atmos. Chem. Phys., 9, 9491–9522, https://doi.org/10.5194/acp-9-9491-2009, 2009.
Murray, B. J. and Bertram, A. K.: Inhibition of solute crystallisation in aqueous H+-NH+4-SO2-4-H2O droplets, Phys. Chem. Chem. Phys., 10, 3287–3301, https://doi.org/10.1039/B802216J, 2008.
O'Brien, R. E., Neu, A., Epstein, S. A., MacMillan, A. C., Wang, B., Kelly, S. T., Nizkorodov, S. A., Laskin, A., Moffet, R. C., and Gilles, M. K.: Physical properties of ambient and laboratory-generated secondary organic aerosol, Geophys. Res. Lett., 41, 4347–4353, https://doi.org/10.1002/2014GL060219, 2014.
Paës, G., Habrant, A., Ossemond, J., and Chabbert, B.: Exploring accessibility of pretreated poplar cell walls by measuring dynamics of fluorescent probes, Biotechnol. Biofuels, 10, 15, https://doi.org/10.1186/s13068-017-0704-5, 2017.
Pajunoja, A., Malila, J., Hao, L., Joutsensaari, J., Lehtinen, K. E. J., and Virtanen, A.: Estimating the Viscosity Range of SOA Particles Based on Their Coalescence Time, Aero. Sci. Tech., 48, i–iv, https://doi.org/10.1080/02786826.2013.870325, 2014.
Pajunoja, A., Hu, W., Leong, Y. J., Taylor, N. F., Miettinen, P., Palm, B. B., Mikkonen, S., Collins, D. R., Jimenez, J. L., and Virtanen, A.: Phase state of ambient aerosol linked with water uptake and chemical aging in the southeastern US, Atmos. Chem. Phys., 16, 11163–11176, https://doi.org/10.5194/acp-16-11163-2016, 2016.
Pant, A., Fok, A., Parsons, M. T., Mak, J., and Bertram, A. K.: Deliquescence and crystallization of ammonium sulfate-glutaric acid and sodium chloride-glutaric acid particles, Geophys. Res. Lett., 31, L12111, https://doi.org/10.1029/2004GL020025, 2004.
Pant, A., Parsons, M. T., and Bertram, A. K.: Crystallization of Aqueous Ammonium Sulfate Particles Internally Mixed with Soot and Kaolinite: Crystallization Relative Humidities and Nucleation Rates, J. Phys. Chem. A, 110, 8701–8709, https://doi.org/10.1021/jp060985s, 2006.
Perraud, V., Bruns, E. A., Ezell, M. J., Johnson, S. N., Yu, Y., Alexander, M. L., Zelenyuk, A., Imre, D., Chang, W. L., Dabdub, D., Pankow, J. F., and Finlayson-Pitts, B. J.: Nonequilibrium atmospheric secondary organic aerosol formation and growth, P. Natl. Acad. Sci. USA, 109, 2836–2841, https://doi.org/10.1073/pnas.1119909109, 2012.
Power, R. M. and Reid, J. P.: Probing the micro-rheological properties of aerosol particles using optical tweezers, Reports Prog. Phys., 77, 74601, https://doi.org/10.1088/0034-4885/77/7/074601, 2014.
Power, R. M., Simpson, S. H., Reid, J. P., and Hudson, A. J.: The transition from liquid to solid-like behaviour in ultrahigh viscosity aerosol particles, Chem. Sci., 4, 2597–2604, https://doi.org/10.1039/c3sc50682g, 2013.
Preston, T. C. and Reid, J. P.: Accurate and efficient determination of the radius, refractive index, and dispersion of weakly absorbing spherical particle using whispering gallery modes, J. Opt. Soc. Am. B, 30, 2113–2122, https://doi.org/10.1364/JOSAB.30.002113, 2013.
Price, H. C., Murray, B. J., Mattsson, J., O'Sullivan, D., Wilson, T. W., Baustian, K. J., and Benning, L. G.: Quantifying water diffusion in high-viscosity and glassy aqueous solutions using a Raman isotope tracer method, Atmos. Chem. Phys., 14, 3817–3830, https://doi.org/10.5194/acp-14-3817-2014, 2014.
Price, H. C., Mattsson, J., and Murray, B. J.: Sucrose diffusion in aqueous solution, Phys. Chem. Chem. Phys., 18, 19207–19216, https://doi.org/10.1039/C6CP03238A, 2016.
Reid, J. P., Bertram, A. K., Topping, D. O., Laskin, A., Martin, S. T., Petters, M. D., Pope, F. D., and Rovelli, G.: The viscosity of atmospherically relevant organic particles, Nat. Commun., 9, 956, https://doi.org/10.1038/s41467-018-03027-z, 2018.
Renbaum-Wolff, L., Grayson, J. W., Bateman, A. P., Kuwata, M., Sellier, M., Murray, B. J., Shilling, J. E., Martin, S. T., and Bertram, A. K.: Viscosity of α-pinene secondary organic material and implications for particle growth and reactivity, P. Natl. Acad. Sci. USA, 110, 8014–8019, https://doi.org/10.1073/pnas.1219548110, 2013.
Robinson, C. B., Schill, G. P., and Tolbert, M. A.: Optical growth of highly viscous organic/sulfate particles, J. Atmos. Chem., 71, 145–156, https://doi.org/10.1007/s10874-014-9287-8, 2014.
Rothfuss, N. E. and Petters, M. D.: Influence of Functional Groups on the Viscosity of Organic Aerosol, Environ. Sci. Technol., 51, 271–279, https://doi.org/10.1021/acs.est.6b04478, 2017.
Saleh, R., Donahue, N. M., and Robinson, A. L.: Time Scales for Gas-Particle Partitioning Equilibration of Secondary Organic Aerosol Formed from Alpha-Pinene Ozonolysis, Environ. Sci. Technol., 47, 5588–5594, https://doi.org/10.1021/es400078d, 2013.
Schill, G. P., De Haan, D. O., and Tolbert, M. A.: Heterogeneous Ice Nucleation on Simulated Secondary Organic Aerosol, Environ. Sci. Technol., 48, 1675–1682, https://doi.org/10.1021/es4046428, 2014.
Schultz, S. G. and Solomon, A. K.: Determination of the Effective Hydrodynamic Radii of Small Molecules by Viscometry, J. Gen. Physiol., 44, 1189–1199, https://doi.org/10.1085/jgp.44.6.1189, 1961.
Seinfeld, J. H. and Pandis, S. N.: Atmospheric Chemistry and Physics: From Air Pollution to Climate Change, 2nd Edn., Wiley, New Jersey, 2006.
Shiraiwa, M. and Seinfeld, J. H.: Equilibration timescale of atmospheric secondary organic aerosol partitioning, Geophys. Res. Lett., 39, L24801, https://doi.org/10.1029/2012GL054008, 2012.
Shiraiwa, M., Ammann, M., Koop, T., and Pöschl, U.: Gas uptake and chemical aging of semisolid organic aerosol particles, P. Natl. Acad. Sci. USA, 108, 11003–11008, https://doi.org/10.1073/pnas.1103045108, 2011.
Shrivastava, M., Lou, S., Zelenyuk, A., Easter, R. C., Corley, R. A., Thrall, B. D., Rasch, P. J., Fast, J. D., Massey Simonich, S. L., Shen, H., and Tao, S.: Global long-range transport and lung cancer risk from polycyclic aromatic hydrocarbons shielded by coatings of organic aerosol, P. Natl. Acad. Sci. USA, 114, 1246–1251, https://doi.org/10.1073/pnas.1618475114, 2017.
Sinnecker, D., Voigt, P., Hellwig, N., and Schaefer, M.: Reversible Photobleaching of Enhanced Green Fluorescent Proteins, Biochemistry, 44, 7085–7094, https://doi.org/10.1021/bi047881x, 2005.
Song, L., Hennink, E. J., Young, I. T., and Tanke, H. J.: Photobleaching kinetics of fluorescein in quantitative fluorescence microscopy, Biophys. J., 68, 2588–2600, https://doi.org/10.1016/S0006-3495(95)80442-X, 1995.
Song, M., Liu, P. F., Hanna, S. J., Li, Y. J., Martin, S. T., and Bertram, A. K.: Relative humidity-dependent viscosities of isoprene-derived secondary organic material and atmospheric implications for isoprene-dominant forests, Atmos. Chem. Phys., 15, 5145–5159, https://doi.org/10.5194/acp-15-5145-2015, 2015.
Song, M., Liu, P. F., Hanna, S. J., Zaveri, R. A., Potter, K., You, Y., Martin, S. T., and Bertram, A. K.: Relative humidity-dependent viscosity of secondary organic material from toluene photo-oxidation and possible implications for organic particulate matter over megacities, Atmos. Chem. Phys., 16, 8817–8830, https://doi.org/10.5194/acp-16-8817-2016, 2016.
Song, Y. C., Haddrell, A. E., Bzdek, B. R., Reid, J. P., Bannan, T., Topping, D. O., Percival, C., and Cai, C.: Measurements and Predictions of Binary Component Aerosol Particle Viscosity, J. Phys. Chem. A, 120, 8123–8137, https://doi.org/10.1021/acs.jpca.6b07835, 2016.
Steimer, S. S., Berkemeier, T., Gilgen, A., Krieger, U. K., Peter, T., Shiraiwa, M., and Ammann, M.: Shikimic acid ozonolysis kinetics of the transition from liquid aqueous solution to highly viscous glass, Phys. Chem. Chem. Phys., 17, 31101–31109, https://doi.org/10.1039/C5CP04544D, 2015.
Surratt, J. D., Murphy, S. M., Kroll, J. H., Ng, N. L., Hildebrandt, L., Sorooshian, A., Szmigielski, R., Vermeylen, R., Maenhaut, W., Claeys, M., Flagan, R. C., and Seinfeld, J. H.: Chemical Composition of Secondary Organic Aerosol Formed from the Photooxidation of Isoprene, J. Phys. Chem. A, 110, 9665–9690, https://doi.org/10.1021/jp061734m, 2006.
Surratt, J. D., Chan, A. W. H., Eddingsaas, N. C., Chan, M., Loza, C. L., Kwan, A. J., Hersey, S. P., Flagan, R. C., Wennberg, P. O., and Seinfeld, J. H.: Reactive intermediates revealed in secondary organic aerosol formation from isoprene, P. Natl. Acad. Sci. USA, 107, 6640–6645, https://doi.org/10.1073/pnas.0911114107, 2010.
Vaden, T. D., Imre, D., Beránek, J., Shrivastava, M., and Zelenyuk, A.: Evaporation kinetics and phase of laboratory and ambient secondary organic aerosol, P. Natl. Acad. Sci. USA, 108, 2190–2195, https://doi.org/10.1073/pnas.1013391108, 2011.
Virtanen, A., Joutsensaari, J., Koop, T., Kannosto, J., Yli-Pirilä, P., Leskinen, J., Mäkelä, J. M., Holopainen, J. K., Pöschl, U., Kulmala, M., Worsnop, D. R., and Laaksonen, A.: An amorphous solid state of biogenic secondary organic aerosol particles, Nature, 467, 824–827, https://doi.org/10.1038/nature09455, 2010.
Virtanen, A., Kannosto, J., Kuuluvainen, H., Arffman, A., Joutsensaari, J., Saukko, E., Hao, L., Yli-Pirilä, P., Tiitta, P., Holopainen, J. K., Keskinen, J., Worsnop, D. R., Smith, J. N., and Laaksonen, A.: Bounce behavior of freshly nucleated biogenic secondary organic aerosol particles, Atmos. Chem. Phys., 11, 8759–8766, https://doi.org/10.5194/acp-11-8759-2011, 2011.
Wang, B., O'Brien, R. E., Kelly, S. T., Shilling, J. E., Moffet, R. C., Gilles, M. K., and Laskin, A.: Reactivity of Liquid and Semisolid Secondary Organic Carbon with Chloride and Nitrate in Atmospheric Aerosols, J. Phys. Chem. A, 119, 4498–4508, https://doi.org/10.1021/jp510336q, 2015.
Wheeler, M. J. and Bertram, A. K.: Deposition nucleation on mineral dust particles: a case against classical nucleation theory with the assumption of a single contact angle, Atmos. Chem. Phys., 12, 1189–1201, https://doi.org/10.5194/acp-12-1189-2012, 2012.
Widengren, J. and Rigler, R.: Mechanisms of photobleaching investigated by fluorescence correlation spectroscopy, Bioimaging, 4, 149–157, https://doi.org/10.1002/1361-6374(199609)4:3<149::AID-BIO5>3.0.CO;2-D, 1996.
Wilson, T. W., Murray, B. J., Wagner, R., Möhler, O., Saathoff, H., Schnaiter, M., Skrotzki, J., Price, H. C., Malkin, T. L., Dobbie, S., and Al-Jumur, S. M. R. K.: Glassy aerosols with a range of compositions nucleate ice heterogeneously at cirrus temperatures, Atmos. Chem. Phys., 12, 8611–8632, https://doi.org/10.5194/acp-12-8611-2012, 2012.
Wong, J. P. S., Zhou, S., and Abbatt, J. P. D.: Changes in Secondary Organic Aerosol Composition and Mass due to Photolysis: Relative Humidity Dependence, J. Phys. Chem. A, 119, 4309–4316, https://doi.org/10.1021/jp506898c, 2015.
Ye, Q., Robinson, E. S., Ding, X., Ye, P., Sullivan, R. C., and Donahue, N. M.: Mixing of secondary organic aerosols versus relative humidity, P. Natl. Acad. Sci. USA, 113, 12649–12654, https://doi.org/10.1073/pnas.1604536113, 2016.
Ye, Q., Upshur, M. A., Robinson, E. S., Geiger, F. M., Sullivan, R. C., Thomson, R. J., and Donahue, N. M.: Following Particle-Particle Mixing in Atmospheric Secondary Organic Aerosols by Using Isotopically Labeled Terpenes, Chem., 4, 318–333, https://doi.org/10.1016/j.chempr.2017.12.008, 2018.
Yeung, M. C., Lee, A. K. Y., and Chan, C. K.: Phase Transition and Hygroscopic Properties of Internally Mixed Ammonium Sulfate and Adipic Acid (AS-AA) Particles by Optical Microscopic Imaging and Raman Spectroscopy, Aero. Sci. Tech., 43, 387–399, https://doi.org/10.1080/02786820802672904, 2009.
Zaveri, R. A., Easter, R. C., Shilling, J. E., and Seinfeld, J. H.: Modeling kinetic partitioning of secondary organic aerosol and size distribution dynamics: representing effects of volatility, phase state, and particle-phase reaction, Atmos. Chem. Phys., 14, 5153–5181, https://doi.org/10.5194/acp-14-5153-2014, 2014.
Zaveri, R. A., Shilling, J. E., Zelenyuk, A., Liu, J., Bell, D. M., D'Ambro, E. L., Gaston, C. J., Thornton, J. A., Laskin, A., Lin, P., Wilson, J., Easter, R. C., Wang, J., Bertram, A. K., Martin, S. T., Seinfeld, J. H., and Worsnop, D. R.: Growth Kinetics and Size Distribution Dynamics of Viscous Secondary Organic Aerosol, Environ. Sci. Technol., 52, 1191–1199, https://doi.org/10.1021/acs.est.7b04623, 2018.
Zelenyuk, A., Imre, D., Beránek, J., Abramson, E., Wilson, J., and Shrivastava, M.: Synergy between Secondary Organic Aerosols and Long-Range Transport of Polycyclic Aromatic Hydrocarbons, Environ. Sci. Technol., 46, 12459–12466, https://doi.org/10.1021/es302743z, 2012.
Zhang, Q., Jimenez, J. L., Canagaratna, M. R., Allan, J. D., Coe, H., Ulbrich, I., Alfarra, M. R., Takami, A., Middlebrook, A. M., Sun, Y. L., Dzepina, K., Dunlea, E., Docherty, K., DeCarlo, P. F., Salcedo, D., Onasch, T., Jayne, J. T., Miyoshi, T., Shimono, A., Hatakeyama, S., Takegawa, N., Kondo, Y., Schneider, J., Drewnick, F., Borrmann, S., Weimer, S., Demerjian, K., Williams, P., Bower, K., Bahreini, R., Cottrell, L., Griffin, R. J., Rautiainen, J., Sun, J. Y., Zhang, Y. M., and Worsnop, D. R.: Ubiquity and dominance of oxygenated species in organic aerosols in anthropogenically-influenced Northern Hemisphere midlatitudes, Geophys. Res. Lett., 34, L13801, https://doi.org/10.1029/2007GL029979, 2007.
Zhou, S., Lee, A. K. Y., McWhinney, R. D. and Abbatt, J. P. D.: Burial Effects of Organic Coatings on the Heterogeneous Reactivity of Particle-Borne Benzo[a]pyrene (BaP) toward Ozone, J. Phys. Chem. A, 116, 7050–7056, https://doi.org/10.1021/jp3030705, 2012.