the Creative Commons Attribution 4.0 License.
the Creative Commons Attribution 4.0 License.
 | 07 Sep 2018
Examination on total ozone column retrievals by Brewer spectrophotometry using different processing software
Anna Maria Siani
Francesca Frasca
Francesco Scarlatti
Arianna Religi
Henri Diémoz
Giuseppe R. Casale
Massimiliano Pedone
Volodya Savastiouk
The availability of long-term records of the total ozone content (TOC) represents a valuable source of information for studies on the assessment of short- and long-term atmospheric changes and their impact on the terrestrial ecosystem. In particular, ground-based observations represent a valuable tool for validating satellite-derived products. To our knowledge, details about software packages for processing Brewer spectrophotometer measurements and for retrieving the TOC are seldom specified in studies using such datasets. The sources of the differences among retrieved TOCs from the Brewer instruments located at the Italian stations of Rome and Aosta, using three freely available codes (Brewer Processing Software, BPS; O3Brewer software; and European Brewer Network (EUBREWNET) level 1.5 products) are investigated here. Ground-based TOCs are also compared with Ozone Monitoring Instrument (OMI) TOC retrievals used as an independent dataset since no other instruments near the Brewer sites are available.
The overall agreement of the BPS and O3Brewer TOC data with EUBREWNET data is within the estimated total uncertainty in the retrieval of total ozone from a Brewer spectrophotometer (1 %). However, differences can be found depending on the software in use. Such differences become larger when the instrumental sensitivity exhibits a fast and dramatic drift which can affect the ozone retrievals significantly. Moreover, if daily mean values are directly generated by the software, differences can be observed due to the configuration set by the users to process single ozone measurement and the rejection rules applied to data to calculate the daily value.
This work aims to provide useful information both for scientists engaged in ozone measurements with Brewer spectrophotometers and for stakeholders of the Brewer data products available on Web-based platforms.


Although ozone (O3) is present in small amounts in the terrestrial atmosphere, it plays a crucial role in the attenuation of solar ultraviolet (UV) radiation (200–400 nm) reaching the surface and in radiative processes controlling the energy balance on the Earth (Ramanathan and Dickinson, 1979; Dessler, 2000; Bordi et al., 2012; WMO, 2015).
The cumulative amount of stratospheric and tropospheric ozone represents the total ozone column (TOC). The most common ground-based instruments for measuring TOC are spectrophotometers which are designed to measure ground level spectral intensities of solar ultraviolet radiation attenuated by the ozone absorption. From these spectra, it is possible to retrieve the TOCs. The first TOC observations were recorded using a Dobson spectrophotometer in the late 1920s (Dobson and Harrison, 1926). Since then, a growing number of sites have been equipped with Dobson spectrophotometers, and in the 1980s they began to be equipped with automated Brewer spectrophotometers (Brewer, 1973). Nowadays, both Dobson and Brewer spectrophotometers are used all over the world, and the accuracy of measurements taken with a well-maintained Brewer spectrophotometer is 1 % in the direct-sun (DS) mode (Vanicek, 2006).
It should be pointed out that high-quality TOC retrievals from ground-based stations are necessary not only in support of the validation of satellite-derived products (Tzortziou et al., 2012) but also for the assessment of the long-term ozone trend and the verification of the effectiveness of the Montreal Protocol on substances that deplete the ozone layer. Moreover, ground-based TOC data are also necessary to calibrate the parameters in the global climate models used to predict the expected behaviour of the ozone layer in the future (Stübi et al., 2017). The above issues show the importance of measuring the ozone amount from ground-based stations with a very good performance. Even though all available processing software packages use the same TOC retrieval algorithm, which is based on the Bouguer–Lambert–Beer law, slightly different implementations potentially trigger some differences in the processed TOC data.
The largest part of the total ozone column data analysed in the current/available scientific literature is extracted from the WOUDC data archive (World Ozone and Ultraviolet Radiation Data Centre). To our knowledge, the processing software of Brewer TOC data varies from site to site; the processing algorithm and the data rejection rules are seldom specified. WOUDC (2017) ozone files do not include information on the software used to process ozone data, the version of such software or the adopted data rejection rules. The same information is usually not reported in studies related to ozone monitoring, trend detection and satellite validation. This can be due to the fact that no standard processing software of Brewer raw data has yet been adopted. For this reason, the European Cooperation in Science and Technology (COST) Action ES1207 “A European Brewer Network” (EUBREWNET) was established aiming at defining, among others, a standard procedure to process the raw Brewer data, thus ensuring the quality of the data and harmonizing the products from the European Brewer instruments (EUBREWNET, 2017).
The purpose of the present study is to investigate the differences among the TOCs retrieved by three different processing software packages: Brewer Processing Software, hereafter called BPS, developed by Dr. Vitali Fioletov and Akira Ogyu (Environment Canada); O3Brewer software, developed by Ing Martin Stanek (Solar and Ozone Observatory of CHMI/International Ozone Service); and the EUBREWNET level 1.5 ozone products. For the purpose of an intercomparison exercise, we tested the mentioned software on the datasets collected by the Brewer instruments installed at Rome and Aosta, Italy. Then, Brewer ozone recalculations were also compared with the Ozone Monitoring Instrument (OMI) TOC retrievals. The OMI data were used since no other independent collocated instruments for measuring TOC were available.
This paper is structured as follows: Sect. 2.1 briefly describes the theory on the ozone estimates from Brewer DS measurements. In Sect. 2.3, the procedure used by three software packages for processing ozone data is presented. Section 2.4 describes the Brewer stations under study. Section 3 is dedicated to the comparison among the three TOC data retrievals and to understanding the causes responsible for the differences among processed ozone values. Additional comparison between ground-based data and OMI products is also carried out. Moreover, ozone trends are estimated to investigate if the use of specific software could affect the results. Finally, conclusions are drawn in the last section.
2.1 Theory of direct-sun measurements with Brewer spectrophotometers
The Brewer spectrophotometer is an instrument designed to retrieve the total ozone column by measuring irradiances of both direct sunlight (Kerr et al., 1981) and polarized radiation scattered from the zenith sky (ZS; Brewer and Kerr, 1973; Muthama et al., 1995). Total ozone can be also derived from focused sun measurements, commonly employed at high latitudes (Josefsson, 1992). It is also possible to determine total ozone by using the moon as a light source (Kerr et al., 1990), or measuring the global spectral irradiance in the UV region (Kerr and Davis, 2007).
The most accurate method for determining the total column amount of a gas in the atmosphere is based on the DS measurements. It has been shown (Vanicek, 2006) that the accuracy of measurements taken with a well-maintained Brewer spectrophotometer is 1 % in the DS mode and 3 %–4 % in the ZS mode. The random errors of individual measurements have been found to be within ±1 % for all measurements (Fioletov et al., 2005).
The algorithm to retrieve the total ozone column from the Brewer in DS mode is based on a differential measurement method involving four selected wavelengths in the ozone absorption spectra, nominally 310.1, 313.5, 316.8 and 320.1 nm. The wavelengths are selected by a rapidly rotating slit mask, and raw photon counts for each slit mask wavelength position (from 3 to 6) are registered by a photomultiplier. During each measurement run cycle the slit mask is rotated 20 times. The raw photon counts are then converted into count rates and are corrected for the characteristics of the photomultiplier (dark count and dead time) and for the internal Brewer temperature (Kerr, 2010). In addition, a correction for the spectral transmittance of the attenuation filters can be added depending on the filter used if the respective characterization is available.
A linear combination (F) of the base-ten logarithms of the count rates (Fi) measured during the direct-sun spectral irradiance observations for the ith slit is computed by weighting the Fi with coefficients (wi=1, −0.5, −2.2, +1.7). The weighting coefficients are chosen in order to minimize the effect of the aerosol extinction and to eliminate the effect of sulfur dioxide absorption (Kerr et al., 1981; Kerr, 2010) and all factors independent of the wavelength (flat factors):
Fi is also compensated for the effect of the Rayleigh scattering by subtracting
where p is the climatological pressure at the measurement site and po is the pressure at the sea level; μR is the Rayleigh air mass factor (i.e. the slant path of direct radiation through air), calculated for a thin layer at 5 km altitude; and βi is the Rayleigh scattering coefficient at the wavelength, λi.
According to the Bouguer–Lambert–Beer law, it is possible to retrieve the TOC as
where Δα is the differential ozone absorption coefficient, i.e. the linear combination of the ozone cross sections using the same weighting coefficients employed for F. Δα is calculated after performing a specific test using spectral lamps providing the precise operational wavelengths and applying the convolution with the slit function characterized for each individual spectrophotometer. Then Δα is obtained for these wavelengths using the Bass–Paur ozone absorption spectrum (Bass and Paur, 1985) at the fixed temperature of −45 ∘C (Kerr, 2010).
The standard Brewer algorithm assumes that the ozone is concentrated in a thin layer at an altitude of 22 km; thus the air mass factor (μ) is expressed by
where RE is the Earth's radius and Z is the solar zenith angle. Fo is also expressed as the linear combination of the extraterrestrial irradiance at the operational Brewer wavelengths with the same weighting coefficients used for F. Fo corresponds to F at the top of the atmosphere and it usually named “extraterrestrial constant” (ETC), a specific factor different for each Brewer, and determined through a calibration procedure.
There are two methods to determine the ETC. The first is based on the use of the Langley plot technique, i.e. plotting F versus μ, and then the ETC value is extrapolated at zero air mass. This method is used for the calibration of primary standards and should be carried out under stable atmospheric conditions and low pollution concentrations. The second method is based on transferring the calibration from a reference Brewer instrument with a known ETC to a candidate instrument during field campaigns. This latter technique is the most common way to regularly calibrate the instruments which belong to the Brewer network. In between the calibration audits with a travelling standard, the TOC data are processed adjusting the ETC according to the changes of the radiometric sensitivity of the instrument if needed. The correction uses time series of the internal standard lamp tests, described in the Sect. 2.2.
Direct-sun measurements are carried out at specific solar zenith angles throughout the day depending on the user schedule (a sequence of commands written by the operator), allowing the Brewer to make observations continuously and automatically. During a DS measurement, a group of five consecutive sub-measurements are taken in less than 5 min. Then the mean and the standard deviation of the five ozone values are computed and associated with that DS measurement. The standard deviation is used to determine the acceptability of each TOC measurement. An individual TOC value is normally considered acceptable if the standard deviation of the five measurements is lower than 2.5 or 3 DU.
2.2 Standard lamp correction
Several tests are performed on a daily and weekly basis to verify that the Brewer operates correctly and to track the changes in instrumental properties. The main standard tests included in the diurnal operational schedule are shutter motor run/stop (RS), photomultiplier dead time (DT), mercury lamp (Hg) and standard lamp (SL).
The RS test verifies that the slit mask motor is operating properly. It calculates the ratio of irradiances at the operational wavelength using an internal 20 W quartz–halogen lamp as the light source in a dynamic mode and in a static mode. This ratio should be as close as possible to unity.
The DT test measures the dead time of the photomultiplier and the photon-counting circuitry, and the result of the test value should be within 5 ns with respect to the instrument constant. Also during the DT test, the halogen lamp is turned on.
For the Hg test a mercury lamp is used. This test ensures the correct wavelength alignment of the Brewer due to the internal temperature changes. This test is usually carried out several times every day.
The SL test is used to monitor the stability of the instrument response after the calibration with the reference spectrophotometer. The test is performed using the internal quartz–halogen lamp as the light source. The photon counts are recorded at the same operational wavelengths employed in the DS measurement, and the result of the SL test, the so-called R6 ratio which corresponds to a fictitious value of ozone column density, is determined using Eq. (1). In this way changes with respect to the reference R6 value (R6ref), determined during the calibration with the reference instrument, are constantly tracked. If a change in R6 is experienced, this results in a corresponding change in the ETC assuming that the relative lamp intensities at the four wavelengths do not change. Consequently, a correction in the reference ETC should be applied to determine the ozone values in between each calibration, as follows:
where ΔSL is the correction factor measuring the difference between R6ref which is determined at every calibration and R6 for a specific day.
Depending on the processing software used by the station operator, ΔSL is computed in different ways, not always clearly explained by the software documentation.
In the BPS, the reference value R6ref is determined with a triangular smoothing filter of SL test values over the 15-day period immediately following the calibration date. There should be at least one good SL test value per day. If the corresponding B-files are not available, the program is not able to establish the reference SL level and the ETC will not be adjusted. Notice that for other processing software R6ref is based on the SL test values during the calibration campaign. If the abs(R6ref−R6) ≤250 units, then the median of daily averages from all R6 data before 15 days and after 15 days for a particular day is used for the correction. The median is used because it is less influenced by single invalid R6s. If the abs(R6ref−R6) is above 250 units, then ETC is adjusted taking into account the difference between the R6ref and the present daily mean values of R6. That correction is reported in the file named “o3data” produced by the BPS. The threshold and the time window are however not adjustable by the users (Vitali Fioletov, personal communication, 2018).
O3Brewer adjusts the ETC using a Gaussian smoothing filter on R6 values (Stanek, 2016). There should be SL measurements 10 days before and 10 days after the selected date period. The software creates the smoothed R6 time series (hereafter named R6smooth) which is used for the ETC adjustment. This means that there should be at least one SL test per day. The ETC correction is applied when the difference between the reference R6ref and R6 from SL test results does not exceed a predefined value (the default value is 500 units). This threshold is now configurable in the latest version, 6.0 (Martin Stanek, personal communication, 2018). The time window is however not adjustable by the users. If this difference exceeds the threshold, then the software can remember the last day with a good SL test and will apply that correction (Martin Stanek, personal communication, 2018). This option can be turned off, and then the daily mean values of the SL test are used for the correction of the ETC.
Level 1.5 total ozone column data from EUBREWNET are recalculated with the ΔSL correction determined by applying a triangular moving average over the daily median values of R6 within a 7-day window (default time window). The correction is applied if the difference between R6ref and the calculated value exceeds 5 units. Level 2.0 consists of level 1.5 products validated with a posterior calibration. If the reference constants of a posteriori calibration do not differ significantly from the values in use, then level 1.5 products are not reprocessed and represent the most reliable products (http://rbcce.aemet.es/dokuwiki/doku.php; last access: 1 March 2018).
At the present time, tools for level 2.0 have been developed but not yet implemented. A complete description of the processing can be found on the EUBREWNET website (2017).
2.3 Measuring instruments and sites
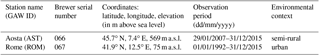
Brewer MKIV spectrophotometers serial numbers 067 and 066 have been operating at the Solar Radiometry Observatory of Sapienza University of Rome (hereafter Rome) and at the headquarters of the Aosta Valley Regional Environmental Protection Agency (ARPA) at Aosta-Saint Christophe (hereafter Aosta), respectively. The former has been recording TOCs since 1992 (Siani et al., 2002), and the latter since 2007 (Siani et al., 2013).
In this study the above-mentioned sites were selected because both Brewer instruments belong to Sapienza University of Rome and have been calibrated with the same reference spectrophotometer since their installation, regularly submitting data to the WOUDC and taking part in the COST Action ES1207 EUBREWNET. The station characteristics are reported in Table 1.
Table 2Calibration history of Brewer 066 and 067. In brackets the month of the calibration for Brewer 067 is reported. In one case the calibration of Italian Brewer instruments was performed in Arosa (Switzerland) at the Lichtklimatisches Observatorium during the Seventh Intercomparison Campaign of the Regional Brewer Calibration Center Europe (WMO-GAW, 2015). In 2013 the calibration of both Brewer instruments was carried out at Aosta.
* The recalculation of the constants was performed by IOS after the calibration in July 2009.
Since their installation, both Italian Brewer instruments have been calibrated every 1 or 2 years by intercomparison with the travelling reference Brewer 017 from International Ozone Services Inc. (IOS) (2017). This Brewer is in turn calibrated against the World Brewer Reference Triad in Toronto (Fioletov et al., 2005). In this way the ozone calibration of Italian spectrophotometers is also traceable to the Brewer Reference Triad.
The calibration history of the two instruments used in this study is reported in Table 2. Although zenith sky and global irradiance measurements were available, only DS measurements were selected in this study because they have a lower uncertainty compared to the other types of measurements (Fioletov et al., 2005).
In this study we analysed individual DS values and daily averages at Rome and Aosta stations, generated by BPS version 2.1.1 updated to 14 Ferbuary 2017 (Fioletov and Ogyu, 2007), by O3Brewer software packages version 6.0 updated to 14 March 2018 and by EUBREWNET level 1.5 ozone products. Level 1.5 individual TOC values are discarded when the standard deviation is above 2.5 DU and the maximum ozone air mass is above 3.5. In addition, ozone values less than 100 DU and greater than 500 DU are also rejected. The stray-light correction was not applied because it requires a calibration against a double-monochromator Brewer instrument and an instrumental characterization (Karppinen et al., 2015; Redondas et al., 2016) which was not available. Level 1.5 TOC values were downloaded from the EUBREWNET platform over the period 2005–2015 at Rome and 2007–2015 at Aosta.
In the configuration file of BPS and O3Brewer software, where it is suitable, we set the same rejection criteria as used in EUBREWNET, i.e. maximum standard deviation of 2.5 DU and maximum ozone air mass of 3.5.
The rejection criteria of ozone values are hardcoded in the BPS software and consist of three sequential checks: (1) if raw counts are less than 2500, the value is rejected; (2) if calculated ozone for DS or ZS is less than 50 DU, the value is rejected; and (3) if observation is in the DS mode and the calculated ozone is between 50 and 100 DU, the value is rejected (Akira Ogyu, personal communication, 2018). The maximum calculated ozone is indeed configurable in the BPS set-up and was set to 500 DU.
The limits on the calculated ozone are not configurable in the O3Brewer set-up. In the latest version used in this study, the standard lamp maximum value for applying the ETC correction from SL test results is now configurable. Here we used the default limit of 500 units for the difference between R6 and the reference R6ref.
2.4 Satellite TOC data
OMI products were used as an ancillary dataset with the purpose of understanding the difference among the investigated Brewer retrievals, and the comparison should not be regarded as exhaustive validation exercises of satellite total ozone data. Daily averages of the Brewer TOC were compared with satellite ozone values obtained during the overpass. The use of daily means instead of Brewer TOC observations taken close to the OMI overpass is reasonable since it allows a large number of pair measurements to be compared (Antón et al., 2009; Vaz Peres et al., 2017) because there are only one or two daily satellite values.
Satellite overpass data at Rome and Aosta were derived from OMI on board the NASA EOS-Aura spacecraft, launched in July 2004. The OMI instrument is a nadir-viewing spectrometer measuring solar-reflected and backscattered light from the Earth's atmosphere and surface in the wavelength range from 270 to 500 nm, providing global daily coverage with a spatial resolution of 13×24 km2 in nadir. The Aura satellite travels in a sun-synchronous polar orbit, crossing the Equator at 13:45 local time.
Two algorithms, OMI-TOMS (Total Ozone Mapping Spectrometer) and OMI-DOAS (differential optical absorption spectroscopy), are used to produce OMI daily total ozone datasets. In our study OMI-TOMS ozone overpasses based on the TOMS V8.5 algorithm (Bhartia and Wellemeyer, 2002) at the stations under study over the period 1 October 2004–31 December 2015 were downloaded from the NASA-Aura validation data centre platform. Here we used OMI-TOMS since it has a better agreement with the ground-based Brewer and Dobson instruments (Balis et al., 2007).
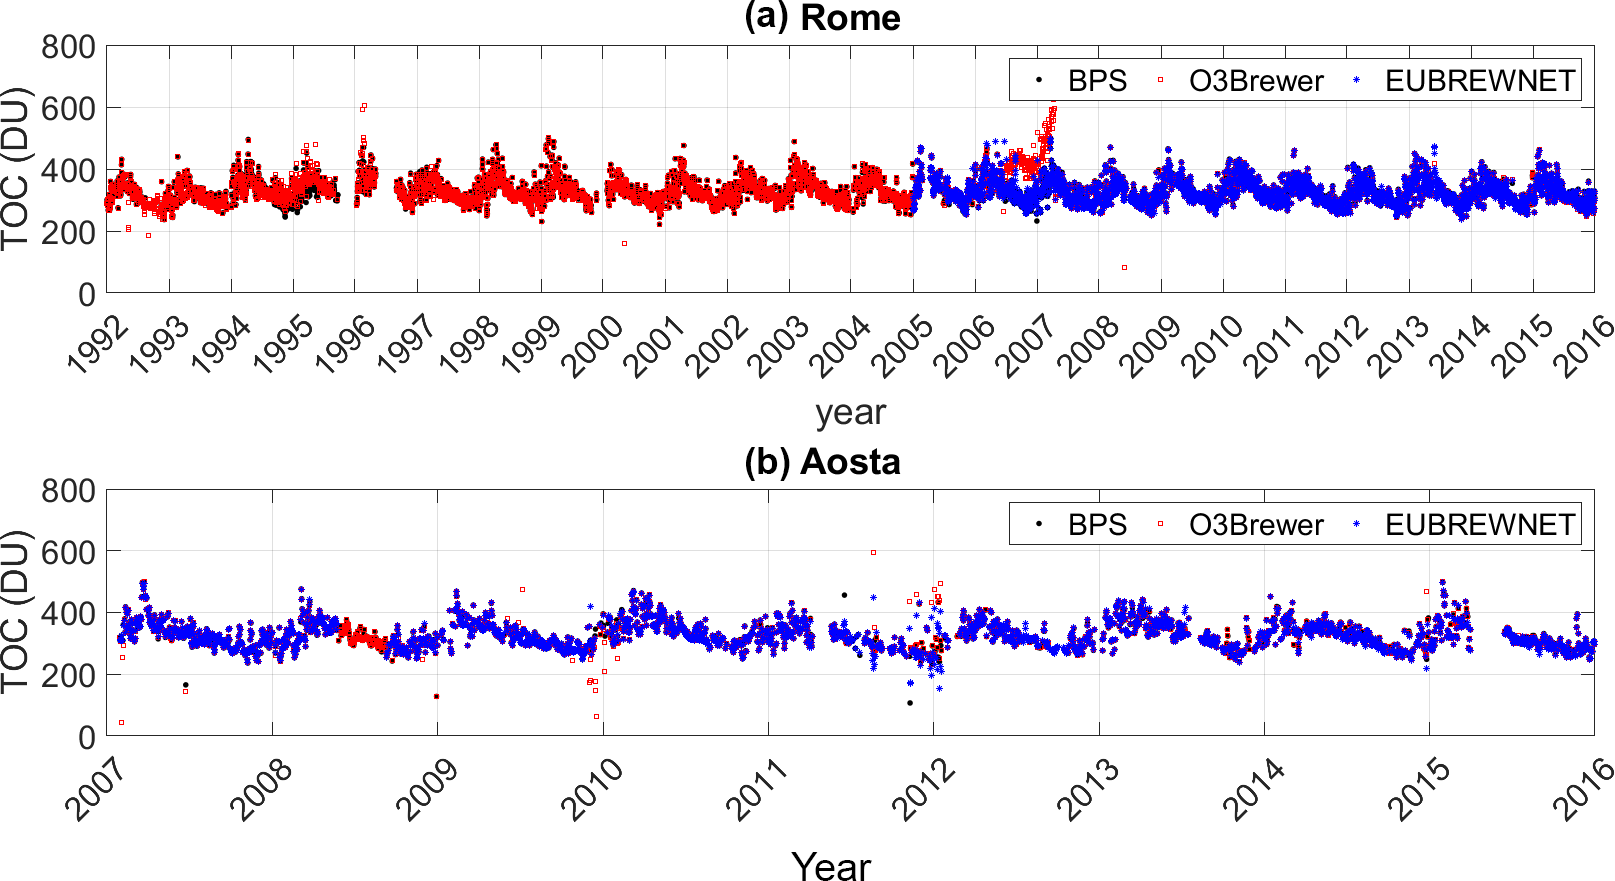
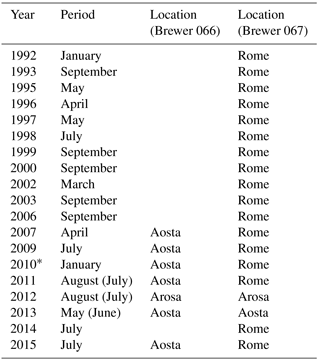
Figure 1Time series of TOC daily means from BPS (black), O3Brewer (red) and EUBREWNET (blue) at Rome (a) and at Aosta (b). At Aosta the EUBREWNET level 1.5 ozone values were not generated between 24 May and 8 September 2008, because the standard lamp burnt out in May 2008 and was replaced in September 2008.
2.5 Statistical parameters
The following statistical parameters were used with the aim of quantifying the differences among the TOC series: nonparametric Spearman coefficient (RHO), mean bias (MB), mean percentage error (MPE) and root mean square error (RMSE). RHO was used to measure the correlation between two variables without making any assumption about their distribution. MB represents the systematic differences between two selected datasets; MPE provides the average of percentage errors with respect to TOC values taken as the reference. RMSE is an estimate of the standard deviation of the difference (residuals) between two datasets.
In the formulas of the mentioned statistical parameters, yi is the ith TOC value (O3Brewer or OMI), is the ith TOC value of the BPS (or EUBREWNET) series and N is the number of all the possible data pairs analysed. The uncertainty of MB and MPE is characterized by the standard deviation.
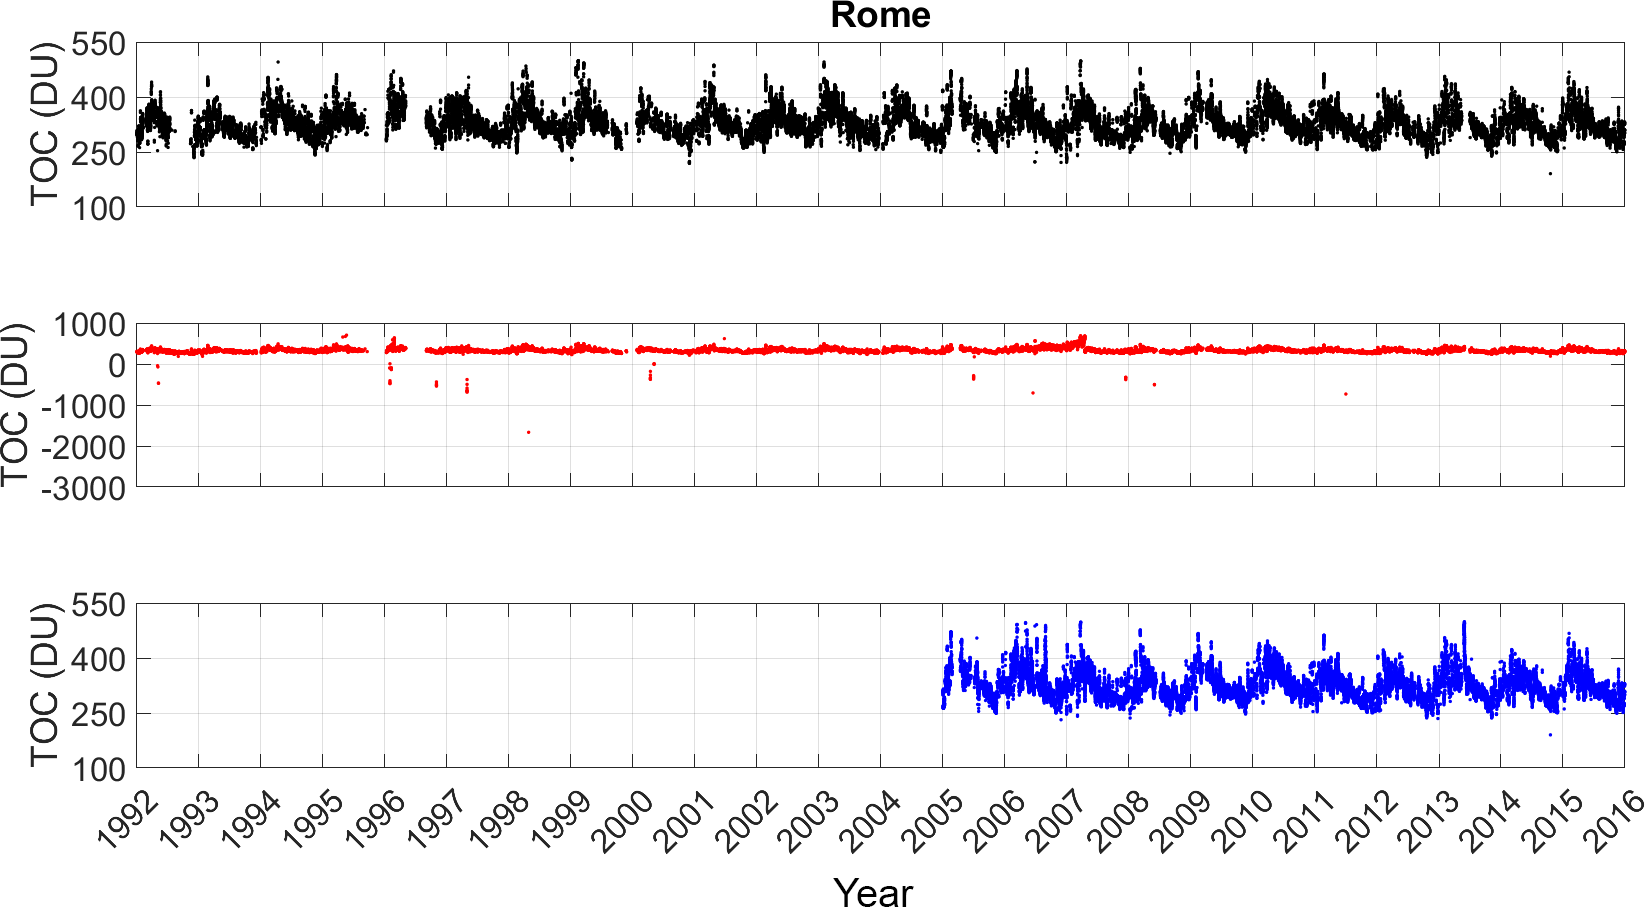
Figure 2Individual TOC values generated by BPS (black), O3Brewer (red) and EUBREWNET (blue) at Rome.
In the comparison between Brewer and OMI data the scaled correlation (RHOs) was calculated (Diémoz et al., 2016) to exclude the possibility that the source of the correlation is a common cycle (e.g. the annual cycle). That calculation was performed by splitting the series of the ozone daily values into short intervals (here K=30 days), and for each interval the RHO coefficient was determined. Then RHOs is given by
In this way the high-frequency component (< 30 days) common to Brewer and OMI series was revealed.
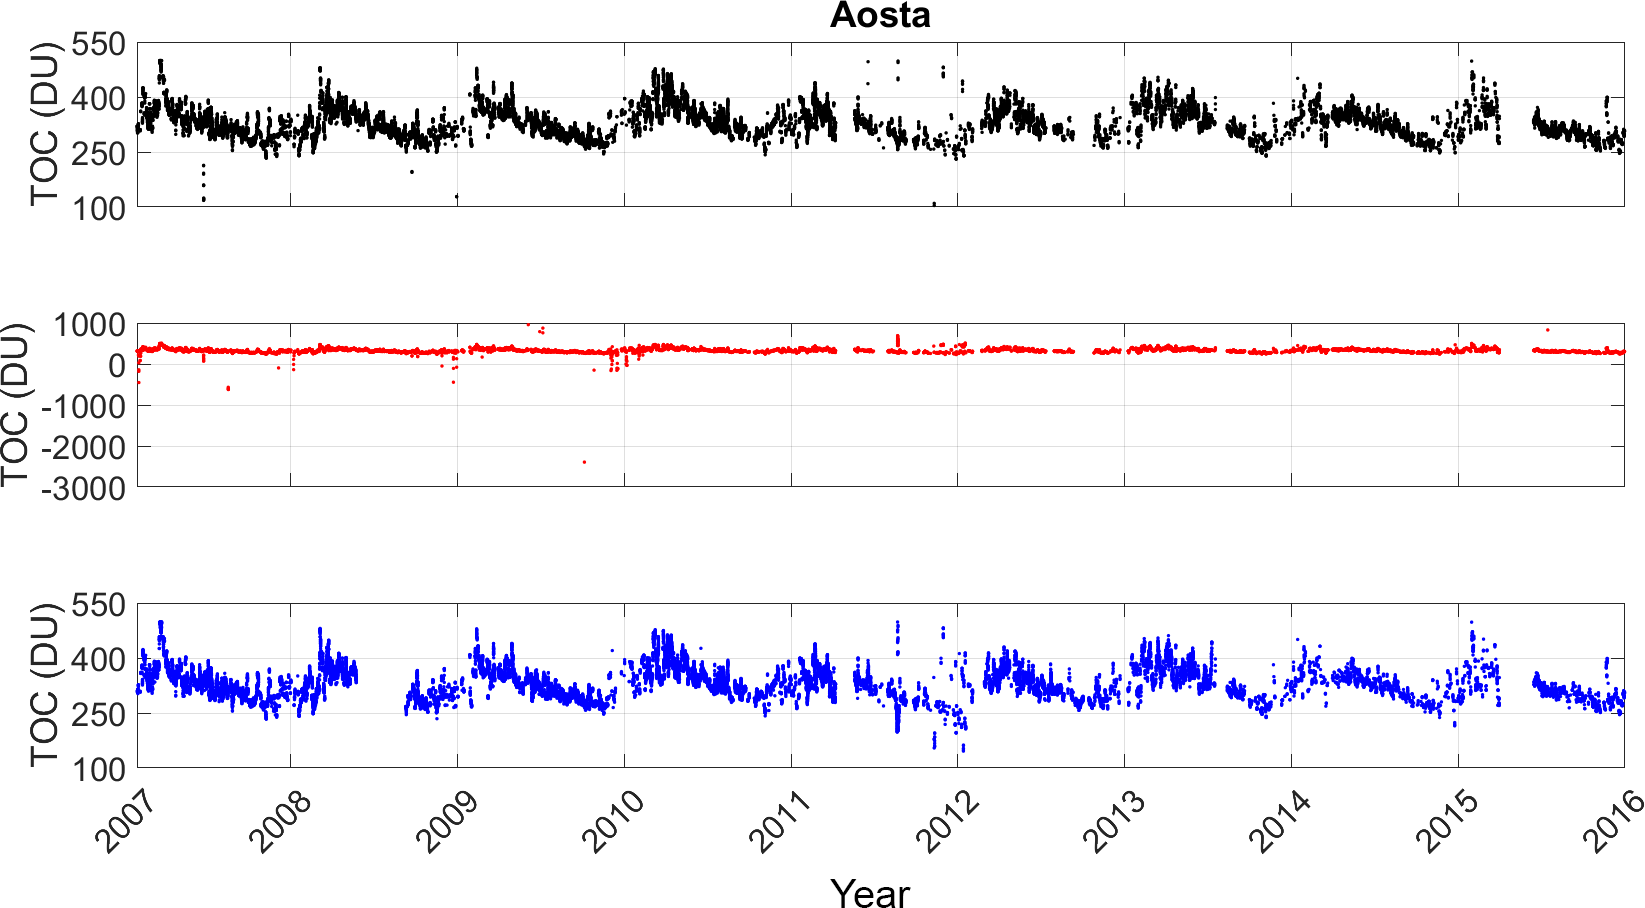
Figure 3Individual TOC values generated by BPS (black), O3Brewer (red) and EUBREWNET (blue) at Aosta.
2.6 Trend analysis
To assess whether specific software could affect the trend, we estimated the trend from the annual mean anomalies. We applied the methodology proposed by Fountoulakis et al. (2016). Climatological ozone values for each day were calculated over the period under study. The daily anomaly with respect to the daily climatological value was calculated. Afterward the monthly anomalies were determined by averaging the daily anomalies for each month provided that at least 15 days of data were available. Finally, the monthly anomalies were averaged to determine the annual mean anomalies. The trend among the three codes was expressed as the percentage change per decade and used in their comparison. The statistical significance of the trends was derived from the Mann–Kendall test with statistical significance set at p≤5 %.
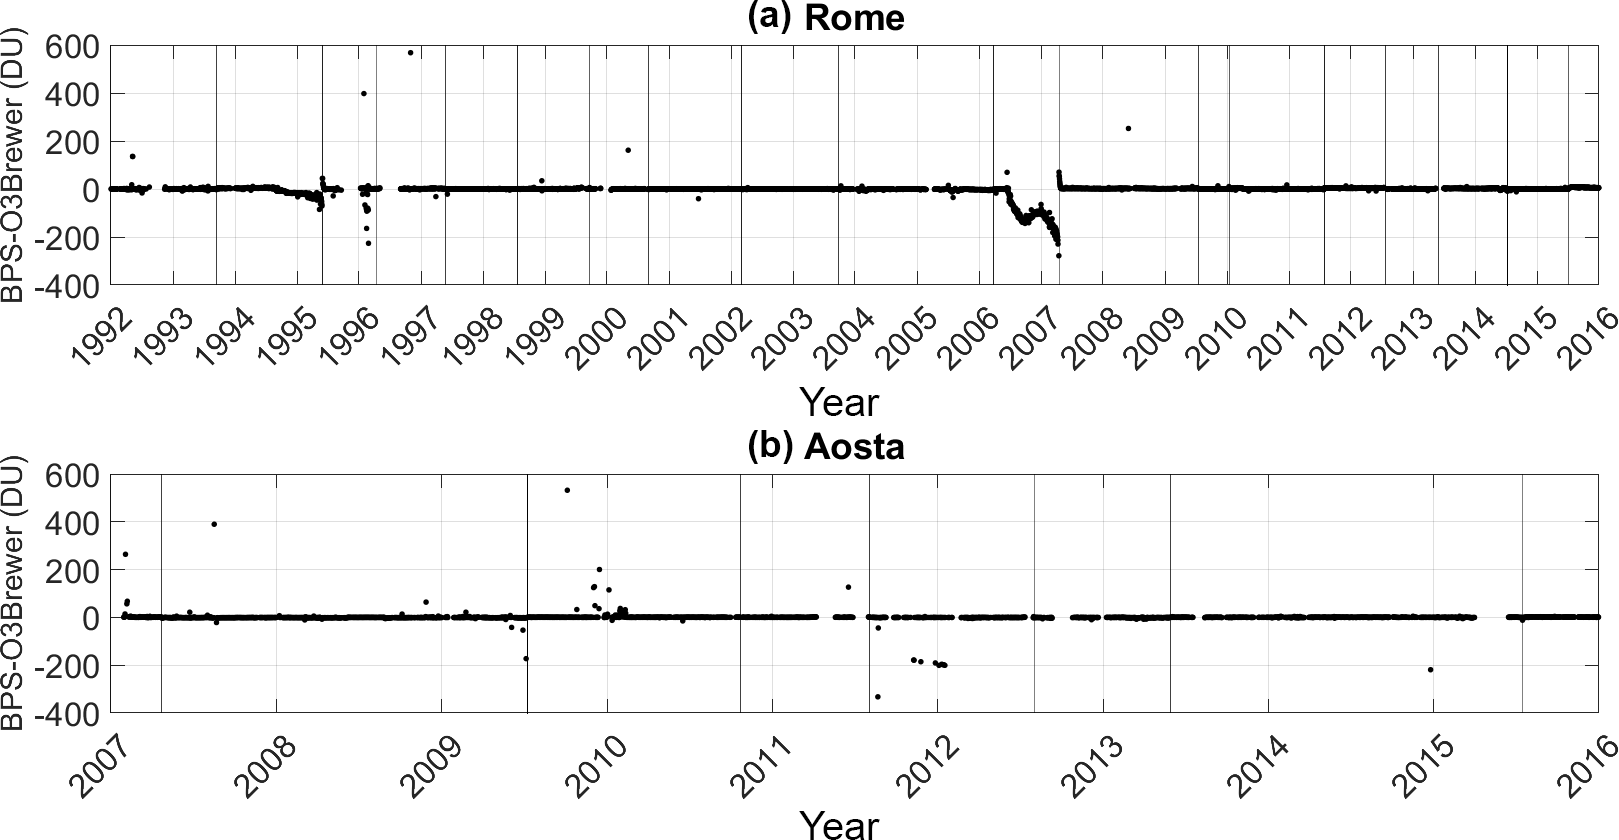
Figure 4Time plot of the differences between BPS and O3Brewer daily means at Rome (a) and at Aosta (b). Vertical lines represent the date of the calibration campaigns.
The time series of TOC daily means generated by BPS and O3Brewer and calculated from individual EUBREWNET ozone values are presented in Fig. 1 (upper panel: Rome; lower panel: Aosta). Individual measurements are distinctly plotted for each site in Figs. 2 and 3.
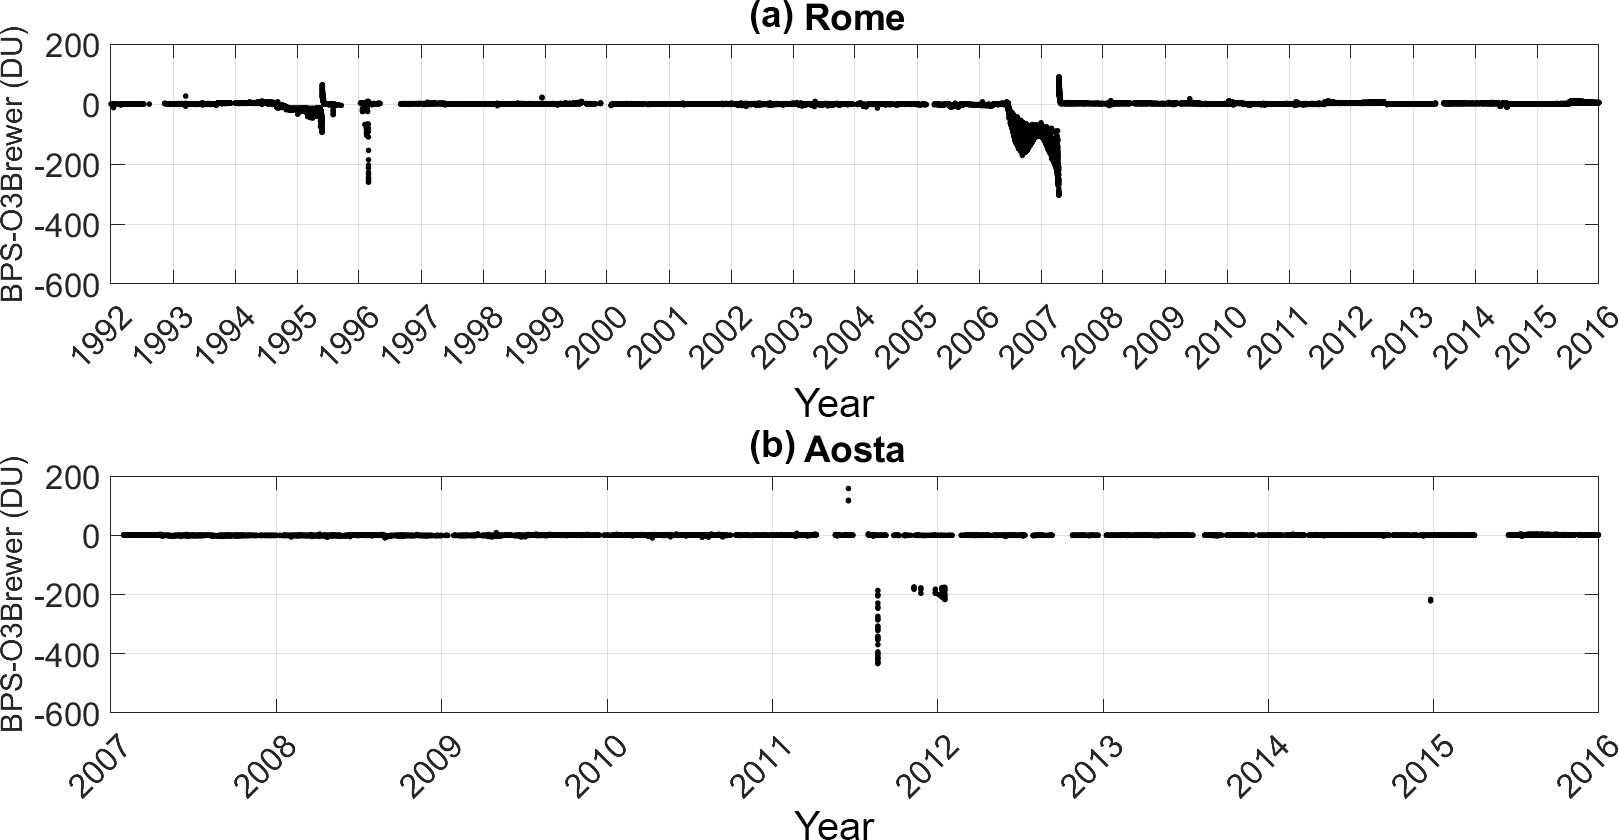
Figure 5Time plot of the differences between individual BPS and O3Brewer ozone values at Rome (a) and at Aosta (b).
It is worth noticing that ozone seasonal cycles show an overall similarity between the two sites with a maximum value in late spring and a minimum value in late autumn, both for daily means and for individual ozone series. The seasonal behaviour of O3Brewer is not easily distinguishable since the y-axis range has flattened due to negative recalculated ozone values. However, it is clearly visible that there are some periods in which TOC daily means as well as individual measurements obtained by the three processing software packages are different (mainly between 2006 and 2007 at Rome and at the end of 2011 at Aosta).
In order to understand where the differences came from, we analysed both individual TOC observations and the resulting daily values processed by BPS and O3Brewer. Afterwards we compared both TOC retrievals with EUBREWNET data. Finally, the processed Brewer data were compared with OMI products.
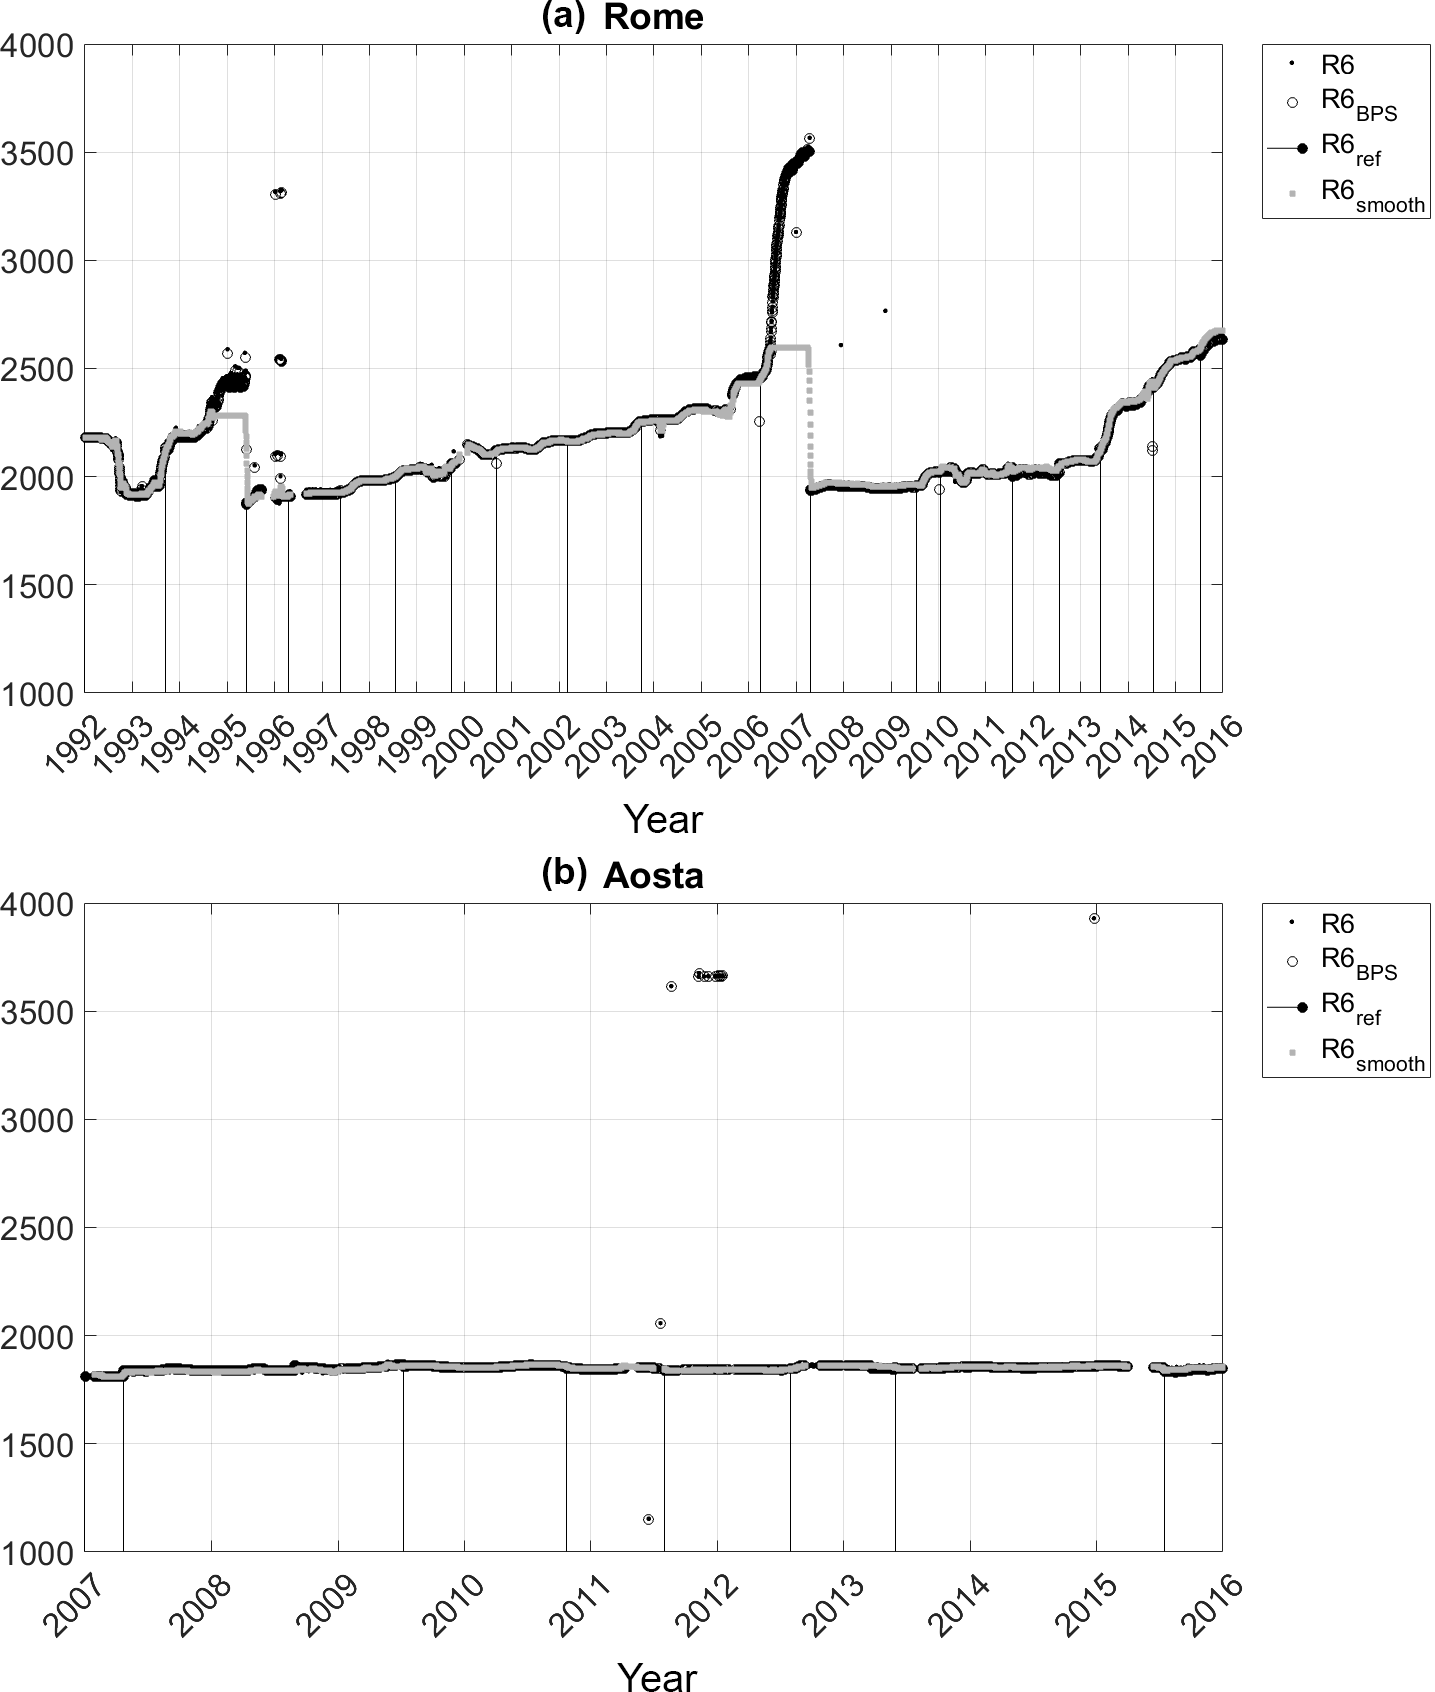
Figure 6Daily series of the ratios R6, R6BPS and R6smooth at Rome (a) and at Aosta (b). Vertical lines represent R6ref established during each calibration campaign. BPS discarded the two spikes in December 2007 and December 2008.
3.1 Comparison between BPS and O3Brewer TOC retrievals
Figure 4 shows the temporal behaviour of the ozone differences between BPS and O3Brewer and daily means, whereas Fig. 5 shows the differences between individual values. It can be noticed that in several cases large differences can be attributed to wrong negative ozone recalculations by O3Brewer as also shown in Figs. 2 and 3. The minimum and maximum differences in the daily means are −278.1 and 567.9 DU at Rome, and −332.3 and 532.0 DU at Aosta, respectively. The differences between individual BPS and O3Brewer ozone values range from a minimum of −304.4 DU to a maximum of 90.6 DU at Rome, and from −435.6 to −157.7 DU at Aosta.
We took into consideration the spectral sensitivity of both Brewer instruments through the R6 ratio time behaviour (Fig. 6). In the same figure, how each software package (R6BPS and R6smooth) tracks changes in the spectral sensitivity of the instrument is also plotted. R6BPS was obtained as the sum of BPS correction and R6ref. R6ref values established during the calibration campaigns are also plotted. It is worth noticing that the number of standard lamp test per day is on average from 4 to 6 at Rome, and from 2 to 4 in winter and from 8 to 10 in summer at Aosta, and that only the daily means of BPS correction and R6smooth are stored. The latter was calculated if at least one standard lamp test was performed.
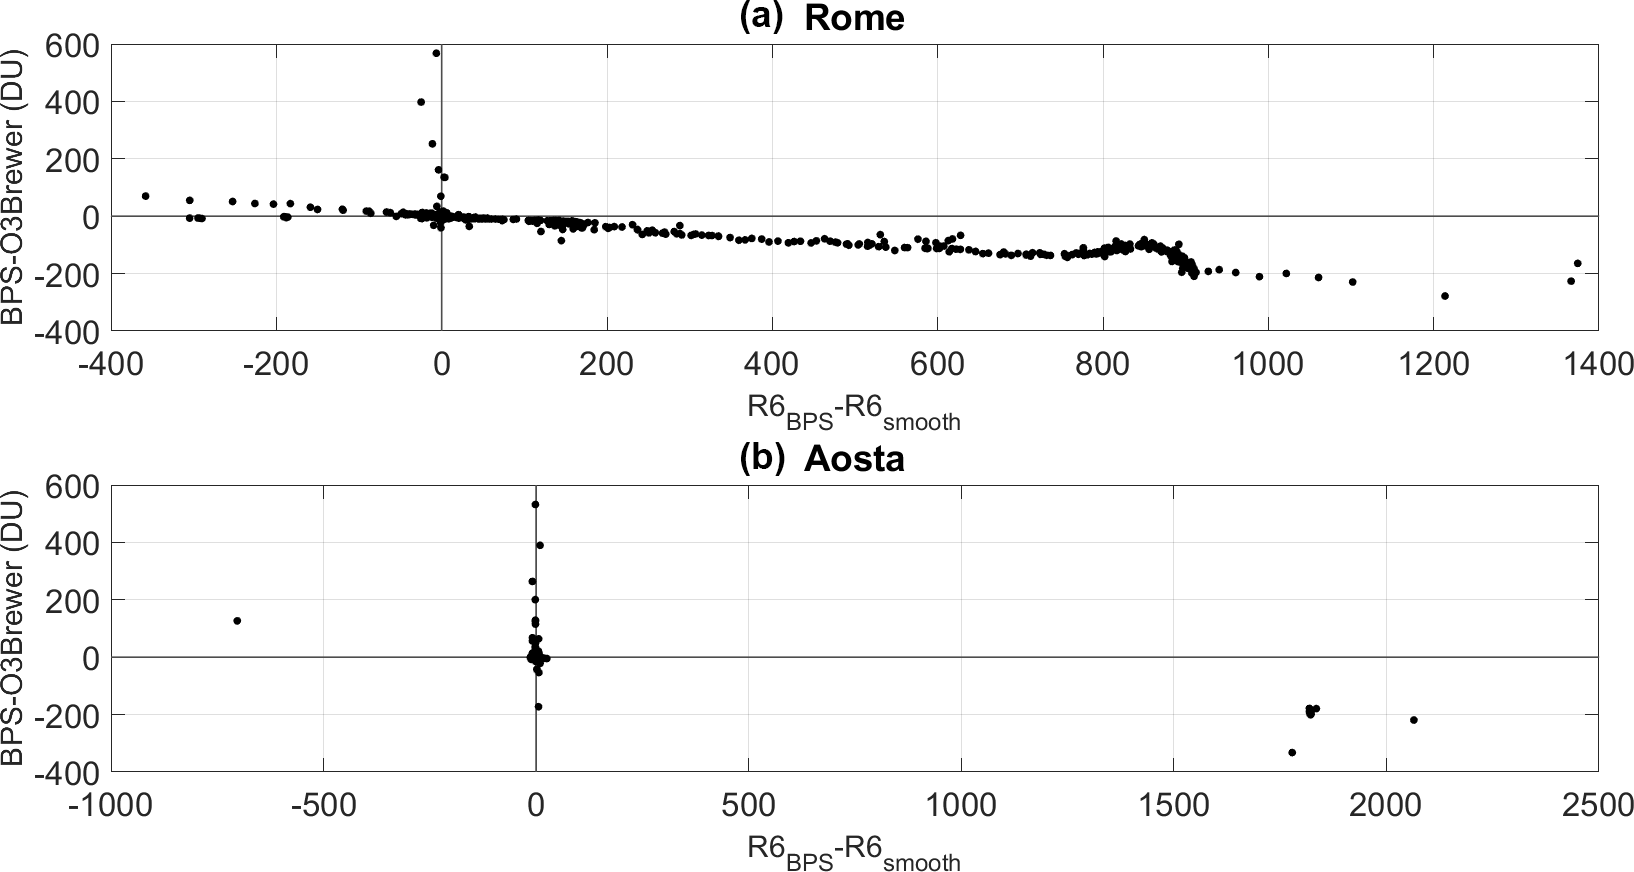
Figure 7Differences between BPS and O3Brewer TOC daily means vs. R6BPS–R6smooth at Rome (a) and at Aosta (b).
Looking at R6 behaviour (Fig. 6a), it can be noticed that the sensitivity of the instrument at Rome has changed mainly in two periods (between 1994 and 1995, and between 2006 and 2007). R6smooth becomes a constant offset when the sensitivity of the instrument starts to change. The cut-off is not exactly equal to the threshold set in the configuration (in this case 500 units) but lower, because the filter looks 10 days before and 10 days after the date when SL R6 is calculated. If the cut-off remains constant, it means that the last calculated correction which passes through rejection criteria is taken into account; the same situation is experienced when there is no valid SL test (Martin Stanek, personal communication, 2018). Consequently, the temporal behaviour of R6smooth during these time intervals appears as a plateau. In this case SL correction is not applied since it is too high. Once a new calibration is performed (i.e. new references of R6 and the ETC are defined), R6 and R6smooth show a similar behaviour again.
Brewer 066 (Aosta) exhibits a better stability except for some R6 spikes (Fig. 6b), whereas the R6smooth time series shows a stable behaviour with respect to R6. R6BPS shows a similar behaviour to R6 at both stations due to the calculation method of the standard lamp correction by the BPS.
A better visualization of the effect of the correction factor on TOCs is provided by plotting the difference between the TOC daily means (BPS–O3Brewer) as a function of the difference between R6BPS and R6smooth (Fig. 7). Large deviations between the two reprocessed TOC daily means appear when there is a large difference between R6BPS and R6smooth. However large differences occur even if R6BPS does not differ too much from R6smooth.
Three circumstances are analysed here when differences between BPS and O3Brewer ozone data exceed the value of the declared DS accuracy: R6BPS lower than R6smooth, R6BPS higher than R6smooth and R6BPS similar to R6smooth.
3.1.1 R6BPS lower than R6smooth
Slight ozone differences take place when R6BPS is lower than R6smooth (at least 100 units); then the difference in ozone daily means is between −3 % and 21 % and in the case of individual values from −3 % up to 27 % at Rome. At Aosta there is only one episode (18 June 2011) in which the O3Brewer daily mean differs by about 30 % from BPS. In that case, the O3Brewer average was derived by three individual ozone values that show the same difference with respect to the BPS ones. In this case, a large negative correction was applied to ozone values, thus generating a false high-ozone case. The spike in the R6 value originated in the two wrong SL tests carried out on that day, caused perhaps by the micrometer being in a wrong position, noisy communication, incorrect zenith drive position or lamp ageing. Consequently, the negative BPS correction generated high ozone values with a large standard deviation, whereas R6smooth was not applied to individual TOC data that have results consistent with ozone values before and after that date.
At Rome the conditions in which R6BPS is lower than R6smooth occurred during the calibrations in 1995, 2006, 2007 and 2014. The discrepancy between the two codes could have been caused by the offset introduced by the way BPS determines the R6 reference value because for the other code, the R6ref is set manually in the configuration. The BPS R6ref is computed with a triangular smoothing filter of SL test values over the 15-day period after the calibration, and it is calculated “on the fly” from daily mean SL values and not stored (Vitali Fioletov, personal communication, 2018).
To look into the possible effect of the BPS offset, we estimated R6ref_BPS for each day over the 15 days after the calibration by subtracting the correction (reported in the file o3data.txt) from the corresponding R6 value. Then the average over the 15 R6ref_BPS values was compared with R6ref (given by hand after the calibration). The estimated offset introduced by BPS with respect to R6ref is very small, ranging between −19 and 6 units at Rome and between −10 and 2 units at Aosta. Consequently, the BPS offset appears not to be responsible for the ozone differences that can be attributed to the calculation method of the standard lamp correction.
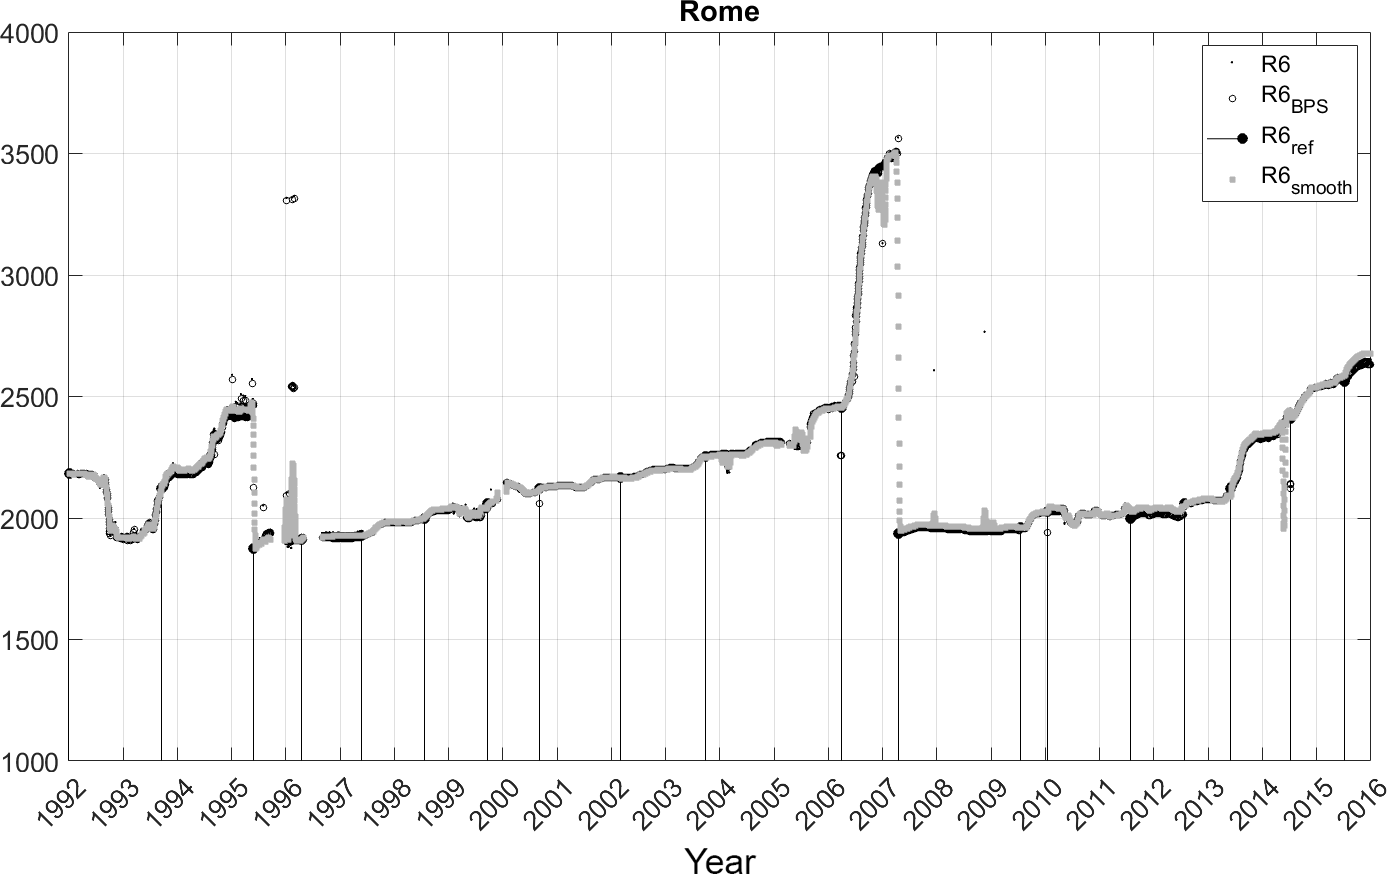
Figure 8Daily series of the ratios R6, R6BPS and R6smooth_3000 (setting the SL maximal limit to 3000 units, in the legend named R6smooth) at Rome. Vertical lines represent R6ref established during each calibration campaign.
3.1.2 R6BPS higher than R6smooth
Large negative ozone differences occur when R6BPS is higher than R6smooth (at least > 100 units). This causes a variation between the daily means generated by the codes from −5 % to −50 % at Rome and from −51 % to −91 % at Aosta. When the individual values are considered, a mean percentage difference between −3.1 % and −57 % is found at Rome; at Aosta the mean percentage difference is of the same magnitude as that found for the daily means.
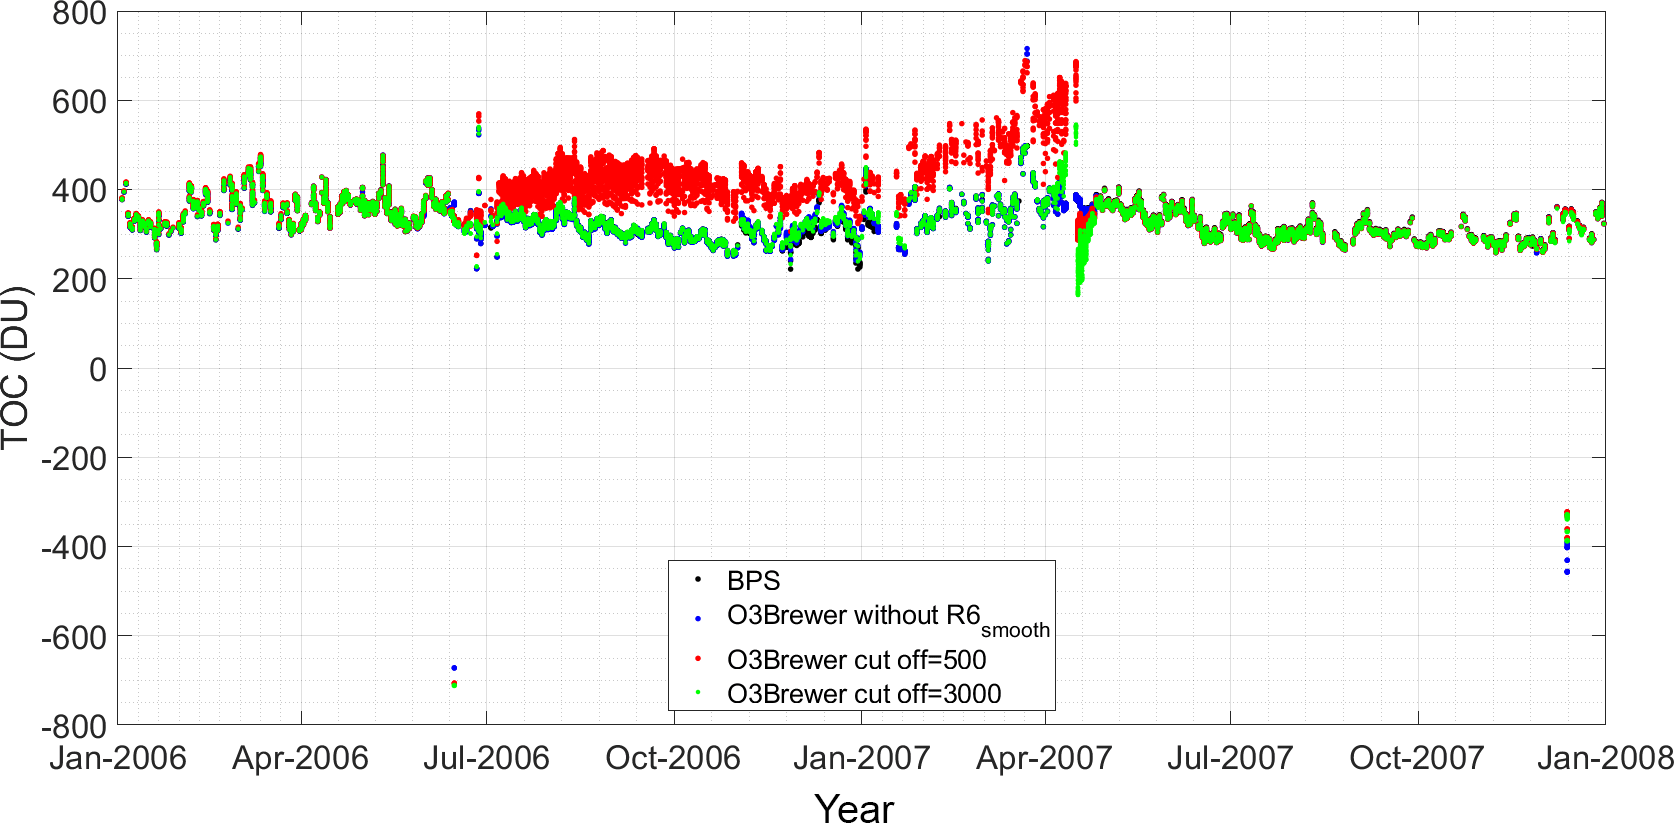
Figure 9Individual ozone values calculated by the BPS (black), by O3Brewer with the R6smooth correction turned off (blue; in this case the daily mean values of the SL test are used for the correction of the ETC), by O3Brewer with the cut-off set to 500 units (red) and by O3Brewer with the cut-off set to 3000 units (green) over the period of the R6 drift in 2006–2007 at Rome.
Two long periods are found at Rome with these conditions (29 October 1994–5 May 1995, 26 June 2006–16 April 2007). The large drift in R6 turned out to be the deterioration of the filter (NiSO4/UG11), which was replaced during the calibration visits both in 1995 and 2007. In both cases the cut-off in R6smooth can be observed, and hence the O3Brewer recalculation provided unusual TOC values. Then, we processed Rome ozone data using O3Brewer by setting the SL maximal limit to a higher value to assess whether the smoothing filter correction can properly process ozone data when large changes occurred in the instrumental response. The SL maximal correction limit was set to 3000 units, keeping identical conditions for the air mass and the standard deviation of the previous processing. In addition, ozone data were further processed by turning off the smoothing filter; in that case the R6smooth was not applied, and the daily mean values of the SL test are used for the correction of the ETC. Figure 8 shows the time series of the ratios R6, R6BPS and R6smooth_3000 (setting the SL maximal limit to 3000 units) at Rome. It can be noticed that R6smooth_3000 now has similar behaviour as R6BPS; nevertheless in some circumstances its behaviour is noisier than both R6smooth (when the SL maximal limit is set to 500 units as shown in Fig. 6) and R6BPS.
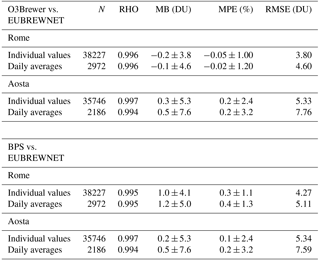
Table 3Summary of the statistics of O3Brewer vs. BPS at both sites (N: number of data; RHO: Spearman scaled correlation coefficient; MB: mean bias; MPE: mean percentage error; RMSE: root mean square error; the uncertainty of MB and MPE is characterized by the standard deviation).
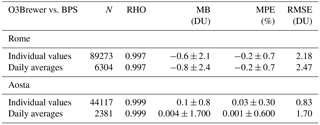
Figure 9 shows individual TOC data processed by O3Brewer (1) without applying R6smooth, (2) applying the R6smooth with the SL maximal limit correction set to 500 units and (3) applying the R6smooth_3000 with the SL maximal limit correction set to 3000 units at Rome over the period of the R6 drift in 2006–2007 at Rome. In the same figure, individual BPS recalculations without modifying the set-up are also plotted. A better agreement with BPS ozone data is visible when ozone data were processed without applying the R6smooth correction and with a higher cut-off in R6; however there are still anomalous ozone values due the SL correction, whereas ozone values calculated without the correction seem not to be affected.
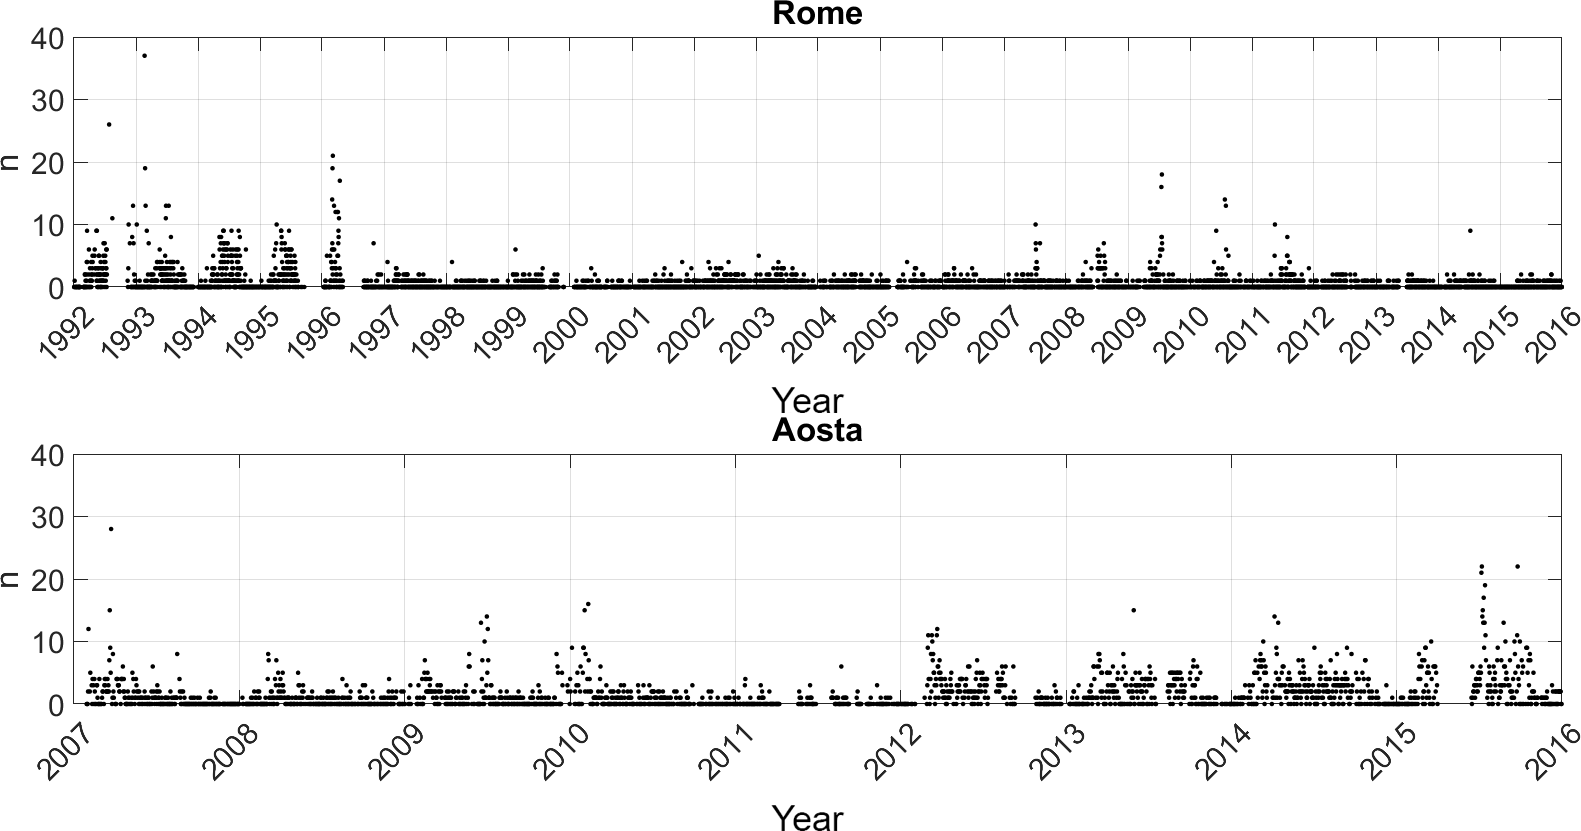
Figure 10Time plot of the difference (n) between the number of individual ozone values per day calculated by O3Brewer and those by BPS.
The occasional anomalous R6 ratios occur at Aosta, mostly in 2011 and at the beginning of 2012. Wrong wavelength selection by the micrometer, communication problems or incorrect zenith drive position in relation to the lamp could have caused the R6 spikes. In this case the algorithm of O3Brewer (with the cut-off at 500 units) did not follow the abrupt change. The correction was not applied, resulting in large over- or underestimation of TOC or with uncertain data quality.
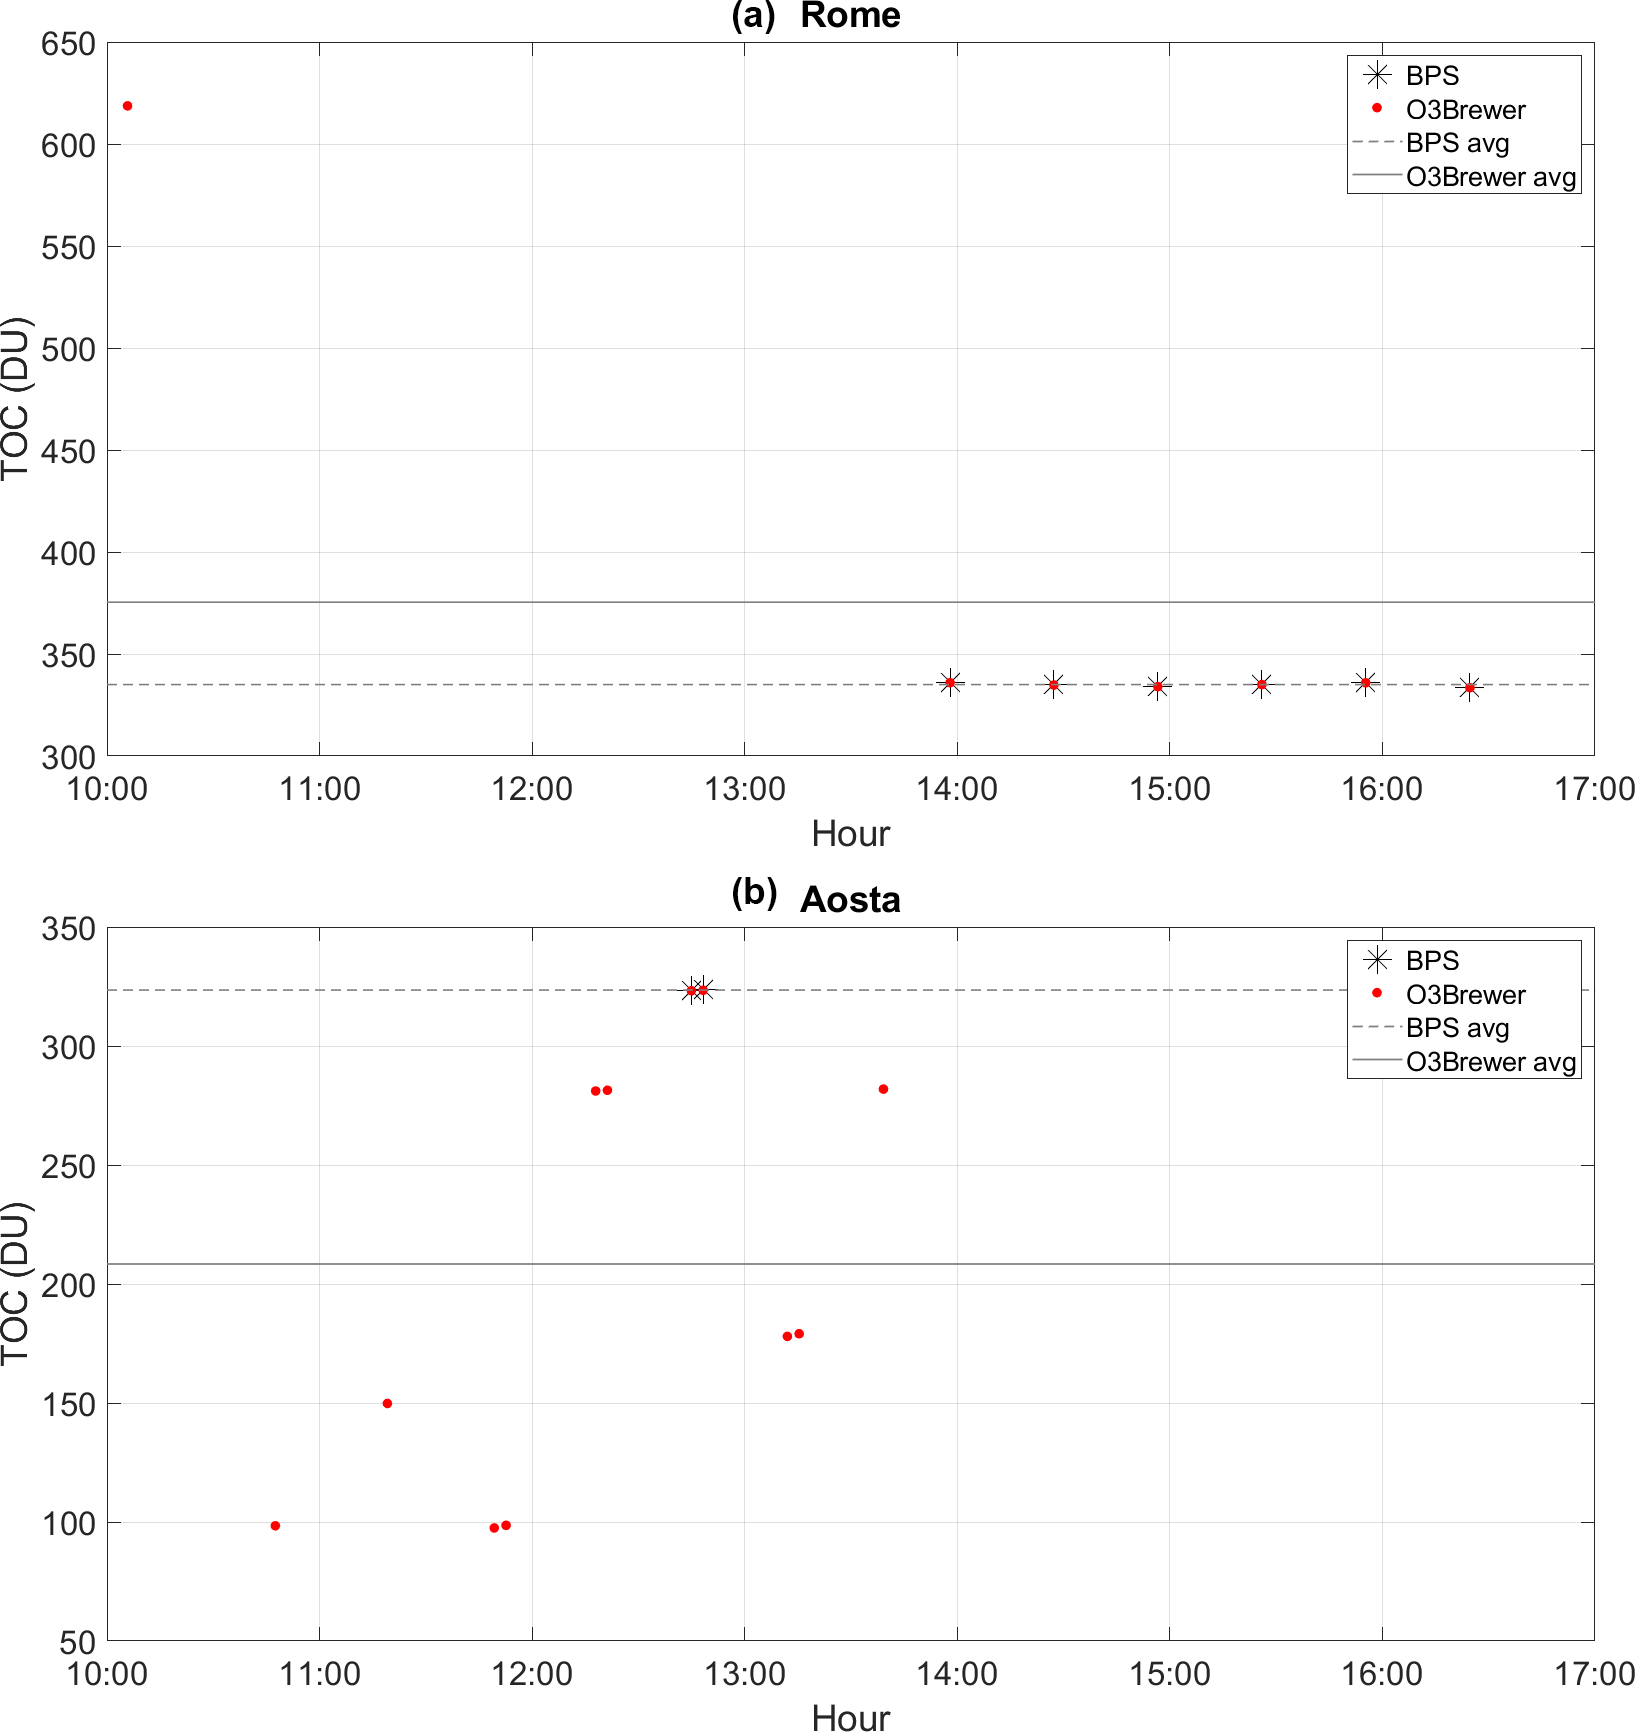
Figure 11Individual TOC values generated by BPS and O3Brewer on 23 June 2001 at Rome (a) and on 5 January 2010 at Aosta (b) taken as examples where differences between BPS and O3Brewer averages occurred although the R6BPS is similar to R6smooth. Horizontal lines (dashed for BPS; solid for O3Brewer) represent the daily average (avg).
3.1.3 R6BPS similar to R6smooth
Taking into account a different number of observations in the determination of the daily means by the two codes can generate significant differences in some cases. The total number of individual total ozone values calculated by O3Brewer is 104 666 at Rome and 50 088 at Aosta; the number of those calculated by BPS is 100 352 at Rome and 46 617 at Aosta. Figure 10 shows the difference per day between the number of individual ozone values calculated by O3Brewer and those calculated by BPS. On some days the number of the individual O3Brewer ozone calculations is higher than that of BPS.
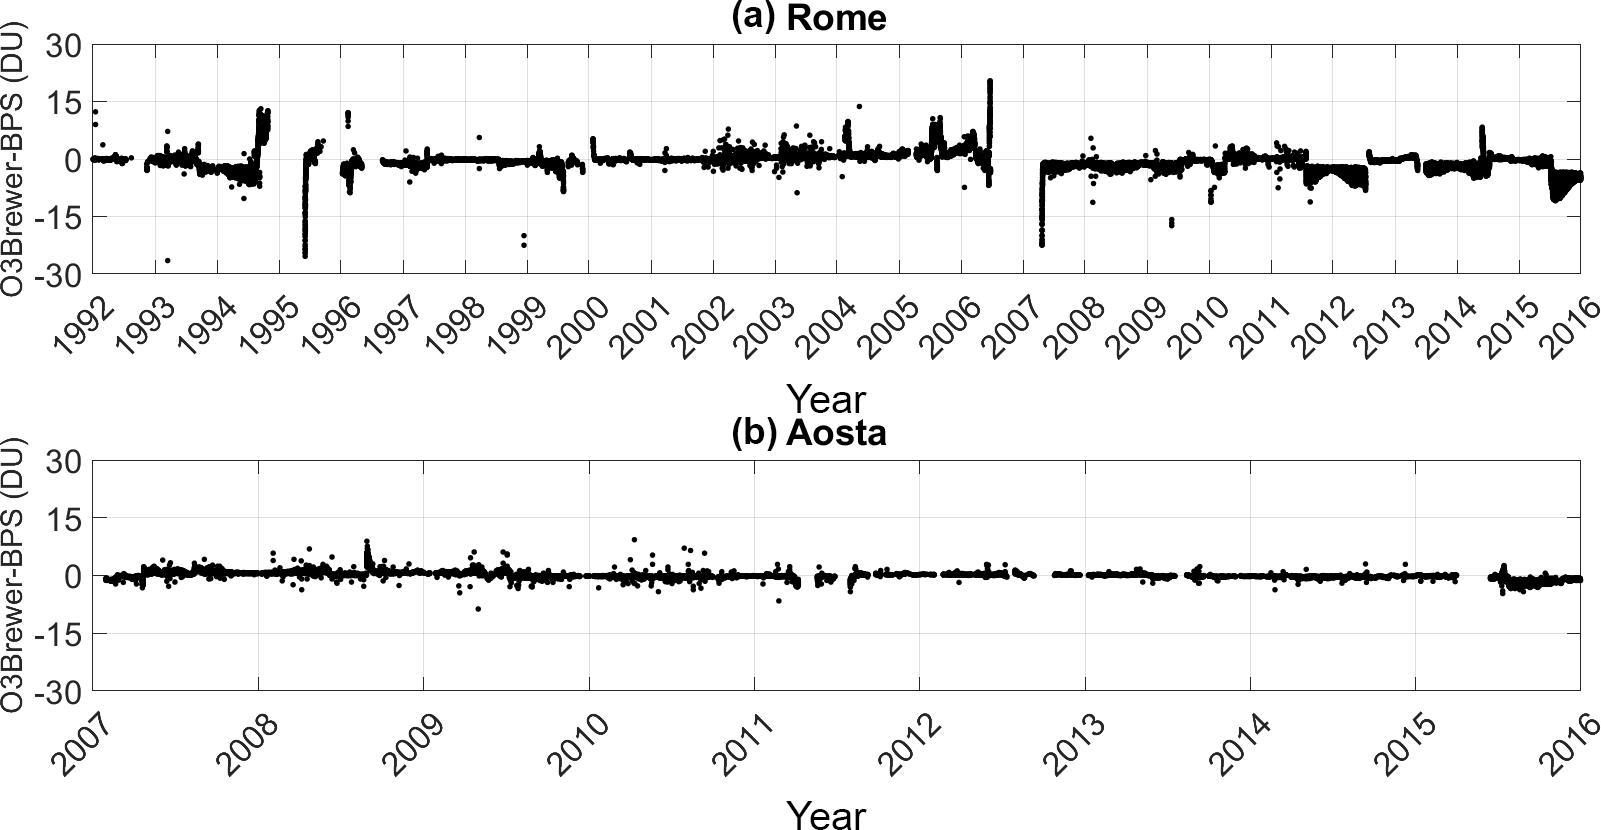
Figure 12Difference between individual TOC values generated by BPS and O3Brewer at Rome (a) and at Aosta (b) when anomalous values were discarded. In O3Brewer the cut-off in R6 was set to 500 units.
Table 4Summary of the statistics of O3Brewer vs. EUBREWNET and BPS vs. EUBREWNET at both sites (N: number of data; RHO: Spearman correlation; MB: mean bias; MPE: mean percentage error; RMSE: root mean square error; the uncertainty of MB and MPE is characterized by the standard deviation).
Such a difference can be due to the fact that there are no rejection conditions on the minimum and the maximum ozone values calculated by O3Brewer. Consequently, the daily means generated by this software are determined including anomalous values. The case of R6BPS, similar to R6smooth, is responsible for significant ozone differences in the daily means (> 5 %) which belong to the above circumstance.
As a specific example of the above case, we show individual ozone values generated by both codes on 23 June 2001 at Rome with a daily average of 335 DU for BPS and 375.4 DU for O3Brewer (Fig. 11a). The high individual ozone value generated by O3Brewer (618.7 DU) is due to the lack of the rejection rule of the maximum ozone in this code, which is also included in the calculation of the daily mean. Another example is provided for Aosta (Fig. 11b). On 5 January 2010 the daily average is 323.5 DU for BPS, whereas it is 208.4 DU for O3Brewer. The BPS rejection rules (reported in Sect. 2.3) can explain the discarding of the nine O3Brewer ozone values, since the first check in the BPS is the raw counts; when they are less than 2500, the ozone is not calculated.
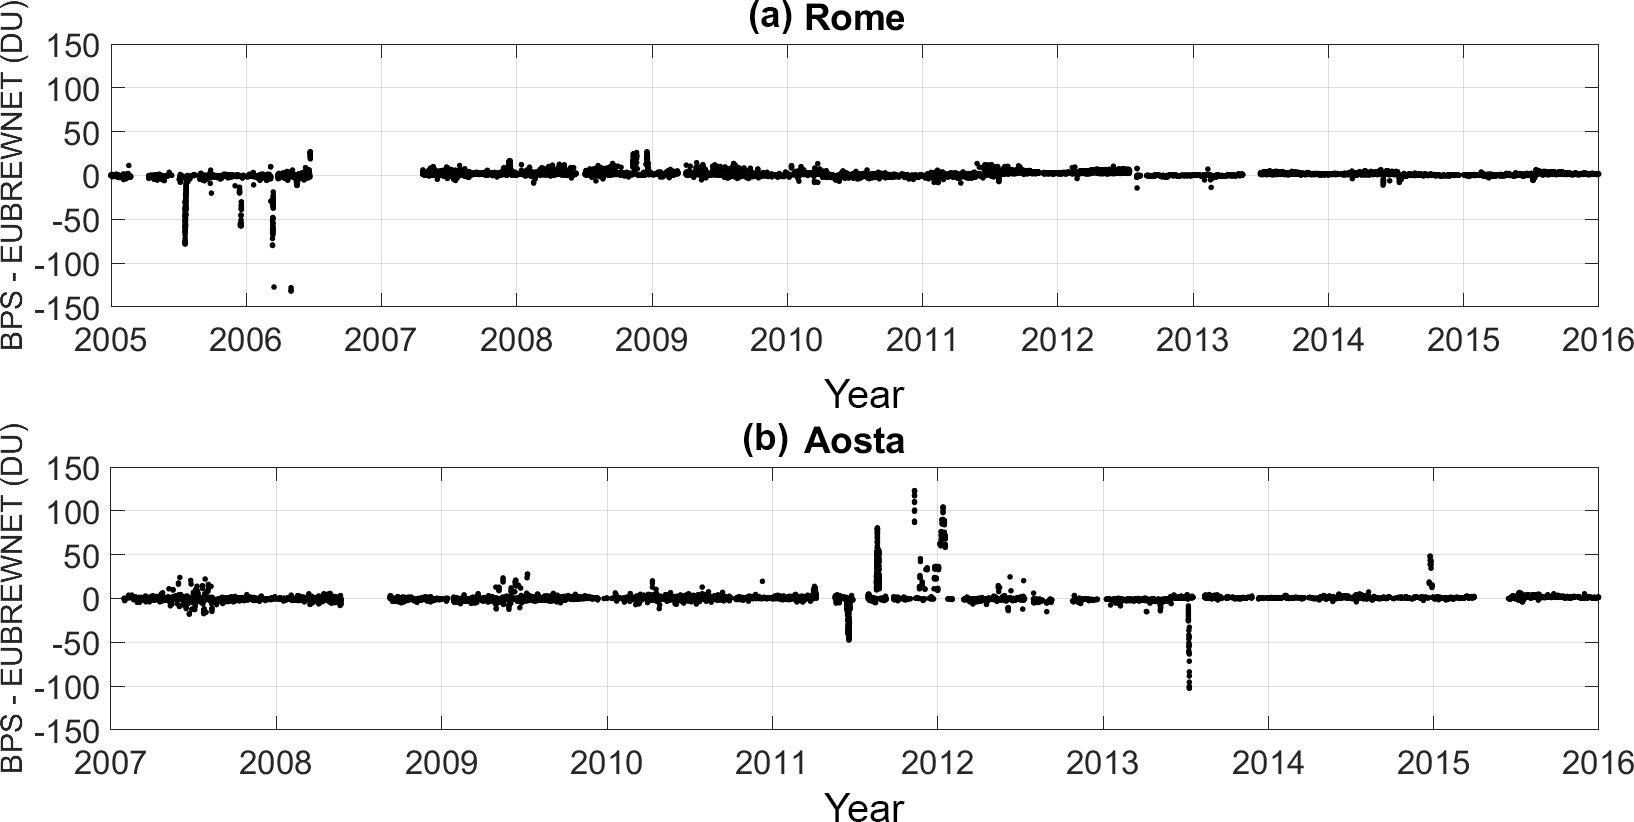
Figure 13Difference between individual TOC values generated by BPS and EUBREWNET (a, Rome; b, Aosta).
In the following analysis we considered ozone calculated by O3Brewer only with the cut-off at 500 units. Data belonging to the three circumstances described in the previous sections were not included in the statistical comparison. TOC data without R6 values (no SL test was performed on that day) were also discarded. Table 3 shows the statistical comparison between individual BPS and O3Brewer reprocessed ozone values and the comparison between BPS and O3Brewer daily means. The temporal behaviour of the differences between individual O3brewer and BPS ozone values is plotted in Fig. 12, showing a variability in general within ±25 DU at Rome and ±10 DU at Aosta.

Figure 14Difference between individual TOC values generated by O3Brewer and EUBREWNET (a, Rome; b, Aosta). Periods belonging to the three circumstances described in the Sect. 3.1 with the R6 drift or spikes were removed.
A good overall agreement is found taking into account both individual values and daily means, and the correlation is close to unity at both stations; MPE does not vary significantly taking into account either individual values or daily means at Rome as well as at Aosta.
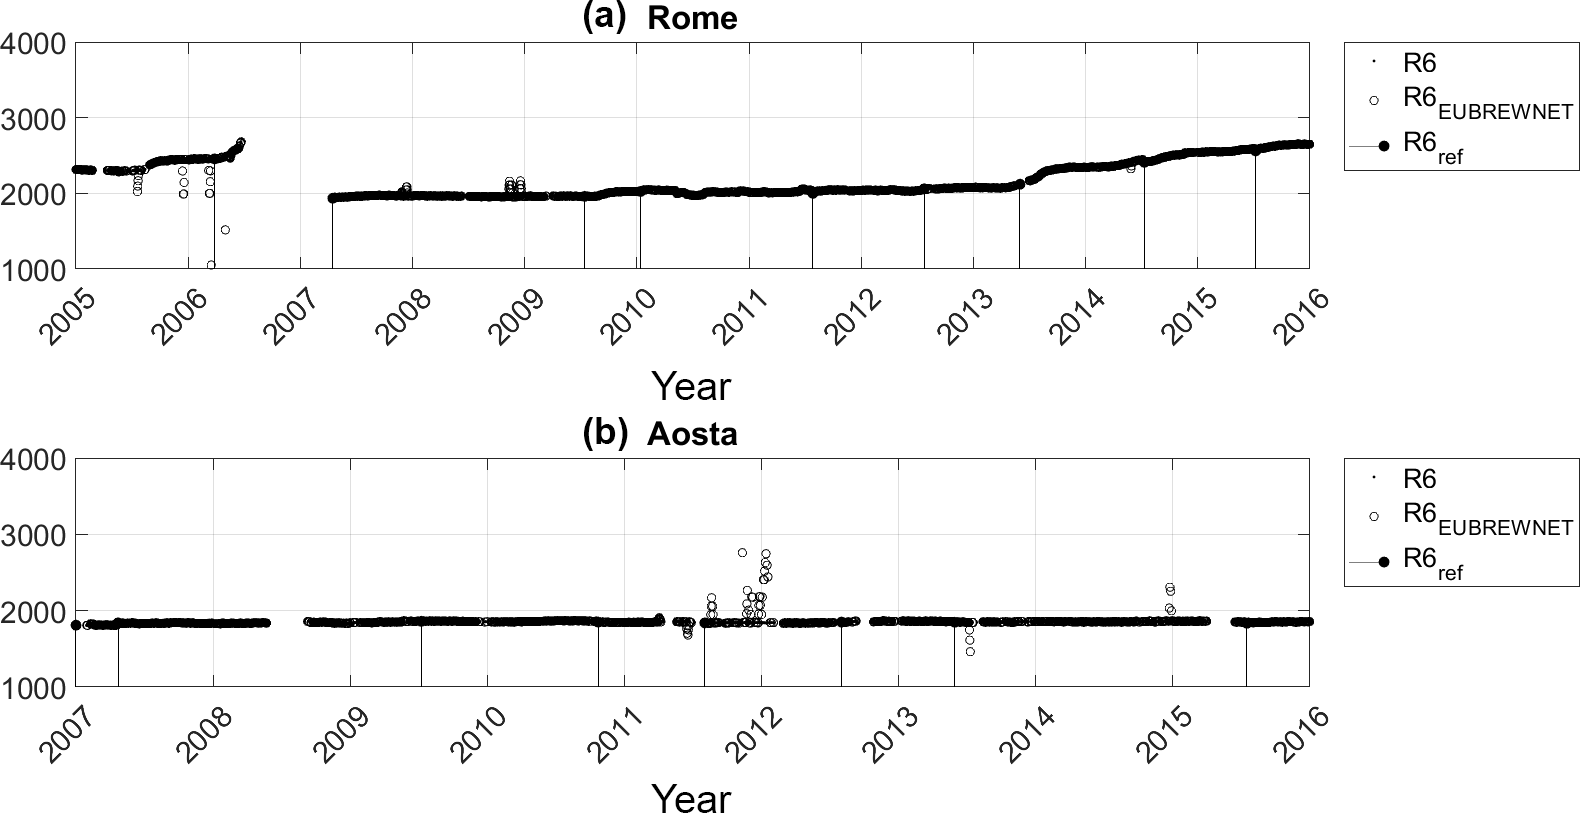
Figure 15Daily averages of the ratios R6 and R6EUBREWNET at Rome (a) and at Aosta (b). Periods belonging to the three circumstances described in the Sect. 3.1 with the R6 drift or spikes were removed. R6EUBREWNET values were downloaded by EUBREWNET. Vertical lines represent R6ref established during each calibration campaign.
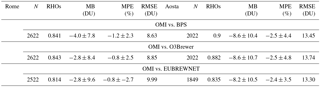
Table 5Summary of the statistics of the comparison of OMI versus BPS, O3Brewer and EUBREWNET (N: number of data; RHOs: Spearman scaled correlation; MB: mean bias; MPE: mean percentage error; RMSE: root mean square error; the uncertainty of MB and MPE is characterized by the standard deviation).
3.2 Comparison of BPS and O3Brewer TOC retrievals with EUBREWNET data
The individual values and daily means of TOC retrieved by O3Brewer and BPS data were compared with those derived from EUBREWNET retrievals. The comparison was performed not including BPS and O3Brewer ozone data of the three circumstances described in Sect. 3.1.1, 3.1.2 and 3.1.3.
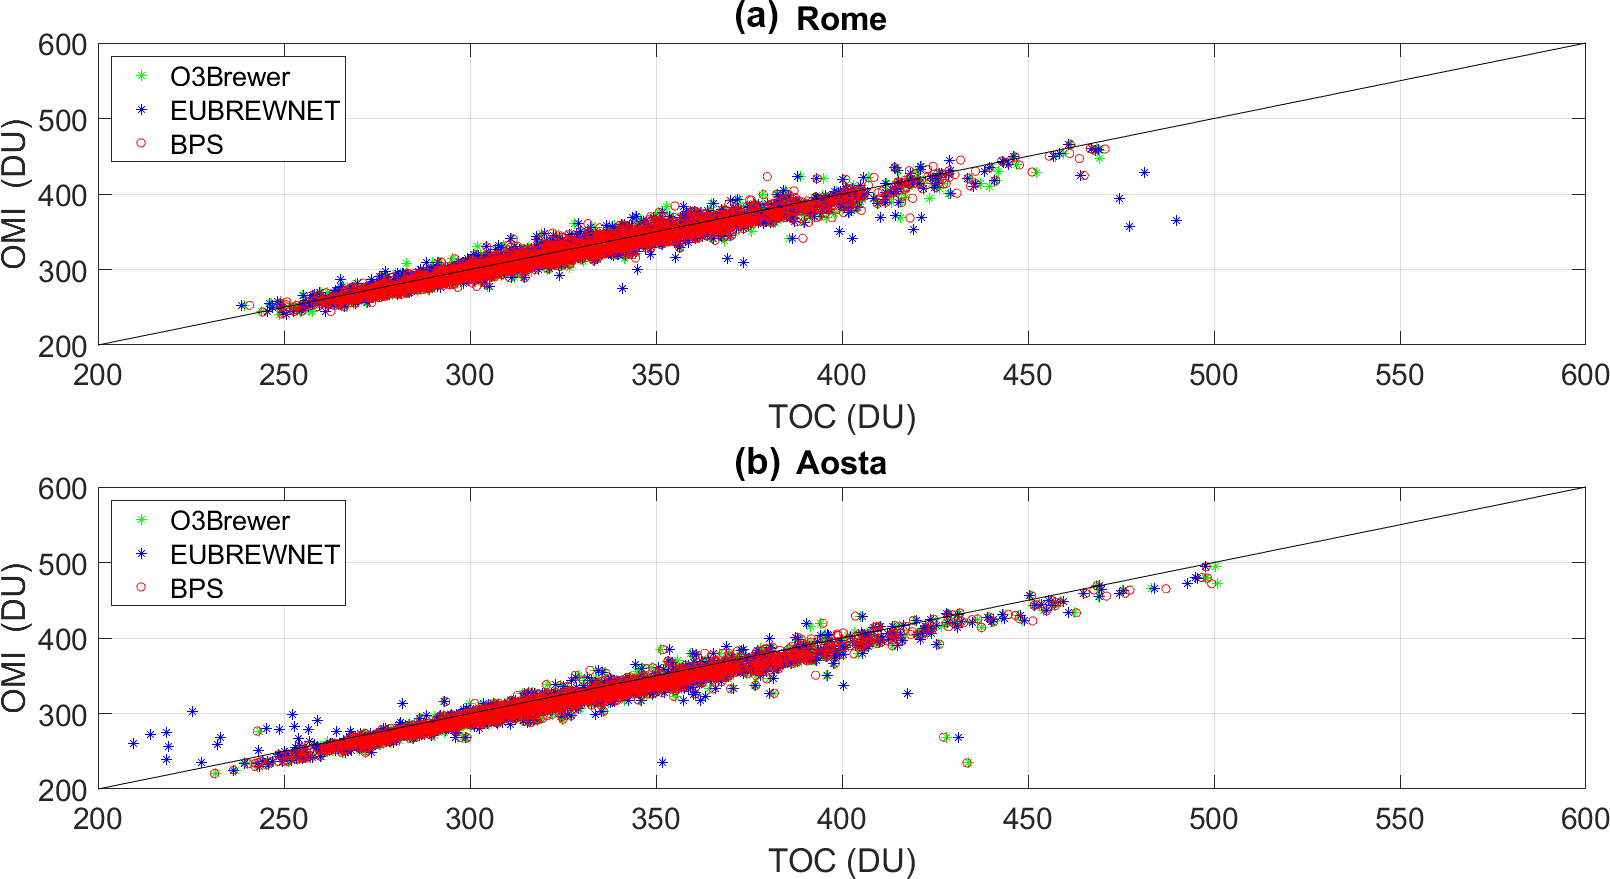
Figure 16Scatter plots of total ozone column for OMI vs. Brewer at Rome (a) and Aosta (b). The solid line represents the bisectrix. The comparison is carried out with O3Brewer (green), EUBREWNET (blue) and BPS (red) data.
Table 4 shows the statistical results of the two processed TOC datasets against the EUBREWNET data. It is found that the difference among the TOC retrievals is less than 1 %.
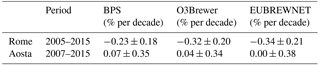
Table 6The total ozone linear trends derived by the processed ozone values using three different processing codes.
However, as seen in Figs. 13–14, the differences between the individual ozone values calculated by BPS and EUBREWNET (Fig. 13) and by O3Brewer and EUBREWNET (Fig. 14) are in some cases relevant. Figure 15 shows the daily averages of R6 and R6EUBREWNET. It seems that problems of the standard lamp values not properly filtered by the currently applied 7-day window smoothing have generated less reliable results (see the temporal behaviour of R6EUBREWNET in Fig. 15). This problem could be solved in the level 2 data, in which a filter in the R6 values is planned to be taken into account in the EUBREWNET algorithm (Ilias Fountoulakis, personal communication, 2018). However, although these options exist in the configuration form, they are still inactive.
3.3 Comparison of BPS, O3Brewer and EUBREWNET TOC retrievals with OMI data
OMI overpasses were also compared with the processed Brewer TOC retrievals. The comparison was performed taking into account the same design criteria described in the previous section. The scatter plots of OMI vs. Brewer data are shown in Fig. 16. However, depending on the Brewer processing software, a different behaviour is visible, even when only “good” data were considered. It can be observed that EUBREWNET data show larger deviations from the bisectrix with respect to the other retrievals.
The results of the statistical analysis are summarized in Table 5. The results of the statistical analysis are summarized in Table 5. In general, the scaled correlation is, for both sites, on average RHOs = 0.8, which represents how well connected the series are in the short term.
OMI products show a systematic underestimation with respect to ground-based data. Satellite data for both O3Brewer and EUBREWNET are less than 1 % at Rome and about 2.5 % at Aosta; in the case of BPS data, the values are 1.2 % (Rome) and 2.5 % (Aosta). These results are in agreement with previous studies on validation of the OMI total ozone column by Brewer spectrophotometry conducted at the same latitudes (Ialongo et al., 2008; Anton et al., 2009).
When comparing RMSE values it can be noticed that RMSE at Rome is lower than that found at Aosta, which supports the observed scatter plot shown in Fig. 16.
Furthermore, systematic differences between ozone estimated from OMI and from Brewer at Aosta could be related to the ground pixel size, which can affect ozone amounts probed by the satellite, due to the complex orography of the valley.
3.4 Comparison among the trends estimated by the three processing software packages' ozone retrievals
The detected trends in ozone series calculated by using the three processing software packages are reported in Table 6. The trends were quantified over the period 2005–2015 for Rome to be consistent with the EUBREWNET ozone data coverage, and 2007–2015 for Aosta. Ozone data showing large differences among the codes were not included in the trend analysis.
The Quasi-Biennial Oscillation and solar cycle effects were not filtered in the ozone series. The former was found to be small at mid-latitude stations (Fountoulakis et al., 2016), whereas the latter was not taken into account due to the short length of the analysed ozone series (< 11 years). All trends are found to be statistically not significant (p value is 0.05).
It is clear from Table 6 that there are no significant differences in the trends among the three codes when data affected by rapid changes or persistent drift in R6 are removed.
This study analysed the total ozone column (TOC) recalculations at Rome and Aosta using three different software packages (Brewer Processing Software, BPS; O3Brewer software; and EUBREWNET level 1.5 products). The TOC data were processed adjusting the extraterrestrial constant (ETC) according to the changes of the radiometric sensitivity of the instrument, which is represented by the so-called R6 ratio. We found that large differences in total ozone column retrievals can be experienced when the R6 behaviour exhibits a fast and dramatic drift between two consecutive calibrations or spikes. These conditions can affect TOC retrievals due to the algorithm of the standard lamp correction applied. The correction is based on the difference between the R6 value and the reference value of the calibration (R6ref) with the reference spectrophotometer.
When R6 exceeded the default value of the cut-off (500 units) set in the configuration of the O3Brewer software, the correction was not applied during an occasional spike. This could generate false high/low ozone values. In the latest version of O3Brewer it is possible to set the cut-off to a higher value that is useful when a large R6 drift is experienced. However, anomalous ozone values can be still observed, since in O3Brewer there are no filter conditions on the minimum and the maximum ozone values. Similarly, the current level of EUBREWNET (level 1.5) can produce erroneous ozone recalculations when anomalous R6 values are experienced. The issue is expected to be resolved in level 2.0 products when they are released. The BPS ozone recalculations seem to be less affected in the case of R6 drift.
However, when serious changes in the spectral sensitivity of an instrument are experienced, a solution consists in dividing the periods of R6 drifts into shorter time intervals, and for that period a new set of constants (R6ref and ETC) could be established by the user as the averages of R6 ratios in that time interval. This process (“synthetic calibration”) allows the user to introduce standard lamp corrections larger than the software's hardcoded thresholds. In any case the synthetic constants in use must be confirmed in the next calibration with the reference instrument.
Here we decided to discard the periods with drifts or occasional abrupt changes in R6, and a good overall agreement was found between BPS, O3Brewer and EUBREWNET (mean percentage error < 1 %). However, a spread among the individual EUBREWNET ozone values and those retrieved by the other two codes was still found, probably due to the standard lamp values not being filtered properly by the currently applied 7-day window smoothing, generating less reliable results.
The analysis of the differences between recalculated TOCs and OMI overpasses shows that the latter dataset underestimates less than 2 % of ground-based total ozone columns at Rome and less than 3 % at Aosta (using “good” cases). Yet the estimate of the trends using the ozone retrievals from the three different codes does not seem to be affected when ozone data with anomalous R6 values are removed.
The operators should constantly monitor the sensitivity of the instrument and thoroughly know the processing software used to recalculate the total ozone. This means that the quality-controlled data cannot be assured only by automatic data rejection rules of the adopted software, but a rigorous manual data inspection is always necessary to prevent inconsistent data produced by the processing software package in use.
As a final remark, it is important to underline that, for the sake of consistency and comparability between the results from different stations which send ozone products to international data centres such as WOUDC (World Ozone and Ultraviolet Radiation Data Centre) or others, it is important to know the processing software used to generate individual ozone values, the time behaviour of the instrumental stability, the method applied for the standard lamp correction and the adopted rejection criteria to determine the daily means.
The data used for the present study can be requested from the authors (annamaria.siani@uniroma1.it).
All authors helped to develop the paper. AMS played a major role in supervising and coordinating the whole work; GRC and HD equally provided helpful comments on the draft. FF, FS and AR contributed in the elaboration of the Brewer and satellite data. AMS and GRC are responsible for establishing and maintaining Brewer 067; HD contributed with data of Brewer 066 and in establishing and maintaining the site; FF and MP gave Matlab support; VS gave support with the Brewer Processing Software.
The authors declare that they have no conflict of interest.
This article is part of the special issue “Quadrennial Ozone Symposium 2016 – Status and trends of atmospheric ozone (ACP/AMT inter-journal SI)”. It is a result of the Quadrennial Ozone Symposium 2016, Edinburgh, United Kingdom, 4–9 September 2016.
We thank the European Brewer Network (http://rbcce.aemet.es/eubrewnet/; last access: 1 March 2018) for providing access to the data used in this investigation and the COST Action ES1207 “A European Brewer Network (EUBREWNET)”, supported by COST (European Cooperation in Science and Technology). We also thank the NASA Goddard Space Flight Center for making OMI data available (https://avdc.gsfc.nasa.gov/; 1 March 2018).
The authors are grateful to Martin Stanek, Vitali Fioletov, Akira Ogyu and Ilias Fountoulakis for their helpful clarifications on the processing software.
The authors thank Paul Young (associate editor) and the anonymous reviewers for their valuable suggestions and comments.
This paper is dedicated to the memory of Ken Lamb, founder of International
Ozone Services Inc. (IOS), who zealously delivered accurate ozone and UV
calibrations to the worldwide Brewer community.
Edited by: Paul Young
Reviewed by: two anonymous referees
Antón, M., López, M., Vilaplana, J. M., Kroon, M., McPeters, R., Bañón, M., and Serrano, A.: Validation of OMI-TOMS and OMI-DOAS total ozone column using five Brewer spectroradiometers at the Iberian Peninsula, J. Geophys. Res.-Atmos., 114, D14307, https://doi.org/10.1029/2009JD012003, 2009.
Balis, D. Kroon, M., Koukouli, M. E., Brinksma, E. J., Labow, G., Veefkind, J. P., and McPeters, R. D.: Validation of Ozone Monitoring Instrument total ozone column measurements using Brewer and Dobson spectrophotometer ground-based observations, J. Geophys. Res., 112, D24S46, https://doi.org/10.1029/2007JD008796, 2007.
Bass, A. M. and Paur, R. J.: The ultraviolet cross-sections of ozone, Part I, The measurements, in: Atmospheric ozone, edited by: Zerefos, C. S., Ghazi, A., and Reidel, D., Proceedings of the Quadrennial Ozone Symposium, Halkidiki, Greece, 1984, Dordrecht, Holland, 606–610,1985.
Bhartia, K. and Wellemeyer, C.: Toms-v8 total O3 algorithm, OMI Algorithm Theoretical Basis Document, 2, 15–31, 2002.
Bordi, I., Fraedrich K., Sutera, A., and Zhu, X.: On the climate response to zero ozone, Theor. Appl. Climatol., 109, 253–259, 2012.
Brewer, A. W.: A replacement for the Dobson spectrophotometer?, Pure Appl. Geophys., 106, 919–927, 1973.
Brewer, A. W. and Kerr, J. B.: Total ozone measurements in cloudy weather, Pure Appl. Geophys., 106, 928–937, 1973.
Dessler, A.: Chemistry and Physics of Stratospheric Ozone, International Geophysics Series 74, Academic press, London UK, 2000.
Diémoz, H., Eleftheratos, K., Kazadzis, S., Amiridis, V., and Zerefos, C. S.: Retrieval of aerosol optical depth in the visible range with a Brewer spectrophotometer in Athens, Atmos. Meas. Tech., 9, 1871–1888, https://doi.org/10.5194/amt-9-1871-2016, 2016.
Dobson, G. M. B. and Harrison, D. N.: Measurements of the amount of ozone in the Earth's atmosphere and its relation to other geophysical conditions, Proc. R. Soc. Lon. Ser. A, 110, 660–692, 1926.
EUBREWNET (A European Brewer Network): COST Action ES 1207, available at: http://rbcce.aemet.es/eubrewnet (last access: 30 June 2017) and http://www.eubrewnet.org/cost1207/, last access: 1 June 2017.
Fioletov, V. E. and Ogyu, A.: Brewer Processing Software, http://exp-studies.tor.ec.gc.ca/pub/BrewerProcessingSoftware/brewerprocessingsoftware.pdf (last access: 15 August 2018) 2007.
Fioletov, V. E., Kerr, J. B., McElroy, C. T., Wardle, D. I., Savastiouk, V., and Grajnar, T. S.: The Brewer reference triad, Geophys. Res. Lett., 32, L20805, https://doi.org/10.1029/2005GL024244, 2005.
Fountoulakis, I., Bais, A. F., Fragkos, K., Meleti, C., Tourpali, K., and Zempila, M. M.: Short- and long-term variability of spectral solar UV irradiance at Thessaloniki, Greece: effects of changes in aerosols, total ozone and clouds, Atmos. Chem. Phys., 16, 2493–2505, https://doi.org/10.5194/acp-16-2493-2016, 2016.
Ialongo, I., Casale, G. R., and Siani, A. M.: Comparison of total ozone and erythemal UV data from OMI with ground-based measurements at Rome station, Atmos. Chem. Phys., 8, 3283–3289, https://doi.org/10.5194/acp-8-3283-2008, 2008.
International Ozone Service (IOS): International Ozone Service Inc., http://www.io3.ca/ (last access: 1 September 2017) September 2017
Josefsson, W. A. P.: Focused sun observations using a Brewer ozone spectrophotometer, J. Geophys. Res., 97, 15813–15817, https://doi.org/10.1029/92JD01030,1992.
Karppinen, T., Redondas, A., García, R. D., Lakkala, K., McElroy, C. T., and Esko, K.: Compensating for the Effects of Stray Light in Single-Monochromator Brewer Spectrophotometer Ozone Retrieval, Atmos. Ocean, 53, 66–73, 2015.
Kerr, J. B.: The Brewer Spectrophotometer, in: UV Radiation in Global Climate Change, edited by: Gao, W., Schmoldt, D., and Slusser, J., Springer, Berlin, 160–191, 2010.
Kerr, J. B. and Davis, J. M.: New methodology applied to deriving total ozone and other atmospheric variables from global irradiance spectra, J. Geophys. Res., 112, D21301, https://doi.org/10.1029/2007JD008708, 2007.
Kerr, J. B., McElroy, C. T., and Olafson, R. A.: Measurements of total ozone with the Brewer spectrophotometer, in: Procs. of the Quadrennial Ozone Symposium, edited by: London, J., Natl. Cent. for Atmos. Res., Boulder, Colorado, 11, 74–79, 1981.
Kerr, J. B., McElroy, C. T., Wardle, D. I., and Dorokhov, V.: Measurements of arctic total ozone during the polar winter, Atmos. Ocean, 28, 383–392, 1990.
Muthama, N. J., Scimia, U., Siani, A. M., and Palmieri, S.: Toward optimizing Brewer zenith sky total ozone measurements at the Italian stations of Rome and Ispra, J. Geophys. Res., 100, 3017–3022, 1995.
Ramanathan, V. and Dickinson, R. E.: The role of stratospheric ozone in the zonal and seasonal radiative energy balance of the earth-troposphere system, J. Atmos. Sci., 36, 1084–1104, 1979.
Redondas A., Franco, J. R., Lopez-Solano, J., Carreno, V., Leòn-Luis, S. F., and Hernàndez-Cruz, B.: The Regional Brewer Calibration Center – Europe: an overview of the X Brewer Intercomparison Campaign, WMO Commission for Instruments and Methods of Observation, TECO, 2016.
Siani, A. M, Casale, G. R., and Galliani, A.: Investigation on a low ozone episode at the end of November 2000 and its effect on ultraviolet radiation, Opt. Eng., 41, 3082–3089, 2002.
Siani, A. M., Modesti, S., Casale, G. R., Diemoz, H., and Colosimo, A.: Biologically effective surface UV climatology at Rome and Aosta, AIP Conf. Proc., 1531, 903–906, 2013.
Stanek, M.: O3Brewer, http://www.o3soft.eu/o3brewer.html (last access: 14 March 2018), 2016.
Stübi, R., Schill, H., Klausen, J., Vuilleumier, L., and Ruffieux, D.: Reproducibility of total ozone column monitoring by the Arosa Brewer spectrophotometer triad, Geophys. Res. Atmos., 122, 4735–4745, 2017.
Tzortziou, M., Herman, J. R., Cede, A., and Abuhassan, N.: High precision, absolute total column ozone measurements from the Pandora spectrometer system: Comparisons with data from a Brewer double monochromator and Aura OMI, J. Geophys. Res., 117, D16303, https://doi.org/10.1029/2012JD017814, 2012.
Vanicek, K.: Differences between ground Dobson, Brewer and satellite TOMS-8, GOME-WFDOAS total ozone observations at Hradec Kralove, Czech. Atmos. Chem. Phys., 6, 5163–5171, 2006.
Vaz Peres, L., Bencherif, H., Mbatha, N., Passaglia Schuch, A., Toihir, A. M., Bègue, N., Portafaix, T., Anabor, V., Kirsch Pinheiro, D., Paes Leme, N. M., Bageston, J. V., and Schuch, N. J.: Measurements of the total ozone column using a Brewer spectrophotometer and TOMS and OMI satellite instruments over the Southern Space Observatory in Brazil, Ann. Geophys., 35, 25–37, https://doi.org/10.5194/angeo-35-25-2017, 2017.
WMO (World Meteorological Organization): Scientific Assessment of Ozone Depletion: 2014, Global Ozone Research and Monitoring Project, Report No. 55, Geneva, Switzerland, 2015.
WMO-GAW: Seventh Intercomparison Campaign of the Regional Brewer Calibration Center Europe (RBCC-E) Lichtklimatisches Observatorium, Arosa, Switzerland, 16–27 July 2012, Report no. 216, 2015.
WOUDC (World Ozone and Ultraviolet Data Centre): http://woudc.org, last access: 1 June 2017.