the Creative Commons Attribution 4.0 License.
the Creative Commons Attribution 4.0 License.
 | 20 Sep 2018
Photocurrent modelling and experimental confirmation for meteoric smoke particle detectors on board atmospheric sounding rockets
Gabriel Giono
Boris Strelnikov
Heiner Asmus
Tristan Staszak
Nickolay Ivchenko
Franz-Josef Lübken
Characterising the photoelectron current induced by the Sun's UV radiation is crucial to ensure accurate daylight measurements from particle detectors. This article lays out the methodology used to address this problem in the case of the meteoric smoke particle detectors (MSPDs), developed by the Leibniz Institute of Atmospheric Physics in Kühlungsborn (IAP) and flown on board the PMWEs (Polar Mesosphere Winter Echoes) sounding rockets in April 2018. The methodology focuses on two complementary aspects: modelling and experimental measurements. A detailed model of the MSPD photocurrent was created based on the expected solar UV flux, the atmospheric UV absorption as a function of height by molecular oxygen and ozone, the photoelectric yield of the material coating the MSPD as a function of wavelength, the index of refraction of these materials as a function of wavelength and the angle of incidence of the illumination onto the MSPD. Due to its complex structure, composed of a central electrode shielded by two concentric grids, extensive ray-tracing calculations were conducted to obtain the incidence angles of the illumination on the central electrode, and this was done for various orientations of the MSPD in respect to the Sun. Results of the modelled photocurrent at different heights and for different materials, as well as for different orientations of the detector, are presented. As a pre-flight confirmation, the model was used to reproduce the experimental measurements conducted by Robertson et al. (2014) and agrees within an order of magnitude. An experimental setup for the calibration of the MSPD photocurrent is also presented. The photocurrent induced by the Lyman-alpha line from a deuterium lamp was recorded inside a vacuum chamber using a narrowband filter, while a UV-sensitive photodiode was used to monitor the UV flux. These measurements were compared with the model prediction, and also matched within an order of magnitude. Although precisely modelling the photocurrent is a challenging task, this article quantitatively improved the understanding of the photocurrent on the MSPD and discusses possible strategies to untangle the meteoric smoke particles (MSPs) current from the photocurrent recorded in-flight.


Meteoric smoke particles (MSPs, sometimes also referred to as meteor smoke particles) play an important role in the mesosphere/lower thermosphere (MLT) region. They interact with the D- and E-region ionosphere, forming the dusty plasma the properties of which are currently subject to active research. MSPs originate from incoming meteor influx and the estimates of their input to the Earth's atmosphere ranges from several to hundreds of tonnes per day (Ceplecha et al., 1998; Cziczo et al., 2001; Gabrielli et al., 2004; Hughes, 1978; Love and Brownlee, 1993; Mathews et al., 2001; Plane, 2004, 2012; Wasson and Kyte, 1987). Since the work of Rosinski and Snow (1961), the term MSP has referred to solid state particles that are recondensed from evaporated meteoric material (Hunten et al., 1980). Both of these processes (evaporation and recondensation) take place in the height range 70–120 km (Hunten et al., 1980; Kalashnikova et al., 2000; Love and Brownlee, 1991; McNeil et al., 1998; Plane, 2004; Vondrak et al., 2008). The solid particles can further sediment and are even found in Arctic ice (Gabrielli et al., 2004). The MSPs are also a subject to atmospheric advection and thus are influenced by neutral dynamics of the MLT region (Megner et al., 2006). It is commonly believed that MSPs could serve as nuclei for heterogeneous nucleation of mesospheric ice particles that cause the strong radar returns known as Polar Mesospheric Summer Echoes (PMSEs) (Rapp and Thomas, 2006). There are a number of works suggesting that MSPs play a key role in formation of the Polar Mesospheric Winter Echoes (PMWEs) similar to the mechanism including ice particles in summer for PMSE formation (Belova et al., 2008; Chen and Scales, 2005; Havnes and Kassa, 2009; Havnes et al., 2011; Kavanagh et al., 2006; Kero et al., 2008; La Hoz and Havnes, 2008; Mahmoudian et al., 2017). This hypothesis is supported by indirect measurements (Belova et al., 2008; Havnes and Kassa, 2009; Havnes et al., 2011; Kero et al., 2008; La Hoz and Havnes, 2008); however, a verification by direct in situ measurements is still needed.
Considerable effort was put in the last decades towards the study of MSP properties (Baumann et al., 2013; Plane et al., 2014). First detected by ion mass spectrometers on board sounding rockets (Arnold and Viggiano, 1982; Arnold et al., 1982; Schulte and Arnold, 1992), their existence was later confirmed by other measurement techniques (Fentzke et al., 2009; Rapp et al., 2010, 2012; Robertson et al., 2014; Strelnikova et al., 2007). Remote sensing techniques, as well as modelling, rely on some assumptions to do with MSP properties, which are poorly known. Thus, there are many open questions regarding the MSPs, like their size distribution, composition, shape, charge state, work function, photoelectric yield, etc. Microphysical properties of MSPs are difficult to measure because their size varies from tens of nanometres to less than a nanometre. It is known that physical properties of such tiny particles can significantly differ from those, of say micrometre size (Duft et al., 2015).
The most direct measurement technique to study MSPs are the so-called Faraday cup detectors carried by sounding rockets (Havnes et al., 1996; Rapp and Strelnikova, 2009). However, these instruments are drastically affected by the aerodynamics of the rocket flight, prohibiting detection of the smallest particles, normally below 1 nm size (Asmus et al., 2017; Hedin et al., 2005, 2007; Horányi et al., 1999; Strelnikova et al., 2009). To circumvent this limitation, a new rocket-borne MSP detector (MSPD) was developed at the Leibniz Institute of Atmospheric Physics (IAP) in Kühlungsborn, Germany (Staszak et al., 2017). Its design was inspired by the successful results obtained with the CONE instrument, which was designed as an aerodynamically improved TOTAL instrument (Giebeler et al., 1993; Strelnikov et al., 2013). The MSPD, shown in Fig. 1, consists of a central spherical electrode collecting current from the electrically charged MSPs, shielded by two electrically biased concentric grids (e.g. +6 and −6 V) repelling the ambient ions and electrons. The geometry was optimised to reduce aerodynamic and bow-shock effects, as these effects directly determine the minimum mass required for the MSPs to reach the central electrode, thus affecting the estimation of the MSP density. These MSP detectors will be part of a sounding rocket campaign aiming at investigating PMWEs, with the first two launches conducted in April 2018 from Andøya, Norway, and two additional flights scheduled for 2019.
The photocurrent is another possible limitation of the detector: PMWEs are predominantly observed during daytime, meaning that the measurements need to be conducted under direct sunlight. The photocurrent induced by solar UV radiation on vehicles in the near-Earth environment is of the order of a few nA cm−2 (Feuerbacher and Fitton, 1972), which can be a few orders of magnitude larger than the current collected from MSPs. The characterisation of the expected MSPD photocurrent prior to flight is thus a crucial aspect of the instrument development, and is presented in detail in this article. The final goal is to provide strategies for interpreting the expected flight measurements, as the recorded current will be the sum of both the MSPs current of interest and the unwanted photocurrent. This endeavour was conducted by means of two distinct, yet complementary, methods: modelling and experimental measurements. An overview of a photocurrent model is presented in Sect. 2, which includes an atmospheric absorption model for estimating the UV light intensity at various heights, the material properties for various possible surface coating of the detector and a detailed ray-tracing simulation to quantify the complex illumination on the central electrode depending on the MSPD orientation. The experimental aspect is described in Sect. 3, where the experimental setup for measuring the MSPD photocurrent is presented. The setup includes a vacuum chamber, a deuterium UV light source with calibrated spectrum from 115 to 170 nm, a narrowband filter to select the UV range around the Lyman-alpha (121.56 nm) and a UV-sensitive photodiode for monitoring the UV flux. Finally, Sect. 4 gives a summary of both aspects and discusses ways to utilise them for untangling the MSP current from the photocurrent recorded during the flight.
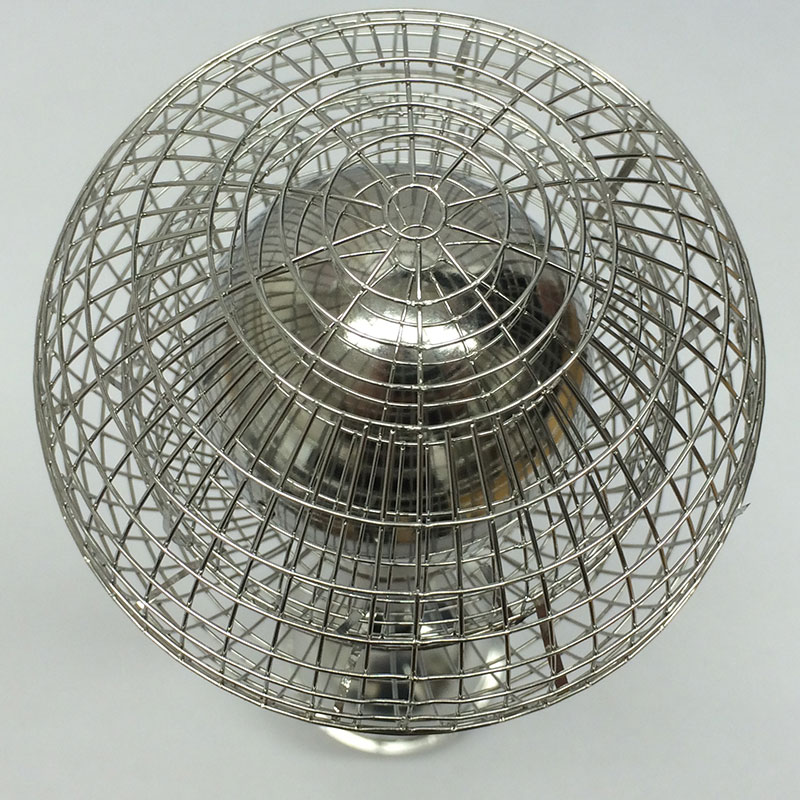
Figure 1Meteoric Smoke Particle Detector with its central spherical electrode (26 mm radius), shielded by two electrically biased concentric grids (35 and 45 mm radius).
The photocurrent is the result of the photoelectric effect (Einstein, 1905): high-energy photons at wavelengths from the ultraviolet and below are able to eject electrons from a material when absorbed, as the energy transferred from the photon to the electron is larger than the material work function, giving the excess as kinetic energy to the ejected electron. The photocurrent, i.e. the number of photoelectrons ejected per second, depends on the spectral flux of photon illuminating the material, as well as on the material properties that determine its interaction with the photons.
2.1 Ultraviolet spectral flux as a function of altitude
The first step for estimating the MSPD photocurrent during flight is to determine the spectral flux illuminating the detector as a function of altitude. All photons considered originate from the Sun, and its UV spectrum is well characterised by space-borne instruments. The major feature of the solar UV spectrum is the Lyman-alpha line at 121.56 nm, with its spectral intensity being more than 2 orders of magnitude larger than the UV continuum. The continuum decreases drastically for wavelengths below the Lyman-alpha, and as the photocurrent induced by near-UV photons is negligible for most materials, only the spectral region from 115 to 300 nm is considered to be relevant for modelling the MSPD photocurrent. The reference solar UV flux considered for the modelling was taken from the SOLSTICE instrument on board the Solar Radiation and Climate Experiment (SORCE) spacecraft (Rottman et al., 2005). This measurement was taken on 30 July 2006, approximatively one solar cycle ago, to roughly represent a similar solar activity as expected during the forthcoming launch. For each height, the number of each spectral photon is reduced by atmospheric absorption, depending on the atmospheric column along the photon trajectory. Atmospheric absorption in the UV is mainly the result of molecular oxygen O2 at heights below 150 km and for wavelengths below 200 nm, and of ozone O3 in the whole UV range becoming significant at heights below 70 km. The spectral absorption as a function of height can be estimated knowing the density (as a function of the height) and the absorption cross section (as a function of the wavelength) for both of these two molecules.
The NRLMSISE-00 atmospheric model (Picone et al., 2002) was used to obtain the atmospheric density of molecular oxygen, following the parameters suggested by the COSPAR international reference atmosphere (CIRA-2012). Although the atmospheric density of molecular oxygen can vary by up to ±20 % below a 150 km altitude, depending on the solar and geomagnetic activities, as shown in Fig. 2, calculations for both low and high activity scenarios did not show a significant difference in terms of the resulting amount of photocurrent. However, the main absorption layer of the UV light by O2 molecules, occurring at altitudes between 70 and 90 km (see Fig. 8 in Sect. 2.4), was shifted by up to a few kilometres due to the difference in the O2 profiles. The low solar and geomagnetic activities scenario was thus used as a baseline for the model, while the altitude was left as an optional adjustable parameter within a few kilometres to accommodate for the solar and geomagnetic uncertainty. The atmospheric density of O3 was taken from Bodeker and Hassler (2012), at the latitude of the Andøya rocket launch site in Norway (69.1144∘ N). Note that the variation of the ozone concentration due to the solar activity was not considered in Bodeker and Hassler (2012), but is not expected to significantly impact the photocurrent estimation in the presented case as ozone absorption mainly occurs below the altitude of interest for MSP measurements. The absorption cross section for O2 was taken from Blake et al. (1966) and Huffman (1985), and from Molina and Molina (1986) and Huffman (1985) for O3. It is important to notice that a proper treatment of the Lyman-alpha absorption is crucial for the modelling. For this reason, the precise absorption cross section of O2 at the Lyman-alpha wavelength was taken from Ogawa (1968) and used for the two spectral bins (121 and 122 nm) in which all photons were considered to be from the Lyman-alpha line. This last point is a reasonable assumption, as the UV continuum in this wavelength range is orders of magnitude lower than the Lyman-alpha emission.
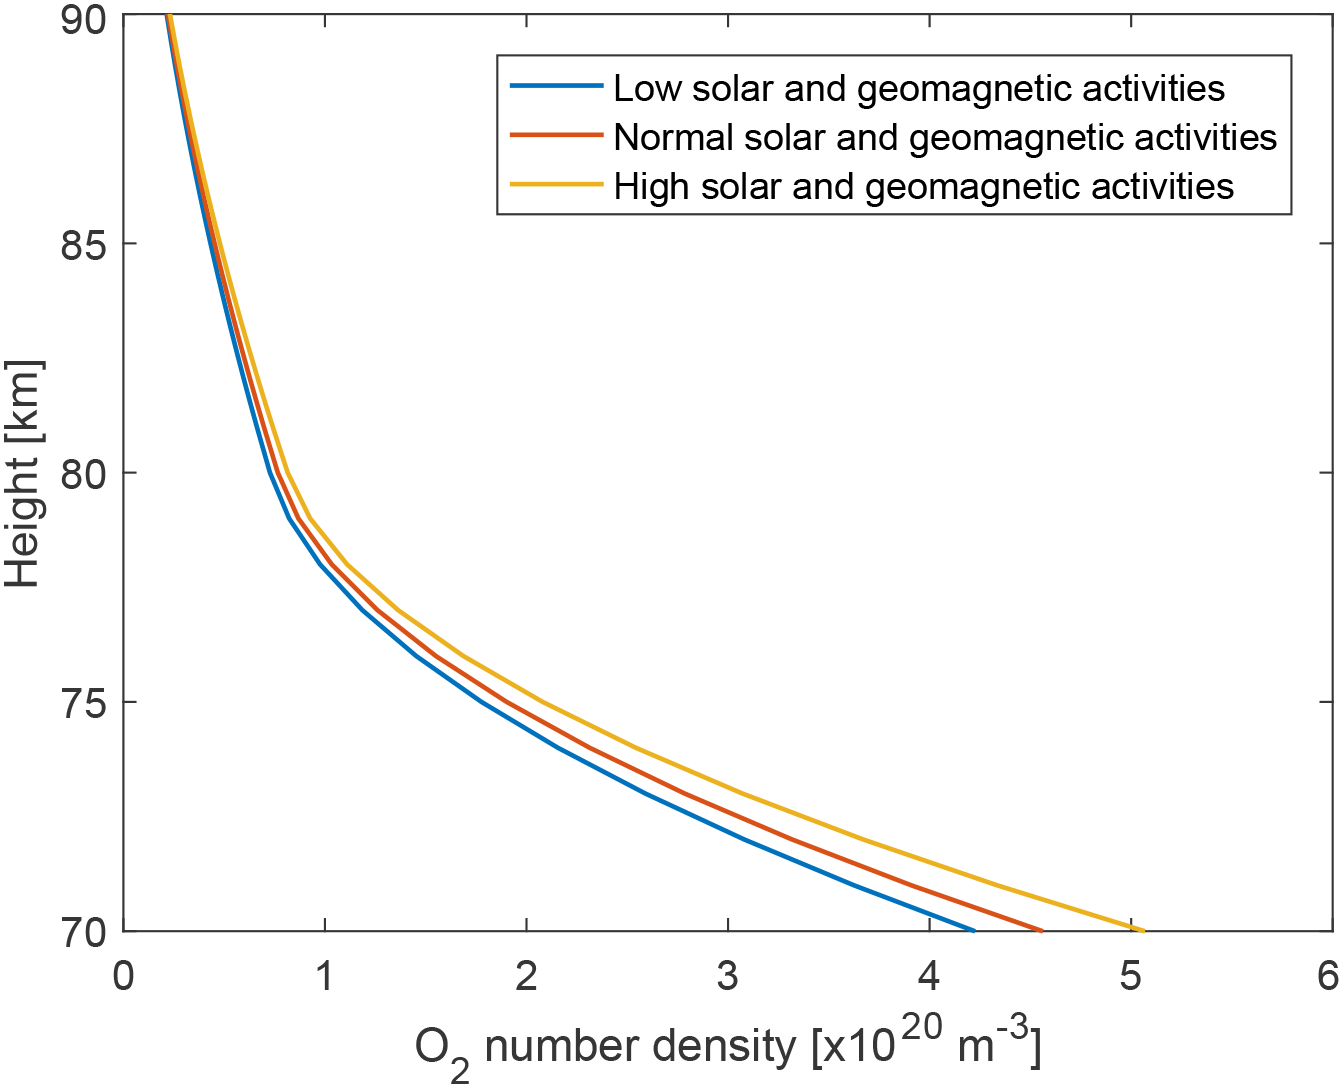
Figure 2Comparison of O2 number density between 70 and 90 km altitude, based on the NRLMSISE-00 atmospheric model.
Using the atmospheric density ρ(h) and absorption cross section σ(λ) of a given species, one can derive the amount of absorption at a given height by first calculating the absorption coefficient β at each height as follows:
The total absorption coefficient β is obtained as the sum of all species considered, in the presented case these are and .
The solar zenith angle θz is also an important parameter, as it determines the atmospheric column above a given height. The Earth's curvature was considered when calculating the atmospheric column, which mostly affects high solar zenith angle condition by reducing the corresponding atmospheric column compared to a classical plane-parallel calculation of the atmosphere. To simulate a realistic atmosphere, the β coefficient representing the absorption is derived considering the atmospheric column along the line of sight, which depends on the solar zenith angle θz and the curvature of the Earth. The full geometry of the realistic atmosphere considered is shown in Appendix A.
The absorption optical depth τ is calculated by integrating the absorption coefficient β along the line of sight from each given height to the top of the atmosphere htop (here considered to be 240 km), as shown in Eq. (2).
Finally, the number of photons at a given height is derived using the following absorption equation:
where F(htop,λ) is the solar UV flux at the top of the atmosphere.
Figure 3 shows the computed solar UV flux for various heights and for a solar zenith angle θz of 75∘ (around the expected solar zenith angle around midday and during spring at the launch site of Andøya). The resulting spectral distributions of photons at various heights are comparable with the ones presented by Huffman (1985).
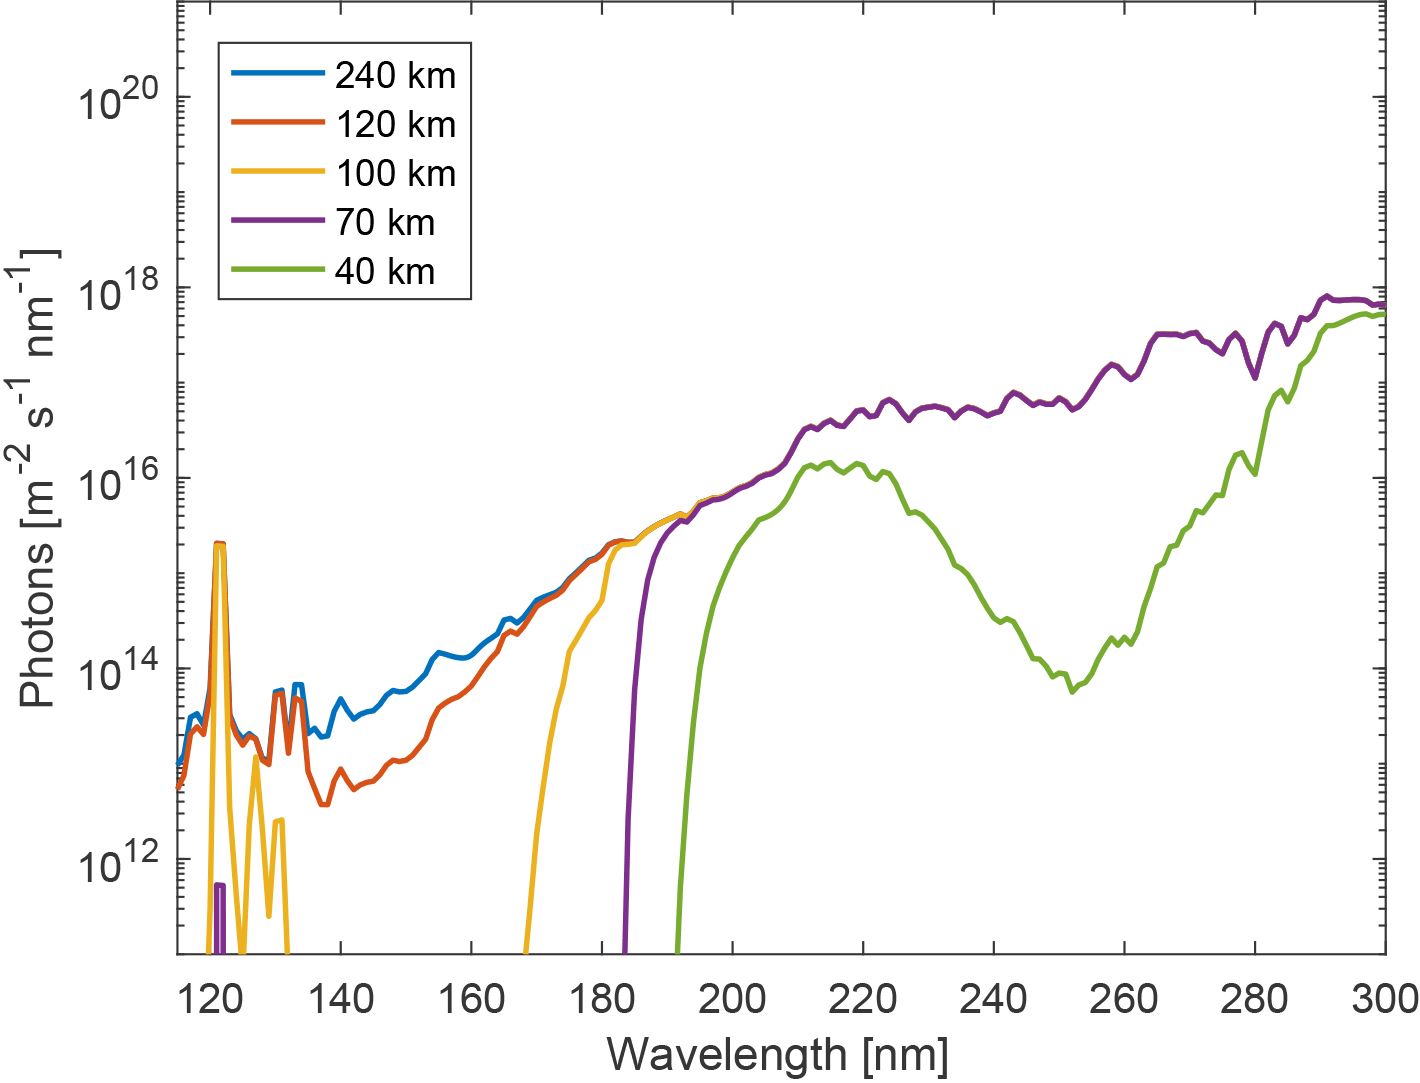
Figure 3Spectral photon flux from 115 to 300 nm for various altitudes, for a solar zenith angle θz of 75∘.
Note that the contribution from scattered photons was not considered in the calculation. In this part of the atmosphere, the main scattering mechanism is Rayleigh scattering by air molecules (N2 and O2), which approximatively scales as λ−4. Although one might expect it to be significant for vacuum ultraviolet (VUV) wavelengths, a comparison between the absorption and scattering cross sections (Bucholtz, 1995) of the major contributors to both effects shows the opposite. Figure 4 shows that the Rayleigh scattering cross section of air molecules is several orders of magnitude smaller than the absorption cross section of both O2 and O3. Hence, absorption by O2 should dominate below 120 km, thus making the contribution from photons scattered below this altitude negligible. Scattering from above this altitude can also be neglected due to the low density of molecules.
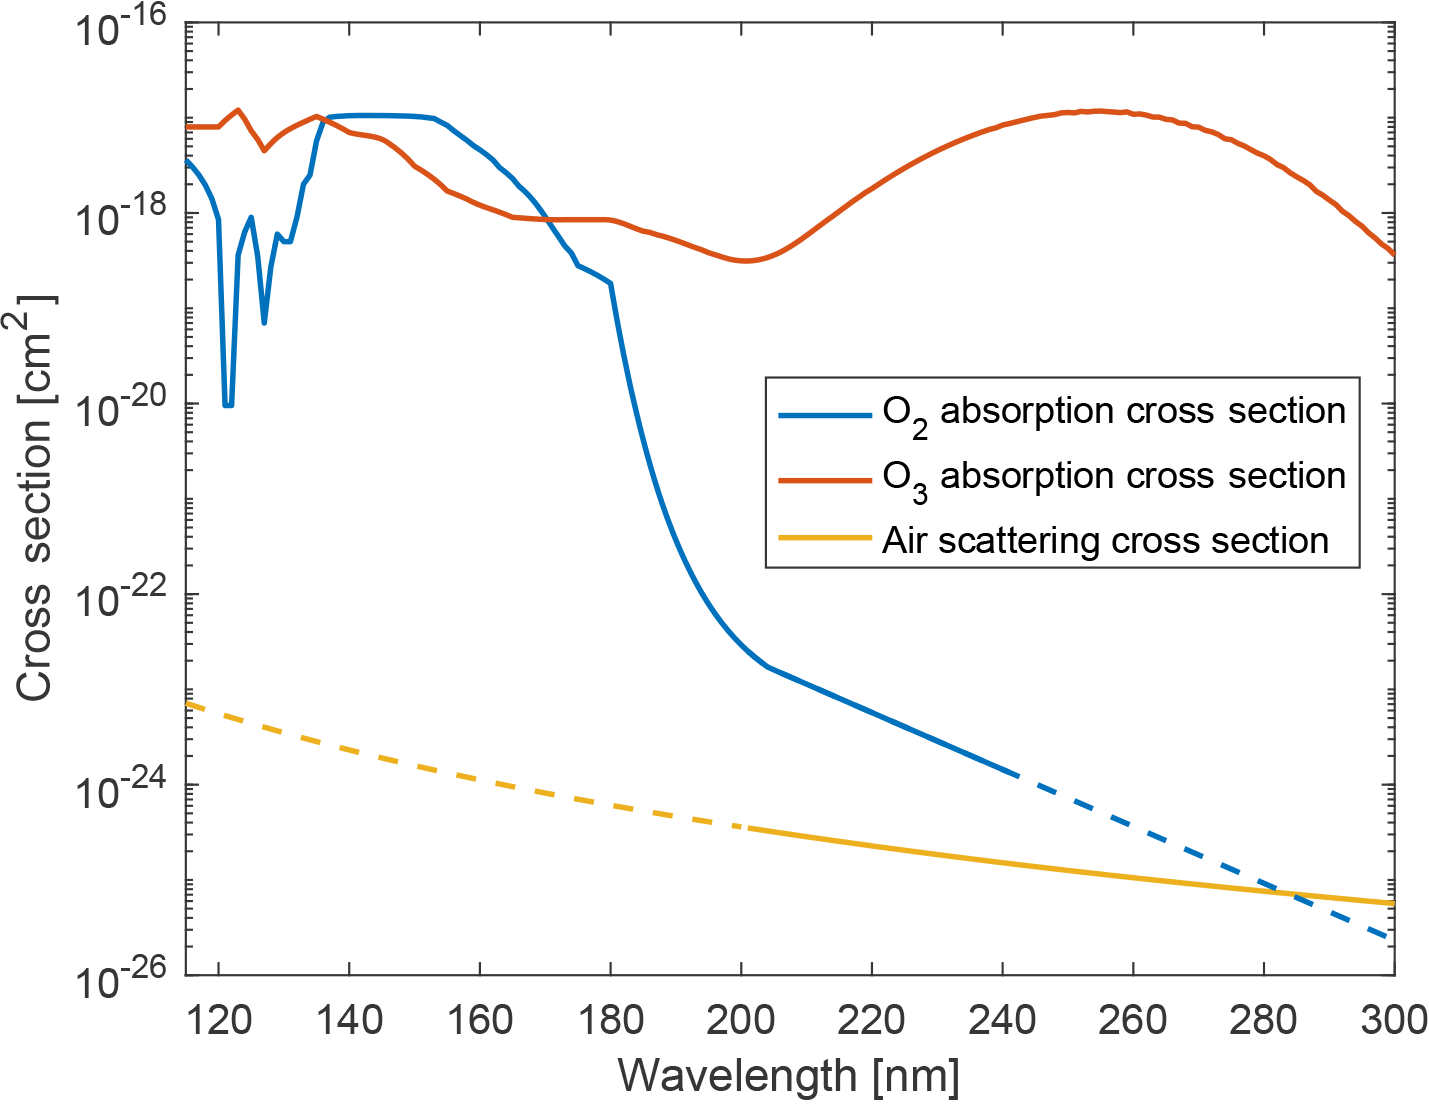
Figure 4Comparison between the absorption cross section of O2 and O3 with the scattering cross section of air. Dashed lines show the interpolated data.
2.2 Material properties
The properties of the material are the second important aspect to be considered when estimating the photocurrent, as each material interacts differently with the incoming energetic photons. For any material, knowledge of the following two properties is required: their photoelectric yield and their reflectance. The photoelectric yield is the probability for a photon with a given energy to eject an electron from the material. Indeed, although all absorbed photons transfer their energy to the electrons inside the material, most of the electrons are only excited inside the material and thus do not contribute to the photocurrent. The reflectance gives the probability for a photon to be reflected from the material, depending on its angle of incidence θi. Reflected photons do not contribute to the photocurrent: only absorbed photons can transfer their energy to the material electrons.
Photoelectric yields for gold, aluminium, stainless steel and graphite are taken from Feuerbacher and Fitton (1972), and values for nickel up to 180 nm were obtained from Hinteregger and Watanabe (1952). The values used for these five materials are shown in Fig. 5. It is important to notice that the photoelectric yield drops by almost 2 orders of magnitude from 121.5 to 250 nm. Hence, even if the solar spectral flux is higher in the near-UV compared to the Lyman-alpha line (see Fig. 3), the contribution to the photocurrent from these near-UV photons is expected to be much lower than the contribution from the more energetic Lyman-alpha photons. In addition, material composition (e.g. alloys), preparation (e.g. freshly cut aluminium compared to aluminium oxide surface), intrinsic structure (e.g. lattice structure for crystalline materials) and surface roughness can have a large impact on the photoelectric yield. Gold and aluminium measurements presented by Feuerbacher and Fitton (1972) were evaporated film on glass substrate, exposed to ambient atmosphere for several days. The stainless steel surface was a clean polished one, and graphite was prepared as an atomically clean surface. No information about the alloy used for aluminium and stainless steel was given. Results for nickel from Hinteregger and Watanabe (1952) were obtained using a cathode but no additional information was given.
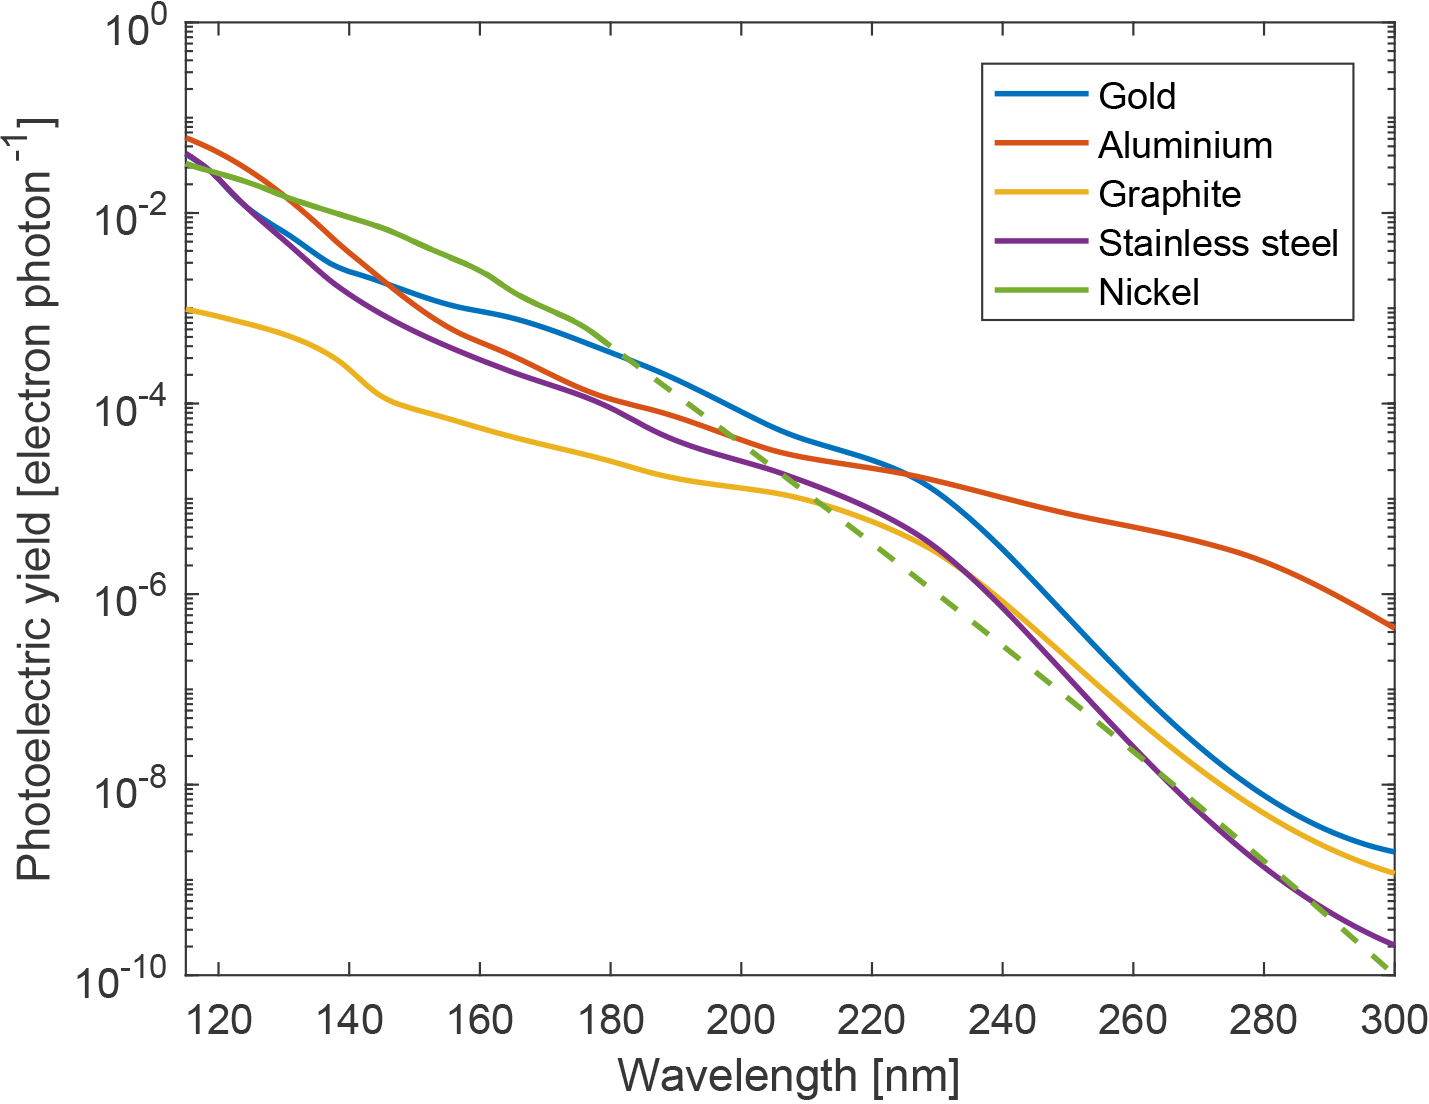
Figure 5Photoelectric yield as a function of wavelength for the five different materials: gold, aluminium, stainless steel, graphite and nickel. The dashed part of the nickel curve shows the interpolated data.
The total reflectance R(λ,θi) for these materials is the average of the two Rs(λ,θi) and Rp(λ,θi) reflectances for s and p polarisation, respectively, which can be obtained from the Fresnel equations
where n(λ) is the refractive index of each material as a function of wavelengths. Measurements of n(λ) for gold, aluminium, graphite and nickel were taken from Hagemann et al. (1975), McPeak et al. (2015), Djurisic and Li. (1999) and Werner et al. (2009), respectively. Proper measurements of the index of refraction for stainless steel in the UV were not found in the literature, and values for iron measured by Werner et al. (2009) were used instead.
The absorption is obtained as . Figure 6 shows a comparison of the reflectance at the Lyman-alpha for the five difference materials.

Figure 6Reflectance at the wavelength of the Lyman-alpha (121 nm), as a function of angle of incidence, for each of the five materials.
2.3 Illumination on the detector
A proper knowledge of the illumination's angle of incidence θi onto the MSPD is required for estimating the photocurrent. Ray-tracing simulations can provide a quantitative estimation of illumination across the detector surface given that a high enough spatial resolution for the grid is used. However, due to its complex geometry, modelling the instrument in a standard ray-tracing software was not possible and a custom routine was created instead. The central electrode was modelled as a sphere, and each wire composing the two concentric grids (hereafter referred to as grid-wire) was modelled as a torus (98 in total). The ray-tracing calculations aimed at finding the intersection between a given ray (i.e. a vector) and each of the instrument surfaces by solving a quartic equation (i.e. equation of the fourth degree) for each torus, and one quadratic equation for the central sphere. The resolution of the simulated grid of rays was 0.1 mm, which is small enough compared to the radius of the grid-wire radius (0.5 mm). In addition, only half of the MSPD was simulated thanks to symmetry, i.e. x axis from 0 to +45 mm, and z axis from −45 to +45 mm. Although the MSPD is symmetric along two of its axes, a change in inclination (i.e. rotation of the detector around one of the two axes of symmetry) can result in a different illumination of the central electrode. This was investigated by performing calculations for seven different inclinations, from 0 to 90∘. Such simulations are quite computationally intensive: each run at a given inclination was composed of approximatively 320 000 rays and required about a week of computation on a 24-CPU node from the KTH PDC post-processing server. Figure 7 shows the resulting illumination for three different inclinations: 0, 45 and 90∘. Rays interacting with the central electrode are shown in red in Fig. 7, and their angle of incidence with respect to the sphere can easily be obtained using the output from the ray-tracing simulation. Note that rays reflected by the grids towards the central electrode were not considered here. In this design of the detector, such rays are unlikely to have a significant impact as only the inner side of both grids could reflect photons back onto the electrode, and the inner sides are shadowed by the grids themselves.
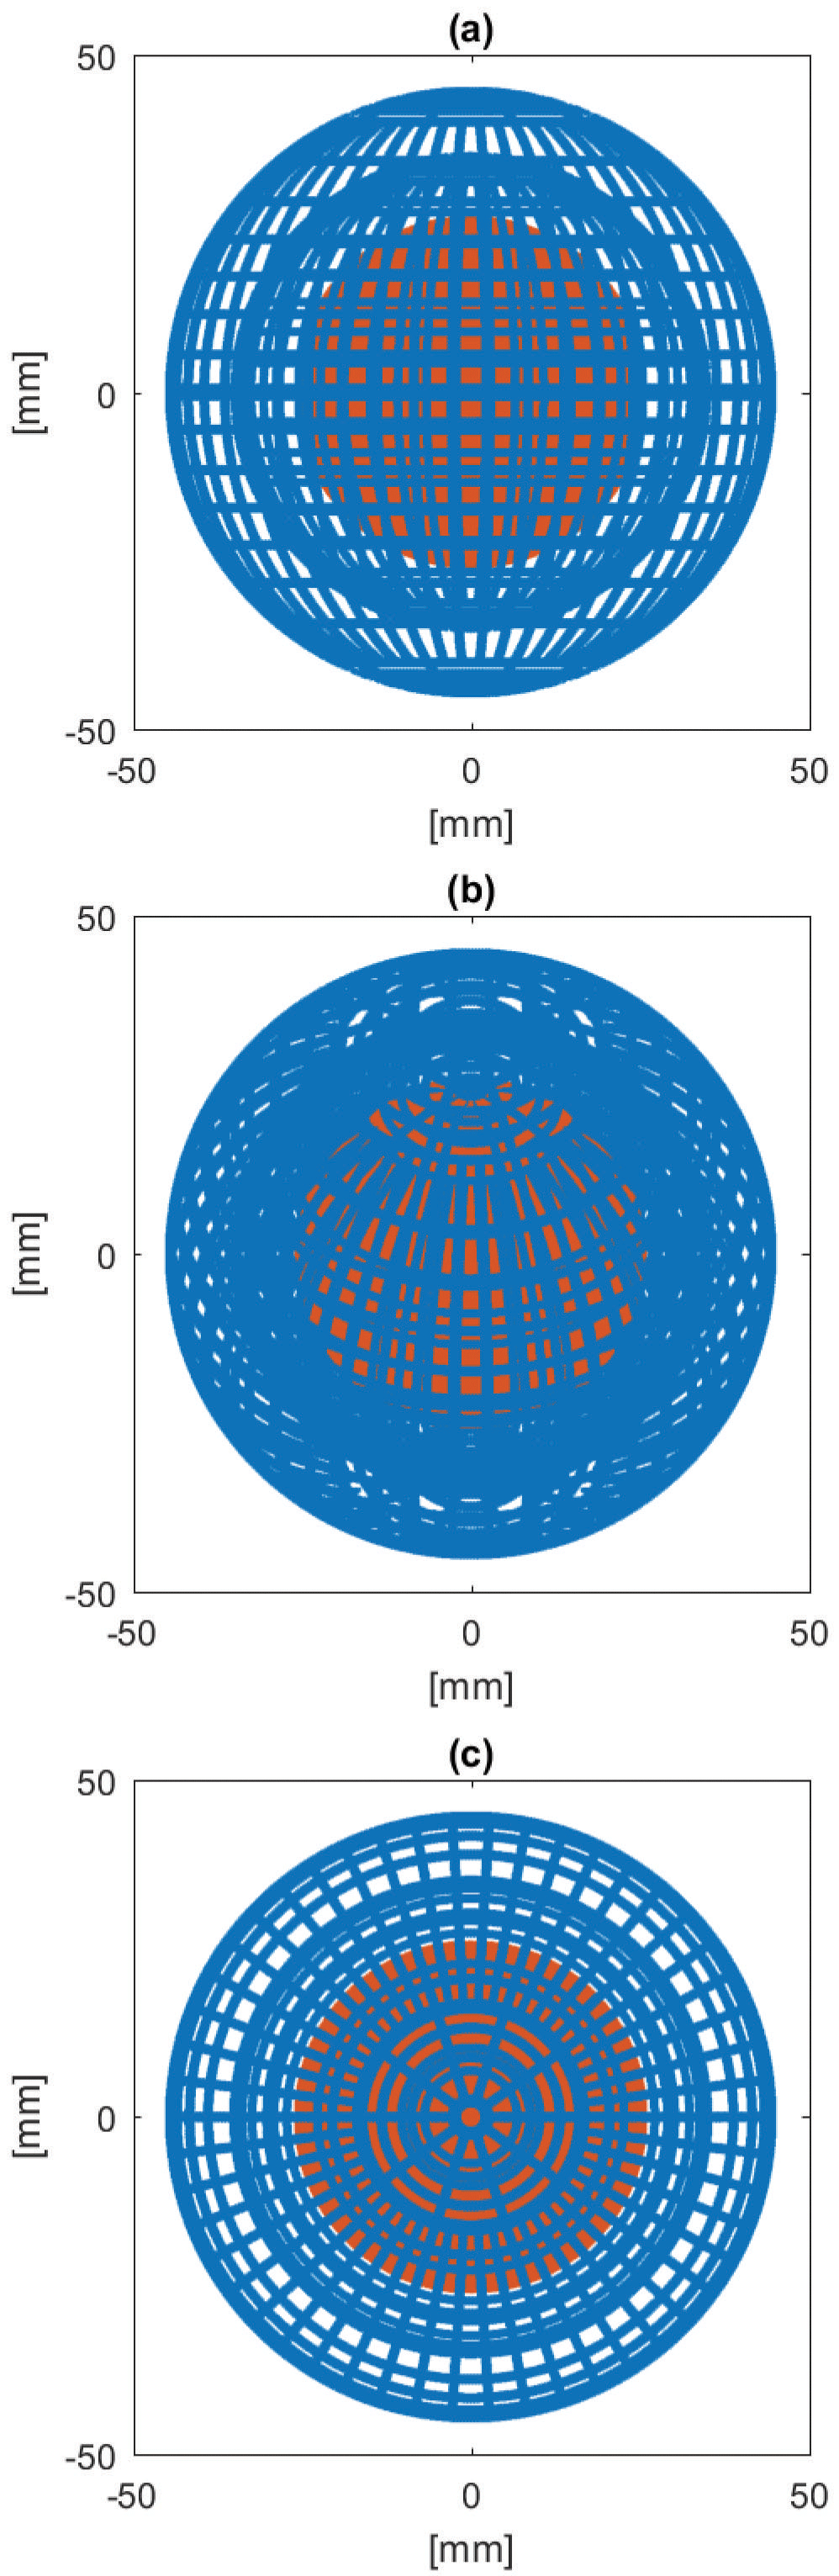
Figure 7Illumination on the MSPD for an inclination angle of (a) 0∘, (b) 45∘ and (c) 90∘. Red shows the rays hitting the central electrode and blue represents the rays hitting the grids.
2.4 Resulting photocurrent
The MSPD photocurrent can be obtained by combining how the UV photons at each height (Sect. 2.1) fall on the detector (Sect. 2.3) and interact with its material (Sect. 2.2). The resulting photocurrent, as a function of height, is shown in Fig. 8 for the five different materials at a 0∘ inclination. As expected from its photoelectric yield, a carbon coating produces the lowest photocurrent at heights above 80 km. Aluminium, nickel and stainless steel produce relatively similar photocurrents below 60 km, as most of the Lyman-alpha photons are absorbed by the atmosphere and their photoelectric yields in the near-UV are relatively similar.
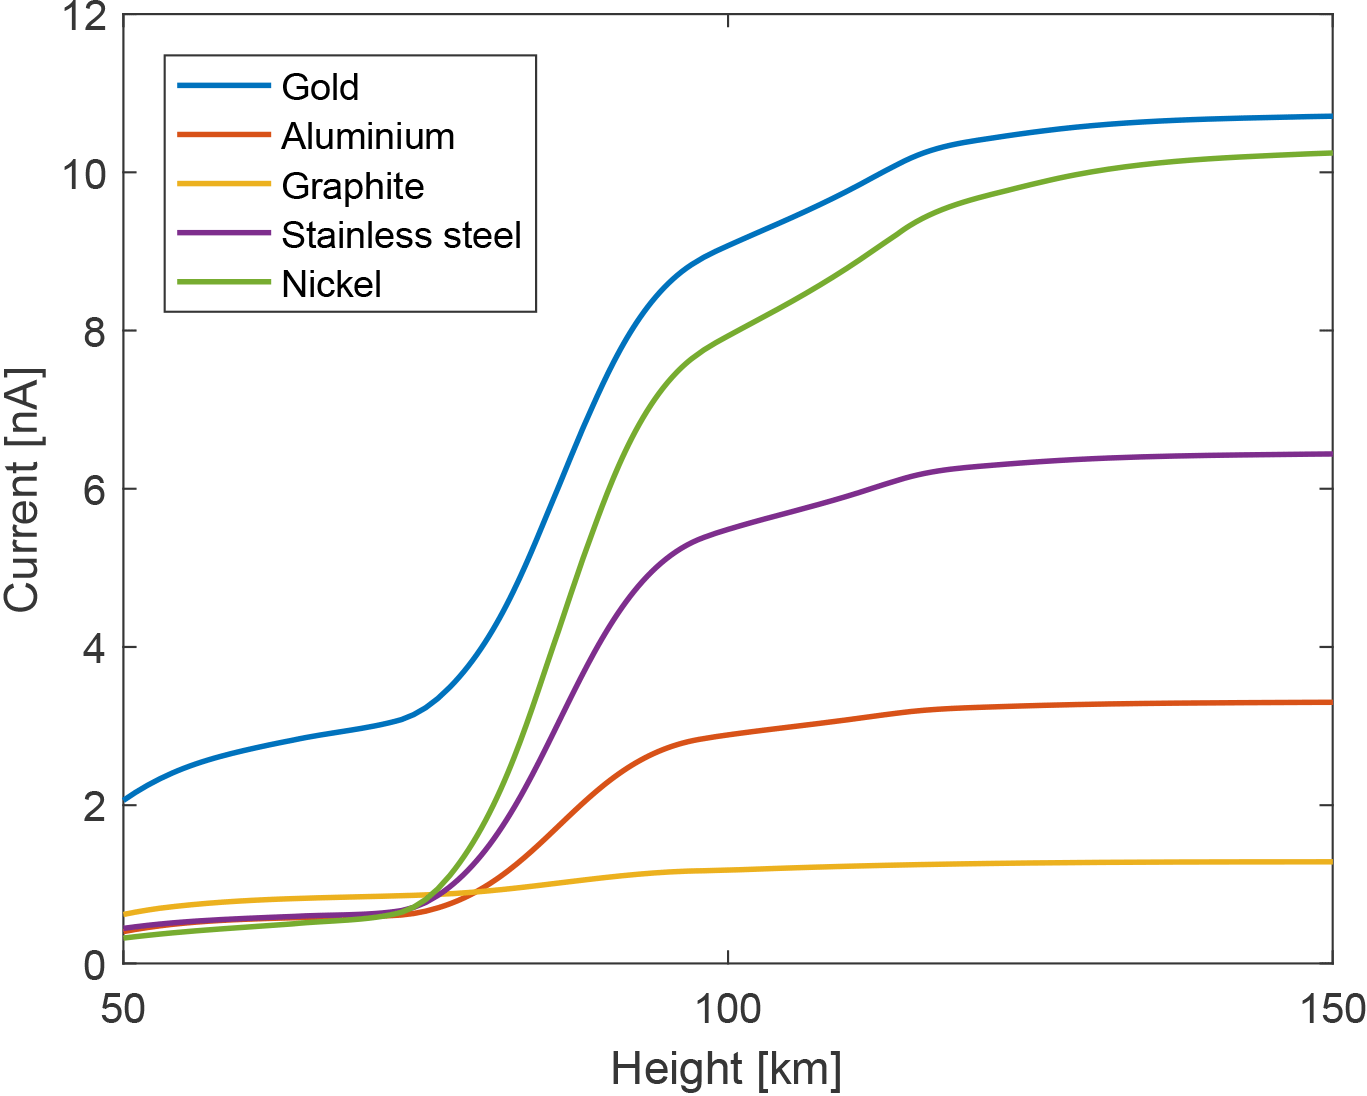
Figure 8MSPD photocurrent at various heights for the five different materials, for an inclination angle of 0∘ and a solar zenith angle of 75∘.
Figure 9 shows the expected photocurrent of a stainless steel electrode (i.e. the base material of the MSPD) at an altitude of 85 km and for various inclinations of the detector. As expected from its asymmetric design, the change of the photocurrent as a function of inclination is not straightforward, due to the complex shadowing of the central electrode by the two concentric grids. In addition, the photocurrent can be seen to be much larger for the case at 90∘ compared to the other cases. This is most likely due to a perfect alignment of the two grids for this particular case, reducing the shadowing on the central electrode, and is expected to be less significant on the real detectors, as both concentric grids are not as perfectly aligned together. Nevertheless, this is an important result as it confirmed the relationship between the recorded photocurrent and the instrument attitude, which could be used as an additional parameter to constrain the photocurrent from the MSP current during the analysis of the flight measurement.
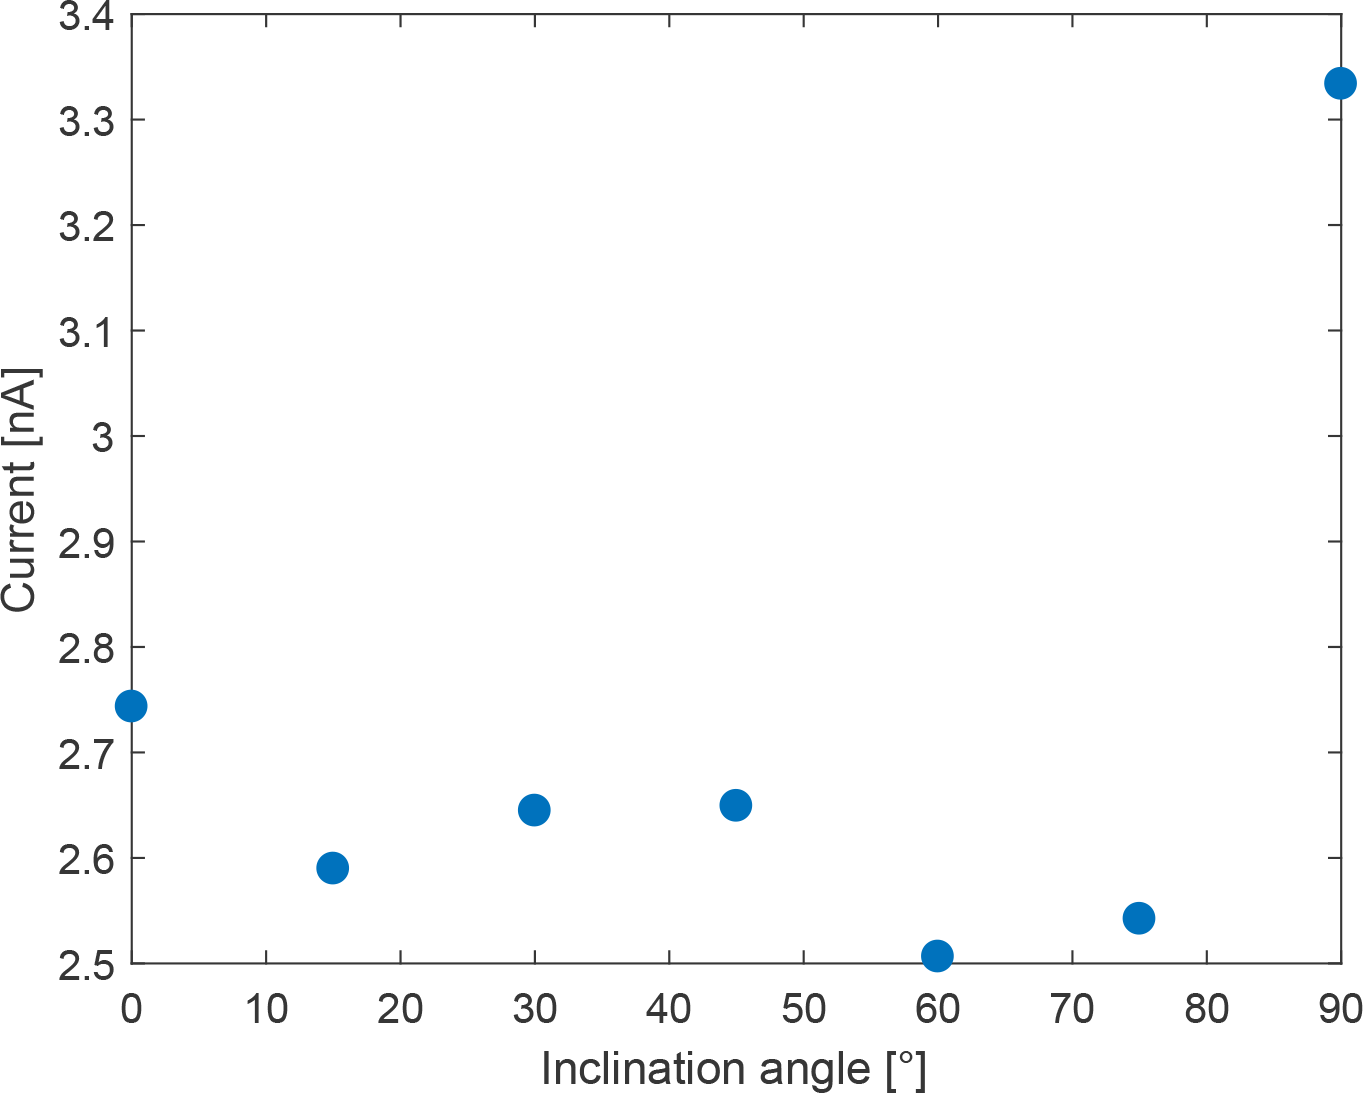
Figure 9Photocurrent as a function of inclination of the MSPD detector at a 85 km altitude, for the seven different inclination angles simulated. The material considered is stainless steel and the solar zenith angle is 75∘.
2.5 Comparison photocurrent measurements from a sounding rocket flight
Robertson et al. (2014) presented photocurrent measurements recorded by a 20 mm diameter aluminium plate on board the CHAMPS sounding rocket. The rocket was launched from Andøya on 13 October 2011 at 13:50 UT. The model was used to estimate the photocurrent emitted by such aluminium plate, using the solar spectral irradiance recorded by the SOLSTICE/SORCE instrument on this particular day and assuming an almost normal angle of incidence on the plate (i.e. differences in angle of incidence from 0 to 30∘ can be considered negligible). Information about how the aluminium plate was prepared was not provided by Robertson et al. (2014), although one can probably assume a polished surface with oxidation from the ambient atmosphere. Figure 10 shows the results of the calculation, compared to the measurements from Robertson et al. (2014) (see Fig. 13 therein, here taken as the average of both the up-leg and down-leg measurements). Note that measurements below 700 nA m−2 and above 96 km were not provided by Robertson et al. (2014). One can see that in the region of interest where MSP are expected, i.e. from 75 to 95 km, the decrease in photocurrent due to the Lyman-alpha absorption by molecular oxygen is reproduced by the base model (i.e. using an unshifted altitude range for the O2 and O3 profiles and using the photoelectric yield of aluminium from Feuerbacher and Fitton, 1972), although the scaling is quite different. The base model underestimates the photocurrent above 90 km by a factor of 5 while slightly overestimating it below 80 km. The reason behind these differences is most likely due to the uncertainty of the photoelectric yield, as well as a small influence by the unknown true density profile of O2 at these heights. These two parameters were left as free parameters in order to fit the photocurrent measured by the plate. As the plate photoelectric yield was unknown, the measurement for aluminium was taken for the overall shape of the yield and a power law scaling (i.e. linear trend in the log scale curve) was used to adjust its slope. The resulting photocurrent profile is shown in Fig. 10, whereas the adjusted photoelectric yield is shown in Fig. 11 alongside the yield of other metals from Feuerbacher and Fitton (1972). One can see that the model can provide a much better fit to the measurements with only a small +1.2 km offset of the model altitude, combined with an adjusted photoelectric yield about five times larger at the Lyman-alpha, where most of the O2 absorption occurs. Notice that the adjusted yield is comparable to the measurements of other metals. Although these results are empirical, the altitude offset and adjusted yield are not completely unrealistic. As previously mentioned, the difference in the photoelectric yield might be due to contaminating material on the plate surface, as well as the purity and the surface roughness of the aluminium used. The residual between the fitted model and the measurements has a ±300 pA amplitude and is shown in Fig. 12. The pattern seen in the residual is an artefact from the model that does not perfectly reproduce the photocurrent.
Considering the number of possible uncertainties, the base model was still able to reproduce the photocurrent within the same order of magnitude and with a similar absorption behaviour with respect to height. In addition, adjustment to the photoelectric yield and the height of the atmospheric density profiles allowed the model to fit the measurement with a ±300 pA amplitude residual. Although this method is not perfect (i.e. one would ideally want to have a precise measurement of the detector photoelectric yield), such fitting of the model should still be able to detect MSP layers inducing current larger than 300 pA in the 70 to 100 km altitude region in the case of the MSPD.
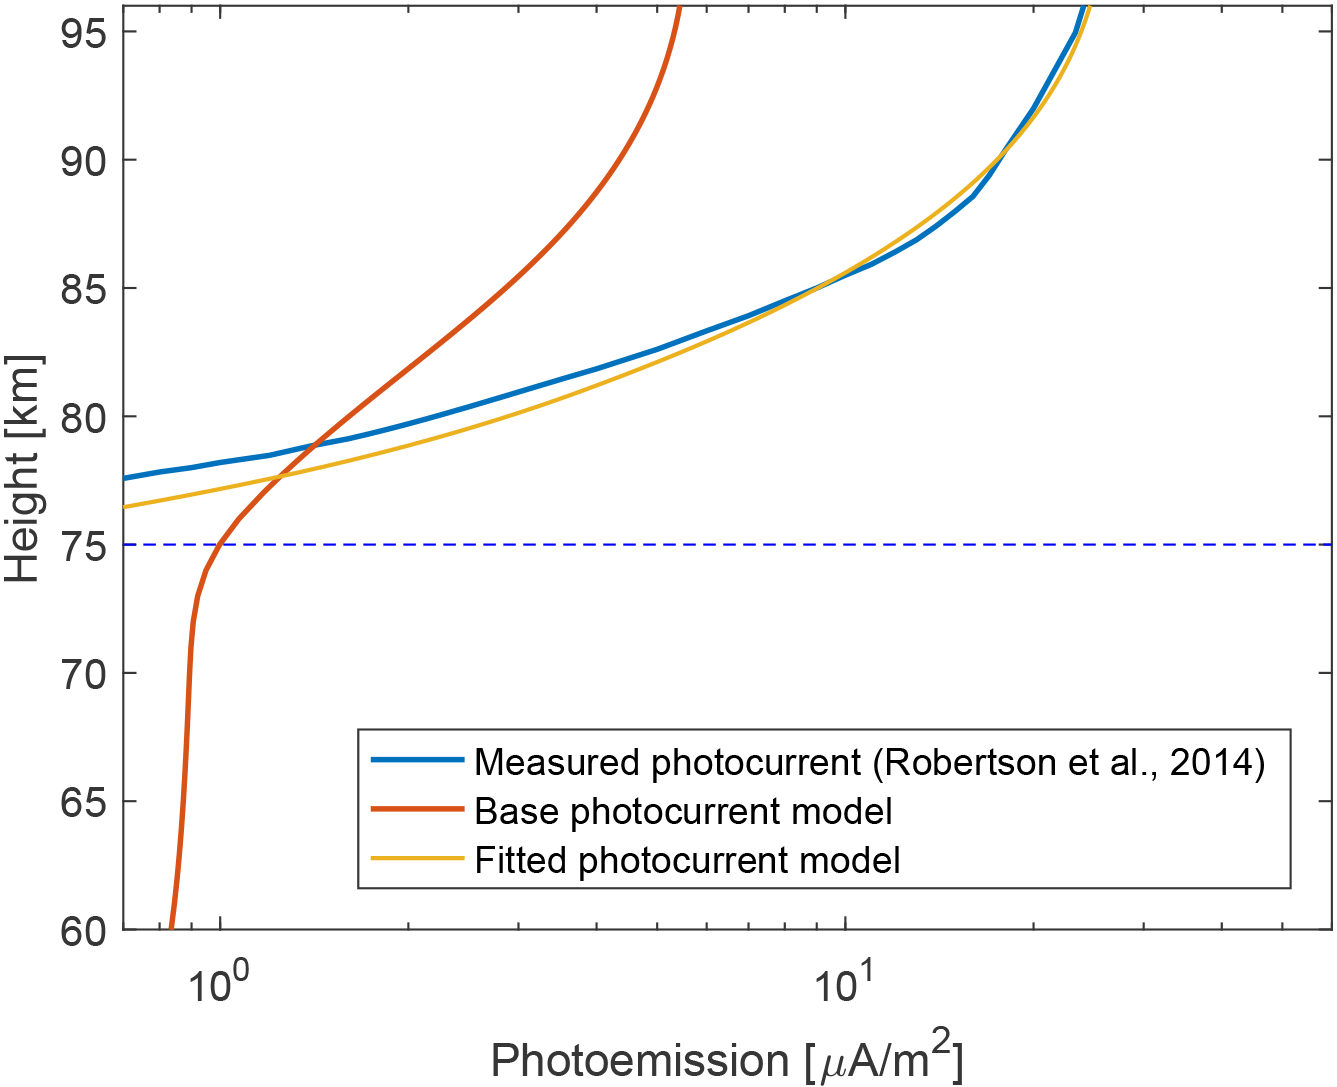
Figure 10Photocurrent measurements from a 20 mm diameter aluminium plate, taken from Robertson et al. (2014) (blue curve), compared to the computed photocurrent by the base model (red curve) and the model with adjusted yield and +1.2 km shift in altitude (yellow curve). The horizontal dashed line shows the lower height limit for the expected MSP layer. The solar zenith angle considered for the calculation is 75∘.
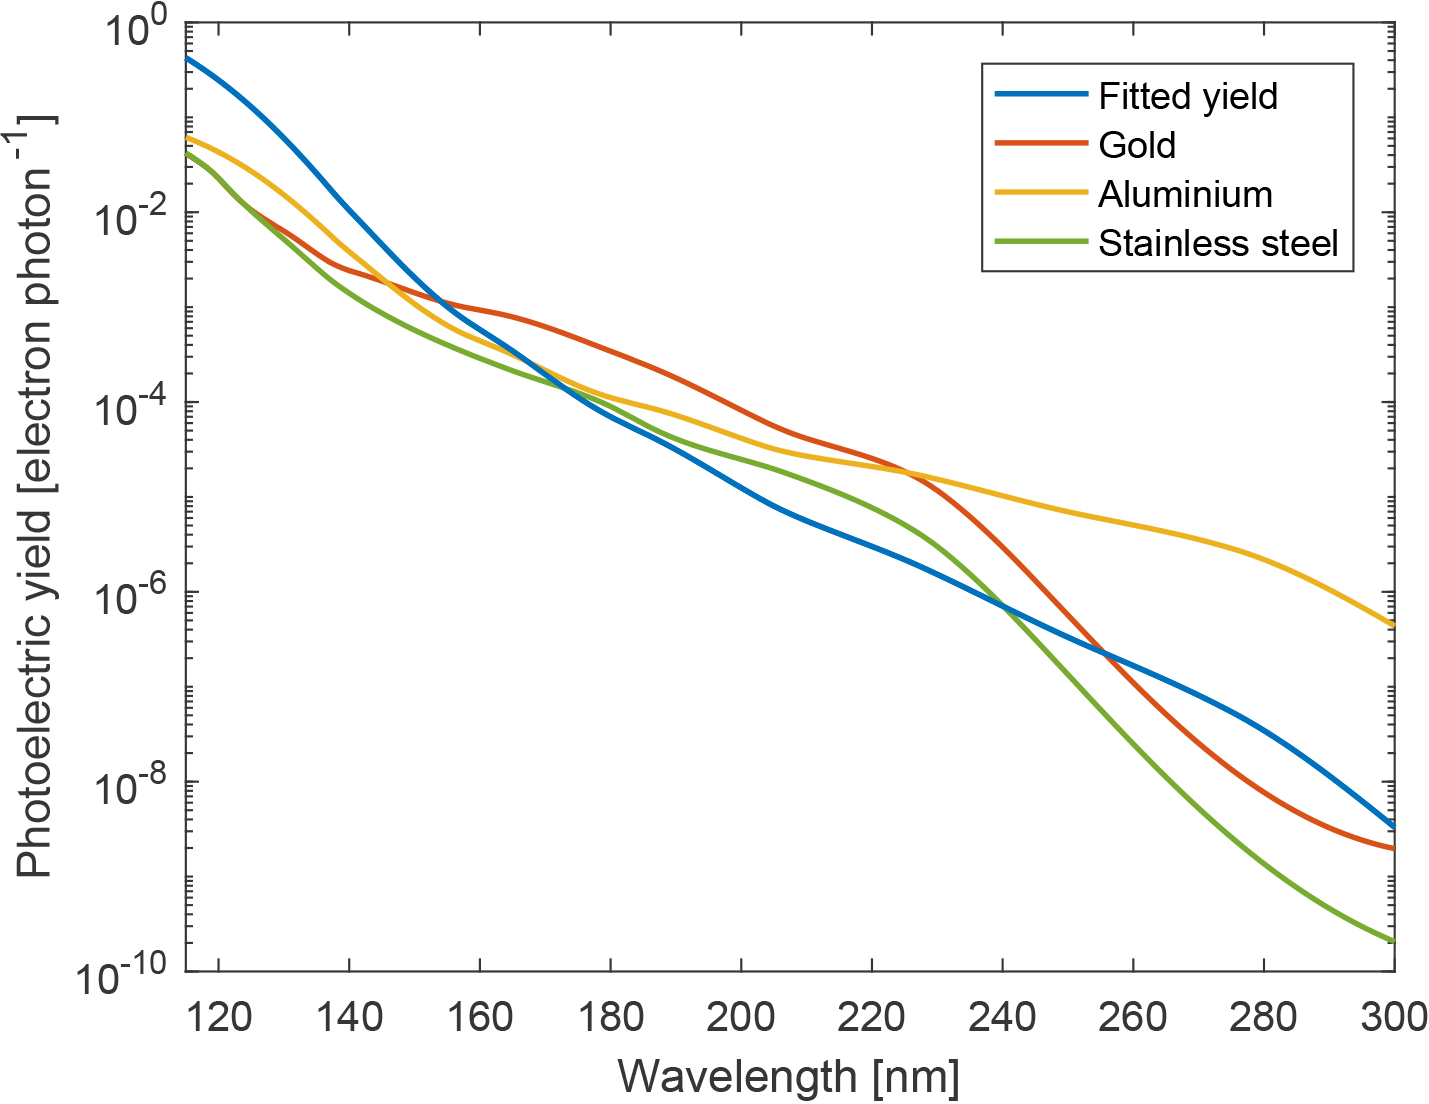
Figure 11Fitted photoelectric yield compared to other metals from Feuerbacher and Fitton (1972).
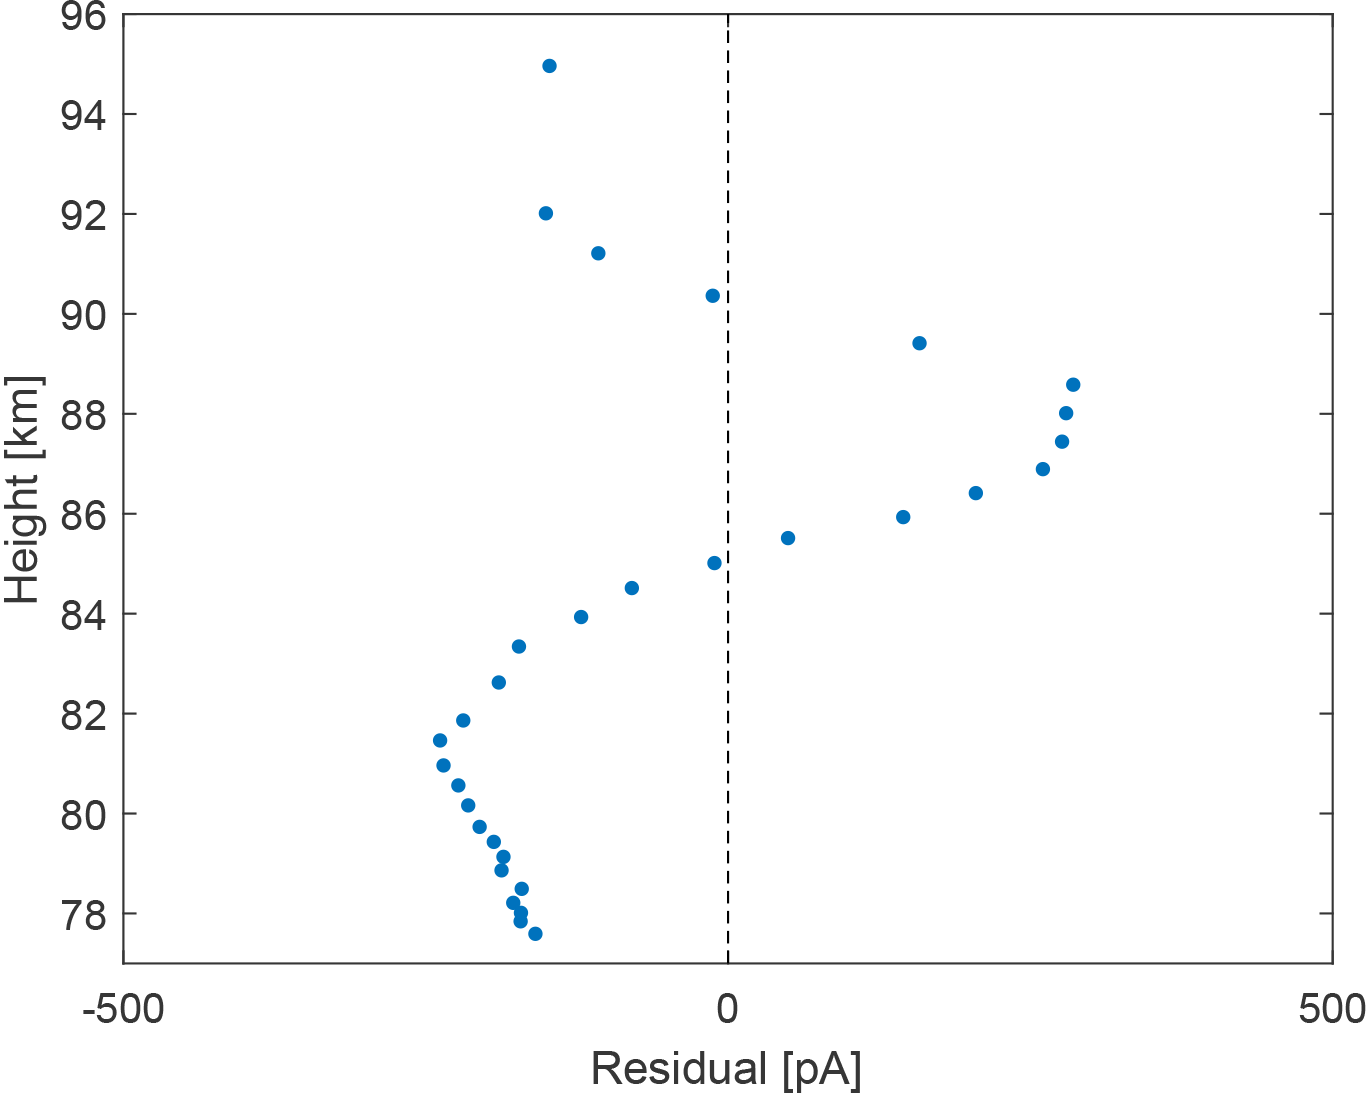
Figure 12Residual between the photocurrent measurements from Robertson et al. (2014) and the fitted photocurrent model.
3.1 Overview of the experiment and apparatus
The experiment aims at using a known UV spectral flux to illuminate the detector and monitor the resulting photocurrent on the MSPD. Ideally, a calibrated UV light source in a monochromator setup can provide a precise wavelength selection of the UV flux and allow for a detailed breakdown of the photocurrent as a function of the incident wavelength. However, such configuration was not readily available and, for the purpose of keeping the cost low, narrowband filters were used to select various UV wavelength-bands instead. Figure 13 shows the layout of the experiment. The experiment was conducted inside a 300 mm radius and 600 mm long vacuum chamber, to avoid absorption of the VUV light by the atmosphere.

The light source used was a Heracles V01 Deuterium lamp, which was calibrated by the PTB (Physikalisch-Technische Bundesanstalt, the German national institute of metrology) in 2011 for a previous calibration experiment (Ernst et al., 2011). Its normalised emission spectrum is shown in Fig. 14a. Although the initial plan was to use four different filters centred around 121.5, 160, 200 and 250 nm to obtain the photocurrent in various passbands, no significant photocurrent was recorded when using the three latter filters. This was not due to a lack of photons from the light source in these spectral ranges but rather to the photoelectric yield of the material decreasing rapidly as the wavelength increases (see Fig. 5), making the resulting photocurrent below the detection limit (∼10 pA). Hence, only the Lyman-alpha filter was used during the experiment and its transmission curve is shown in Fig. 14b. Finally, the VUV flux from the light source was monitored using a silicon photodiode mounted on a rotary stage in order to move it either in front or away from the light source beam. Monitoring the light source flux was needed to estimate possible temperature related variation of the intensity as well as measuring the light source stability, but also for estimating the possible decrease in the flux due to contamination. Knowing the spectral response from the photodiode and the incident spectrum via the light source spectrum and the filter transmittance, it is possible to estimate the photon flux emitted by the light source from the photodiode current. However, the manufacturer only provided the spectral response of the diode down to 148 nm, and the response for lower wavelengths was unknown. Figure 14c shows the spectral response down to 148 nm, as well as two empirical responses for wavelengths down to 115 nm. The first case represents a monotonic decrease of the spectral response as a function of wavelength whereas the second case represents an insensitivity of the photodiode to lower wavelengths. Pictures of the experimental setup are shown in Fig. 15.
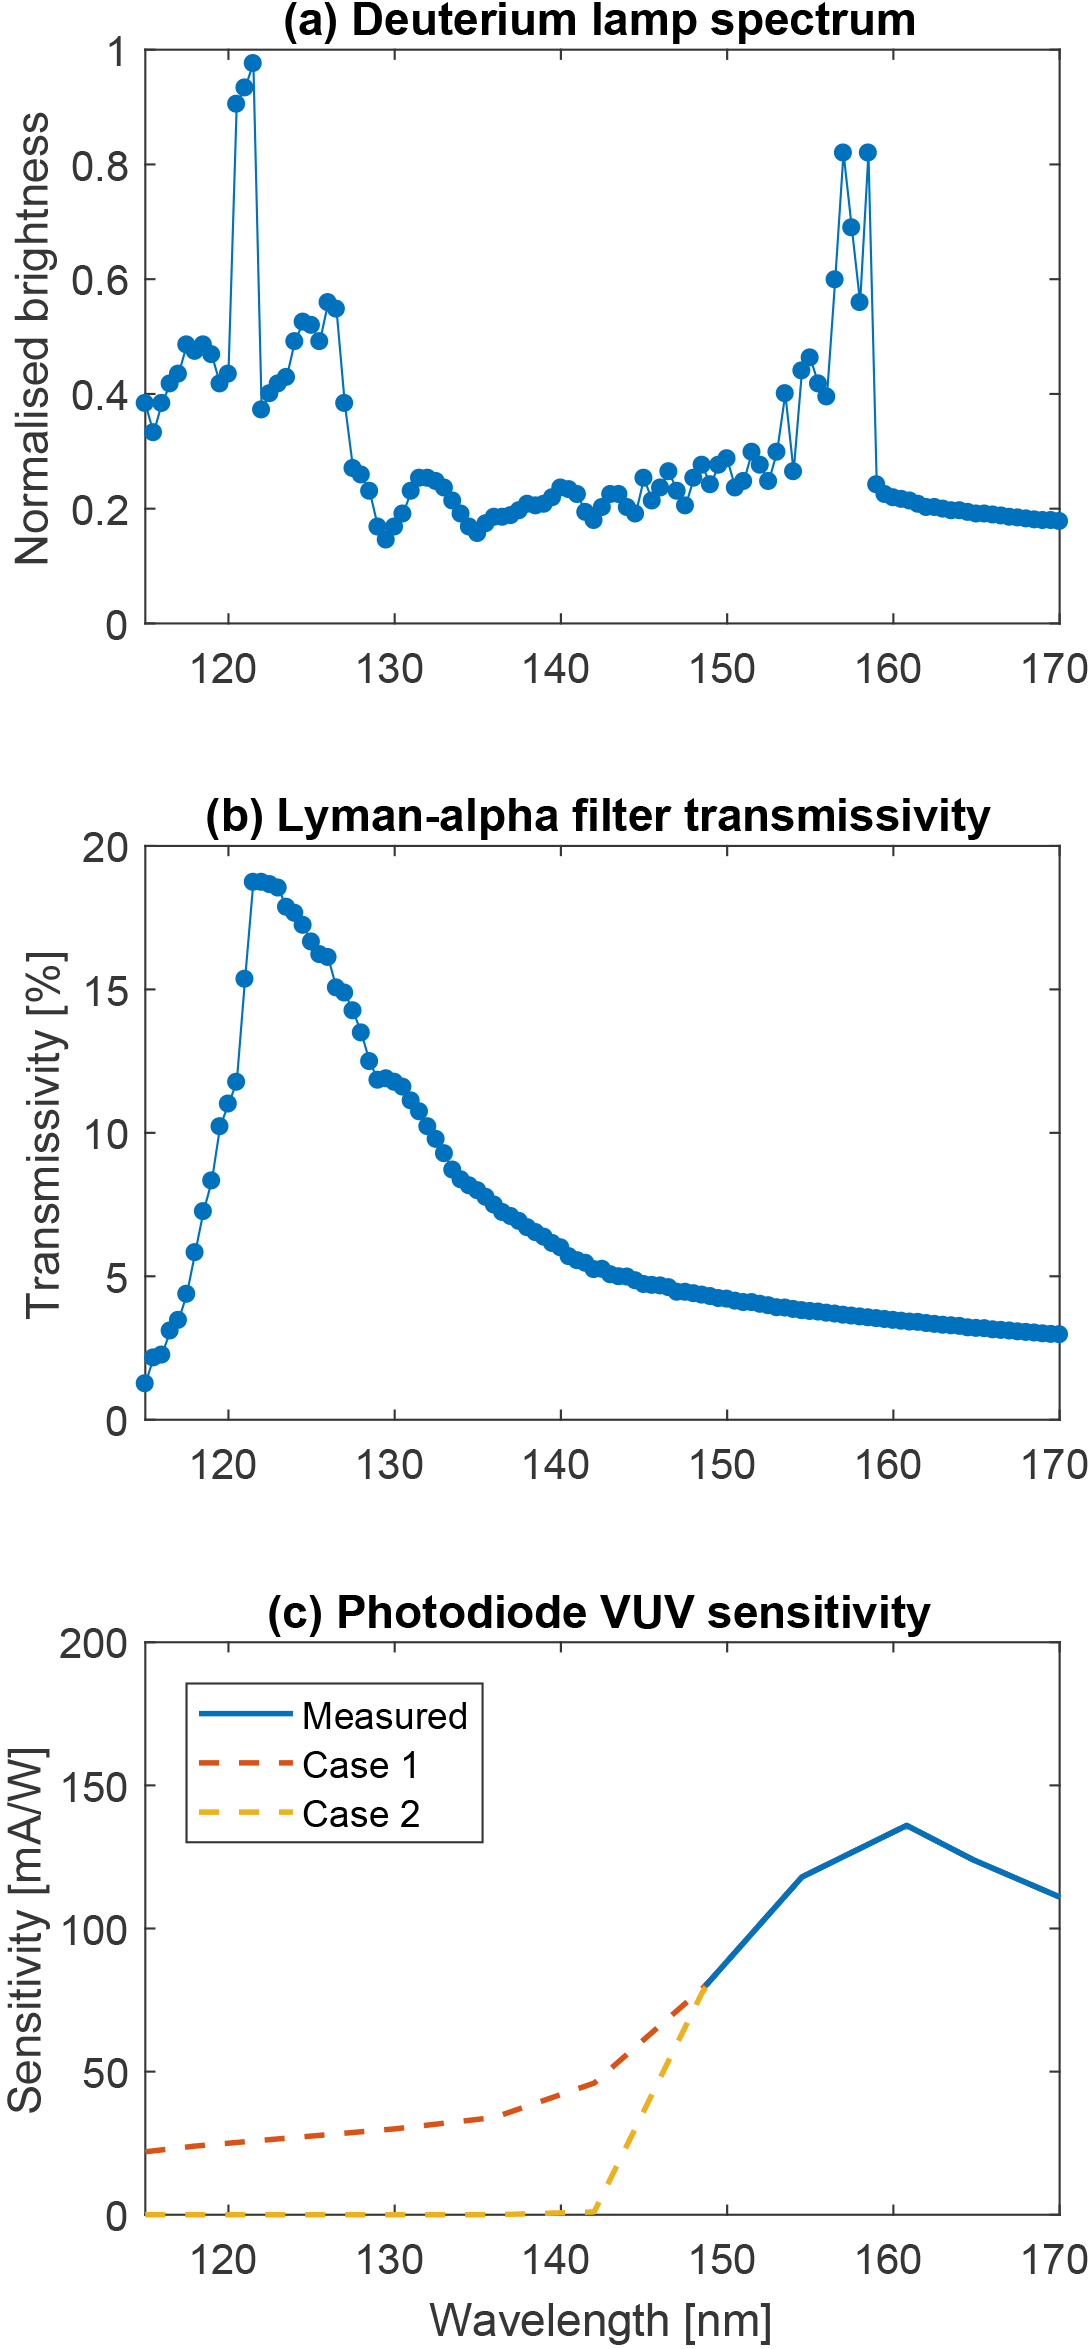
Figure 14(a) Deuterium lamp spectrum measured by PTB. (b) Transmission curve of the Lyman-alpha filter. (c) Sensitivity of the photodiode, with the two different assumed cases below 148 nm.
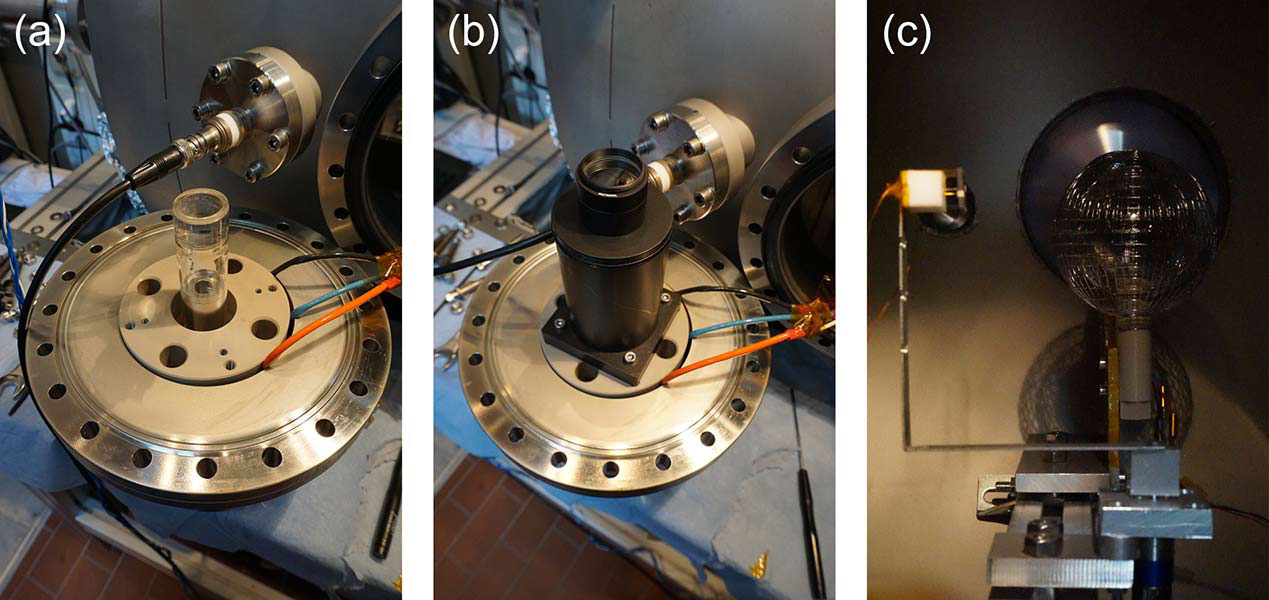
Figure 15(a) Deuterium lamp spectrum inside its polyether ether ketone (PEEK) holder. (b) Deuterium lamp covered with baffle and filter holder. (c) Setup inside the vacuum chamber, with MSPD in the background (0∘ inclination) and the photodiode on its rotating arm on the left.
3.2 Experimental measurements
Measurements were conducted for three different inclination angles of the MSPD: 0, 45 and 90∘. The initial plan was to record the photocurrent for additional inclination of the detector. However, large variations between multiple measurements taken at the same inclination were observed. These large variations were due to contamination on the Lyman-alpha filter, most likely caused by outgassing from the deuterium lamp socket, and greatly degraded the VUV throughput over time as the light source was operated within a vacuum. An example is shown in Fig. 16. One can notice the much larger decrease in the electrode current compared to the photodiode current. This suggests a larger absorption of the shorter wavelengths, which are a larger contributor to the photocurrent but for which the photodiode is less sensitive. Note that a positive sign is adopted as convention for the electrode photocurrent, to be consistent with the calculation presented in Sect. 2.
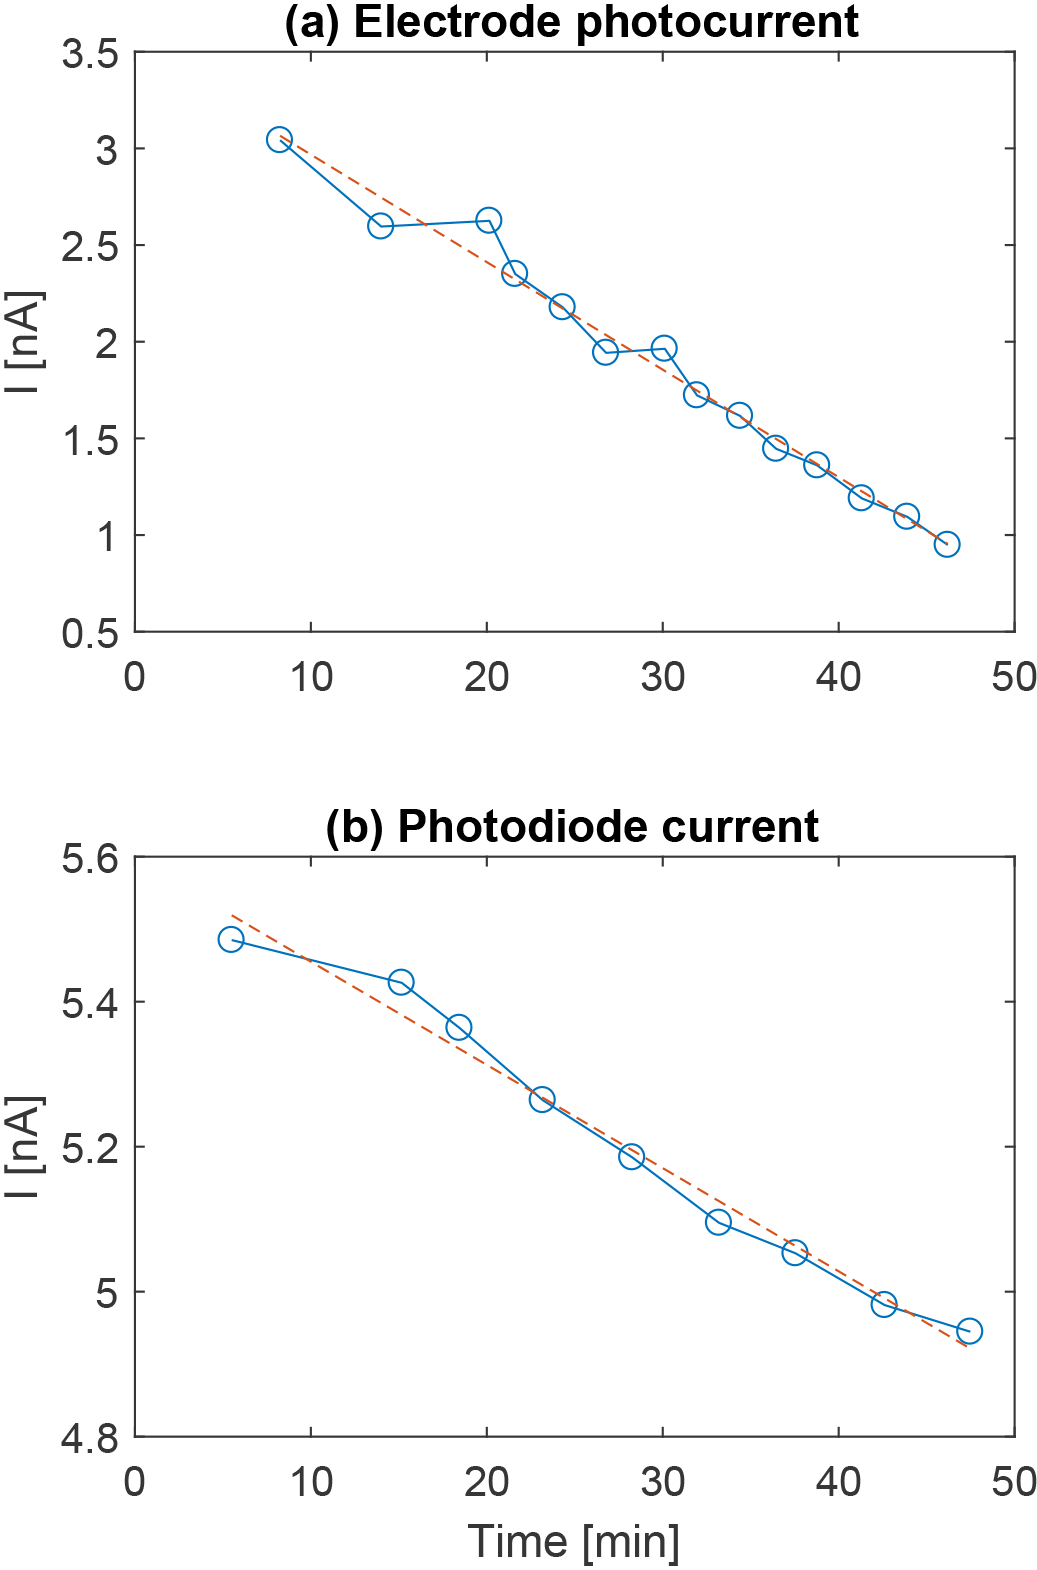
Figure 16Decrease of (a) the electrode photocurrent and (b) the photodiode current over time, suggesting a degradation of the UV throughput due to contamination on the Lyman-alpha filter. Time starts at the start-up of the light source. The red dashed line shows a linear fitting.
To mitigate this issue, a rigorous cleaning of the filter using methanol was performed in between each measurement sequence taken at a given MSPD inclination. This effectively removed the contaminating material from its surface. The lamp MgF2 window and the MSPD detector (inside an ultrasonic bath of ethanol) were also cleaned in between measurement sequences. The duration of each measurement sequence was kept below 15 min to minimise the time spent within a vacuum and thus limit the build-up of the contamination. Each measurement sequence was performed as follows: the light source was switched on after reaching a pressure of 10−3 mbar and 5 min were allocated for its output light and current levels to stabilise. Then, a first recording of the electrode photocurrent was performed (each individual measurement consisted of 500 points recorded in about 1 min at a fixed bias using a Keithley 6430 sub-femtoamp remote sourcemeter). The photodiode was then placed in front of the beam and a recording of its current was performed. After that, a second measurement of the electrode photocurrent was performed, followed by a photocurrent measurement on each of the two grids, a second photodiode measurement, a third electrode photocurrent measurement and a final third photodiode measurement before switching off the light source. Dark current measurements for the electrode, the two grids and the photodiode were also recorded with the light source off and was around 10 pA for all surfaces. The biases used on the detector were the same as for one of the supposed flight configurations: central electrode grounded (in this case, to the chamber walls), inner grid at +6 V and outer grid at −6 V. Note that reaching a higher vacuum was not required for the purpose of the experiment, as the threshold for significant decrease in the photocurrent due to absorption was observed to be around 10−2 mbar. Figure 17 shows the results for the 15 measurement sequences taken during the experiment in chronological order, five for each of the three orientations tested. The degradation of the throughput over time due to contamination is seen between the three measurements of the electrode photocurrent recorded on each sequence, even though the time spent within a vacuum was less than 15 min. This added a large measurement uncertainty and for this reason, multiple measurement sequences were conducted for the same three inclination angles instead of measuring additional inclination angles. Moreover, a linear decrease on both the electrode photocurrent and the photodiode current can be seen between the different measurement sequences. This was interpreted as a residual contamination building up over time onto the filter surface, which could not be removed entirely by the methanol cleaning. Still, the cleaning was very effective, as Fig. 16 showed that the throughput would otherwise be decreased by a factor of 3 after only 50 min of operation. Note that the current collected by the photodiode only decreased by about 10 % compared to the much larger decrease of the electrode photocurrent. This can be interpreted as the shortest wavelengths (i.e. around the Lyman-alpha) are more affected by the contamination compared to longer wavelengths, which are also transmitted by the filter (see Fig. 14b). These shorter wavelengths contribute more to the photocurrent whereas the photodiode is, by design, more sensitive to the longer wavelengths, hence the smaller decrease rate of the photodiode current compared to the electrode photocurrent.

Figure 17Results from the measurement sequences in chronological order for (a) the electrode photocurrent and (b) the photodiode current, for the three different inclinations.
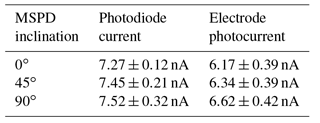
An estimation of the uncontaminated signal was made by removing the linear trend from the degradation. Table 1 shows the averaged corrected electrode photocurrent and corrected photodiode current for each of the three inclinations, with their corresponding 1σ errors calculated as the standard deviation of all 15 measurements taken at a given inclination.
Table 1Average electrode photocurrent and photodiode current for each inclination.
3.3 Comparison with modelling
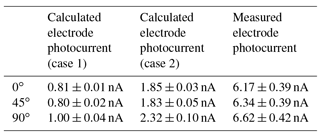
The photodiode currents from Table 1 can be used to determine the VUV flux from the light source. This current is the result of the integral of the light source spectrum multiplied by the filter spectral transmittance and the photodiode spectral sensitivity. By normalising the light source spectrum, one can use the recorded photodiode current to scale the light source spectrum and determine the number of photons emitted by the light source at each wavelength (assuming the light source spectrum is constant and not a function of other parameters such as the temperature). As previously mentioned, an uncertainty remained on the photodiode sensitivity for wavelengths below 148 nm, and two empirical cases were considered: a monotonic decrease of the spectral response as a function of wavelength and an insensitivity to lower wavelengths (see Fig. 14c). The resulting spectral flux of photons from the light source can then be input into the photocurrent model from Sect. 2 to estimate the expected photocurrent. Table 2 shows the expected photocurrent determined from the above described calculation, compared to the measured photocurrent from Table 1. One can see that, depending on the case for the photodiode sensitivity, the estimated photocurrent is between 3 to 8 times smaller than the measured one. This is comparable to the photocurrent modelled by the base model for the aluminium plate as discussed in Sect. 2.5, which also underestimated the photocurrent by a factor from 1 to 5. In addition, one can see that the predicted differences in photocurrent for the various inclinations is roughly similar to the error on the measured photocurrent, meaning that distinguishing between the different inclinations was unfortunately not possible based on the experimental measurements.
The characterisation of the photocurrent induced by solar UV radiation is a crucial aspect of any plasma probe launched during daytime. A dual and complementary approach to the problem was presented by means of both modelling and experimental measurements in the particular case of a rocket-borne meteoric smoke particle detector (MSPD) currently developed at the IAP.
The details of the photocurrent simulation were presented, including (1) an atmospheric absorption model providing the spectral flux of photons from 115 to 300 nm at any given height, (2) the material properties (photoelectric yield and reflectance) for various possible material and surface coatings of the detector, and (3) a detailed ray-tracing simulation providing a complete picture of the solar illumination onto the detector. The resulting photocurrent as a function of height was presented for the different material coatings of the MSPD. The model was also used to estimate the photocurrent on a circular aluminium plate and compared to actual photocurrent measurements by a similar plate made by Robertson et al. (2014), revealing an underestimation of the photocurrent by a factor of 1 to 5 in the 75 to 95 km region. A much better fit was obtained by allowing the model to adjust the photoelectric yield with a power law scaling, as well as shifting the height of the O2 and O3 atmospheric number densities by a few kilometres. Adjusting the yield can be justified by the fact that the plate photoelectric yield was unknown and could largely differ from the measurement by Feuerbacher and Fitton (1972) due to surface effects (e.g. oxidation, contamination, roughness and/or composition). Similarly, absolute knowledge of the O2 number density at these heights was lacking, which can be accounted for by slightly shifting the model altitude. The residual between the measurements and the adjusted model was within ±300 pA in the 70 to 95 km altitude range, suggesting that a MSP signal larger than 300 pA hidden in the photocurrent might be detectable using this method in the case of the MSPD.
The MSPD photocurrent was also measured experimentally: a deuterium lamp was used to provide VUV light and a known passband was selected around the Lyman-alpha wavelength using a narrowband filter. The light source flux was monitored using a silicon photodiode and, knowing the light source spectrum, the filter transmissivity and the photodiode sensitivity, an estimation of the spectral flux illuminating the detector could be made. Although the experiment had some issues, namely the contamination of the filter, the reduction of which reduced transmissivity and the uncalibrated spectral response of the photodiode below 148 nm, some practical solutions were presented and an improved experiment could provide better results in the future. Based on the measured photon flux, the model was used to estimate the resulting photocurrent, which was then compared to the experimentally measured one. The base model again underestimated the photocurrent by a factor of 3 to 8, depending on the photodiode sensitivity considered.
Precisely estimating the photocurrent is very challenging but the presented work revealed some pathways for building and preparing future rocket-borne instruments. First of all, knowledge of the material properties is crucial when attempting any estimation of the photocurrent. From a material standpoint, a graphite coating seems to be the best choice for minimising the photocurrent. However, a proper experimental characterisation of the reflectivity and, most importantly, of the photoelectric yield is required. This could be done simultaneously by measuring the wavelength dependence of the photocurrent response for the entire instrument as attempted in Sect. 3. However, a monochromator setup would be required for precise measurements, as well as a very bright UV light, especially in the wavelength range above 200 nm where the photoelectric yield drastically decreases. Another possibility could be characterising material samples of the detector at synchrotron facilities with a monochromator setup at the beamline. The high intensity of the beam would allow for a precise characterisation of the material photocurrent response. On this topic, it is worth pointing out the lack of open access accurate measurements of material properties, in particular for the photoelectric yield, as all measurements used in this article could only be retrieved from the published curves. Secondly, simultaneous measurements of the O2 number density along the rocket path is needed in order to constrain the deep-UV absorption at heights between 70 to 95 km. Monitoring the UV flux from the Sun, especially the Lyman-alpha line, during the flight could also provide a useful input to further constrain the photocurrent. Finally, placing the detector in the shadow of the rocket would directly solve all photocurrent related issues. However, this can be complicated as the rocket spins and in particular if the detectors are installed on deployable booms such as the MSPDs. Nonetheless, one could, for example, envision an deployable umbrella-like shade installed on the boom which could increase the time spent by the detector in shadow.
In the particular case of the MSPD, three important aspects derived from the presented work will be utilised to untangle the MSPD photocurrent from the actual MSP current. First, the photocurrent is affected by the detector inclination due to its asymmetric design, indicating a possible relation between the recorded photocurrent and the rocket attitude. Second, in-flight measurements of the O2 density will be provided by the CONE instrument also flying on board the PMWE sounding rockets. This will serve to better estimate the O2 absorption in the 75 to 95 km region of interest. Finally, the photoelectric yield will be adjusted to best fit the photocurrent recorded during flight, as demonstrated in Sect. 2.5, in order to constrain MSP signal larger than ±300 pA.
The geometry of the atmosphere used in the model is shown in Fig. A1, where h is the height of a given point of interest P, R is Earth radius, θz is the solar zenith angle, x is the distance between P and a given point P′ along the line of sight (LOS) and h′ is the corresponding height of the point P′. Using the law of cosine, one can express h′ as function of the distance x in a polynomial equation of order 2. The path along the LOS x is discretised with one kilometre steps, and the corresponding h′ are calculated by solving the polynomial equation. The final light path is obtained by considering values of h′ between h and 240 km, the top of the atmosphere considered in the model.

Data used in this article, as well as the atmospheric absorption model developed, are available upon request to G. Giono.
The modelling of the photocurrent was conducted by GG at KTH, with the help of constructive discussion with the co-authors. The experimental measurements were conducted at the IAP by GG, with direct support from FJL, BS, HA and TS. All co-authors contributed to improvement when writing the article.
The authors declare that they have no conflict of interest.
This article is part of the special issue “Layered phenomena in the mesopause region (ACP/AMT inter-journal SI)”. It is a result of the LPMR workshop 2017 (LPMR-2017), Kühlungsborn, Germany, 18–22 September 2017.
The work was partially supported by the Swedish Government Agency for
Innovation Systems (Vinnova), contract no. 2016-04094. This work was
supported by the German Space Agency (DLR) under grant 50OE1402 (project
PMWE). The authors thank Hans-Jürgen Heckl and Torsten Köpnick for
building the instrument.
Edited by: Christian
von Savigny
Reviewed by: Martin Friedrich and one anonymous referee
Arnold, F. and Viggiano, A. A.: Combined mass spectrometric composition measurements of positive and negative ions in the lower ionosphere, I – Positive ions, Planet. Space Sci., 30, 1295–1305, https://doi.org/10.1016/0032-0633(82)90103-9, 1982. a
Arnold, F., Viggiano, A. A., and Ferguson, E. E.: Combined mass spectrometric composition measurements of positive and negative ions in the lower ionosphere, II – Negative ions, Planet. Space Sci., 30, 1307–1314, https://doi.org/10.1016/0032-0633(82)90104-0, 1982. a
Asmus, H., Staszak, T., Strelnikov, B., Lübken, F.-J., Friedrich, M., and Rapp, M.: Estimate of size distribution of charged MSPs measured in situ in winter during the WADIS-2 sounding rocket campaign, Ann. Geophys., 35, 979–998, https://doi.org/10.5194/angeo-35-979-2017, 2017. a
Baumann, C., Rapp, M., Kero, A., and Enell, C.-F.: Meteor smoke influences on the D-region charge balance – review of recent in situ measurements and one-dimensional model results, Ann. Geophys., 31, 2049–2062, https://doi.org/10.5194/angeo-31-2049-2013, 2013. a
Belova, E., Smirnova, M., Rietveld, M. T., Isham, B., Kirkwood, S., and Sergienko, T.: First observation of the overshoot effect for polar mesosphere winter echoes during radiowave electron temperature modulation, Geophys. Res. Lett., 35, L03110, https://doi.org/10.1029/2007GL032457, 2008. a, b
Blake, A. J., Carver, J. H., and Haddad, G. N.: Photo-absorption cross sections of molecular oxygen between 1250A and 2350A, J. Quant. Spectosc. Ra., 6, 451–459, https://doi.org/10.1016/0022-4073(66)90010-0, 1966. a
Bodeker, G. and Hassler, B.: Bodeker Scientific Global Vertically Resolved Ozone Database, nCAS British Atmospheric Data Centre, available at: http://catalogue.ceda.ac.uk/uuid/9a2438602c2b534f54d81e54b9d98d75 (last access: 13 September 2018), 2012. a, b
Bucholtz, A.: Rayleigh-scattering calculations for the terrestrial atmosphere, Appl. Opt., 34, 2765–2773, https://doi.org/10.1364/AO.34.002765, 1995. a
Ceplecha, Z., Borovička, J., Elford, W. G., Revelle, D. O., Hawkes, R. L., Porubčan, V., and Šimek, M.: Meteor Phenomena and Bodies, Space Sci. Rev., 84, 327–471, https://doi.org/10.1023/A:1005069928850, 1998. a
Chen, C. and Scales, W. A.: Electron temperature enhancement effects on plasma irregularities associated with charged dust in the Earth's mesosphere, J. Geophys. Res., 110, A12313, https://doi.org/10.1029/2005JA011341, 2005. a
Cziczo, D. J., Thomson, D. S., and Murphy, D. M.: Ablation, Flux, and Atmospheric Implications of Meteors Inferred from Stratospheric Aerosol, Science, 291, 1772–1775, https://doi.org/10.1126/science.1057737, 2008. a
Djurišić, A. B. and Li., E. H.: Optical properties of graphite, J. Appl. Phys., 85, 7404, https://doi.org/10.1063/1.369370, 1999. a
Duft, D., Nachbar, M., Eritt, M., and Leisner, T.: A Linear Trap for Studying the Interaction of Nanoparticles with Supersaturated Vapors, Aerosol Sci. Tech., 49, 683–691, https://doi.org/10.1080/02786826.2015.1063583, 2015. a
Einstein, A.: Über einen die Erzeugung und Verwandlung des Lichtes betreffenden heuristischen Gesichtspunkt, Ann. Phys.-Berlin, 17, 132–148, 1905. a
Ernst, S., Skruszewicz, S., Strelnikov, B., and Rapp, M.: Absolute Calibration of Vacuum Ultraviolet Xenon Flash Lamps used for Photoionization of Meteor Smoke Particles, in: Publication Proceedings of the 20th Symposium on European Rocket and Balloon Programmes and Related Research, vol. ESA SP-700, Hyere, France, 2011. a
Fentzke, J., Janches, D., Strelnikova, I., and Rapp, M.: Meteoric smoke particle properties derived using dual-beam Arecibo UHF observations of D-region spectra during different seasons, J. Atmos. Solar-Terr. Phys., 71, 1982–1991, https://doi.org/10.1016/j.jastp.2009.09.002, 2009. a
Feuerbacher, B. and Fitton, B.: Experimental Investigation of Photoemission from Satellite Surface Materials, J. Appl. Phys., 43, 1563, https://doi.org/10.1063/1.1661362, 1972. a, b, c, d, e, f, g
Gabrielli, P., Barbante, C., Plane, J. M. C., Varga, A., Hong, S., Cozzi, G., Gasparia, V., Planchon, F. A. M., Cairns, W., Ferrari, C., Crutzen, P., Ceson, P., and Boutron, C. F.: Meteoric smoke fallout over the holocene epoch revealed by iridium and platinum in Greenland ice, Nature, 432, 1011–1014, 2004. a, b
Giebeler, J., Lübken, F.-J., and Nägele, M.: CONE – a new sensor for in-situ observations of neutral and plasma density fluctuations, ESA SP, Montreux, Switzerland, ESA-SP-355, 311–318, 1993. a
Hagemann, H.-J., Gudat, W., and Kunz, C.: Optical constants from the far infrared to the x-ray region: Mg, Al, Cu, Ag, Au, Bi, C, and Al2O3, J. Opt. Soc. Am., 65, 742–744, https://doi.org/10.1364/JOSA.65.000742, 1975. a
Havnes, O. and Kassa, M.: On the sizes and observable effects of dust particles in polar mesospheric winter echoes, J. Geophys. Res.-Atmos., 114, D09209, https://doi.org/10.1029/2008JD011276, 2009. a, b
Havnes, O., Trøim, J., Blix, T., Mortensen, W., Næsheim, L. I., Thrane, E., and Tønnesen, T.: First detection of charged dust particles in the Earth's mesosphere, J. Geophys. Res., 101, 10839–10848, https://doi.org/10.1029/96JA00003, 1996. a
Havnes, O., La Hoz, C., Rietveld, M. T., Kassa, M., Baroni, G., and Biebricher, A.: Dust charging and density conditions deduced from observations of PMWE modulated by artificial electron heating, J. Geophys. Res.-Atmos., 116, D24203, https://doi.org/10.1029/2011JD016411, 2011. a, b
Hedin, J., Gumbel, J., and Rapp, M.: The aerodynamics of smoke particle sampling, in: 17th ESA Symposium on European Rocket and Balloon Programmes and Related Research, edited by: Warmbein, B., vol. 590 of ESA Special Publication, 145–150, 2005. a
Hedin, J., Gumbel, J., and Rapp, M.: On the efficiency of rocket-borne particle detection in the mesosphere, Atmos. Chem. Phys., 7, 3701–3711, https://doi.org/10.5194/acp-7-3701-2007, 2007. a
Hinteregger, H. E. and Watanabe, K.: Photoelectric Cells for the Vacuum Ultraviolet, J. Opt. Soc. Am., 43, 604–608, https://doi.org/10.1364/JOSA.43.000604, 1952. a, b
Horányi, M., Gumbel, J., Witt, G., and Robertson, S.: Simulation of rocket-borne particle measurements in the mesosphere, Geophys. Res. Lett., 26, 1537–1540, https://doi.org/10.1029/1999GL900298, 1999. a
Huffman, R. E.: Handbook of Geophysics and the Space Environment, Air Force Geophysics Laboratory, 1985. a, b, c
Hughes, D. W.: Meteors, in: Cosmic Dust, edited by: McDonnel, J. A. M., Wiley, Chichester, 1978. a
Hunten, D. M., Turco, R. P., and Toon, O. B.: Smoke and Dust Particles of Meteoric Origin in the Mesosphere and Stratosphere, J. Atmos. Sci., 37, 1342–1357, https://doi.org/10.1175/1520-0469(1980)037<1342:SADPOM>2.0.CO;2, 1980. a, b
Kalashnikova, O., Horányi, M., Thomas, G. E., and Toon, O. B.: Meteoric smoke production in the atmosphere, Geophys. Res. Lett., 27, 3293–3296, https://doi.org/10.1029/1999GL011338, 2000. a
Kavanagh, A. J., Honary, F., Rietveld, M. T., and Senior, A.: First observations of the artificial modulation of polar mesospheric winter echoes, Geophys. Res. Lett., 33, L19801, https://doi.org/10.1029/2006GL027565, 2006. a
Kero, A., Enell, C.-F., Kavanagh, A. J., Vierinen, J., Virtanen, I., and Turunen, E.: Could negative ion production explain the polar mesosphere winter echo (PMWE) modulation in active HF heating experiments?, Geophys. Res. Lett., 35, L23102, https://doi.org/10.1029/2008GL035798, 2008. a, b
La Hoz, C. and Havnes, O.: Artificial modification of polar mesospheric winter echoes with an RF heater: Do charged dust particles play an active role?, J. Geophys. Res.-Atmos., 113, D19205, https://doi.org/10.1029/2008JD010460, 2008. a, b
Love, S. G. and Brownlee, D. E.: Heating and thermal transformation of micrometeoroids entering the earth's atmosphere, Icarus, 89, 26–43, https://doi.org/10.1016/0019-1035(91)90085-8, 1991. a
Love, S. G. and Brownlee, D. E.: A direct measurement of the terrestrial mass accretion rate of cosmic dust, Science, 262, 550–553, https://doi.org/10.1126/science.262.5133.550, 1993. a
Mahmoudian, A., Mohebalhojeh, A. R., Farahani, M. M., Scales, W. A., and Kosch, M.: Remote sensing of mesospheric dust layers using active modulation of PMWE by high-power radio waves, J. Geophys. Res., 122, 843–856, https://doi.org/10.1002/2016JA023388, 2017. a
Mathews, J. D., Janches, D., Meisel, D. D., and Zhou, Q.-H.: The micrometeoroid mass flux into the upper atmosphere: Arecibo results and a comparison with prior estimates, Geophys. Res. Lett., 28, 1929, https://doi.org/10.1029/2000GL012621, 2001. a
McNeil, W. J., Lai, S. T., and Murad, E.: Differential ablation of cosmic dust and implications for the relative abundances of atmospheric metals, J. Geophys. Res., 103, 10899–10911, https://doi.org/10.1029/98JD00282, 1998. a
McPeak, K. M., Jayanti, S. V., Kress, S. J. P., Meyer, S., Iotti, S., Rossinelli, A., and Norris, D. J.: Plasmonic films can easily be better: Rules and recipes, ACS Photonics, 2, 326–333, https://doi.org/10.1021/ph5004237, 2015. a
Megner, L., Rapp, M., and Gumbel, J.: Distribution of meteoric smoke – sensitivity to microphysical properties and atmospheric conditions, Atmos. Chem. Phys., 6, 4415–4426, https://doi.org/10.5194/acp-6-4415-2006, 2006. a
Molina, L. T. and Molina, M. J.: Absolute Absorption Cross Sections of Ozone in the 185- to 350-nm Wavelength Range, J. Geophys. Res., 14501–14508, 1986. a
Ogawa, M.: Absorption Coefficients of O2 at the Lyman-Alpha Line and Its Vicinity, J. Geophys. Res., 73, 6759–6763, https://doi.org/10.1029/JA073i021p06759, 1968. a
Picone, J., Hedin, A., Drob, D., and Aikin., A.: NRLMSISE-00 empirical model of the atmosphere: statistical comparisons and scientific issues., J. Geophys. Res., 107, 1468, https://doi.org/10.1029/2002JA009430, 2002. a
Plane, J. M. C.: A time-resolved model of the mesospheric Na layer: constraints on the meteor input function, Atmos. Chem. Phys., 4, 627–638, https://doi.org/10.5194/acp-4-627-2004, 2004. a, b
Plane, J. M. C.: Cosmic dust in the earth's atmosphere, Chem. Soc. Rev., 41, 6507–6518, https://doi.org/10.1039/C2CS35132C, 2012. a
Plane, J. M. C., Saunders, R. W., Hedin, J., Stegman, J., Khaplanov, M., Gumbel, J., Lynch, K. A., Bracikowski, P. J., Gelinas, L. J., Friedrich, M., Blindheim, S., Gausa, M., and Williams, B. P.: A combined rocket-borne and ground-based study of the sodium layer and charged dust in the upper mesosphere, J. Atmos. Sol.-Terr. Phys., 118, 151–160, https://doi.org/10.1016/j.jastp.2013.11.008, 2014. a
Rapp, M. and Strelnikova, I.: Measurements of meteor smoke particles during the ECOMA-2006 campaign: 1. Particle detection by active photoionization, J. Atmos. Sol.-Terr. Phys., 71, 477–485, https://doi.org/10.1016/j.jastp.2008.06.002, 2009. a
Rapp, M. and Thomas, G. E.: Modeling the microphysics of mesospheric ice particles: Assessment of current capabilities and basic sensitivities, J. Atmos. Sol.-Terr. Phys., 68, 715–744, 2006. a
Rapp, M., Strelnikova, I., Strelnikov, B., Hoffmann, P., Friedrich, M., Gumbel, J., Megner, L., Hoppe, U.-P., Robertson, S., Knappmiller, S., Wolff, M., and Marsh, D. R.: Rocket-borne in situ measurements of meteor smoke: Charging properties and implications for seasonal variation, J. Geophys. Res.-Atmos., 115, D00I16, https://doi.org/10.1029/2009JD012725, 2010. a
Rapp, M., Plane, J. M. C., Strelnikov, B., Stober, G., Ernst, S., Hedin, J., Friedrich, M., and Hoppe, U.-P.: In situ observations of meteor smoke particles (MSP) during the Geminids 2010: constraints on MSP size, work function and composition, Ann. Geophys., 30, 1661–1673, https://doi.org/10.5194/angeo-30-1661-2012, 2012. a
Robertson, S., Dickson, S., Horányi, M., Sternovsky, Z., Friedrich, M., Janches, D., Megner, L., and Williams, B.: Detection of meteoric smoke particles in the mesosphere by a rocket-borne mass spectrometer, J. Atmos. Sol.-Terr. Phys., 118, 161–179, https://doi.org/10.1016/j.jastp.2013.07.007, 2014. a, b, c, d, e, f, g, h, i
Rosinski, J. and Snow, R. H.: Secondary Particulate Matter from Meteor Vapors., J. Atmos. Sci., 18, 736–745, 1961. a
Rottman, G., Woods, T., and George, V.: The Solar Radiation and Climate Experiment (SORCE), Springer, New York, NY, 2005. a
Schulte, P. and Arnold, F.: Detection of upper atmospheric negatively charged microclusters by a rocket-borne mass spectrometer, Geophys. Res. Lett., 19, 2297–2300, https://doi.org/10.1029/92GL02631, 1992. a
Staszak, T., Asmus, H., Strelnikov, B., Lübken, F.-J., and Giono, G.: A new rocket-borne Meteor Smoke Particle (MSPD) for D-region ionosphere, in: 23rd ESA Symposium on European Rocket and Balloon Programmes and Related Research, ESA Special Publication, 2017. a
Strelnikov, B., Rapp, M., and Lübken, F.-J.: In-situ density measurements in the mesosphere/lower thermosphere region with the TOTAL and CONE instruments, in An Introduction to Space Instrumentation, Terra Publishers, https://doi.org/10.1029/JD095iD05p05533, 2013. a
Strelnikova, I., Rapp, M., Raizada, S., and Sulzer, M.: Meteor smoke particle properties derived from Arecibo incoherent scatter radar observations, Geophys. Res. Lett., 34, L15815, https://doi.org/10.1029/2007GL030635, 2007. a
Strelnikova, I., Rapp, M., Strelnikov, B., Baumgarten, G., Brattli, A., Svenes, K., Hoppe, U.-P., Friedrich, M., Gumbel, J., and Williams, B. P.: Measurements of meteor smoke particles during the ECOMA-2006 campaign: 2. Results, J. Atmos. Sol.-Terr. Phys., 71, 486–496, https://doi.org/10.1016/j.jastp.2008.07.011, 2009. a
Vondrak, T., Plane, J. M. C., Broadley, S., and Janches, D.: A chemical model of meteoric ablation, Atmos. Chem. Phys., 8, 7015–7031, https://doi.org/10.5194/acp-8-7015-2008, 2008. a
Wasson, J. T. and Kyte, F. T.: Comment on the letter 'On the influx of small comets into the earth's atmosphere, II – Interpretation, Geophys. Res. Lett., 14, 779–780, 1987. a
Werner, W. S. M., Glantschnig, K., and Ambrosch-Draxl, C.: Optical constants and inelastic electron-scattering data for 17 elemental metals, J. Phys. Chem. Ref. Data, 38, 1013, https://doi.org/10.1063/1.3243762, 2009. a, b