the Creative Commons Attribution 4.0 License.
the Creative Commons Attribution 4.0 License.
 | 19 Oct 2018
Development and field testing of an online instrument for measuring the real-time oxidative potential of ambient particulate matter based on dithiothreitol assay
Joseph V. Puthussery
Chen Zhang
Vishal Verma
We developed an online instrument for measuring the oxidative potential (OP) of ambient particulate matter (PM) using the dithiothreitol (DTT) assay. The instrument uses a mist chamber (MC) to continuously collect the ambient PM2.5 in water, and then determines its DTT activity using an automated syringe pump system. The instrument was deployed at an urban site in the University of Illinois campus, and its field performance was evaluated by comparing the results with the offline DTT activity measurements of simultaneously collected PM-laden filters. The online DTT activity measurements correlated well with the offline measurements but were higher than both methanol (slope =1.08, R2=0.93) and Milli-Q water (slope =1.86, R2=0.86) extracts of the PM filters, indicating a better efficiency of the MC for collecting the water-insoluble fraction of PM. The hourly measurements of ambient PM2.5 OP were obtained by running the online instrument intermittently for 50 days with minimal manual assistance. The daytime DTT activity levels were generally higher than at night. However, a 4-fold increase in the hourly averaged activity was observed on the night of 4 July (Independence Day fireworks display). The diurnal profile of the hourly averaged OP during weekdays showed a bimodal trend, with a sharp peak in the morning (around 07:00 LT), followed by a broader afternoon peak which plateaus around 14:00 LT and starts subsiding at night (around 19:00 LT).
To investigate the association of the diurnal profile of DTT activity with the emission sources at the site, we collected time-segregated composite PM filter samples in four different time periods of the day (morning, 07:00–10:00 LT; afternoon, 10:00–15:00 LT; evening, 15:00–19:00 LT; and night, 19:00–07:00 LT) and determined the diurnal variations in the redox active components (i.e., water-soluble Cu, Fe, Mn, organic carbon, elemental carbon, and water-soluble organic carbon). Based on this comparison, we attributed the daytime OP of ambient PM2.5 to the vehicular (both exhaust and non-exhaust) emissions and resuspended dust, whereas secondary photochemical transformation of primary emissions appear to enhance the OP of PM during the afternoon and evening period.
- Article
(1059 KB) -
Supplement
(283 KB) - BibTeX
- EndNote


Several recent studies have used the oxidative potential (OP) of ambient particulate matter (PM) as an indicator of the aerosol toxicity (Li et al., 2003; Knaapen et al., 2004; Steenhof et al., 2011; Bates et al., 2015; Tuet et al., 2016; Yang et al., 2016). The underlying hypothesis in these studies is that ambient particles upon inhalation can catalyze the generation of reactive oxygen species (ROS), creating a biochemical imbalance between oxidants and antioxidants which leads to a state of the cellular oxidative stress (Knaapen et al., 2004). This inherent property of the ambient PM to induce oxidative stress is supposed to be more closely associated with the PM-related adverse health effects (such as congestive heart failure, myocardial infarction, asthma etc.) than conventionally used PM mass concentrations (Bates et al., 2015; Maikawa et al., 2016; Weichenthal et al., 2016; Yang et al., 2016; Abrams et al., 2017).
To quantify the OP associated with ambient PM, researchers have used both cell-based and cell-free assays. Cell-based assays generally involve the use of fluorescent probes (such as 2′,7′-dichlorodihydrofluorescein diacetate, DCFH-DA) for measuring the PM-induced intracellular ROS in alveolar macrophages or other cell lines (Landreman et al., 2008; Saffari et al., 2014; Tuet et al., 2016). These assays are laborious, complex, and require long analysis times (Dungchai et al., 2013). Cell-free assays, on the other hand, are easier to perform and provide a faster estimation of OP (Fang et al., 2015). The dithiothreitol (DTT) assay is one of the most widely used cell-free assays to measure the ambient particles' OP, which has shown good correlation with several biological markers of PM-induced adverse health effects (Steenhof et al., 2011; Delfino et al., 2013; Bates et al., 2015; Tuet et al., 2016; Yang et al., 2016; Abrams et al., 2017). In the DTT assay, PM catalyzes the transfer of electrons from DTT to oxygen, generating superoxide radicals. The consumption of DTT over time, which is reported as the DTT activity or OP of the ambient PM, is assumed to be proportional to the concentration of redox active compounds in the PM sample (Kumagai et al., 2002; Cho et al., 2005).
Previous studies have suggested that OP of the ambient particles is affected by various factors such as PM composition, size, and source (Li et al., 2003; Steenhof et al., 2011; Janssen et al., 2014; Tuet et al., 2016; Fang et al., 2017a). Moreover, few studies have also indicated that the ambient particles' OP changes during the course of the day due to the influence of atmospheric processing and aging (Verma et al., 2009; Saffari et al., 2014). The conventional approach for measuring the DTT activity of ambient PM involves long-duration sampling (typically 24–72 h) using filters and extracting them in a suitable medium (e.g., water or methanol) (Verma et al., 2012; Fang et al., 2015). The laborious and time-consuming protocol of these methods limit their applications to only few samples, and thus make it almost impossible to fully capture the diurnal variations in the ambient particles' OP. Another issue in measuring OP of the ambient particles collected over filters is related with the chemical stability of the PM samples. Generally, PM collected over filters might undergo chemical alteration during sampling, storage, and extraction procedures, such as loss of semivolatile organic (Daher et al., 2011) and inorganic (Yao et al., 2001; Pathak et al., 2004) compounds and change in the oxidation state of metals, e.g., Mn (Majestic et al., 2007). Some of these components are known to directly contribute to OP (e.g., semivolatile organic compounds, Verma et al., 2009; Mn, Charrier and Anastasio, 2012), while others (e.g., inorganic ions) can affect it indirectly by altering the solubility of redox-active metals (Fang et al., 2017b). Therefore, OP measured on the archived filters might not be truly representative of the real potential of ambient particles to generate ROS in a biological system after inhalation. For reducing some of these artifacts, certain researchers (e.g., Cho et al., 2005; Daher et al., 2011) used a liquid impinger (Biosampler, SKC-West Inc.) to collect the concentrated slurry of ambient aerosols and measured its OP using the DTT assay. The direct collection of particles into liquid helps to minimize the PM loss during sampling and extraction processes. However, this method is not fully automated; i.e., frequent manual observation is needed to maintain the optimum conditions for an upstream aerosol concentrator (Kim et al., 2001). Moreover, it requires a relatively long sampling duration, i.e., at least 6 h, to collect enough volume of the concentrated slurry, making this approach unsuitable for obtaining highly time-resolved OP data for the ambient particles.
Over the past decade, various online instruments have also been developed for measuring the ROS associated with ambient PM (Venkatachari and Hopke, 2008; Wang et al., 2011; Sameenoi et al., 2012; King and Weber, 2013; Wragg et al., 2016; Eiguren-Fernandez et al., 2017; Zhou et al., 2018). These instruments couple a direct aerosol into a water collection device, e.g., particle-into-liquid sampler (PILS), liquid spot sampler (LSS), or mist chamber (MC) to an analytical system. However, most of these instruments measure the particle-bound ROS, which represents only a small part of the particles' OP. To the best of our knowledge, only two online systems have been developed until now which measure the OP based on DTT assay: Sameenoi et al. (2012) and Eiguren-Fernandez et al. (2017). Sameenoi et al. (2012) used a PILS coupled directly to a microfluidic electrochemical sensor for measuring the DTT activity of ambient particles. The online system performance was tested in the lab using standard reference dust and fly ash aerosolized samples. The measured DTT activity was reported to have a linear correlation with the aerosol concentration. Eiguren-Fernandez et al. (2017) used an LSS for particle collection, followed by its DTT activity determination in a traditional protocol (i.e., light absorbance spectroscopy). However, a major shortcoming in these two studies was the lack or limited days of field measurements. The online system based on microfluidic electrochemical sensor (Sameenoi et al., 2012) was characterized only in the lab using simulated aerosol samples and has never been tested in the ambient environment (at least not reported in any publication). Meanwhile, the system developed by Eiguren-Fernandez et al. (2017) was tested in the field for only 3 days (with 3 h time resolution), and the long-term stability of the system is yet to be evaluated.
Here, we discuss the development of an automated online instrument to measure the hourly averaged OP of ambient PM2.5 using DTT assay and its evaluation in the field conditions for over 50 days. A custom-built glass MC was used for collecting the ambient PM suspension, which is then transferred to an automated analytical system for DTT activity determination. Our study reports, for the first time, the complete diurnal profile of the DTT activity of ambient PM2.5 at an hourly resolution, obtained from 50 days of field deployment of the instrument. The diurnal variations in DTT activity were further compared with the diurnal variations in PM2.5 chemical composition. The results presented in our study demonstrate the usefulness of obtaining highly time-resolved data on PM2.5 OP to comprehend various emission sources and their relative importance in assessing the risk from PM2.5 exposure over the course of the day.
2.1 Instrument set-up
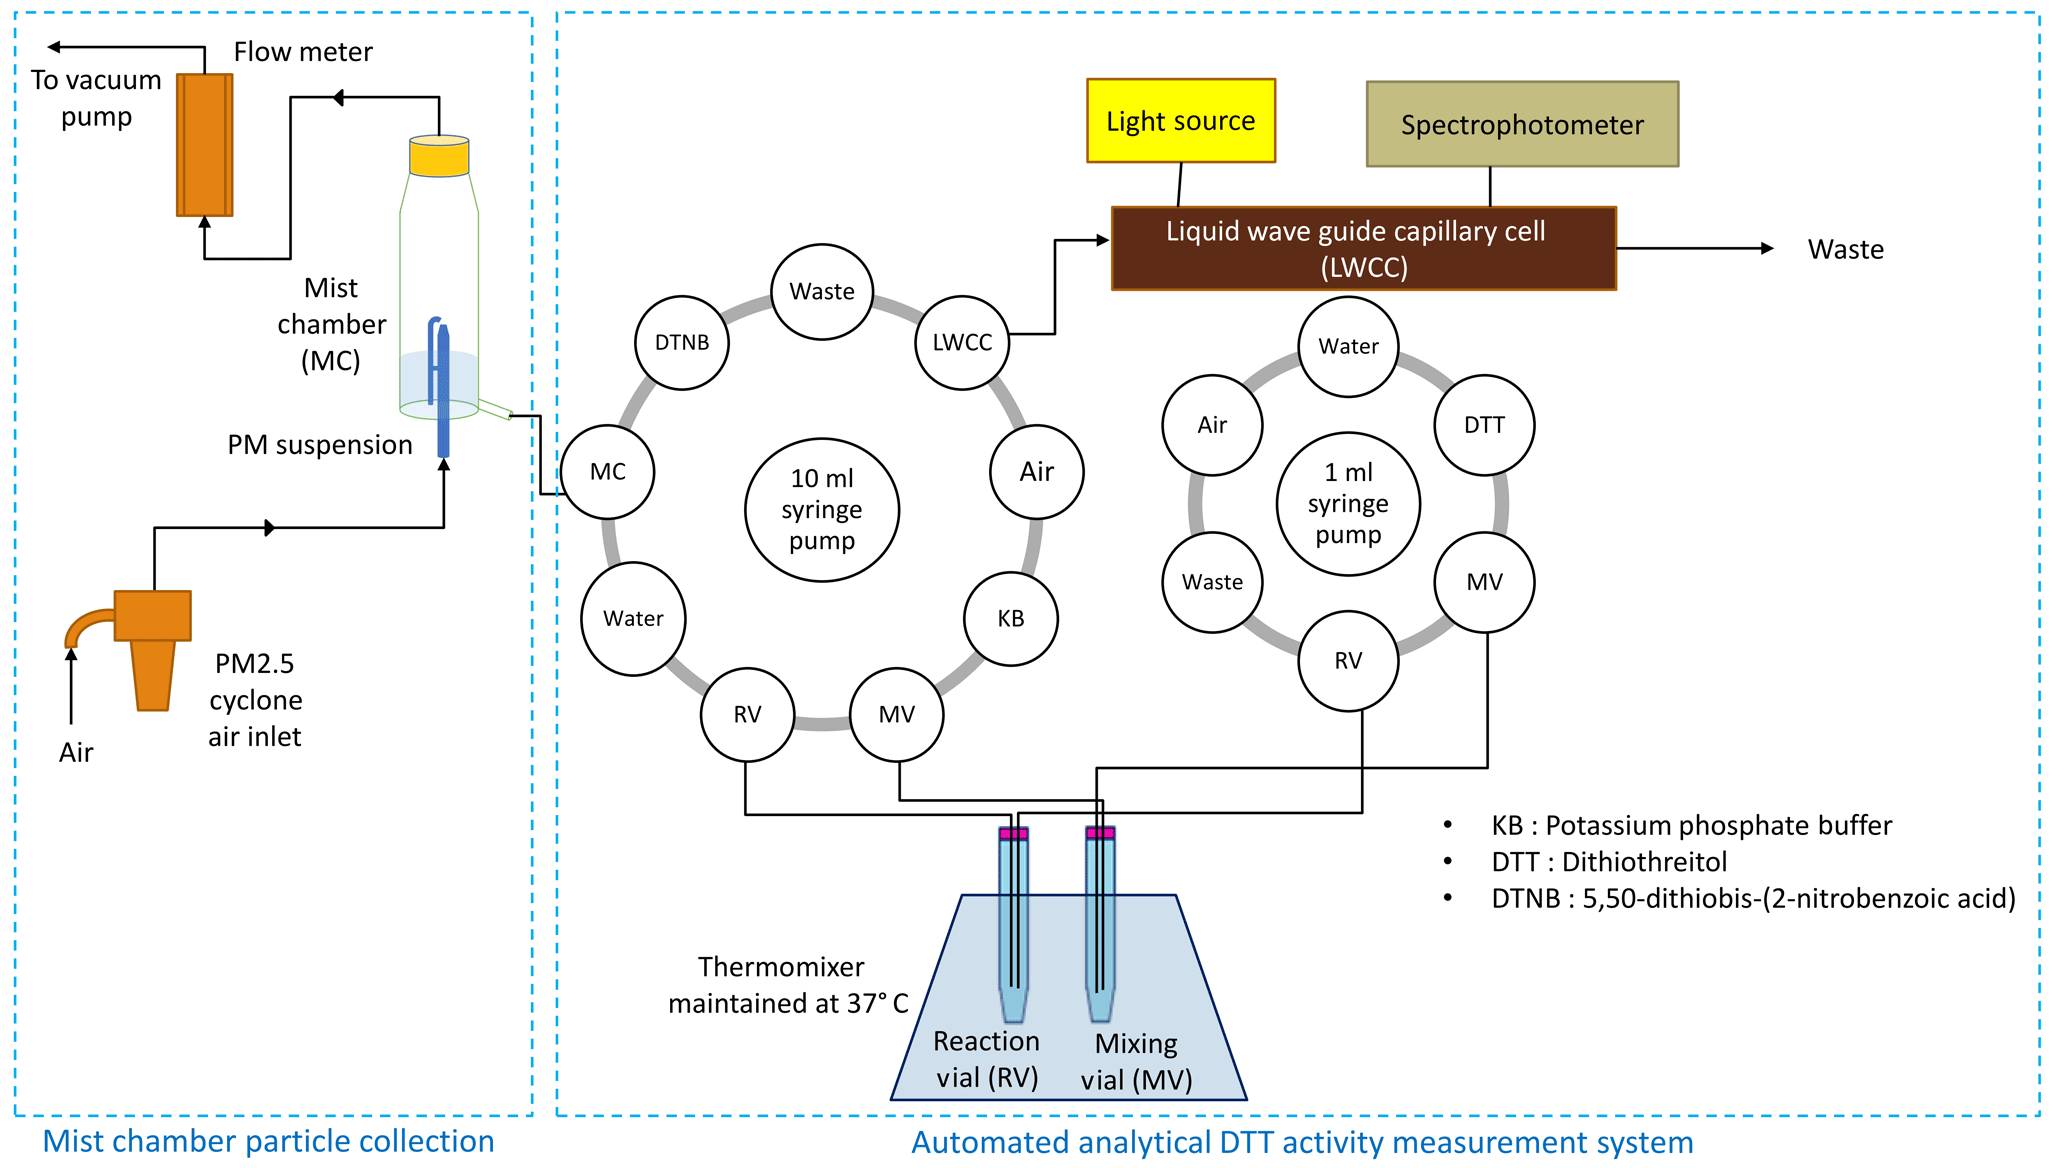
The basic layout of the instrument setup for measuring the PM2.5 OP is shown in Fig. 1. The entire system is housed in a 1.83 m × 1.22 m × 0.61 m insulated aluminum chamber built by the Civil and Environmental Engineering Machine Shop of the University of Illinois at Urbana-Champaign (UIUC). The temperature inside the chamber is maintained at 18 ∘C using a portable air conditioner (Black and Decker BPACT14HWT). An MC was used for collecting the ambient PM2.5 suspension in water. MCs were originally designed for collecting the water-soluble gases with Henry's constant (KH)>103 M atm−1 (Cofer et al., 1985; Spaulding et al., 2002; Hennigan et al., 2009); however, few studies (Anderson et al., 2008; King and Weber, 2013) have also used these devices for collecting the water-soluble fraction of the ambient particles. Hennigan et al. (2009) estimated the collection efficiency of the MC as ∼95 % using nitric acid aerosols at a flow rate of 21 L min−1. King and Weber (2013) also calculated the collection efficiency of the MC by operating it simultaneously with a PILS and measuring the sulfate collected by both systems. The collection efficiency in the MC was close to 100 % at flow rates greater than 25 L min−1. The MC used in this study was custom built in the glassblowing shop at UIUC and operated at a flow rate of 42 L min−1. Exact dimensions of the MC are given in Fig. S1 (Supplement). A 0.5 in. (OD) copper tube was used to connect the inlet port of the MC to a PM2.5 cyclone (University Research Glassware (URG), Carrboro, NC, USA). The working principle for particle collection in MC is explained in previous studies (Anderson et al., 2008; King and Weber, 2013). In brief, a predetermined volume of Milli-Q water is added, such that the water level remains above the bottom tip of the capillary tube inside the MC. As air flows through the tapered inlet, air pressure drops at the capillary nozzle tip, which causes the water in the bottom reservoir to rise through the capillary tube and create a fine mist inside the chamber. This mist impinges on a 47 mm TefSep polytetrafluoroethylene (PTFE) membrane hydrophobic filter (1 µm pore size) (GVS Life Sciences, ME, USA) loaded in a filter pack (URG, Carrboro, NC, USA), attached at the top of the MC. The mist continuously washes the particles as they are collected onto the filter, with some additional direct scrubbing from the airstream. The airflow exiting the hydrophobic filter was continuously measured by an inline flow meter (10–100 SLPM; Dwyer Instruments, MI, USA). The airflow rate eventually starts decreasing with an increasing PM loading on the filter, i.e., gradual accumulation of some water-insoluble PM, which is not recovered in the MC suspension. Typically, the flow rate was found to decrease by approximately 10 % after 16 h of continuous operation of the MC in our case. Therefore, the filter was changed twice in a day (at 07:00 and 19:00 LT) to ensure a near-constant flow rate of 42 L min−1 (±2.5 %). The online system couples the MC to an automated DTT activity determination system, consisting of two automated syringe pumps and a continuously shaken thermomixer (Fang et al., 2015; discussed in Sect. 2.2) as shown in Fig. 1.
2.2 Instrument operation and procedures
At the start of each sampling run, a fixed amount of Milli-Q water (which was varied depending on time of the day, discussed in Sect. 3.2) was added to the MC using a programmable 10 mL syringe pump (Versa Pump 6, V6; Kloehn Inc., Las Vegas, NV, USA). The PM suspension (∼1.75 mL) at the end of the sampling run (1 h) was withdrawn from MC and fed to the reaction vial (RV) of the automated analytical system for DTT activity measurement using the same syringe pump. The DTT activity measurement system is based on the same protocol as described in Xiong et al. (2017) using two syringe pumps (V6 and Versa Pump 3, V3; Kloehn Inc., Las Vegas, NV, USA), but slightly modified to handle the small volume of the PM suspensions. The RV was placed in a thermomixer (550 rpm; Eppendorf North America, Inc., Hauppauge, NY, USA) maintained at a constant temperature of 37 ∘C and continuously shaken. DTT (0.25 mL, 1 mM, final concentration in the reaction vial: 100 µM, > 99 % purity; Sigma-Aldrich, St. Louis, MO, USA) and potassium phosphate buffer (0.5 mL, pH 7.4, 0.5 µM, > 99 % purity; Sigma-Aldrich, St. Louis, MO, USA) were then added to the RV, using the V3 and V6 syringe pump, respectively. To determine the DTT consumption rate, 50 µL aliquot from the RV was withdrawn by a V3 pump at fixed time points (3, 13, 23, 33, and 43 min) and mixed immediately with 0.5 mL of -dithiobis(2-nitrobenzoic acid) (DTNB, 0.2 mM, > 98 % purity; Sigma-Aldrich, St. Louis, MO, USA), which was added by the V6 pump in the measurement vial (MV). The residual DTT in the aliquot reacts with DTNB to form 2-nitro-5-thiobenzoic acid (TNB). TNB absorbs light sharply at a wavelength of 412 nm, and therefore, the absorbance was measured by pushing the mixture (using the V6 pump) through a liquid waveguide capillary cell (LWCC-M-3100; World Precision Instruments, Inc., FL, USA) with an optical path length of 100 cm. The LWCC was coupled to an online spectrophotometer (Ocean Optics, Inc., Dunedin, FL, USA), which includes both an ultraviolet–visible (UV–vis) light source (DH-Mini) and a multiwavelength light detector (Flame-S). The absorbance intensity at 600 nm was chosen as a reference (where there was no absorption from the reaction mixture) to correct for the temporal drift in the absorbance spectrum. The absorbance at both wavelengths (412 and 600 nm) were continuously recorded and saved as a .CSV file using a data acquisition software (Spectra Suite, Ocean Optics, USA). Since the absorbance is proportional to the quantity of DTT left in the RV, the slope of the absorbance versus time (five time points) gives the DTT consumption rate of the sample. This DTT consumption rate was normalized by the volume of sampled air and reported in the units of nmol min−1 m−3, referred hereafter as extrinsic DTT activity or OPex. The analytical part of the instrument along with the MC was cleaned twice in a month by first replacing all the chemicals with methanol, followed by Milli-Q water, and then running the automated system script for a routine DTT assay protocol (five times with each solvent).
2.3 Field deployment of the instrument
The online instrument was deployed on the roof (height from the ground level ∼25 m) of a parking deck (north campus parking) located adjacent to a four-lane street (University Avenue) in the university campus and operated intermittently for approximately 50 days (between 31 May and 16 August 2017). While the analytical part of the instrument measured the DTT activity of a given PM suspension, the MC simultaneously collected a new PM suspension. Thus, hourly measurements of ambient PM2.5 OPex were obtained with minimal manual assistance, i.e., only for replacing the filters (twice in a day), resetting the computer program script (once in a day), and refilling the DTT solution (once in a day) and other reagents as needed (typically after 4–5 days).
2.4 Instrument blanks
Two different types of instrument blanks were analyzed in this study: system blanks and method blanks. The system blank was determined by filling Milli-Q water in the MC but without collecting any air sample; i.e., the vacuum pump remained switched off. The water remained in MC for a few (2–3) minutes after which its DTT activity was measured by the analytical system. The method blank (particle free) was determined by connecting a high efficiency particulate air (HEPA) filter upstream of the MC and running it for 1 h. Thus, measured DTT activity in the method blank would be due to a possible contribution from water-soluble gases. System blanks were collected everyday (i.e., one blank per day), while method blanks were collected four times in a week during field deployment of the instrument (discussed in Sect. 3.2). Thus, a total of 50 system blanks and 28 method blanks were collected throughout the sampling period.
2.5 Instrument performance
The instrument performance was assessed by calibrating the analytical part (DTT activity determination) of the instrument using positive controls (both before field deployment and during operation), determining the limit of detection (LOD; from the blanks data), and comparing the online versus offline results (see Sect. 2.6). All the results pertaining to the instrument performance are discussed in the results sections (Sect. 3.1, 3.3, and 3.4).
2.6 Online versus offline system comparison
The DTT activity measurements from the online system were compared with a conventional filter sampling and extraction method followed by offline DTT activity analysis of the extracts. Ambient filters (N=36), each for a duration corresponding to the MC sampling (i.e., 60 min), were collected for offline analysis from the same site (the roof of north campus parking) on different days (see Table S1 in the Supplement), while the online instrument was also running continuously. The 47 mm TefSep hydrophobic filters (same as those used in the filter pack of the MC) were used for collecting PM2.5, at a flow rate of 42 L min−1. After each sampling run, the filters were brought back to the lab and immediately stored in a freezer (−20 ∘C). All the filters were extracted and analyzed within 12 h of sampling. Limited mass loadings on these filters did not allow us to extract each filter in both water and methanol. Therefore, 20 filters were extracted in Milli-Q water (1.75 mL volume per filter), while the remaining 16 filters were extracted in methanol by sonication (Cole-Parmer Ultrasonic Cleaner 8891, IL, USA) for 30 min. The methanol extracts were evaporated (to < 100 µL) by blowing high-purity nitrogen into the vial. The concentrated extracts were then reconstituted by adding Milli-Q water (final volume: 1.75 mL). The samples were immediately analyzed for DTT activity by a semiautomated system developed in our lab (Xiong et al., 2017). Field blank filters (N=6) were similarly collected, processed (i.e., three filters extracted in Milli-Q water and three in methanol), and analyzed for the DTT activity.
2.7 Time-segregated composite sampling and chemical analysis
To infer the associations between the diurnal trend in the ambient PM2.5 DTT activity and PM2.5 chemical composition, time-segregated composite PM2.5 samples were collected for 10 weekdays in August 2017 (the exact dates are provided in the Supplement; Table S1). The composite samples were collected onto both prebaked 8 in. × 10 in. quartz filters (Tissuquartz 2500QAT-UP, Pall Life Sciences, Port Washington, NY; referred as QS thereafter) and 8 in. × 10 in. Teflon filters (Zefluor PTFE membrane filters, Pall Laboratory, NY; referred as TS thereafter) using two high volume samplers (HiVol, Tisch Environmental; nominal flow rate: 1.13 m3 min−1, PM2.5 impactor) at the same site. These composite samples were collected in four different time periods of the day: morning (07:00–10:00 LT), afternoon (10:00 –15:00 LT), evening (15:00–19:00 LT), and night (19:00 –07:00 LT); i.e., the filters were changed four times in a day, but the same set of filters were used for all 10 days. Thus, a total of eight samples were collected: QS1 and TS1 (morning; total hours of sampling: 30 h), QS2 and TS2 (afternoon; total hours of sampling: 50 h), QS3 and TS3 (evening; total hours of sampling: 40 h), and QS4 and TS4 (night; total hours of sampling: 120 h). All samples were stored in a freezer at −20 ∘C between sampling intervals. The total PM2.5 mass loading on the filters was determined by weighing (both pre- and post-sampling) the filters using a lab scale digital balance (±0.2 mg readability; A120S, Sartorius, Göttingen, Germany). Prior to weighing, the filters were equilibrated for 24 h at 20 ∘C and 50 % relative humidity (RH).
The concentrations of elemental carbon (EC) and organic carbon (OC) were measured on a small section (1 cm2) of the quartz filters as per National Institute for Occupational Safety and Health (NIOSH) protocol, using a thermal–optical transmittance (TOT) analyzer (Sunset Laboratory) (Birch and Cary, 1996). For the rest of the chemical analysis, Teflon filter punches (25 mm diameter) were extracted into Milli-Q water by sonication (30 min). The water-soluble organic carbon (WSOC) concentration in these extracts was measured using a total organic carbon analyzer (TOC-VCPH, Shimadzu Co., Japan) (Wang et al., 2018). The concentrations of water-soluble Cu, Fe, and Mn in the extracts were determined by inductively coupled plasma mass spectrometry (ICP-MS) (Perkin Elmer, Waltham, MA) (Yu et al., 2018).
3.1 Calibration of the analytical system for DTT activity measurement
Before field deployment, the analytical measurement part of the online DTT instrument was calibrated by measuring DTT activity of 9,10-phenanthraquinone (PQN, Sigma-Aldrich, St. Louis, MO, USA; > 99 % purity). Here, the sampling part of the instrument, i.e., MC, was replaced with a 14-port multiposition valve (VICI® Valco Instrument Co. Inc., USA) to consecutively select different PQN standard solutions of known concentrations for analysis. The linear plot of the DTT consumption rate (nmol min−1) versus PQN concentration had a slope of 7.55±0.54, with a coefficient of determination (R2) of 0.98 (Fig. S2). The slope of calibration is very close to the slope obtained earlier by Fang et al. (2015) using a similar automated DTT system. During the field operation, the analytical part of the instrument was calibrated at least once in 15 days by following the same procedure, i.e., replacing the MC with the multiposition valve.
3.2 Effect of evaporation in MC on DTT activity of ambient PM
During air sampling, the volume of water inside the MC decreases due to evaporative loss. There are two concerns associated with this loss of water. First, if the water level drops below the capillary, the mist formation is stopped, and the filter will collect particles by dry sampling (i.e., without mist formation). We found that the rate of evaporation is largely governed by the ambient relative humidity (RH), which changes diurnally. Note that the strong dependence of the evaporative loss in MC on RH as seen in our study was not observed in previous studies (Hennigan et al., 2009, 2018; King and Weber, 2013). This is probably due to the significantly higher flow rate (42 L min−1) and longer sampling duration (60 min) adopted in our study as compared to previous studies (flow rate: 21–28 L min−1; sampling duration ∼5 min). Therefore, the evaporative losses were minimal in those studies (Hennigan et al., 2009, 2018; King and Weber, 2013) but cannot be ignored in our case. To address this concern, the Kloehn control program script was modified to adjust the amount of water added to the MC at the beginning of each sampling run based on the forecasted hourly RH at the site (AccuWeather, 2018). Typically, the RH was highest (78±6 %) during night and early morning, and lowest (50±8 %) in the afternoon period. Table S2 shows the volume of water added to the MC for various ranges of RH observed at the sampling location. Adjusting this amount of water ensured at least 55 min of wet sampling (i.e., sampling PM with simultaneous mist formation) for each collected PM suspension, with the rest as the dry sampling. Note that a fraction of the particles collected during dry sampling is extracted in the next run of wet sampling, which could lead to a small bias in the PM mass carried over to RV from the actual PM mass corresponding to a sampling run. However, this bias is not expected to be significant given a very low duration of dry sampling (< 5 min) out of the total 60 min of sampling.
The second concern associated with the evaporation of water is the variable volume of the PM suspensions collected after different sampling runs depending on the ambient RH, i.e., larger volume at high RH, while smaller volume at low RH. Note that evaporation can still continue (although substantially slower than during mist formation) after the water level drops below the capillary level. Based on the design of the MC used in this study, final volume of the PM suspension remaining inside the reservoir after the water level drops just below the capillary should be 1.75 mL. However, the volume of PM suspensions obtained from MC during the field sampling was found to vary from 1.5 to 2 mL (i.e., within ±15 % of the theoretically designed volume of 1.75 mL; as observed from numerous trials in extreme RH conditions). We suspected that a variation in the sample volume could potentially affect the DTT activity measurements in the RV. To quantify this effect, we conducted a laboratory study where we measured the DTT activity of a PM extract in different reaction volumes, but which all contained the same amount of PM mass. Six circular punches (4.9 cm2 each) from a PM2.5-laden HiVol quartz filter (24 h sample collected from the same site) were extracted in 35 mL of Milli-Q water by sonication for 30 min. The extract was filtered by passing through a 0.45 µm PTFE syringe filter (Fisherbrand™, Fisher Scientific, PA, USA). A total of 0.875 mL aliquot of this filtered extract was added in 12 different sample vials, which ensured the same PM2.5 mass in each vial. To the reference sample vial, 0.875 mL Milli-Q water was added to make the total sample volume 1.75 mL (equivalent to the theoretically designed volume of the PM suspension obtained from MC after 1 h of sampling). To the remaining sample vials, different amounts of Milli-Q water (0, 0.175, 0.35, 0.525, 0.7, 1.05, 1.225, 1.4, 1.575, and 1.75 mL) were added to obtain variable sample volumes (0.875, 1.05, 1.225, 1.4, 1.575, 1.925, 2.1, 2.275, 2.45, and 2.625 mL). This experiment simulated the changes in the volume of PM suspensions obtained from MC due to evaporation. The DTT activities of all these samples were then measured (in triplicates) using the semiautomated system in our lab. The same experiment was repeated for three more PM2.5 filters, and all the results are compiled in Fig. S3. As expected, there is an overall inverse trend in the DTT activity versus sample volume; samples containing larger volumes showed lower DTT activity than those containing smaller volumes. However, maximum bias in the activity for a 20 % variation in the sample volume was less than 6 % (average 3±3 %); therefore, this small bias was neglected for the purpose of this study. Note that a larger variation in the sample volume could significantly affect the measurement of DTT activity (e.g., bias > 12 % for a 50 % variation in the sample volume, as shown in Fig. S3). Therefore, an appropriate control, e.g., a Nafion or a diffusion dryer, should be used upstream of MC at locations where the ambient RH can vary substantially and more abruptly to minimize its impact on the variations in sample volume and subsequent bias in the DTT activity measurement.
3.3 Blanks and limit of detection (LOD)
The average (±1σ) system and method blanks obtained by the instrument were 0.32±0.06 and 0.33±0.08 nmol min−1, respectively, and the difference between these two blanks was not statistically significant (p > 0.05; unpaired t test). Therefore, the LOD of the instrument for measuring the PM-induced DTT activity was determined as 0.24 nmol min−1, i.e., 3 times the standard deviation of the method blanks. The insignificant difference between the system and method blanks indicates that the ambient gases (e.g., ozone) have minimal interference in the DTT activity measured by the online instrument. Ozone has very low solubility in water (Henry's law constant M atm−1) (Sander, 2015), which makes it unlikely to get collected in MC. To further confirm the insignificant contribution from ambient gases in the DTT activity, we connected a custom-built activated charcoal denuder (22 in. long and 3 in. diameter tube (with a concentric meshed tube for airflow), filled with 4 mm pellet activated charcoal; EnviroSupply & Service, Irvine, CA), upstream of the MC. The field blanks collected for a day (N=24) with an upstream denuder (i.e., HEPA filter + denuder) were not significantly different (0.33±0.09 nmol min−1) than without the denuder (i.e., only HEPA filter). A possible explanation for the nil contribution from ambient gases in our DTT activity measurement could be their low ambient concentrations and a very low residence time (72 ms) in our MC, leading to their insignificant concentration in the MC suspension.
3.4 Online instrument results versus filter measurements
Figure 2 shows a comparison of the results obtained by the online instrument with the DTT activity measured on the water and methanol extracts of the filters (47 mm), which were simultaneously collected while running the instrument. The online measurements from the instrument have a high coefficient of determination (R2 > 0.80) with the results obtained by offline filter extraction method, both using Milli-Q water and methanol. The slope for the water extraction versus online measurement was 1.86 (R2=0.86; p < 0.001; N=20), while methanol extracts of the PM filters showed a much better agreement with the online system (slope =1.08; R2=0.93; p < 0.001; N=16). This is probably due to a significant contribution from some water-insoluble PM components in MC, which otherwise remain embedded in the filter fibers and are poorly extracted in water by sonication. Recently, Gao et al. (2017) also reported a ratio of the DTT activity measured on the water-soluble extracts of the ambient PM filters collected from Atlanta, USA, to the total OPex (i.e., DTT oxidation performed directly on the filter) as 1.54–1.72. Additionally, the ratio of the DTT activity measured on methanol-soluble extracts of the filters to the total OPex was 1.06–1.1. The higher OPex measured directly on the filters was attributed to the contribution from the water-insoluble PM fraction that remained on the filters, which is not fully extracted even by methanol. The lower DTT activity measured by offline filter extraction method in our study could also be due to the loss of redox-active semivolatile species and other chemical alterations in the collected PM during storage (Yao et al., 2001; Pathak et al., 2004; Daher et al., 2011) and extraction of the filters by sonication (Roper et al., 2015). Collectively, our results, which are very similar to Gao et al. (2017), demonstrate a much better efficiency of the MC for OP measurements as compared to conventional filter sampling and extraction protocols.
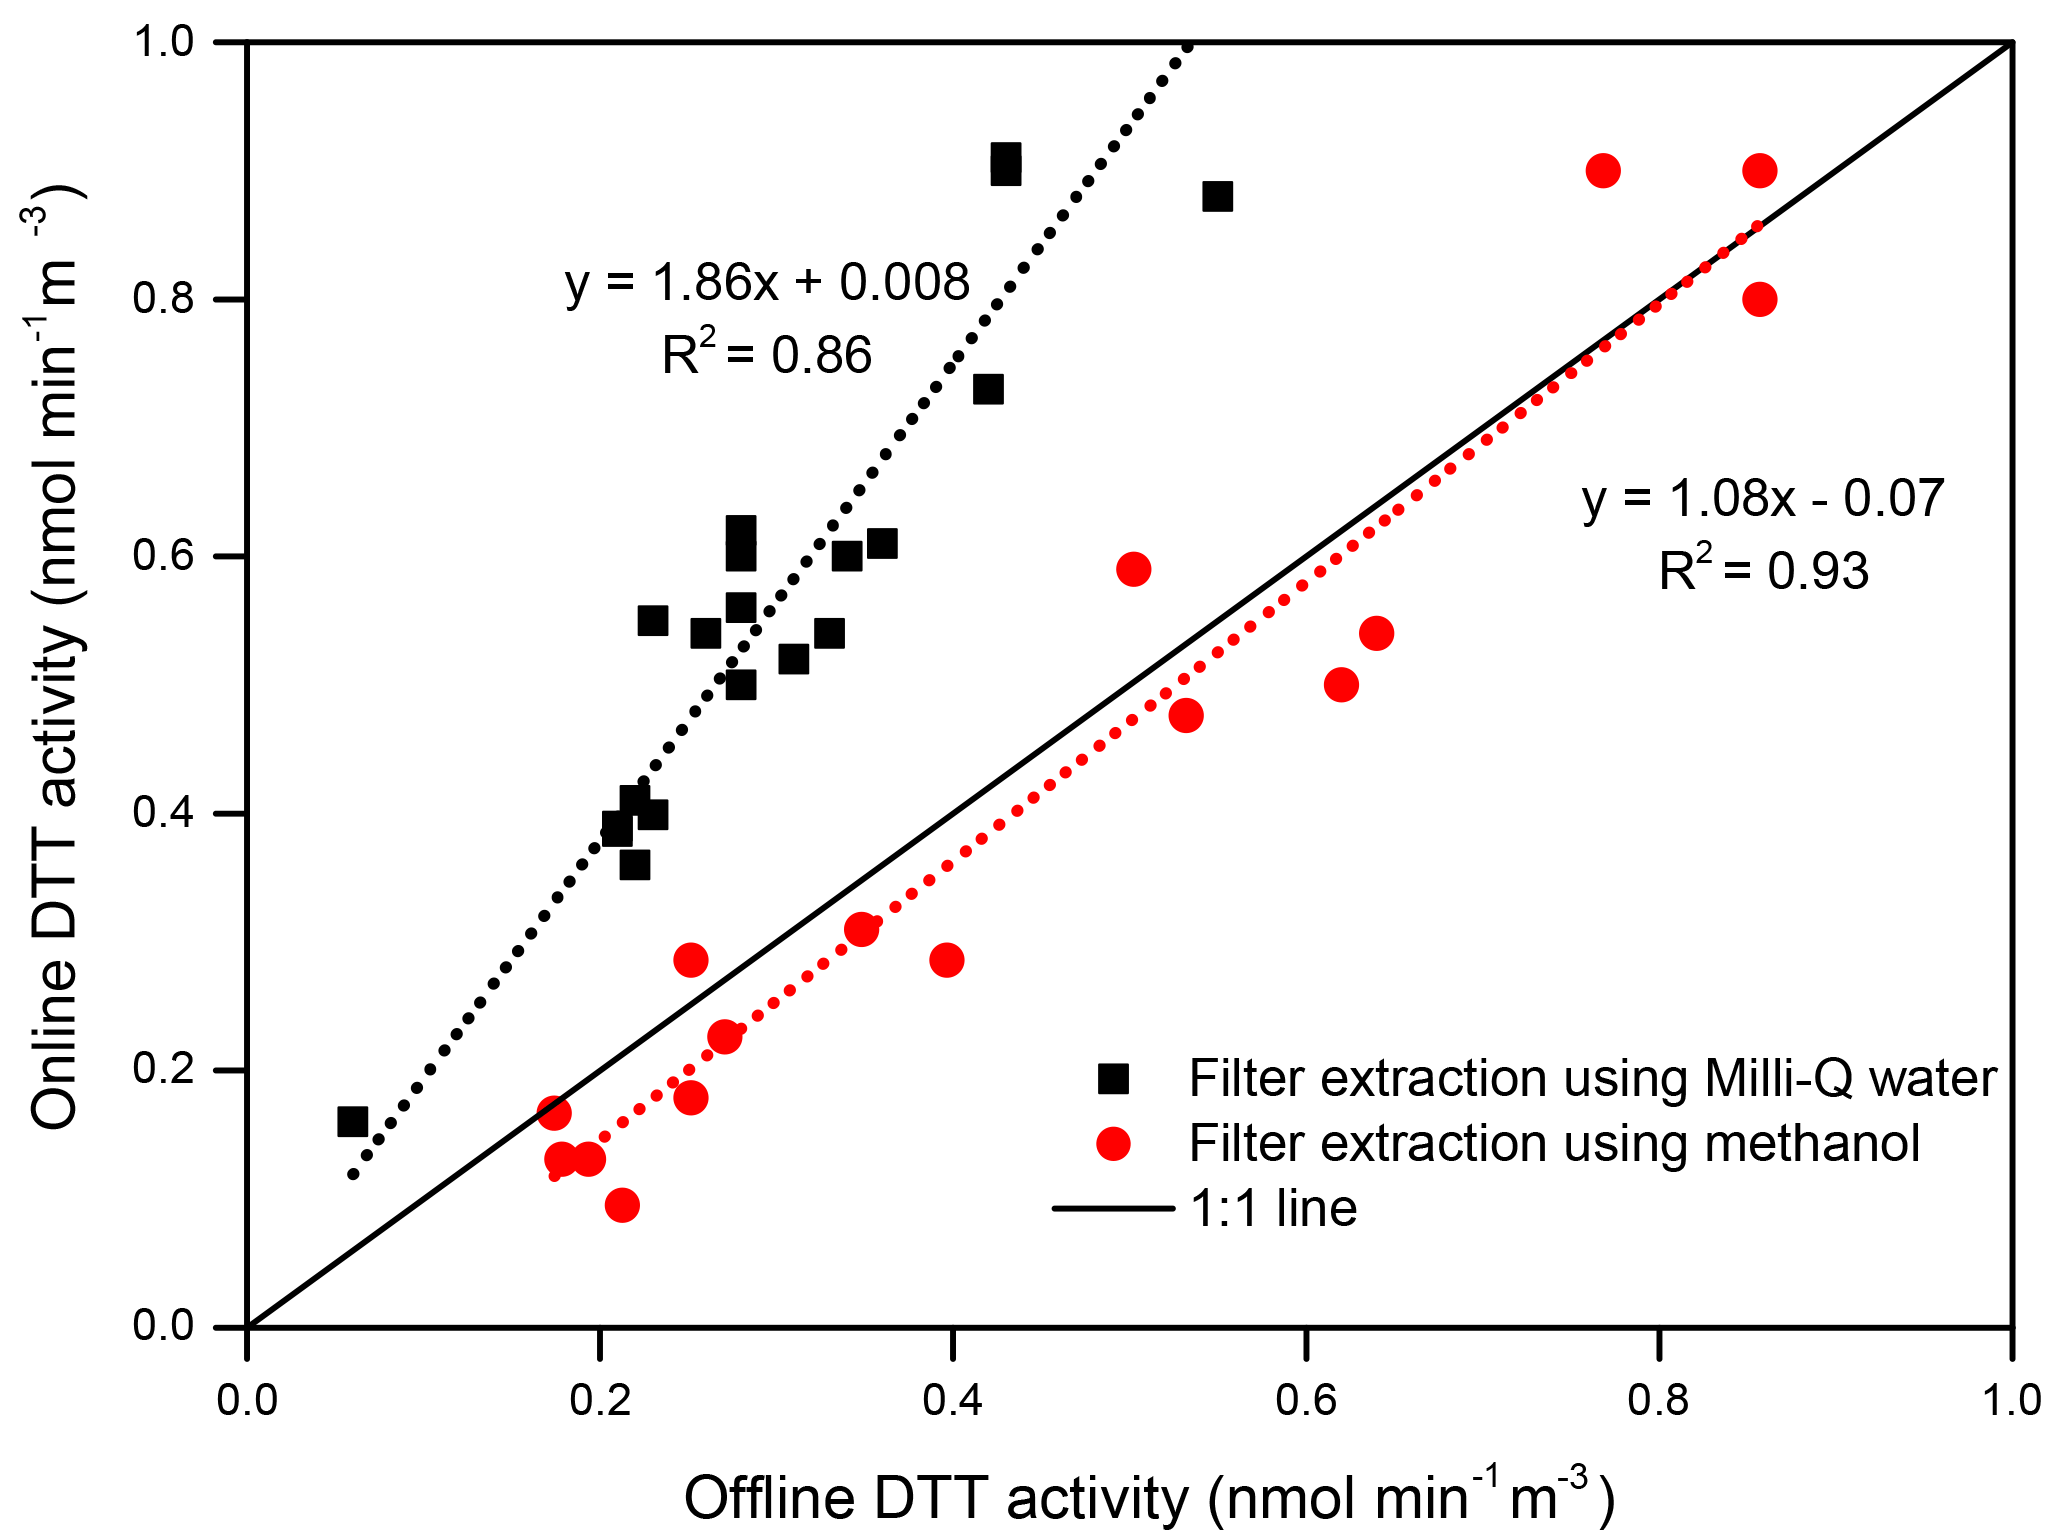
Figure 2Comparison of the DTT activity obtained from the online instrument with the traditional filter collection and extraction methodology (i.e., offline DTT activity analysis of the PM extracts).

Figure 3Time-series plot of the DTT activity from 31 May to 16 August 2017. The shaded portions in the graph are weekend DTT activity measurements. The instrument was not operated between 12 July and 3 August 2017 (shown as a break in the x axis).
3.5 Time series of the ambient PM2.5 DTT activity
Figure 3 shows the time series of the hourly ambient PM2.5 DTT activity (blank corrected) measured by the online instrument between 31 May and 16 August 2017. The instrument was almost continuously operated for collecting the ambient data (except a few days for method or denuder blanks and calibration of the analytical part) between 31 May and 11 July 2017, followed by a break of 22 days (12 July–3 August 2017) before running it again for 13 days in the month of August 2017. The average (±1σ) DTT activity obtained during the entire sampling period was 0.33±0.19 nmol min−1 m−3, which is in typical range of the total OPex as observed in Atlanta (0.2–0.4 nmol of DTT min m−3; Gao et al., 2017) and is higher than the water-soluble OPex measured at the same site (0.04–0.18 nmol of DTT min m−3) in our previous studies (Xiong et al., 2017; Wang et al., 2018; Yu et al., 2018). Around 65 % of the hourly measurements of DTT activity were above the instrument LOD. However, measurements during the weekends were mostly below the LOD. The low activity over the weekends is possibly due to less vehicular traffic, resulting in lower PM2.5 emissions. Additionally, very low DTT activity (or below LOD) was measured on days with exceptionally high RH (> 90 %) and during rain events, probably due to reduced PM2.5 concentrations (Lou et al., 2017). A significant diurnal variation in the DTT activity can also be inferred from the time-series plot, with nighttime measurements generally lower than the daytime levels (except a few peaks, e.g., on 4 and 5 July 2017). A more detailed analysis of the diurnal trend of DTT activity is provided in Sect. 3.6.
The fireworks display during the Independence Day (4 July 2017) celebration in Champaign County had a pronounced effect on the ambient PM2.5 OPex. The DTT activity measured on the night of 4 July and the following 2 days, showed a significantly elevated value (peak value 1.4 nmol min−1 m−3), which was approximately 4 times the average DTT activity obtained during the entire sampling period. This is probably due to an overall increase in the ambient PM2.5 concentration emitted from firecrackers. The PM2.5 concentration measured at a nearby Environmental Protection Agency (EPA) monitoring site (Bondville, located ∼8 miles from the study area) reported an increase of 124 %, 42 %, and 49 % in the average PM2.5 concentration between 4 and 6 July (average of 3 days 14.0±1.2 µg m−3), compared to 2 July (6.27 µg m−3), 3 July (9.9 µg m−3), and 7 July (9.4 µg m−3; assumed control days), respectively. Pervez et al. (2016) reported a 13- and 7-fold increase in the ambient Cu and Mn concentration in the local background PM2.5 after a firework pollution episode in Bhilai, India. Note that Cu and Mn are among the most important metals in PM, which have been reported to be associated with the DTT activity (Charrier and Anastasio, 2012).
3.6 Diurnal profile of the ambient PM2.5 OPex and chemical components
One of the primary motivations for developing the online instrument was to discern the diurnal variations in ambient PM2.5 OPex so that it could be better linked with the chemical components and their emission sources. Therefore, hourly data obtained by running the instrument for 28 days (between 31 May and 2 July 2017) was composited to obtain a diurnal profile of the DTT activity as shown in Fig. 4. The diurnal profiles were separately plotted for the weekdays and weekends in Fig. 4a and b, respectively. The diurnal profile of OPex in weekdays appears to have a trimodal trend with peaks at 07:00–08:00 LT, 12:00–13:00 LT, and 18:00–19:00 LT. The highest peak was observed around 13:00 LT, and the night time nadir was around 03:00 LT. In contrast, the weekend diurnal profile appears to be flat with no clear trend. To test if the identified peaks in the diurnal profile of DTT activity are statistically significant (given the large variation in day-to-day activity), we first performed a single factor ANOVA test (SPSS, V24.0.0.0) on all points of the diurnal plot (N=24). The diurnal profile for the weekends did not yield any statistically significant peak (F=1.51, Fcritical=1.59, p=0.07) for the entire data. However, F value obtained for the weekday diurnal profile data was higher than the critical F value (F=6.38, Fcritical=1.56, p < 0.01) indicating significant differences in certain hourly measurements during weekdays. To further test the statistical significance of the three identified peaks in the diurnal profile for weekdays, we conducted a Student's t test between different pairs of the hourly data. For example, all 07:00 LT measurements were compared with 05:00 and 09:00 LT measurements, 13:00 LT measurements were compared with 09:00 and 16:00 LT measurements, and the 19:00 LT peak was compared with 13:00, 16:00, and 21:00 LT data, individually. The measurements at 07:00 LT were found to be statistically different from 05:00 and 09:00 LT (p < 0.05). Similarly, the measurements at 09:00 and 13:00 LT were also statistically different (p < 0.01). Although, the difference among the 13:00, 16:00, and 19:00 LT data was not statistically different (p=0.16 for t test between 13:00 and 16:00 LT, 0.45 between 16:00 and 19:00 LT, and 0.58 between 13:00 and 19:00 LT), the 19:00 and 21:00 LT measurements were statistically different (p < 0.05). Thus, it was inferred based on these tests that the diurnal OPex trend is actually bimodal with the first peak during the morning period, followed by an afternoon peak which flattens out (i.e., extends from 13:00 to 19:00 LT, but with a slight dip at 16:00 LT), before subsiding at night (around 21:00 LT).
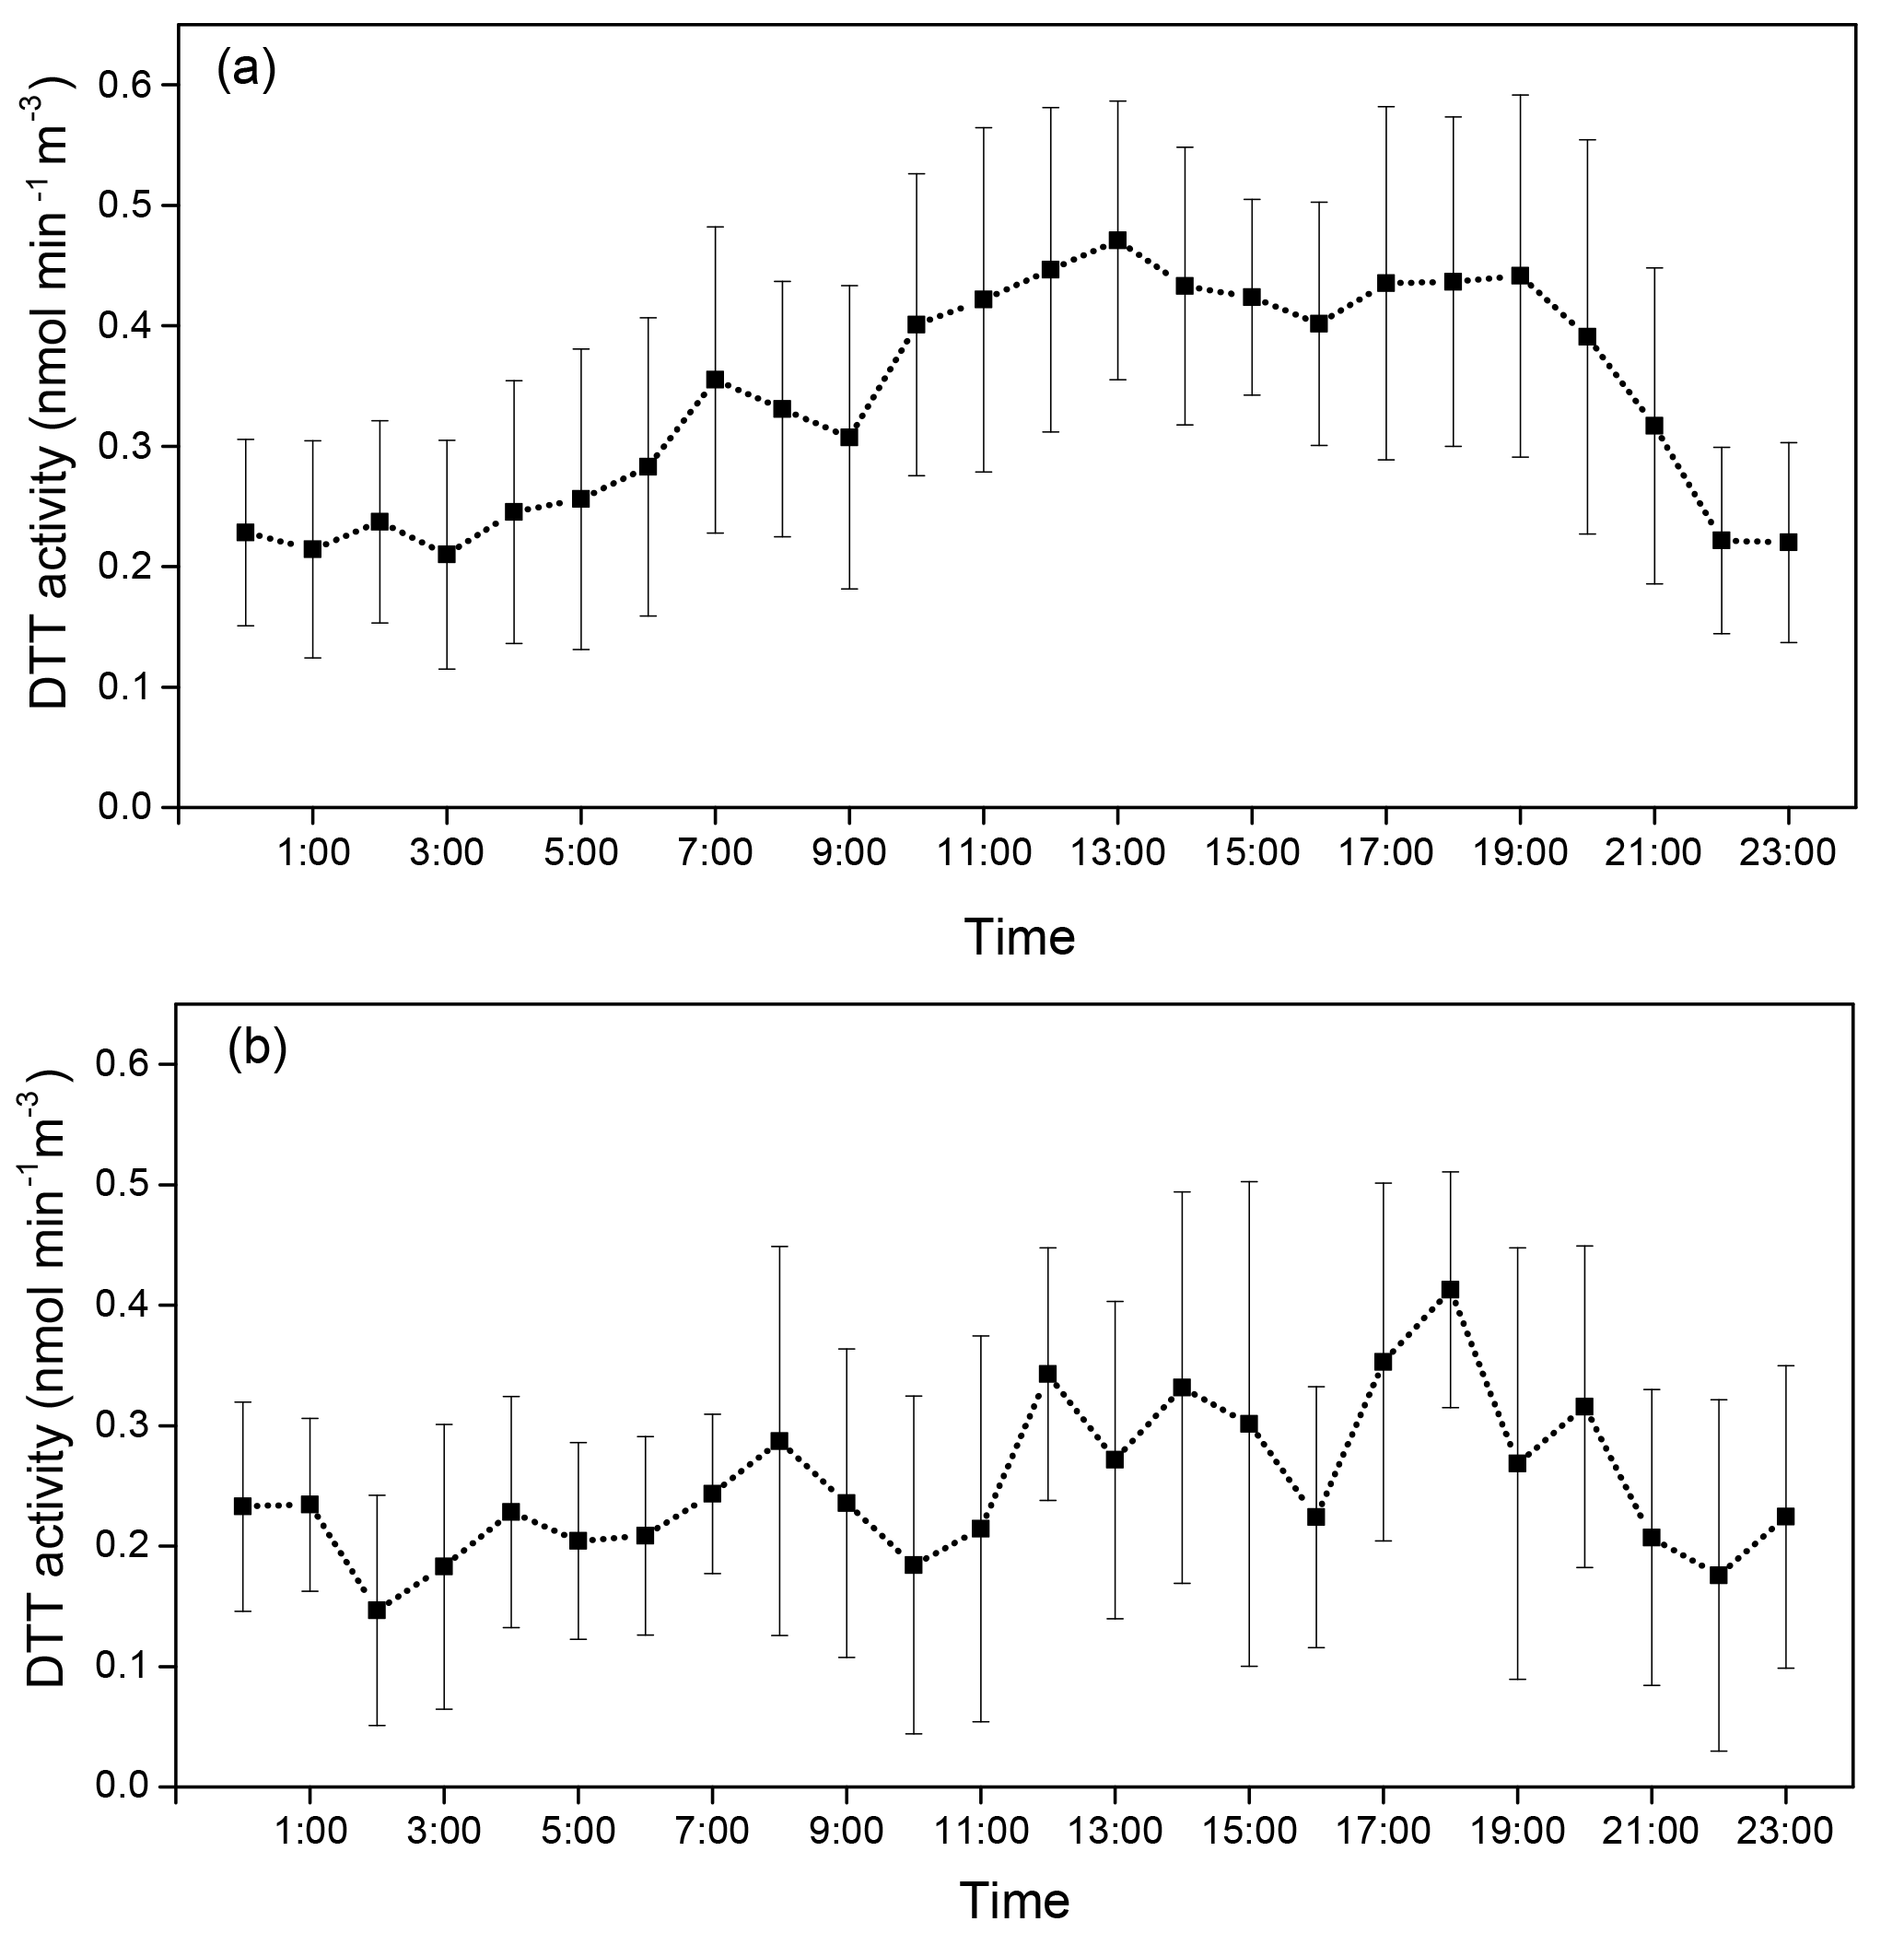
Figure 4Diurnal profile of the ambient PM2.5 DTT activity measured at the sampling site over (a) weekdays (n=18 days) and (b) weekends (n=10 days). The data from 31 May to 2 July 2017 were used for plotting this profile. Error bars are the standard deviation (1σ) of the average DTT activity in that hour.
To further investigate the diurnal profile of the DTT activity and its association with various emission sources at the site, we analyzed the chemical composition of the PM2.5 collected on eight time-segregated composite filters, i.e., QS1–QS4 and TS1–TS4 in August. The schedule of this time-segregated sampling was determined based on the diurnal profile of the DTT activity in weekdays (Fig. 4). Note that the diurnal profile in DTT activity obtained by the instrument during the time-segregated sampling (Fig. S4) had a similar trend as obtained in the month of June (Fig. 4). We measured the concentration of key chemical species, i.e., WSOC, OC, EC, and transition metals (Cu, Mn, and Fe), which have all been shown to be associated with the DTT activity (Charrier and Anastasio, 2012; Saffari et al., 2014; Verma et al., 2014; Yang et al., 2014) in our time-segregated samples, along with the PM mass, to infer their diurnal variations and compare it with that in the DTT activity. The average PM2.5 concentration during the time-segregated sampling was 7.8±0.16, 8.5±0.36, 8.1±0.16, and 7.6±0.29 µg m−3 (not shown) for the morning, afternoon, evening, and night samples, respectively. Given that there are no substantial variations in PM2.5 mass concentrations, the diurnal variations in the DTT activity are hypothesized to be mainly attributed to the varying chemical composition of PM2.5 resulting from different emission sources at the site.
3.6.1 Carbonaceous aerosol
Figure 5 shows PM2.5 carbonaceous content, in terms of the ambient concentrations of EC, OC, and WSOC during time-segregated sampling. EC can be assumed as a marker of the exhaust emissions from diesel vehicles (Shah et al., 2004; Shirmohammadi et al., 2016). EC showed a peak in the morning and also at night. The morning peak coincided with the rush hour traffic and can be attributed to the vehicular emissions. It then subsides in the afternoon and remains constant till evening, before increasing again at night. Based on our personal observation, vehicular traffic is almost negligible after 22:00 LT at this location. Therefore, the EC peak observed at night is probably a result of the decrease in atmospheric mixing height at the site (Liu and Liang, 2010). The lower temperature and higher relative humidity (average values 19 ∘C and 78 % at night (19:00–07:00 LT) compared to 27 ∘C and 48 % in daytime during the time-segregated sampling) might have resulted in limited atmospheric mixing at night. Furthermore, EC has been reported to be distributed uniformly in the vertical direction and is thus greatly influenced by the atmospheric mixing height (Lin et al., 2009; Mues et al., 2017). A similar pattern in EC (i.e., peaks in morning and late evening) has been reported in a few other studies (Mues et al., 2017; Sharma et al., 2017; Singh et al., 2018), where the lower concentrations in daytime were attributed to a higher mixing height and stronger turbulence than at nighttime. Note that our nighttime composite filter was sampled from 19:00 to 07:00 LT, thus probably including part of the EC from evening rush hour traffic which is trapped in the lowered mixing height at night. Overall, the diurnal trend in EC does not follow the trend in DTT activity, which indicates a negligible role of EC in determining the DTT activity at this location. These results contrast with earlier studies showing a high correlation between EC and DTT activity (Verma et al., 2012; Gao et al., 2017). However, it should be noted that EC concentrations measured in this study (0.15–0.24 µg m−3) were much lower than the values reported by other studies conducted at similar urban locations. For instance, Verma et al. (2014) reported a monthly averaged summer EC concentration of 0.75±0.25 µg m−3 in Atlanta, while the concentrations in the range of 0.4–0.52 µg m−3 were reported for the samples collected in Los Angeles during summer 2012 (Shirmohammadi et al., 2016). Therefore, the EC concentration at our sampling location is probably too low to make a significant contribution in the DTT activity. Additionally, fresh EC is less active and needs to be oxidized to participate in the DTT assay as indicated by Antiñolo et al. (2015), which reported an almost exponential increase in the DTT activity of soot particles after exposure to high levels (> 1012 molecule cm−3 h) of ozone. Given the PM2.5 collected at the site, which is adjacent to a roadway, contain mostly fresh and unoxidized EC, it probably leads to a poor association between the diurnal trends in EC and DTT activity in our study.
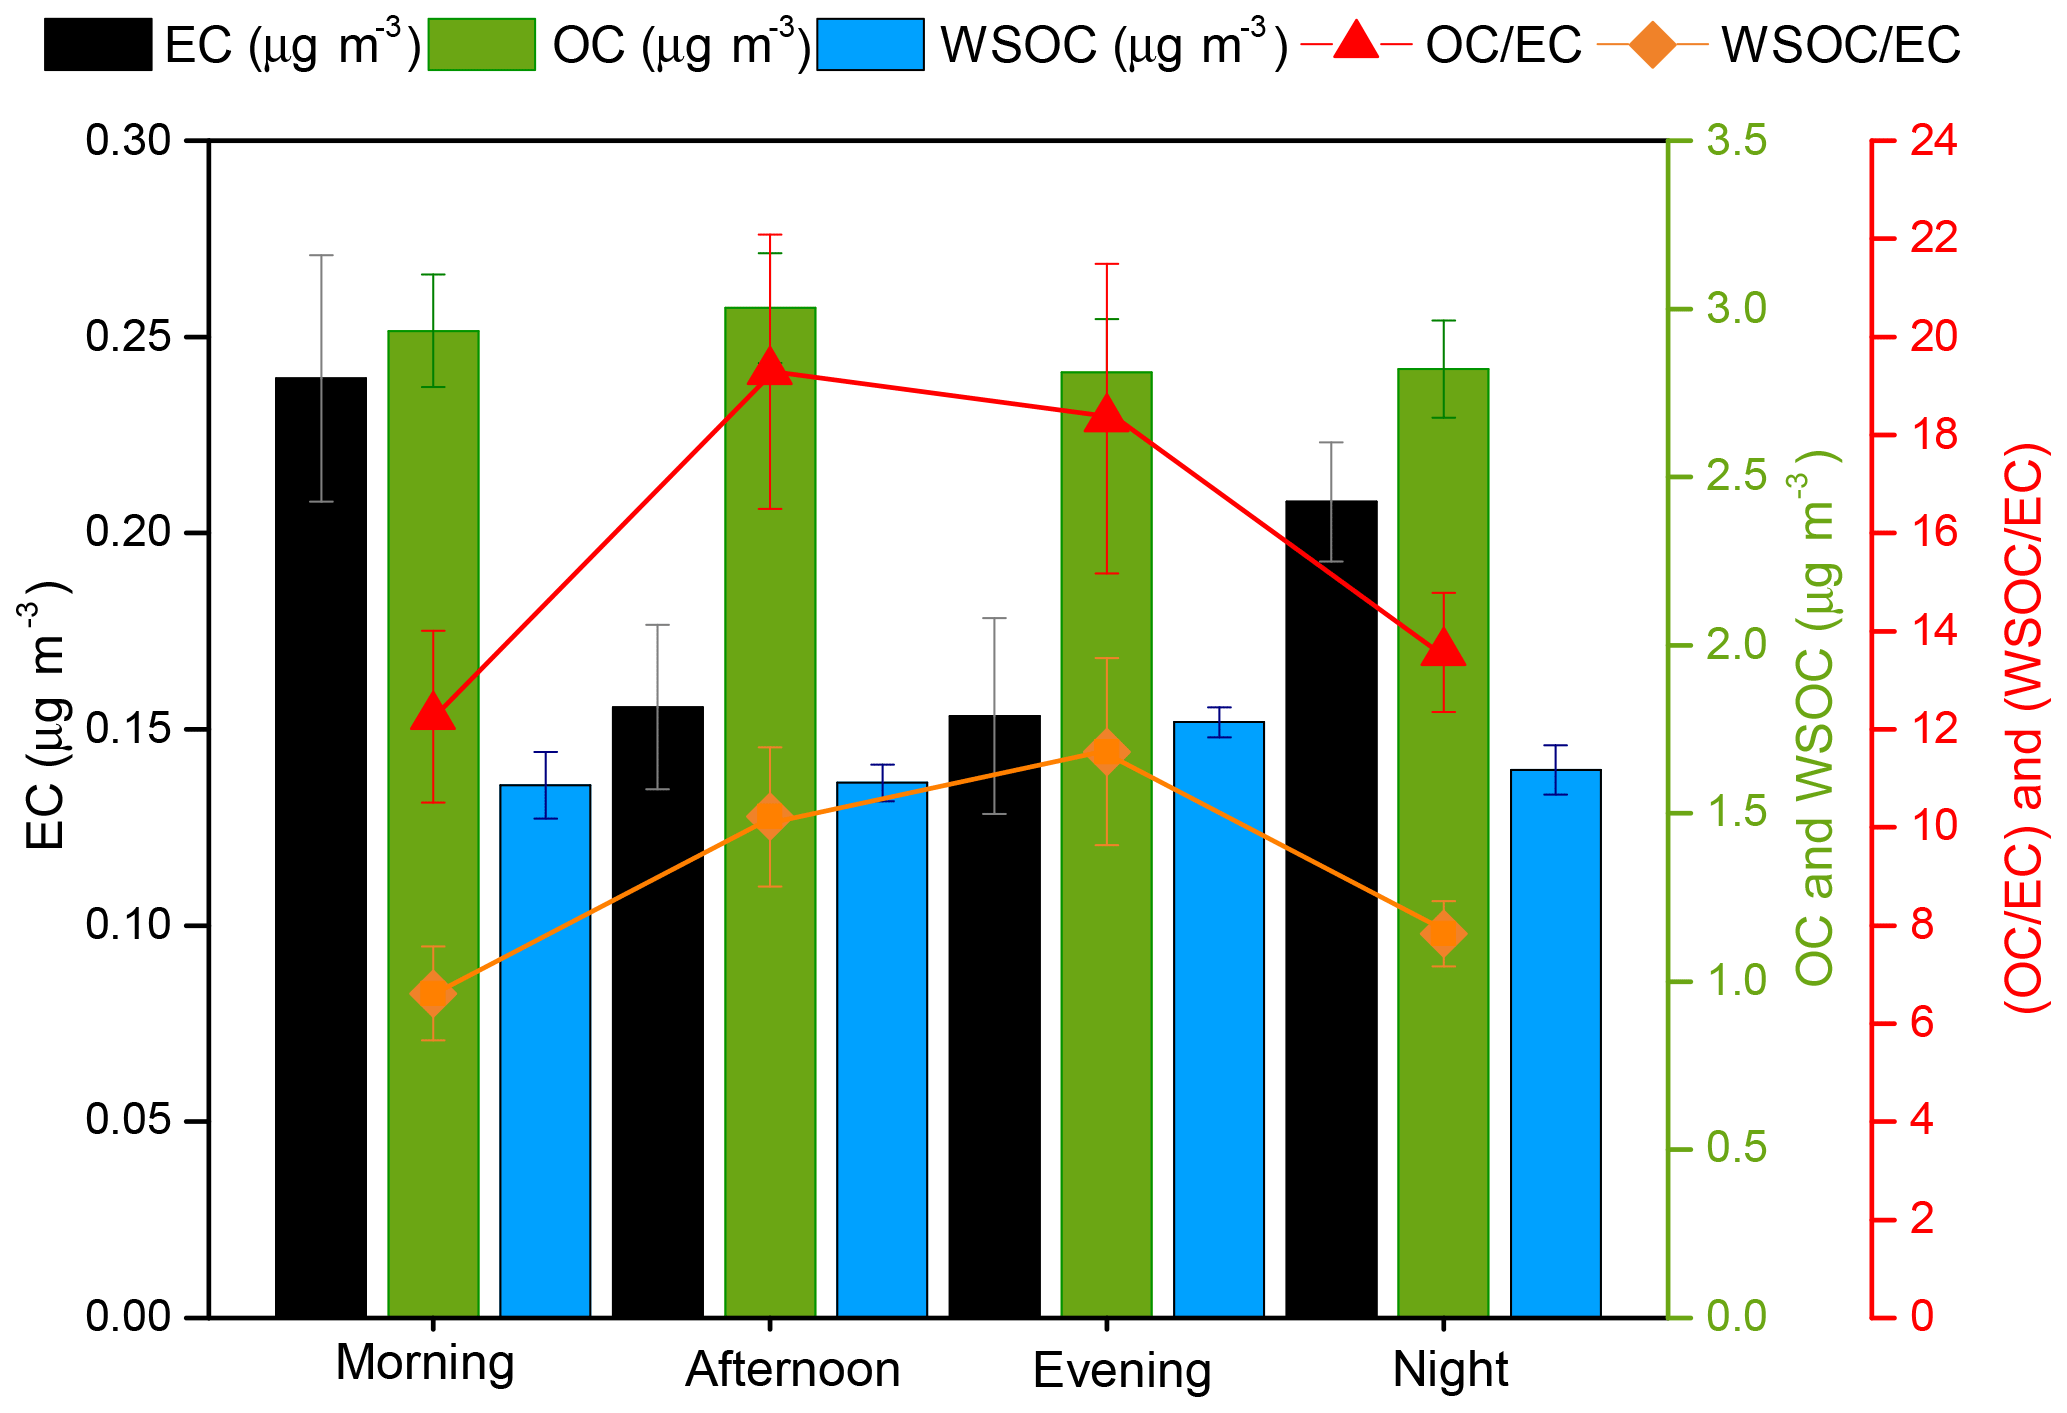
Figure 5Diurnal trend in the ambient concentrations of carbonaceous aerosols, i.e., EC, OC, and WSOC, and the ratio of OC ∕ EC and WSOC ∕ EC, as measured from the time-segregated integrated filters. Error bars denote standard deviation (1σ) of the triplicate measurements.
The secondary organic aerosols (SOAs) formed by photochemical reactions have been reported as one of the major contributor to the ambient PM2.5 OP (Snyder et al., 2009; Verma et al., 2009, 2014; Saffari et al., 2015). WSOC is a substantial component of SOA formed during photochemical reactions (Cheung et al., 2012; Verma et al., 2014). On the other hand, OC is emitted from both primary (e.g., combustion) and secondary (e.g., photochemical formation) sources (Cabada et al., 2004). As depicted in Fig. 5, neither OC nor WSOC show any diurnal pattern. Figure 5 also shows the OC ∕ EC ratio which peaked in the afternoon. Considering a higher mixing height and relatively lower traffic in the afternoon than morning, an elevated OC ∕ EC ratio indicates an additional OC contribution, which compensates its decrease from reduced vehicular emissions and enhanced atmospheric mixing. We attribute this additional OC to the secondary particle formation via photochemical reactions, which keeps the OC concentration almost constant throughout the day. Figure S5 shows a diurnal profile of ozone measured at Bondville (EPA site). The ozone concentration peaked from 11:00 to 18:00 LT, indicating secondary formation of particles in the afternoon period. To further confirm the contribution from SOA to OC, the WSOC ∕ EC ratio was also plotted (Fig. 5), which ranged from 6.6 (morning) to 11.3 (evening) and followed a similar diurnal profile as ozone or the OC ∕ EC ratio. Thus, the broad peak in DTT activity during afternoon and evening periods could partly be caused by the redox-active SOA components.
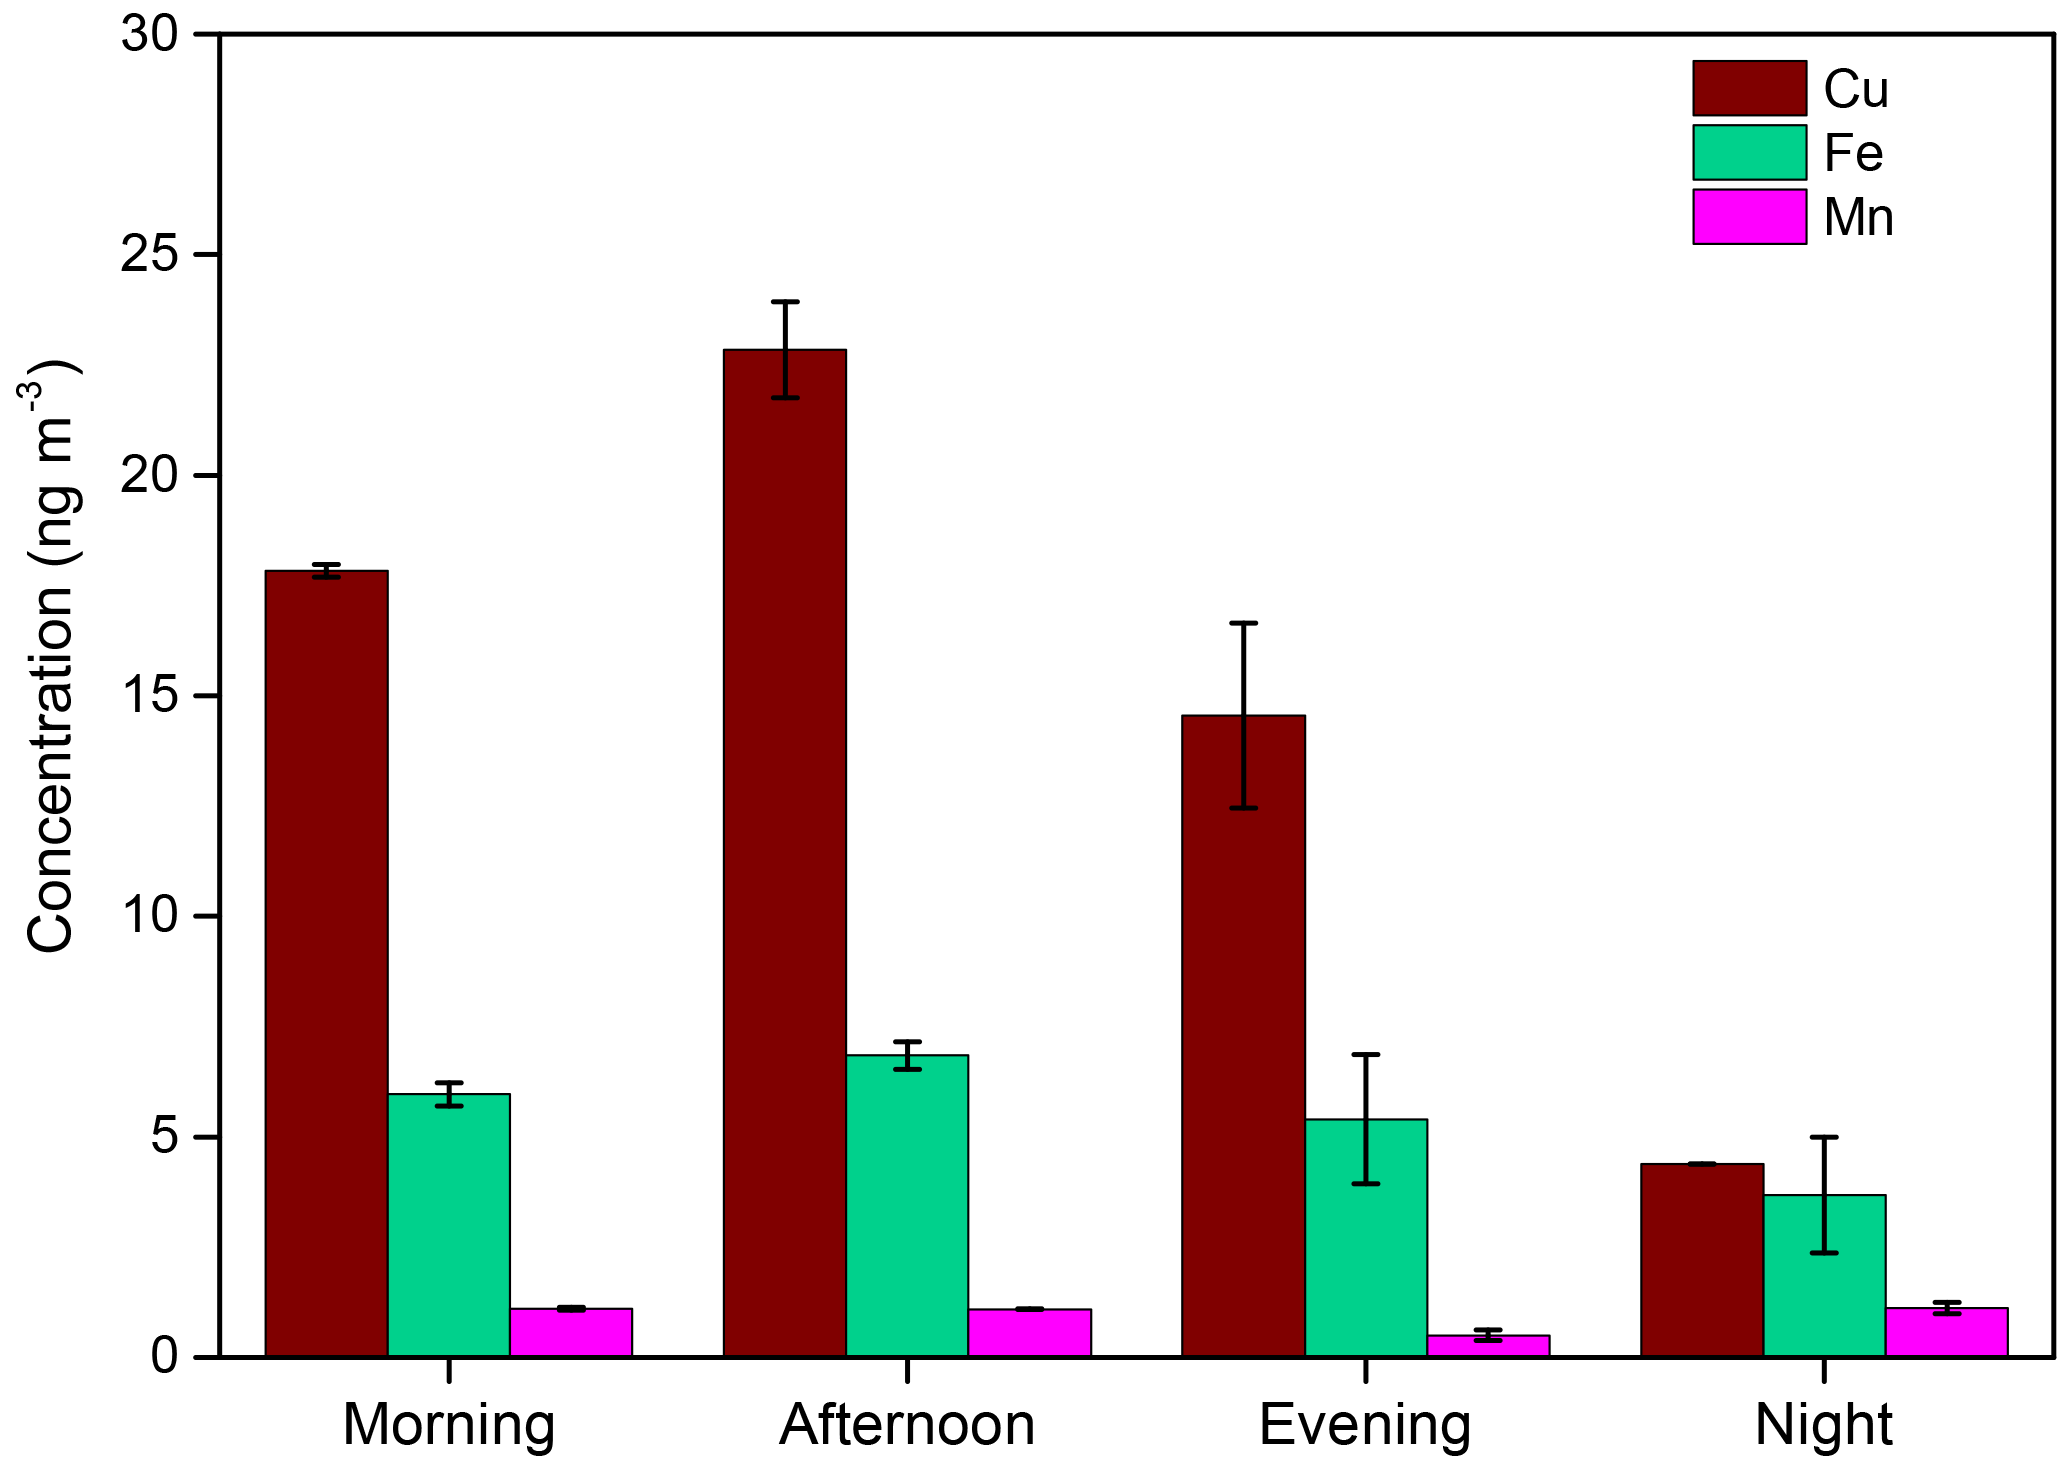
Figure 6Diurnal trend in the ambient concentrations of metals, i.e., Cu, Fe, and Mn, as measured from the time-segregated integrated filters. Error bars denote standard deviation (1σ) of the triplicate measurements.
3.6.2 Trace metals
Vehicular sources, which include both direct exhausts and non-tailpipe emissions (e.g., brake and tire wear, abrasion of the road surface, and resuspension of road dust) contribute majorly to the concentration of trace metals in the atmosphere (Thorpe and Harrison, 2008). Hulskotte et al. (2007) identified brake wear as one of the main sources of airborne Cu emission. In addition, resuspended road dust is a mixture of various elements including the redox-active transition metals (e.g., Cu, Mn, and Fe) (Wang et al., 2005; Thorpe and Harrison, 2008; Chen et al., 2012). Figure 6 shows the ambient concentrations of three metals, i.e., Cu, Mn, and Fe measured at the sampling site. The concentrations of Cu varied between 4 and 22 ng m−3, and was comparable to the concentrations reported in other studies conducted in urban areas (Verma et al., 2009, 2014). However, the concentration of Fe (3.7–6.9 ng m−3) was significantly lower than reported in other studies. Fe concentrations typically found in urban atmospheres are in the range of 90–280 ng m−3 (Verma et al., 2009, 2014; Xia and Gao, 2011). The concentration of Mn at this site was very low (≤1.1 ng m−3) during the entire sampling period.
Both Cu and Fe followed a very similar diurnal trend as the DTT activity (Fig. 4), with highest concentration in the afternoon and lowest at night. The difference in the diurnal trends of metals and EC concentrations (i.e., EC peaks in the morning, while metals peak in the afternoon) indicates a lesser influence of direct vehicular exhausts on the metal concentrations than the resuspended dust, which is generally driven by higher vehicular speeds (due to relatively lower traffic) and drier conditions in the afternoon (Pant and Harrison, 2013). Figure S6 shows the diurnal pattern of ambient RH at the sampling site. The very high RH (> 75 %) substantially suppresses the dust resuspension and the resultant metal concentrations during nighttime. A close similarity of the diurnal profile of the water-soluble metals with DTT activity suggests a significant contribution of both vehicular emissions (the morning peak) and resuspended dust (in the afternoon) to PM2.5 OPex at the sampling site.
We developed and field-tested an online instrument for the near real-time measurement of ambient PM2.5 OPex with an hourly resolution. The instrument is based on coupling an automated analytical system for DTT activity determination to an MC designed to collect PM2.5 suspension in water. The MC, equipped with a hydrophobic filter collects PM2.5 suspension by generating a fine mist of water, which scrubs the particles, both directly from air and from those collected onto the filter. The PM suspension collected in MC is then fed to an automated analytical system for the measurement of DTT activity.
The OPex data collected using the online instrument showed a strong correlation (R2 > 0.8; p < 0.001) with the measurements obtained by the conventional filter sampling and extraction (in water and methanol) methodology. However, the online instrument yielded higher DTT activity than both water-extracted filters (slope =1.86, N=20) and methanol-extracted filters (slope =1.08, N=16). We attribute this higher DTT activity to the contribution from water-insoluble components, which are more effectively collected in MC than the conventional filter sampling and extraction protocol. The instrument was tested in the field for 50 days in summer 2017 with minimal manual assistance. The instrument's LOD as tested under field conditions is 0.24 nmol min−1, and around 65 % of the hourly DTT activity measurements during field sampling were above the LOD. Substantially lower DTT activity levels (i.e., either below or very close to LOD) were observed on the days with very high RH (> 90 %) or rain events. Interestingly, the DTT activity showed a 4-fold increase on the night of 4 July (Independence Day), caused by the fireworks display, as compared to the average OPex measured during the entire sampling period.
The hourly data collected during field sampling allowed us to plot the first-ever recorded diurnal profile of the DTT activity of ambient PM2.5. The diurnal profile for weekdays showed a bimodal trend with the first peak in the morning (around 07:00 LT), followed by a broad peak (extending from 13:00 to 19:00 LT, but with a slight dip at 16:00 LT) during afternoon and early evening periods. We further investigated this bimodal profile of ambient PM2.5 DTT activity in relation to the diurnal variation in PM2.5 chemical composition by collecting time-segregated composite filters for 10 consecutive weekdays. By comparison of the DTT activity with various chemical components, i.e., OC, EC, WSOC, Cu, Fe, and Mn, the morning peak in DTT activity profile was attributed to the vehicular sources (exhausts and non-exhausts), whereas both secondary formation (i.e., SOA) and resuspended dust seem to contribute to the afternoon peak. Overall, the extensive field testing of the instrument in our study demonstrates its stability and consistency to yield the long-term measurements of ambient PM2.5 OPex. Further studies in this direction should be aimed to integrate the highly time-resolved data obtained by online instruments for measuring the PM2.5 OP and chemical composition and thus infer the diurnal contribution of various emission sources in the risk associated with PM2.5 exposure.
Data used in this paper can be provided upon request by email to Vishal Verma (vverma@illinois.edu).
The supplement related to this article is available online at: https://doi.org/10.5194/amt-11-5767-2018-supplement.
JVP designed the instrument, led the the sampling campaign, performed the experiments, and wrote the manuscript. CZ helped in the filter collection and in conducting the DTT activity experiments. VV conceived the idea, organized the manuscript, and supervised the project.
The authors declare that they have no conflict of interest.
This work was supported from Vishal Verma's start-up fund by the
Department of Civil and Environmental Engineering at University of Illinois
Urbana-Champaign. We thank Michelle Wahl (parking director) for providing
us the site for measurement.
Edited by: Mingjin Tang
Reviewed by: four anonymous referees
Abrams, J. Y., Weber, R. J., Klein, M., Samat, S. E., Chang, H. H., Strickland, M. J., Verma, V., Fang, T., Bates, J. T., Mulholland, J. A., Russell, A. G., and Tolbert, P. E.: Associations between ambient fine particulate oxidative potential and cardiorespiratory emergency department visits, Environ. Health Persp., 125, 107008, https://doi.org/10.1289/EHP1545, 2017.
AccuWeather: AccuWeather Forecast, available at: https://www.accuweather.com/en/us/urbana-il/61801/weather-forecast/328764 last access: 10 April 2018.
Anderson, C. H., Dibb, J. E., Griffin, R. J., Hagler, G. S. W., and Bergin, M. H.: Atmospheric water-soluble organic carbon measurements at Summit, Greenland, Atmos. Environ., 42, 5612–5621, https://doi.org/10.1016/j.atmosenv.2008.03.006, 2008.
Antiñolo, M., Willis, M. D., Zhou, S., and Abbatt, J. P. D.: Connecting the oxidation of soot to its redox cycling abilities, Nat. Commun., 6, 6812, https://doi.org/10.1038/ncomms7812, 2015.
Bates, J. T., Weber, R. J., Abrams, J., Verma, V., Fang, T., Klein, M., Strickland, M. J., Sarnat, S. E., Chang, H. H., Mulholland, J. A., Tolbert, P. E., and Russell, A. G.: Reactive Oxygen Species Generation Linked to Sources of Atmospheric Particulate Matter and Cardiorespiratory Effects, Environ. Sci. Technol., 49, 13605–13612, https://doi.org/10.1021/acs.est.5b02967, 2015.
Birch, M. E. and Cary, R. A.: Elemental Carbon-Based Method for Monitoring Occupational Exposures to Particulate Diesel Exhaust, Aerosol Sci. Technol., 25, 221–241, https://doi.org/10.1080/02786829608965393, 1996.
Cabada, J. C., Pandis, S. N., Subramanian, R., Robinson, A. L., Polidori, A., and Turpin, B.: Estimating the Secondary Organic Aerosol Contribution to PM2.5 Using the EC Tracer Method Special Issue of Aerosol Science and Technology on Findings from the Fine Particulate Matter Supersites Program, Aerosol Sci. Technol., 38, 140–155, https://doi.org/10.1080/02786820390229084, 2004.
Charrier, J. G. and Anastasio, C.: On dithiothreitol (DTT) as a measure of oxidative potential for ambient particles: evidence for the importance of soluble transition metals, Atmos. Chem. Phys., 12, 9321–9333, https://doi.org/10.5194/acp-12-9321-2012, 2012.
Chen, J., Wang, W., Liu, H., and Ren, L.: Determination of road dust loadings and chemical characteristics using resuspension, Environ. Monit. Assess., 184, 1693–1709, https://doi.org/10.1007/s10661-011-2071-1, 2012.
Cheung, K., Shafer, M. M., Schauer, J. J., and Sioutas, C.: Diurnal trends in oxidative potential of coarse particulate matter in the Los Angeles basin and their relation to sources and chemical composition, Environ. Sci. Technol., 46, 3779–3787, https://doi.org/10.1021/es204211v, 2012.
Cho, A. K., Sioutas, C., Miguel, A. H., Kumagai, Y., Schmitz, D. A., Singh, M., Eiguren-Fernandez, A., and Froines, J. R.: Redox activity of airborne particulate matter at different sites in the Los Angeles Basin, Environ. Res., 99, 40–47, https://doi.org/10.1016/j.envres.2005.01.003, 2005.
Cofer, W. R., Collins, V. G., and Talbot, R. W.: Improved Aqueous Scrubber for Collection of Soluble Atmospheric Trace Gases, Environ. Sci. Technol., 19, 557–560, https://doi.org/10.1021/es00136a012, 1985.
Daher, N., Ning, Z., Cho, A. K., Shafer, M., Schauer, J. J., and Sioutas, C.: Comparison of the chemical and oxidative characteristics of particulate matter (PM) collected by different methods: Filters, impactors, and BioSamplers, Aerosol Sci. Technol., 45, 1294–1304, https://doi.org/10.1080/02786826.2011.590554, 2011.
Delfino, R. J., Staimer, N., Tjoa, T., Gillen, D. L., Schauer, J. J., and Shafer, M. M.: Airway inflammation and oxidative potential of air pollutant particles in a pediatric asthma panel, J. Expo. Sci. Env. Epid., 23, 466–473, https://doi.org/10.1038/jes.2013.25, 2013.
Dungchai, W., Sameenoi, Y., Chailapakul, O., Volckens, J., and Henry, C. S.: Determination of aerosol oxidative activity using silver nanoparticle aggregation on paper-based analytical devices, Analyst, 138, 6766, https://doi.org/10.1039/c3an01235b, 2013.
Eiguren-Fernandez, A., Kreisberg, N., and Hering, S.: An online monitor of the oxidative capacity of aerosols (o-MOCA), Atmos. Meas. Tech., 10, 633–644, https://doi.org/10.5194/amt-10-633-2017, 2017.
Fang, T., Verma, V., Guo, H., King, L. E., Edgerton, E. S., and Weber, R. J.: A semi-automated system for quantifying the oxidative potential of ambient particles in aqueous extracts using the dithiothreitol (DTT) assay: results from the Southeastern Center for Air Pollution and Epidemiology (SCAPE), Atmos. Meas. Tech., 8, 471–482, https://doi.org/10.5194/amt-8-471-2015, 2015.
Fang, T., Zeng, L., Gao, D., Verma, V., Stefaniak, A. B., and Weber, R. J.: Ambient Size Distributions and Lung Deposition of Aerosol Dithiothreitol-Measured Oxidative Potential: Contrast between Soluble and Insoluble Particles, Environ. Sci. Technol., 51, 6802–6811, https://doi.org/10.1021/acs.est.7b01536, 2017a.
Fang, T., Guo, H., Zeng, L., Verma, V., Nenes, A., and Weber, R. J.: Highly Acidic Ambient Particles, Soluble Metals, and Oxidative Potential: A Link between Sulfate and Aerosol Toxicity, Environ. Sci. Technol., 51, 2611–2620, https://doi.org/10.1021/acs.est.6b06151, 2017b.
Gao, D., Fang, T., Verma, V., Zeng, L., and Weber, R. J.: A method for measuring total aerosol oxidative potential (OP) with the dithiothreitol (DTT) assay and comparisons between an urban and roadside site of water-soluble and total OP, Atmos. Meas. Tech., 10, 2821–2835, https://doi.org/10.5194/amt-10-2821-2017, 2017.
Hennigan, C. J., Bergin, M. H., Russell, A. G., Nenes, A., and Weber, R. J.: Gas/particle partitioning of water-soluble organic aerosol in Atlanta, Atmos. Chem. Phys., 9, 3613–3628, https://doi.org/10.5194/acp-9-3613-2009, 2009.
Hennigan, C. J., El-Sayed, M. M. H., and Hodzic, A.: Detailed characterization of a mist chamber for the collection of water-soluble organic gases, Atmos. Environ., 188, 12–17, https://doi.org/10.1016/J.ATMOSENV.2018.06.019, 2018.
Hulskotte, J. H. J., van der Gon, H. A. C. D., Visschedijk, A. J. H., and Schaap, M.: Brake wear from vehicles as an important source of diffuse copper pollution, Water Sci. Technol., 56, 223–231, 2007.
Janssen, N. A. H., Yang, A., Strak, M., Steenhof, M., Hellack, B., Gerlofs-Nijland, M. E., Kuhlbusch, T., Kelly, F., Harrison, R., Brunekreef, B., Hoek, G., and Cassee, F.: Oxidative potential of particulate matter collected at sites with different source characteristics, Sci. Total Environ., 472, 572–581, https://doi.org/10.1016/j.scitotenv.2013.11.099, 2014.
Kim, S., Jaques, P. A., Chang, M., Froines, J. R., and Sioutas, C.: Versatile aerosol concentration enrichment system (VACES) for simultaneous in vivo and in vitro evaluation of toxic effects of ultrafine, fine and coarse ambient particles Part I: Development and laboratory characterization, J. Aerosol Sci., 32, 1281–1297, https://doi.org/10.1016/S0021-8502(01)00057-X, 2001.
King, L. E. and Weber, R. J.: Development and testing of an online method to measure ambient fine particulate reactive oxygen species (ROS) based on the -dichlorofluorescin (DCFH) assay, Atmos. Meas. Tech., 6, 1647–1658, https://doi.org/10.5194/amt-6-1647-2013, 2013.
Knaapen, A. M., Borm, P. J. A., Albrecht, C., and Schins, R. P. F.: Inhaled particles and lung cancer. Part A: Mechanisms, Int. J. Cancer, 109, 799–809, https://doi.org/10.1002/ijc.11708, 2004.
Kumagai, Y., Koide, S., Taguchi, K., Endo, A., Nakai, Y., Yoshikawa, T., and Shimojo, N.: Oxidation of proximal protein sulfhydryls by phenanthraquinone, a component of diesel exhaust particles, Chem. Res. Toxicol., 15, 483–489, https://doi.org/10.1021/tx0100993, 2002.
Landreman, A. P., Shafer, M. M., Hemming, J. C., Hannigan, M. P., and Schauer, J. J.: A macrophage-based method for the assessment of the reactive oxygen species (ROS) activity of atmospheric particulate matter (PM) and application to routine (daily-24 h) aerosol monitoring studies, Aerosol Sci. Technol., 42, 946–957, https://doi.org/10.1080/02786820802363819, 2008.
Li, N., Sioutas, C., Cho, A., Schmitz, D., Misra, C., Sempf, J., Wang, M., Oberley, T., Froines, J., and Nel, A.: Ultrafine particulate pollutants induce oxidative stress and mitochondrial damage, Environ. Health Persp., 111, 455–460, https://doi.org/10.1289/ehp.6000, 2003.
Lin, P., Hu, M., Deng, Z., Slanina, J., Han, S., Kondo, Y., Takegawa, N., Miyazaki, Y., Zhao, Y., and Sugimoto, N.: Seasonal and diurnal variations of organic carbon in PM2.5 in Beijing and the estimation of secondary organic carbon, J. Geophys. Res., 114, D00G11, https://doi.org/10.1029/2008JD010902, 2009.
Liu, S. and Liang, X. Z.: Observed diurnal cycle climatology of planetary boundary layer height, J. Climate, 23, 5790–5809, https://doi.org/10.1175/2010JCLI3552.1, 2010.
Lou, C., Liu, H., Li, Y., Peng, Y., Wang, J., and Dai, L.: Relationships of relative humidity with PM2.5 and PM10 in the Yangtze River Delta, China, Environ. Monit. Assess., 189, 582, https://doi.org/10.1007/s10661-017-6281-z, 2017.
Maikawa, C. L., Weichenthal, S., Wheeler, A. J., Dobbin, N. A., Smargiassi, A., Evans, G., Liu, L., Goldberg, M. S., and Godri Pollitt, K. J.: Particulate oxidative burden as a predictor of exhaled nitric oxide in children with Asthma, Environ. Health Persp., 124, 1616–1622, https://doi.org/10.1289/EHP175, 2016.
Majestic, B. J., Schauer, J. J., and Shafer, M. M.: Development of a manganese speciation method for atmospheric aerosols in biologically and environmentally relevant fluids, Aerosol Sci. Technol., 41, 925–933, https://doi.org/10.1080/02786820701564657, 2007.
Mues, A., Rupakheti, M., Münkel, C., Lauer, A., Bozem, H., Hoor, P., Butler, T., and Lawrence, M. G.: Investigation of the mixing layer height derived from ceilometer measurements in the Kathmandu Valley and implications for local air quality, Atmos. Chem. Phys., 17, 8157–8176, https://doi.org/10.5194/acp-17-8157-2017, 2017.
Pant, P. and Harrison, R. M.: Estimation of the contribution of road traffic emissions to particulate matter concentrations from field measurements: A review, Atmos. Environ., 77, 78–97, https://doi.org/10.1016/j.atmosenv.2013.04.028 Review, 2013.
Pathak, R. K., Yao, X., and Chan, C. K.: Sampling Artifacts of Acidity and Ionic Species in PM2.5, Environ. Sci. Technol., 38, 254–259, https://doi.org/10.1021/es0342244, 2004.
Pervez, S., Chakrabarty, R. K., Dewangan, S., Watson, J. G., Chow, J. C., and Matawle, J. L.: Chemical speciation of aerosols and air quality degradation during the festival of lights (Diwali), Atmos. Pollut. Res., 7, 92–99, https://doi.org/10.1016/J.APR.2015.09.002, 2016.
Roper, C., Chubb, L. G., Cambal, L., Tunno, B., Clougherty, J. E., and Mischler, S. E.: Characterization of ambient and extracted PM2.5 collected on filters for toxicology applications, Inhal. Toxicol., 27, 673–681, https://doi.org/10.3109/08958378.2015.1092185, 2015.
Saffari, A., Daher, N., Shafer, M. M., Schauer, J. J., and Sioutas, C.: Seasonal and spatial variation in dithiothreitol (DTT) activity of quasi-ultrafine particles in the Los Angeles Basin and its association with chemical species, J. Environ. Sci. Heal. A, 49, 441–451, https://doi.org/10.1080/10934529.2014.854677, 2014.
Saffari, A., Hasheminassab, S., Wang, D., Shafer, M. M., Schauer, J. J., and Sioutas, C.: Impact of primary and secondary organic sources on the oxidative potential of quasi-ultrafine particles (PM0.25) at three contrasting locations in the Los Angeles Basin, Atmos. Environ., 120, 286–296, https://doi.org/10.1016/j.atmosenv.2015.09.022, 2015.
Sameenoi, Y., Koehler, K., Shapiro, J., Boonsong, K., Sun, Y., Collett, J., Volckens, J., and Henry, C. S.: Microfluidic electrochemical sensor for on-line monitoring of aerosol oxidative activity, J. Am. Chem. Soc., 134, 10562–10568, https://doi.org/10.1021/ja3031104, 2012.
Sander, R.: Compilation of Henry's law constants (version 4.0) for water as solvent, Atmos. Chem. Phys., 15, 4399–4981, https://doi.org/10.5194/acp-15-4399-2015, 2015.
Shah, S. D., Cocker, D. R., Miller, J. W., and Norbeck, J. M.: Emission Rates of Particulate Mailer and Elemental and Organic Carbon from In-Use Diesel Engines, Environ. Sci. Technol., 38, 2544–2550, https://doi.org/10.1021/es0350583, 2004.
Sharma, M. C., Pandey, V. K., Kumar, R., Latief, S. U., Chakrawarthy, E., and Acharya, P.: Seasonal characteristics of black carbon aerosol mass concentrations and influence of meteorology, New Delhi (India), Urban Clim., 24, 968–981, https://doi.org/10.1016/j.uclim.2017.12.002, 2017.
Shirmohammadi, F., Hasheminassab, S., Wang, D., Schauer, J. J., Shafer, M. M., Delfino, R. J., and Sioutas, C.: The relative importance of tailpipe and non-tailpipe emissions on the oxidative potential of ambient particles in Los Angeles, CA, Faraday Discuss., 189, 361–380, https://doi.org/10.1039/c5fd00166h, 2016.
Singh, V., Ravindra, K., Sahu, L., and Sokhi, R.: Trends of atmospheric black carbon concentration over United Kingdom, Atmos. Environ., 178, 148–157, https://doi.org/10.1016/J.ATMOSENV.2018.01.030, 2018.
Snyder, D. C., Rutter, A. P., Collins, R., Worley, C., and Schauer, J. J.: Insights into the origin of water soluble organic carbon in atmospheric fine particulate matter, Aerosol Sci. Technol., 43, 1099–1107, https://doi.org/10.1080/02786820903188701, 2009.
Spaulding, R. S., Talbot, R. W., and Charles, M. J.: Optimization of a mist chamber (cofer scrubber) for sampling water-soluble organics in air, Environ. Sci. Technol., 36, 1798–1808, https://doi.org/10.1021/es011189x, 2002.
Steenhof, M., Gosens, I., Strak, M., Godri, K. J., Hoek, G., Cassee, F. R., Mudway, I. S., Kelly, F. J., Harrison, R. M., Lebret, E., Brunekreef, B., Janssen, N. A. H., and Pieters, R. H. H.: In vitro toxicity of particulate matter (PM) collected at different sites in the Netherlands is associated with PM composition, size fraction and oxidative potential – the RAPTES project, Part. Fibre Toxicol., 8, 26, https://doi.org/10.1186/1743-8977-8-26, 2011.
Thorpe, A. and Harrison, R. M.: Sources and properties of non-exhaust particulate matter from road traffic: A review, Sci. Total Environ., 400, 270–282, https://doi.org/10.1016/j.scitotenv.2008.06.007, 2008.
Tuet, W. Y., Fok, S., Verma, V., Tagle Rodriguez, M. S., Grosberg, A., Champion, J. A., and Ng, N. L.: Dose-dependent intracellular reactive oxygen and nitrogen species (ROS/RNS) production from particulate matter exposure: comparison to oxidative potential and chemical composition, Atmos. Environ., 144, 335–344, https://doi.org/10.1016/j.atmosenv.2016.09.005, 2016.
Venkatachari, P. and Hopke, P. K.: Development and laboratory testing of an automated monitor for the measurement of atmospheric particle-bound reactive oxygen species (ROS), Aerosol Sci. Technol., 42, 629–635, https://doi.org/10.1080/02786820802227345, 2008.
Verma, V., Ning, Z., Cho, A. K., Schauer, J. J., Shafer, M. M., and Sioutas, C.: Redox activity of urban quasi-ultrafine particles from primary and secondary sources, Atmos. Environ., 43, 6360–6368, https://doi.org/10.1016/j.atmosenv.2009.09.019, 2009.
Verma, V., Rico-Martinez, R., Kotra, N., King, L., Liu, J., Snell, T. W., and Weber, R. J.: Contribution of water-soluble and insoluble components and their hydrophobic/hydrophilic subfractions to the reactive oxygen species-generating potential of fine ambient aerosols, Environ. Sci. Technol., 46, 11384–11392, https://doi.org/10.1021/es302484r, 2012.
Verma, V., Fang, T., Guo, H., King, L., Bates, J. T., Peltier, R. E., Edgerton, E., Russell, A. G., and Weber, R. J.: Reactive oxygen species associated with water-soluble PM2.5 in the southeastern United States: spatiotemporal trends and source apportionment, Atmos. Chem. Phys., 14, 12915–12930, https://doi.org/10.5194/acp-14-12915-2014, 2014.
Wang, C.-F., Chang, C.-Y., Tsai, S.-F., and Chiang, H.-L.: Characteristics of road dust from different sampling sites in northern Taiwan, J. Air Waste Manage. Assoc., 55, 1236–44, https://doi.org/10.1080/10473289.2005.10464717, 2005.
Wang, Y., Hopke, P. K., Sun, L., Chalupa, D. C., and Utell, M. J.: Laboratory and field testing of an automated atmospheric particle-bound reactive oxygen species sampling-analysis system, J. Toxicol., 2011, 1–9, https://doi.org/10.1155/2011/419476, 2011.
Wang, Y., Plewa, M. J., Mukherjee, U. K., and Verma, V.: Assessing the cytotoxicity of ambient particulate matter (PM) using Chinese hamster ovary (CHO) cells and its relationship with the PM chemical composition and oxidative potential, Atmos. Environ., 179, 132–141, https://doi.org/10.1016/j.atmosenv.2018.02.025, 2018.
Weichenthal, S., Crouse, D. L., Pinault, L., Godri-Pollitt, K., Lavigne, E., Evans, G., van Donkelaar, A., Martin, R. V., and Burnett, R. T.: Oxidative burden of fine particulate air pollution and risk of cause-specific mortality in the Canadian Census Health and Environment Cohort (CanCHEC), Environ. Res., 146, 92–99, https://doi.org/10.1016/j.envres.2015.12.013, 2016.
Wragg, F. P. H., Fuller, S. J., Freshwater, R., Green, D. C., Kelly, F. J., and Kalberer, M.: An automated online instrument to quantify aerosol-bound reactive oxygen species (ROS) for ambient measurement and health-relevant aerosol studies, Atmos. Meas. Tech., 9, 4891–4900, https://doi.org/10.5194/amt-9-4891-2016, 2016.
Xia, L. and Gao, Y.: Characterization of trace elements in PM2.5 aerosols in the vicinity of highways in northeast New Jersey in the U.S. east coast, Atmos. Pollut. Res., 2, 34–44, https://doi.org/10.5094/APR.2011.005, 2011.
Xiong, Q., Yu, H., Wang, R., Wei, J., and Verma, V.: Rethinking Dithiothreitol-Based Particulate Matter Oxidative Potential: Measuring Dithiothreitol Consumption versus Reactive Oxygen Species Generation, Environ. Sci. Technol., 51, 6507–6514, https://doi.org/10.1021/acs.est.7b01272, 2017.
Yang, A., Jedynska, A., Hellack, B., Kooter, I., Hoek, G., Brunekreef, B., Kuhlbusch, T. A. J., Cassee, F. R., and Janssen, N. A. H.: Measurement of the oxidative potential of PM2.5 and its constituents: The effect of extraction solvent and filter type, Atmos. Environ., 83, 35–42, https://doi.org/10.1016/j.atmosenv.2013.10.049, 2014.
Yang, A., Janssen, N. A. H., Brunekreef, B., Cassee, F. R., Hoek, G., and Gehring, U.: Children's respiratory health and oxidative potential of PM2.5: The PIAMA birth cohort study, Occup. Environ. Med., 73, 154–160, https://doi.org/10.1136/oemed-2015-103175, 2016.
Yao, X., Fang, M., and Chan, C. K.: Experimental study of the sampling artifact of chloride depletion from collected sea salt aerosols, Environ. Sci. Technol., 35, 600–605, https://doi.org/10.1021/es000964q, 2001.
Yu, H., Wei, J., Cheng, Y., Subedi, K., and Verma, V.: Synergistic and Antagonistic Interactions among the Particulate Matter Components in Generating Reactive Oxygen Species Based on the Dithiothreitol Assay, Environ. Sci. Technol., 52, 2261–2270, https://doi.org/10.1021/acs.est.7b04261, 2018.
Zhou, J., Bruns, E. A., Zotter, P., Stefenelli, G., Prévôt, A. S. H., Baltensperger, U., El-Haddad, I., and Dommen, J.: Development, characterization and first deployment of an improved online reactive oxygen species analyzer, Atmos. Meas. Tech., 11, 65–80, https://doi.org/10.5194/amt-11-65-2018, 2018.