the Creative Commons Attribution 4.0 License.
the Creative Commons Attribution 4.0 License.
 | 23 Nov 2018
Twin-plate Ice Nucleation Assay (TINA) with infrared detection for high-throughput droplet freezing experiments with biological ice nuclei in laboratory and field samples
Anna T. Kunert
Mark Lamneck
Frank Helleis
Ulrich Pöschl
Mira L. Pöhlker
Janine Fröhlich-Nowoisky
For efficient analysis and characterization of biological ice nuclei under immersion freezing conditions, we developed the Twin-plate Ice Nucleation Assay (TINA) for high-throughput droplet freezing experiments, in which the temperature profile and freezing of each droplet is tracked by an infrared detector. In the fully automated setup, a couple of independently cooled aluminum blocks carrying two 96-well plates and two 384-well plates, respectively, are available to study ice nucleation and freezing events simultaneously in hundreds of microliter-range droplets (0.1–40 µL). A cooling system with two refrigerant circulation loops is used for high-precision temperature control (uncertainty <0.2 K), enabling measurements over a wide range of temperatures (∼ 272–233 K) at variable cooling rates (up to 10 K min−1).
The TINA instrument was tested and characterized in experiments with bacterial and fungal ice nuclei (IN) from Pseudomonas syringae (Snomax®) and Mortierella alpina, exhibiting freezing curves in good agreement with literature data. Moreover, TINA was applied to investigate the influence of chemical processing on the activity of biological IN, in particular the effects of oxidation and nitration reactions. Upon exposure of Snomax® to O3 and NO2, the cumulative number of IN active at 270–266 K decreased by more than 1 order of magnitude. Furthermore, TINA was used to study aqueous extracts of atmospheric aerosols, simultaneously investigating a multitude of samples that were pre-treated in different ways to distinguish different kinds of IN. For example, heat treatment and filtration indicated that most biological IN were larger than 5 µm. The results confirm that TINA is suitable for high-throughput experiments and efficient analysis of biological IN in laboratory and field samples.
- Article
(3437 KB) -
Supplement
(3038 KB) - BibTeX
- EndNote


Clouds and aerosols still contribute the largest uncertainty to the evaluation of the Earth's changing energy budget (Boucher et al., 2013). Thus, the understanding of the contribution of atmospheric aerosols in cloud processes is of fundamental importance. Atmospheric ice nucleation is essential for cloud glaciation and precipitation, thereby influencing the hydrological cycle and climate. Ice can be formed via homogeneous nucleation in liquid water droplets or heterogeneous nucleation triggered by particles serving as atmospheric ice nuclei (IN) (Pruppacher and Klett, 1997).
A wide range of droplet freezing assays and instruments have been developed and applied for the analysis of IN in immersion freezing experiments (e.g., Budke and Koop, 2015; Fröhlich-Nowoisky et al., 2015; Häusler et al., 2018; Murray et al., 2010; O'Sullivan et al., 2014; Stopelli et al., 2014; Tobo, 2016; Vali, 1971b; Whale et al., 2015; Wright and Petters, 2013; Zaragotas et al., 2016). Most of the available assays and instruments, however, are limited to the investigation of small droplet numbers and use optical detection systems in the UV–Vis wavelength range.
Infrared (IR) detectors enable efficient detection of droplet freezing (Harrison et al., 2018; Zaragotas et al., 2016). Upon the phase change of water from liquid to solid, latent heat is released resulting in a sudden temperature change of the droplet, which can be detected by IR video thermography. In 1995, Ceccardi et al. (1995) used IR video thermography as a new technique to non-destructively study ice formation on plants by visualizing the changes in surface temperature. Wisniewski et al. (1997) evaluated the IR video thermography under controlled conditions and determined it as an excellent method for directly observing ice nucleation and propagation in plants. Since then, IR video thermography has been used in a range of studies investigating freezing in plants (e.g., Ball et al., 2002; Carter et al., 1999; Charrier et al., 2017; Fuller and Wisniewski, 1998; Hacker and Neuner, 2007; Pearce and Fuller, 2001; Sekozawa et al., 2004; Stier et al., 2003; Wisniewski et al., 2008; Workmaster, 1999). Further applications of IR video thermography are investigations of cold thermal stress in insects (Gallego et al., 2016), monitoring of freeze-drying processes (Emteborg et al., 2014), as well as detection of ice in wind turbine blades (Gómez Muñoz et al., 2016) and helicopter rotor blades (Hansman and Dershowitz, 1994). Freezing of single water droplets in an acoustic levitator has also been successfully observed by IR video thermography (Bauerecker et al., 2008).
Here, we introduce the Twin-plate Ice Nucleation Assay (TINA) for high-throughput droplet freezing experiments, in which the temperature profile and freezing of each droplet is tracked by an infrared detector. In the fully automated setup, a couple of independently cooled aluminum blocks are available to study ice nucleation and freezing events in nearly 1000 microliter-range droplets simultaneously. The instrument was developed in the course of the INUIT project over the last three years, in which it has been presented and discussed at several conferences and workshops (Kunert et al., 2016a,b, 2017a,b, 2018). We use the bacterial IN Snomax® and the IN-active fungus Mortierella alpina as biological test substances to investigate heterogeneous ice nucleation. Moreover, TINA is applied to investigate the effect of O3 and NO2 exposure on the IN activity of Snomax®. Furthermore, aqueous extracts of atmospheric aerosols are treated in different ways and are analyzed for different kinds of IN.
2.1 Technical details
The core of TINA is composed of two independently cooled, customized sample holder aluminum blocks, which have been shaped for multiwell plates with 96 and 384 wells, respectively. In each cooling block, two multiwell plates can be analyzed simultaneously. The maximal droplet volume in the 96-well block is 250 µL, and the minimal droplet volume is 0.1 µL, which is the limit of our liquid handling station (epMotion ep5073, Eppendorf, Hamburg, Germany). For each experiment, new sterile multiwell plates are used (96-well: Axon Labortechnik, Kaiserslautern, Germany, 384-well: Eppendorf, Hamburg, Germany). As shown in Fig. 1, the design of the two sample holder blocks is basically identical, but the detailed construction varies slightly. Both blocks consist of two parts, a trough and a cap, which are screwed together and sealed with an O-ring. But, for the 96-well block (Fig. 1a), the cap is at the top (Fig. 1b), and the trough is at the bottom (Fig. 1c), whereas, for the 384-well block (Fig. 1d), the trough is at the top (Fig. 1e) and the cap is at the bottom (Fig. 1f). Two openings with Swagelok® adapters for cooling liquid are placed next to each other, and the cooling liquid flows in a small passage around an elevation in the middle of the trough.
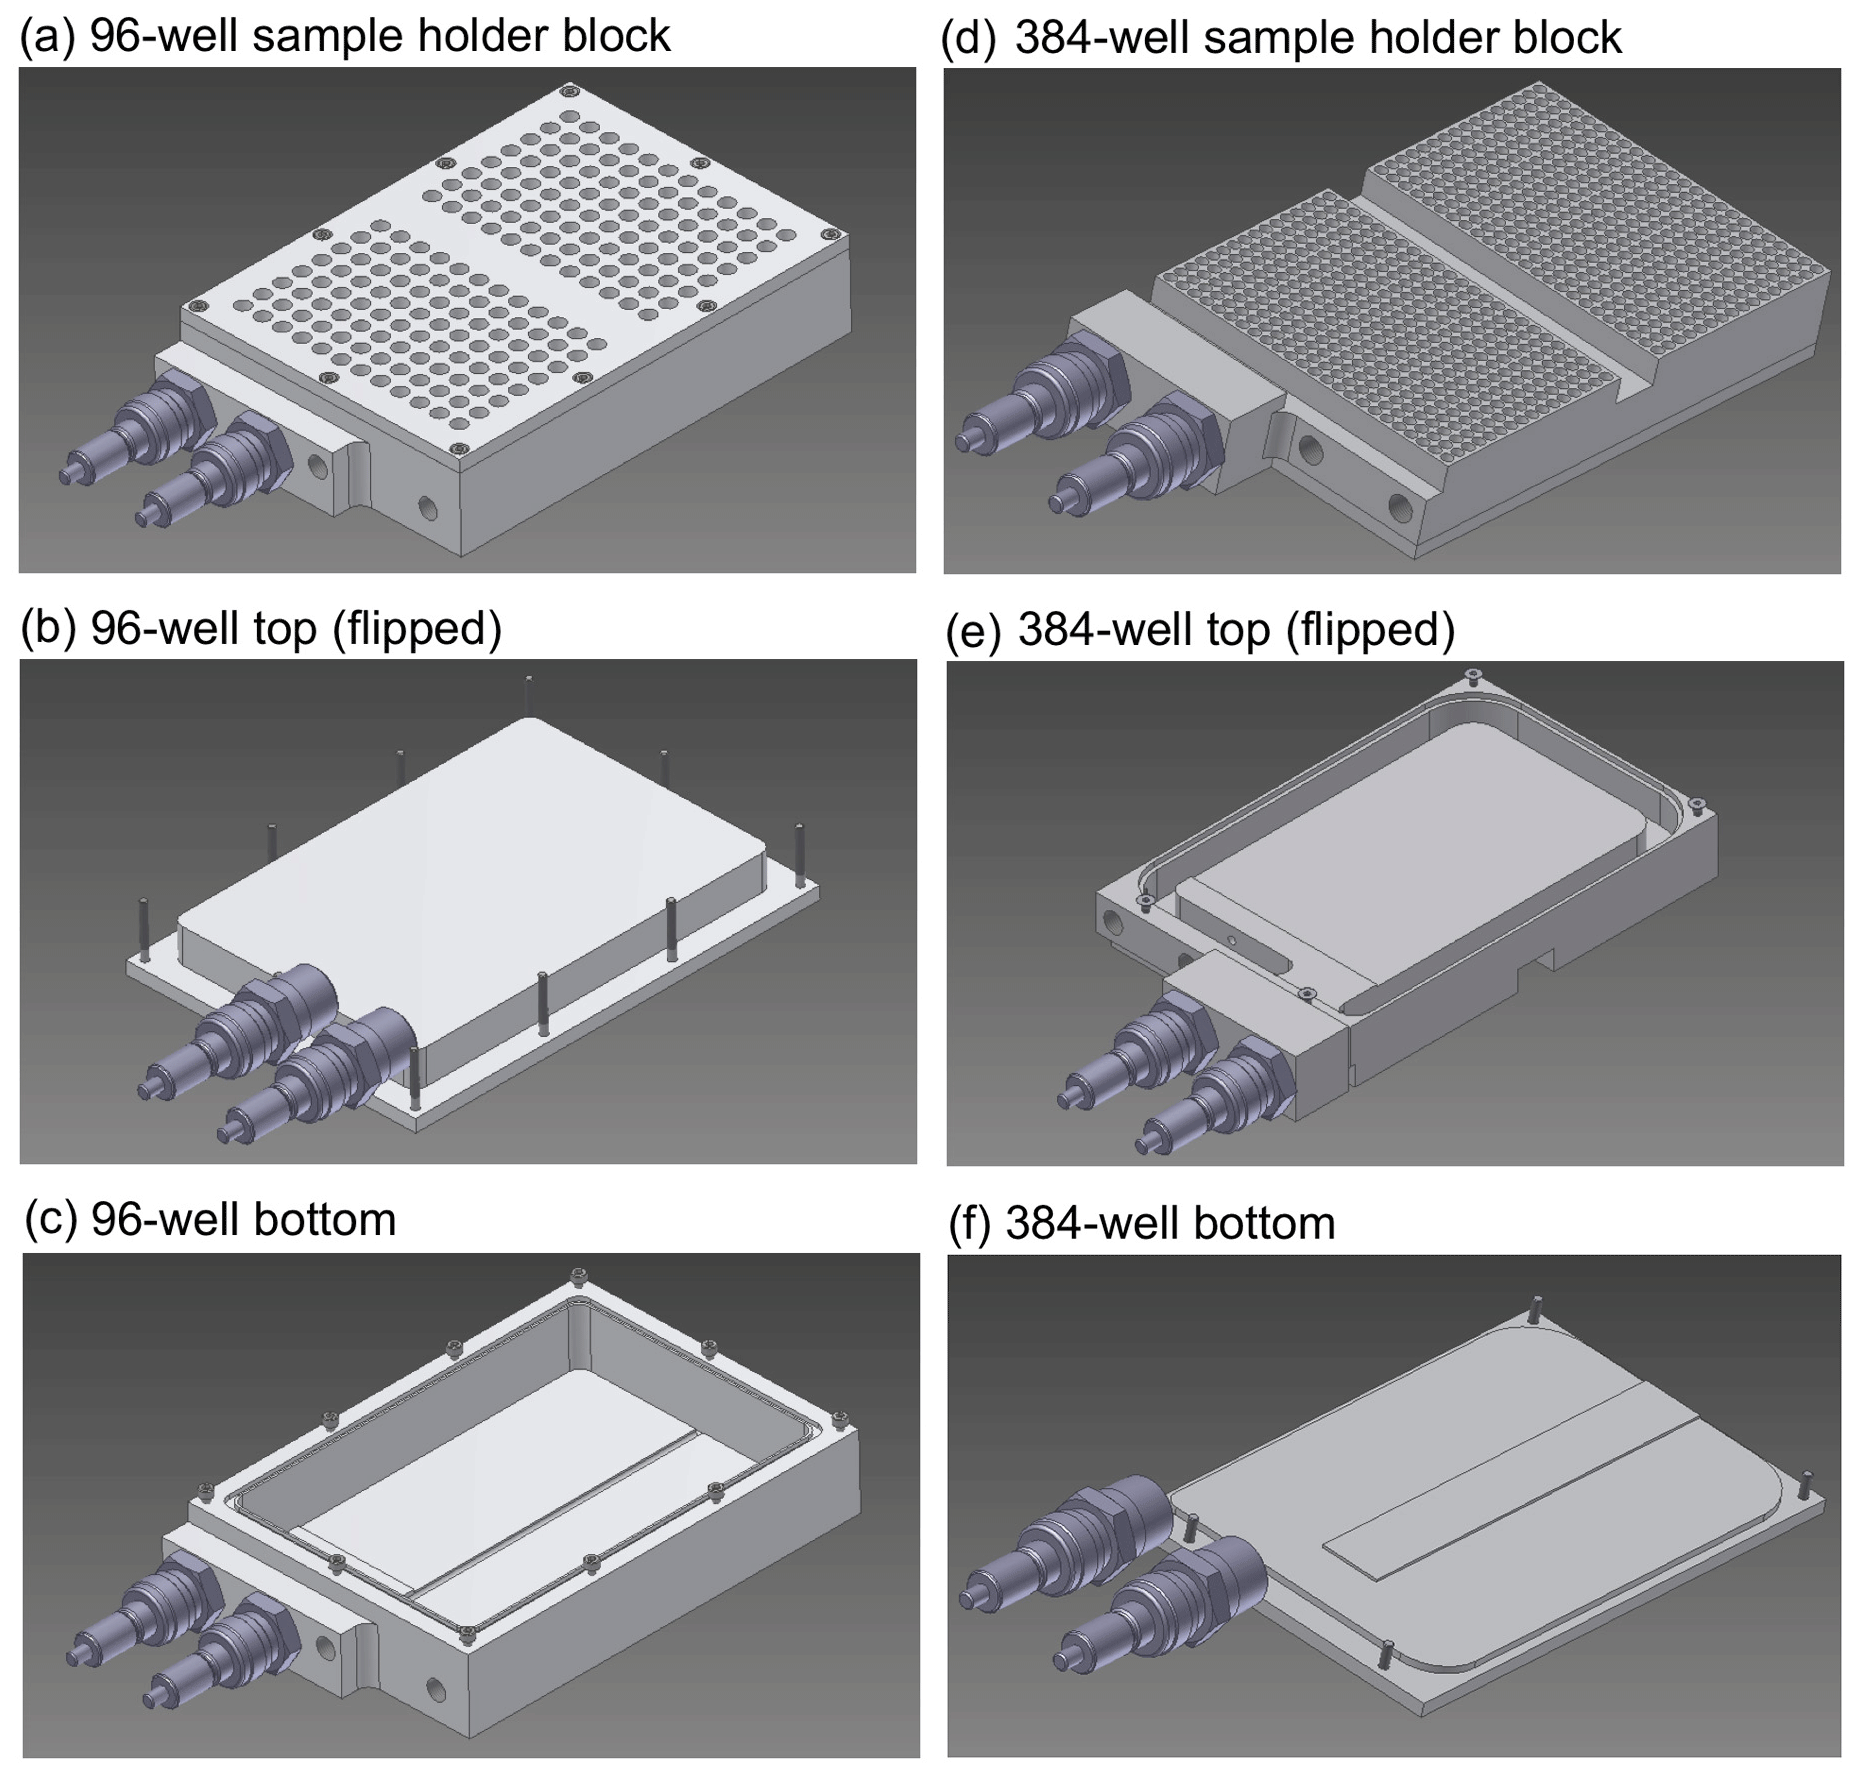
Figure 1Sample holder and cooling blocks of the Twin-plate Ice Nucleation Assay (TINA) with (a–c) 96-well plates and (d–f) 384-well plates (CAD drawings).
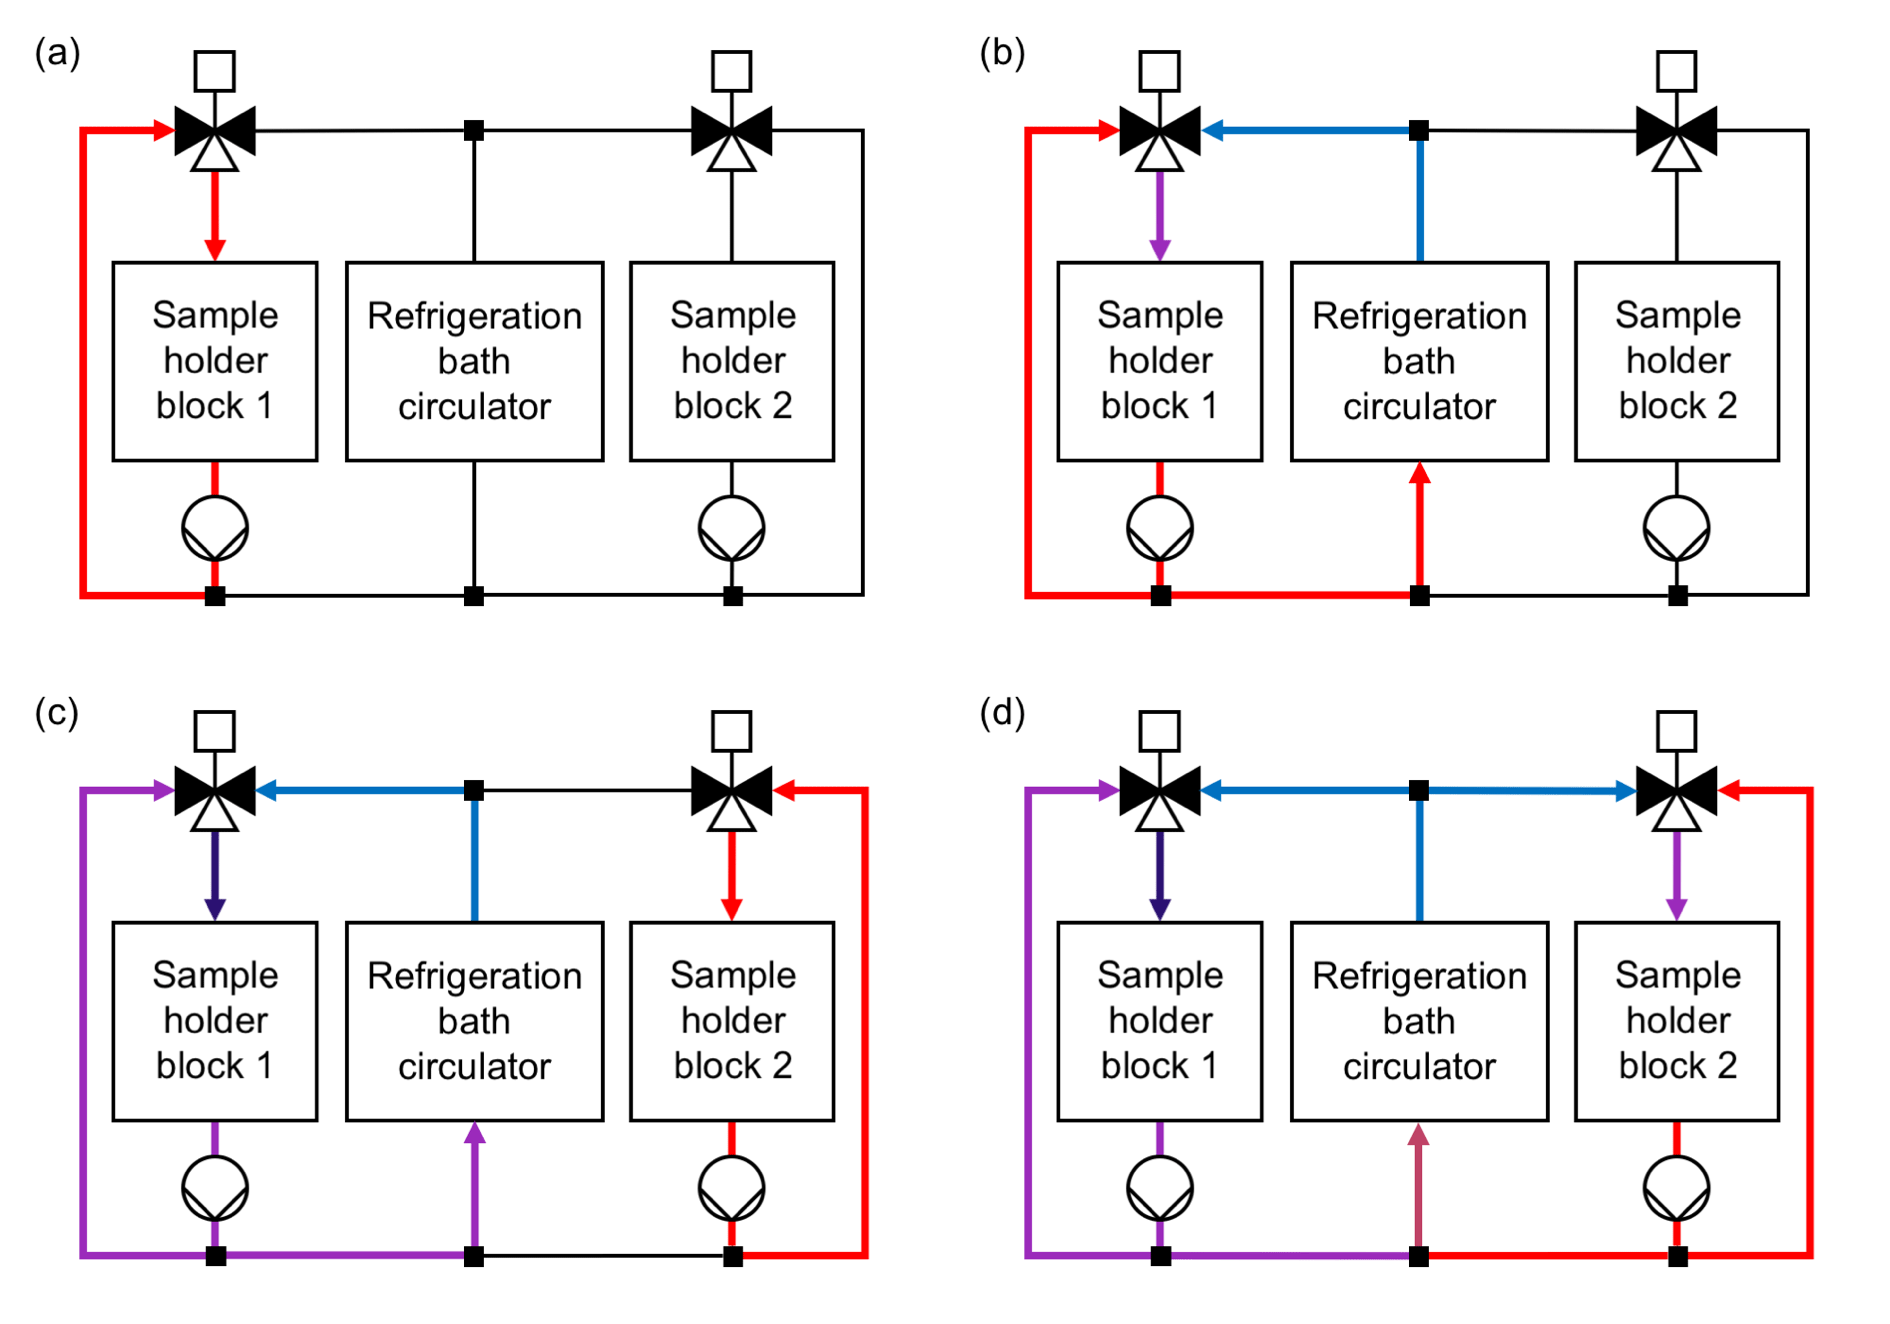
Figure 2Cooling system layout and operating principle of the Twin-plate Ice Nucleation Assay (TINA). (a) Cooling liquid is pumped in warm cooling loop of sample holder block 1 without connection to colder cooling liquid provided by refrigeration bath circulator. (b) Mixing valve is opened for both warm cooling liquid of warm cooling loop and cold cooling liquid of refrigeration bath circulator. Position of mixing valve defines temperature within sample holder block 1. (c) Sample holder block 1 is cooled further down, while cooling liquid is pumped in warm cooling loop of sample holder block 2. (d) Sample holder block 2 can be run in parallel independently of the temperature in sample holder block 1.

Figure 3Schematic illustration of the overall setup: sample holder blocks, sample holders with droplets, IR cameras, cooling system with refrigeration bath circulator, pumps and mixing valves, computer control.
The customized sample holder blocks are cooled with a silicon-based cooling liquid (SilOil M80.055.03, Peter Huber Kältemaschinenbau AG, Offenburg, Germany) tempered by an external high-performance refrigeration bath circulator (CC-508 with Pilot ONE, Peter Huber Kältemaschinenbau AG), which can supply temperatures down to 218 K (−55 ∘C). Both sample holder blocks can be operated in parallel and independently of each other by use of two self-developed mixing valves and cooling loops (Fig. 2). This allows either the cooling of two different droplet freezing assays at the same time or the observation of 960 droplets in one experiment. The mixing of a cold and a warm loop of cooling liquid for each block enables a fast and precise adjustment of the sample holder block temperatures without being dependent on the cooling rate of the refrigeration bath circulator itself. In each experiment, the refrigeration bath circulator is cooled down 5 K below the coldest temperature, which is projected for the experiment, while no mixing of warm and cold cooling liquid occurs. By changing the position of the mixing valves for a defined period of time, cold and warm cooling liquids are mixed together so that the desired temperatures within the two blocks are reached. Two pumps (VPP-655 PWM Single Version, Alphacool International GmbH, Braunschweig, Germany) ensure the continuous circulation of cooling liquid through each block independently of the position of the mixing valves. Figure 3 is a schematic illustration of the overall setup of TINA.
2.2 Temperature control and calibration
Within each sample holder block, the temperature is measured with two temperature sensors, an NTC thermistor in the cooling liquid stream (TH-44033, resistance: 2255Ω∕298 K, interchangeability: ±0.1 K, Omega Engineering GmbH, Deckenpfronn, Germany) and a customized sensor with an NTC thermistor (10K3MRBD1, resistance: 10 000Ω∕298 K, interchangeability: ±0.2 K, TE Connectivity Company, Galway, Ireland) and a thermocouple (K type, 0.08 mm diameter, Omega), which were glued together in a 1∕8 in. Swagelok® pipe, placed inside the elevated central part of the block. With further thermocouples connected to this reference, this offers the possibility of measuring temperature differences between the NTC thermistor and arbitrary points simultaneously. Another NTC thermistor (10K3MRBD1, resistance: 10 000Ω∕298 K, interchangeability: ±0.2 K, TE Connectivity Company) monitors the temperature behind each mixing valve. Temperature control within the entire system is achieved by a self-developed microcontroller-based electronic system. The analog input unit is equipped with a low-noise, 24 bit ADC (ADS1256, Texas Instruments Incorporated, Dallas, TX, USA), which assures the required accuracy to process the resolution of the used thermistors. All thermistors had been calibrated with a reference thermometer (2180A, Fluke Deutschland GmbH, Glottertal, Germany; 0.01 K resolution, system uncertainty δFluke: ±0.08 K at 223 K and ±0.07 K at 273 K). Therefore, all thermistors were bound together with a PT100 sensor of the reference thermometer, and the bundle was placed inside a brass cylinder filled with cooling liquid. The cylinder was placed inside the cooling bath of the refrigeration bath circulator. The temperature within the bath was cooled down from 303.2 to 218.2 K (30.0 to −55.0 ∘C) in 5 K steps, warmed to 220.7 K (−52.5 ∘C), and raised again from 220.7 to 300.7 K (−52.5 to 27.5 ∘C) in 5 K steps. Each step was kept for 30 min to equilibrate the temperature, while the resistance of all thermistors and the temperature measured by the reference thermometer were monitored. For the conversion of the measured resistance of the thermistors into temperature, cubic spline interpolation was used (δIpol <0.01 K). We obtained the thermistor calibration uncertainty δThermistor <0.09 K ().
To determine a potential temperature gradient of the sample holder blocks, two thermocouples (K type, 0.08 mm diameter, Omega) were positioned in various wells of multiwell plates (Fig. S1a and b in the Supplement), each filled with 30 µL pure water (see Sect. 3.1). These thermocouples were connected to the thermocouple in the elevation of each sample holder block, and the temperature offset between sample holder block and wells was measured for a continuous cooling rate of 1 K min−1 (Fig. S1c). Below −2 ∘C, the temperature offset between sample holder block and wells is nearly constant, in this example ∼0.16 and ∼0.19 K. The measurement was performed in duplicate for all observed wells. Figure S2 shows the temperature gradient exemplarily for the 384-well sample holder block in a 2-D interpolation based on all measurements.
To characterize the uncertainty of this measurement, the two thermocouples were placed in an ice water bath, and the sample holder block was cooled down to 2, 1, 0, −1, and −2 ∘C (Tblock), while the difference between the ice water and the block temperature was monitored by the thermocouples (TdiffTC) (Fig. S3). From these experiments, we obtained thermocouple uncertainties δTC<0.05 K ().
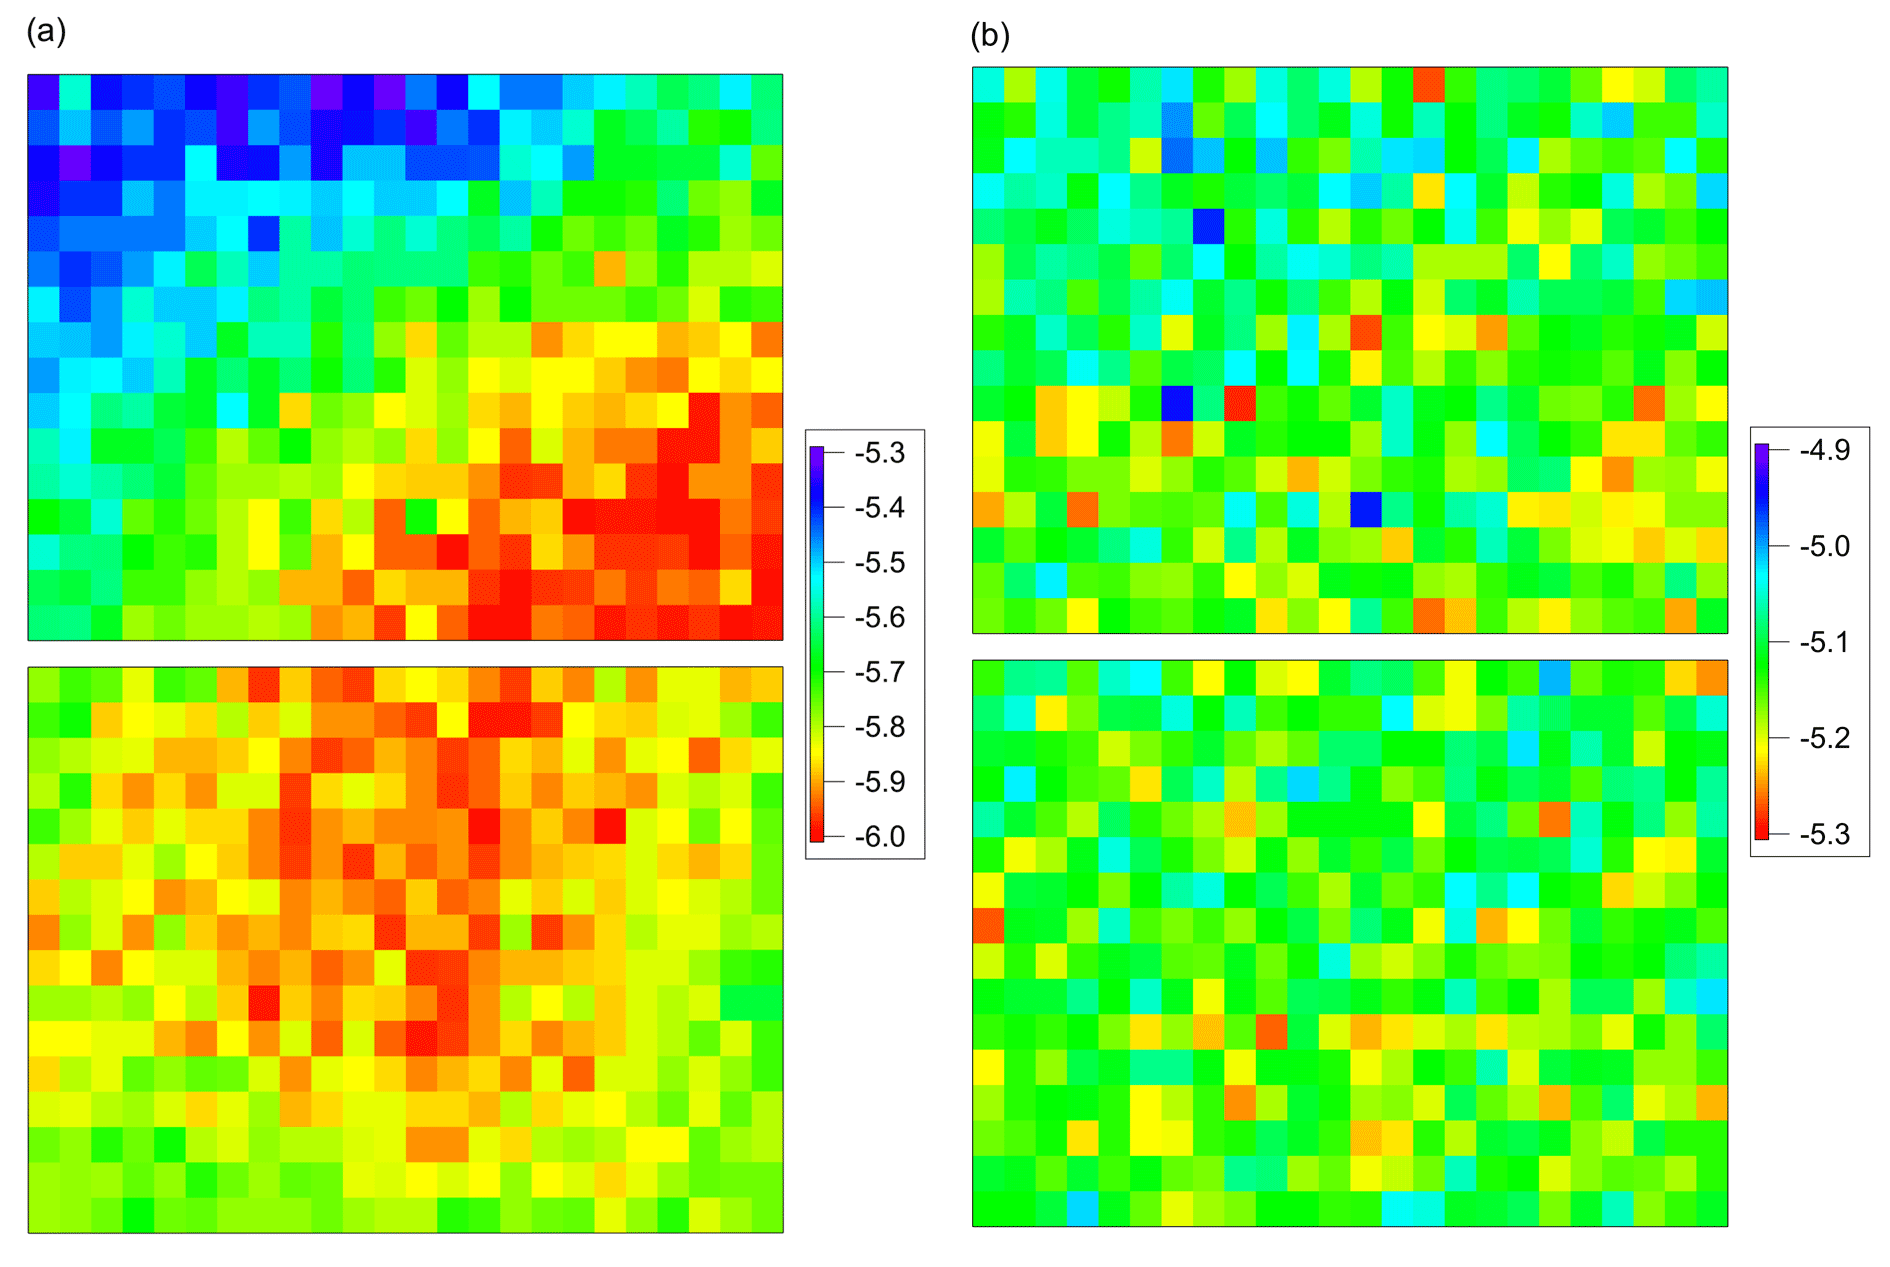
Figure 4Measurement of temperature gradient of 384-well sample holder block using Mortierella alpina 13A as calibration substance. A correction matrix was calculated to compensate for temperature gradient and offset. (a) Data before correction. (b) Data after correction.
Additionally, we used undiluted IN filtrate of Mortierella alpina 13A (see Sect. 3.2) as calibration substance, and a freezing experiment was performed as described for the biological reference materials (see Sect. 3.2). These results were used to compensate for the temperature gradient, and the thermocouple measurements were used to correct the temperature offset between gradient-corrected wells and thermistors. A correction matrix was calculated, and this matrix was used to correct subsequent freezing experiments. Figure 4 shows the results of the fungal IN filtrate measurement (a) before and (b) after correction. After correction, all fungal IN filtrate measurements showed a standard deviation of <0.06 K (δMorti). From the calibration measurements, we obtained a total uncertainty estimate of δtotal<0.2 K ().

Figure 5Sequence of infrared camera images showing 384 droplets during cooling. Red circles indicate freezing droplets.
2.3 Infrared video thermography
Droplet freezing is determined by a distinct detection system, where the temperature profile of each single droplet is tracked by infrared cameras (Seek Thermal Compact XR, Seek Thermal Inc., Santa Barbara, CA, USA) coupled to a self-written software. The camera has a resolution of 206×156 pixels, and it takes 10 pictures per second. These pictures are averaged to one picture per second. The concept enables a doubtless determination of freezing events because freezing of supercooled liquid releases energy, which leads to an abrupt rise in the detected temperature of the observed droplet, as discussed earlier (Sect. 1). This detection system uses the IR video thermography only to determine freezing events, while the proper temperature is monitored by thermistors. Figure 5 is a sequence of infrared camera images showing 384 droplets during cooling and freezing (red circles). Software analysis uses a grid of 96 and 384 points, respectively, where the grid point is set to the center of each well enabling one to fit the dimensions of each plate under different perspective angles. The temperature is tracked for each well during the experiment. A self-written algorithm detects a local maximum shortly followed by a local minimum in the derivative of the temperature profile, which is caused by the release of latent heat during freezing. The software exports the data for each droplet in CSV format.
2.4 Data analysis
Assuming ice nucleation as a time-independent (singular) process, the number concentration of IN ( active at a certain temperature (T) per unit mass of material is given by Eq. (1) (Vali, 1971a).
where s is the number of freezing events in 0.1 K bins (ΔT), a is the number of all droplets, m is the mass of the particles in the initial suspension, Vwash is the volume of the initial suspension, Vdrop is the droplet volume, and d is the dilution factor of the droplets relative to m. The measurement uncertainty ( was calculated using the counting error of s plus one digit and the Gaussian error propagation (Eq. 3).
The cumulative IN number concentration (Nm(T)) is given by Eq. (4).
The error of the cumulative IN number concentration (δNm(T)) was calculated using Eq. (5).
According to the above equations, the uncertainty is proportional to the number of frozen droplets per temperature bin. In the freezing experiments described below, the lowest number of freezing events and largest uncertainties were obtained at the lower and higher end of each dilution series (Poisson distribution). Data points with uncertainties ≥100 % were excluded (overall less than 6 % of the measurement data).
The fully automated TINA setup was tested and characterized for immersion freezing experiments with pure-water droplets, as well as Snomax® and IN filtrate of the fungus Mortierella alpina as biological reference substances. Moreover, TINA was used to study the effect of O3 and NO2 exposure on the IN activity of Snomax®. Furthermore, TINA was applied to atmospheric aerosol samples.
3.1 Pure water
Pure water was obtained from a Barnstead™ GenPure™ xCAD Plus water purification system (Thermo Scientific, Braunschweig, Germany). The water was autoclaved at 394 K (121 ∘C) for 20 min, filtered three times through a sterile 0.1 µm pore diameter sterile polyethersulfone (PES) vacuum filter unit (VWR International, Radnor, PA, USA), and autoclaved again.
For background measurements, 3 µL aliquots of autoclaved and filtered pure water were pipetted into new sterile multiwell plates by a liquid handling station. Therefore, four (96-well plate) and eight (384-well plate) different water samples were pipetted column-wise distributed into the plates. In total, six columns per sample were apportioned over the two twin plates, i.e., 48 droplets per sample in 96-well plates, and 96 droplets per sample in 384-well plates. The plates were placed in the sample holder blocks and were cooled down quickly to 273 K (0 ∘C) and, as soon as the temperature was stable for 1 min, in a continuous cooling rate of 1 K min−1 further down to 238 K (−35 ∘C).
As the phase transition from liquid water to ice is kinetically hindered, supercooled water can stay liquid at temperatures down to 235 K (−38 ∘C), where homogeneous ice nucleation takes place. This is only true for nanometer-sized droplets because the freezing temperature is dependent on droplet volume and cooling rate, and the classical nucleation theory predicts a homogeneous freezing temperature of about 240 K (−33 ∘C) for microliter-volume droplets using a cooling rate of 1 K min−1 (Fornea et al., 2009; Murray et al., 2010; Pruppacher and Klett, 1997; Tobo, 2016). However, several studies reported average freezing temperatures for microliter-volume droplets of pure water at significantly higher temperatures because of possible artifacts (e.g., Conen et al., 2011; Fröhlich-Nowoisky et al., 2015; Hill et al., 2016; Whale et al., 2015). To our knowledge, only two studies reported an average homogeneous freezing temperature of 240 K (−33 ∘C) for microliter-volume droplets and a cooling rate of 1 K min−1, using hydrophobic surfaces as a contact area for the droplets (Fornea et al., 2009; Tobo, 2016). Providing microliter droplets free of suspended IN and surfaces free of contaminants is difficult, so the temperature limit below which freezing cannot be traced back to heterogeneous IN needs to be determined individually for each setup.
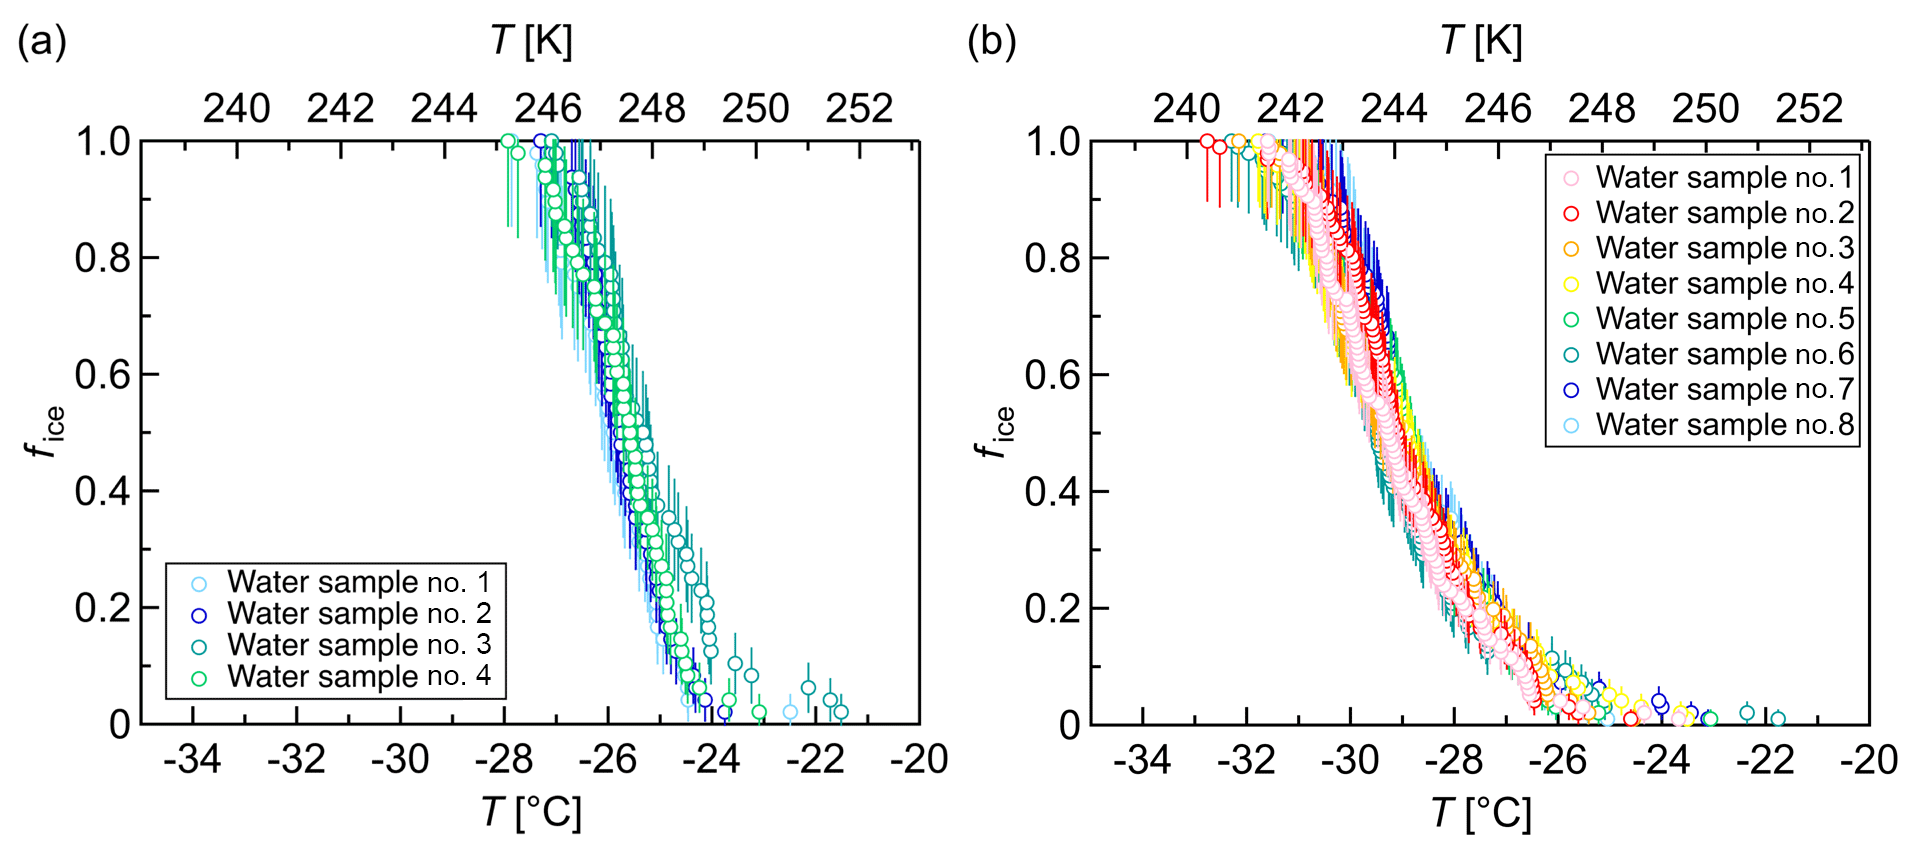
Figure 6Freezing experiments with pure-water droplets. Fraction of frozen droplets (fice) vs. temperature (T) obtained with a continuous cooling rate of 1 K min−1 and a droplet volume of 3 µL. (a) Four different samples with 48 droplets each apportioned over two 96-well plates. (b) Eight different samples with 96 droplets each apportioned over two 384-well plates. The error bars were calculated using the counting error and the Gaussian error propagation. The temperature error is 0.2 K.
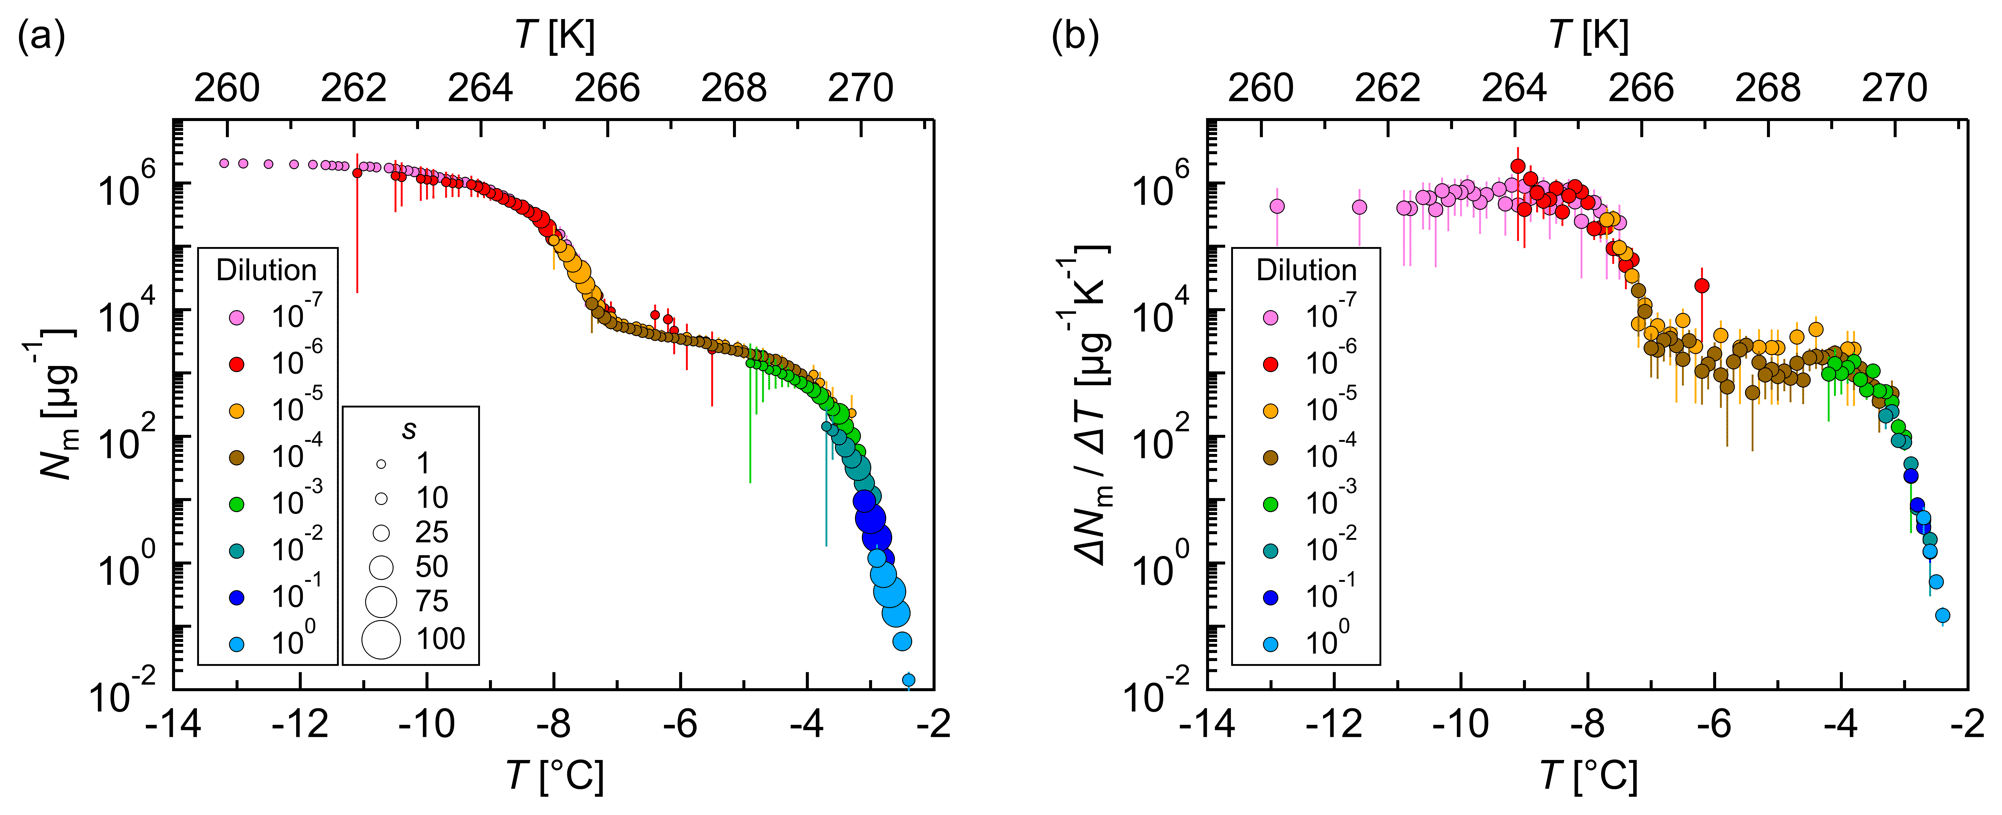
Figure 7Measurements of dilution series of bacterial IN (Snomax®). (a) Cumulative number of IN (Nm) and (b) differential number of IN (ΔNm∕ΔT) per unit mass of Snomax® vs. temperature (T). Droplets of the same dilution of three independent measurements were added to a total droplet number of 288 (3×96 droplets). Symbol colors indicate different dilutions; symbol size indicates the number of frozen droplets per 0.1 K bin (s). The error bars were calculated using the counting error and the Gaussian error propagation. The temperature error is 0.2 K.
Our results showed that most pure-water droplets froze around 248 K (−25 ∘C) in 96-well plates (Fig. 6a) and around 245 K (−28 ∘C) in 384-well plates (Fig. 6b). The 96-well plates were obtained from a different manufacturer than the 384-well plates. All in all, these freezing temperatures are substantially above the expected temperatures for homogeneous nucleation of microliter droplets, but they are in accord with the results of Whale et al. (2015).
3.2 Biological reference materials
The performance of TINA was further assessed using Snomax® as a bacterial IN-active reference substance (e.g., Budke and Koop, 2015; Hartmann et al., 2013; Möhler et al., 2008; Turner et al., 1990; Ward and DeMott, 1989) and IN filtrate of the well-studied IN fungus Mortierella alpina (Fröhlich-Nowoisky et al., 2015; Pummer et al., 2015).

Figure 8Measurements of dilution series of fungal IN (Mortierella alpina 13A). (a) Cumulative number of IN (Nm) and (b) differential number of IN (ΔNm∕ΔT) per unit mass of mycelium vs. temperature (T). Droplets of the same dilution of three independent measurements were added to a total droplet number of 288 (3×96 droplets). Symbol colors indicate different dilutions; symbol size indicates the number of frozen droplets per 0.1 K bin (s). The error bars were calculated using the counting error and the Gaussian error propagation. The temperature error is 0.2 K.
Snomax® was obtained from SMI Snow Makers AG (Thun, Switzerland), and a stock solution was prepared in pure water with an initial mass concentration of 1 mg mL−1. This suspension was then serially diluted 10-fold with pure water by the liquid handling station. The resulting Snomax® concentrations varied between 1 mg mL−1 and 0.1 ng mL−1, equivalent to a total mass of Snomax® between 3 µg and 0.3 pg, respectively, per 3 µL droplet.
Each dilution was pipetted column-wise distributed over the twin plates as described before in 96 droplets into 384-well plates by the liquid handling station. Two plates at a time were placed inside the 384-well sample holder block, and the plates were cooled down quickly to 273 K (0 ∘C) and, as soon as the temperature was stable for 1 min, in a continuous cooling rate of 1 K min−1 further down to 253 K (−20 ∘C).
Three independent experiments with Snomax® showed reproducible results (Fig. S4), and, therefore, droplets of the same dilution were added to a total droplet number of 288. The obtained results were plotted in a cumulative and a differential IN spectrum (Fig. 7). The cumulative IN number concentration represents the total number of IN active above a certain temperature. The cumulative IN spectrum showed two strong increases: around 270 K (−3 ∘C) and around 265 K (−8 ∘C). These findings are in good agreement with the results of Budke and Koop (2015). The differential IN number concentration was calculated according to Vali (1971a), and it represents the number of IN active in a particular temperature interval. The differential IN spectrum showed a similar shape as the cumulative IN spectrum with a distinct plateau between 268 and 266 K (−5 and −7 ∘C) and two slight maxima, around 269 K (−4 ∘C) and around 264 K (−9 ∘C). This indicates the presence of highly efficient IN, active at a temperature of approximately 269 K (−4 ∘C), and less-efficient IN, active around 264 K (−9 ∘C). The fact that the less-efficient IN appeared in higher dilutions implies that they occur in higher concentrations than the highly efficient IN. The presence of further IN with lower freezing temperatures and low concentrations cannot be excluded.

Figure 9Freezing experiments with ozonized and nitrated bacterial IN. Cumulative number of IN (Nm) per unit mass of Snomax® vs. temperature (T). Droplets of the same dilution of three independent measurements were added to a total droplet number of 288 (3×96 droplets). Symbol colors indicate different exposure conditions. The error bars were calculated using the counting error and the Gaussian error propagation. The temperature error is 0.2 K.
The analysis of different IN active within a wide temperature range was only possible with the measurement of a dilution series. TINA enables the simultaneous measurement of such a dilution series with high statistics in a short period of time.
Mortierella alpina 13A was grown on full-strength PDA (VWR International GmbH, Darmstadt, Germany) at 277 K (4 ∘C) for 7 months. Fungal IN filtrate was prepared as described previously (Fröhlich-Nowoisky et al., 2015; Pummer et al., 2015) and contained IN from spores and mycelial surfaces. It was serially diluted 10-fold with pure water by the liquid handling station. The experiment was performed as described above.
For test measurements with fungal IN, IN filtrate of three different culture plates from Mortierella alpina 13A was measured, and the results were reproducible (Fig. S5). The cumulative number of IN per gram mycelium only varied by 1 order of magnitude, which is a good achievement for a biological sample, and droplets of the same dilutions were added to a total droplet number of 288. A cumulative IN spectrum (Fig. 8a) and a differential IN spectrum (Fig. 8b) were plotted. The cumulative number of IN and the initial freezing temperature of 268 K (−5 ∘C) are in good agreement with the literature (Fröhlich-Nowoisky et al., 2015; Pummer et al., 2015). The cumulative and the differential IN spectra showed similar shapes with one maximum around 267 K (−6 ∘C), indicating the presence of one type of IN, which is highly efficient.
3.3 Ozonized and nitrated samples
To study the effect of O3 and NO2 exposure on the IN activity of Snomax®, an aliquot of 1 mL of a 1 mg mL−1 suspension of Snomax® in pure water was exposed in liquid phase to gases with or without O3 and NO2 as described in Liu et al. (2017).
Briefly, O3 was produced by exposing synthetic air to UV light (L.O.T.-Oriel GmbH & Co. KG, Darmstadt, Germany), and the O3 concentration was adjusted by tuning the amount of UV light. The gas flow was ∼ 1.9 L min−1, and it was mixed with N2 containing ∼5 ppmV NO2 (AIR LIQUIDE Deutschland GmbH, Düsseldorf, Germany). The NO2 concentration was regulated by the addition of the amount of the ∼5 ppmV NO2 gas. The O3 and NO2 concentrations were monitored with commercial monitoring instruments (ozone analyzer: 49i, Thermo Scientific, Braunschweig, Germany; NOx analyzer: 42i-TL, Thermo Scientific). The gas mixture was directly bubbled through 1 mL of the Snomax® solution at a flow rate of 60 mL min−1 using a Teflon tube (ID: 1.59 mm). The Snomax® solution was exposed to a mixture of 1 ppm O3 and 1 ppm NO2 for 4 h, representing the exposure to an atmospherically relevant amount of about 200 ppb each for about 20 h. The exposure experiments were performed in triplicate. After exposure, the treated samples were serially diluted and the IN activity was measured as described for the Snomax® reference measurements.
The results showed that gas exposure affected the IN activity of Snomax® (Fig. 9). High concentrations of O3 and NO2 reduced the cumulative number of IN from Snomax® between 1 and 2 orders of magnitude, while exposure to synthetic air showed smaller effects.
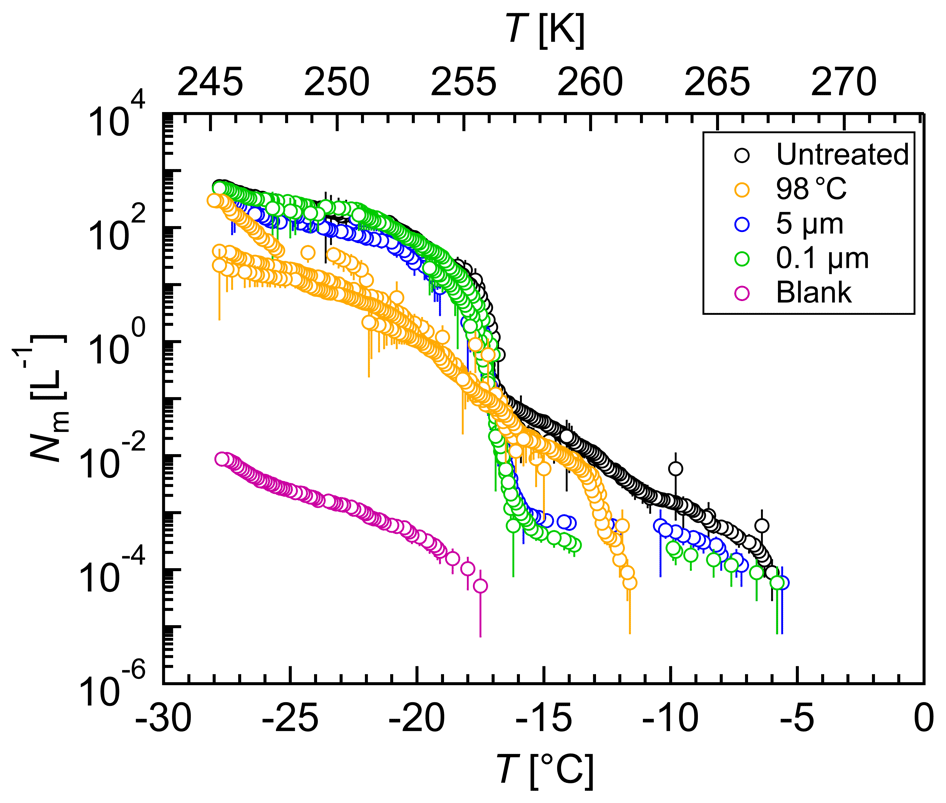
Figure 10Freezing experiments with aqueous extracts of atmospheric aerosols. Cumulative number of IN per liter air (Nm) vs. temperature (T) for untreated (black), heated (yellow), 5 µm filtered (blue), 0.1 µm filtered (green), and blank (magenta) filter extracts. Droplets of the same dilution of two aliquots were added to a total droplet number of 192 (2×96 droplets). The error bars were calculated using the counting error and the Gaussian error propagation. The temperature error is 0.2 K.
Snomax® contains IN proteins of the bacterium Pseudomonas syringae. Attard et al. (2012) found no significant or only weak effects of exposure to ∼100 ppb O3 and ∼100 ppb NO2 on the IN activity of two strains of P. syringae, and a variable response of a third strain, suggesting a strain-specific response.
3.4 Air filter samples
Total suspended particle samples were collected onto 150 mm glass fiber filters (Type MN 85/90, Macherey-Nagel GmbH, Düren, Germany) using a high-volume sampler (DHA-80, Digitel Elektronik AG, Hegnau, Switzerland) operated at 1000 L min−1, which was placed on the roof of the Max Planck Institute for Chemistry (Mainz, Germany). There, a mix of urban and rural continental boundary layer air can be sampled in central Europe. The filter was taken in April 2018, and the sampling period was seven days, corresponding to a total air volume of approximately 10 000 m3. Filters were pre-baked at 603 K (330 ∘C) for 10 h to remove any biological material, and blank samples were taken to detect possible contaminations. All filters were packed in pre-baked aluminum bags, and loaded filters were stored at 193 K (−80 ∘C) until analysis.
An aerosol and a blank filter were cut with a sterilized scissor into aliquots (), and the exact percentage was determined gravimetrically. For reproducibility, two filter sample aliquots of each filter were extracted. Each filter sample aliquot was transferred into a sterile 50 mL tube (Greiner Bio-One, Kremsmünster, Austria), and 10 mL of pure water was added. The tubes were shaken horizontally at 200 rpm for 15 min. Afterwards, the filter was removed, and the aqueous extract was tested for IN activity. To further characterize the IN, the effects of filtration and heat treatment were investigated. Therefore, aliquots of the extract were treated as follows: (i) 1 h at 371 K (98 ∘C), (ii) filtration through a 5 µm pore diameter filter (Acrodisc®, PES, Pall GmbH, Dreieich, Germany), (iii) filtration through a 5 and a 0.1 µm pore diameter filter (Acrodisc®).
Each solution (96 aliquots of 3 µL) was pipetted column-wise into 384-well plates by the liquid handling station. The plates were cooled down quickly to 273 K (0 ∘C) and, as soon as the temperature was stable for 1 min, at a continuous cooling rate of 1 K min−1 further down to 243 K (−30 ∘C).
Each solution of the two aliquots of each filter was measured separately, and droplets of the same solution were added to a total droplet number of 192 (2×96 droplets) (Figs. 10 and S6). All IN concentrations were calculated per liter air.
The untreated filter extract showed IN activity at relatively high temperatures with an initial freezing temperature of 267 K (−6 ∘C). The concentration of IN active at temperatures above 263 K (−10 ∘C) was about 0.001 L−1, but heat treatment led to a loss of IN activity above 263 K (−10 ∘C). Because the activity of known biological IN results from proteins or proteinaceous compounds (Green and Warren, 1985; Kieft and Ruscetti, 1990; Pouleur et al., 1992; Tsumuki and Konno, 1994) and proteins are known to be heat-sensitive, the results suggest the presence of biological IN. The concentration of IN between 263 K (−10 ∘C) and 257 K (−16 ∘C) increased about 2 orders of magnitude and in a sudden increase another 2 orders between 257 K (−16 ∘C) and 256 K (−17 ∘C). The IN concentration below 256 K (−17 ∘C) increased continuously up to about 500 L−1, but heat treatment reduced the IN concentration of up to 1 order of magnitude below 256 K (−17 ∘C). Filtration experiments did not affect the initial freezing temperature, but the concentration of biological IN decreased significantly. The results suggest the presence of many biological IN or agglomerates larger than 5 µm and of a few biological IN smaller than 0.1 µm. The cumulative number of IN active between 263 K (−10 ∘C) and 257 K (−16 ∘C) decreased up to 2 orders of magnitude upon filtration, but the IN concentration below 256 K (−17 ∘C) was not affected. The findings show that many IN active between 263 K (−10 ∘C) and 257 K (−16 ∘C) were larger than 5 µm, whereas IN active below 256 K (−17 ∘C) were smaller than 0.1 µm.
The new high-throughput droplet freezing assay TINA was introduced to study heterogeneous ice nucleation of microliter-range droplets in the immersion mode. TINA provides the analysis of 960 droplets simultaneously or 192 and 768 droplets in two independent experiments at the same time, enabling the analysis of many samples with high statistics in a short period of time. Moreover, an infrared camera-based detection system allows the reliable determination of droplet freezing. The setup was tested with Snomax® as bacterial IN and IN filtrate of Mortierella alpina as fungal IN. For these reference materials, both the initial freezing temperature and the cumulative number of IN per gram unit mass were in good agreement with the literature, which demonstrates the functionality of the new setup.
TINA was applied to study the effect of O3 and NO2 exposure on the IN activity of Snomax®, where high concentrations of O3 and NO2 reduced the IN activity significantly. Atmospheric aerosol samples from Mainz (Germany) were analyzed for IN activity to show the applicability of TINA for field samples. Here, the results suggest that most of the biological IN were larger than 5 µm. Moreover, many IN active between 263 K (−10 ∘C) and 257 K (−16 ∘C) were larger than 5 µm, whereas IN active below 256 K (−17 ∘C) were smaller than 0.1 µm. The results confirm that TINA is suitable for high-throughput experiments and efficient analysis of biological IN in laboratory and field samples.
All data are available from the corresponding authors upon request.
The supplement related to this article is available online at: https://doi.org/10.5194/amt-11-6327-2018-supplement.
ATK, ML, and FH developed the instrument. ATK, UP, JFN conceived and designed the experiments. ATK performed the experiments. MLP wrote the code to process the data and did the error calculation. All authors discussed the data and contributed to the writing of the manuscript.
The authors declare that they have no conflict of interest.
This article is part of the special issue “Results from the ice nucleation research unit (INUIT) (ACP/AMT inter-journal SI)”. It is not associated with a conference.
The authors thank Christian Gurk, Thomas Klimach, Florian Rubach, Frank Kunz,
and the workshop team for supporting the experimental setup, Nina-Maria
Kropf, Carola Sophie Krevert, Isabel Maurus, Gila Maren Kopper, and Petya
Yordanova for technical support, and Hinrich Grothe, Thomas Koop, Thomas
Berkemeier, Alex Huffman, Daniel Andrew Pickersgill, Naama Lang-Yona, and Jan
Frederik Scheel for helpful discussions. The Max Planck Society
(MPG) and the Ice Nuclei Research Unit of the Deutsche Forschungsgemeinschaft
(DFG FR 3641/1-2, FOR 1525 INUIT) are acknowledged for financial support.
The article processing charges for this
open-access
publication were covered by the Max Planck
Society.
Edited by: Mingjin
Tang
Reviewed by: two anonymous referees
Attard, E., Yang, H., Delort, A.-M., Amato, P., Pöschl, U., Glaux, C., Koop, T., and Morris, C. E.: Effects of atmospheric conditions on ice nucleation activity of Pseudomonas, Atmos. Chem. Phys., 12, 10667–10677, https://doi.org/10.5194/acp-12-10667-2012, 2012.
Ball, M. C., Wolfe, J., Canny, M., Hofmann, M., Nicotra, A. B., and Hughes, D.: Space and time dependence of temperature and freezing in evergreen leaves, Funct. Plant. Biol., 29, 1259–1272, 2002.
Bauerecker, S., Ulbig, P., Buch, V., Vrbka, L., and Jungwirth, P.: Monitoring ice nucleation in pure and salty water via high-speed imaging and computer simulations, J. Phys. Chem. C, 112, 7631–7636, https://doi.org/10.1021/jp711507f, 2008.
Boucher, O., Randall, D., Artaxo, P., Bretherton, C., Feingold, G., Forster, P., Kerminen, V.-M., Kondo, Y., Liao, H., Lohmann, U., Rasch, P., Satheesh, S. K., Sherwood, S., Stevens, B., and Zhang, X. Y.: Clouds and Aerosols, in: Climate Change 2013: The Physical Science Basis. Contribution of Working Group I to the Fifth Assessment Report of the Intergovernmental Panel on Climate Change, edited by: Stocker, T. F., Qin, D., Plattner, G.-K., Tignor, M., Allen, S. K., Boschung, J., Nauels, A., Xia, Y., And, V. B., and Midgley, P. M., 571–657, Cambridge University Press, Cambridge, United Kingdom and New York, NY, USA, 2013.
Budke, C. and Koop, T.: BINARY: an optical freezing array for assessing temperature and time dependence of heterogeneous ice nucleation, Atmos. Meas. Tech., 8, 689–703, https://doi.org/10.5194/amt-8-689-2015, 2015.
Carter, J., Brennan, R., and Wisniewski, M.: Low-temperature tolerance of blackcurrant flowers, HortScience, 34, 855–859, 1999.
Ceccardi, T. L., Heath, R. L., and Ting, I. P.: Low-temperature exotherm measurement using infrared thermography, HortScience, 30, 140–142, 1995.
Charrier, G., Nolf, M., Leitinger, G., Charra-Vaskou, K., Losso, A., Tappeiner, U., Améglio, T., and Mayr, S.: Monitoring of Freezing Dynamics in Trees: A Simple Phase Shift Causes Complexity, Plant Physiol., 173, 2196–2207, https://doi.org/10.1104/pp.16.01815, 2017.
Conen, F., Morris, C. E., Leifeld, J., Yakutin, M. V., and Alewell, C.: Biological residues define the ice nucleation properties of soil dust, Atmos. Chem. Phys., 11, 9643–9648, https://doi.org/10.5194/acp-11-9643-2011, 2011.
Emteborg, H., Zeleny, R., Charoud-Got, J., Martos, G., Lüddeke, J., Schellin, H., and Teipel, K.: Infrared thermography for monitoring of freeze-drying processes: Instrumental developments and preliminary results, J. Pharm. Sci., 103, 2088–2097, https://doi.org/10.1002/jps.24017, 2014.
Fornea, A. P., Brooks, S. D., Dooley, J. B., and Saha, A.: Heterogeneous freezing of ice on atmospheric aerosols containing ash, soot, and soil, J. Geophys. Res.-Atmos., 114, 1–12, https://doi.org/10.1029/2009JD011958, 2009.
Fröhlich-Nowoisky, J., Hill, T. C. J., Pummer, B. G., Yordanova, P., Franc, G. D., and Pöschl, U.: Ice nucleation activity in the widespread soil fungus Mortierella alpina, Biogeosciences, 12, 1057–1071, https://doi.org/10.5194/bg-12-1057-2015, 2015.
Fuller, M. and Wisniewski, M.: The use of infrared thermal imaging in the study of ice nucleation and freezing of plants, J. Therm. Biol., 23, 81–89, https://doi.org/10.1016/S0306-4565(98)00013-8, 1998.
Gallego, B., Verdú, J. R., Carrascal, L. M., and Lobo, J. M.: A protocol for analysing thermal stress in insects using infrared thermography, J. Therm. Biol., 56, 113–121, https://doi.org/10.1016/j.jtherbio.2015.12.006, 2016.
Gómez Muñoz, C. Q., García Márquez, F. P., and Sánchez Tomás, J. M.: Ice detection using thermal infrared radiometry on wind turbine blades, Measurement, 93, 157–163, https://doi.org/10.1016/j.measurement.2016.06.064, 2016.
Green, R. L. and Warren, G. J.: Physical and functional repetition in a bacterial ice nucleation gene, Nature, 317, 645–648, https://doi.org/10.1038/317645a0, 1985.
Hacker, J. and Neuner, G.: Ice propagation in plants visualized at the tissue level by infrared differential thermal analysis (IDTA), Tree Physiol., 27, 1661–70, https://doi.org/10.1093/treephys/27.12.1661, 2007.
Hansman, R. J. and Dershowitz, A. L.: Method of and apparatus for detection of ice accretion, United States Patent, Massachusetts Institute of Technology, Patent Number: 5 313 202, 1994.
Harrison, A. D., Whale, T. F., Rutledge, R., Lamb, S., Tarn, M. D., Porter, G. C. E., Adams, M. P., McQuaid, J. B., Morris, G. J., and Murray, B. J.: An instrument for quantifying heterogeneous ice nucleation in multiwell plates using infrared emissions to detect freezing, Atmos. Meas. Tech., 11, 5629–5641, https://doi.org/10.5194/amt-11-5629-2018, 2018.
Hartmann, S., Augustin, S., Clauss, T., Wex, H., Šantl-Temkiv, T., Voigtländer, J., Niedermeier, D., and Stratmann, F.: Immersion freezing of ice nucleation active protein complexes, Atmos. Chem. Phys., 13, 5751–5766, https://doi.org/10.5194/acp-13-5751-2013, 2013.
Häusler, T., Witek, L., Felgitsch, L., Hitzenberger, R., and Grothe, H.: Freezing on a Chip – A New Approach to Determine Heterogeneous Ice Nucleation of Micrometer-Sized Water Droplets, Atmosphere-Basel, 9, 140, https://doi.org/10.3390/atmos9040140, 2018.
Hill, T. C. J., DeMott, P. J., Tobo, Y., Fröhlich-Nowoisky, J., Moffett, B. F., Franc, G. D., and Kreidenweis, S. M.: Sources of organic ice nucleating particles in soils, Atmos. Chem. Phys., 16, 7195–7211, https://doi.org/10.5194/acp-16-7195-2016, 2016.
Kieft, T. L. and Ruscetti, T.: Characterization of Biological Ice Nuclei from a Lichen, J. Bacteriol., 172, 3519–3523, 1990.
Kunert, A. T., Scheel, J. F., Helleis, F., Klimach, T., Pöschl, U., and Fröhlich-Nowoisky, J.: New High-Performance Droplet Freezing Assay (HP-DFA) for the Analysis of Ice Nuclei with Complex Composition, in EGU General Assembly Conference Abstracts, vol. 18, EPSC2016-6293, 2016a.
Kunert, A. T., Scheel, J. F., Helleis, F., Klimach, T., Pöschl, U., and Fröhlich-Nowoisky, J.: TINA: A New High-Performance Droplet Freezing Assay for the Analysis of Ice Nuclei with Complex Composition, in: 4th Workshop – Microphysics of Ice Clouds, 2016b.
Kunert, A. T., Lamneck, M., Gurk, C., Helleis, F., Klimach, T., Scheel, J. F., Pöschl, U., and Fröhlich-Nowoisky, J.: TINA, a new fully automated high-performance droplet freezing assay coupled to a customized infrared detection system, in: EGU General Assembly Conference Abstracts, vol. 19, p. 13571, 2017a.
Kunert, A. T., Lamneck, M., Gurk, C., Helleis, F., Klimach, T., Scheel, J. F., Pöschl, U., and Fröhlich-Nowoisky, J.: TINA, a new fully automated high-performance droplet freezing assay coupled to a customized infrared detection system, in: 5th Workshop – Microphysics of Ice Clouds, 2017b.
Kunert, A. T., Lamneck, M., Helleis, F., Scheel, J. F., Pöschl, U., and Fröhlich-Nowoisky, J.: TINA: Twin-plate ice nucleation assay with infrared detection for high-throughput droplet freezing experiments, in: INUIT Final Conference and 2nd Atmospheric Ice Nucleation Conference, 2018.
Liu, F., Lakey, P., Berkemeier, T., Tong, H., Kunert, A. T., Meusel, H., Su, H., Cheng, Y., Fröhlich-Nowoisky, J., Lai, S., Weller, M. G., Shiraiwa, M., Pöschl, U., and Kampf, C. J.: Atmospheric protein chemistry influenced by anthropogenic air pollutants: nitration and oligomerization upon exposure to ozone and nitrogen dioxide, Faraday Discuss., 200, 413–427, https://doi.org/10.1039/C7FD00005G, 2017.
Möhler, O., Georgakopoulos, D. G., Morris, C. E., Benz, S., Ebert, V., Hunsmann, S., Saathoff, H., Schnaiter, M., and Wagner, R.: Heterogeneous ice nucleation activity of bacteria: new laboratory experiments at simulated cloud conditions, Biogeosciences, 5, 1425–1435, https://doi.org/10.5194/bg-5-1425-2008, 2008.
Murray, B. J., Broadley, S. L., Wilson, T. W., Bull, S. J., Wills, R. H., Christenson, H. K., and Murray, E. J.: Kinetics of the homogeneous freezing of water, Phys. Chem. Chem. Phys., 12, 10380–10387, https://doi.org/10.1039/c003297b, 2010.
O'Sullivan, D., Murray, B. J., Malkin, T. L., Whale, T. F., Umo, N. S., Atkinson, J. D., Price, H. C., Baustian, K. J., Browse, J., and Webb, M. E.: Ice nucleation by fertile soil dusts: relative importance of mineral and biogenic components, Atmos. Chem. Phys., 14, 1853–1867, https://doi.org/10.5194/acp-14-1853-2014, 2014.
Pearce, R. S. and Fuller, M. P.: Freezing of Barley Studied by Infrared Video Thermography, Plant Physiol., 125, 227–240, 2001.
Pouleur, S., Richard, C., Martin, J. G., and Antoun, H.: Ice Nucleation Activity in Fusarium acuminatum and Fusarium avenaceum, Appl. Environ. Microbiol., 58, 2960–2964, 1992.
Pruppacher, H. R. and Klett, J. D.: Microphysics of Clouds and Precipitation, 2nd edn., Springer Netherlands, Dordrecht, 1997.
Pummer, B. G., Budke, C., Augustin-Bauditz, S., Niedermeier, D., Felgitsch, L., Kampf, C. J., Huber, R. G., Liedl, K. R., Loerting, T., Moschen, T., Schauperl, M., Tollinger, M., Morris, C. E., Wex, H., Grothe, H., Pöschl, U., Koop, T., and Fröhlich-Nowoisky, J.: Ice nucleation by water-soluble macromolecules, Atmos. Chem. Phys., 15, 4077–4091, https://doi.org/10.5194/acp-15-4077-2015, 2015.
Sekozawa, Y., Sugaya, S., and Gemma, H.: Observations of Ice Nucleation and Propagation in Flowers of Japanese Pear (Pyrus pyrifolia Nakai) using Infrared Video Thermography, J. Japan. Soc. Hort. Sci., 73, 1–6, https://doi.org/10.1248/cpb.37.3229, 2004.
Stier, J. C., Filiault, D. L., Wisniewski, M., and Palta, J. P.: Visualization of freezing progression in turfgrasses using infrared video thermography, Crop. Sci., 43, 415–420, 2003.
Stopelli, E., Conen, F., Zimmermann, L., Alewell, C., and Morris, C. E.: Freezing nucleation apparatus puts new slant on study of biological ice nucleators in precipitation, Atmos. Meas. Tech., 7, 129–134, https://doi.org/10.5194/amt-7-129-2014, 2014.
Tobo, Y.: An improved approach for measuring immersion freezing in large droplets over a wide temperature range, Sci. Rep., 6, 32930, https://doi.org/10.1038/srep32930, 2016.
Tsumuki, H. and Konno, H.: Ice Nuclei Produced by Fusarium sp. Isolated from the Gut of the Rice Stem Borer, Chilo suppressalis Walker (Lepidoptera: Pyralidae), Biosci. Biotechnol. Biochem., 58, 578–579, 1994.
Turner, M. A., Arellano, F., and Kozloff, L. M.: Three separate classes of bacterial ice nucleation structures, J. Bacteriol., 172, 2521–2526, 1990.
Vali, G.: Quantitative Evaluation of Experimental Results an the Heterogeneous Freezing Nucleation of Supercooled Liquids, J. Atmos. Sci., 28, 402–409, https://doi.org/10.1175/1520-0469(1971)028<0402:QEOERA>2.0.CO;2, 1971a.
Vali, G.: Supercooling of Water and Nucleation of Ice (Drop Freezer), Am. J. Phys., 39, 1125, https://doi.org/10.1119/1.1976585, 1971b.
Ward, P. J. and DeMott, P. J.: Preliminary experimental evaluation of Snomax snow inducer, Pseudomonas syringae, as an artificial ice nucleus for weather modification, J. Weather Modif., 21, 9–13, 1989.
Whale, T. F., Murray, B. J., O'Sullivan, D., Wilson, T. W., Umo, N. S., Baustian, K. J., Atkinson, J. D., Workneh, D. A., and Morris, G. J.: A technique for quantifying heterogeneous ice nucleation in microlitre supercooled water droplets, Atmos. Meas. Tech., 8, 2437–2447, https://doi.org/10.5194/amt-8-2437-2015, 2015.
Wisniewski, M., Lindow, S. E., and Ashworth, E. N.: Observations of Ice Nucleation and Propagation in Plants Using Infrared Video Thermography, Plant Physiol., 113, 327–334, 1997.
Wisniewski, M., Glenn, D. M., Gusta, L., and Fuller, M. P.: Using Infrared Thermography to Study Freezing in Plants, HortScience, 43, 1648–1651, 2008.
Workmaster, B.: Ice nucleation and propagation in cranberry uprights and fruit using infrared video thermography, J. Amer. Soc. Hort. Sci., 124, 619–625, 1999.
Wright, T. P. and Petters, M. D.: The role of time in heterogeneous freezing nucleation, J. Geophys. Res.-Atmos., 118, 3731–3743, https://doi.org/10.1002/jgrd.50365, 2013.
Zaragotas, D., Liolios, N. T., and Anastassopoulos, E.: Supercooling, ice nucleation and crystal growth: A systematic study in plant samples, Cryobiology, 72, 239–243, https://doi.org/10.1016/j.cryobiol.2016.03.012, 2016.