the Creative Commons Attribution 4.0 License.
the Creative Commons Attribution 4.0 License.
 | 07 Feb 2018
Evaluation of a low-cost optical particle counter (Alphasense OPC-N2) for ambient air monitoring
Leigh R. Crilley
Marvin Shaw
Ryan Pound
Louisa J. Kramer
Robin Price
Stuart Young
Alastair C. Lewis
A fast-growing area of research is the development of low-cost sensors for measuring air pollutants. The affordability and size of low-cost particle sensors makes them an attractive option for use in experiments requiring a number of instruments such as high-density spatial mapping. However, for these low-cost sensors to be useful for these types of studies their accuracy and precision need to be quantified. We evaluated the Alphasense OPC-N2, a promising low-cost miniature optical particle counter, for monitoring ambient airborne particles at typical urban background sites in the UK. The precision of the OPC-N2 was assessed by co-locating 14 instruments at a site to investigate the variation in measured concentrations. Comparison to two different reference optical particle counters as well as a TEOM-FDMS enabled the accuracy of the OPC-N2 to be evaluated. Comparison of the OPC-N2 to the reference optical instruments shows some limitations for measuring mass concentrations of PM1, PM2.5 and PM10. The OPC-N2 demonstrated a significant positive artefact in measured particle mass during times of high ambient RH (> 85 %) and a calibration factor was developed based upon κ-Köhler theory, using average bulk particle aerosol hygroscopicity. Application of this RH correction factor resulted in the OPC-N2 measurements being within 33 % of the TEOM-FDMS, comparable to the agreement between a reference optical particle counter and the TEOM-FDMS (20 %). Inter-unit precision for the 14 OPC-N2 sensors of 22 ± 13 % for PM10 mass concentrations was observed. Overall, the OPC-N2 was found to accurately measure ambient airborne particle mass concentration provided they are (i) correctly calibrated and (ii) corrected for ambient RH. The level of precision demonstrated between multiple OPC-N2s suggests that they would be suitable devices for applications where the spatial variability in particle concentration was to be determined.
- Article
(2673 KB) -
Supplement
(1418 KB) - BibTeX
- EndNote


Airborne particles are of global concern due to their detrimental health effects, particularly in the fine fraction (PM2.5, particles with an aerodynamic diameter less than 2.5 µm) and as a result are a regulated pollutant in the EU, USA and other states. Monitoring ambient particle mass concentrations is typically performed using a small number of fixed instruments with gaps in the spatial coverage usually estimated via modelling or interpolation. This is often unsatisfactory as there can be micro-environments in urban areas that result in large spatial and temporal inhomogeneity in airborne particle concentrations, which in turn makes assessment of human exposure to airborne particles difficult (de Nazelle et al., 2017).
Into this gap a fast-growing area is the development of low-cost sensors for measuring the concentrations of a wide range of species in the atmosphere including gases and particles (Lewis et al., 2016; Rai et al., 2017; Snyder et al., 2013). However, the question remains as to whether the uncertain quality of data from these low-cost sensors can be of value when attempting to determine pollutant concentrations at high spatial resolution (Kumar et al., 2015). Sensors for both gases and particles can suffer from drift and a number of interference artefacts such as relative humidity (RH), temperature and other gas-phase species (Lewis et al., 2016; Mueller et al., 2017; Popoola et al., 2016). Despite these challenges, recent work has shown that low-cost gas sensors can be deployed in large-scale networks provided appropriate corrections for known artefacts are applied (Borrego et al., 2016; Mead et al., 2013; Mueller et al., 2017), with clustering of multiple gas sensors into one unit shown to be an effective methodology (Lewis et al., 2016; Mueller et al., 2017; Smith et al., 2017).
For low-cost particle sensors, their reported performance across the literature is somewhat mixed (Borrego et al., 2016; Castellini et al., 2014; Sousan et al., 2016; Viana et al., 2015) and can depend on the type of particle sensor employed. There are a wide range of low-cost particle sensors available commercially from manufacturers including Dylos, TSI, Airsense and Alphasense. The more widely used and available low-cost particle sensors can be considered as miniaturised versions of optical particle counters (OPCs) and employ a light-scattering technique to measure ambient particle concentrations (see e.g. Gao et al., 2015; Sousan et al., 2016). While these miniature OPCs are not meant to compete with more established instrumentation in terms of their accuracy and precision, their affordability and size makes them attractive for use in experiments requiring a number of such instruments, such as personal monitoring (see e.g. de Nazelle et al., 2017; Steinle et al., 2015). However, to be useful in these types of studies, the precision and accuracy of these instruments needs to be evaluated.
Laboratory assessments of the performance of a number of low-cost miniature OPCs have shown promising results, with adequate precision observed compared to reference instrumentation (Manikonda et al., 2016). Sousan et al. (2016) evaluated the Alphasense OPC-N2 in a laboratory study using reference aerosols (Arizona road dust, NaCl and welding fumes) and found reasonable agreement for size distributions and particle mass between the OPC-N2 and a GRIMM portable aerosol spectrophotometer, provided appropriate and specific calibrations were applied. While these results are encouraging (Manikonda et al., 2016; Sousan et al., 2016), laboratory-based studies using reference aerosols may not be representative of their performance when measuring ambient particles, owing in part to the complex mixture and variable relative humidity and temperature encountered in the real world. Previous field testing of low-cost particle sensors has found that the Dylos (Steinle et al., 2015) and Portable University of Washington Particle (PUWP) monitors (Gao et al., 2015) performed well for ambient sampling of particle mass concentration in both an urban and rural environment when compared to reference instruments; however they were assessed over a short period (4–5 days). In contrast, at a roadside location poor agreement between two different OPC sensors compared to reference instruments was observed by Borrego et al. (2016). Clearly, the results are mixed and longer-term assessment of the stability and longevity of these instruments are needed, as these are critical parameters when considering their worth for use in large-scale networks.
We evaluate here the Alphasense OPC-N2, a promising low-cost miniature optical particle counter (Sousan et al., 2016), for monitoring ambient airborne particles at typical urban background sites in the UK. We assessed the inter-unit precision of the OPC-N2 by co-locating 14 instruments at a single site to investigate the variation in measured particle mass concentration in the PM10, PM2.5 and PM1 size fractions between OPC-N2 instruments. In order to determine the accuracy of the OPC-N2, we compared it to two well-established commercial optical particle counters that employ a similar light-scattering technique as well as a TEOM-FDMS, a regulatory standard instrument for particle mass concentration measurements.
2.1 Instrumentation
2.1.1 Alphasense optical particle sensor (OPC-N2)
The optical particle sensor (OPC) under evaluation in the current work is the OPC-N2 manufactured commercially by Alphasense (http://www.alphasense.com) and is described in detail in Sousan et al. (2016). The OPC-N2 can be considered as a miniaturised OPC as it measures 75 mm × 60 mm × 65 mm and weighs under 105 g, and as such is significantly cheaper (approx. GBP 250) than the comparable reference instruments (see next section). The OPC-N2 samples via small fan aspirator and measures particle number concentration over a reported size range of 0.38 to 17 µm across 16 size bins, and maximum particle count of 10 000 s−1. The minimum time resolution is 10 s. The measured particle number concentration is converted via on-board factory calibration to particle mass concentrations for PM1, PM2.5 and PM10 size fraction according to European Standard EN481 (OPC-N2 manual). According the OPC-N2 manual, the standard definition for PM10 in EN481 extends beyond the particle size measured by the OPC-N2 and may consequently underestimate PM10 value by up to 10 %. Further discussion on calculations for conversion from particle number to mass concentrations is given in Sect. 2.3. All OPC-N2s in this study used firmware version 18.
The OPC-N2 is designed to log data via a laptop using software supplied by Alphasense; however, this may not be practical when using multiple OPC-N2s at once or for personal monitoring. Therefore, we developed a custom built system for logging the OPC-N2 during the inter-comparison, utilising either a Raspberry Pi 3 or Arduino system. The Python code to log the outputs from OPC-N2 on a Raspberry Pi 3 is made available in the Supplement. The Python code makes use of the py-opc Python library for operating the OPC-N2 written by Hagan (2017).
2.1.2 Reference instruments
The first reference instrument was a TSI 3330 optical particle spectrophotometer (OPS), which measures particles number concentrations between 0.3 and 10 µm across 16 size bins, with a maximum particle count of 3000 particles cm−3. A GRIMM portable aerosol spectrometer (PAS-1.108, hereafter referred to as the GRIMM) was also utilised, which records particle number concentrations in 15 bins from 0.3 to 20 µm. The TSI 3330 and GRIMM were both recently calibrated and serviced. All measurements of airborne particle concentrations are inherently operationally defined and as a result the TSI 3330 and the GRIMM were chosen as reference instruments as they measure particle size in similar size bins by a similar photometric technique to the Alphasense OPC-N2.
For the sake of this inter-comparison, we have taken the TSI 3330 and GRIMM data as an accurate measure of particle mass concentrations. The reference instrument used for the factory calibration of the OPC-N2 by Alphasense is the TSI 3330 (Sousan et al., 2016) and hence included for comparison.
2.2 Inter-comparison locations
2.2.1 Elms Rd Observatory Station
The instruments were housed within the Elms Road Observatory Station (EROS), located on the University of Birmingham campus. The site is classed as urban background, with emissions from nearby road and a construction site the major sources of particles. Fourteen OPC-N2s were deployed at EROS, enabling the precision of the OPC-N2 to be assessed along with the accuracy relative to the reference instruments, the TSI 3330 and GRIMM. An intensive inter-comparison ran for just over 5 weeks, from 26 August until 3 October 2016, during which all 14 OPC-N2s, the TSI 3330 and the GRIMM sampled ambient air. Minimal lengths (12 cm) of stainless steel tubing (OPC-N2) and conductive black tubing (TSI 3330 and GRIMM) were used to sample outside air, with each OPC having its own inlet at a height of 1.5 m. The vertical inlet for the TSI 3330 necessitated a bend in the tubing; however the calculated sampling efficiency (using von der Weiden et al., 2009) was 92 % for particles with a diameter of 10 µm. Therefore, while the inlet arrangement of the TSI 3330 may have affected the inter-comparison, particularly when considering the accuracy of the OPC-N2, we were limited to what was practical. Sampling intervals for the OPC-N2, TSI 3330 and GRIMM were 10, 60 and 6 s, respectively. In addition, RH measurements from the nearby Elms Road Meteorological station were also obtained which is located approximately 100 m away from EROS.
At the conclusion of the intensive inter-comparison, a subset of the OPC-N2 (5) continued to sample at EROS along with the GRIMM, to test the robustness and suitability of the OPC-N2 for longer-term monitoring. The long-term monitoring concluded on 1 February 2017, meaning that these OPC-N2s sampled ambient air for up to 5 months.
2.2.2 Tyburn Rd
For regulatory purposes, an accepted method for measuring particle mass concentrations is a tapered element oscillating microbalance (TEOM), and therefore we also compared the OPC-N2 to this technique despite the difference in particle measurement approaches. An urban background air monitoring station part of the UK Automatic and Rural Urban Network (AURN) nearby EROS (Tyburn Rd) was chosen for this inter-comparison. At the Tyburn Rd AURN station, the TEOM monitor was fitted with a filter dynamic measurement system (FDMS) (Grover et al., 2006), to correct for semi-volatile particle loss. A subset of OPC-N2s (4) and the GRIMM PAS 1.108 that were deployed at EROS sampled at Tyburn Rd station for 2 weeks during February 2017. The OPC-N2 was housed individually within waterproof boxes on the roof of the cabin near to the TEOM inlet in order to keep the inlet length the same as used at EROS. The GRIMM sampled from a nearby separate inlet.
2.3 Data analysis
All OPCs employed in this study count the number of particles and determine the size based upon particle light scattering of a laser, and to convert to particle mass concentration they must apply a number of assumptions. To calculate the particle mass concentration, spherical particles of a uniform density and shape are assumed, which is not strictly true for airborne particles in an urban atmosphere but is considered a standard approximation. Therefore to ensure a fair comparison between the different OPC, the same calculations and assumptions must be applied to all three OPC measurements. The TSI 3330 data were processed using the TSI AIM software to convert the particle count concentration to particle mass measurements. The particle counts from the GRIMM data were converted to particle mass (via particle volume) using the same calculations, as outlined in the TSI AIM software manual according to Eqs. (1) to (3):
where Dpv is the volume weighted diameter, LB the channel lower boundary, UB the channel upper boundary, v is the particle volume for a channel, n is number weighted concentration per channel, m is the particle mass per channel and ρ is the particle density.
The OPC-N2 converts, on board via a factory determined calibration, particle counts to particle mass concentration in PM1, PM2.5 and PM10 mass concentrations. There is no further information provided by Alphasense on how this calculation is performed apart from the applied particle density across all size bins was 1.65 g cm−3. Therefore, we assumed calculations are similar to Eqs. (1) and (2) as applied to the TSI and GRIMM data and used the same particle density (1.65) across all size bins to calculate particle mass for all OPC.
All instrument time series were corrected for drift against a reference time. As the sampling intervals varied slightly between the different OPC, a 5 min average of particle concentrations was used for inter-comparison between instruments.
3.1 EROS inter-comparison
3.1.1 Comparison of reference optical light-scattering instruments
The two light-scattering optical particle counters used as reference instruments in this study were found to be well correlated (r2 > 0.9), with the GRIMM recording between 20 and 30 % higher concentrations for all three particle mass fractions (Fig. S1, Supplement). The GRIMM is known to overestimate number concentration (Sousan et al., 2016, and references therein) and this difference may reflect differing efficiencies in particle detection between the two instruments.
3.1.2 Performance of the OPC-N2
The performance of the custom built logging systems varied between 44 and 94 % successful data capture, with the Arduino and Raspberry Pi systems giving 44–65 and > 92 %, respectively. The Raspberry Pi data logger system was used for the long-term measurements and for the inter-comparison with the AURN site due to its better performance. The data losses were due to hardware issues and not related to performance of the OPC-N2. Due to the missing data, only a subset of measured PM2.5 concentrations when all 14 OPC-N2s were logging are shown in Fig. 1, along with measured concentrations by the reference instruments. From Fig. 1, while there are times when there appears to be excellent agreement between the OPC-N2s and the reference instruments, there are times when the OPC-N2s record a significant positive artefact, and during these times the spread in measured concentrations increases. For example, on the morning of 18 September, the range of measured concentrations by the individual OPC-N2 was from approximately 30 to 150 µg m−3, whereas the reference instruments reported ∼ 10 µg m−3. The cause of the positive artefact is investigated in later sections, but it points to the individual OPC-N2 responding differently to this artefact. Similar trends were also observed for PM1 and PM10; see Fig. S2 in the Supplement.
As there is a considerable spread in response for the OPC-N2 relative to the reference instruments, we then quantified whether it was always the same OPC-N2 reading low and high. Due to the aforementioned data capture issues, this analysis was only applied to days when all 14 OPC-N2s were running, 21–24 September (Fig. 1). The results are shown as a rank order plot, where the OPC-N2 observations are ordered from the highest reported value to the lowest over this period, normalised to the median concentration at the start of the analysis (t = 0), shown for PM2.5 mass concentration in Fig. 2. The ranking of the OPC-N2s showed some variability over time within periods of 1–6 h, which was particularly noticeable during periods when the OPC-N2 signals underwent large changes in concentrations. This demonstrates that the highest and lowest reporting OPC was not consistently reporting the highest and lowest the lowest PM2.5 concentrations, respectively, over the whole 3-day period. The same trend was also observed for PM1 and PM10 mass concentrations, as shown in Fig. S3 (Supplement).
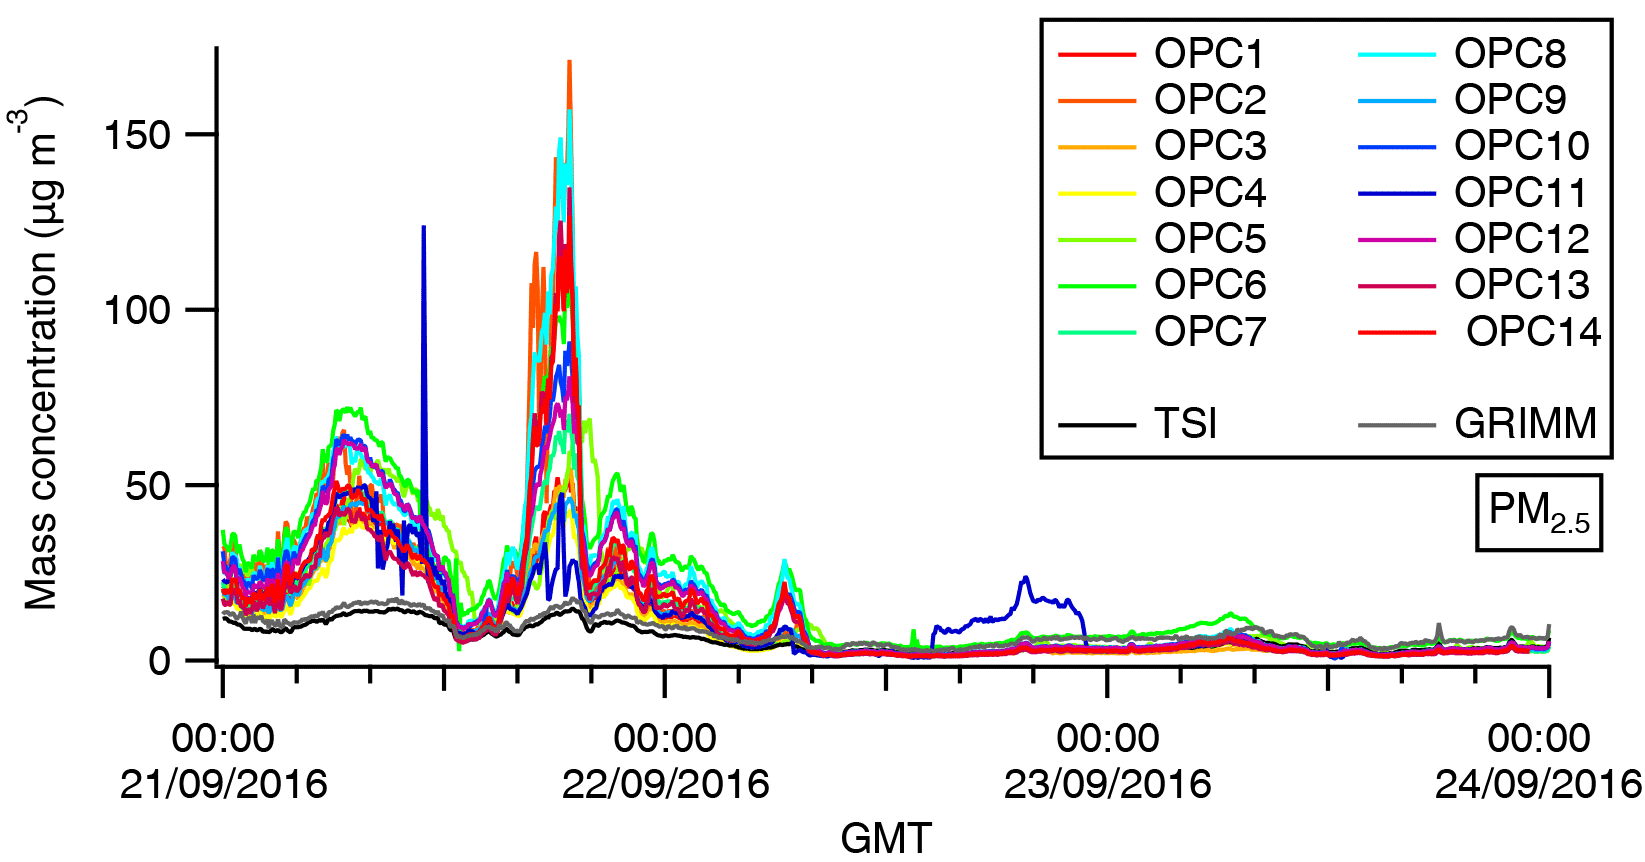
Figure 1Time series of PM2.5 concentrations measured by all OPC-N2s and the reference instruments, TSI 3330 and GRIMM for selected periods with high OPC-N2 data coverage.
For the 3-day time period (21–24 September) we applied the rank order analysis. Two subsets of concentrations measured by the OPC-N2 were evident in the time series (Fig. 1), one a period of highly variable mass concentrations (00:00 BST, 21 September, to 12:00 BST, 22 September 2016) of September) followed by more stable mass concentrations (12:00 BST, 22 September 2016 onward). This was reflected in the corresponding rank order plots where relatively consistent OPC rank orders were observed throughout the variable and comparatively stable PM concentrations periods. However, there is a noticeable transition between the two periods in the rank order plot, observed at approximately 12:00 BST on 22 September. This transition in rank orders would reflect the difference in OPC PM sensitivities, random noise and offset values between each OPC. Over the 3-day period the OPCs appeared to hold their response characteristics and hence rank orders well, suggesting that over this timescale quantitative concentrations could be directly compared. Due to the changing response and the incomplete data coverage, for the rest of the analysis in this paper, when comparing to the reference instruments, the median and inter-quartiles concentrations of all 14 OPC-N2s were used.
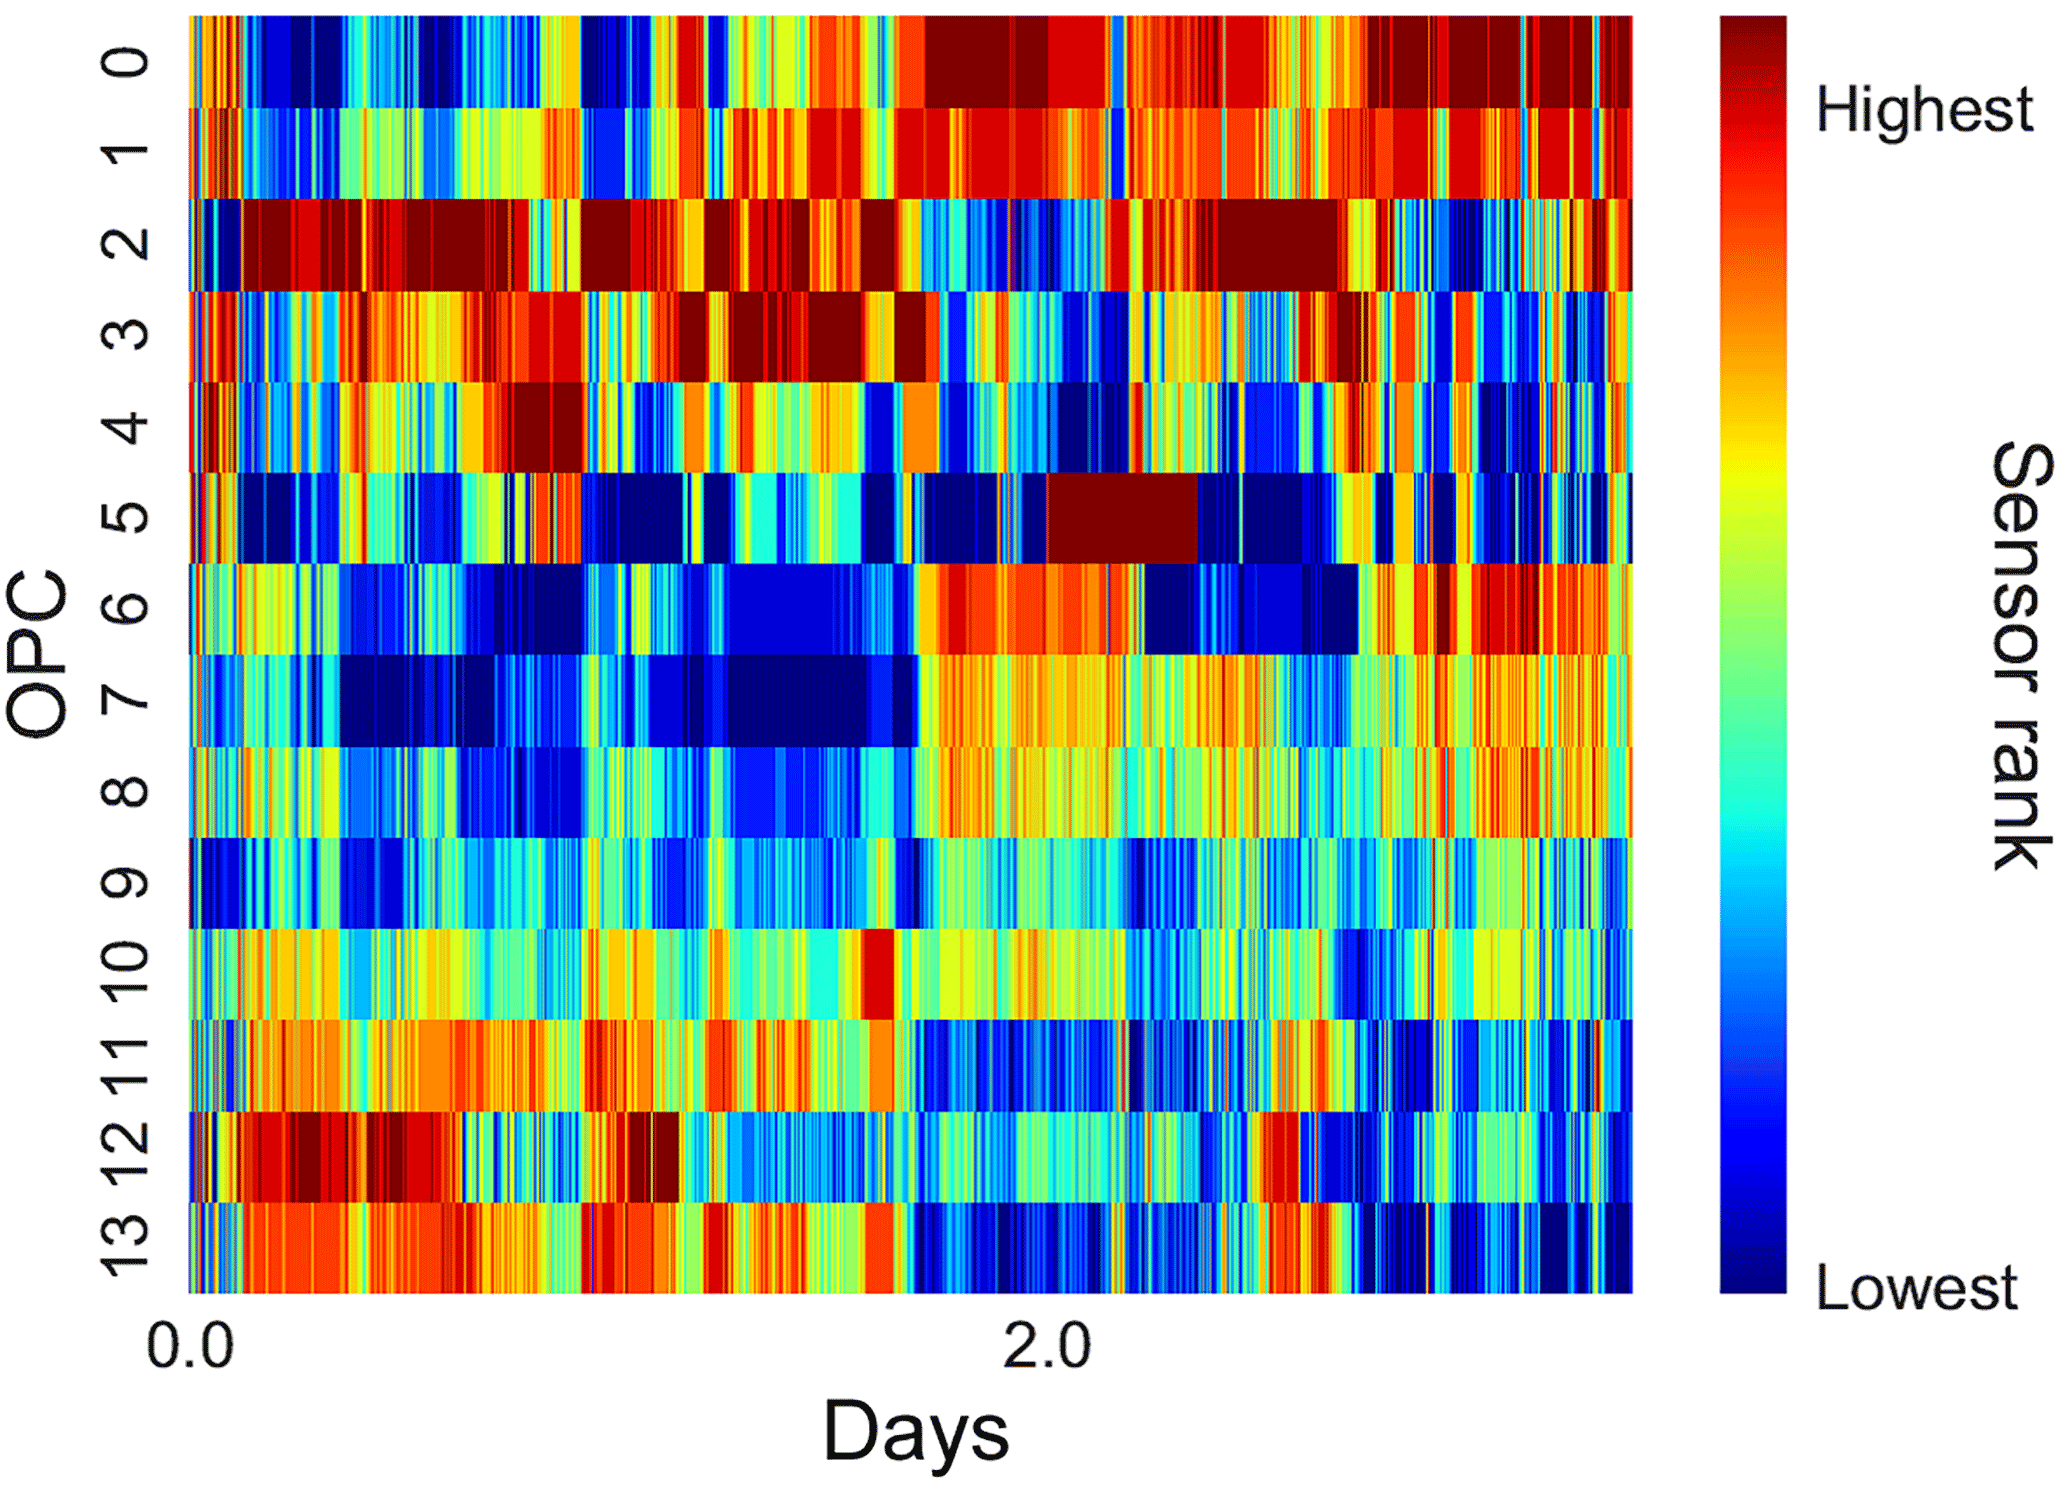
Figure 2Sensor ranking analysis for measured PM2.5 mass concentrations for the 14 OPC-N2s over a 3-day period (21–24 September) with high OPC-N2 data coverage.
One measure of the precision of a group of instruments is the coefficient of variance (CV) and this was calculated for the measured ambient mass concentrations of all 14 OPC-N2s to assess the variability between 14 instruments. The average CV was 0.32 ± 0.16, 0.25 ± 0.14 and 0.22 ± 0.13 for PM1, PM2.5 and PM10 mass concentrations, respectively. This is higher than the value of 0.1 considered acceptable for duplicate instruments by the US EPA (see Sousan et al., 2016, and references therein) but perhaps not unreasonable for low-cost sensors. This may in part be due the OPC-N2 all sampling from separate but identical inlets but suggests the precision of the OPC-N2 would need to be considered when comparing multiple units. To analyse whether the CV for the OPC-N2 varied over the month, the median concentration was plotted along with the CV (shown for PM2.5 in Fig. 3). Throughout the measurement period, the CV was fairly consistent (mean of 0.22 ± 0.13), with spikes in CV values evident during periods of high PM2.5 concentrations, in agreement with trends observed in Fig. 1. We observed a similar trend of consistent CV values for both PM1 and PM10 concentrations, suggesting reasonably stable agreement between all OPC-N2s over a 5-week period.
3.2 Comparison of Alphasense OPC to reference instruments
3.2.1 Particle mass concentration measurement at EROS
Table 1Slopes of measured PM mass concentrations of the reference instruments against the median and inter-quartiles for OPC-N2. The intercepts were not constrained to zero. Correlation co-efficient, r2, is given in parentheses.
The median and inter-quartiles of the measured PM concentrations from the 14 OPC-N2s were used to compare the measured particle mass concentrations to the reference instruments (Fig. 4). From Fig. 4, the notably similar distributions across all three particle size fractions for the first and third quartiles indicate good agreement between the 14 OPC-N2s, further highlighting the reasonable degree of precision between the OPC-N2s as shown in the previous section. At typical ambient PM2.5 and PM10 mass concentrations for the UK, similar distributions were observed for the OPC-N2s and reference instruments (Fig. 1), suggesting reasonable agreement between the devices. In contrast, different distributions were observed for the PM1 fraction, with the OPC-N2 and GRIMM in agreement but appearing to overestimating the PM1 mass concentrations with respect to the TSI 3330. The OPC-N2 has a higher particle size cut-off (0.38 µm) compared to the TSI (0.3 µm), and this may explain the observed difference in frequency distribution for PM1 (Fig. 1). While the TSI and GRIMM have the same particle size cut-off (0.3 µm), these instruments have been shown to disagree (Fig. S1), possibly due to different particle collection efficiencies.

Figure 3Time series of the hourly average median OPC and CV during the September intensive inter-comparison at EROS for PM2.5 mass concentration.
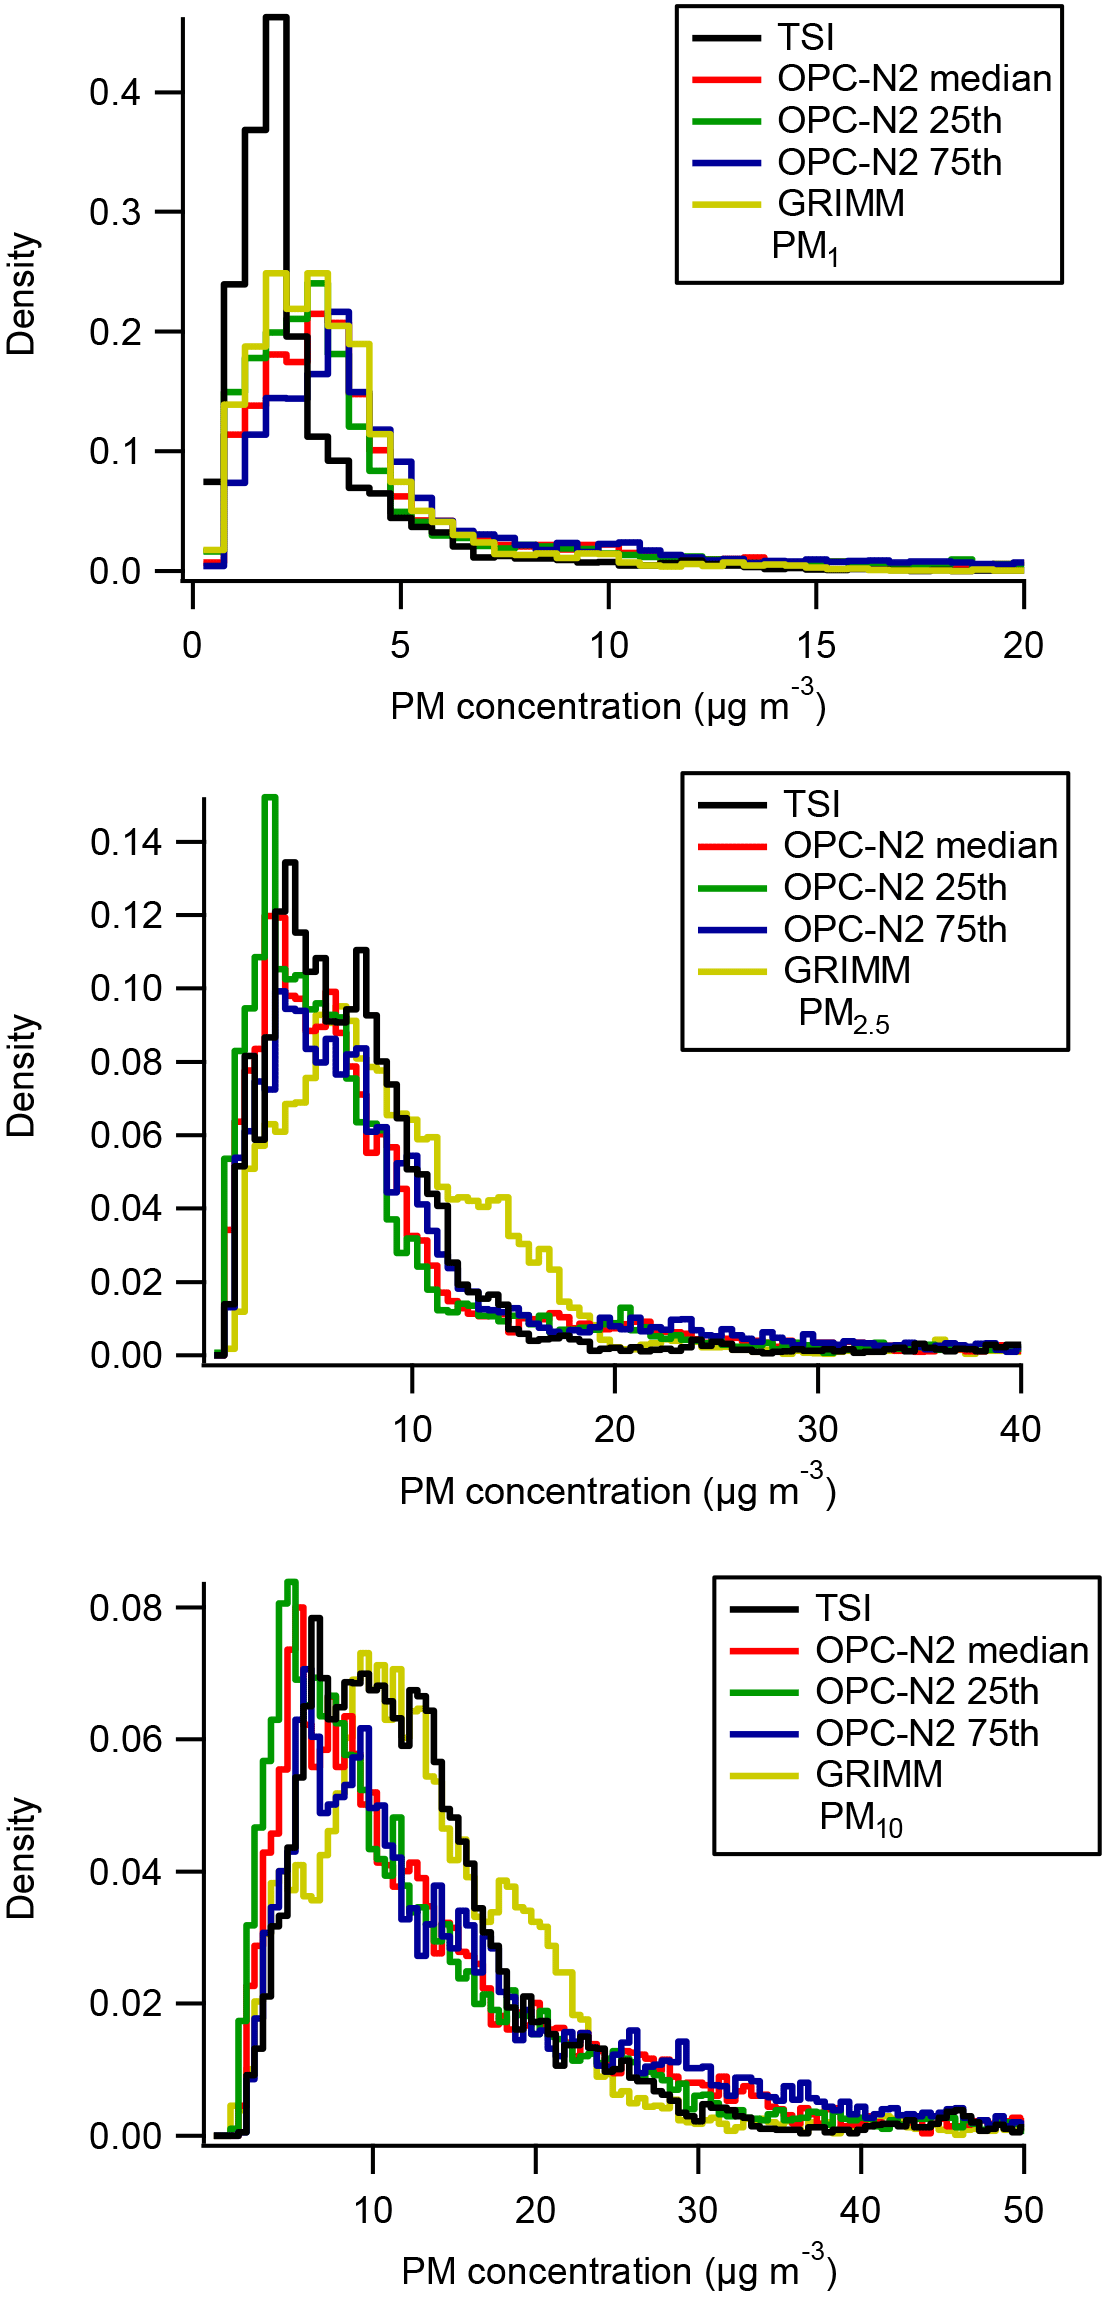
Figure 4Histogram of measured PM1, PM2.5 and PM10 mass concentrations by the TSI 3330, GRIMM and median and inter-quartile values for the 14 OPC-N2s. Note the different x and y axis scales.
When the median and inter-quartile OPC-N2 concentrations were plotted against the TSI and GRIMM concentrations, the slope was greater than unity for all three size fractions (Table 1), indicating that the OPC-N2s were overestimating the ambient particle mass concentrations (approx. 2 to 5 times, Table 1). Overall, the OPC-N2s and GRIMM were in better agreement compared to the TSI for all size fractions (Table 1). The GRIMM was found to record PM concentrations 20–30 % higher compared to the TSI (Fig. S1), and this could in part account for the observed lower slopes between the GRIMM and the OPC-N2s.
The time series of the median OPC-N2 PM2.5 concentrations along with the two reference instruments are shown in Fig. 5, and for a large portion of the inter-comparison all instruments appear to be in agreement. However, there were a number of times when the OPC-N2 readings were up to an order of magnitude higher relative to the reference (e.g. 15 September), pointing to a significant instrument artefact. On 15 September, the GRIMM and TSI also move out of agreement and may point to the same artefact affecting the GRIMM. Similar trends were also observed for the PM1 and PM10 mass fractions (Fig. S4, Supplement) with the OPC-N2 overestimating the PM10 concentration by several orders of magnitude on 15 September (peak mass concentrations in the order of 15 000 µg m−3). Note that as EROS is an urban background site, it was unlikely to be affected by plumes from sources such as vehicles and as a result these high concentrations spikes may not be real.
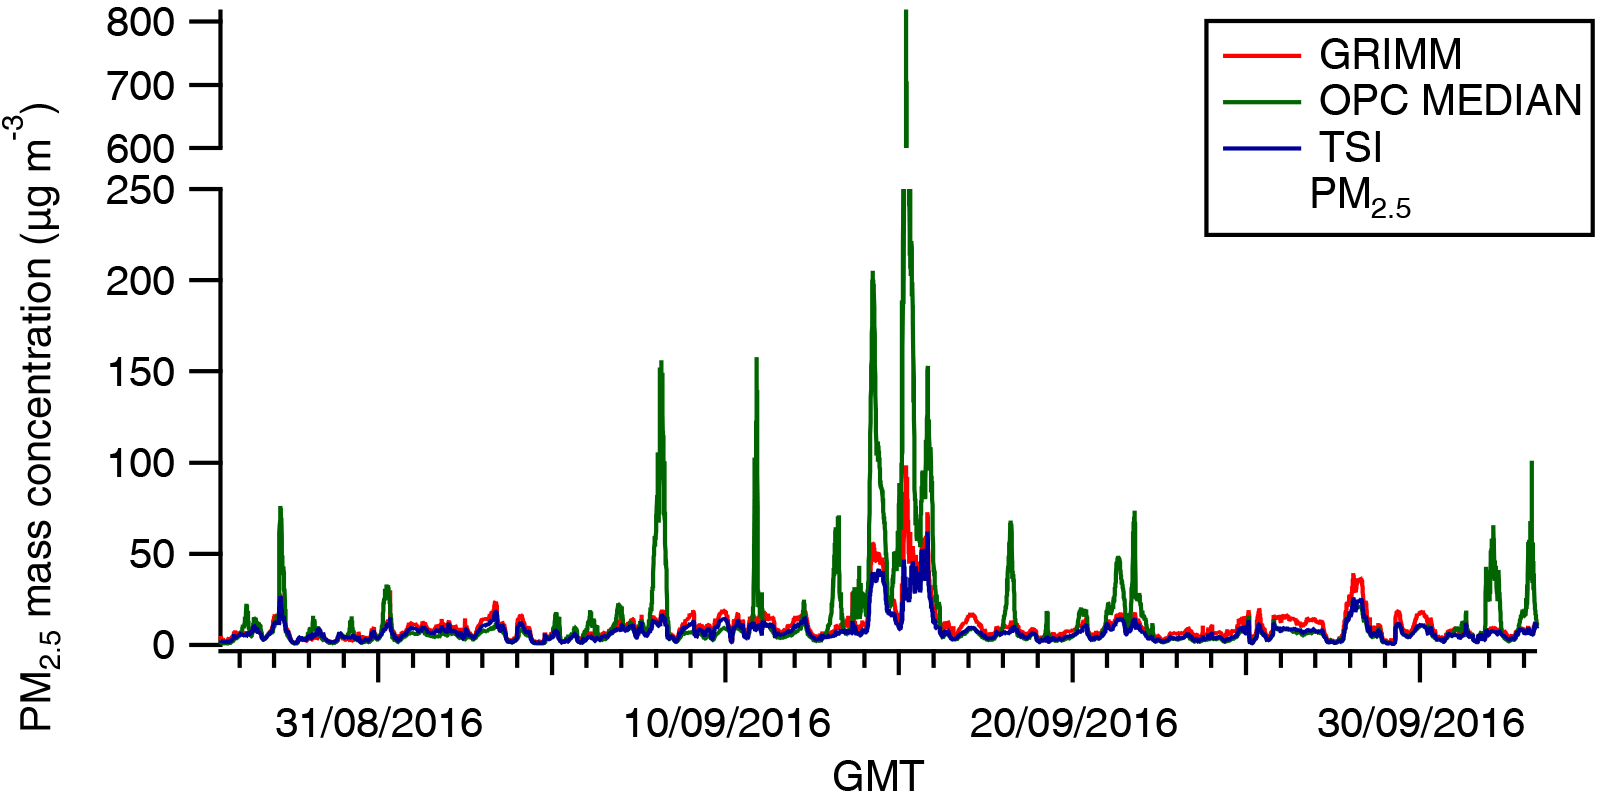
Figure 5Time series of the measured PM2.5 mass concentrations by the TSI, GRIMM and median concentration measured by the 14 OPC-N2s at EROS.
The factors contributing to this apparent artefact shown by the OPC-N2 were investigated. In Fig. 6, the agreement between the OPC-N2 and the TSI instrument appears to vary as a function of ambient RH, with better agreement observed between the two instruments during periods of relatively low ambient RH. However, during times when the RH was high (> 90 %), the OPC-N2 recorded concentrations markedly higher than that measured by the TSI 3330 (Fig. 6). Similar trends were also observed for PM1 and PM10 mass concentrations (Fig. S5, Supplement). Thus, it points to ambient RH as a significant contributing factor affecting the particle mass concentrations measured by the OPC-N2, and this is tested further in later sections. There are distinct differences in design in OPC-N2 compared to the reference instruments (GRIMM and TSI 3330) as both the TSI 3330 and GRIMM utilise a sheath flow unlike the OPC-N2. The sheath flow in both devices will be warmed to temperatures higher than the ambient air due to proximity to the instrument pumps and electronics. This would mean that they measure at a lower RH than ambient and could explain why no RH dependence was observed on measured particle concentrations by the GRIMM and TSI 3330.
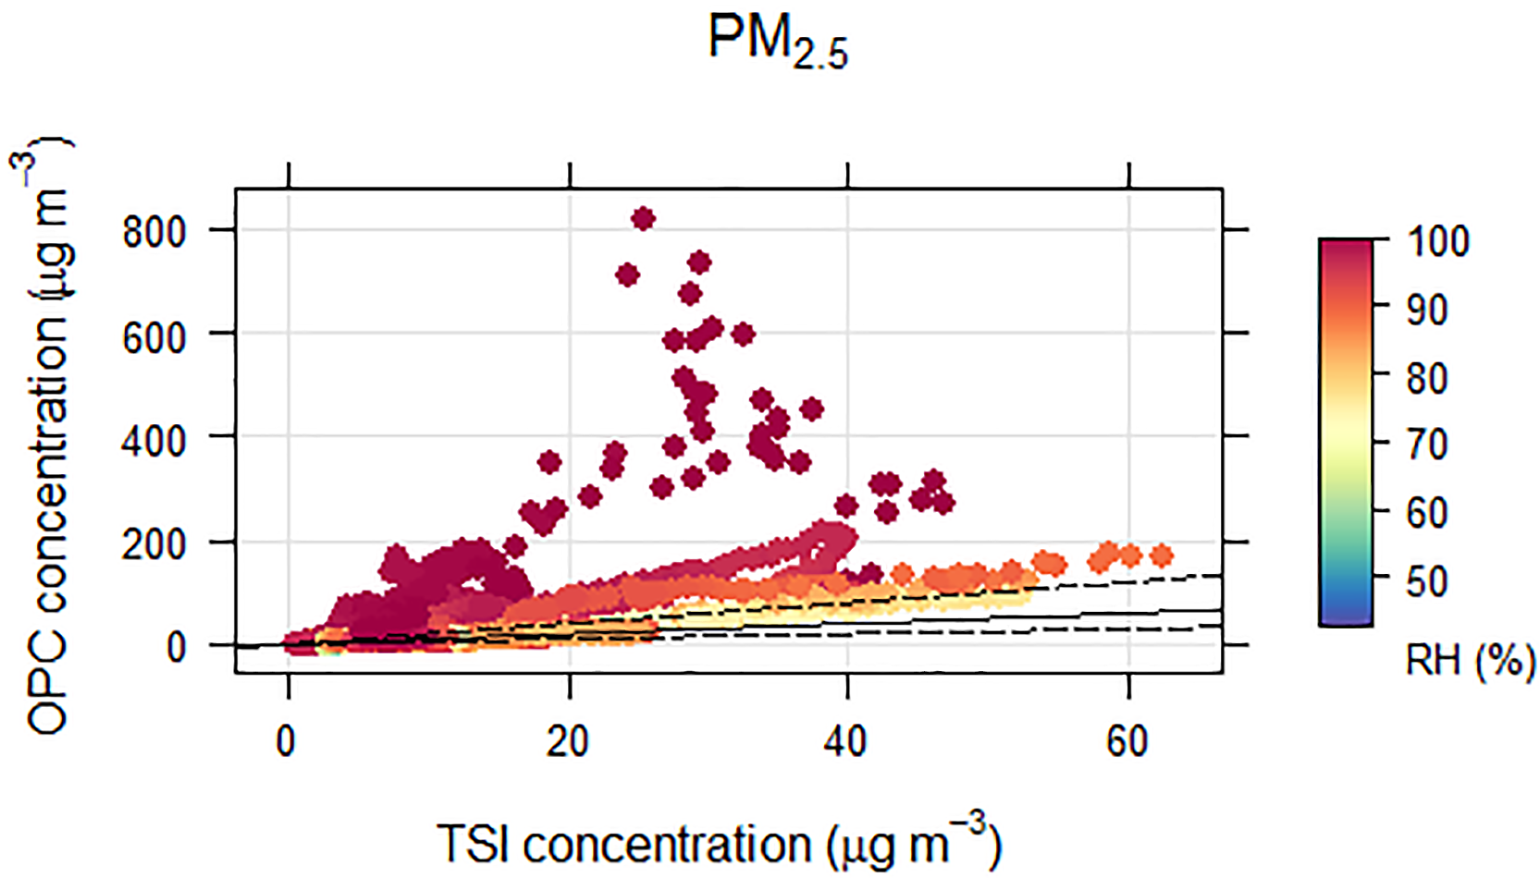
Figure 6Measured concentrations by the TSI 3330 compared to the median concentration measured by the 14 OPC-N2s, coloured by the ambient relative humidity. Also shown are the 1 : 1 (solid) and 0.5 : 1 and 2 : 1 (dashed) lines.
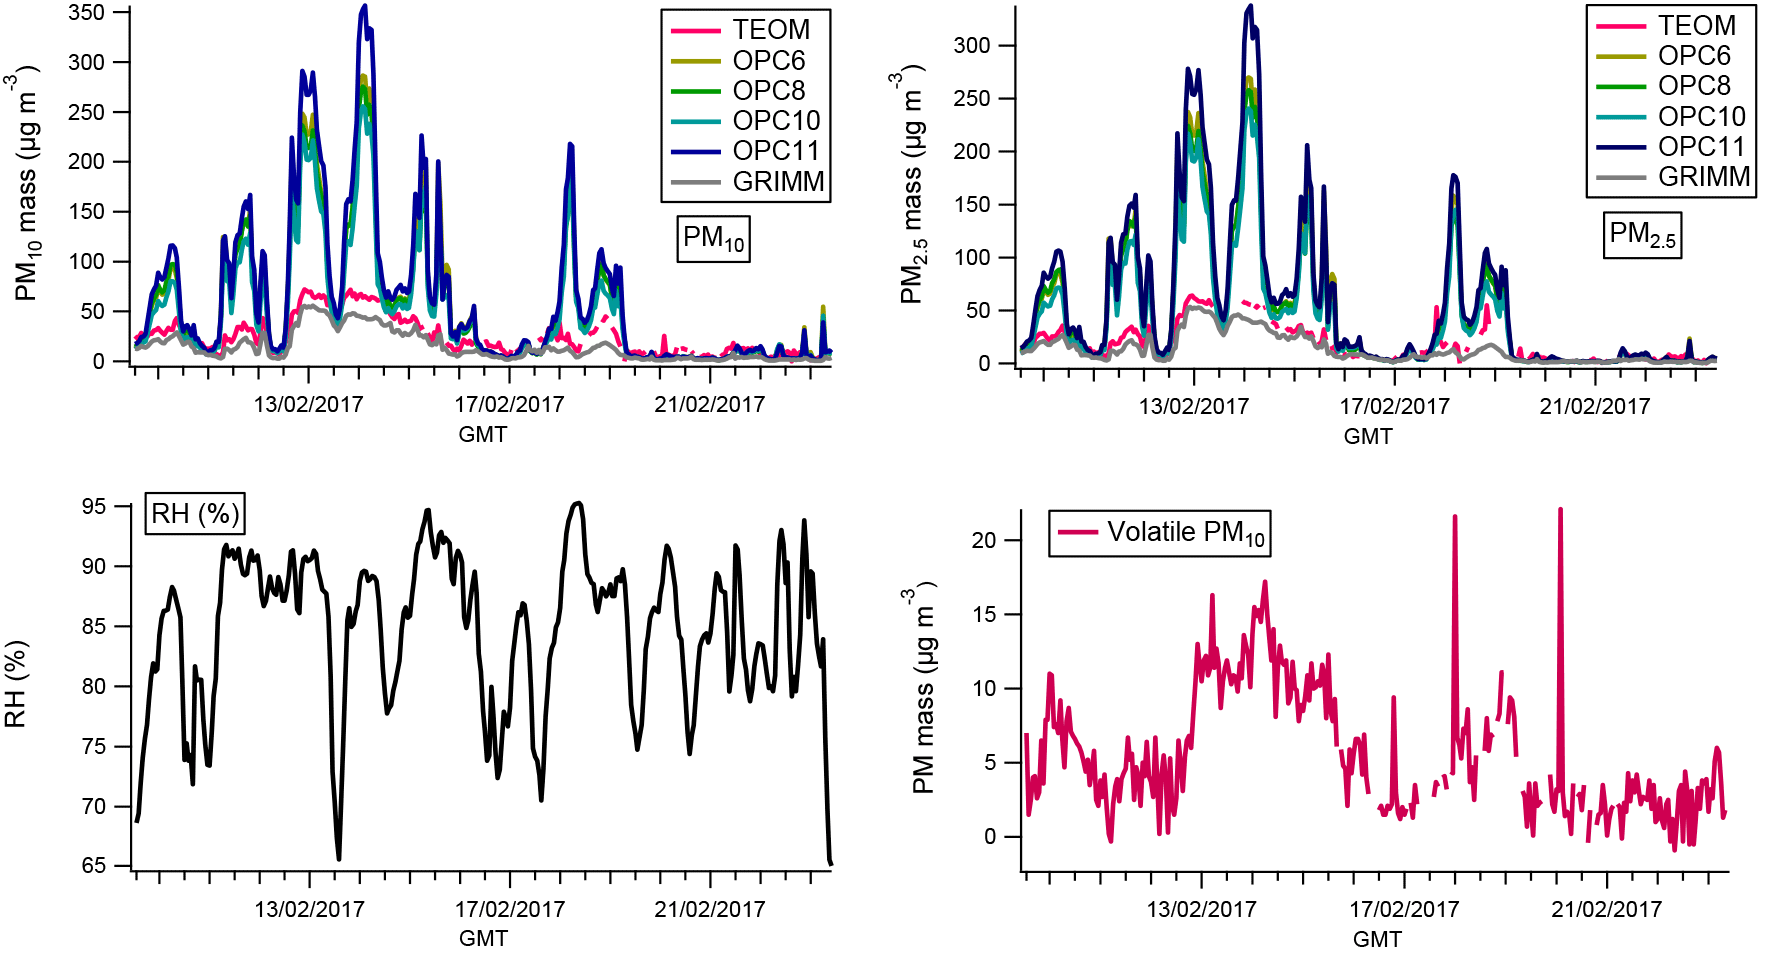
Figure 7Time series for hourly measured PM mass concentrations by the TEOM, four OPC-N2s and the GRIMM at Tyburn Rd urban background AURN station. The volatile particle mass concentration as measured by the TEOM-FDMS and relative humidity measured at Tyburn Rd are also shown.
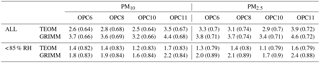
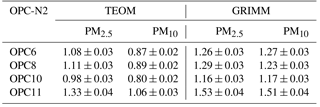
Table 2Slopes of measured PM mass concentrations of the reference instruments (TEOM and GRIMM) against the OPC-N2. The correlation co-efficient, r2, is given in parentheses. The intercepts were not constrained to zero.
3.2.2 Comparison to TEOM-FDMS at AURN monitoring station
We deployed a subset of the OPC-N2 devices (4) and the GRIMM at an urban background AURN station to enable comparison of the measured ambient particle mass concentrations to a TEOM-FDMS. The time series of the measured concentrations of PM10 and PM2.5 for all instruments is shown in Fig. 7. The two reference instruments were found to be well correlated (r2 > 0.91, Fig. S6, Supplement), but the GRIMM reading was about 20 % lower than the TEOM, in agreement with previous work (Grover et al., 2006). From Fig. 6, periods of agreement between the four OPC-N2s and the reference instruments (GRIMM and TEOM) were apparent, along with times when the four OPC-N2s measured concentrations that were notably higher than the reference instruments. Overall, when compared to the TEOM, the OPC-N2 measurements were 2.5–3.9 times higher for both the PM10 and PM2.5, with considerable scatter observed (Table 2).
Closer inspection of Fig. 7 indicated that the times when the four OPC-N2s overestimated the particle mass concentrations were during times of high RH (e.g. 12–14 February), as observed in the previous section. However, there were periods of high RH when the four OPC-N2s and the TEOM were in better agreement (e.g. 20 February onwards), indicating that the large positive artefact observed in the OPC-N2 was not just related to RH. Rather, it appears that positive artefact was observed during times when the volatile fraction measured by the TEOM was relatively high, as well as higher RH, as was observed on 12–14 February (Fig. 7). Thus, it suggests that the ambient aerosol composition also contributed to the significant positive artefact in the OPC-N2. A recent laboratory study found that the particle mass concentrations measured by OPC-N2 for all three size fractions were highly linear with respect to gravimetrically corrected reference instruments but that the slope was dependent on the aerosol type (Sousan et al., 2016). Sousan et al. (2016) observed in the PM10 fraction slopes greater than unity for Arizona road dust but less than unity for salt and therefore suggest that changes in aerosol composition may also account for the differences observed between the reference instruments and OPC-N2 (Fig. 7). This result highlights a limitation when comparing optical methods to gravimetric – as differences may be due to changes in particle mass, size distribution or composition: as all can affect the ability of a particle to scatter light (Holstius et al., 2014).
From Fig. 6, the times when there was a large positive artefact in the OPC-N2 occurred when the RH was above 85 %. If we exclude these times when the RH was over this threshold, better agreement between the four OPC-N2s and the TEOM was observed, with slopes between 1.1 and 1.7 for both size fractions (Table 2). One of the OPC-N2s recorded notably higher mass concentrations compared to the reference instruments (OPC11), compared to the other three OPC-N2s (Table 2), and this highlights the need to calibrate each OPC individually before use in field measurements.
3.3 Development of correction factor for ambient RH
Clearly there were times when there was a significant instrument artefact for the OPC-N2 (Figs. 4 and S4) and the highest overestimations occurred at high RH at both EROS and Tyburn Rd (e.g. Figs. 5 and 6). Whilst the accuracy of the instrument was significantly worse at high RH the precision remains the same within error. The CV analysis conducted in Sect. 3.1.2 is repeated for the same dataset but put into low (RH < 85 %) and high RH (RH > 85 %) subsets. For high-RH conditions the CV for PM1, PM2.5 and PM10 was 0.34 ± 0.30, 0.27 ± 0.14 and 0.23 ± 0.21, respectively. For low-RH conditions the CV for PM1, PM2.5 and PM10 was 0.30 ± 0.25, 0.23 ± 0.14 and 0.20 ± 0.18, respectively.
The size of hygroscopic particles is known to be dependent on RH, as the particle refractive index and size are both a function of RH. Inorganic aerosols (e.g. sodium chloride, nitrate and sulfate) make up a large portion of the PM10 observed at EROS (Yin et al., 2010) and are known to demonstrate an exponential increase in hygroscopic growth at high RH (e.g. Hu et al., 2010; Pope et al., 2010).
The ratio of measured mass concentrations by the OPC-N2 relative to the reference instruments was plotted as a function of RH and appeared to show an exponential increase above ∼ 85 % RH, similar to hygroscopic particle growth curves (Pöschl, 2005). As a result, we applied κ-Köhler theory (Petters and Kreidenweis, 2007), which describes the relationship between particle hygroscopicity and volume by a single hygroscopicity parameter, κ. The κ-Köhler theory can be adapted to relate particle mass to hygroscopicity at a given RH by Eq. (4) (Pope, 2010):
where aw is the water activity (aw = ambient RH ∕ 100) and m and mo are the wet and dry (RH = 0 %) aerosol mass, respectively. The density of the dry particles and water is given by ρw and ρp, respectively. The density of water is 1 g cm−3, and the bulk dry particle density is assumed to be 1.65 g cm−3. The value for κ can be found by a non-linear curve fitting of a humidogram (m∕mo vs. aw) and was calculated using the TEOM measurements at Tyburn Rd in the first instance as the TEOM system employs a Nafion dryer and so measures dry particle mass (Grover et al., 2006). To account for the differences in mass concentration measured by the TEOM and OPC-N2 at RH less than 85 %, the scaling factors shown in Table 2 are used to calibrate the dry mass of the OPC-N2 to that observed in the TEOM, both in the PM2.5 and PM10 fractions.
Figure 8 shows the humidogram plots, for both the PM2.5 and PM10 fractions, obtained by plotting the ratio of OPC-N2 to the reference instrument (TEOM and GRIMM) outputs versus ambient RH. Ideally, a measure of RH internal to the instrument could be made to allow for calculation of particle hygroscopicity within the instrument. However, the OPC-N2 design does not allow for this, so we assume that ambient and instrument RH are identical. In reality, the instrument is likely to be slightly warmer than ambient and hence the RH within the instrument will be slightly lower than ambient. This difference will result in a lower apparent hygroscopicity. When using the TEOM for mo, similar κ constants were calculated for all OPC-N2s, ranging from 0.38 to 0.41 and 0.48 to 0.51 for PM2.5 and PM10, respectively, which is within the expected range for Europe (0.36 ± 0.16; Pringle et al., 2010). Similar κ values were observed when using the GRIMM mass concentrations as the dry particle mass (mo), ranging from 0.41 to 0.44 and 0.38 to 0.41 for PM2.5 and PM10, respectively.
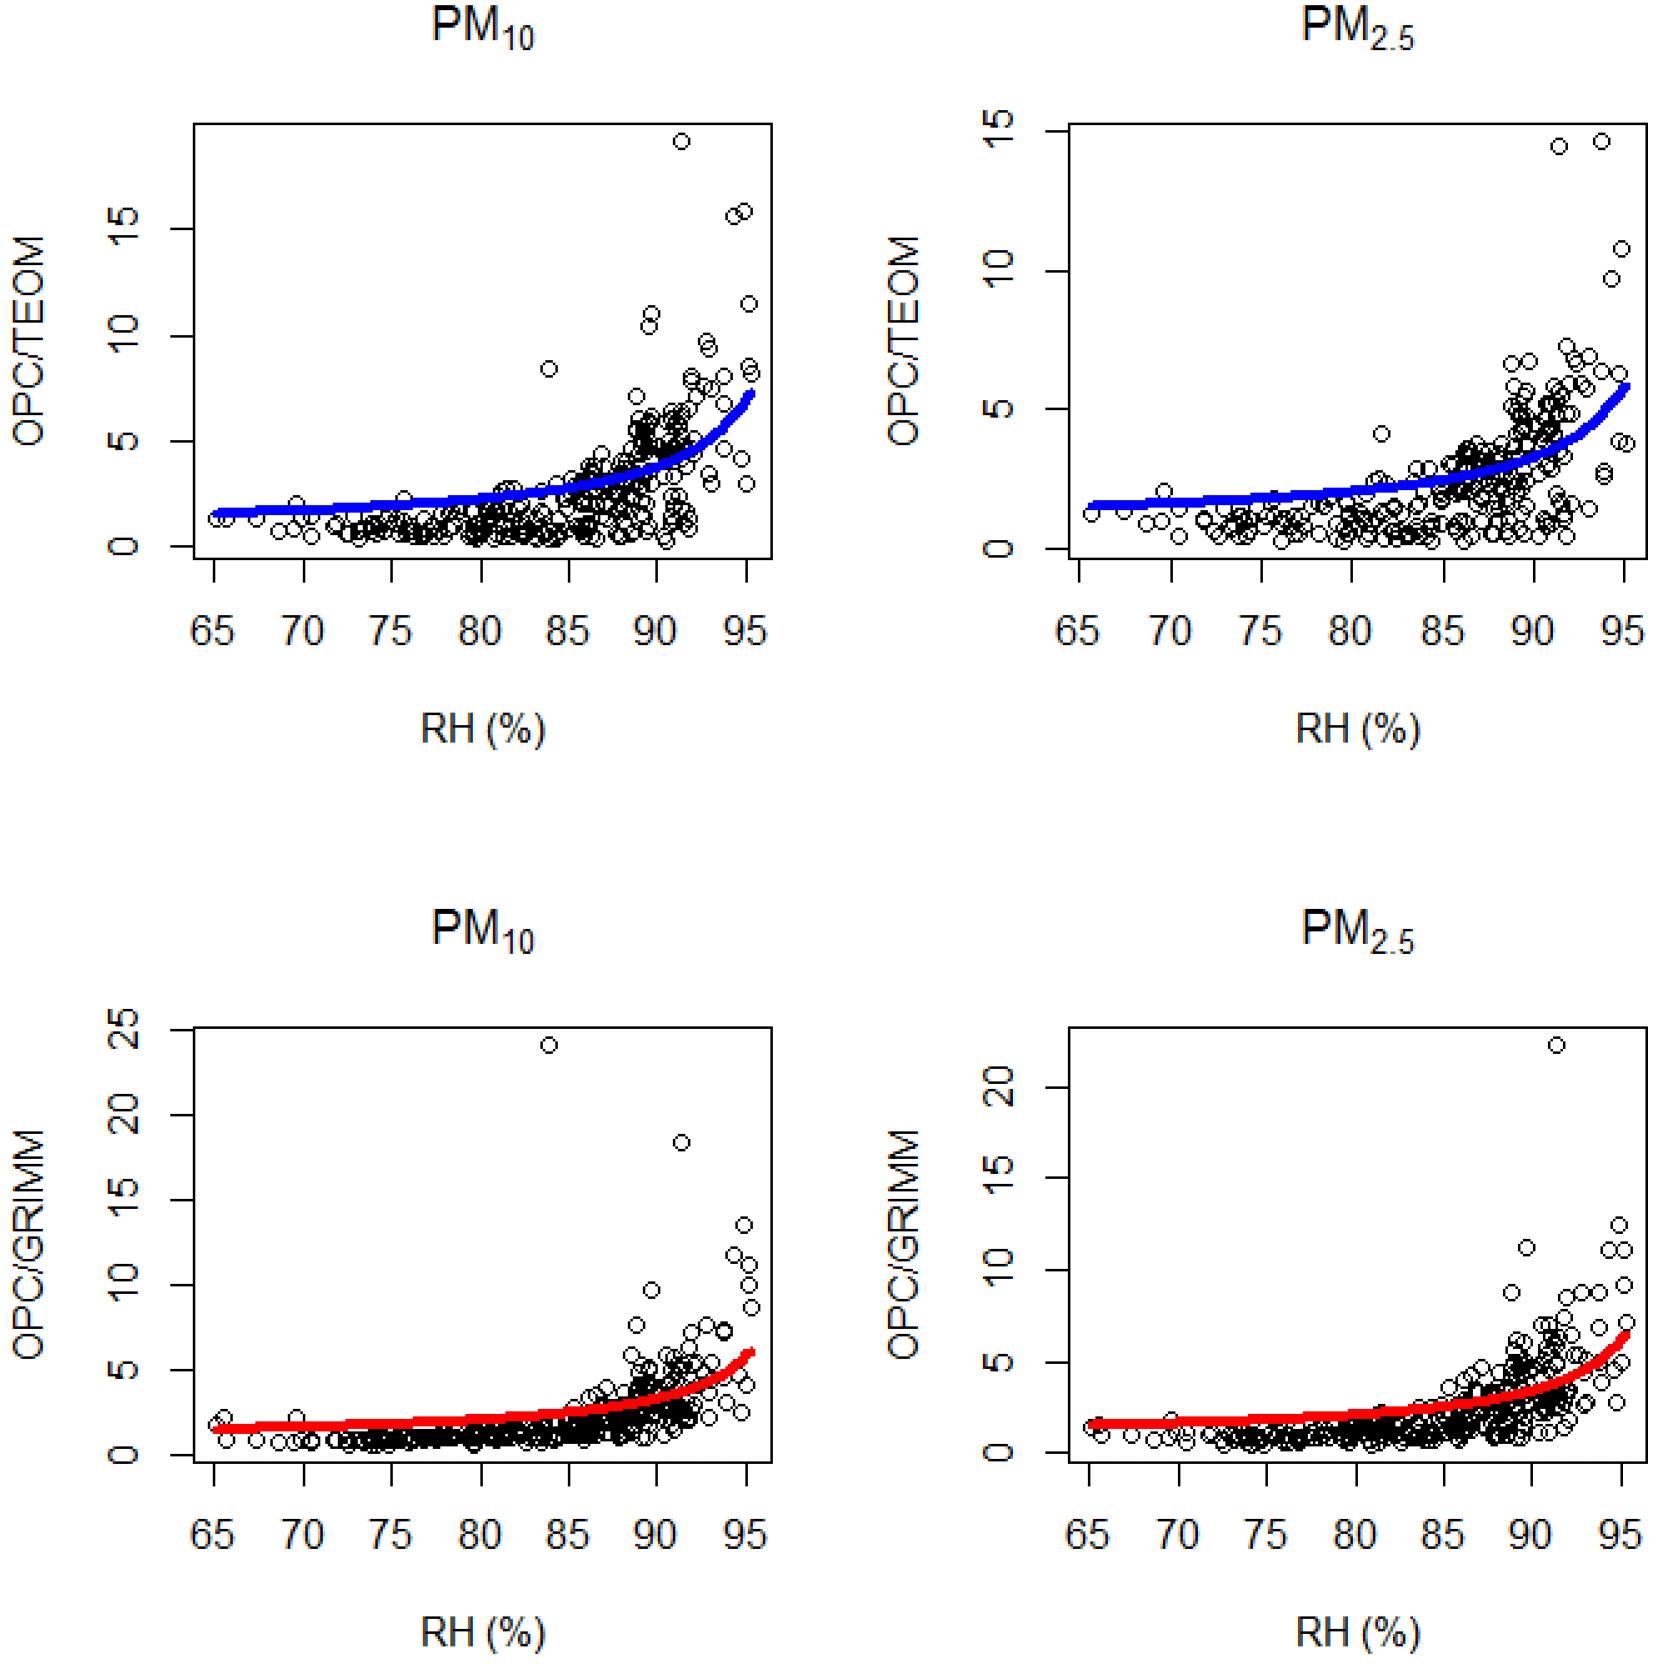
Figure 8Measured and fitted humidograms (m∕mo vs. RH) recorded at the Tyburn Road AURN site for PM10 and PM2.5 size fractions and reference instruments (TEOM and GRIMM). The dry mass (mo) is given by the TEOM or GRIMM and the humidified mass is given by the OPC-N2. Measured data are given by the black circles; the fitted data are given by the blue (TEOM-FDMS) and red (GRIMM) lines.
We then applied this fitting constant to model the expected OPC/reference instrument ratio for a given RH as a result of particle hygroscopic growth by re-arranging Eq. (4) into Eq. (5):
where the m∕mo is the ratio of the OPC-N2 to the reference instruments. Using Eq. (5), the mass concentrations measured by the OPC-N2 were corrected and significantly better agreement between the corrected OPC-N2 and reference instruments was observed for measurements across the whole range of ambient RH (Tables 2 and 3). Overall, the corrected OPC-N2 mass concentrations using Eq. (5) were notably better, within 33 and 52 % of the TEOM and GRIMM, respectively (Table 3), compared to 250–400 % without the correction factor (Table 2). The time series for the corrected data is shown in Figs. S7 and S8 (Supplement) and there are periods where there is good agreement between TEOM and the corrected OPC-N2. However, it was also evident from Table 3 that the slope was different for PM10 and PM2.5 mass fractions for all OPC-N2s when compared to the TEOM. This may be related to the observed variation in κ between the size fractions relative to the TEOM or an unaccounted loss mechanism; the exact cause will be investigated further in future work.
There were also times when the OPC-N2s were clearly overcorrected (e.g. from 20 February onwards), generally when the ambient RH was low (Fig. 6). This suggests that when the RH was below a threshold, Eq. (5) overcorrects the data and this can be observed in the humidograms shown in Fig. 8. Typically, at RH < 85 % the hygroscopic growth of real atmospheric aerosols is small and it may be more appropriate to apply a linear regression correction factor for data recorded under these RH conditions. Therefore we applied a binary two-model approach to correct the OPC-N2 mass concentrations, where a linear correction (using the TEOM as reference concentration) for when RH < 85 %; above this threshold in RH, Eq. (5) was used. As can be seen Fig. S9 (Supplement), there was little change in the slope or r2 value with the two-model correction compared to the using correction with Eq. (5) for all RH. What was noticeable was that the intercept for the two-model approach moved closer to zero, suggesting that at the lower mass concentrations the correction was improved. Similar trends were also observed for PM10. Also during the period from 20 February, the volatile particle fraction was lower (Fig. 6), and this indicates a significantly different aerosol composition. Since κ is composition dependent, a single global fit to κ will result in poor fitting when the true κ is significantly different to the average κ. The preceding discussion suggests that further refinement to the correction factors applied to the OPC-N2 is possible, depending on the ambient RH and better knowledge of aerosol composition. RH measurement is relatively trivial and can be achieved with small sensors, but aerosol composition determination still requires significant analytical equipment and expertise.
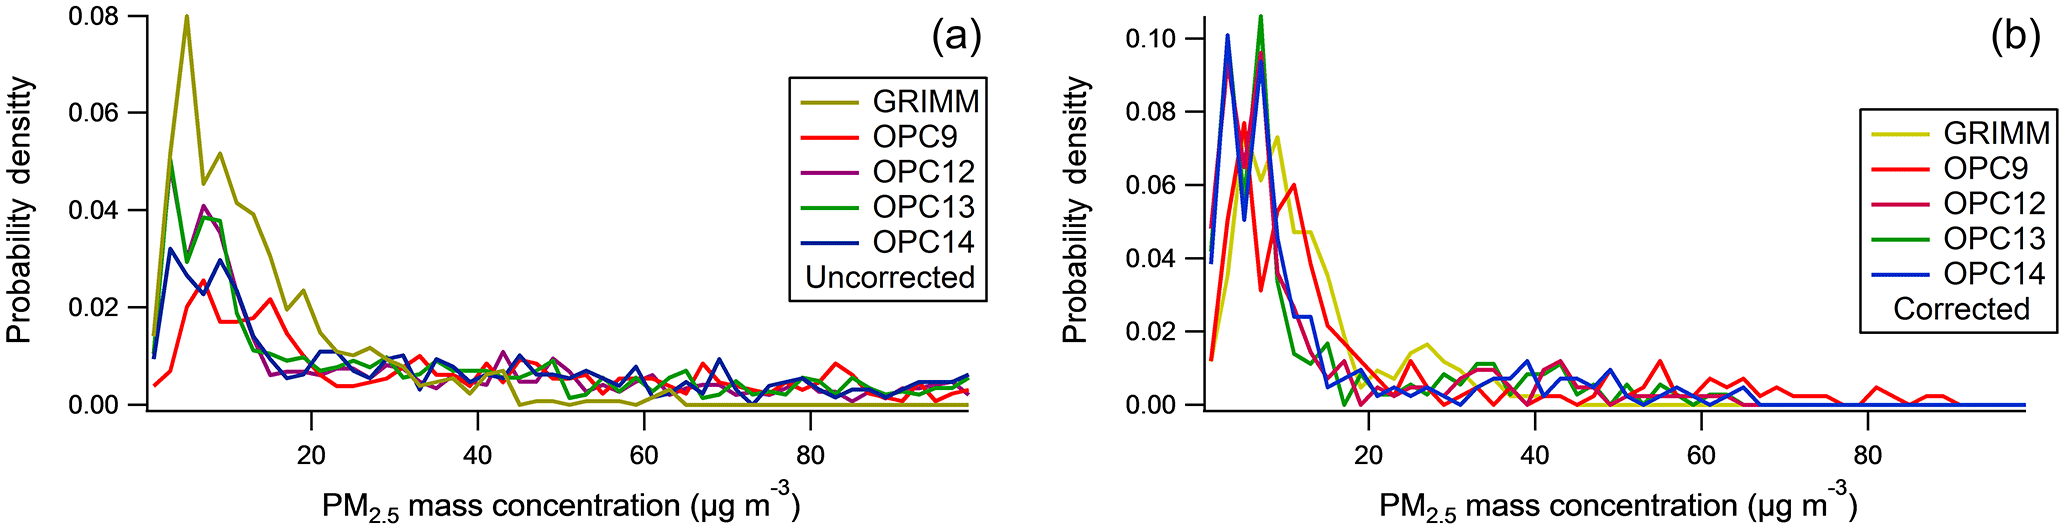
Figure 9Histogram of measured PM2.5 concentrations by the GRIMM PAS 1.108 and the four OPC-N2s for January. The uncorrected OPC-N2 concentrations are shown in panel (a), while panel (b) shows the RH-corrected OPC-N2 concentrations.
Table 3Summary of the comparison between the corrected OPC-N2 (via Eq. 5) against the reference instruments. Intercepts were not constrained to zero.
Longer-term monitoring with OPC-N2 at EROS
After the conclusion of the intensive measurements at EROS (Sect. 3.1), five of the OPC-N2s continued monitoring for a further 4 months to examine whether there was any evidence of instrument drift over time, along with the GRIMM as reference. One of the OPC-N2s failed in December, and so was excluded from this analysis. The remaining four OPC-N2s were compared to GRIMM and in January after running for 4 months (Fig. 9a), and while three of the OPC-N2s had a similar distribution to the GRIMM (OPC12, 13 and 14), OPC9 appeared to show evidence of instrument drift as the mode has shifted relative to the GRIMM. However, the increased frequency of higher mass concentrations not observed by the GRIMM but by all four OPC-N2s (Fig. 9a) suggests that ambient RH is also a factor, as the average RH in January (91 %) was higher than September (84 %). Therefore, we calculated the correction for RH as described in the previous section (Eq. 5), as changes in aerosol composition would affect the particle hygroscopicity. In addition, the κ was only fitted for the data with RH < 95 % since the hygroscopicity of aerosol is highly sensitive to any error in the RH measurement above this value. Application of the RH correction factor resulted in better agreement between each of the OPC-N2s, with similar corrected distributions observed (Fig. 9b). Furthermore, the corrected OPC-N2 concentrations also had better agreement with the GRIMM during January (Fig. 9b) compared to uncorrected concentrations (Fig. 9a), suggesting that changes in the particle water content were the cause. Thus, at least over a 4-month measurement period, there appears to be no evidence of instrument drift in the OPC-N2, once appropriate correction factors were applied.
3.4 Discussion on the OPC-N2 interferences
In the previous sections, the significant positive artefacts observed by the OPC-N2 relative to the reference instruments were at times when the ambient RH was high, pointing to particle water content as the cause. This result is perhaps not surprising, as many studies in the literature have shown that particle water content can be a major reason for discrepancies between techniques that measure ambient particle mass (see e.g. Charron et al., 2004). The use of κ-Köhler theory to derive a correction factor based on ambient RH improved the agreement between the OPC-N2 and reference instruments; however a limitation of this approach is that the bulk aerosol hygroscopicity is related to particle composition, typically the inorganic fraction (e.g. Gysel et al., 2007). Variation in ambient particle composition could account for the large spread observed in the ratio of OPC-N2 ∕ TEOM at high RH (Fig. 8), as an average hygroscopicity correction will overestimate when PM with higher hygroscopicity is measured and vice versa. This would have potentially significant implications when using the OPC-N2 for longer-term monitoring, as the κ value may not be constant over the monitoring period. Therefore, this would suggest the need for regular calibrations to account for changes in bulk aerosol composition and as a result κ values. Furthermore, Eq. (5) may not be required for locations where the ambient RH is lower than 85 %, as typically atmospheric particle growth due to water below this threshold is limited and a simple linear regression may be sufficient. Thus, in situ and seasonally specific calibrations for the OPC-N2 are required to account for possible differences in ambient aerosol properties. However, as κ values for continental regions tend to fall within a narrow range globally (0.3 ± 0.1; Andreae and Rosenfeld, 2008), with some systematic deviations for certain regions (Pringle et al., 2010), this average κ value could be used in lieu of calibration with reference instrument (e.g. a TEOM) to determine the correction factor (C) according to Eq. (6):
However, it should be noted that while in situ calibration of an OPC-N2 with suitable reference instrumentation is preferable, for many locations around the world, and especially low- and middle-income countries (LMICs), this may not be possible and so using an appropriate κ value from the literature in Eq. (6) may be a reasonable approximation.
The Alphasense OPC-N2 was evaluated for use in ambient monitoring of airborne particle mass concentration, with TEOM-FDMS and two commercial optical light-scattering instruments, GRIMM PAS 1.108 and TSI 3330, employed as reference instruments. Comparison of the OPC-N2 to the reference optical instruments demonstrated reasonable agreement for a low-cost sensor to the measured mass concentrations of PM1, PM2.5 and PM10 as evidenced by the stated accuracy and precision. However, the OPC-N2 demonstrated a significant large positive artefact in measured particle mass during times of high ambient RH, and a calibration factor was developed based on bulk particle aerosol hygroscopicity. Application of the RH correction factor, based upon κ-Köhler theory, resulted in notable improvement with the corrected OPC-N2 measurements within 33 % of a TEOM-FDMS. While higher than the slope of 1 ± 0.1 allowed by the US EPA, it is comparable to the agreement of a GRIMM to the TEOM (20 %). All low-cost PM sensors will likely require calibration factors to obtain the dry particle weight unless they actively dry the PM-containing air stream before it enters the device. The use of heated inlets could be used to reduce the RH in the air stream but would have consequences for the power requirements of the sensor, potentially making them less attractive for battery led operation. Thus, it shows that the OPC-N2 does not respond the same as reference instruments to ambient particle mass, but provided appropriate correction factors are applied, reasonable agreement with OPC-N2 to reference instruments can be achieved. Furthermore, the dependence of the OPC-N2 on a correction for RH and κ may limit its application for longer-term monitoring as the κ value may change over time, and this will be the focus of future work. This is especially salient when considering using the OPC-N2 to compare to air quality standards that are 1-year averages of PM2.5 and PM10.
For PM10 mass concentrations, a CV of 22 + 13 % between the 14 OPC-N2s employed in this study was observed, with some of the variability likely due to use of separate but identical inlets, and therefore could be considered reasonable for a low-cost sensor, but this level of precision needs to be considered when using multiple units. One out of four OPC-N2s tested for long-term monitoring appeared to show evidence of instrument drift relative to reference instruments.
Overall, the OPC-N2s have been shown to accurately measure ambient airborne particle mass concentration provided they are correctly calibrated and corrected for RH. The reasonable level of precision demonstrated between multiple OPC-N2 suggests that they would be suitable for applications where a number of instruments are required such as spatial mapping and personal exposure studies.
Original research data are available from the authors on request.
The supplement related to this article is available online at: https://doi.org/10.5194/amt-11-709-2018-supplement.
The authors declare that they have no conflict of interest.
The authors wish to thank Peter Porter and Birmingham City Council for help
in collocating the sensors next to the Tyburn Road AURN site. Francis Pope acknowledges funding form EPSRC (Global Challenges Research Fund IS2016 and IS2017). Alastair C. Lewis and Marvin Shaw
acknowledge funding from the NERC National Capability programme ACREW and
NE/N007115/1.
Edited by: Paolo Laj
Reviewed by: two anonymous referees
Andreae, M. O. and Rosenfeld, D.: Aerosol–cloud–precipitation interactions. Part 1. The nature and sources of cloud-active aerosols, Earth-Sci. Rev., 89, 13–41, 2008.
Borrego, C., Costa, A. M., Ginja, J., Amorim, M., Coutinho, M., Karatzas, K., Sioumis, T., Katsifarakis, N., Konstantinidis, K., De Vito, S., Esposito, E., Smith, P., André, N., Gérard, P., Francis, L. A., Castell, N., Schneider, P., Viana, M., Minguillón, M. C., Reimringer, W., Otjes, R. P., von Sicard, O., Pohle, R., Elen, B., Suriano, D., Pfister, V., Prato, M., Dipinto, S., and Penza, M.: Assessment of air quality microsensors versus reference methods: The EuNetAir joint exercise, Atmos. Environ., 147, 246–263, 2016.
Castellini, S., Moroni, B., and Cappelletti, D.: PMetro: Measurement of urban aerosols on a mobile platform, Measurement, 49, 99–106, 2014.
Charron, A., Harrison, R. M., Moorcroft, S., and Booker, J.: Quantitative interpretation of divergence between PM10 and PM2.5 mass measurement by TEOM and gravimetric (Partisol) instruments, Atmos. Environ., 38, 415–423, 2004.
de Nazelle, A., Bode, O., and Orjuela, J. P.: Comparison of air pollution exposures in active vs. passive travel modes in European cities: A quantitative review, Environ. Int., 99, 151–160, 2017.
Gao, M., Cao, J., and Seto, E.: A distributed network of low-cost continuous reading sensors to measure spatiotemporal variations of PM2.5 in Xi'an, China, Environ. Pollut., 199, 56–65, 2015.
Grover, B. D., Eatough, N. L., Eatough, D. J., Chow, J. C., Watson, J. G., Ambs, J. L., Meyer, M. B., Hopke, P. K., Al-Horr, R., Later, D. W., and Wilson, W. E.: Measurement of Both Nonvolatile and Semi-Volatile Fractions of Fine Particulate Matter in Fresno, CA, Aerosol Sci. Tech., 40, 811–826, 2006.
Gysel, M., Crosier, J., Topping, D. O., Whitehead, J. D., Bower, K. N., Cubison, M. J., Williams, P. I., Flynn, M. J., McFiggans, G. B., and Coe, H.: Closure study between chemical composition and hygroscopic growth of aerosol particles during TORCH2, Atmos. Chem. Phys., 7, 6131–6144, https://doi.org/10.5194/acp-7-6131-2007, 2007.
Hagan, D.: py-opc, available at: https://github.com/dhhagan/py-opc (last access: 2 February 2018), 2017
Holstius, D. M., Pillarisetti, A., Smith, K. R., and Seto, E.: Field calibrations of a low-cost aerosol sensor at a regulatory monitoring site in California, Atmos. Meas. Tech., 7, 1121–1131, https://doi.org/10.5194/amt-7-1121-2014, 2014.
Hu, D., Qiao, L., Chen, J., Ye, X., Yang, X., Cheng, T., and Fang, W.: Hygroscopicity of inorganic aerosols: size and relative humidity effects on the growth factor, Aerosol Air Qual. Res., 10, 255–264, 2010.
Kumar, P., Morawska, L., Martani, C., Biskos, G., Neophytou, M., Di Sabatino, S., Bell, M., Norford, L., and Britter, R.: The rise of low-cost sensing for managing air pollution in cities, Environ. Int., 75, 199–205, 2015.
Lewis, A. C., Lee, J. D., Edwards, P. M., Shaw, M. D., Evans, M. J., Moller, S. J., Smith, K. R., Buckley, J. W., Ellis, M., Gillot, S. R., and White, A.: Evaluating the performance of low cost chemical sensors for air pollution research, Faraday Discuss., 189, 85–103, 2016.
Manikonda, A., Zíková, N., Hopke, P. K., and Ferro, A. R.: Laboratory assessment of low-cost PM monitors, J. Aerosol Sci., 102, 29–40, 2016.
Mead, M. I., Popoola, O. A. M., Stewart, G. B., Landshoff, P., Calleja, M., Hayes, M., Baldovi, J. J., McLeod, M. W., Hodgson, T. F., Dicks, J., Lewis, A., Cohen, J., Baron, R., Saffell, J. R., and Jones, R. L.: The use of electrochemical sensors for monitoring urban air quality in low-cost, high-density networks, Atmos. Environ., 70, 186–203, 2013.
Mueller, M., Meyer, J., and Hueglin, C.: Design of an ozone and nitrogen dioxide sensor unit and its long-term operation within a sensor network in the city of Zurich, Atmos. Meas. Tech., 10, 3783–3799, https://doi.org/10.5194/amt-10-3783-2017, 2017.
Petters, M. D. and Kreidenweis, S. M.: A single parameter representation of hygroscopic growth and cloud condensation nucleus activity, Atmos. Chem. Phys., 7, 1961–1971, https://doi.org/10.5194/acp-7-1961-2007, 2007.
Pope, F. D.: Pollen grains are efficient cloud condensation nuclei, Environ. Res. Lett., 5, 044015, https://doi.org/10.1088/1748-9326/5/4/044015, 2010.
Pope, F. D., Dennis-Smither, B. J., Griffiths, P. T., Clegg, S. L., and Cox, R. A.: Studies of single aerosol particles containing malonic acid, glutaric acid, and their mixtures with sodium chloride. I. Hygroscopic growth, J. Phys. Chem. A, 114, 5335–5341, 2010.
Popoola, O. A. M., Stewart, G. B., Mead, M. I., and Jones, R. L.: Development of a baseline-temperature correction methodology for electrochemical sensors and its implications for long-term stability, Atmos. Environ., 147, 330–343, 2016.
Pöschl, U.: Atmospheric aerosols: composition, transformation, climate and health effects, Angew. Chem. Int. Ed., 44, 7520–7540, 2005.
Pringle, K. J., Tost, H., Pozzer, A., Pöschl, U., and Lelieveld, J.: Global distribution of the effective aerosol hygroscopicity parameter for CCN activation, Atmos. Chem. Phys., 10, 5241–5255, https://doi.org/10.5194/acp-10-5241-2010, 2010.
Rai, A., Kumar, P., Pilla, F., Skouloudis, A., Di Sabatino, S., Ratti, C., Yasar, A., and Rickerby, D.: End-user Perspective of Low-cost Sensors for Outdoor Air Pollution Monitoring, Sci. Total Environ., 607–608, 691–705, https://doi.org/10.1016/j.scitotenv.2017.06.266, 2017.
Smith, K. R., Edwards, P., Evans, M. J., Lee, J. D., Shaw, M. D., Squires, F. A., and Lewis, A.: Clustering approaches to improve the performance of low cost air pollution sensors, Faraday Discuss., 200, 621–637, 2017.
Snyder, E. G., Watkins, T. H., Solomon, P. A., Thoma, E. D., Williams, R. W., Hagler, G. S. W., Shelow, D., Hindin, D. A., Kilaru, V. J., and Preuss, P. W.: The Changing Paradigm of Air Pollution Monitoring, Environ. Sci. Tech., 47, 11369–11377, 2013.
Sousan, S., Koehler, K., Hallett, L., and Peters, T. M.: Evaluation of the Alphasense optical particle counter (OPC-N2) and the Grimm portable aerosol spectrometer (PAS-1.108), Aerosol Sci. Tech., 50, 1352–1365, 2016.
Steinle, S., Reis, S., Sabel, C. E., Semple, S., Twigg, M. M., Braban, C. F., Leeson, S. R., Heal, M. R., Harrison, D., Lin, C., and Wu, H.: Personal exposure monitoring of PM2.5 in indoor and outdoor microenvironments, Sci. Total Environ., 508, 383–394, 2015.
Viana, M., Rivas, I., Reche, C., Fonseca, A.S., Pérez, N., Querol, X., Alastuey, A., Álvarez-Pedrerol, M., and Sunyer, J.: Field comparison of portable and stationary instruments for outdoor urban air exposure assessments, Atmos. Environ., 123, 220–228, 2015.
Yin, J., Harrison, R. M., Chen, Q., Rutter, A., and Schauer, J. J.: Source apportionment of fine particles at urban background and rural sites in the UK atmosphere, Atmos. Environ., 44, 841–851, 2010.