the Creative Commons Attribution 4.0 License.
the Creative Commons Attribution 4.0 License.
 | 19 Feb 2018
The TROPOMI surface UV algorithm
Anders V. Lindfors
Jukka Kujanpää
Niilo Kalakoski
Anu Heikkilä
Kaisa Lakkala
Tero Mielonen
Maarten Sneep
Nickolay A. Krotkov
Antti Arola
Johanna Tamminen
The TROPOspheric Monitoring Instrument (TROPOMI) is the only payload of the Sentinel-5 Precursor (S5P), which is a polar-orbiting satellite mission of the European Space Agency (ESA). TROPOMI is a nadir-viewing spectrometer measuring in the ultraviolet, visible, near-infrared, and the shortwave infrared that provides near-global daily coverage. Among other things, TROPOMI measurements will be used for calculating the UV radiation reaching the Earth's surface. Thus, the TROPOMI surface UV product will contribute to the monitoring of UV radiation by providing daily information on the prevailing UV conditions over the globe. The TROPOMI UV algorithm builds on the heritage of the Ozone Monitoring Instrument (OMI) and the Satellite Application Facility for Atmospheric Composition and UV Radiation (AC SAF) algorithms. This paper provides a description of the algorithm that will be used for estimating surface UV radiation from TROPOMI observations. The TROPOMI surface UV product includes the following UV quantities: the UV irradiance at 305, 310, 324, and 380 nm; the erythemally weighted UV; and the vitamin-D weighted UV. Each of these are available as (i) daily dose or daily accumulated irradiance, (ii) overpass dose rate or irradiance, and (iii) local noon dose rate or irradiance. In addition, all quantities are available corresponding to actual cloud conditions and as clear-sky values, which otherwise correspond to the same conditions but assume a cloud-free atmosphere. This yields 36 UV parameters altogether. The TROPOMI UV algorithm has been tested using input based on OMI and the Global Ozone Monitoring Experiment-2 (GOME-2) satellite measurements. These preliminary results indicate that the algorithm is functioning according to expectations.


Solar ultraviolet (UV) radiation has a broad range of effects concerning life on Earth. Because of its high photon energy, UV radiation influences human health, terrestrial and aquatic ecosystems, air quality, and materials in various ways. For a more detailed discussion on the different effects of UV radiation, see, e.g. UNEP (2015). In order to study and assess these effects and their implications thoroughly, information is needed on the geographical and temporal distribution of UV radiation reaching the Earth's surface.
After the discovery of severe ozone depletion in Antarctica during the austral spring (Farman et al., 1985), it was soon recognized that the stratospheric ozone content was also declining in the Arctic and at midlatitudes (WMO, 1989). Subsequently, the UV radiation reaching the Earth's surface increased during the last decades of the 20th century, as documented in UNEP (2011). The report further found that the strongest increase took place in the high latitudes of the Southern Hemisphere, while the Arctic and midlatitudes in both hemispheres have also experienced UV increases. Outside the polar regions, the increase has been mostly around 5 % or less compared to pre-industrial conditions, whereas at high and polar latitudes, where ozone depletion has been larger, increases have been more substantial (UNEP, 2011).
Thanks to the Montreal Protocol (UN, 1989), concentrations of ozone-depleting substances in the stratosphere are currently decreasing and the total ozone column is on a recovery path back towards pre-1980 levels, which are expected to be reached before the middle of the 21st century (UNEP, 2011). Here, it is worth noting that factors other than the ozone column, for example clouds and surface albedo, also play an important role in determining how much UV radiation reaches the Earth's surface. Current projections of the future UV radiation climate indeed bring forth the complex connections between climate change, stratospheric ozone depletion, and stratospheric dynamics, which all influence the UV radiation of our future climate (Williamson et al., 2014). Thus, it is of great importance to continue monitoring the UV radiation reaching the Earth's surface.
The Sentinel-5 Precursor (S5P) is a polar-orbiting satellite mission, launched on 13 October 2017. The only payload of the mission is the TROPOspheric Monitoring Instrument (TROPOMI), which is a nadir-viewing push-broom-type imaging spectrometer measuring in the ultraviolet, visible, near-infrared, and the shortwave infrared. The S5P mission is on a sun-synchronous orbit with an ascending node equatorial crossing at 13:30, which in conjunction with a wide swath of 2600 km provides near-global daily coverage. TROPOMI measures radiation backscattered from the Earth–atmosphere system. Among other things, TROPOMI measurements will be used for calculating the UV radiation reaching the Earth's surface over the sunlit part of the globe. Thus, the TROPOMI surface UV product will contribute to monitoring UV radiation by providing daily information on the prevailing UV conditions over the globe.
This paper provides a description of the algorithm that will be used for estimating surface UV radiation from TROPOMI observations, including a discussion on algorithm heritage and some example results based on currently active satellite instruments.
The method by Eck et al. (1995) is one of the first satellite-based algorithms for estimating UV irradiances at the Earth's surface presented in the literature. Their method is based on measurements of backscattered UV radiation taken by the Total Ozone Mapping Spectrometer (TOMS) instrument. The general idea in their approach is to first calculate clear-sky UV irradiances, taking into account the total ozone column retrieved from measurements taken by the same instrument, and then in a second step correct these clear-sky irradiances for the attenuation caused by clouds. The cloud effect is determined based on the Lambertian equivalent reflectance (LER) at 360 or 380 nm, which is a measure of how reflective the clouds are. The higher the reflectance, the thicker the cloud (optically) and thus the attenuation of the surface UV irradiance caused by this cloud is stronger. This relationship has later been refined (Krotkov et al., 2001) to also take into account the effect of multiple scattering between the surface and the cloud (see also Herman et al., 2009), yielding the following expression:
where RG is the LER value representing the surface (that is, LER at cloud-free conditions), and CT is the cloud correction (Tanskanen et al., 2006) or cloud transmittance (Krotkov et al., 2001; Herman et al., 2009) factor, which is also commonly referred to as the cloud modification factor (CMF) (Calbo et al., 2005; den Outer et al., 2005; Lindfors et al., 2007). This factor is applied to the clear-sky UV irradiance (Eclear) to obtain an estimate of the UV irradiance under the cloud (E):
Many satellite UV algorithms presented after the pioneering work of Eck et al. (1995) inherits their method. However, it is worth noting that, in the TOMS UV algorithm, Eck's LER method was replaced with a more realistic plane parallel cloud model at the turn of the century (Krotkov et al., 1998, 2001). In the plane parallel cloud model, the cloud optical depth is estimated using radiative transfer calculations assuming a plane parallel water cloud, and given as input to the measured reflectance. The advantage of this approach is that it describes more realistically the wavelength-dependent attenuation of incoming solar radiation by clouds (Krotkov et al., 2001; Lindfors and Arola, 2008) and also that it accounts for the directional distribution of radiation reflected off the cloud.
The Dutch–Finnish Ozone Monitoring Instrument (OMI) on board NASA's Aura satellite launched in 2004 continues the TOMS UV record to the present. The OMI UV algorithm (Tanskanen et al., 2006) is, in essence, very similar to that of TOMS. A recent update of the OMI UV algorithm added climatological aerosol information in order to account for the attenuation caused by absorbing aerosols (Arola et al., 2009).
For estimating daily UV exposure or daily doses, a disadvantage of the above-described TOMS branch of satellite UV algorithms is that they are based on only one satellite overpass per day. This means that the algorithm does not account for variations in cloudiness that occur within a day. Instead the cloud situation of the overpass is assumed to be valid for the whole day. Therefore, days with varying cloud conditions cause a larger uncertainty in the daily UV doses (Bugliaro et al., 2006).
Another approach for estimating surface UV irradiances from satellite measurements is to use cloud information from geostationary satellites in combination with total ozone column from polar-orbiting platforms. This approach has the advantage of having almost continuous cloud observations, but, on the other hand, is not able to cover high-latitudes because of challenging view angles. Geostationary satellite UV algorithms have been developed for both the European and North American regions (Verdebout, 2000; Gadhavi et al., 2008; Zempila et al., 2017).
In order to gain a better picture of the intra-day cloud variability, some algorithms utilize measurements from multiple polar-orbiting satellites (Matthijsen et al., 2000; Ciren and Li, 2003; Lindfors et al., 2009). This approach is also used in the offline UV (OUV) product (Kujanpää and Kalakoski, 2015) provided by EUMETSAT's Satellite Application Facility for Atmospheric Composition and UV Radiation (AC SAF; formerly known as the Ozone and Atmospheric Chemistry Monitoring Satellite Application Facility). The OUV algorithm utilizes cloud measurements taken by Advanced Very High Resolution Radiometer (AVHRR) instruments and carried by two different polar-orbiting satellites (Metop and NOAA POES) to produce a global gridded daily UV product (level 3 product). In the OUV algorithm, the total ozone column is taken from GOME-2.
As explained in more detail in Sect. 3, the approach chosen for estimating surface UV irradiances based on TROPOMI measurements builds on the TOMS-OMI heritage, while also utilizing parts of the AC SAF OUV algorithm. Radiative transfer calculations and look-up table (LUT) functionality of the TROPOMI UV algorithm are based on the AC SAF OUV algorithm, while other parts of the algorithm are mostly based on OMI. One exception here is that the TROPOMI UV algorithm uses the reflectance at 354 nm, while OMI uses that at 360 nm, for calculating the cloud optical depth. Furthermore, the surface albedo climatology used in TROPOMI is an improved version of that used in OMI, following the approach chosen in AC SAF OUV.
In practice, the TROPOMI UV algorithm estimates the surface UV using radiative transfer calculations implemented in a LUT to keep computational demands at a reasonable level. The inputs for these radiative transfer calculations are essentially the TROPOMI-retrieved total ozone column and reflectance at 354 nm, together with information on the surface albedo and the atmospheric aerosol load taken from other sources.
Of the above-discussed heritage UV products, the TOMS UV record is the longest. The TOMS UV record is based on measurements taken by a series of satellites. It begins with measurements taken by the Nimbus 7 satellite in 1978 and ends with the Earth Probe in 2007. The major TOMS instruments flew on orbits with a 12:00 equator crossing time, while OMI and TROPOMI has equator crossing times of 13:45 and 13:30, respectively. The OMI UV product covers the years from 2004 to the present and is currently foreseen to last for at least a few more years, while TROPOMI will continue this satellite UV record further into the future. Thus, there will most probably be at least some years of overlap between TROPOMI and OMI. This overlap will be very useful for validation purposes and time series analyses. Although the AC SAF OUV comprises a somewhat different type of UV product (because it is a direct L3 product), it is worth noting that the OUV record covers the period from 2007 onwards, and thus will also be available for comparison with the TROPOMI UV product.
For the TROPOMI UV algorithm, we have chosen to use the VLIDORT radiative transfer model (Spurr, 2006). VLIDORT is a vector discrete ordinate radiative transfer model that accounts for polarization. It has been used, for example, in the satellite UV algorithm of AC SAF (Kujanpää and Kalakoski, 2015).
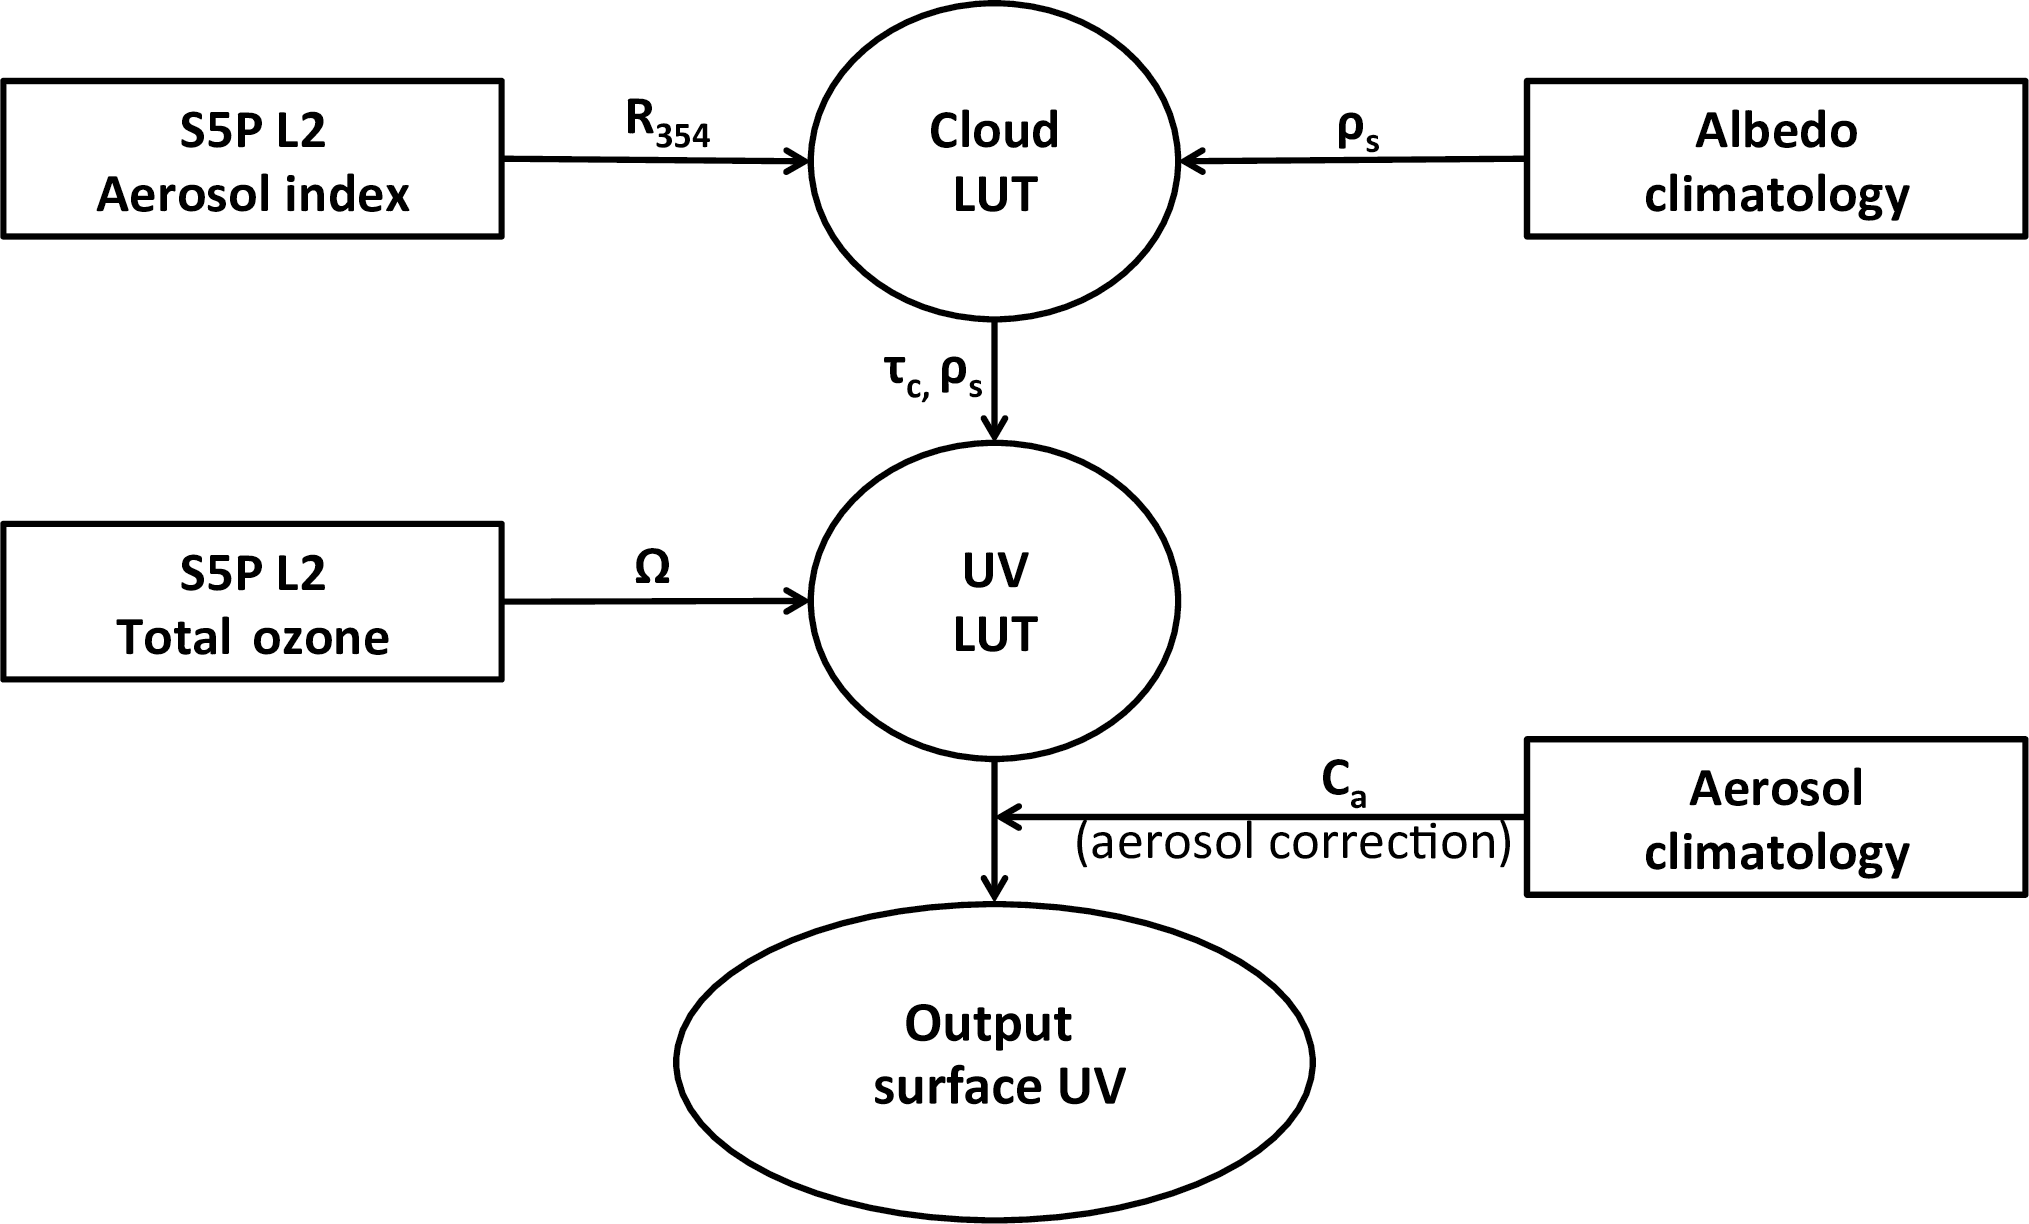
The inputs to the VLIDORT radiative transfer calculations are essentially the total ozone column (Ω), the surface albedo (ρs), and the cloud optical depth (τc). Based on these, the UV irradiances at the Earth's surface are calculated through a LUT-based approach, which reduces the computational demands compared to online radiative transfer model calculations. Here, the total ozone column is a retrieved L2 product of TROPOMI, available in the Total Ozone product (Spurr et al., 2016), while the cloud optical depth is estimated as part of the UV algorithm (see Sect. 3.3) based on the measured reflectance at 354 nm (R354) provided by the L2 aerosol index (AI) product (Stein Zweers, 2016).
Figure 1 presents a schematic flow diagram of the TROPOMI UV algorithm. In practice, the TROPOMI UV algorithm uses two sets of LUTs instead of explicitly running the radiative transfer model. One LUT gives τc using R354 and ρs as main inputs, while the other one gives the UV irradiance using Ω, τc, and ρs as main inputs. Here, ρs is taken from a climatology created for the OUV algorithm. It uses the monthly minimum Lambert equivalent reflectivity (MLER) climatology (Herman and Celarier, 1997) for regions and time periods with permanent or negligible snow/ice cover, while a climatology better capturing the seasonal changes in the surface albedo (Tanskanen, 2004) during the transition periods is used elsewhere (see Kujanpää and Kalakoski, 2015 for details). A correction for the effect of absorbing aerosols corresponding to climatological aerosol properties is applied, following the OMI aerosol correction approach (Arola et al., 2009).
In the following subsections, we first briefly discuss the influence of various factors such as clouds and aerosols have on surface UV irradiances. Thereafter, we describe the approach used in the radiative transfer model within the TROPOMI UV algorithm, including a description of how the LUTs are implemented.
3.1 Factors affecting surface UV
The UV irradiance at the Earth's surface is largely determined by the solar zenith angle, clouds, total ozone column, surface albedo, aerosols, Earth–Sun distance, and altitude or pressure. The different factors affecting surface UV radiation have been discussed in the literature (see, e.g. Weatherhead et al., 2005, and reference therein). Here, we only include a brief discussion of these factors and encourage the interested reader to study the literature more in depth.
3.1.1 Solar zenith angle
The solar zenith angle (θ0) determines the optical path of the direct radiation component through the atmosphere and is therefore the most important factor for the surface UV irradiance. Through its influence on the optical path, the solar zenith angle modifies the effect that other factors have on the surface UV. The smaller the solar zenith angle (higher sun), the more UV radiation reaches the surface, and vice versa.
3.1.2 Clouds
Clouds attenuate UV radiation in a way which is similar to the familiar attenuation of visible radiation under cloudy skies: they reflect part of the incoming radiation back to space, thereby reducing the irradiance reaching the Earth's surface. Josefsson and Landelius (2000) found an average CMF (cloud modification factor) of 0.4 for overcast conditions at a Swedish station, with fairly large variation in the observed CMF values around this average, depending on the detailed properties of the prevailing cloud. For cloud amounts less than 4 out of 8 (octas), Josefsson and Landelius found a CMF larger than 0.9, indicating that UV radiation is only weakly attenuated as long as less than half of the sky is covered by clouds. Den Outer et al. (2005) found a climatological yearly average CMF of 0.68 for erythemal UV in the Netherlands, while for global solar radiation (integrated over the wavelength range 300–3000 nm), they found a climatological CMF of 0.57. Thus, there is a wavelength dependence in the attenuation of incoming solar radiation by clouds, with radiation of shorter wavelengths making it to the surface more effectively. The physical aspects of this effect have been discussed by Lindfors and Arola (2008).
In radiative transfer, the cloud optical depth (τc) is often used as a measure of the opacity of the cloud. τc defines how much a beam of radiation passing through the cloud is attenuated, following the Beer–Lambert–Bouguer law.
Although clouds generally attenuate the UV radiation reaching the surface, it is worth noting that, in certain conditions, they can also act to intermittently increase the surface UV irradiance to above what would be expected in otherwise equivalent but cloud-free conditions. When the sun is not obscured by clouds, they can act as reflecting surfaces enhancing the UV irradiance reaching the surface (e.g. Lubin and Frederick, 1991).
3.1.3 Total ozone column
The total ozone column (Ω) is predominantly a measure of the ozone content of the stratosphere, because most of the ozone of the atmosphere resides there. As ozone strongly absorbs UV radiation at wavelengths below 320 nm, the stratospheric ozone layer protects life on Earth from too intense UV radiation. Variations in the total ozone column are reflected in the UV irradiances at the surface. The larger the total ozone column, the lower the UV irradiance and vice versa. The exact relationship between total ozone and surface UV depends on the wavelength considered and also on the total ozone column and the solar zenith angle. For erythemally weighted UV and moderate to high sun (), a 1 % change in the total ozone column leads roughly to a 1–1.2 % change in the UV (Weatherhead et al., 2005).
3.1.4 Albedo
The surface UV albedo (ρs) is generally low, being of the order of 0.05 for most surfaces, as shown, for example, by the TOMS satellite data (Herman and Celarier, 1997). Surfaces covered by snow or ice, however, exhibit much higher surface albedos (Blumthaler and Ambach, 1988; Feister and Grewe, 1995). A high surface albedo may enhance the UV level at the surface significantly due to multiple scattering between the surface and the atmosphere above. It has been shown, for example, that a surface covered by fresh and clean snow (albedo 0.8) enhances the UV irradiance at 320 nm by a factor of 1.5 compared to snow-free, low albedo conditions (Lenoble, 1998).
The UV irradiance at a specific location is not only influenced by the local surface albedo at the measurement site, but also by the often inhomogeneous surface conditions of the surrounding area, extending a few tens of kilometres away from the measurement site (Degünther et al., 1998; Degünther and Meerkötter, 2000). The effect of the varying surface conditions in the surroundings of the measurement site can be represented by the effective albedo. The effective surface albedo can be thought of as the albedo required in a one-dimensional radiative transfer model in order to produce a cloud-free UV irradiance that is in agreement with measurements.
3.1.5 Aerosols
Aerosols usually decrease the level of UV radiation reaching the surface, partly by scattering radiation back to space and partly by absorption. The aerosol load of the atmosphere varies strongly in time and space. Therefore, the effect of aerosols on the UV irradiance reaching the surface also shows strong variation. During a measurement campaign in Greece in 1996, aerosols were found to decrease the UV irradiance by 5–35 % compared to aerosol-free conditions (Kylling et al., 1998). These numbers are similar to the yearly average aerosol attenuation in various parts of the globe corresponding to the aerosol correction applied in the OMI UV algorithm (Arola et al., 2009). This correction is based on the aerosol absorption optical depth (τaa) and will also be used in the TROPOMI UV algorithm (see Sect. 3.5).
3.1.6 Altitude
The UV irradiance at the surface usually increases with increasing altitude (z) (Gröbner et al., 2000). This is due to the fact that the surface pressure (ps) is smaller at higher altitude. In other words, there is less atmosphere at high altitudes, and therefore less scattering and absorption takes place. Moreover, tropospheric ozone is mostly located at low altitudes, which is also the case for other pollutants such as aerosols. At high altitudes there are also typically less clouds, or even clouds beneath acting as a reflecting surface with high albedo, thus increasing the UV irradiance compared to less elevated sites.
3.1.7 Earth–Sun distance
The Earth–Sun distance (R) varies over the course of the year because of the elliptic shape of the Earth's orbit around the Sun. Because of this variation, the irradiance at the top of the atmosphere varies as a function of 1∕R2. This variation, which is of the order of ±3 %, can be taken into account using a multiplicative factor to irradiances representing the baseline Earth–Sun distance of 1 AU.
3.2 General radiative transfer set-up
The aim of the radiative transfer set-up of the TROPOMI UV algorithm is to account for the factors influencing the surface UV irradiance discussed above. VLIDORT is a one-dimensional radiative transfer model where the vertical structure of the atmosphere is represented by 30 model layers, as depicted in Fig. 2. At the very bottom, there is a surface, which in our set-up is a Lambertian reflector characterized by its albedo. The layer 1–2 km above the surface (layer 2) includes a homogeneous water cloud. In addition, all layers include Rayleigh scattering by air molecules (p is the pressure), absorption by ozone, and temperature information.
The cloud (layer 2) consists of water droplets with a size distribution following the C1 model by Deirmendjian (1969) yielding an effective cloud droplet radius of reff=6 µm. The same cloud model has been used in the TOMS–OMI and the AC SAF UV algorithms (Krotkov et al., 2001; Kujanpää and Kalakoski, 2015).
The temperature and the ozone density of each layer in the radiative transfer model is set according to the TOMS V7 climatology (Wellemeyer et al., 1997), which gives climatological ozone and temperature profiles for three broad latitude bands (low latitude, midlatitude, and high latitude) as a function of total ozone column.
This general set-up of the VLIDORT model is used for both (i) calculating the cloud optical depth and (ii) calculating surface UV irradiances, as described in the following subsections. All radiative transfer calculations were done using the extraterrestrial solar spectrum of OMI (Dobber et al., 2008) and assuming an Earth–Sun distance of 1 AU.
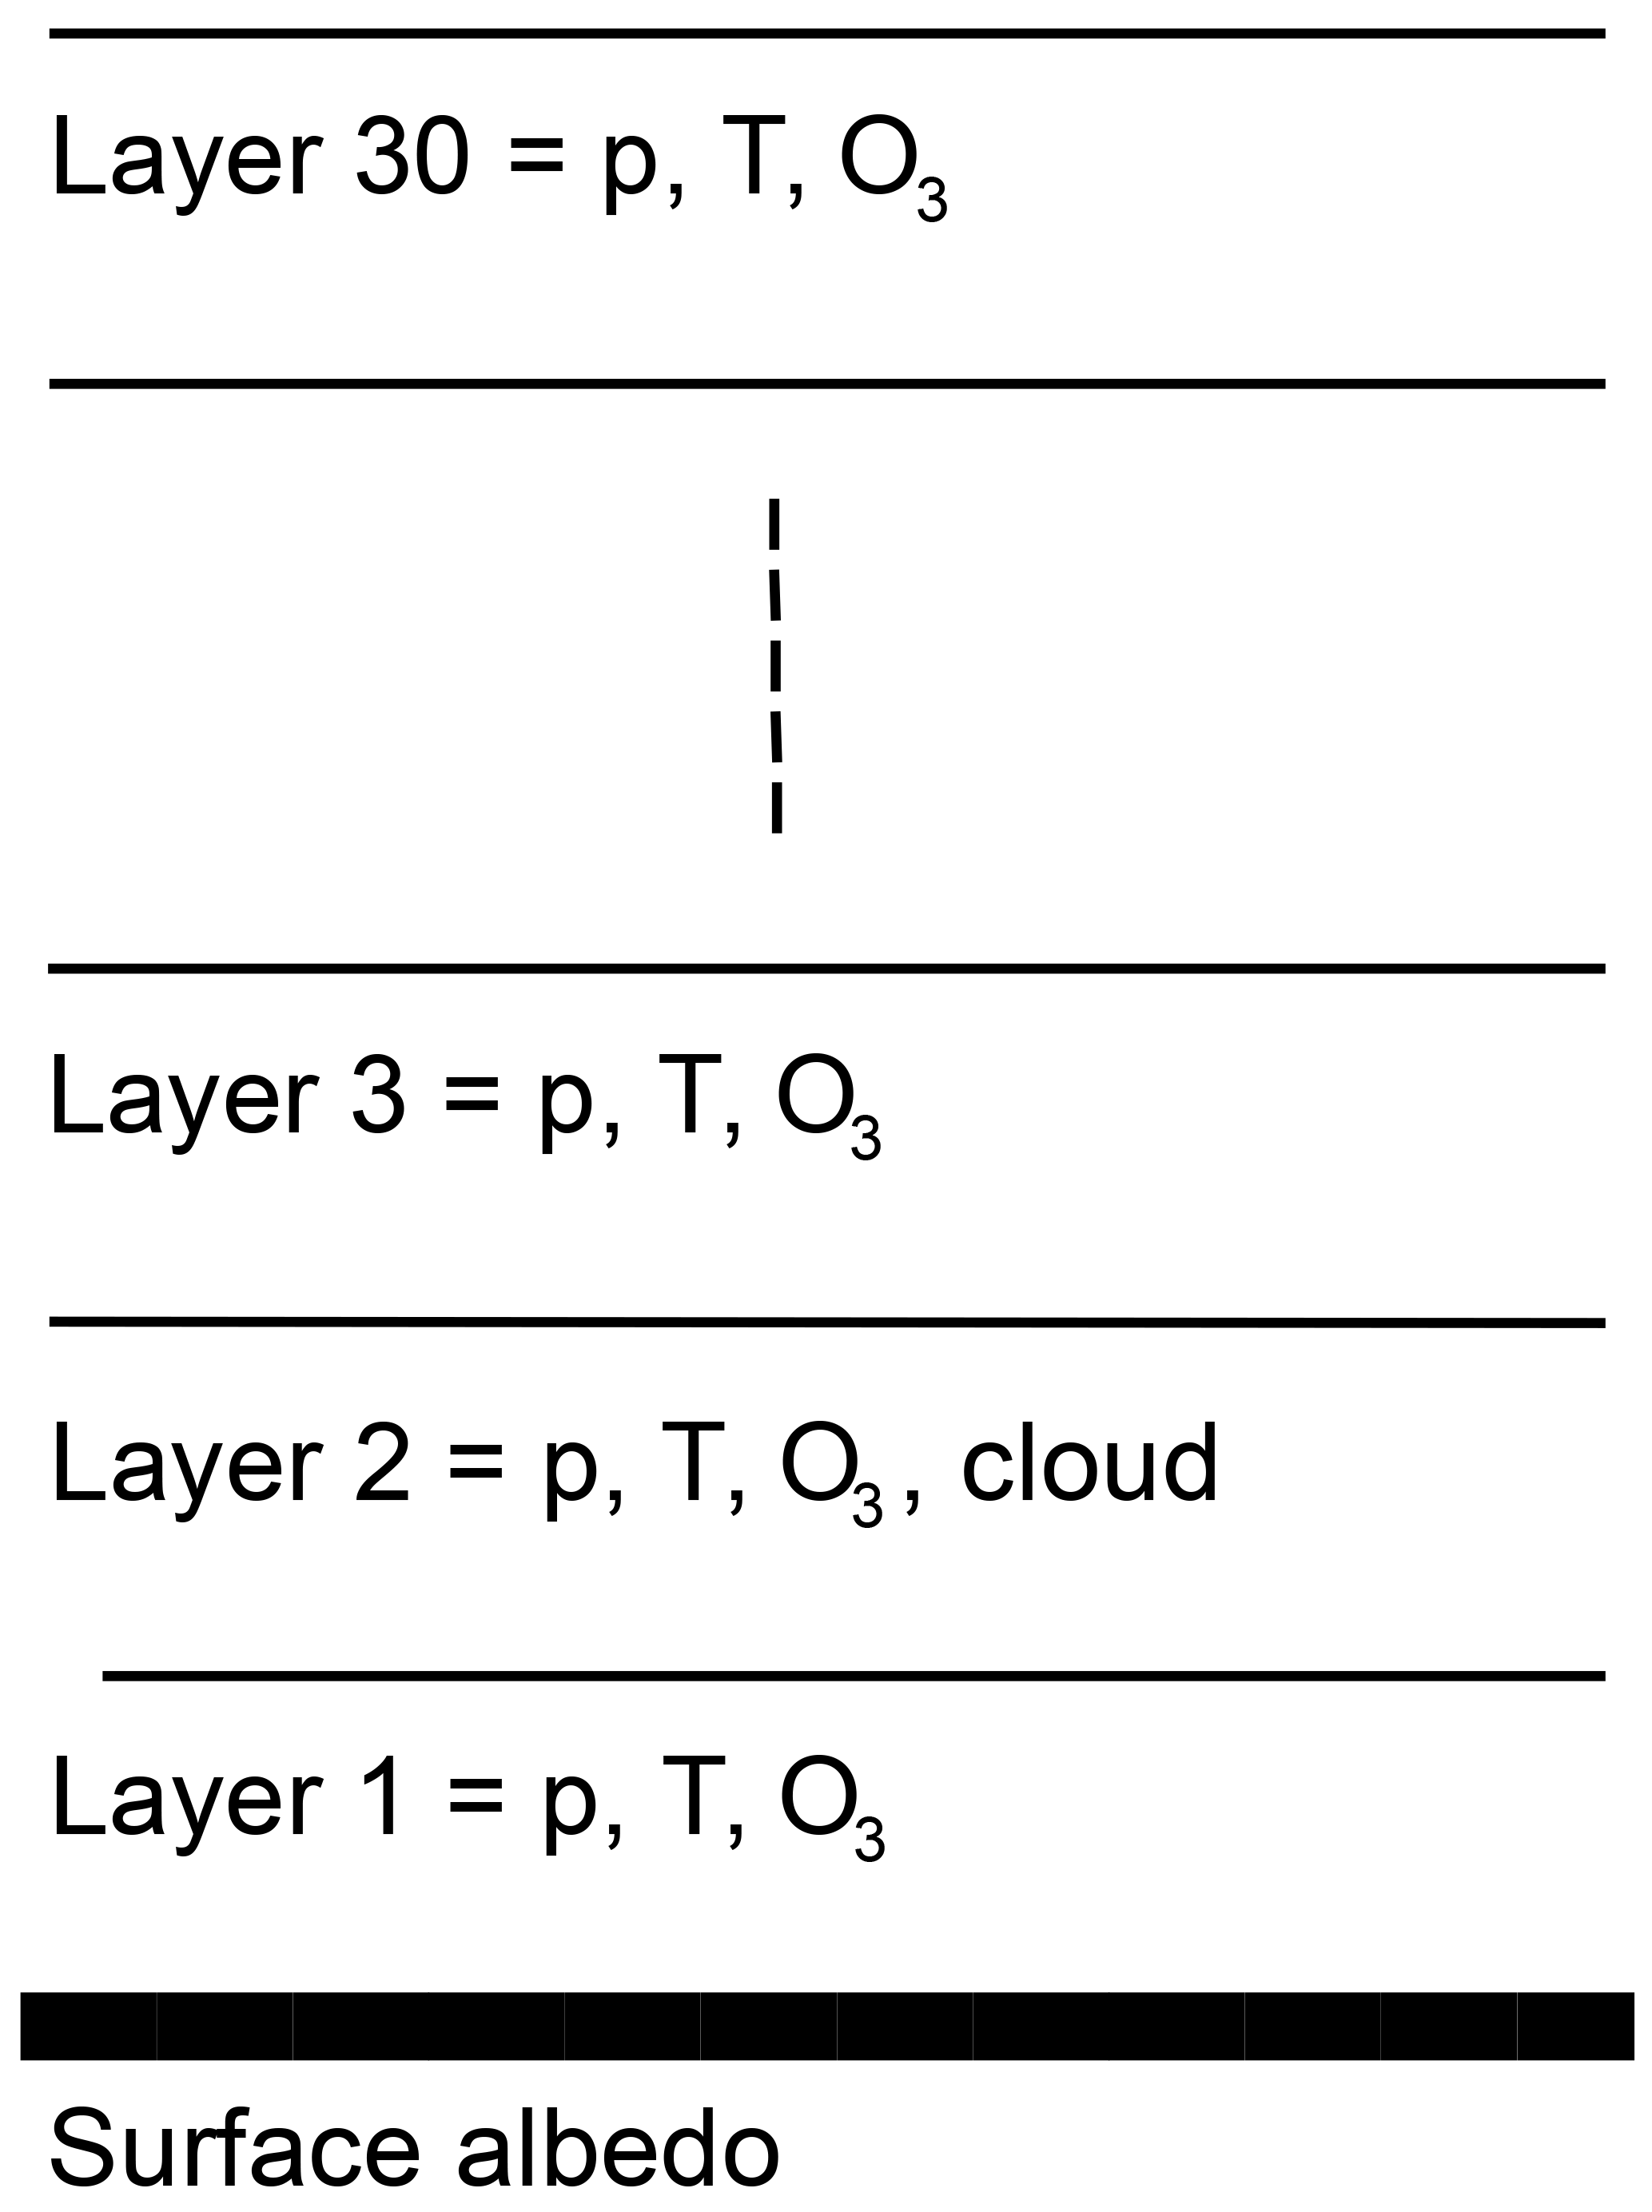
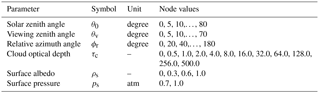
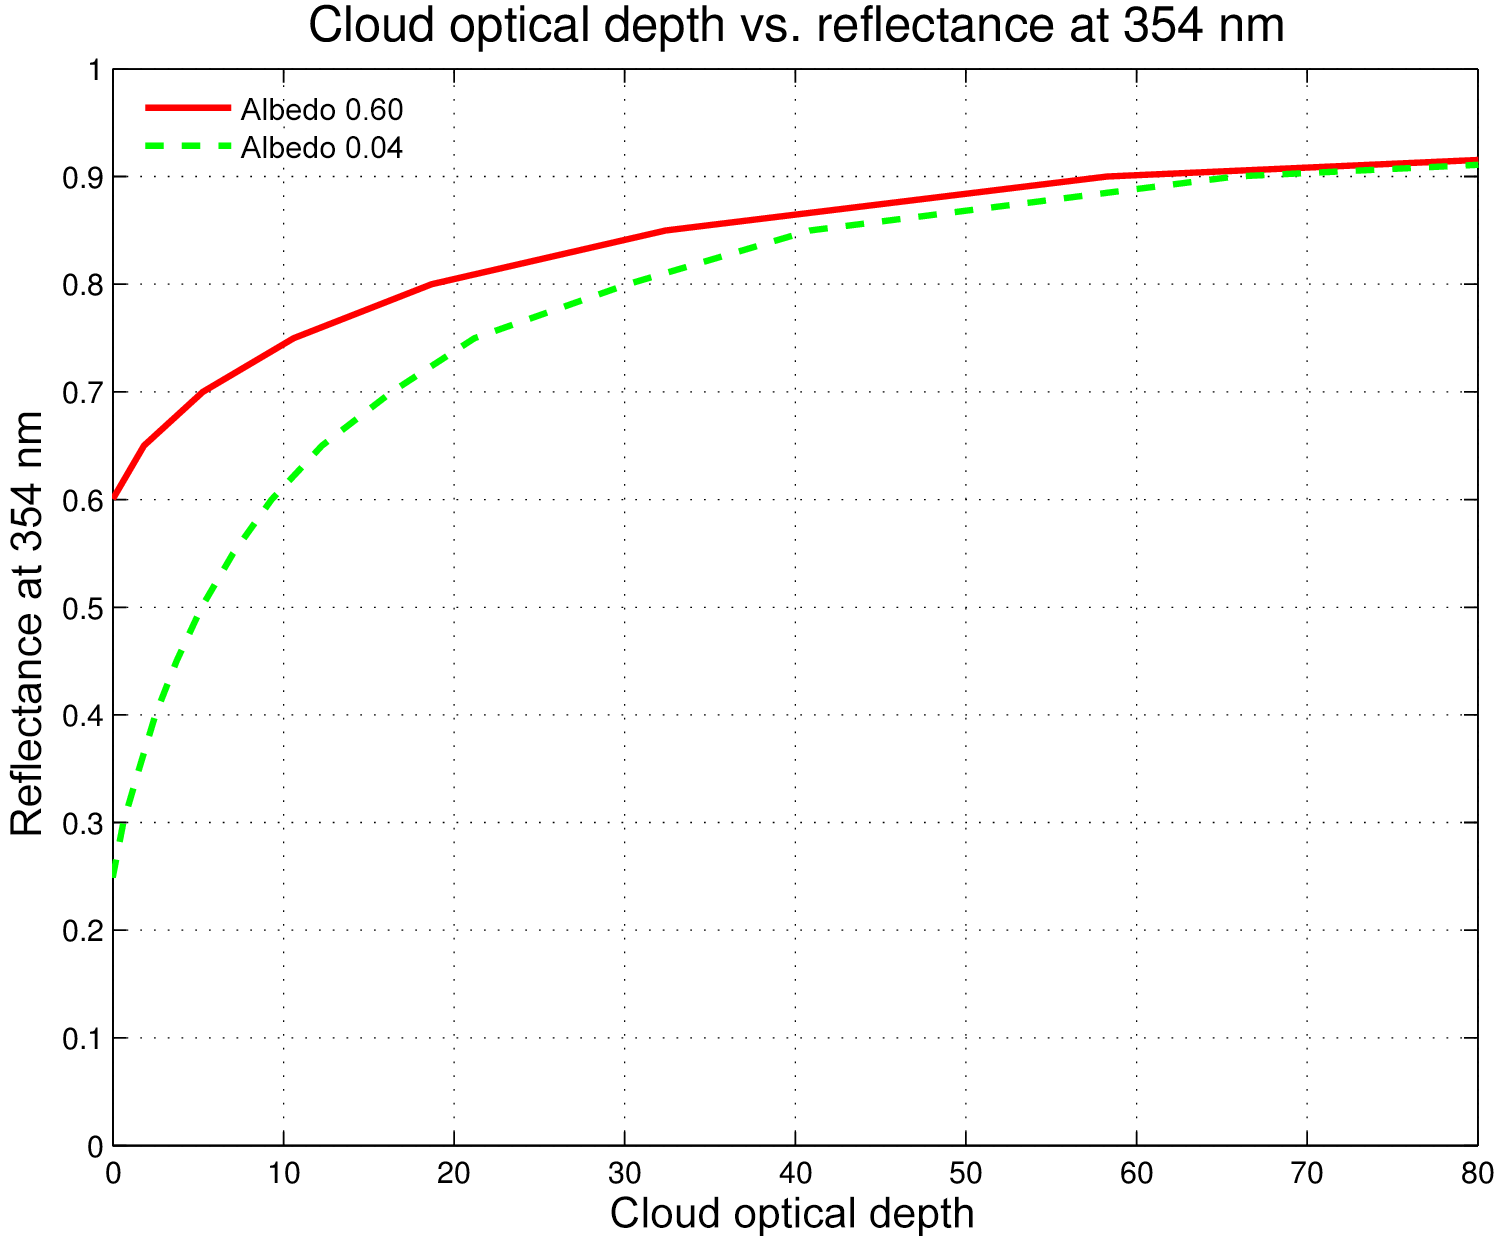
Figure 3Cloud optical depth vs. the reflectance at 354 nm according to the look-up table. For the relationship shown here, the surface pressure was ps=1 atm and the solar and viewing geometry was , , and .
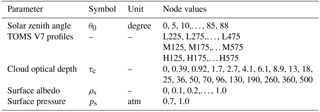
Table 2Node points of the look-up table for the dose rates and UV irradiances at selected wavelengths. The full 26 profile set of the TOMS V7 climatology is used. L, M, and H refer to the low-, middle-, and high-latitude profiles, respectively, while the numbers refer to total ozone columns in DU.
3.3 Cloud LUT
The main input used to estimate the cloud optical depth (τc) is the reflectance at 354 nm (R354). R354 is available in the TROPOMI AI L2 output, as it is also used for calculating the aerosol index. R354 is defined as (Stein Zweers, 2016, their Eq. 4-1):
where I354 is the radiance at 354 nm reflected by the Earth (atmosphere and surface) measured by TROPOMI and E0, 354 is the solar irradiance at 354 nm at the top of the atmosphere, and θ0 is the solar zenith angle. E0, 354 is measured by TROPOMI on a daily basis and is corrected for the Doppler shift in the measured spectrum due to the relative motion of the satellite with respect to the Sun. Both I354 and E0, 354 are the average over five consecutive spectral pixels centred at 354 nm of the TROPOMI instrument. Furthermore, they have both been normalized to correspond to an Earth–Sun distance of 1 AU.
In our radiative transfer calculations, the combined spectral response of these five consecutive pixels are represented by a 0.88 nm wide (corresponding to 5 pixels 0.22 nm apart), flat-top slit function with Gaussian tails, which have a width of 0.27 nm at half maximum.
The approach here is somewhat different from that used in the OMI UV algorithm, where the radiance of a single spectral pixel at 360 nm is used to determine the reflectance, from which the cloud optical depth is consecutively calculated. We believe the approach chosen for TROPOMI will constitute an improvement because (i) averaging over five channels will help reduce noise in the signal, and (ii) while there is some O2−O2 absorption at 360 nm (Thalman and Volkamer, 2013) that may influence the estimated cloud optical depth, 354 nm is free of such absorption features.
The cloud LUT was calculated using the VLIDORT radiative transfer model. R354 was calculated by systematically varying the cloud optical depth (τc), the solar zenith angle (θ0), the viewing zenith angle (θv), the relative azimuth angle (ϕr) between the sun and the satellite, the surface albedo (ρs), and the surface pressure (ps). The outcome is a look-up table spanning all relevant combinations of these parameters that gives τc as a function of the other parameters by interpolating in the multidimensional space defined by the LUT nodes. Interpolation is performed using polynomial (Lagrangian) interpolation. The base alternative is to use 4 points from the surrounding space, resulting in third-degree polynomial interpolation. If the desired point is close to the boundary of the LUT, then 3 points are used (resulting in second-degree polynomial interpolation), while for points outside the LUT space, 2 points are used (linear extrapolation). The same interpolation scheme is also used for the UV LUT (Sect. 3.4).
Note that here τc is an effective optical depth in the sense that it corresponds to the cloud optical depth of a homogeneous water cloud, as specified above, that produces the best match with the measured R354 given the other input parameters. Note that the ozone content of the atmosphere has a negligible influence on R354. Therefore, we used a constant ozone profile in these calculations, corresponding to the midlatitude TOMS V7 profile with a total ozone column of 325 DU (i.e. M325 in Table 2).
The nodes of the cloud LUT are listed in Table 1. All inputs needed to retrieve τc are based on the TROPOMI AI L2 output, except the albedo, which is based on a climatology as explained above. ps of the AI L2 output is normally based on the pressure fields of the European Centre for Medium-Range Weather Forecasts (ECMWF). In the case of missing data from the ECMWF, ps is calculated from the altitude a.s.l. using the hydrostatic equation and assuming a scale height of 8.3 km. The altitude in the AI L2 output is based on Global Multi-resolution Terrain Elevation Data 2010 (Danielson and Gesch, 2011).
To demonstrate the idea of estimating τc based on the measured R354, Fig. 3 shows τc as a function of R354 for a low albedo (ρs=0.04) and a fairly high albedo (ρs=0.60) case. For the low-albedo case, R354 increases strongly with increasing τc up to optical depths of around 20, whereafter the increase gradually levels off as R354 saturates towards large τc. Note that for the high-albedo case, R354 is less sensitive to changes in τc than for the low-albedo case. This means, in practice, that it is more difficult to accurately estimate τc for high-albedo cases. Finally, the figure also brings forth the strong Rayleigh scattering of radiation in the UV; for cloudless skies (τc=0), the low albedo R354 is around 0.25.
3.4 UV LUT
The solar irradiance at Earth's surface is a function of wavelength. Furthermore, the effect of the incoming radiation on, for example, a specific photochemical reaction or a biological response, depends on the wavelength. In order to quantify the effectiveness of radiation with respect to a specific effect, various action spectra (weighting functions) have been introduced (e.g. Aphalo et al., 2012) that can be used to calculate effective spectral irradiances and dose rates (e.g. Kujanpää and Kalakoski, 2015, Eq. 2).
The UV LUT of the TROPOMI algorithm includes UV irradiances at four selected wavelengths, namely 305, 310, 324, and 380 nm, and erythemally (Webb et al., 2011) and vitamin-D weighted UV dose rates (CIE, 2006, the tabulated data provided in the publication were linearly interpolated to obtain a complete action spectrum). Note that both the erythemal and the vitamin-D action spectrum gives large weight to radiation of wavelengths below 320 nm (see Fig. 3 in Kujanpää and Kalakoski, 2015).
Similarly to the cloud LUT, the LUT for UV irradiances and dose rates was created by running the radiative transfer model by systematically varying the following input parameters: θ0, Ω, τc, ρs, and ps. Table 2 lists the nodes chosen for the UV LUT. Here, the ozone profile follows the TOMS V7 climatology as explained above.
For comparison with ground-based measurements of UV irradiances, it is worth noting that all calculations for the UV LUT were done using a triangular 1 nm full-width-at-half-maximum (FWHM) slit function, which is commonly used as a standard slit function, for example, when comparing different ground-based spectrometers (Gröbner et al., 2005). Note also that the wavelengths of the extraterrestrial spectrum used in our radiative transfer calculations (Dobber et al., 2008) have been corrected to correspond to wavelengths in the atmosphere rather than in a vacuum.
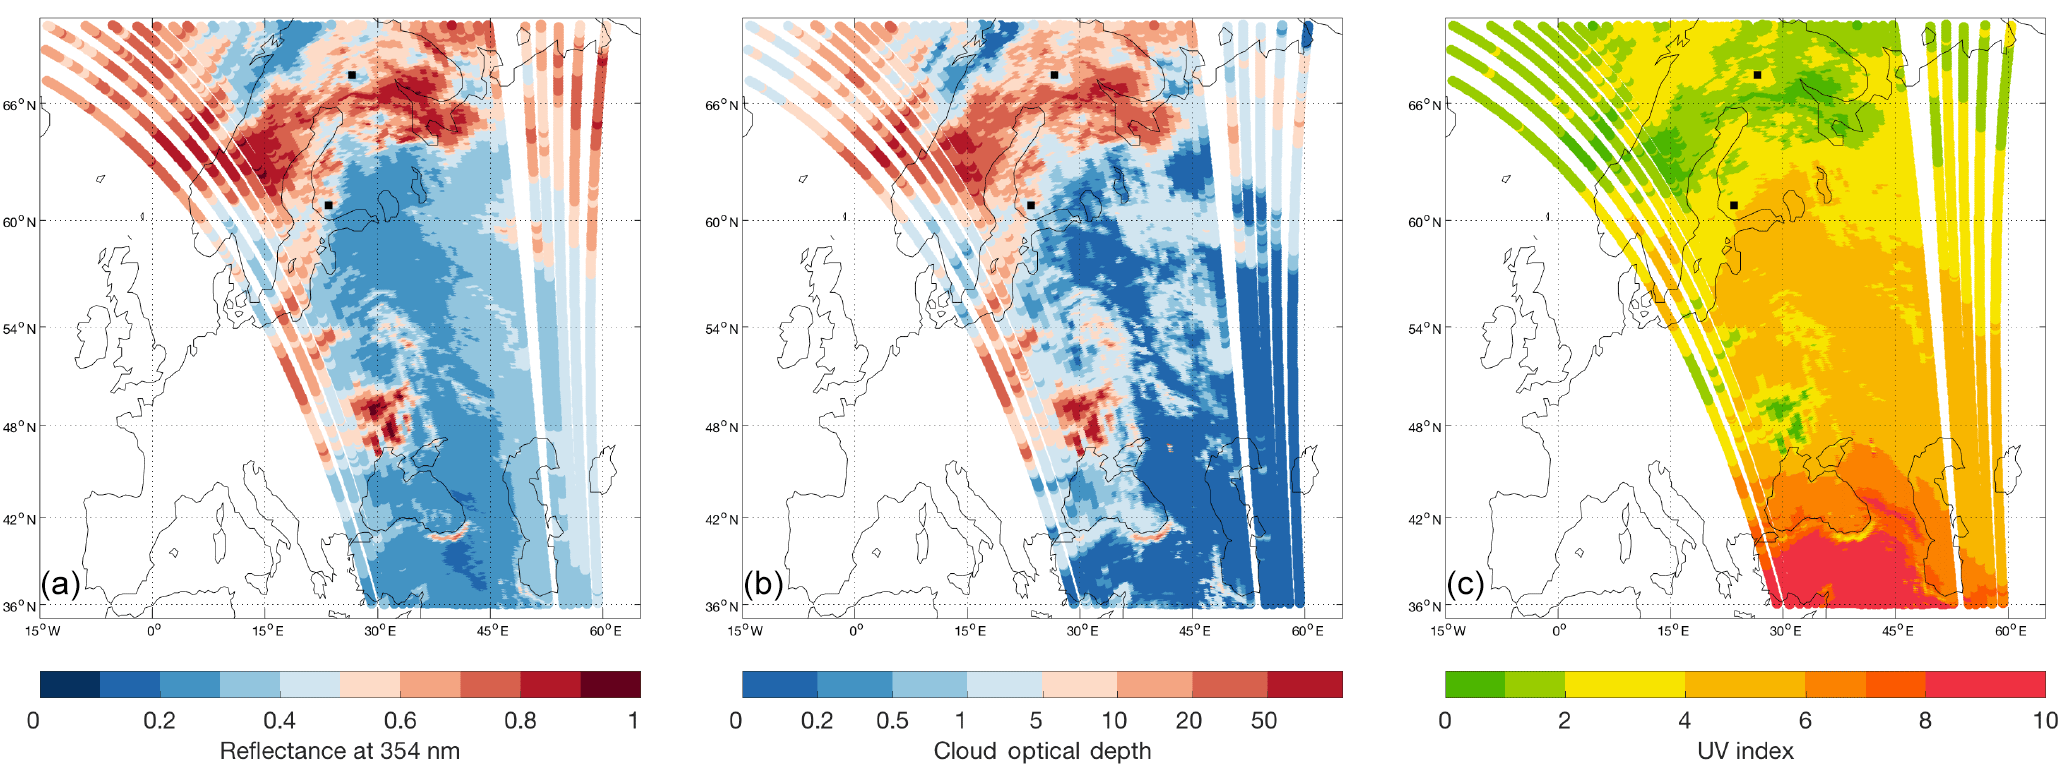
Figure 4The reflectance at 354 nm (a), the cloud optical depth (b), and the UV index at solar noon (c) of the TROPOMI UV algorithm based on OMI test data for 13 August 2007. Jokioinen (south-western Finland) and Sodankylä (northern Finland) are marked with black squares.
3.5 Daily cycle and post-processing
The calculated UV quantities are corrected for the variation in the Earth–Sun distance (see Sect. 3.1) and the attenuation caused by absorbing aerosols in a post-processing step. After these corrections have been applied, the daily doses and daily accumulated irradiances are calculated by integrating over the 24 h time window centred at local solar noon. For this, a time step of half an hour is used. It is worth emphasizing that the TROPOMI UV algorithm does not account for variation in the cloud cover within the day, but instead assumes that the cloud optical depth inferred from the overpass measurement is valid for the whole day.
The absorbing aerosol correction follows the approach of Arola et al. (2009) used in the OMI UV algorithm. It is based on a monthly aerosol climatology by Kinne et al. (2013). The correction is a multiplicative factor (Ca) which depends on the aerosol absorption optical depth (τaa):
Here, the factor 3 in the denominator represents average conditions according to earlier studies on the behaviour of satellite-estimated UV compared to ground-based measurements and its dependence on τaa (Krotkov et al., 2005; Arola et al., 2005). Arola et al. (2009) found a significantly reduced bias in the OMI UV product compared to ground-based measurements over Europe after this correction had been applied.
The aerosol absorption optical depth depends on wavelength, but so does the aerosol correction factor (Ca) that is applied in the TROPOMI UV algorithm. Here, we utilize the aerosol optical depth and single scattering albedo at 290, 315, 345, and 380 nm, available in the aerosol climatology. These values are linearly interpolated to the wavelengths included in the TROPOMI UV algorithm, after which the wavelength-specific τaa is calculated. For the UV irradiances at selected wavelengths (i.e. 305, 310, 324, and 380 nm), the TROPOMI UV algorithm applies a wavelength-specific aerosol correction. For the erythemally weighted and vitamin-D weighted UV irradiances, the aerosol correction corresponding to 310 nm is applied.
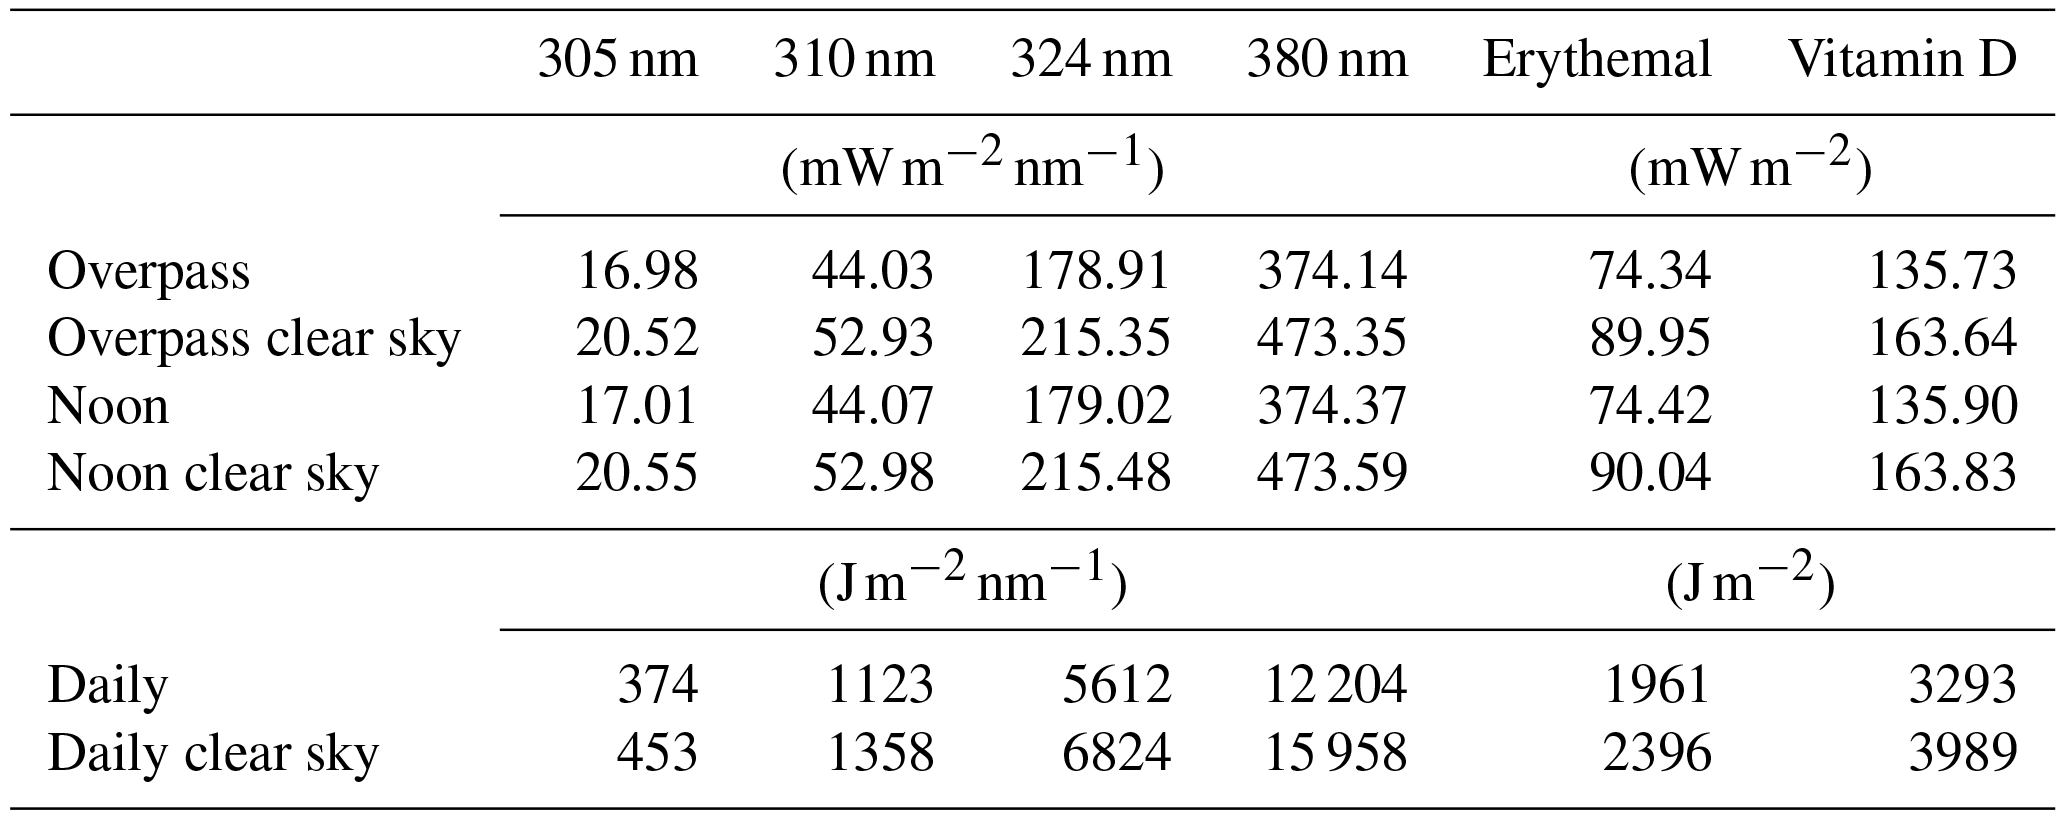
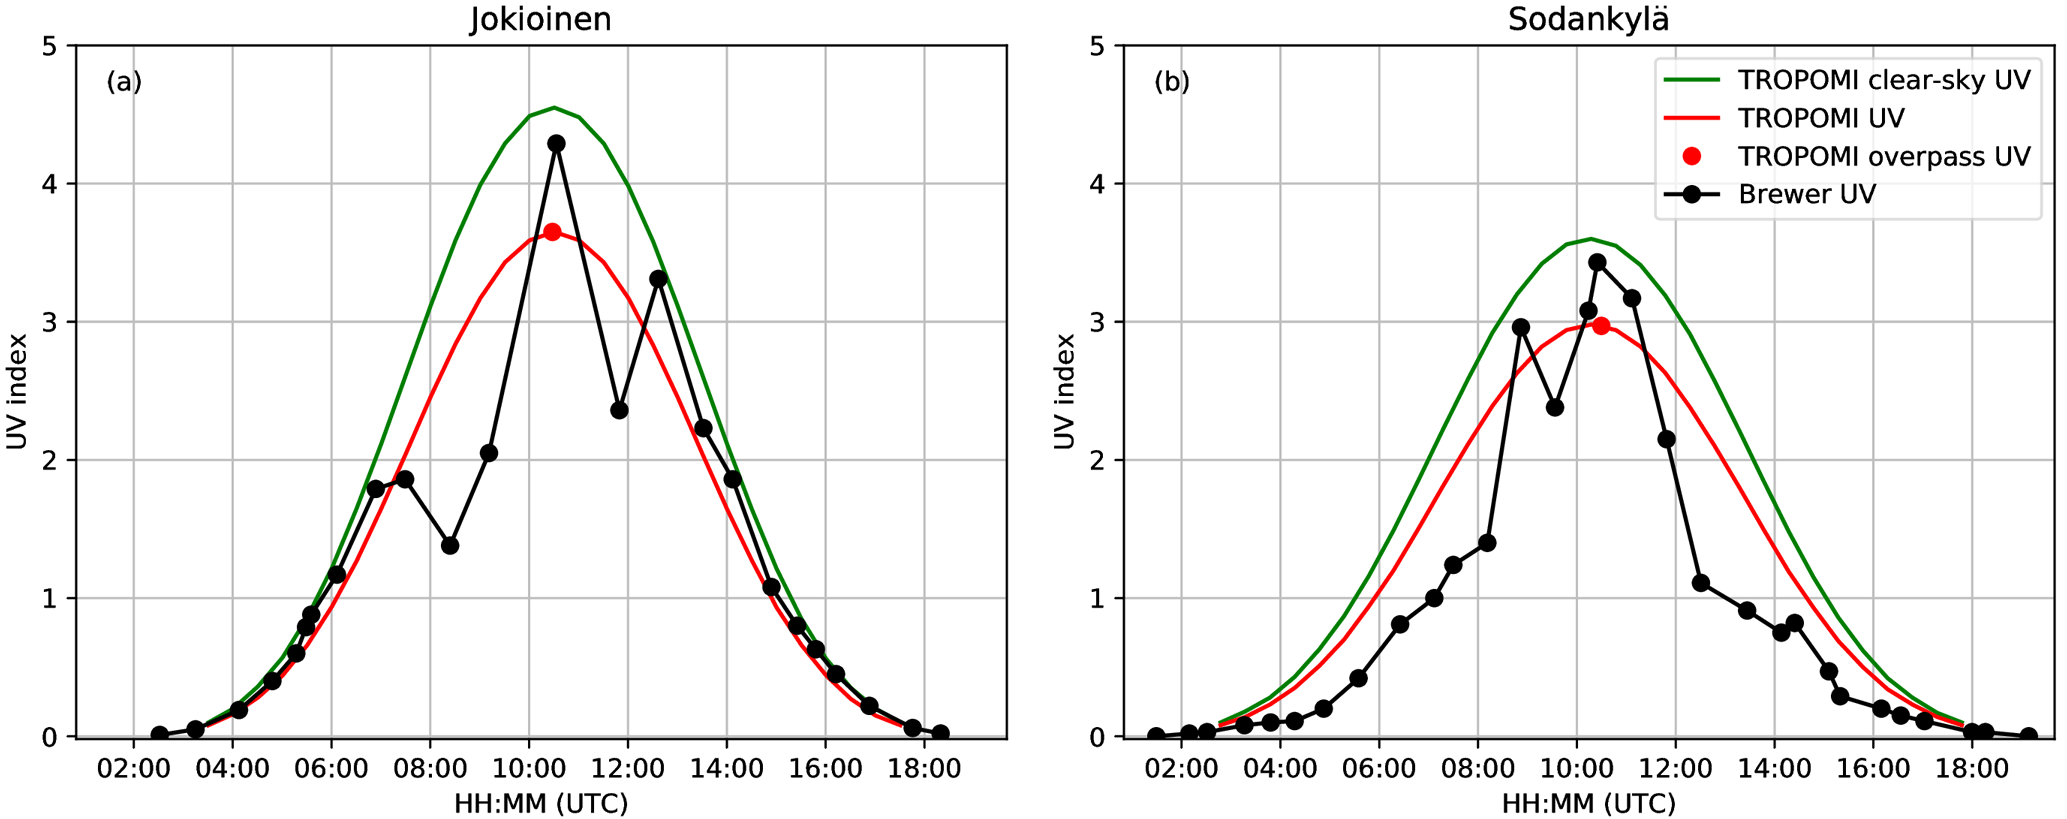
Figure 5The UV index as measured by a Brewer spectrophotometer in (a) Jokioinen, and (b) Sodankylä on 13 August 2007 together with results from the TROPOMI UV algorithm based on OMI measurements.
4.1 Output and example results
The TROPOMI L2 UV product includes the following UV quantities: the UV irradiance at 305, 310, 324, and 380 nm; the erythemally weighted UV; the vitamin-D weighted UV. Each of these are available as (i) a daily dose or daily accumulated irradiance, (ii) overpass dose rate or irradiance, and (iii) local noon dose rate or irradiance. In addition, all quantities are available corresponding to actual cloud conditions and as clear-sky values, corresponding to otherwise the same conditions but assuming a cloud-free atmosphere. This makes 36 UV parameters altogether (see Table 3).
The L2 aerosol index and total ozone column products used as input to the UV product are both based on measurements taken by TROPOMI's UVVIS spectrometer, band 3, which covers the wavelength range 320–405 nm (Loots et al., 2016). The ground resolution of these measurements, and thus also of the TROPOMI UV product, is 7×3.5 km2 in nadir, while the largest pixels throughout the swath are foreseen to be roughly 9×14 km2. The TROPOMI swath consists of 450 across-track pixels.
During the development of the TROPOMI UV algorithm, the UV processor software has been tested using GOME-2 and OMI satellite data as a surrogate for real TROPOMI measurements. The GOME-2 and OMI data have been processed using the TROPOMI aerosol index (Stein Zweers, 2016) and total ozone (Spurr et al., 2016) algorithms to produce realistic TROPOMI-like L2 output.
Figure 4 shows, as an example, the reflectance at 354 nm, the retrieved cloud optical depth, and the UV index of solar noon produced using OMI-based test data for 13 August 2007, processed to yield L2 aerosol index and total ozone output files that were given as input to the TROPOMI UV algorithm. The Finnish UV measurement stations Jokioinen (south-western Finland) and Sodankylä (northern Finland) are marked on the map. The OMI overpass time for both stations was close to 10:30 UTC and less than 15 min from local solar noon.
The figure shows relatively high reflectances (R354) corresponding to cloudy areas over the central Baltic (east of Sweden) as well as over large parts of Sweden, Norway, Finland, and the Kola Peninsula. The cloud optical depth in these areas varies from values below 5 to values over 50. Over the western part of Russia, on the other hand, there is a rather cloud-free region extending to the south-eastern part of Finland. In this area, cloud optical depths are below 1.
The figure also shows the UV index (UVI) at local solar noon. The UVI has been introduced by the World Health Organization (WHO, 2002) as a tool for informing the public about UV radiation. Thus, here we use the UVI to demonstrate the example output of the TROPOMI UV algorithm. The UVI is formulated based on the erythemally weighted UV dose rate, scaled to reach a convenient number (i.e. the UVI is the erythemal dose rate in W m−2 multiplied by 40).
The solar noon UVI of Fig. 4 reflects the aforementioned variations in the cloud optical depth. Also, the noon solar zenith angle has a strong influence on the UVI. UVI <2 prevails in the cloudy Scandinavian and North Atlantic areas, while UVI >4 is present in the relatively cloud-free areas of south-eastern Finland and western Russia. Further south, cloud-free areas with UVI >8 can be seen south of the Black Sea, and also in the mountainous regions between the Black Sea and the Caspian Sea, where an influence of the altitude can be observed. South of the Black Sea, in the immediate vicinity of the coast, there is a crescent-shaped area showing UVI <4, with corresponding relatively high reflectivity and cloud optical depth. Meteorological satellite products (Meteosat SEVIRI data collected by the Finnish Meteorological Institute; not shown) confirm that clouds are present over this area.
Figure 5 shows a more detailed comparison of the TROPOMI UV product with ground-based measurements taken by Brewer spectroradiometers (Lakkala et al., 2008) of the Finnish Meteorological Institute. Table 3 lists all 36 UV quantities of the L2 TROPOMI UV output for the satellite pixel closest to Sodankylä.
The UVI measured by the Brewer spectrophotometer in Sodankylä (Fig. 5) shows reduced values due to clouds during the morning and afternoon hours, while the values around noon are close to those expected for cloud-free conditions. Also for Jokionen, the Brewer-measured UVI is close to expected values for cloud-free conditions, although the midday hours in general are somewhat cloudy. The very morning and late afternoon hours in Jokioinen also appear cloud-free, with good agreement between the TROPOMI clear-sky UVI and that measured by the Brewer. The retrieved effective cloud optical depths are 2.3 and 3.0 for Sodankylä and Jokioinen, indicating the presence of a cloud over both stations during the satellite overpass. This is consistent with both the Brewer UV measurements and with supporting satellite data (AVHRR data collected by the Finnish Meteorological Institute; not shown). Finally, Fig. 5 also demonstrates the effect of assuming that the overpass cloud optical depth is valid throughout the day: while the Brewer measurements indicate significant variability in the UV irradiance caused by clouds, the TROPOMI UV (red curve) is evenly attenuated throughout the day.
4.2 Expected uncertainty
The errors associated with the estimated UV quantities using the TROPOMI UV algorithm are expected to be similar to the errors of the heritage algorithms, namely the OMI surface UV product, which is most similar to that of TROPOMI. For TROPOMI, no validation results are yet available, while OMI has been scrutinized in comparison to ground-based measurements in a number of studies presented in the literature.
For OMI, Tanskanen et al. (2007) summarized their validation results as follows:
For flat, snow-free regions with modest loadings of absorbing aerosols or trace gases, the OMI-derived daily erythemal doses have a median overestimation of 0–10 %, and some 60 to 80 % of the doses are within ±20 % from the ground reference. For sites significantly affected by absorbing aerosols or trace gases one expects, and observes, bigger positive bias up to 50 %. For high-latitude sites the satellite-derived doses are occasionally up to 50 % too small because of unrealistically small climatological surface albedo.
After inclusion of the absorbing aerosol correction in the OMI algorithm, it is expected that the overestimation due to aerosols should have reduced considerably, which indeed was the case for the European stations included in the study of Arola et al. (2009). However, even after this correction, a systematic overestimation of 20–30 % remained for Rome (Italy) and Reading (England). Furthermore, it is worth noting that the aerosol climatology represents typical or average conditions, which means that day-to-day variations in the aerosol load at polluted locations may still cause occasional strong overestimation in the surface UV.
A recent study by Bernhard et al. (2015) assessed errors in the OMI UV over high latitudes, caused by inaccuracies in the surface UV albedo climatology used in the algorithm. Their results show that the OMI UV can have a bias exceeding 50 % – in both negative and positive directions – when the OMI surface albedo is too high or too low. Note, however, that, although the percentage error may seem large, the figures of Bernhard et al. (2015) correspond to conditions with relatively low sun and therefore the errors remain small on an absolute scale.
A more comprehensive uncertainty analysis of the TROPOMI UV product is planned, which will be based on uncertainties in the inputs given to the LUTs and how the uncertainties of all input parameters combined influence the estimated surface UV.
This paper describes the TROPOMI UV algorithm. The algorithm has been tested using realistic input, based on OMI and GOME-2 satellite measurements. These preliminary results indicate that the algorithm is functioning according to expectations, also when compared with ground-based Brewer spectrophotometer UV measurements in Finland. A proper evaluation of the performance of the TROPOMI UV product can, however, only be done after the launch, when real data start becoming available.
There is a strong need for continued monitoring of the UV radiation reaching the Earth's surface. The TROPOMI UV record will build upon the heritage of satellite-retrieved surface UV that starts with TOMS in 1978 and continues to the present thanks to the OMI UV record (see, e.g. Ialongo et al., 2011).
The Brewer UV data are available through the European UV database, EUVDB, http://uv.fmi.fi/uvdb/ (Heikkilä et al., 2016). The satellite data used are available from the corresponding author on request.
AVL designed the presented algorithm with help from all co-authors. AVL, JK, and NK implemented the algorithm with help from NAK, MS, AA and JT. AH, KL and TM helped to interpret the results. All co-authors participated in writing the manuscript.
The authors declare that they have no conflict of interest.
This article is part of the special issue on “TROPOMI on
Sentinel-5 Precursor: data products and algorithms”. It is not associated
with a conference.
Edited by: Jhoon Kim
Reviewed by: two anonymous referees
Aphalo, P., Albert, A., Björn, L., Ylianttila, L., Figueroa, F. L., and Huovinen, P.: Beyond the Visible: A Handbook of Best Practice in Plant UV Photobiology, Chap. 1 Introduction, 21–27, COST Action FA0906 UV4growth. University of Helsinki, Department of Biosciences, Division of Plant Biology, Helsinki, 2012. a
Arola, A., Kazadzis, S., Krotkov, N., Bais, A., Gröbner, J., and Herman, J. R.: Assessment of TOMS UV bias due to absorbing aerosols, J. Geophys. Res., 110, D23211, https://doi.org/10.1029/2005JD005913, 2005. a
Arola, A., Kazadzis, S., Lindfors, A., Krotkov, N., Kujanpää, J., Tamminen, J., Bais, A., di Sarra, A., Villaplana, J. M., Brogniez, C., Siani, A. M., Janouch, M., Weihs, P., Webb, A., Koskela, T., Kouremeti, N., Meloni, D., Buchard, V., Auriol, F., Ialongo, I., Staneck, M., Simic, S., Smedley, A., and Kinne, S.: A new approach to correct for absorbing aerosols in OMI UV, Geophys. Res. Lett., 36, L22805, https://doi.org/10.1029/2009GL041137, 2009. a, b, c, d, e, f
Bernhard, G., Arola, A., Dahlback, A., Fioletov, V., Heikkilä, A., Johnsen, B., Koskela, T., Lakkala, K., Svendby, T., and Tamminen, J.: Comparison of OMI UV observations with ground-based measurements at high northern latitudes, Atmos. Chem. Phys., 15, 7391–7412, https://doi.org/10.5194/acp-15-7391-2015, 2015. a, b
Blumthaler, M. and Ambach, W.: Solar UVB-albedo of various surfaces, Photochem. Photobiol., 48, 85–88, 1988. a
Bugliaro, L., Mayer, B., Meerkötter, R., and Verdebout, J.: Potential and limitations of space-based methods for retrieval of surface UV-B daily doses: a numerical study, J. Geophys. Res., 111, D23207, https://doi.org/10.1029/2005JD006534, 2006. a
Calbo, J., Pages, D., and Gonzalez, J.-A.: Empirical studies of cloud effects on UV radiation: a review, Rev. Geophys., 43, 1–28, https://doi.org/10.1029/2004RG000155, 2005. a
CIE: Action spectrum for the production of previtamin D3 in human skin, Tech. Rep. 174, Commission Internationale de l'Eclairage (International Commission on Illumination), Vienna, Austria, 2006. a
Ciren, P. and Li, Z.: Long-term global Earth surface ultraviolet radiation exposure derived from ISCCP and TOMS satellite measurements, Agr. Forest Meteorol., 120, 51–68, 2003. a
Danielson, J. J. and Gesch, D. B.: Global multi-resolution terrain elevation data 2010 (GMTED2010), Tech. Rep. 2011–1073, U.S. Geological Survey, Reston, Virginia, 2011. a
Degünther, M. and Meerkötter, R.: Influence of inhomogeneous surface albedo on UV irradiance: effect of a stratus cloud, J. Geophys. Res., 105, 22755–22761, 2000. a
Degünther, M., Meerkötter, R., Albold, A., and Seckmeyer, G.: Case study on the influence of inhomogeneous surface albedo on UV irradiance, Geophys. Res. Lett., 25, 3587–3590, 1998. a
Deirmendjian, D.: Electromagnetic Scattering on Spherical Polydispersions, American Elsevier Publishing Company Inc., New York, 1969. a
den Outer, P. N., Slaper, H., and Tax, R. B.: UV radiation in the Netherlands: assessing long-term variability and trends in relation to ozone and clouds, J. Geophys. Res., 110, D02203, https://doi.org/10.1029/2004JD004824, 2005. a
Dobber, M., Voors, R., Dirksen, R., Kleipool, Q., and Levelt, P.: The high-resolution solar reference spectrum between 250 and 550 nm and its application to measurements with the ozone monitoring instrument, Sol. Phys., 249, 281–291, https://doi.org/10.1007/s11207-008-9187-7, 2008. a, b
Eck, T. F., Bhartia, P. K., and Kerr, J. B.: Satellite estimation of spectral UVB irradiance using TOMS derived total ozone and UV reflectivity, Geophys. Res. Lett., 22, 611–614, 1995. a, b
Farman, J. C., Gardiner, B. G., and Shanklin, J. D.: Large losses of total ozone in Antarctica reveal seasonal ClOx∕NOx interaction, Nature, 315, 207–210, 1985. a
Feister, U. and Grewe, R.: Spectral albedo measurements in the UV and visible region over different types of surfaces, Photochem. Photobiol., 62, 736–744, 1995. a
Gadhavi, H., Pinker, R. T., and Laszlo, I.: Estimates of surface ultraviolet radiation over north America using geostationary operational environmental satellites observations, J. Geophys. Res., 113, D21205, https://doi.org/10.1029/2007JD009308, 2008. a
Gröbner, J., Albold, A., Blumthaler, M., Cabot, T., De la Casiniere, A., Lenoble, J., Martin, T., Masserot, D., Muoeller, M., Philipona, R., Pichler, T., Pougatch, E., Rengarajan, G., Schmucki, D., Seckmeyer, G., Sergent, C., Toureo, M., and Weihs, P.: Variability of spectral solar ultraviolet irradiance in an Alpine environment, J. Geophys Res., 105, 26991–27003, 2000. a
Gröbner, J., Schreder, J., Kazadzis, S., Bais, A. F., Blumthaler, M., Görts, P., Tax, R., Koskela, T., Seckmeyer, G., Webb, A. R., and Rembges, D.: Traveling reference spectroradiometer for routine quality assurance of spectral solar ultraviolet irradiance measurements, Appl. Optics, 44, 5321–5331, https://doi.org/10.1364/AO.44.005321, 2005. a
Heikkilä, A., Kaurola, J., Lakkala, K., Karhu, J. M., Kyrö, E., Koskela, T., Engelsen, O., Slaper, H., and Seckmeyer, G.: European UV DataBase (EUVDB) as a repository and quality analyser for solar spectral UV irradiance monitored in Sodankylä, Geosci. Instrum. Method. Data Syst., 5, 333–345, https://doi.org/10.5194/gi-5-333-2016, 2016 (data available at: http://uv.fmi.fi/uvdb/, last access: 12 February 2018).
Herman, J. R. and Celarier, E. A.: Earth surface reflectivity climatology at 340 nm to 380 nm from TOMS data, J. Geophys. Res., 102, 28003–28011, 1997. a, b
Herman, J. R., Labow, G., Hsu, N. C., and Larko, D.: Changes in cloud and aerosol cover (1980–2006) from reflectivity time series using SeaWiFS, N7-TOMS, EP-TOMS, SBUV-2, and OMI radiance data, J. Geophys. Res.-Atmos., 114, D01201, https://doi.org/10.1029/2007JD009508, 2009. a, b
Ialongo, I., Arola, A., Kujanpää, J., and Tamminen, J.: Use of satellite erythemal UV products in analysing the global UV changes, Atmos. Chem. Phys., 11, 9649–9658, https://doi.org/10.5194/acp-11-9649-2011, 2011. a
Josefsson, W. and Landelius, T.: Effect of clouds on UV irradiance: as estimated from cloud amount, cloud type, precipitation, global radiation and sunshine duration, J. Geophys. Res., 105, 4927–4935, 2000. a
Kinne, S., O'Donnel, D., Stier, P., Kloster, S., Zhang, K., Schmidt, H., Rast, S., Giorgetta, M., Eck, T. F., and Stevens, B.: MAC-v1: a new global aerosol climatology for climate studies, J. Adv. Model. Earth Sy., 5, 704–740, https://doi.org/10.1002/jame.20035, 2013. a
Krotkov, N. A., Bhartia, P. K., Herman, J. R., Fioletov, V., and Kerr, J. B.: Satellite estimation of spectral surface UV irradiance in the presence of tropospheric aerosols 1: cloud-free case, J. Geophys. Res., 103, 8779–8793, 1998. a
Krotkov, N. A., Bhartia, P. K., Herman, J. R., Ahmad, Z., and Fioletov, V.: Satellite estimation of spectral surface UV irradiance 2: effect of horizontally homogeneous clouds and snow, J. Geophys. Res., 106, 11743–11759, 2001. a, b, c, d, e
Krotkov, N., Bhartia, P. K., Herman, J., Slusser, J., Scott, G., Labow, G., Vasilkov, A. P., Eck, T. F., and Holben, B.: Aerosol ultraviolet absorption experiment (2002 to 2004) – Part 2: absorption optical thickness, refractive index, and single scattering albedo, Opt. Eng., 44, 041005, https://doi.org/10.1117/1.1886819, 2005. a
Kujanpää, J. and Kalakoski, N.: Operational surface UV radiation product from GOME-2 and AVHRR/3 data, Atmos. Meas. Tech., 8, 4399–4414, https://doi.org/10.5194/amt-8-4399-2015, 2015. a, b, c, d, e, f
Kylling, A., Bais, A. F., Blumthaler, M., Schreder, J., Zerefos, C. S., and Kosmidis, E.: Effect of aerosols on solar UV irradiances during photochemical activity and solar ultraviolet radiation campaign, J. Geophys. Res., 103, 26051–26060, 1998. a
Lakkala, K., Arola, A., Heikkilä, A., Kaurola, J., Koskela, T., Kyrö, E., Lindfors, A., Meinander, O., Tanskanen, A., Gröbner, J., and Hülsen, G.: Quality assurance of the Brewer spectral UV measurements in Finland, Atmos. Chem. Phys., 8, 3369–3383, https://doi.org/doi.org/10.5194/acp-8-3369-2008, 2008. a
Lenoble, J.: Modeling of influence of snow reflectance on ultraviolet irradiance for cloudless sky, Appl. Optics, 37, 2441–2447, 1998. a
Lindfors, A. and Arola, A.: On the wavelength-dependent attenuation of UV radiation by clouds, Geophys. Res. Lett., 35, L05806, https://doi.org/10.1029/2007GL032571, 2008. a, b
Lindfors, A., Kaurola, J., Arola, A., Koskela, T., Lakkala, K., Josefsson, W., Olseth, J. A., and Johnsen, B.: A method for reconstruction of past UV radiation based on radiative transfer modeling: applied to four stations in northern Europe, J. Geophys. Res., 112, D23201, https://doi.org/10.1029/2007JD008454, 2007. a
Lindfors, A., Tanskanen, A., Arola, A., van der A, R., Bais, A., Feister, U., Janouch, M., Josefsson, W., Koskela, T., Lakkala, K., den Outer, P. N., Smedley, A. R. D., Slaper, H., and Webb, A. R.: The PROMOTE UV record: toward a global satellite-based climatology of surface ultraviolet irradiance, IEEE J. Sel. Top. Appl., 2, 207–212, https://doi.org/10.1109/JSTARS.2009.2030876, 2009. a
Loots, E., Babic, L., Kissi-Ameyaw, J., Smeets, J., Braak, R., Kleipool, Q., Ludewig, A., Vacanti, G., Dierssen, W., Leloux, J., and Rozemeijer, N.: Algorithm theoretical basis document for the TROPOMI L01b data processor, Tech. rep., Royal Netherlands Meteorological Institute, De Bilt, 2016. a
Lubin, D. and Frederick, J. E.: The ultraviolet radiation environment of the Antarctic peninsula: the roles of ozone and cloud cover, J. Appl. Meteorol., 30, 478–493, 1991. a
Matthijsen, J., Slaper, H., Reinen, A. G. M., and Velders, G. J. M.: Reduction of solar UV by clouds: a remote sensing approach compared with ground based measurements, J. Geophys. Res., 105, 5069–5080, 2000. a
Spurr, R. J.: VLIDORT: a linearized pseudo-spherical vector discrete ordinate radiative transfer code for forward model and retrieval studies in multilayer multiple scattering media, J. Quant. Spectrosc. Ra., 102, 316–342, https://doi.org/10.1016/j.jqsrt.2006.05.005, 2006. a
Spurr, R., Loyola, D., Roozendael, M. V., and Lerot, C.: S5P/TROPOMI Total Ozone ATBD, available at: http://www.tropomi.eu/data-products/level-2-products (last access: 5 February 2018), issue 1.0, 2016. a, b
Stein Zweers, D.: TROPOMI ATBD of the UV aerosol index, available at: http://www.tropomi.eu/data-products/level-2-products (last access: 5 February 2018), issue 1.0, 2016. a, b, c
Tanskanen, A.: Lambertian surface albedo climatology at 360 nm from TOMS data using moving time-window technique, in: OZONE, Proceedings XX Quadrennial Ozone Symposium, 1–8 June 2004, vol. II, 1159–1160, Athens, Greece, 2004. a
Tanskanen, A., Krotkov, N., Herman, J. R., and Arola, A.: Surface ultraviolet irradiance from OMI, IEEE T. Geosci. Remote, 44, 1267–1271, 2006. a, b
Tanskanen, A., Lindfors, A., Määttä, A., Krotkov, N., Herman, J., Kaurola, J., Koskela, T., Lakkala, K., Fioletov, V., Bernhard, G., McKenzie, R., Kondo, Y., O'Neill, M., Slaper, H., den Outer, P., Bais, A. F., and Tamminen, J.: Validation of daily erythemal doses from ozone monitoring instrument with ground-based UV measurement data, J. Geophys. Res., 112, D24S44, https://doi.org/10.1029/2007JD008830, 2007. a
Thalman, R. and Volkamer, R.: Temperature dependent absorption cross-sections of O2−O2 collision pairs between 340 and 630 nm and at atmospherically relevant pressure, Phys. Chem. Chem. Phys., 15, 15371–15381, https://doi.org/10.1039/C3CP50968K, 2013. a
UN: Montreal Protocol on Substances that Deplete the Ozone Layer, United Nations – Treaty Series, 1522, United Nations, New York, available at: https://treaties.un.org/doc/Publication/UNTS/Volume 1522/v1522.pdf (last access: 5 February 2018), 1989. a
UNEP: Environmental effects of ozone depletion and its interactions with climate change: 2010 assessment, Photoch. Photobio. Sci., 10, 165–320, 2011. a, b, c
UNEP: Environmental effects of ozone depletion and its interactions with climate change: 2014 assessment, Photoch. Photobio. Sci., 14, 1–186, 2015. a
Verdebout, J.: A method to generate surface UV radiation maps over Europe using GOME, Meteosat, and ancillary geophysical data, J. Geophys. Res., 105, 5049–5058, 2000. a
Weatherhead, B., Tanskanen, A., Stevermer, A., Andersen, S., Arola, A., Austin, J., Bernhard, G., Browman, H., Fioletov, V., Grewe, V., Herman, J., Josefsson, W., Kylling, A., Kyrö, E., Lindfors, A., Shindell, D., Taalas, P., and Tarasick, D.: ACIA 2005, Chap. 5: Ozone and Ultraviolet Radiation, 151–182, Cambridge University Press, New York, 2005. a, b
Webb, A. R., Slaper, H., Koepke, P., and Schmalwieser, A. W.: Know your standard: clarifying the CIE erythema action spectrum, Photochem. Photobiol., 87, 483–486, https://doi.org/10.1111/j.1751-1097.2010.00871.x, 2011. a
Wellemeyer, C., Taylor, S., Seftor, C., McPeters, R., and Bhartia, P.: A correction for total ozone mapping spectrometer profile shape errors at high latitude, J. Geophys. Res.-Atmos., 102, 9029–9038, https://doi.org/10.1029/96JD03965, 1997. a
WHO: Global Solar UV Index: A Practical Guide, World Health Organization, available at: http://www.who.int/uv/publications/globalindex/en/ (last access: 5 February 2018), 2002. a
Williamson, C. E., Zepp, R. G., Lucas, R. M., Madronich, S., Austin, A. T., Ballare, C. L., Norval, M., Sulzberger, B., Bais, A. F., McKenzie, R. L., Robinson, S. A., Haeder, D.-P., Paul, N. D., and Bornman, J. F.: Solar ultraviolet radiation in a changing climate, Nat. Clim. Change, 4, 434–441, https://doi.org/10.1038/NCLIMATE2225, 2014. a
WMO: Scientific assessment of Stratospheric Ozone: 1989, World Meteorological Organization (WMO), Global Ozone Research and Monitoring Project–Report No. 20, United Nations Environment Program, Nairobi, Kenya, 1989. a
Zempila, M.-M., van Geffen, J. H. G. M., Taylor, M., Fountoulakis, I., Koukouli, M.-E., van Weele, M., van der A, R. J., Bais, A., Meleti, C., and Balis, D.: TEMIS UV product validation using NILU-UV ground-based measurements in Thessaloniki, Greece, Atmos. Chem. Phys., 17, 7157–7174, https://doi.org/10.5194/acp-17-7157-2017, 2017. a