the Creative Commons Attribution 4.0 License.
the Creative Commons Attribution 4.0 License.
 | 28 Feb 2019
Evaluation of Windsond S1H2 performance in Kumasi during the 2016 DACCIWA field campaign
Geoffrey Elie Quentin Bessardon
Kwabena Fosu-Amankwah
Anders Petersson
Barbara Jane Brooks
Sparv Embedded, Sweden (http://windsond.com, last access: 22 February 2019), has answered the call for less expensive but accurate reusable radiosondes by producing a reusable sonde primarily intended for boundary-layer observations collection: the Windsond S1H2. To evaluate the performance of the S1H2, in-flight comparisons between the Vaisala RS41-SG and Windsond S1H2 were performed during the Dynamics–Aerosol–Chemistry–Cloud Interactions in West Africa (DACCIWA) project (FP7/2007–2013) ground campaign at the Kumasi Agromet supersite (6∘40′45.76′′ N, 1∘33′36.50′′ W) inside the Kwame Nkrumah University of Science and Technology (KNUST), Ghana, campus. The results suggest a good correlation between the RS41-SG and S1H2 data, the main difference lying in the GPS signal processing and the humidity response time at cloud top. Reproducibility tests show that there is no major performance degradation arising from S1H2 sonde reuse.


Accurate in situ measurements of tropospheric temperature, pressure, water vapour, and wind profiles provide critical input for numerical weather forecasting and climate models, in the quantification of atmospheric thermodynamic stability, for the development and application of remote-sensing retrievals, and as an important constraint for atmospheric process studies. Since the 1930s such measurements have been made by small instrument packages attached to balloons (Jensen et al., 2016) known as radiosondes; the vertical resolution of the profile being determined by the ascent rate of the balloon (Martin et al., 2011). The many changes in instrumentation, sounding practices, and data processing are discussed at length by many authors including Haimberger (2007), Vömel et al. (2007), Haimberger et al. (2008), Rowe et al. (2008), Sherwood et al. (2008), McCarthy et al. (2009), Miloshevich et al. (2009), Seidel et al. (2009), Dai et al. (2011), Hurst et al. (2011), Thorne et al. (2011), Moradi et al. (2013), Wang et al. (2013), Dirksen et al. (2014), Yu et al. (2015), Bodeker et al. (2016), and Jensen et al. (2016).
The operational cost of launching a radiosonde is high: according to Bill Blackmore (personal communication, 2012), as cited by Gonzalez et al. (2012), the National Weather Service (NWS) Weather Forecasting Offices (WFOs) estimate that the cost per unit launch of a radiosonde in the US is USD 325 (price includes radiosonde, balloon, and labour) and a total of USD 21 827 000 a year if 2 launches are made at 92 sites. This rough estimate varies regionally as the price of labour, helium, and balloons and is not the same around the globe. Yet operational costs are a significant investment in countries with limited resources.
For many years the provision of radiosounding technology has been dominated by the likes of Vaisala and Graw, but over the last decade there has been an increase in the call for less expensive but accurate devices (Gonzalez et al., 2012; Lafon et al., 2014; Kräuchi and Philipona, 2016). The development of a cheaper reusable radiosounding system could contribute to the development of a denser operational network in regions of the world with limited financial resources, in addition to being useful for field campaigns where multiple shallow soundings are needed. Reusable sondes have been introduced for the first time by Legain et al. (2013), which modified a Vaisala sonde to enclose it in a cage which is tethered to two balloons. The system allowed one balloon to detach at a desired altitude and have the caged sonde slowly descend with the second balloon prior to recovery. While this system has shown successful results in terms of pressure, temperature, humidity, and recovery rate it does not assess the effect of the cage and the two balloons on the obtained wind profile. Sonde modification required makes the use of this system more complex and can be an obstacle towards a global use of the system. This shows that the development of reusable sonde technologies is still in its early stages, meaning that manufacturers can develop their own solutions.
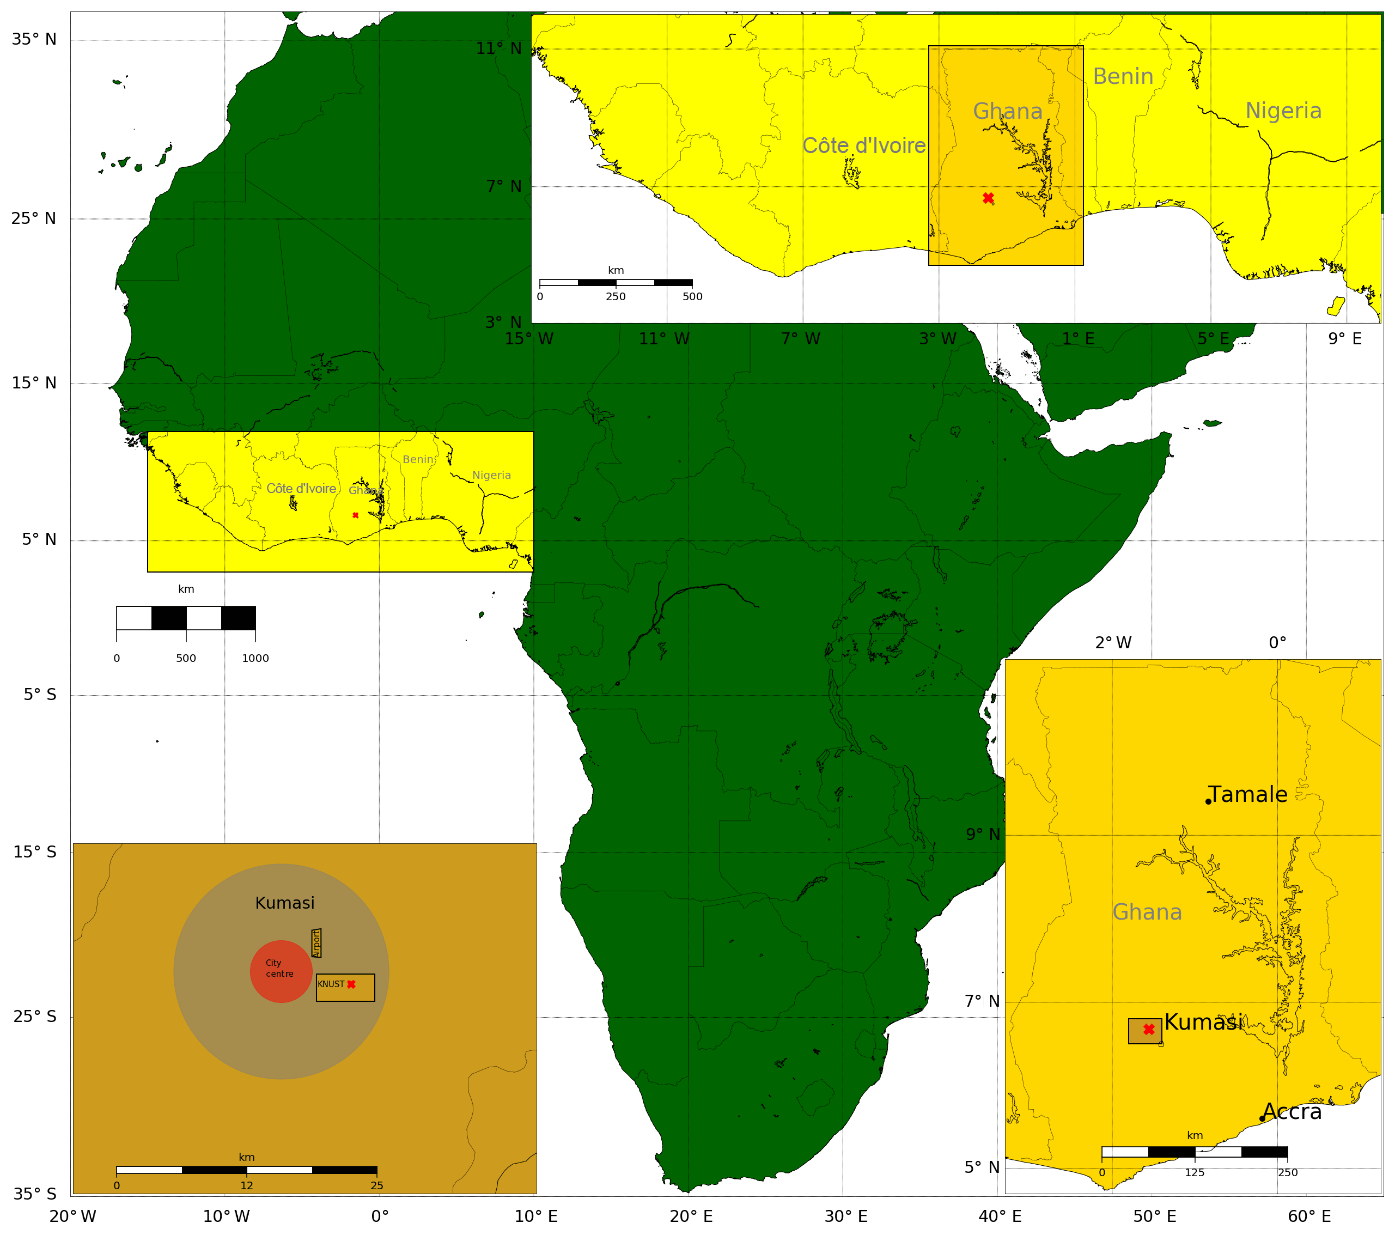
Figure 1Location of the field site with respect to Africa, the West African region, Ghana, and Kumasi.
The Windsond S1H2 from Sparv Embedded, Sweden (http://windsond.com), aims to reduce the cost of boundary-layer sounding through its reuse and multi-sonde reception features while remaining a compact and relatively simple to use system. This paper presents the results of the first field campaign utilization of the Windsond S1H2 during the Dynamics–Aerosol–Chemistry–Cloud Interactions in West Africa (DACCIWA) project (FP7/2007–2013) ground campaign at the Kumasi Agromet supersite. Here the performance of this radiosonde is compared with that of established Vaisala RS41 sondes in order to better understand changes in the nocturnal boundary layer, in addition to an assessment of the system's overall robustness.
The instrument comparison took place within the framework of the DACCIWA ground campaign at the Kumasi Agromet supersite (6.679378∘ N, 1.560139∘ W) inside the Kwame Nkrumah University of Science and Technology (KNUST), Ghana, campus: Fig. 1 shows the location of the field site with respect to the West African region, Ghana, and Kumasi.
The DACCIWA ground campaign has been designed to allow the identification of the controlling processes and factors for low-level clouds (LLCs) formation and to investigate the LLCs' effects on the convective boundary layer (CBL). The sounding programme consisted of synoptic sounding at 06:00 UTC using a Vaisala (RS41-SG or RS92) radiosonde launched at the Agromet supersite. This time was selected because the LLC cover was expected to be most intense. In addition to the daily soundings, frequent radiosondes were launched at regular intervals during intensive operation periods (IOPs). The sounding programme had three objectives: (1) to provide the daily statistic of atmospheric conditions, (2) to provide more frequent boundary layer sounding during DACCIWA IOPs to observe the evolution of the LLCs and associated phenomena such as the nocturnal low-level jet (NLLJ), and (3) to evaluate the Windsond performance. Figure 2 shows the sounding rationale during DACCIWA IOPs: a single S1H2 launched at 03:00 UTC, two launched at 06:00 UTC simultaneously with an RS41-SG launch, and a final single S1H2 launched at 09:00 UTC.
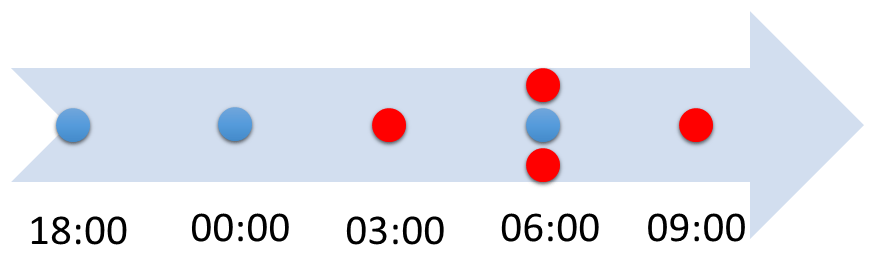
Figure 2Scheme representing the sonde routine strategy during DACCIWA IOPs, with RS41-SG (blue) and Windsond S1H2-R (red) time in UTC.
The performance comparison between the two systems consisted of (1) a comparison of the Windsond S1H2 and Vaisala RS41-SG sondes and (2) an assessment of the reproducibility of the S1H2 during the DACCIWA field campaign.
The Windsond S1H2 is a lightweight (12 g) sonde manufactured by Sparv Embedded of Sweden with an operational ceiling of 8 km. Being lightweight, the size of the balloon is substantially smaller, with a 48 cm “party balloon” being recommended and hence requires less helium. As with any sounding system, there is a radio receiver. For the Windsond, the RR1-250 radio receiver is used and this is connected directly to the host laptop via USB: the arrangement is shown in Fig. 3. The system has an operational frequency configurable in the range of 400 to 480 MHz.
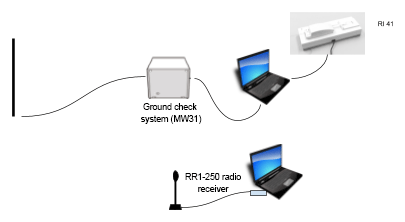
Figure 3Experimental system set-up: antennae, sounding system, and ground check system (MW41).
The Windsond launch procedure requires no preflight calibration and the firmware in use (v1) allowed up to 4 sondes to be active at any one time. In September 2016, version 2 of the firmware was launched allowing 8 sondes to be active simultaneously while the latest version allows 16.
The operational software provides a “cutdown” feature: when activated, the cord attaching the sonde to the balloon is cut. This, in conjunction with the integrated instrument retrieval system and prediction of landing site, makes the retrieval and reuse of the sonde viable. The S1H2 uses a 1.9 g 75 mAh rechargeable lithium-ion battery (a separate battery): the separated battery allows the sonde to be reused quickly after recovery.
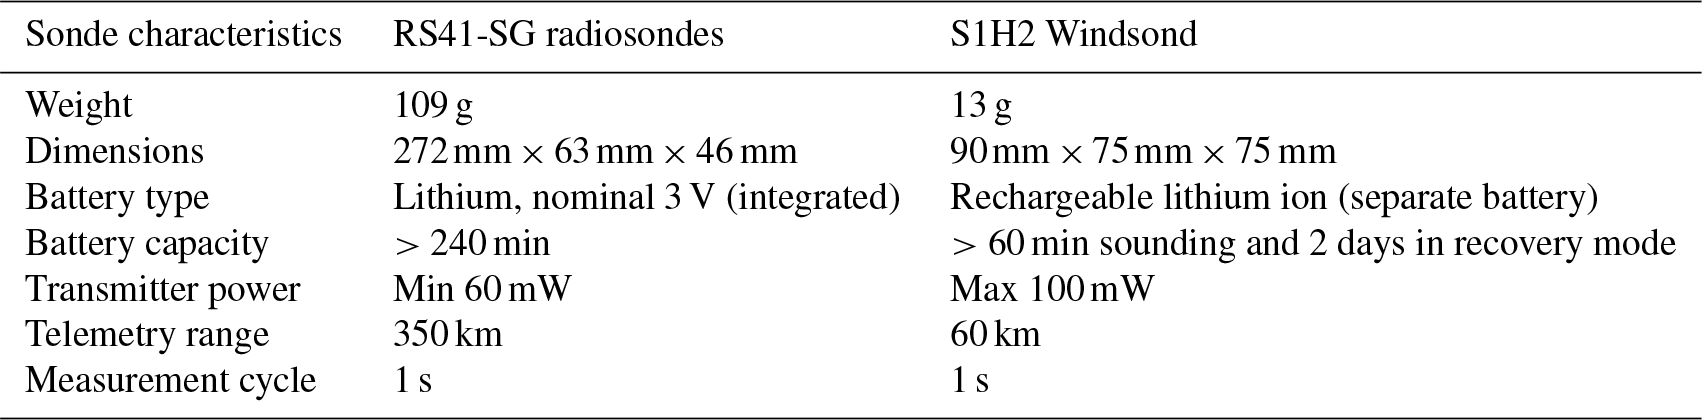
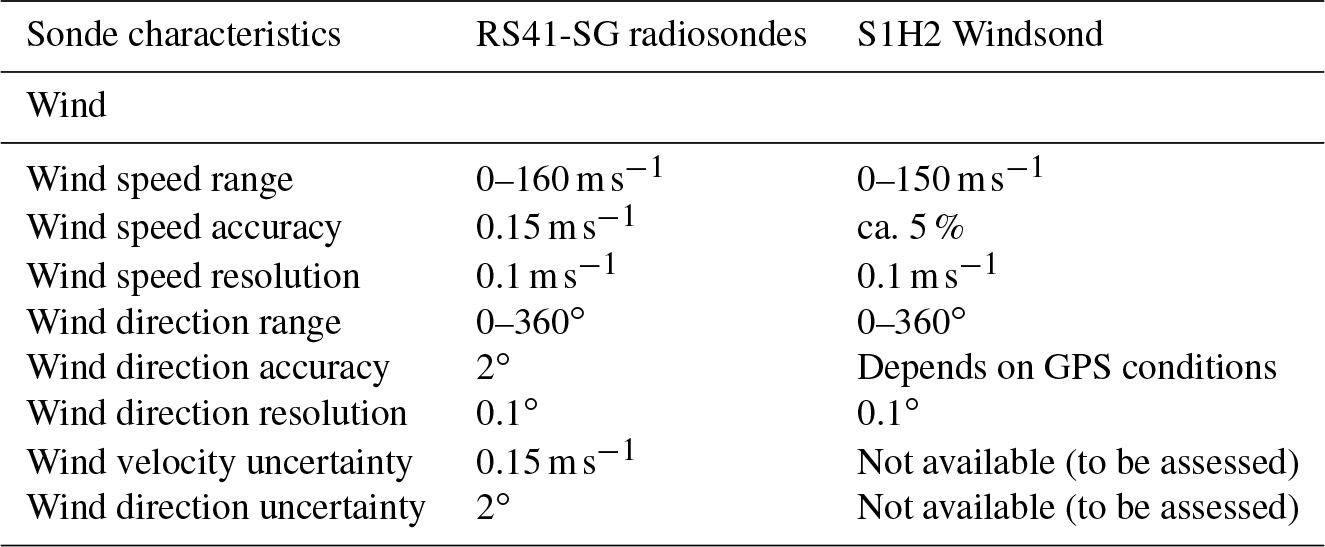
Figure 4 shows the Windsond S1H2 and it can be seen that it is used in a styrofoam cup: all key features are shown. Table 1 summarizes some of the key physical characteristics of the Windsond S1H2 and the Vaisala RS41, the sonde used for the sensor comparison test.
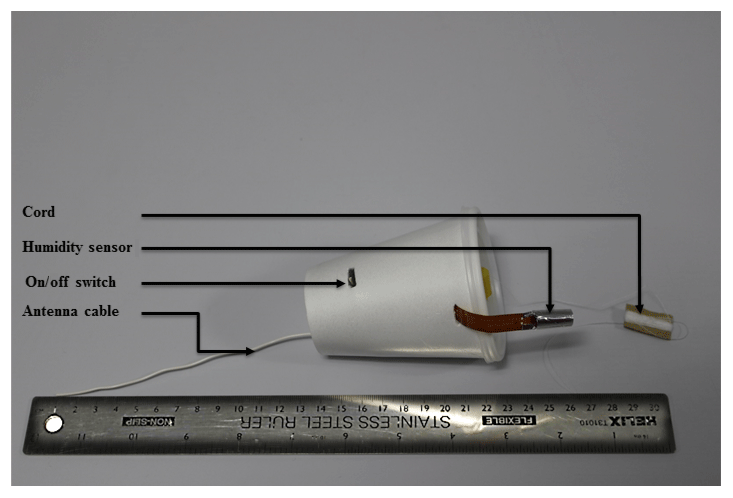
Table 1Summary of key physical characteristics of the RS41 and the Windsond S1H2 (based on Table 5 from Vaisala, 2014; SparvEmbedded, 2016).
3.1 Temperature
Tables 2–5 show, on a parameter by parameter scale, a comparison of sensor characteristics. The RS41-SG uses a platinum temperature resistor while a band-gap temperature sensor is used in the Windsond S1H2. The silicon band-gap temperature sensor is a type of thermometer or temperature detector commonly employed in electronic devices. It has good stability in extreme environmental conditions due to the integral stability of crystalline silicon. Silicon band-gap temperature sensors operate on the principle that the forward voltage of a silicon diode is temperature dependent. Band-gap technology has the advantage of being low-cost, accurate, and reliable, as well as providing highly consistent measurements and having a positive temperature coefficient with a very low drift over time (Burlet et al., 2015).
Both sensors have the same resolution but the S1H2 has a smaller operational range. The platinum wire temperature sensor of the RS41-SG is both more accurate and has a faster response time than the band-gap sensor (Table 2; Vaisala, 2014; SparvEmbedded, 2016).
Table 2Sonde temperature sensor manufacturer specifications (based on Table 1 from Vaisala, 2014; SparvEmbedded, 2016).
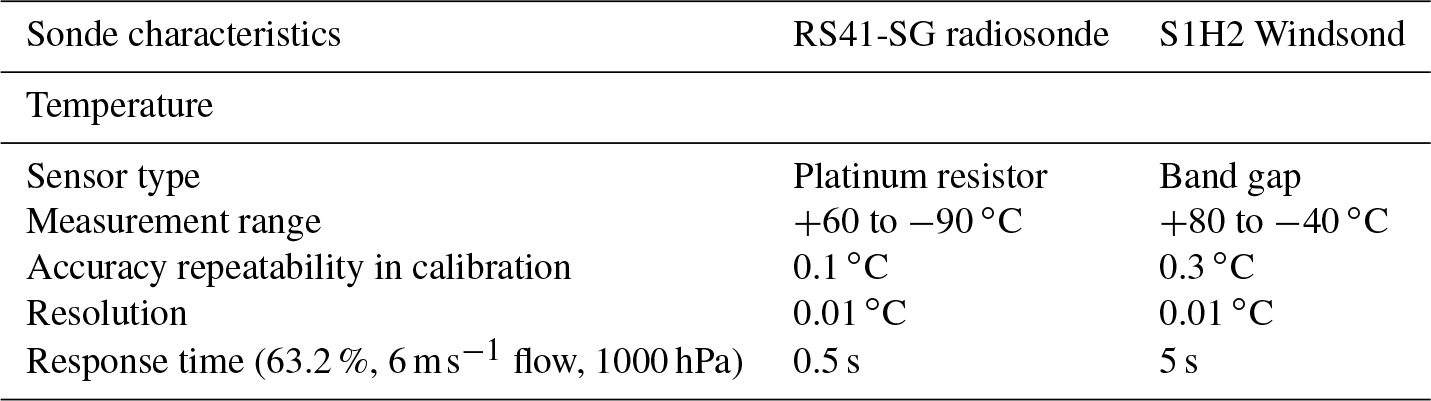
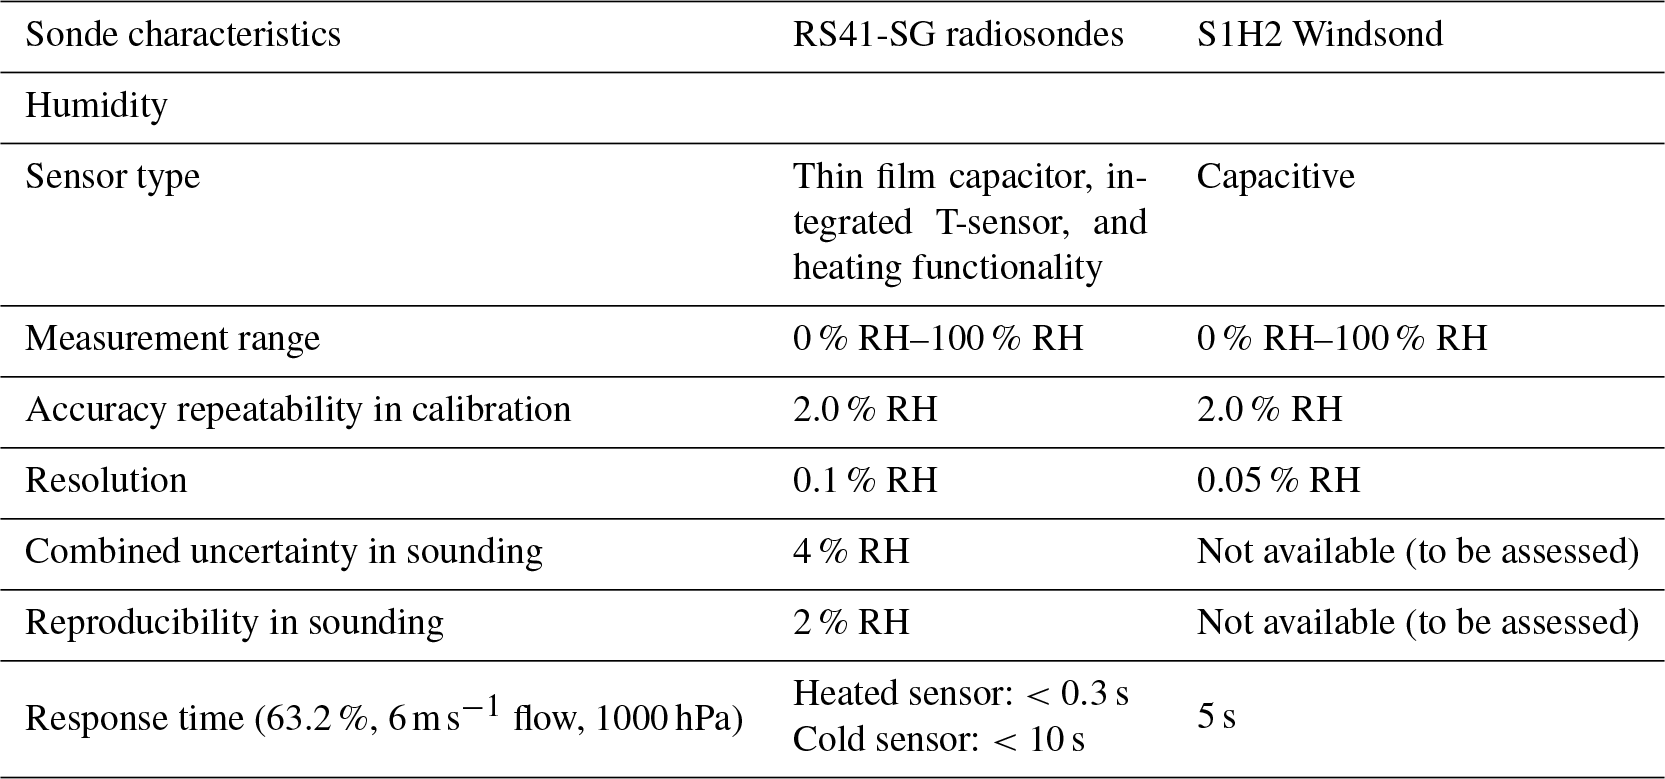
Table 3Humidity sensor manufacturer specifications (based on Table 2 from Vaisala, 2014; SparvEmbedded, 2016).
3.2 Humidity
Both sondes use a thin film capacitor to make humidity measurements. These sensors provide a high accuracy, excellent long-term stability and negligible hysteresis. They are insensitive to contamination by particulate matter, are not permanently damaged by liquids, and are resistant to most chemicals. A capacitive humidity sensor works like a plate capacitor. The lower electrode is deposited on a carrier substrate, often a ceramic material. A thin polymer hygroscopic layer acts as the dielectric, and on top of this is the upper plate, which acts as the second electrode but which also allows water vapour to pass through it into the polymer. The water vapour molecules enter or leave the hygroscopic polymer until the water vapour content is in equilibrium with the ambient air or gas. The dielectric strength of the polymer is proportional to the water vapour content. In turn, the dielectric strength affects the capacitance, which is measured and processed to give a relative humidity measurement.
The RS41-SG humidity sensor integrates humidity and temperature sensing elements. Preflight automatic reconditioning of the humidity sensor effectively removes chemical contaminants in order to improve humidity measurement accuracy. The integrated temperature sensor is used to compensate for the effects of solar radiation in real time. The sensor heating function enables an active de-icing method in freezing conditions during the flight (Table 3 from Vaisala, 2014; SparvEmbedded, 2016).
3.3 Pressure
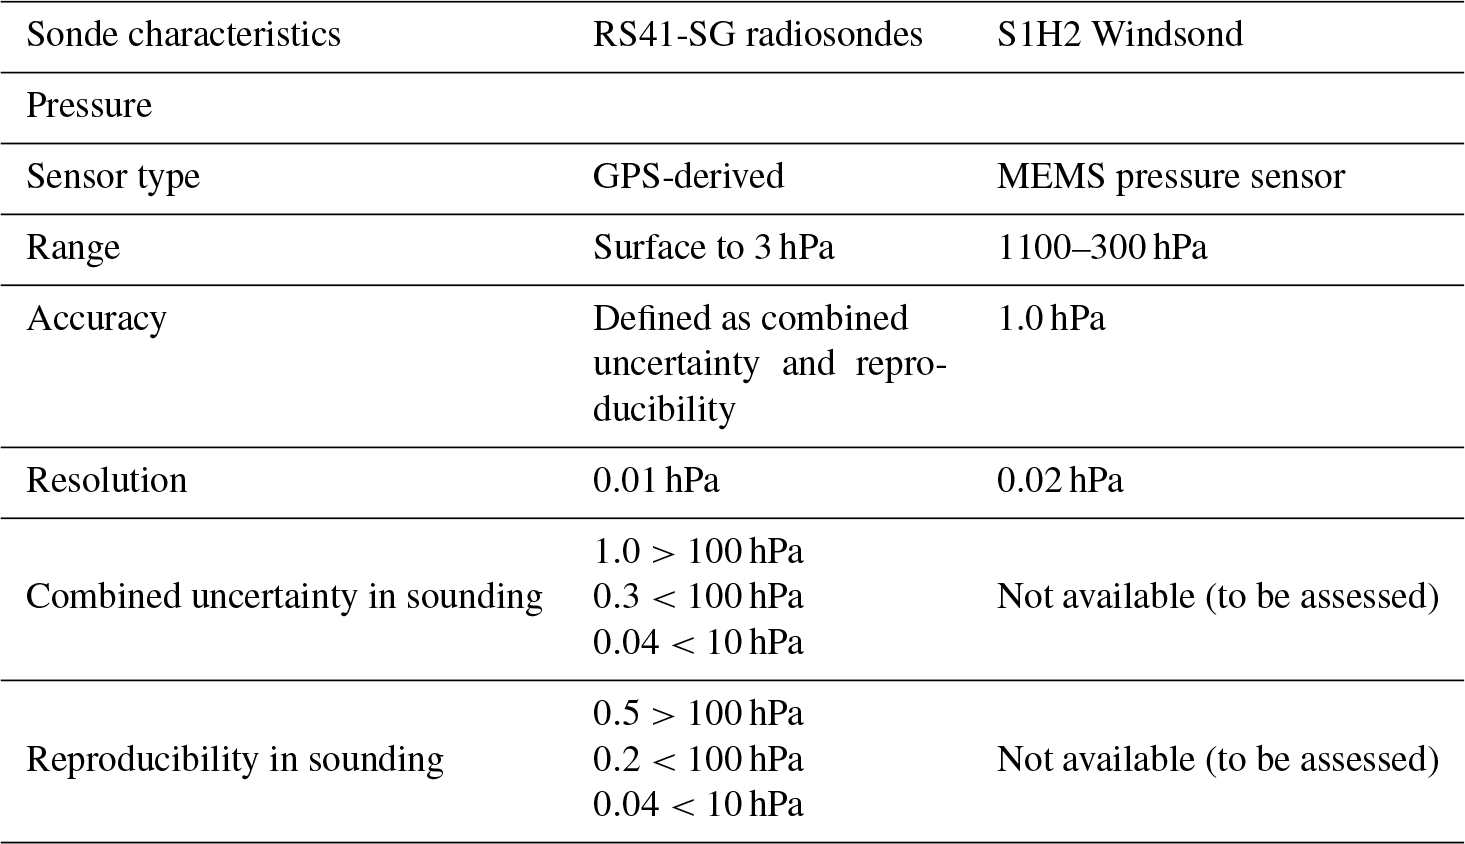
The RS41-SG has a number of variants and of particular importance here are the RS41-SG and RS41-SGP. Although both sonde types provide pressure, temperature, humidity, and wind measurements it is in the manner in which pressure is derived that the difference arises. The SGP variant has the same pressure sensor as the RS92 sonde but with revised electronics and calibration, while the SG has no pressure sensor at all. In the latter case, the values of atmospheric pressure are calculated from satellite ranging codes, combined with differential corrections from the MW41 ground station. Pressure calculation also uses temperature and humidity from the radiosonde and the hypsometric equation.
The S1H2 measures the pressure with a microelectromechanical (MEMS) piezoresistor pressure sensor. This technology etches a diaphragm into a silicone substrate. Micro-piezoresistors measure the deformation of the diaphragm due to changing pressure.
The difference in performance characteristics (Table 4) between the two sondes arise from the S1H2 making direct pressure measurements while those of the RS41-SG are derived indirectly. The WMO radiosonde inter-comparison experiment 2010 (Nash et al., 2011) showed that pressure measurements, derived from geopotential heights and radiosonde measurements of temperature, and relative humidity profiles were very reproducible and suitable for all radiosounding operations wherein GPS systems are set up correctly, which includes the Vaisala system. This shows that the Vaisala-derived pressure is a reliable reference to assess the Windsond pressure sensor, and the Windsond cost can be lowered by removing the pressure sensor in future versions of the Windsond system, depending on its GPS system accuracy. Using a Windsond without a pressure sensor, however, requires an accurate pressure measurement at the surface if the pressure above the surface is to be computed using GPS altitude information, which requires a complementary external pressure sensor which can reduce the versatility of the Windsond system.
Table 4Pressure sensor manufacturer specifications (based on Table 3 from Vaisala, 2014; SparvEmbedded, 2016).
3.4 Position and winds
The Vaisala system uses on-board GPS receiver pseudorange to measure latitude, longitude, and height and applies a differential correction using the Vaisala ground station's GPS receiver. Use of differential GPS techniques in principle improves the accuracy and resolution of measurements. However, wind speed and direction are determined independently from the GPS position using the GPS Doppler frequency shifts.
The Windsond GPS ground station is not a GPS receiver; therefore, latitude and longitude are determined using on-board GPS receiver pseudorange without differential correction. Similar to the RS41-SG, the S1H2 wind speed and direction are determined independently from latitude and longitude using the GPS signal without differential correction explaining the two systems' similar performance characteristics as seen on Table 5.
Table 5Sonde wind measurement characteristics (based on Table 7 from Vaisala, 2014; SparvEmbedded, 2016).
The Vaisala system determines height using the GPS pseudorange with differential correction while the Windsond uses sonde pressure. The Windsond altitude algorithm tested here does not include hypsometric correction and is corrected in later versions.
The Vaisala sounding system MW41 has a single operational mode, unlike the older MW31 which features an operational and a research mode, producing different degrees of signal processing. The MW31 research mode processes the data as little as possible, only correcting solar radiation and pendulum effects, while both MW41 and MW31 operational modes produce the highest degree of signal processing in which raw data are filtered and discontinuous data are interpolated. The non-processed data described in the previous section were produced by simulating the flight with the archived data and leaving as little post-processing as possible, similar to the MW31 research mode.
The Windsond S1H2 firmware has a single operational mode and produces uncorrected data. Later versions of Windsond have since introduced data correction of all parameters. During this experiment, the uncorrected data have been used, but the ground pressure altitude and temperature have been adjusted to the value measured by the ground-based instrumentation available on the Kumasi supersite.
5.1 Experimental design
5.1.1 Profile comparison
The performance of the S1H2 Windsond was assessed by taping a S1H2 Windsond and RS41-SG radiosonde together on the same flight at the Kumasi Agromet supersite for the DACCIWA synoptic flight on 28 June 2016 that launched at 05:44 UTC. Despite the Windsond S1H2 acquisition cycle being 1 s (Table 1) the firmware was only supporting 3 s acquisition and was set accordingly while the Vaisala RS41-SG to 1 s. Vaisala RS41-SG data have been reduced to 3 s data by selecting measurements taken at the same time as the Windsond S1H2 and only measurements below 6000 m a.g.l. have been considered because of the S1H2 recommended operational ceiling. A statistical comparison including both linear regression and the correlation coefficient between temperature, relative humidity, altitude, wind speed, meridional wind, and zonal wind recorded by both sondes was performed. The Windsond S1H2 produces wind speed and wind direction only, and the 2π periodicity of wind direction makes linear regression irrelevant, so it has been converted to zonal and meridional winds.
5.1.2 Signal processing effects for low altitudes
To analyse the signal processing effect, the same procedure as in Sect. 5.1.1 was performed on the data recorded by the S1H2, the RS41-SG, and the RS41-SG after processing from the MW41. The scope was reduced to data up to 1000 m a.g.l., allowing us to see the difference between the datasets in greater detail. It also allows direct comparison with the reproducibility experiment where flights never exceeded 1000 m a.g.l.
5.1.3 Pressure comparison
The RS41-SG does not provide raw pressure data, so the performance evaluation of the S1H2 pressure sensor is completed by comparing it to the pressure calculated by the MW41 from the RS41-SG data, following the procedure described in Sect. 5.1.2.
Moreover, the S1H2 altitude measurement uses the pressure sensor data. To assess the influence of the pressure sensor error on the altitude error, the pressure difference between S1H2 pressure and the processed RS41-SG pressure is compared to the difference between the S1H2 and RS41-SG altitude.
During the reproducibility experiment presented in Sect. 6, sondes are not attached together and are flying at different ascent rates. To assess the reproducibility of the S1H2, all reproducibility flight data have to be re-aligned to a similar vertical level. The comparison between the pressure and altitude error is used to assess the best vertical level boxes to use in the reproducibility experiment data analysis.
5.2 Windsond S1H1 v. Vaisala RS41-SG performance comparison flight results
5.2.1 Profile comparison
The scatter plot in Fig. 5 compares respectively temperature, relative humidity, altitude, wind speed, meridional wind, and zonal wind recorded by both sondes with colours indicating the corresponding altitude according to the RS41-SG. The red line indicates the linear regression between both datasets. For all of the assessed meteorological parameters, the linear regression parameters are in the range [0.83, 1.01], with a correlation coefficient over 0.6 indicating a relatively good agreement between both sondes. However, some discrepancies between parameters or due to sudden atmospheric changes have been identified.
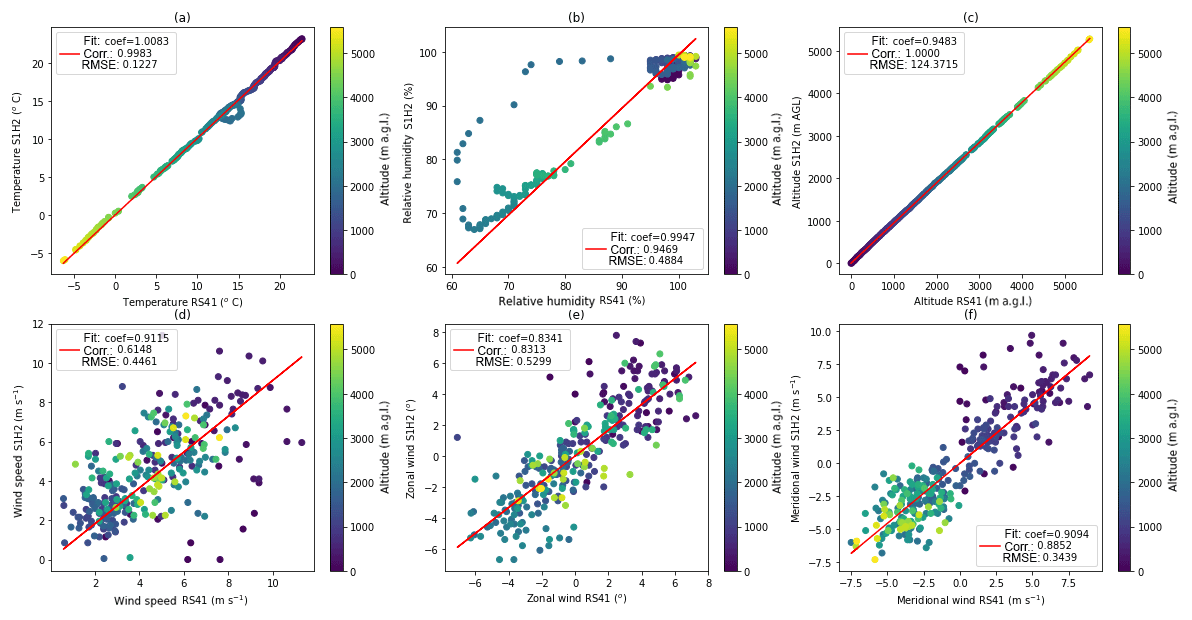
Figure 5Comparison of temperature (a), relative humidity (b), altitude (c), wind speed (d), zonal winds (e), and meridional winds (f) recorded by the Windsond S1H2 and the Vaisala RS41-SG during the flight of 28 June 2016, 05:44 UTC in Kumasi. The colours are based on the Vaisala RS41-SG-measured altitude with the maximum altitude set to 6000 m. The red lines indicate the linear regression of each parameter.
The relative humidity and temperature regression line coefficients in Fig. 5a and b are within 10−2 to 1 with a correlation coefficient over 0.9, meaning that both sondes are in general agreement over the whole flight. At 2000 m (dark green in Fig. 5a, b) a sudden temperature increase and relative humidity decrease occurs and shows discrepancies between sensors. The relative humidity below 2000 m is around 100 % indicating the presence of clouds. The sudden warming associated with a sudden drying consequently corresponds to the top of a cloud. For both temperature and relative humidity, the RS41-SG sensors are detecting the sudden temperature and humidity changes associated with cloud top before the S1H2 sensors. The faster response time of the RS41-SG platinum temperature resistor compared to the S1H2 band-gap temperature sensor explains the faster RS41-SG reply to temperature change, while the heating system on the RS41-SG humidity sensor evaporating the cloud water explains the faster RS41-SG reply to relative humidity change.
Wind speed and horizontal wind components in Fig. 5d, e, and f have the lowest correlation coefficient of all parameters and points are noisy, so a smoothing can potentially partially resolve the wind speed and wind component bias. However, linear regression coefficient below 1 indicates that the S1H2 regularly underestimates the winds. This underestimation can be explained by differences in the GPS sensor or the antenna, as the Vaisala system does not use differential correction to measure winds.
The correlation between both sensor altitude in Fig. 5c is the highest of all parameters, while the large root-mean-square error over 100 and the linear regression coefficient below 1 indicates that the S1H2 regularly underestimates the sonde ascent compared to the RS41. This underestimation can be explained by the absence of hypsometric correction in the S1H2 altitude determination algorithm and/or errors due to the pressure sensor. The influence of the pressure sensor error on altitude error is assessed in Sect. 5.2.3.
5.2.2 Signal processing effects in the boundary layer
The scatter plot in Fig. 6 compares respectively temperature, relative humidity, altitude, wind speed, meridional wind, and zonal wind recorded by the S1H2, the RS41-SG, and the RS41-SG after processing from the MW41, with colours indicating the corresponding altitude according to the S1H2 with the maximum altitude set to 1000 m. The red line indicates the linear regression between the S1H2 and the RS41-SG data while the blue line indicates the linear regression between the S1H2 and the RS41-SG data after processing from the MW41. A comparison between Figs. 5 and 6 shows that in the boundary layer the correlation between S1H2 and raw RS41-SG is smaller than for the whole profile; this is certainly due to the smaller number of points considered, putting greater emphasis on errors. The comparison of the linear regression coefficient for each parameter in Fig. 6 shows that the processed RS41-SG data are closer to a 1 to 1 ratio with the S1H2, and the correlation between processed RS41-SG and S1H2 is greater than between the raw RS41-SG and the S1H2. This feature is certainly due to the smoothing operated by the MW41 on the RS41-SG and the adjustment of the maximum relative humidity to 100 %. This result shows that the inexpensive Windsond system can reach a level of performance close to the expensive Vaisala system in the boundary layer. However, due to a limited number of sondes available only one performance flight was performed. To be statistically significant this result needs to be verified with more performance comparison flights.
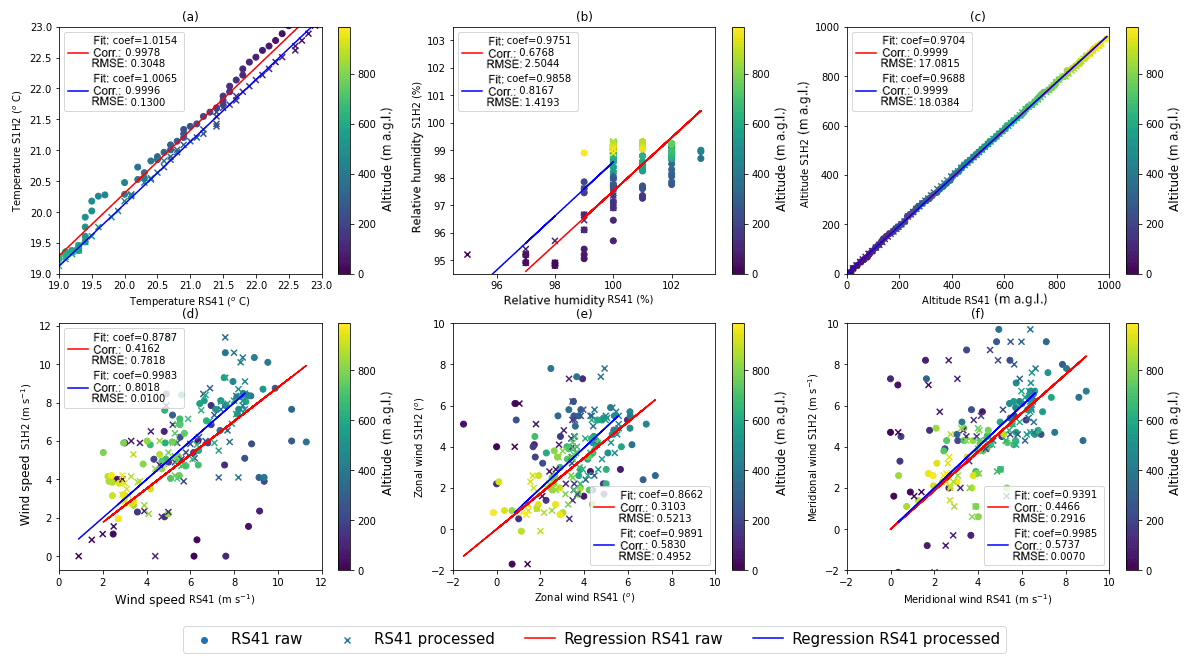
Figure 6Comparison of temperature (a), relative humidity (b), altitude (c), wind speed (d), zonal winds (e), and meridional winds (f) recorded by the Windsond S1H2 and the Vaisala RS41-SG before and after processing during the flight of 28 June 2016, 05:44 UTC in Kumasi. The colours are based on the Vaisala RS41-SG-measured altitude with the maximum altitude set to 1000 m.
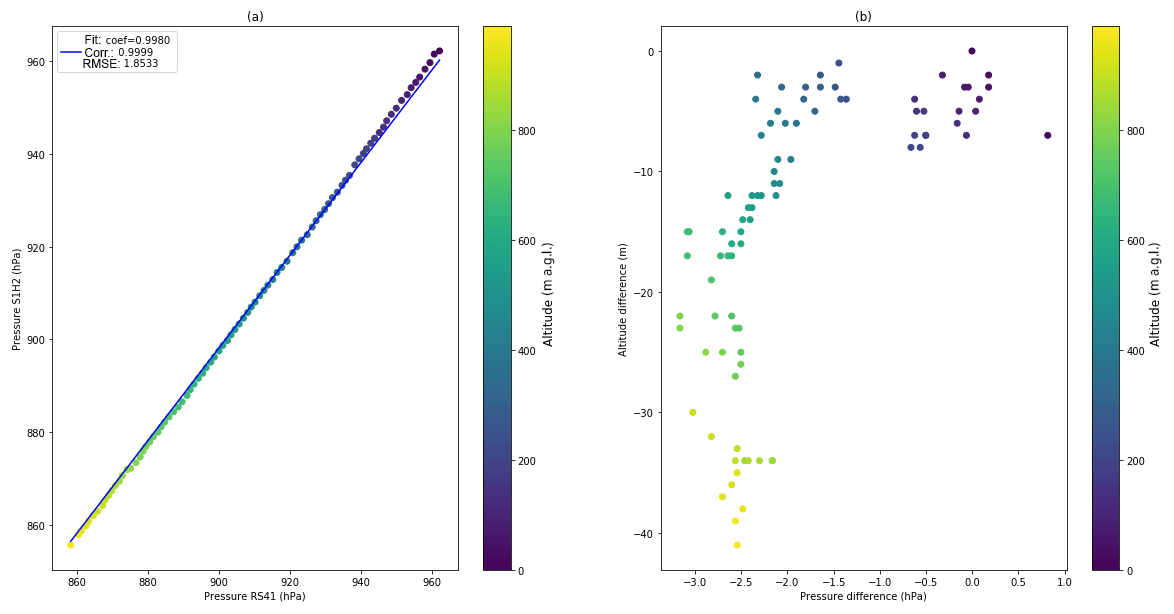
Figure 7Comparison of pressure recorded by the Windsond S1H2 and calculated by the Vaisala MW41 (a), the pressure difference between the recorded Windsond S1H2 and the Vaisala MW41, and the altitude difference between the Windsond S1H2 and the Vaisala RS41-SG (b) during the flight of 28 June 2016, 05:44 UTC in Kumasi. The colours are based on the Vaisala RS41-SG-measured altitude with the maximum altitude set to 1000 m.
5.2.3 Pressure comparison
The scatter plot in Fig. 7a compares the pressure recorded by the S1H2 and calculated by the MW41 after processing from the RS41, with colours indicating the corresponding altitude according to the S1H2 with the maximum altitude set to 1000 m and the blue line indicating the linear regression between both measured and calculated pressures. The ratio between the pressure measured by the S1H2 and calculated by the MW41 is close to 1 to 1, with an almost perfect correlation and an error below 3 hPa. Comparison of the altitude difference measured by the two sondes and the pressure difference between the calculated and measured pressure shows that over 200 m the pressure difference remains between 2 and 3 hPa while the altitude difference is regularly increasing with height. This shows that the S1H2 pressure sensor error influence on the S1H2 altitude underestimation is small. More recent versions of the Windsond firmware that include hypsometric correction are probably also correcting the altitude bias. The pressure difference consistently remains between 2 and 3 hPa; thus, vertical level boxes of 1 hPa are chosen to re-align the sondes during the reproducibility experiment.
5.3 Windsond S1H2 vs. Vaisala RS41-SG performance comparison conclusions
The performance comparison between the Windsond S1H2 and the Vaisala RS41-SG shows the potential of the Windsond system which is able to closely match the temperature, pressure and humidity of the Vaisala RS41-SG even after processing by the MW41. However, when a sudden temperature and humidity change happen the slower response time of the Windsond system leads to temporary bias in the profile. The main weakness of the Windsond S1H2 lies in its GPS sensor and antenna which leads to a systematical error in wind speed and components, which complicates the observation of phenomena such as the NLLJ. A more advanced signal processing can improve the GPS sensor performances. The robust performance of the pressure sensor associated with the altitude systematic error shows that corrections in the altitude retrieval algorithm implemented in the latest versions of the Windsond firmware can improve the altitude measurement. The consistent pressure measurements are leading to the use of pressure level as the vertical reference for comparing the Windsond S1H2 and the Vaisala RS41-SG during the reproducibility experiment.
6.1 Experimental design
The assessment of sonde reproducibility is essential to guarantee the reliability of the sounding data during the data analysis: alterations of sonde performance under different atmospheric conditions have to be taken into account for a complete understanding of the data. The reuse feature of the S1H2 requires an evaluation of the data alteration due to sonde reuse in addition to the reproducibility evaluation using new sondes under different atmospheric conditions.
To complete both assessments, sondes were launched and retrieved until they got lost. To ensure, according to the authors, the best compromise between ensuring a satisfying recovery rate and a full LLC coverage, the cut-off was set at an altitude of 650 m a.g.l. At the preset cut-off altitude, two heating coils were activated and the string connecting the sonde to the balloon was burnt through. During the sonde descent, after the sonde loses contact with the ground station at approximatively 100 m a.g.l., the system automatically predicts and displays the expected landing point on a map view.
The ground station was carried to the predicted location and upon getting closer, approximately within 50 m, contact between the sonde and the ground station was established, the sonde immediately started to emit loud beeps (about 15 s time interval) and flashes of light. Signal strength increased when approaching the sonde and the vice versa. Once retrieved the sonde was switched off.
When reusing the sonde, the cup and lid were checked for any physical damage. The lid of the cup was then opened to confirm that there is no physical damage to any part (i.e. the heating coils or the printed circuit board). A 4 m polyester string (sewing thread) was wound around a cardboard ( cm) cut-out with the ends left free: one to attach to the balloon the other to tie to the heating coil.
The sonde renewal strategy was based on sonde damage or loss. If a sonde was lost or any physical damage was not amendable for the next routine flight a new sonde was introduced. This strategy has been chosen to fully evaluate the degradation of the sonde, in terms of both retrieval and data quality but reduced the number of reproducibility flights with new sondes. The number of times each sonde had flown, as well as sonde recovery success, is detailed in Fig. 8. The results will be analysed and associated with the different reasons for a sonde loss.
Flights where an S1H2 has been launched simultaneously with another RS41-SG have been selected for the reproducibility and data alteration from the sonde reuse study. During the simultaneous flights, the RS41-SG and S1H2 were attached to different balloons and consequently did not climb at the exact same ascent rate. The comparison of each pair requires the data to be aligned at the same vertical level, and the systematic underestimation of the altitude by the S1H2 associated with the robust performances of the S1H2 pressure sensor led to the use of 1 hPa pressure ranges. For each pair, temperature, relative humidity, total, zonal, and meridional winds have been boxed in the pressure ranges. The pairs have then been sorted by the number of times the S1H2 was used, the median value for each range, and the number of uses that have been computed before a similar statistical comparison is performed on the median values.
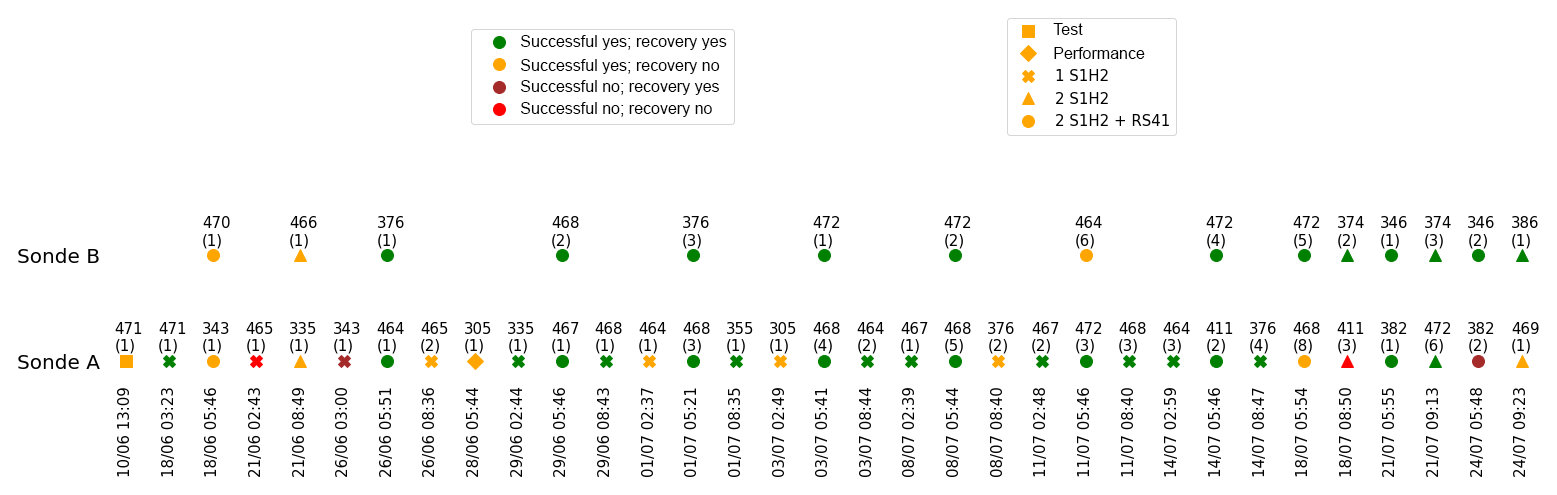
Figure 8Timeline listing sounding time in UTC, the shapes indicate the corresponding number of radiosonde S1H2 that was launched (test denotes the test sonde, performance denotes the S1H2 launched taped to an RS41-SG, +RS41 denotes simultaneous launch with the Kumasi Agromet supersite); the sonde ID, with the number of times the sonde has been used in brackets, is indicated above the shape; and the colours indicate the flight result and the recovery result.
6.2 S1H2 Windsond reproducibility experiment results
Figure 8 details the sonde flight number, the flight success and the sonde recovery for each flight. More than 70 % of the sonde launches have been recovered, with sonde 468 being used eight times. The recovery rate could have been improved with more experience using the system and if the receptor had not been damaged due to the difficulties of carrying a laptop with an antenna in the tropical rainforest and different hazards such as tropical animals. The radio receiver RR2 with a Bluetooth connection seems promising for soundings in a difficult or harsh environment for overcoming these difficulties. Only five flights have been identified as unsuccessful, showing the overall robustness of the S1H2 radio antenna through the experiment.
The scatter plot in Fig. 9 compares respectively temperature, relative humidity, altitude, wind speed, meridional wind, and zonal wind recorded by the S1H2 and the RS41, boxed in a 1 hPa range and sorted according to the number of soundings of the S1H2, as indicated by the different markers, with colours indicating the corresponding altitude according to the RS41-SG with the maximum altitude set to 1000 m a.g.l. The presence of data over 650 m a.g.l. is explained by failures of the cut-off system leading to the loss of the sonde, but supplementary data are available for the comparison. For every parameter, the different markers are superposed randomly indicating the absence of performance degradation over time with the use of the S1H2 system. However, sonde S1H2 464 used for the sixth time systematically underestimated relative humidity and overestimated meridional wind, but sonde 468 when used for the eighth time did not show a particular anomaly, suggesting a contamination of the 464 sonde relative humidity sensor. Temperature and relative humidity of sonde 468 during its eighth flight at 800 m a.g.l. (yellow) showed the presence of a cloud top where the lag in the S1H2 answer was identified as it was in the performance flight.

Figure 9Comparison of temperature (a), relative humidity (b), altitude (c), wind speed (d), zonal winds (e), and meridional winds (f) recorded by the Windsond S1H2 and the Vaisala during the DACCIWA field campaign in Kumasi. Each marker corresponds to the median value over a 1 hPa range for all the flights where the S1H2 was used for the first, second, third, fourth, fifth, sixth and eighth time. The colours are based on the Vaisala RS41-SG-measured altitude with the maximum altitude set to 1000 m.
Figure 10 shows the linear regression coefficient and the correlation between the boxed S1H2 and the RS41-SG data for each use. For temperature and altitude, the markers are superposed while for the other parameters markers are more spread but no clear trend can be identified. Sonde 464, which was used for the sixth time, with a low correlation and linear regression coefficient for relative humidity and large meridional speed linear regression coefficient, respectively, confirms the contamination damage on the sonde identified in Fig. 9. The relative humidity and low correlation of sonde 468 when used for the eighth run can be explained by the cloud top found in Fig. 9. The low or negative linear regression coefficient values for speed confirm the lack of accuracy in the performance flight and underline a need for improvement in the wind speed calculation from the GPS data.
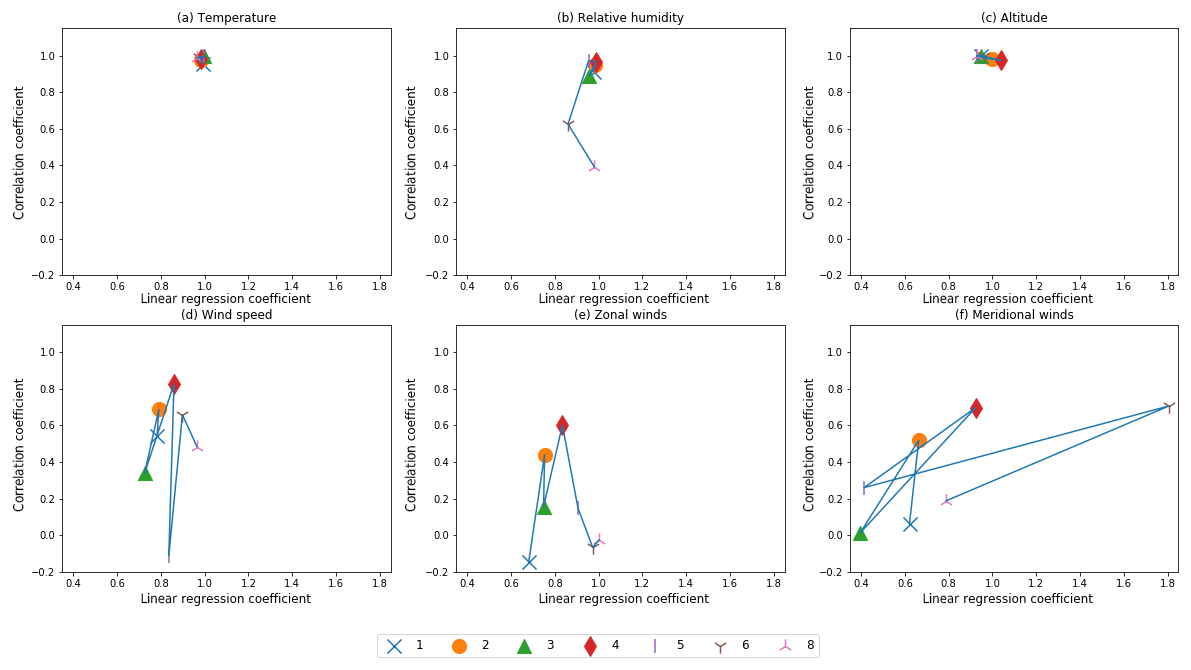
Figure 10Comparison of the correlation coefficient and the linear regression coefficients between the S1H2 and the RS41-SG temperature (a), relative humidity (b), altitude (c), wind speed (d), zonal winds (e), and meridional winds (f) for all the flights where the S1H2 was used for the first, second, third, fourth, fifth, sixth and eighth time.
6.3 S1H2 Windsond reproducibility experiment conclusions
The reproducibility experiment showed the robustness of the recovery system as well as the sensors. No clear performance degradation has been identified through the flights and the sondes have been recovered up to seven times. Similar performance weaknesses have been identified, such as the GPS sensor correction and the sensitivity to abrupt temperature and humidity changes.
However, the maximum altitude was limited to 650 m a.g.l. to ensure a satisfactory recovery rate which limits the use of the sonde recovery feature, and a sonde at its sixth use showed signs of contamination. A check of the sonde sensor values with ground instrumentation is consequently necessary before reusing the sonde to increase confidence in the measurement.
The Windsond S1H2 has been developed with the goal of providing an immediate view of local conditions at lower altitudes (up to 6000 m a.g.l.) with a focus on portability and low operating costs to simplify a frequent use in the field.
In order to characterize the performances of the Windsond, an inter-comparison flight was undertaken at the Agromet supersite in Kumasi, Ghana, on 28 June 2016. The results show that most of the data recorded below 6000 m are in agreement. However, abrupt changes in temperature and humidity show that the Windsond needs a faster response time for these changes. Wind speed and the components' relatively low performance show that the GPS sensor and its antenna is a weakness of the current system. These limitations make the deployment of an operational network using this system under the tested configuration impossible.
In the boundary layer, the RS41-SG data processing increases the agreement with the S1H2 data, showing that the expensive Vaisala system performance can be approached by the low-cost S1H2 system. The pressure calculated by the MW41 from the RS41-SG data is in good agreement with the MEMS pressure senor from the S1H2. The robust performance of the S1H2 pressure sensor shows that error in altitude estimation is mainly due to the absence of hypsometric correction in the retrieval algorithm that current versions of the firmware should have corrected. It is therefore recommended that further performance evaluation of the sonde with a more recent version of the firmware be conducted.
A reproducibility experiment has been undertaken to assess both the performance of the sonde under different atmospheric conditions and the data degradation due to sonde reuse. Some of the simultaneous flights were performed with sondes used several times. The results show that there is no real causality, correlation, or ratio between the sonde changes and the reuse of a sonde, showing there is a minor degradation in the data accuracy for reused sondes. However, one sonde showed signs of contamination on the relative humidity sensor. The authors recommend to compare sonde performance with ground instrumentation before reusing the sonde.
The capacity for using the same sonde up to eight times in such a mixed environment as Kumasi constitutes a success for the Windsond recovery system. However, the authors would have preferred a louder beep to help recovery in a noisy environment and also a vibrating system to help the sonde to fall off of trees when the sonde, unfortunately, is stuck on it.
The overall success of this experiment shows the potential of this new technology. It is therefore recommended that further experiments that quantitatively assess the reproducibility of the sonde be conducted in a different environment.
The results of this Windsond evaluation are limited due to the limited resources available at the time – to reiterate this was an opportunistic piece of observational research. The authors recommend that future experiments perform more high-altitude flights at different times of the day to confirm the identified features during the inter-comparison flight and assess the reproducibility of sonde performance. It is also recommended that these flights be performed using the more recent version of the firmware in order to confirm that the altitude bias has been corrected. If the altitude error is corrected it is recommended that altitude profiles be similar to those in Jensen et al. (2016), where flights are classified by cloud cover and time of the day they were performed. It would also be interesting to integrate the Windsond system in a larger experiment similar to the WMO inter-comparison experiment (Nash et al., 2011) where internationally recognized benchmarks for the operational performance of the Windsond could be defined.
Data used in this paper are available at https://doi.org/10.6096/dacciwa.1663 (Brooks, 2016).
GEQB and KFA designed the experiments and carried them out under the supervision and advice of BJB. GEQB performed the data analysis. AP provided valuable Windsond system information to perform the analysis. GEQB prepared the manuscript with contributions from all co-authors.
The authors declare that they have no conflict of interest.
This article is part of the special issue “Results of the project `Dynamics–Aerosol–Chemistry–Cloud interactions in West Africa' (DACCIWA) (ACP/AMT inter-journal SI)”. It is not associated with a conference.
The research leading to these results has received funding from the European
Union Seventh Framework Programme (FP7/2007–2013) under grant agreement no. 603502
(EU project DACCIWA: Dynamics–Aerosol–Chemistry–Cloud Interactions in
West Africa). Both systems used in this research were provided by
NCAS-AMF. We would like to thank the reviewers for their thoughtful comments
and efforts towards improving our manuscript.
Edited by: Mathew Evans
Reviewed by: two anonymous referees
Bodeker, G. E., Bojinski, S., Cimini, D., Dirksen, R. J., Haeffelin, M., Hannigan, J. W., Hurst, D. F., Leblanc, T., Madonna, F., Maturilli, M., Mikalsen, A. C., Philipona, R., Reale, T., Seidel, D. J., Tan, D. G. H., Thorne, P. W., Vömel, H., and Wang, J.: Reference upper-air observations for climate: From concept to reality, B. Am. Meteorol. Soc., 97, 123–135, https://doi.org/10.1175/BAMS-D-14-00072.1, 2016.
Brooks, B. J.: DACCIWA field campaign, Kumasi super-site, Instrumentation, SEDOO OMP, https://doi.org/10.6096/dacciwa.1663, 2016.
Burlet, C., Vanbrabant, Y., Piessens, K., Welkenhuysen, K., and Verheyden, S.: Niphargus: A silicon band-gap sensor temperature logger for high-precision environmental monitoring, Comput. Geosci., 74, 50–59, https://doi.org/10.1016/j.cageo.2014.10.009, 2015.
Dai, A., Wang, J., Thorne, P. W., Parker, D. E., Haimberger, L., and Wang, X. L.: A new approach to homogenize daily radiosonde humidity data, J. Climate, 24, 965–991, 2011.
Dirksen, R. J., Sommer, M., Immler, F. J., Hurst, D. F., Kivi, R., and Vömel, H.: Reference quality upper-air measurements: GRUAN data processing for the Vaisala RS92 radiosonde, Atmos. Meas. Tech., 7, 4463–4490, https://doi.org/10.5194/amt-7-4463-2014, 2014.
Gonzalez, L., Kos, L., Lavas, S., and Douglas, M.: A New Possible Plan for a More Cost-Effective Adaptive Radiosonde Observing Strategy for the United States, available at: http://weather.ou.edu/~soundoff/Final Capstone Paper.pdf (last access: 22 February 2019), 2012.
Haimberger, L.: Homogenization of radiosonde temperature time series using innovation statistics, J. Climate, 20, 1377–1403, https://doi.org/10.1175/JCLI4050.1, 2007.
Haimberger, L., Tavolato, C., and Sperka, S.: Toward elimination of the warm bias in historic radiosonde temperature records – Some new results from a comprehensive intercomparison of upper-air data, J. Climate, 21, 4587–4606, https://doi.org/10.1175/2008JCLI1929.1, 2008.
Hurst, D. F., Hall, E. G., Jordan, A. F., Miloshevich, L. M., Whiteman, D. N., Leblanc, T., Walsh, D., Vömel, H., and Oltmans, S. J.: Comparisons of temperature, pressure and humidity measurements by balloon-borne radiosondes and frost point hygrometers during MOHAVE-2009, Atmos. Meas. Tech., 4, 2777–2793, https://doi.org/10.5194/amt-4-2777-2011, 2011.
Jensen, M. P., Holdridge, D. J., Survo, P., Lehtinen, R., Baxter, S., Toto, T., and Johnson, K. L.: Comparison of Vaisala radiosondes RS41 and RS92 at the ARM Southern Great Plains site, Atmos. Meas. Tech., 9, 3115–3129, https://doi.org/10.5194/amt-9-3115-2016, 2016.
Kräuchi, A. and Philipona, R.: Return glider radiosonde for in situ upper-air research measurements, Atmos. Meas. Tech., 9, 2535–2544, https://doi.org/10.5194/amt-9-2535-2016, 2016.
Lafon, T., Fowler, J., Jiménez, J. F., and Cordoba, G. J. T.: A Viable Alternative for Conducting Cost-Effective Daily Atmospheric Soundings in Developing Countries, B. Am. Meteorol. Soc., 95, 837–842, https://doi.org/10.1175/BAMS-D-13-00125.1, 2014.
Legain, D., Bousquet, O., Douffet, T., Tzanos, D., Moulin, E., Barrie, J., and Renard, J.-B.: High-frequency boundary layer profiling with reusable radiosondes, Atmos. Meas. Tech., 6, 2195–2205, https://doi.org/10.5194/amt-6-2195-2013, 2013.
Martin, S., Bange, J., and Beyrich, F.: Meteorological profiling of the lower troposphere using the research UAV “M2AV Carolo”, Atmos. Meas. Tech., 4, 705–716, https://doi.org/10.5194/amt-4-705-2011, 2011.
McCarthy, M. P., Thorne, P. W., and Titchner, H. A.: An analysis of tropospheric humidity trends from radiosondes, J. Climate, 22, 5820–5838, https://doi.org/10.1175/2009JCLI2879.1, 2009.
Miloshevich, L. M., Vömel, H., Whiteman, D. N., and Leblanc, T.: Accuracy assessment and correction of Vaisala RS92 radiosonde water vapor measurements, J. Geophys. Res.-Atmos., 114, 1–23, https://doi.org/10.1029/2008JD011565, 2009.
Moradi, I., Soden, B., Ferraro, R., Arkin, P., and Vömel, H.: Assessing the quality of humidity measurements from global operational radiosonde sensors, J. Geophys. Res.-Atmos., 118, 8040–8053, https://doi.org/10.1002/jgrd.50589, 2013.
Nash, J., Oakley, T., Vömel, H., and Wei, L.: WMO intercomparison of high quality radiosonde systems, World Meteorological Organization Instruments and Observing Methods, https://doi.org/10.1016/0006-8993(92)90441-B, 2011.
Rowe, P. M., Miloshevich, L. M., Turner, D. D., and Walden, V. P.: Dry bias in Vaisala RS90 radiosonde humidity profiles over Antarctica, J. Atmos. Ocean. Tech., 25, 1529–1541, https://doi.org/10.1175/2008JTECHA1009.1, 2008.
Seidel, D. J., Berger, F. H., Diamond, H. J., Dykema, J., Goodrich, D., Immler, F., Murray, W., Peterson, T., Sisterson, D., Sommer, M., Thorne, P., Vömel, H., and Wang, J.: Reference upper-air observations for climate: Rationale, progress, and plans, B. Am. Meteorol. Soc., 90, 361–369, https://doi.org/10.1175/2008BAMS2540.1, 2009.
Sherwood, S. C., Meyer, C. L., Allen, R. J., and Titchner, H. A.: Robust tropospheric warming revealed by iteratively homogenized radiosonde data, J. Climate, 21, 5336–5350, https://doi.org/10.1175/2008JCLI2320.1, 2008.
SparvEmbedded: Windsond Product Catalogue, available at: http://windsond.com/windsond_catalog_Dec2016.pdf (last access: 22 February 2019), 2016.
Thorne, P. W., Brohan, P., Titchner, H. A., McCarthy, M. P., Sherwood, S. C., Peterson, T. C., Haimberger, L., Parker, D. E., Tett, S. F. B., Santer, B. D., Fereday, D. R., and Kennedy, J. J.: A quantification of uncertainties in historical tropical tropospheric temperature trends from radiosondes, J. Geophys. Res.-Atmos., 116, 1–19, https://doi.org/10.1029/2010JD015487, 2011.
Vaisala: Comparison of Vaisala Radiosondes RS41 and RS92, White Paper, Ref. B211317EN – B, © Vaisala, Helsinki, Finland, 2014.
Vömel, H., Selkirk, H., Miloshevich, L., Valverde-Canossa, J., Valdés, J., Kyrö, E., Kivi, R., Stolz, W., Peng, G., and Diaz, J. A.: Radiation dry bias of the Vaisala RS92 humidity sensor, J. Atmos. Ocean. Tech., 24, 953–963, https://doi.org/10.1175/JTECH2019.1, 2007.
Wang, J., Zhang, L., Dai A., Immler, F., Sommer, M., and Vömel, H.: Radiation dry bias correction of vaisala RS92 humidity data and its impacts on historical radiosonde data, J. Atmos. Ocean. Tech., 30, 197–214, https://doi.org/10.1175/JTECH-D-12-00113.1, 2013.
Yu, H., Ciesielski, P. E., Wang, J., Kuo, H. C., Vömel H., and Dirksen, R.: Evaluation of humidity correction methods for Vaisala RS92 tropical sounding data, J. Atmos. Ocean. Tech., 32, 397–411, https://doi.org/10.1175/JTECH-D-14-00166.1, 2015.
- Abstract
- Introduction
- The field site
- The S1H2 Windsond
- Signal processing
- Windsond S1H2 vs. Vaisala RS41-SG performance comparison
- S1H2 Windsond reproducibility experiment
- Summary and conclusions
- Data availability
- Author contributions
- Competing interests
- Special issue statement
- Acknowledgements
- References