the Creative Commons Attribution 4.0 License.
the Creative Commons Attribution 4.0 License.
 | 28 Feb 2019
Aerosol light absorption from optical measurements of PTFE membrane filter samples: sensitivity analysis of optical depth measures
Apoorva Pandey
Nishit J. Shetty
Rajan K. Chakrabarty
Mass absorption cross section (MAC) measurements of atmospherically relevant aerosols are required to quantify their effect on Earth's radiative budget. Estimating aerosol light absorption from transmittance and/or reflectance measurements through filter deposits is an attractive option because of their ease of deployment in field settings, low cost, and the ability to revisit previously analyzed samples. These measurements suffer from artifacts that depend on a given filter measurement system and aerosol optics. Empirical correction algorithms are available for commercial instruments equipped with optically thick fiber filters, but optically thin filter media have not been characterized in detail. Here, we present empirical relationships between particle light absorption optical depth – measured using multiwavelength integrated photoacoustic spectrometers – and filter optical depth measurements for polytetrafluoroethylene (PTFE) membrane filter samples of carbonaceous aerosols generated from combustion of diverse biomass fuels and kerosene (surrogate for fossil fuel combustion). Through radiative transfer modeling, we assessed the suitability of three measures of filter-based optical depth for robustly describing particulate-phase light absorption over a range of single scattering albedo (SSA) values: (1) ODs – a measure of transmission of the fraction of incident radiation that is not backscattered by the filter system – which utilizes transmittance and reflectance of the sample side of the filter; (2) the commonly used ODc, which uses transmittance and reflectance of the clean side of the filter; and (3) ATN or the Beer–Lambert attenuation. Modeling results were also validated experimentally, with ODs showing the least variability around the mean in this multidimensional parameter space. We establish a simple, wavelength-independent formulation for calculating aerosol MAC and absorption coefficients from measurements of ODs. We find the ratio between in situ particulate absorption optical depth and ODs to be inversely proportional to aerosol SSA. Our findings underscore that ODs is a better optical depth measure than ODc for applying appropriate correction factors when estimating particle-phase light absorption from filter-based techniques.
- Article
(2189 KB) -
Supplement
(482 KB) - BibTeX
- EndNote


Aerosol light absorption affects the radiative balance of the Earth's atmosphere through direct and indirect mechanisms (Bond et al., 2013; Kanakidou et al., 2005; Ramanathan et al., 2001). The light absorption metric relevant to climate modelers – the mass absorption cross section (MAC) – depends on the size, shape, and composition of the aerosols (Andreae and Gelencsér, 2006; Bond and Bergstrom, 2006; Moosmüller et al., 2009). This property has a complex relationship with the emission source, especially for carbonaceous aerosols (Andreae and Gelencsér, 2006; Bond and Bergstrom, 2006; Chakrabarty et al., 2010). The canonical MAC value for “pure” black carbon aerosols, associated with fossil fuel emissions, is 7.5 m2 g−1 at 550 nm (Bond et al., 2013). MAC values for absorbing organic carbon, typically released from biomass burning, strongly vary with combustion phase and can range ∼0.01–1 m2 g−1 at 550 nm (Laskin et al., 2015).
A first-principle method of measuring contact-free aerosol light absorption is photoacoustic spectroscopy, which employs lasers at selected wavelengths to heat the aerosols, thereby producing a detectable pressure signal (Arnott et al., 1999). Absorption can also be estimated as the difference between in situ measurements of extinction and scattering (Schnaiter et al., 2005; Sheridan et al., 2005). Alternatively, a commonly adopted technique for estimating light absorption uses measurements of transmittance and/or reflectance for aerosol particles collected on a filter substrate. Instruments based on this technique, including the aethalometer (Hansen et al., 1984) and the Particle Soot Absorption Photometer or PSAP (Virkkula et al., 2005), facilitate semi-continuous sampling of particles and produce time-averaged bulk absorption measurements. Particles may also be collected on a filter substrate and analyzed for their absorption using stand-alone spectrophotometers (Martins et al., 2009; Pandey et al., 2016; White et al., 2016; Zhong and Jang, 2011).
Filter-based measurements are attractive because of their ease of deployment in field settings and low cost, but they suffer from several artifacts. Particles embedded in a multiple scattering medium experience a larger optical path length than in their native suspended state, leading to the appearance of enhanced light absorption (Bond et al., 1999; Clarke, 1982; Gorbunov et al., 2002). This is referred to as the multiple scattering artifact and depends on the choice of filter medium. A higher loading of absorbing aerosols can diminish the effect of multiple scattering, inducing an aerosol-dependent loading artifact (Arnott et al., 2005; Weingartner et al., 2003). Highly scattering aerosols could enhance multiple scattering and lead to increased backscatter, which leads to an overestimation of absorption (Lack et al., 2008; Weingartner et al., 2003). These artifacts have been evaluated for several commonly used filter-based instruments, such as those aforementioned, by comparing their measurements with contact-free aerosol light absorption measurements or using reference materials with known optical properties. Typically, correction algorithms for these artifacts are formulated as functions of some combination of filter and aerosol properties (Arnott et al., 2005; Collaud Coen et al., 2010; Virkkula, 2010; Weingartner et al., 2003) and are specific to a given measurement system.
In many field settings, aerosol samples are collected on polytetrafluoroethylene (PTFE) membrane filters (commonly known as Teflon filters) for inferring ambient or near-source particulate mass concentrations using gravimetric analysis (Koistinen et al., 1999). Major aerosol monitoring networks, such as the Interagency Monitoring of PROtected Visual Environments (IMPROVE) network (Chow et al., 2010; Solomon et al., 2014), the Chemical Speciation Network (CSN) (Solomon et al., 2014), and the Surface PARTiculate mAtter Network (SPARTAN) (Snider et al., 2015), collect particle samples on Teflon filters for gravimetric and elemental measurements. PTFE filters are chemically inert and, unlike quartz fiber filters, present a very low surface area for organic vapor adsorption (Kirchstetter et al., 2001; Vecchi et al., 2014). Correction schemes developed for instruments that use fiber filters (like the PSAP and aethalometer) cannot be applied to transmittance and/or reflectance measurements on PTFE filters. A previous study on the artifacts associated with this filter type used a reference material and provided a constant multiple scattering correction factor for optical loadings smaller than a certain threshold (Zhong and Jang, 2011). Another recent study (White et al., 2016) proposed a theory-based model to calibrate attenuation measurements for Teflon filter samples and applied this new model to a historical dataset from the IMPROVE network. They found that the reevaluated absorption values for the PTFE samples were well correlated with thermo-optical elemental carbon (EC) measurements for co-located quartz fiber filters.
In this work, we generated carbonaceous aerosols with varying physicochemical properties from the combustion of biomass fuels and kerosene. Kerosene combustion was used as a surrogate for fossil fuel burning, which is linked with soot or EC emissions (Andreae and Gelencsér, 2006; Bond et al., 2013). The combustion of wildland and fuel biomass is implicated in emissions of EC as well as light absorbing organic carbon (LAOC) (Andreae and Gelencsér, 2006; Chakrabarty et al., 2010; Chen and Bond, 2010). EC is known to absorb light throughout the visible and ultraviolet (UV) wavelengths, while LAOC absorbs preferentially in the near-UV and UV regions (Andreae and Gelencsér, 2006; Bond and Bergstrom, 2006; Kirchstetter et al., 2004; Sun et al., 2007). Therefore, we measured in situ and contact-free aerosol light absorption and scattering coefficients using integrated photoacoustic-nephelometer (IPN) spectrometers operated at three wavelengths – 375, 405, and 532 nm. Co-located with these measurements was a sampling system to collect particles onto Teflon membrane filters. Subsequent filter optical measurements, using a UV–visible (UV–vis) spectrophotometer, were performed. Observed empirical relationships between particle light absorption and filter optical depth measures were established in conjunction with predictions from a one-dimensional (1-D) two-stream radiation transfer model.
2.1 Two-stream radiative transfer model
A 1-D two-stream radiative transfer framework for multiple scattering in absorbing media was developed in Bohren (1987) – widely known as the Kubelka–Munk theory (Kubelka, 1948) – and subsequently discussed in relation to aerosol-filter systems in several studies (Arnott et al., 2005; Clarke, 1982; Gorbunov et al., 2002; Petzold and Schönlinner, 2004). Solving a radiation balance for an aerosol-laden filter medium yields the following expressions for transmittance (Tl) and reflectance (Rl), respectively:
Here, ωl, gl, and τe, l denote the single scattering albedo (SSA), asymmetry parameter, and extinction optical depth, respectively, of the composite layer. The parameter K is defined as
Arnott et al. (2005) used the above model to derive the form for an approximate correction factor for the aethalometer. The aethalometer uses optically thick quartz fiber filters, which are strongly multiple scattering, transmitting only ∼10 % of light in the visible wavelengths. A mathematical consequence of strong multiple scattering is that the term Kτe, l is much greater than unity and Eqs. (1a) and (1b) can be replaced by simplified approximations. In contrast, the Teflon filters used in this study are optically thin and constitute a weak multiple scattering medium: they transmit 70 %–80 % of incident visible light. Therefore, the full equations for Tl and Rl were solved for the filter-particle system, using a range of plausible values of dimensionless aerosol optical properties: absorption optical depth (τa, s) and SSA. Two other required inputs could not be measured: the penetration depth of aerosols into the filter was assumed to be 10 % of the total filter thickness, and the asymmetry parameter of the aerosols was fixed at 0.6, based on the typical values reported for biomass burning emissions (Martins et al., 1998; Reid et al., 2005). A schematic representation of the two-layer system – the aerosol-laden layer with properties Tl and Rl and a clean filter layer with properties Tf and Rf – is shown in Fig. 1. Transmittance and reflectance (Ts and Rs, respectively) through the filter, when light is first incident on the aerosol-laden layer (or “sample-side”), are given by (Gorbunov et al., 2002)
If the light first passes through the clean filter layer, the model predicts that transmittance, Tc, is still given by Eq. (3a). However, filter substrates are not uniform over their depths and have visually distinguishable front and back surfaces. Therefore, measurements of Ts and Tc are expected to differ. For the model substrate, reflectance, Rc, is given by
Attenuation (ATN) due to the aerosol deposit is calculated by applying Beer–Lambert's law relating to the reduction in transmittance of an exposed filter (Ts) relative to a blank (Tb) (Bond et al., 1999; Campbell et al., 1995). For a non-absorbing filter substrate, all attenuation of incident light must be caused by aerosol light absorption. Therefore, ATN is a measure of τa, s.
Here, Rb is the reflectance of the blank. An alternate measure of filter-aerosol optical depth utilizes transmittance and reflectance of the clean face of the filter (Campbell et al., 1995; White et al., 2016). This reflectance measurement Rc can be assumed to be approximately equal to Rb. PTFE blanks are non-absorbing; therefore the numerator in Eq. (5) can be replaced by . It should be noted that for translucent Teflon filters, Rb and Rc cannot be assumed to be exactly equal (Campbell et al., 1995; Clarke, 1982). Therefore, we represent this measure of optical depth by a separate variable, ODc, where the subscript denotes that the transmittance and reflectance values used correspond to the clean side of the filter:
Finally, we define an optical depth measure using sample-side transmittance and reflectance, which can be interpreted as a measure of transmission of the fraction of incident radiation that is not backscattered by the filter-aerosol system:
Values of ATN, ODc, and ODs for a range of τa, s values (0–1) are shown in Fig. 2 for two cases: (1) highly absorbing aerosols (SSA =0.3) and (2) highly scattering aerosols (SSA =0.95). We illustrate that ODc is nearly equal to ATN for the absorbing aerosol case, but there are significant differences between the two optical measures when the filter is loaded with highly scattering aerosols. This is because a translucent substrate with a reflective coating on its back behaves like a mirror: reflectance of the substrate increases when such a coating is applied. We also find that ATN shows the largest variation with SSA for a given value of τa, s, while ODs exhibits the smallest variation. This can be attributed to the changing relationships between Rs and filter loading for different SSA values (see Fig. S2 in the Supplement). For large SSA, Rs>Rb, and therefore, from Eqs. (5) and (7), ODs< ATN. The converse is true for small SSA values. It should be noted that fixed blank optics – based on the mean of transmittance and reflectance measurements (measurement techniques are described in the following section) on 20 blank filters – were used to model ATN, ODc, and ODs. The purpose of this exercise was to illustrate the sensitivity of the above optical depth measures to SSA values of aerosols deposited on identical media.
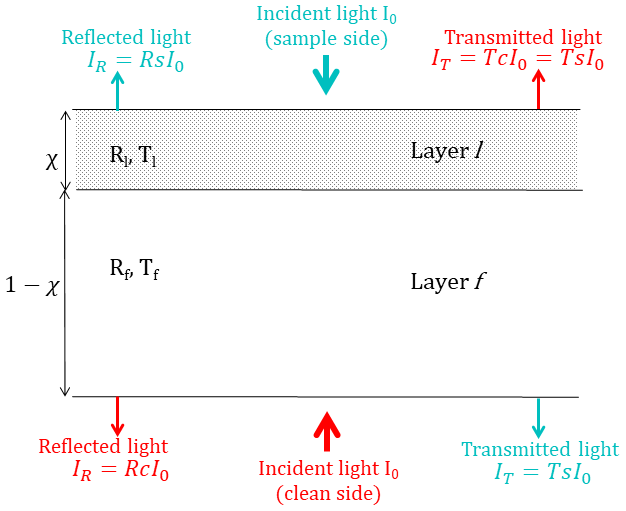
Figure 1Two-layer model of a filter sample consisting of an aerosol-laden layer “l” and a clean layer “f”.
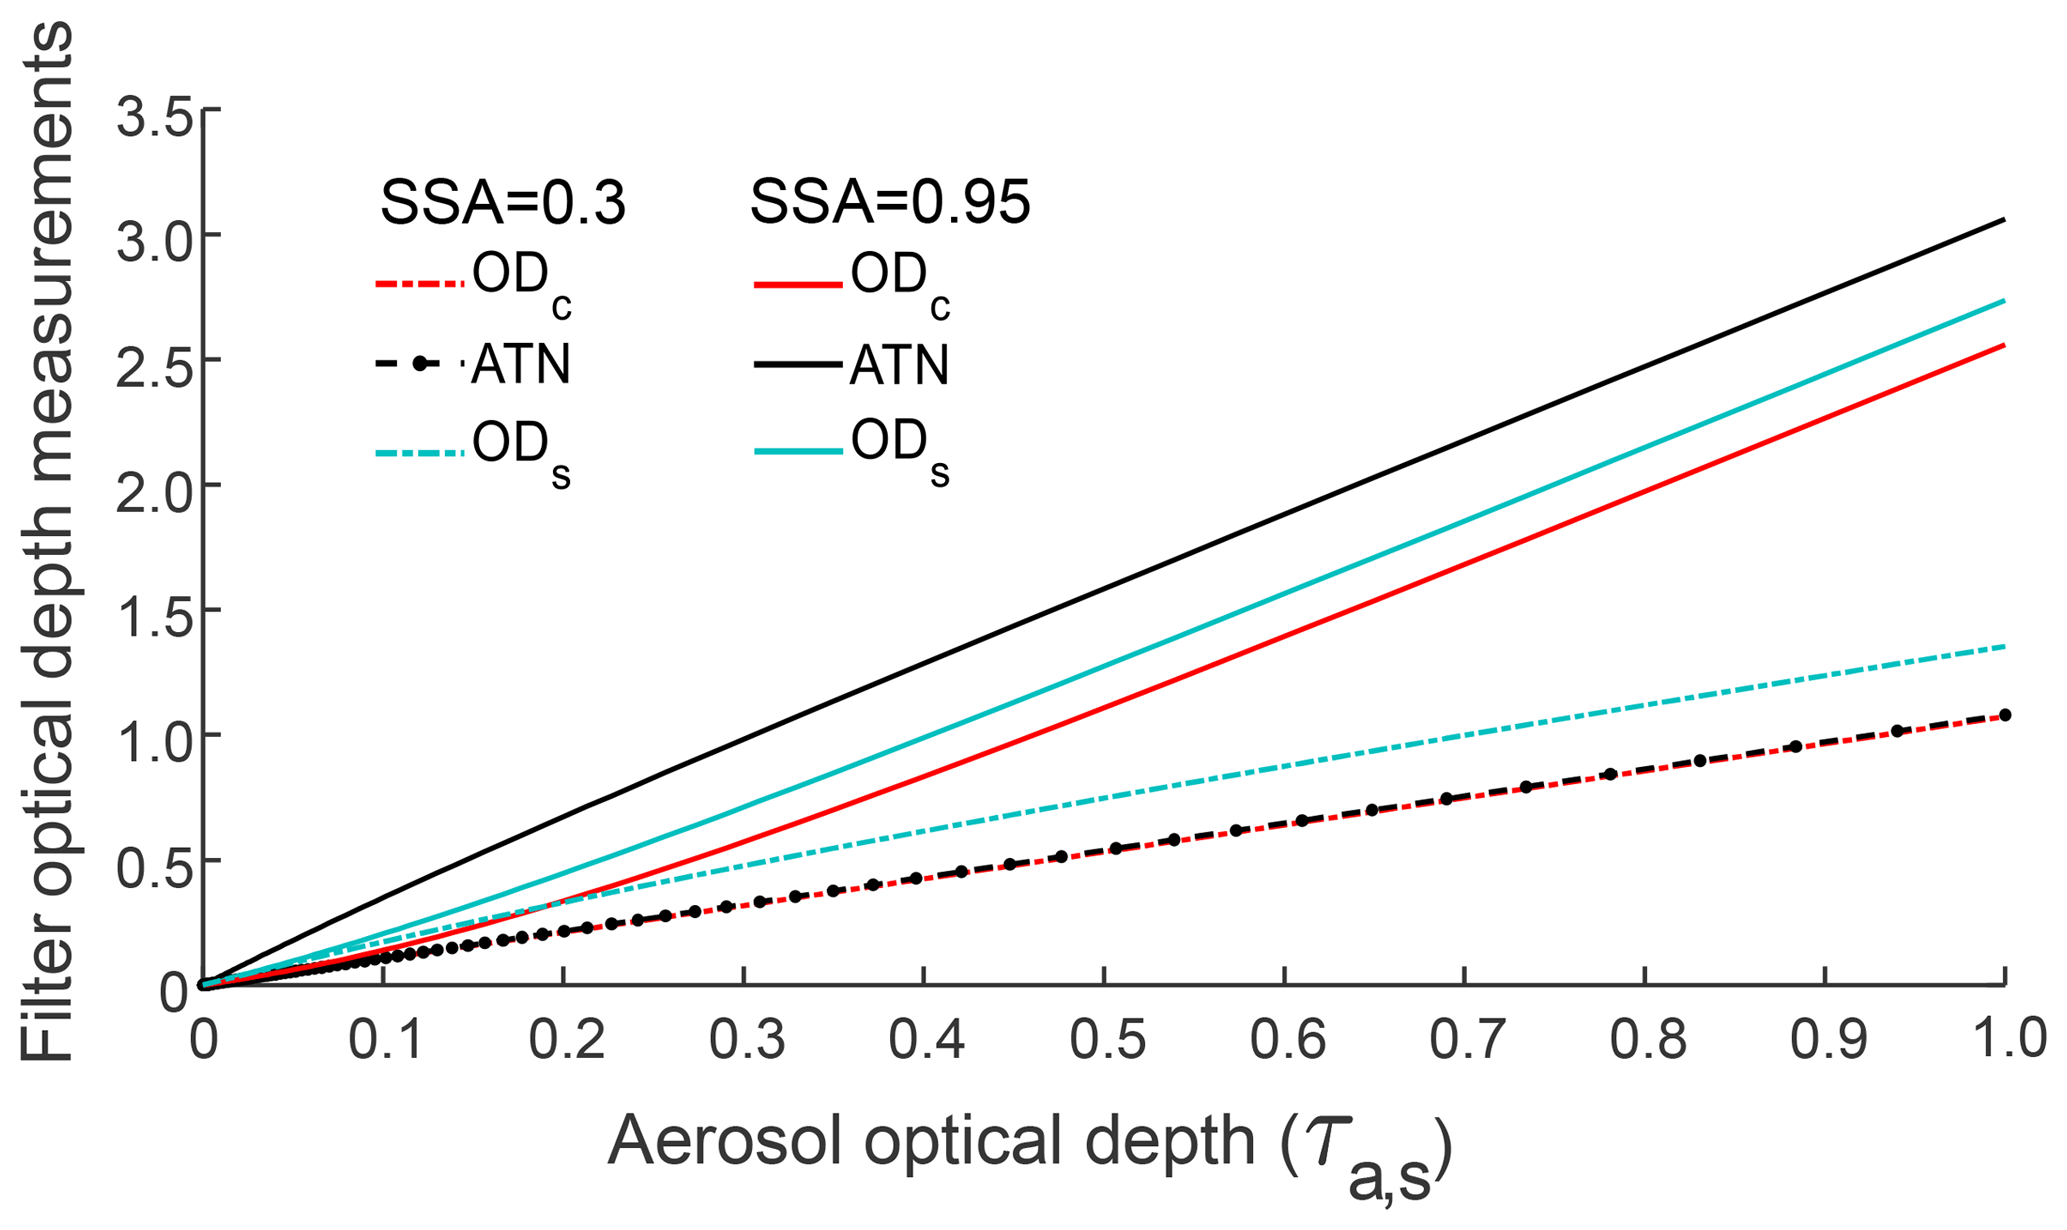
Figure 2Modeled values of filter optical depth measures (ODc, ATN, and ODs) with increasing aerosol optical depth (τa, s) of deposited highly absorbing (SSA =0.3) or highly scattering (SSA =0.95) aerosols. Fixed blank optics were assumed.
The variation in filter optical measures with SSA was quantified by calculating the means and standard deviations (SDs) of ATN, ODc, and ODs, over SSA values ranging 0.2–0.99 for each input value of τa, s. A total of 500 linearly spaced points along the SSA range were used. Blank filter properties were also varied within the model in accordance with the range observed over the 20 lab blanks. For every model sample, defined by a given SSA and τa, s combination, a model blank was generated assuming a normal distribution of blank transmittance values (mean =0.7, SD =0.02). Figure 3 shows the ratio of standard deviation to the corresponding average values of each filter optical depth measure. The relatively low standard deviation in ODs (for most loading values) implies that this variable is a good candidate for estimating aerosol light absorption from filter optical measurements, for a wide range of aerosol types. The increase in standard deviation with increasing loading is mainly contributed by very high SSA points which are typically associated with lower absorption per unit mass; therefore very high mass loadings of such aerosols would be required to yield the upper range of the τa, s. For SSA <0.9, modeled attenuation values show little spread (<15 % variability around the mean) with changing SSA. A surface plot of ODs for all model data points ( and ) is shown in Fig. S4.
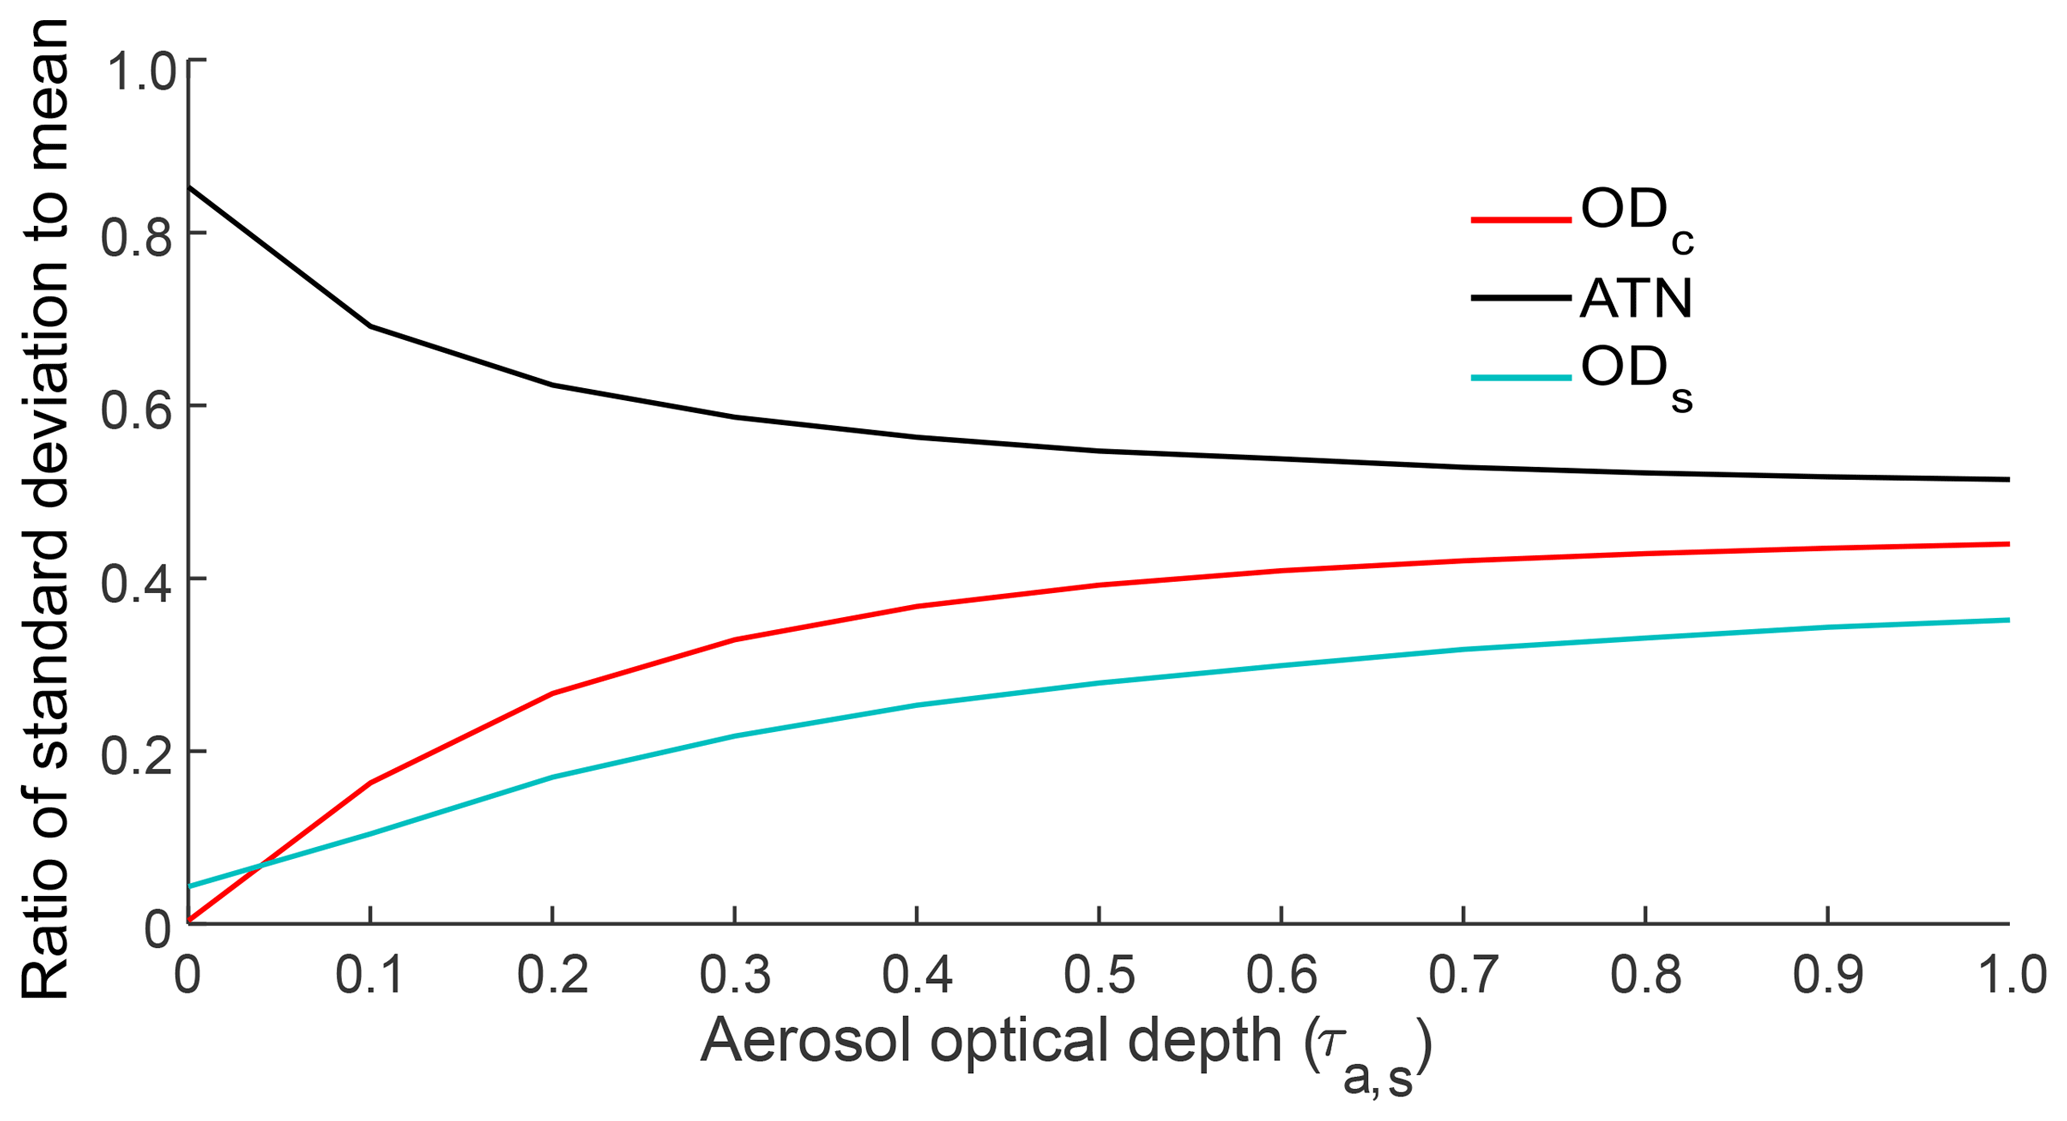
Figure 3Ratio of standard deviations to means of modeled filter optical depth measures (ODc, ATN and ODs) averaged over 500 equally spaced SSA points ranging 0.2–0.99, corresponding to each value of aerosol optical depth (τa, s). Blank optics were randomly generated for each sample point from a normal distribution, with mean =0.7 and SD =0.02.
2.2 Experiments
Diverse biomass fuels including wood and needles from pine, fir, and sage trees, grass, peat, and cattle dung were burned in a 21 m3 stainless steel combustion chamber located at Washington University (Sumlin et al., 2018, 2017). Flaming, smoldering, and mixed combustion phases were employed (see Sect. S1 in the Supplement) to generate a range of intrinsic aerosol properties: SSA values at 375, 405, and 532 nm ranged 0.4–0.99 and absorption Ångström exponents (AÅEs) for 375–532 nm ranged 1.2–6.8. A kerosene lamp was used to generate soot particles, with an SSA of ∼0.3 and AÅE within 0.70–1.1. A schematic of the experimental setup is shown in Fig. 4. Experimental conditions and intrinsic aerosol optical properties for each fuel–combustion phase combination are listed in Table 1. Approximately 10–50 g of a given type of woody biomass, grass, or dung was placed in a stainless steel pan and ignited using a flame. It was either allowed to continue flaming or brought to a smoldering phase by starving the flame with a lid. In the same type of pan, 5–15 g of peat was smoldered by using a ring heater to raise its temperature to 200 ∘C. In one set of experiments, smoke from the chamber was directly sampled, while in another set, a hood placed over the pan was used for sampling the aerosols. The chamber exhaust was closed during the burns. The outlet from the hood or chamber was passed through a diffusion dryer and a semi-volatile organic compound denuder into a mixing volume, from which aerosols were continuously sampled by the four IPNs.
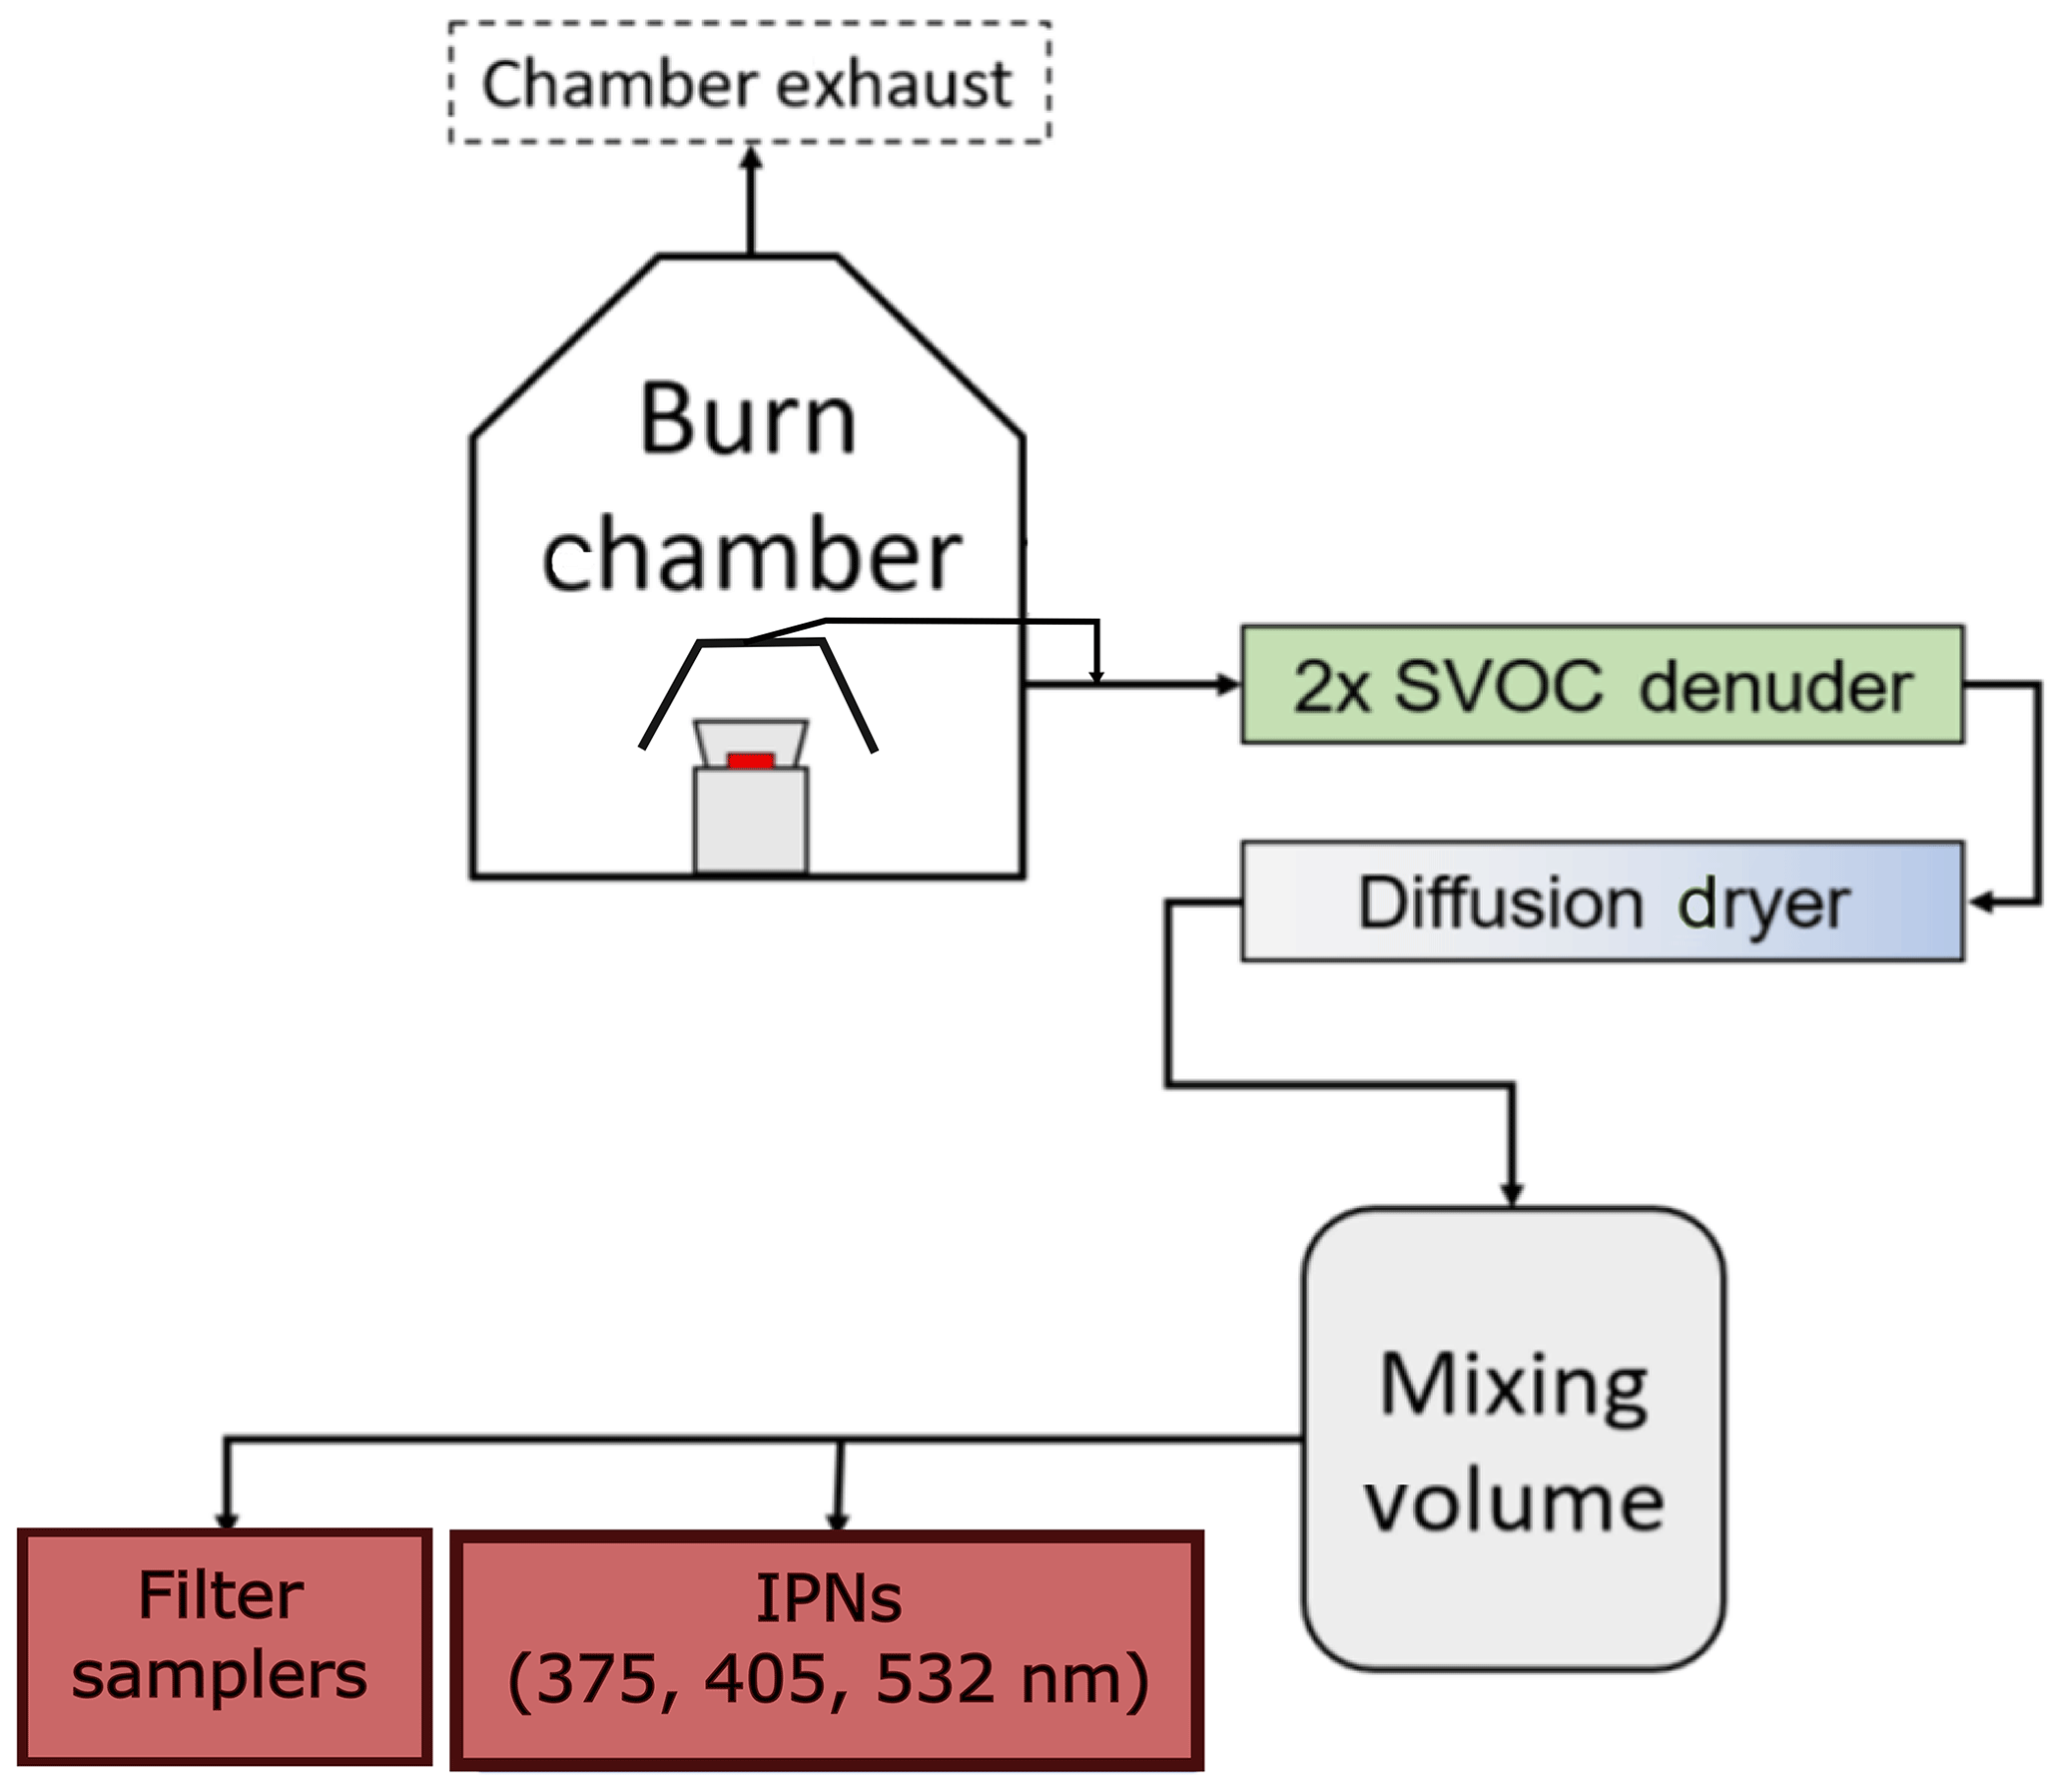
Figure 4Schematic representation of the experimental setup. Inlet to the semi-volatile organic compound denuder was taken from either the chamber sampling port or the hood. “IPNs” denotes the integrated photoacoustic-nephelometer spectrometers.
Table 1Number of burns conducted and filter samples collected for each fuel type and combustion phase in this study. Intrinsic optical properties of emissions from each study condition are also given.

During each burn, optical (absorption and scattering coefficients) signals were monitored using IPNs until a steady state was reached. During the steady state, particle samples were collected on 47 mm PTFE membrane (Pall) filters. The filter sampling flow rate was set to 5 L min−1, and the sampling durations were between 2 and 20 min. For each filter sample, τa, s of the deposited aerosols was calculated from the absorption coefficients measured using the IPNs:
where babs, av is the average absorption coefficient (in Mm−1) during the sampling duration ts (in min), Q is the flow rate (in liters per minute or L min−1) through the filter, and As is the filter sample area (in m2). Optical depth τa, s for the samples in this study ranged between 0.01 and 0.68. The uncertainty in these estimates was predominantly from the standard deviation in babs, av over the averaging interval and was within 10 % for all samples. Values of babs, av at 532 nm ranged from ∼300 Mm−1 for smoldering samples to ∼20 000 Mm−1 for flaming phase samples; the corresponding range at 375 nm was ∼3000–30 000 Mm−1.
Sample-side transmittance (Ts) and reflectance (Rs) for the filter samples were measured using a PerkinElmer LAMBDA 35 UV–Vis spectrophotometer (described in Zhong and Jang, 2011). This instrument contains an integrating sphere and two sample holders. Transmittance was measured by placing the sample in the first holder ahead of the sphere, in the direction of the sample beam, while a white standard was placed in the second holder (behind the sphere). Reflectance was measured by keeping the first holder empty and placing the sample in the second holder. Both measurements were performed on the sample face of the filter: light was incident on the side that was exposed to the sample air. Each measurement was normalized to the baseline transmittance and reflectance value of the measurement system: between every 10 sample scans, transmittance and reflectance were measured with no sample placed in the first holder, and a white standard was placed in the second holder. Sample transmittance and reflectance values were then divided by the corresponding baseline. Only Ts and Rs were measured for all samples in this study as model results indicated that ODs is better suited than ODc for estimating τa, s (Fig. 3). To test the validity of this assumption, transmittance and reflectance were also measured on the clean side of the filter (Tc and Rc, respectively) for a subset of the samples (n=54). This subset corresponded to samples collected during 17 biomass burning experiments which yielded aerosols with SSA (375, 405, and 532 nm) ranging 0.54–0.99. For all samples, we found Ts>Tc.
From normalized Ts and Rs measurements, ODs was calculated using Eq. (7). When this equation is applied to blank filters, it results in ODs values between 0.01 and 0.03. A wavelength-dependent “blank optical depth” was subtracted from the sample data. Triplicate transmission and reflection measurements were used to estimate measurement uncertainty, which is attributable to random fluctuations in the measurements. Means and standard deviations of the ODs values calculated from the replicate measurements yielded an uncertainty (ratio of standard deviation to mean) of 5 % in ODs. Similarly, ODc was calculated for the 54-sample subset.
A correction factor (C) that captures the net effect of multiple scattering and aerosol loading can be defined as
The model described in Sect. 2.1 was used to calculate filter optical depths for each experimental sample (using measured τa, s and SSA values as inputs). Modeled and experimental values of ODs for the samples are shown in Fig. 5. The two datasets are highly correlated (Pearson R=0.92), but the model predicted larger values of ODs than those determined experimentally. This disagreement may partially be due to differences between assumed parameters in our model and their real-world values. It is also possible that assuming an average propagation direction of diffuse radiation within the two-stream approximation (Arnott et al., 2005; Sagan and Pollack, 1967) causes this systematic difference.
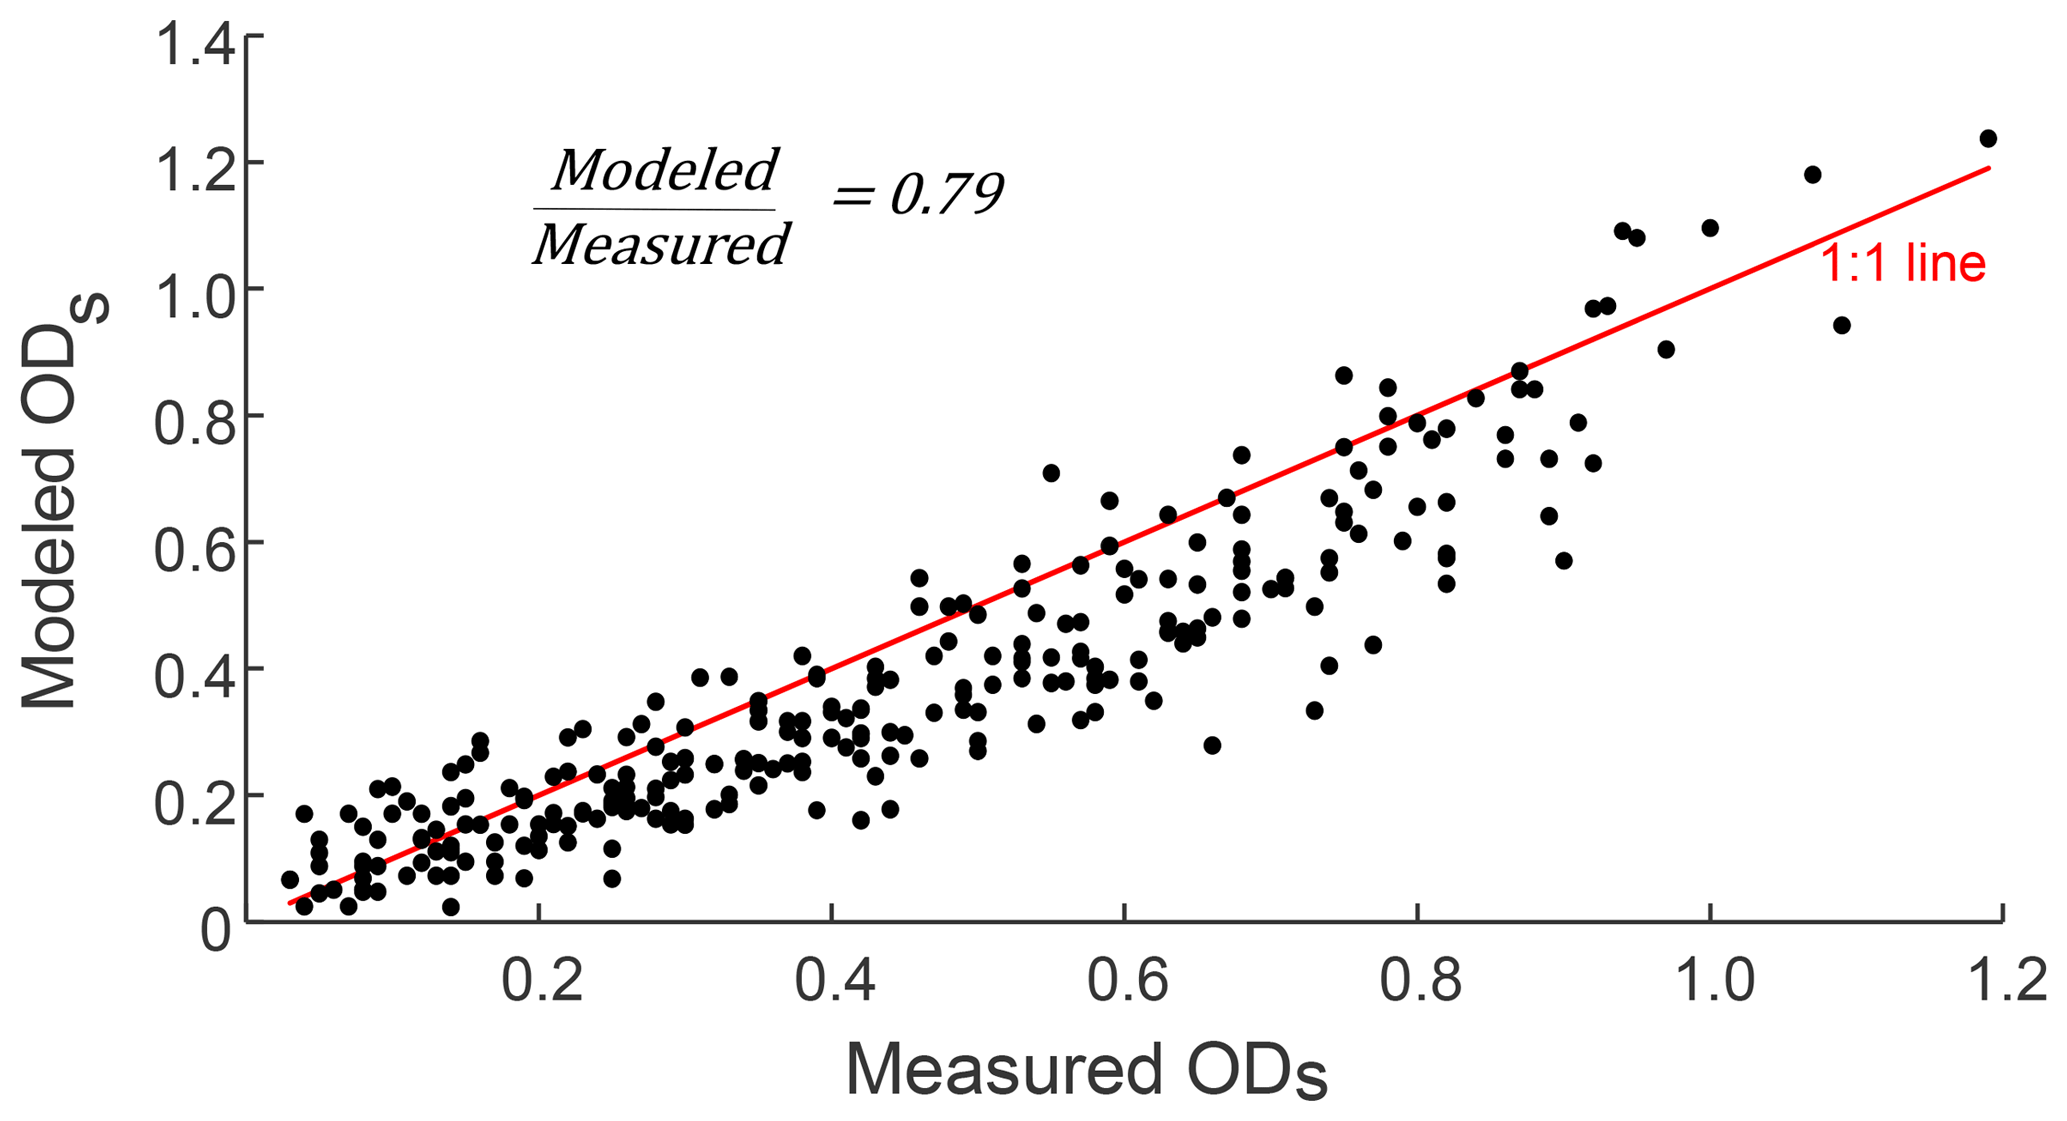
Figure 5Modeled filter optical depth (ODs) for absorption optical depth and single scattering albedo values of the aerosols sampled in this study compared with the corresponding filter measurements. A 1:1 line is shown in red. The average ratio of modeled to measured ODs is 0.79.
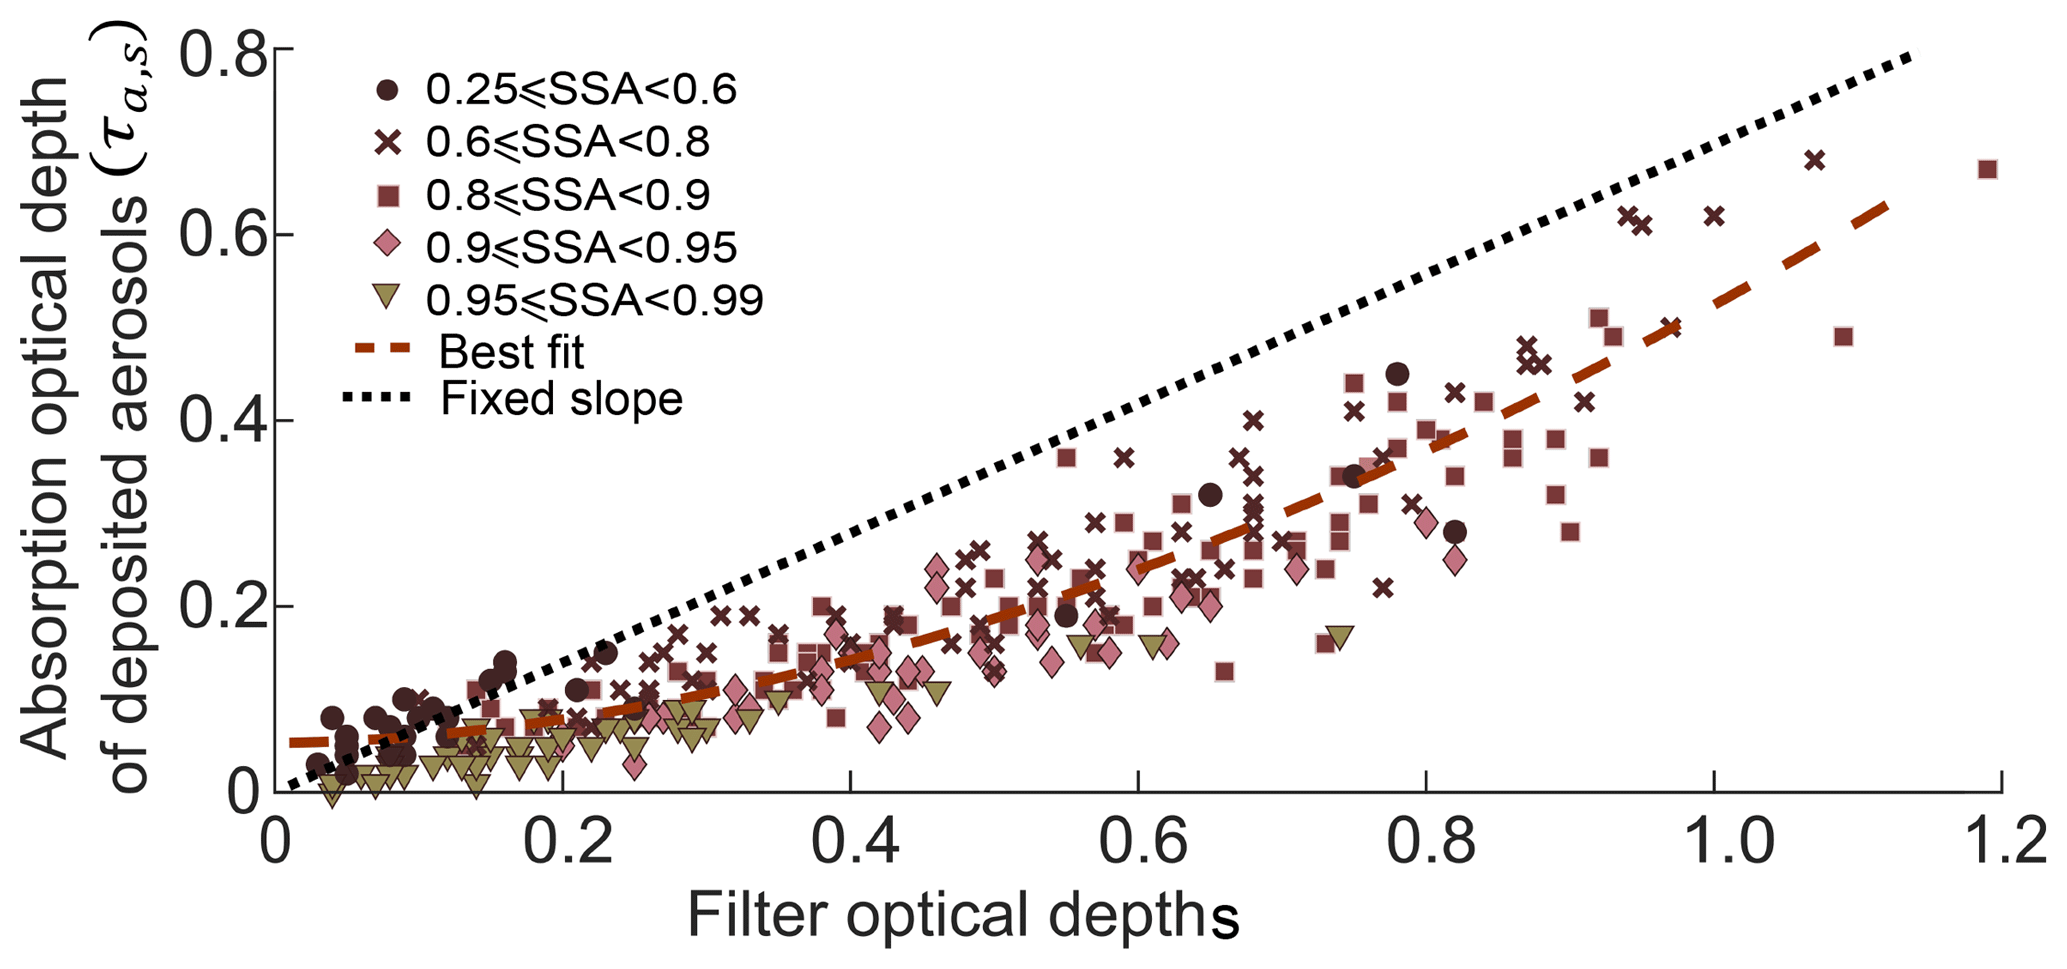
Figure 6Relationship between in situ aerosol optical depth (τa, s) and filter optical depth ODs for all (n=90) samples, measured at 375, 405, and 532 nm (N=270 data points). The best fit curve is given by Eq. (10), with R2=0.87. The black perforated line has a fixed slope of 0.67 per Zhong and Jang (2011). Uncertainties (1 SD) in ODs ranged 2–5 %, while those in τa, s were 5–10 %.
In Fig. 6, we combined all experimental (τa, s versus ODs) data corresponding to the three wavelengths since our measurements showed no clear stratification with varying wavelength. The relationships between τa, s and modeled values of ODs, ODc, and ATN are presented in the Supplement (Fig. S5); modeling predicts the lowest scatter in the τa, s–ODs curve (Fig. S5). Further, Fig. 7 shows τa, s plotted against measured ODs and ODc (at all three wavelengths) for the aforementioned subset of 54 filter samples, demonstrating that τa, s is better correlated with ODs than with ODc. Ordinary least-squares regression was applied to obtain power-law fits included in the plot legend. The corresponding relationship for all points in Fig. 6 is given by (R2=0.87)
Also shown in the figure are estimated τa, s values using a constant correction factor C of 0.67 proposed by Zhong and Jang (2011) (black perforated line); this correction factor clearly overestimates τa, s for most ODs values investigated in this study. We find our data to be better represented by an approximate C=0.46 based on a linear least-squares fit (R2=0.79). However, any constant C value does not capture the nonlinearity of the interaction between aerosol properties and the multiple scattering within the filter medium. It should be noted that C in Eq. (9) represents the net effects of all filter artifacts. There are measurement errors associated with both ODs and τa, s, and, therefore, C contains propagation of uncertainties from both parameters. There was no correlation between C and ODs (see Fig. S6). We observed an inverse relationship between C and SSA (Fig. 8), consistent with results the from the two-stream radiative transfer model. For a given value of τa, s, ODs will always be higher for aerosols with higher SSA values. Consequently, we should expect C to decrease with increasing SSA; this decreasing relationship in our data is given in Eq (11).
Values of C and SSA for individual samples (shown in Fig. S6b) were aggregated into five SSA bins to demonstrate the inapplicability of an empirical correction factor formulation to low SSA data points in this study. The large spread in C values for low SSA is likely due to noise amplification from dividing two small (τa, s and ODs<0.2) numbers. For SSA >0.6, the above linear fit holds.

Figure 7Relationship between in situ aerosol optical depth (τa, s) and measured values of filter optical depth measures ODc and ODs for a subset of 54 filter samples, measured at 375, 405, and 532 nm (N=162 data points). Uncertainties were as in Fig. 6.
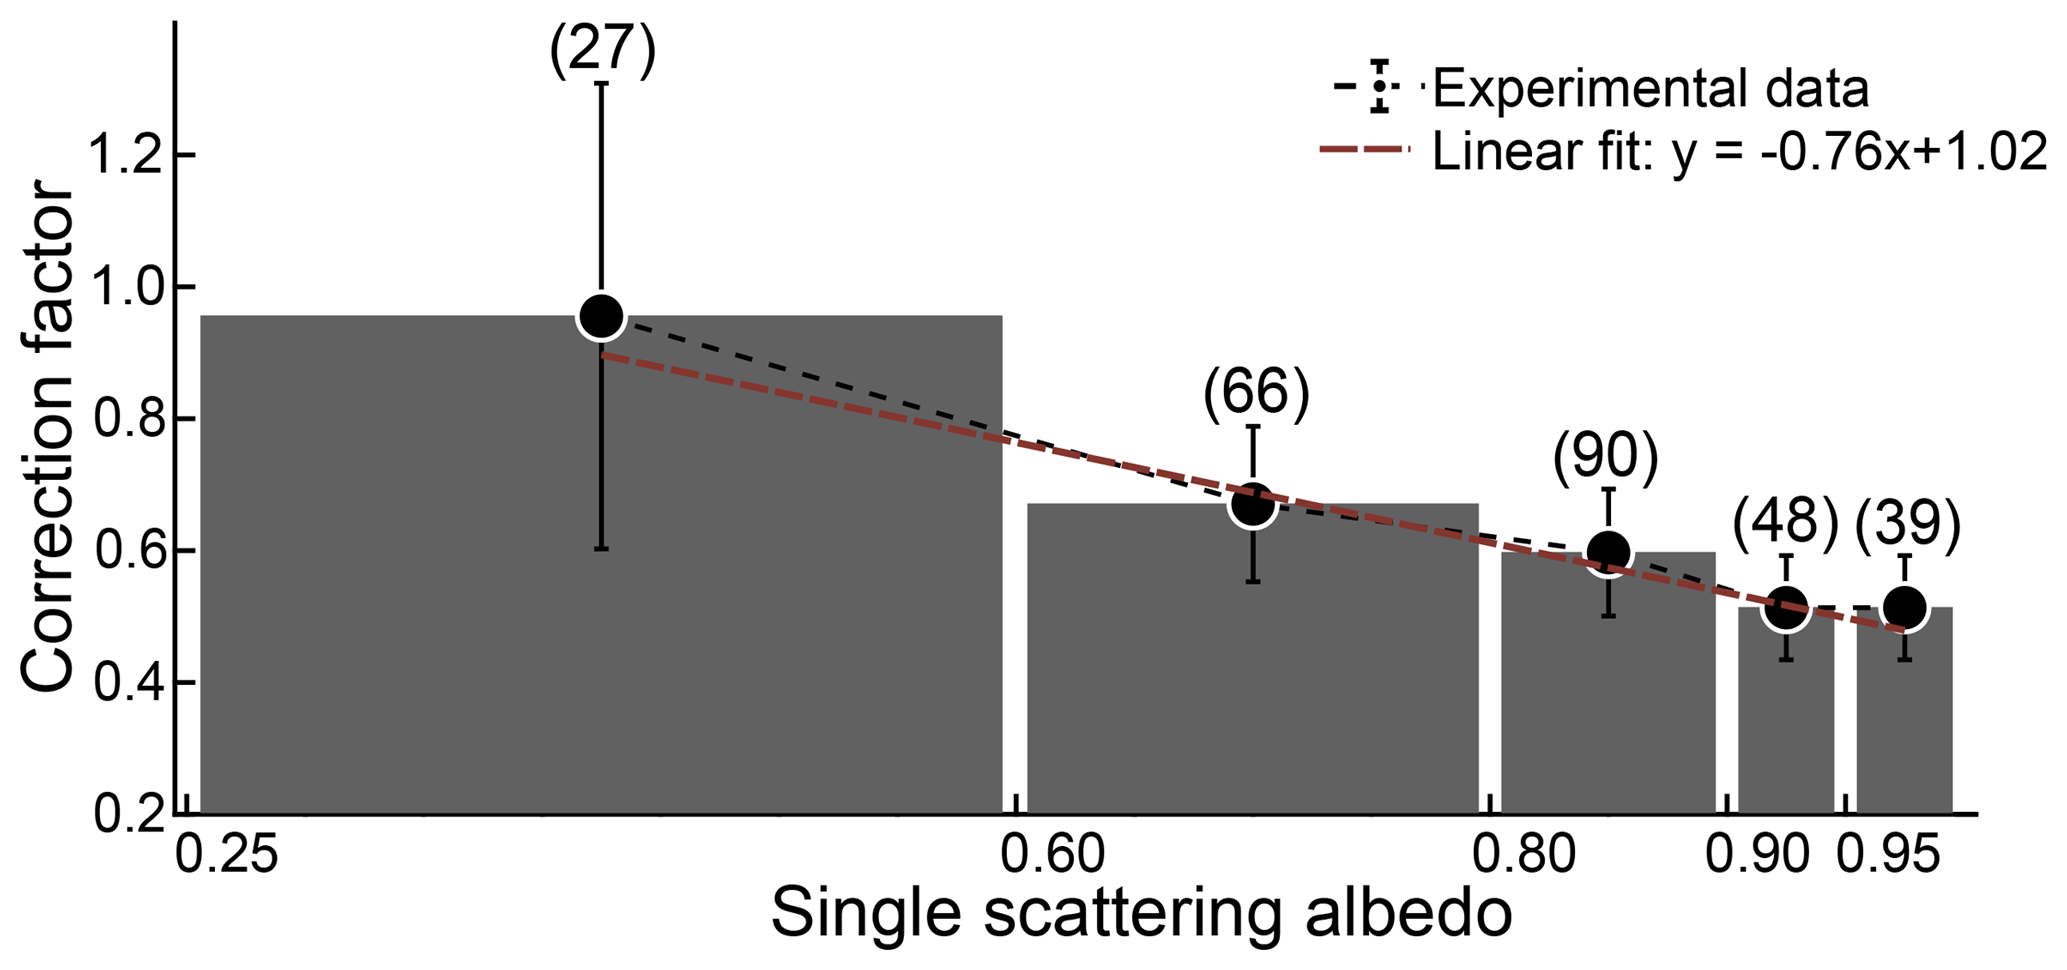
Figure 8Correction factor C for filter artifacts as a function of single scattering albedo of the deposited aerosols. Error bars show 1 SD around the mean. The numbers in parentheses denote the number of data points in each bin.
We evaluated the relationship between in situ aerosol light absorption and attenuation of aerosol deposits on Teflon filters for combustion aerosols (encompassing ), at wavelengths of 375, 405, and 532 nm. An empirical nonlinear relationship was found between the absorption optical depth of sampled aerosols and attenuation through filter samples; the nature of this function was consistent with predictions from a two-stream radiative transfer model of the filter-aerosol system. Following Eq. (10), we propose the estimation of aerosol MAC (m2 g−1) values from filter ODs measurements using
where As is the filter sample area (in m2) and m is the mass on deposited particles (in g). Additionally, aerosol absorption coefficients (babs; in Mm−1) can also be calculated using
The quantities Q and ts are as used in Eq. (8). Caution must be taken, as suggested by the two-stream model results, in terms of the limits of applicability of the empirical relationships (Eqs. 10–13) – significant errors could result from application of the relationships if the aerosol SSA >0.9 and ODs values are beyond the range of this work.
Teflon filters are routinely used for gravimetric and elemental analysis across monitoring networks (Chow et al., 2010; Snider et al., 2015; Solomon et al., 2014), as well as in field and laboratory source characterization studies. In many measurement systems, such as the Hybrid Integrating Plate and Sphere (HIPS) method (Bond et al., 1999) used by the IMPROVE network, transmittance and reflectance are measured on the clean side of the filter and the optical depth ODc is calculated (Campbell et al., 1995; White et al., 2016). The relationship between aerosol optical depth, τa, s, and ODc showed a larger variability across varying SSA than that between τa, s and ODs. Therefore, we suggest further evaluation of ODs as an optical depth measure that can be empirically connected to particulate-phase light absorption for a range of aerosol types.
All experimental data (aerosol and filter optical measurements for 90 samples and 3 wavelengths) are available for download at https://doi.org/10.17632/tt85kjrv37.1 (Pandey, 2019).
The Supplement includes a schematic of the experimental setup (Sect. S1), detailed equations for the two-stream model (Sect. S2, Fig. S1), supplemental modeling results (Sect. S2, Figs. S2–S5), and correction factor plots (Sect. S3, Fig. S6). The supplement related to this article is available online at: https://doi.org/10.5194/amt-12-1365-2019-supplement.
RKC conceived of the study and its design, provided guidance and supervision for carrying out the research tasks, and contributed to the preparation of the manuscript. AP and NJS performed the experiments. AP performed the data analysis and optical modeling, developed the figures, and led the preparation of the manuscript. All authors were involved in the editing and proofreading of the manuscript.
The authors declare that they have no conflict of interest.
This work was partially supported by the National Science Foundation under
grant no. AGS1455215, NASA ROSES under grant no. NNX15AI66G, and the
International Center for Energy, Environment and Sustainability (InCEES) at
Washington University in St. Louis.
Edited by: Omar Torres
Reviewed by: Warren White and one anonymous referee
Andreae, M. O. and Gelencsér, A.: Black carbon or brown carbon? The nature of light-absorbing carbonaceous aerosols, Atmos. Chem. Phys., 6, 3131–3148, https://doi.org/10.5194/acp-6-3131-2006, 2006.
Arnott, W. P., Moosmüller, H., Rogers, C. F., Jin, T., and Bruch, R.: Photoacoustic spectrometer for measuring light absorption by aerosol: instrument description, Atmos. Environ., 33, 2845–2852, 1999.
Arnott, W. P., Hamasha, K., Moosmüller, H., Sheridan, P. J., and Ogren, J. A.: Towards aerosol light-absorption measurements with a 7-wavelength aethalometer: Evaluation with a photoacoustic instrument and 3-wavelength nephelometer, Aerosol Sci. Tech., 39, 17–29, 2005.
Bohren, C. F.: Multiple scattering of light and some of its observable consequences, Am. J. Phys., 55, 524–533, 1987.
Bond, T. C. and Bergstrom, R. W.: Light absorption by carbonaceous particles: An investigative review, Aerosol Sci. Tech., 40, 27–67, 2006.
Bond, T. C., Anderson, T. L., and Campbell, D.: Calibration and intercomparison of filter-based measurements of visible light absorption by aerosols, Aerosol Sci. Tech., 30, 582–600, 1999.
Bond, T. C., Doherty, S. J., Fahey, D., Forster, P., Berntsen, T., DeAngelo, B., Flanner, M., Ghan, S., Kärcher, B., and Koch, D.: Bounding the role of black carbon in the climate system: A scientific assessment, J. Geophys. Res.-Atmos., 118, 5380–5552, 2013.
Campbell, D., Copeland, S., and Cahill, T.: Measurement of aerosol absorption coefficient from Teflon filters using integrating plate and integrating sphere techniques, Aerosol Sci. Tech., 22, 287–292, 1995.
Chakrabarty, R. K., Moosmüller, H., Chen, L.-W. A., Lewis, K., Arnott, W. P., Mazzoleni, C., Dubey, M. K., Wold, C. E., Hao, W. M., and Kreidenweis, S. M.: Brown carbon in tar balls from smoldering biomass combustion, Atmos. Chem. Phys., 10, 6363–6370, https://doi.org/10.5194/acp-10-6363-2010, 2010.
Chen, Y. and Bond, T. C.: Light absorption by organic carbon from wood combustion, Atmos. Chem. Phys., 10, 1773–1787, https://doi.org/10.5194/acp-10-1773-2010, 2010.
Chow, J. C., Watson, J. G., Green, M. C., and Frank, N. H.: Filter light attenuation as a surrogate for elemental carbon, J. Air Waste Manage., 60, 1365–1375, 2010.
Clarke, A. D.: Effects of filter internal reflection coefficient on light absorption measurements made using the integrating plate method, Appl. Optics, 21, 3021–3031, 1982.
Collaud Coen, M., Weingartner, E., Apituley, A., Ceburnis, D., Fierz-Schmidhauser, R., Flentje, H., Henzing, J. S., Jennings, S. G., Moerman, M., Petzold, A., Schmid, O., and Baltensperger, U.: Minimizing light absorption measurement artifacts of the Aethalometer: evaluation of five correction algorithms, Atmos. Meas. Tech., 3, 457–474, https://doi.org/10.5194/amt-3-457-2010, 2010.
Gorbunov, B., Hamilton, R., and Hitzenberger, R.: Modeling radiative transfer by aerosol particles on a filter, Aerosol Sci. Tech., 36, 123–135, 2002.
Hansen, A., Rosen, H., and Novakov, T.: The aethalometer – an instrument for the real-time measurement of optical absorption by aerosol particles, Sci. Total Environ., 36, 191–196, 1984.
Kanakidou, M., Seinfeld, J. H., Pandis, S. N., Barnes, I., Dentener, F. J., Facchini, M. C., Van Dingenen, R., Ervens, B., Nenes, A., Nielsen, C. J., Swietlicki, E., Putaud, J. P., Balkanski, Y., Fuzzi, S., Horth, J., Moortgat, G. K., Winterhalter, R., Myhre, C. E. L., Tsigaridis, K., Vignati, E., Stephanou, E. G., and Wilson, J.: Organic aerosol and global climate modelling: a review, Atmos. Chem. Phys., 5, 1053–1123, https://doi.org/10.5194/acp-5-1053-2005, 2005.
Kirchstetter, T. W., Corrigan, C. E., and Novakov, T.: Laboratory and field investigation of the adsorption of gaseous organic compounds onto quartz filters, Atmos. Environ., 35, 1663–1671, 2001.
Kirchstetter, T. W., Novakov, T., and Hobbs, P. V.: Evidence that the spectral dependence of light absorption by aerosols is affected by organic carbon, J. Geophys. Res., 109, D21208, https://doi.org/10.1029/2004JD004999, 2004.
Koistinen, K. J., Kousa, A., Tenhola, V., Hänninen, O., Jantunen, M. J., Oglesby, L., Kuenzli, N., and Georgoulis, L.: Fine particle (PM25) measurement methodology, quality assurance procedures, and pilot results of the EXPOLIS study, J. Air Waste Manage., 49, 1212–1220, 1999.
Kubelka, P.: New contributions to the optics of intensely light-scattering materials. Part I, J. Opt. Soc. Am., 38, 448–457, 1948.
Lack, D. A., Cappa, C. D., Covert, D. S., Baynard, T., Massoli, P., Sierau, B., Bates, T. S., Quinn, P. K., Lovejoy, E. R., and Ravishankara, A.: Bias in filter-based aerosol light absorption measurements due to organic aerosol loading: Evidence from ambient measurements, Aerosol Sci. Tech., 42, 1033–1041, 2008.
Laskin, A., Laskin, J., and Nizkorodov, S. A.: Chemistry of Atmospheric Brown Carbon, Chem. Rev., 115, 4335–4382, 2015.
Martins, J. V., Artaxo, P., Liousse, C., Reid, J. S., Hobbs, P. V., and Kaufman, Y. J.: Effects of black carbon content, particle size, and mixing on light absorption by aerosols from biomass burning in Brazil, J. Geophys. Res., 103, 32041–32050, 1998.
Martins, J. V., Artaxo, P., Kaufman, Y. J., Castanho, A. D., and Remer, L. A.: Spectral absorption properties of aerosol particles from 350–2500 nm, Geophys. Res. Lett., 36, L13810, https://doi.org/10.1029/2009GL037435, 2009.
Moosmüller, H., Chakrabarty, R., and Arnott, W.: Aerosol light absorption and its measurement: A review, J. Quant. Spectrosc. Ra., 110, 844–878, 2009.
Pandey, A.: Aerosol light absorption and optical measurements of PTFE membrane filter samples, Mendeley Data, Version 1, https://doi.org/10.17632/tt85kjrv37.1, 2019.
Pandey, A., Pervez, S., and Chakrabarty, R. K.: Filter-based measurements of UV–vis mass absorption cross sections of organic carbon aerosol from residential biomass combustion: Preliminary findings and sources of uncertainty, J. Quant. Spectrosc. Ra., 182, 296–304, 2016.
Petzold, A. and Schönlinner, M.: Multi-angle absorption photometry – a new method for the measurement of aerosol light absorption and atmospheric black carbon, J. Aerosol Sci., 35, 421–441, 2004.
Ramanathan, V., Crutzen, P., Kiehl, J., and Rosenfeld, D.: Aerosols, climate, and the hydrological cycle, Science, 294, 2119–2124, 2001.
Reid, J. S., Eck, T. F., Christopher, S. A., Koppmann, R., Dubovik, O., Eleuterio, D. P., Holben, B. N., Reid, E. A., and Zhang, J.: A review of biomass burning emissions part III: intensive optical properties of biomass burning particles, Atmos. Chem. Phys., 5, 827–849, https://doi.org/10.5194/acp-5-827-2005, 2005.
Sagan, C. and Pollack, J. B.: Anisotropic nonconservative scattering and the clouds of Venus, J. Geophys. Res., 72, 469–477, 1967.
Schnaiter, M., Schmid, O., Petzold, A., Fritzsche, L., Klein, K.-F., Andreae, M. O., Helas, G., Thielmann, A., Gimmler, M., and Möhler, O.: Measurement of wavelength-resolved light absorption by aerosols utilizing a UV-VIS extinction cell, Aerosol Sci. Tech., 39, 249–260, 2005.
Sheridan, P. J., Arnott, W. P., Ogren, J. A., Andrews, E., Atkinson, D. B., Covert, D. S., Moosmüller, H., Petzold, A., Schmid, B., and Strawa, A. W.: The Reno Aerosol Optics Study: An evaluation of aerosol absorption measurement methods, Aerosol Sci. Tech., 39, 1–16, 2005.
Snider, G., Weagle, C. L., Martin, R. V., van Donkelaar, A., Conrad, K., Cunningham, D., Gordon, C., Zwicker, M., Akoshile, C., Artaxo, P., Anh, N. X., Brook, J., Dong, J., Garland, R. M., Greenwald, R., Griffith, D., He, K., Holben, B. N., Kahn, R., Koren, I., Lagrosas, N., Lestari, P., Ma, Z., Vanderlei Martins, J., Quel, E. J., Rudich, Y., Salam, A., Tripathi, S. N., Yu, C., Zhang, Q., Zhang, Y., Brauer, M., Cohen, A., Gibson, M. D., and Liu, Y.: SPARTAN: a global network to evaluate and enhance satellite-based estimates of ground-level particulate matter for global health applications, Atmos. Meas. Tech., 8, 505–521, https://doi.org/10.5194/amt-8-505-2015, 2015.
Solomon, P. A., Crumpler, D., Flanagan, J. B., Jayanty, R., Rickman, E. E., and McDade, C. E.: US National PM2.5 chemical speciation monitoring networks – CSN and IMPROVE: description of networks, J. Air Waste Manage, 64, 1410–1438, 2014.
Sumlin, B. J., Pandey, A., Walker, M. J., Pattison, R. S., Williams, B. J., and Chakrabarty, R. K.: Atmospheric Photooxidation Diminishes Light Absorption by Primary Brown Carbon Aerosol from Biomass Burning, Environ. Sci. Tech. Let., 4, 540–545, 2017.
Sumlin, B. J., Heinson, Y. W., Shetty, N., Pandey, A., Pattison, R. S., Baker, S., Hao, W. M., and Chakrabarty, R. K.: UV–Vis–IR spectral complex refractive indices and optical properties of brown carbon aerosol from biomass burning, J. Quant. Spectrosc. Ra., 206, 392–398, 2018.
Sun, H., Biedermann, L., and Bond, T. C.: Color of brown carbon: A model for ultraviolet and visible light absorption by organic carbon aerosol, Geophys. Res. Lett., 34, L17813, https://doi.org/10.1029/2007GL029797, 2007.
Vecchi, R., Bernardoni, V., Paganelli, C., and Valli, G.: A filter-based light-absorption measurement with polar photometer: Effects of sampling artifacts from organic carbon, J. Aerosol Sci., 70, 15–25, 2014.
Virkkula, A.: Correction of the calibration of the 3-wavelength Particle Soot Absorption Photometer (3λ PSAP), Aerosol Sci. Tech., 44, 706–712, 2010.
Virkkula, A., Ahlquist, N. C., Covert, D. S., Arnott, W. P., Sheridan, P. J., Quinn, P. K., and Coffman, D. J.: Modification, calibration and a field test of an instrument for measuring light absorption by particles, Aerosol Sci. Tech., 39, 68–83, 2005.
Weingartner, E., Saathoff, H., Schnaiter, M., Streit, N., Bitnar, B., and Baltensperger, U.: Absorption of light by soot particles: determination of the absorption coefficient by means of aethalometers, J. Aerosol Sci., 34, 1445–1463, 2003.
White, W. H., Trzepla, K., Hyslop, N. P., and Schichtel, B. A.: A critical review of filter transmittance measurements for aerosol light absorption, and de novo calibration for a decade of monitoring on PTFE membranes, Aerosol Sci. Tech., 50, 984–1002, 2016.
Zhong, M. and Jang, M.: Light absorption coefficient measurement of SOA using a UV – Visible spectrometer connected with an integrating sphere, Atmos. Environ., 45, 4263–4271, 2011.