the Creative Commons Attribution 4.0 License.
the Creative Commons Attribution 4.0 License.
 | 01 Mar 2019
An intercomparison of total column-averaged nitrous oxide between ground-based FTIR TCCON and NDACC measurements at seven sites and comparisons with the GEOS-Chem model
Bavo Langerock
Kelley C. Wells
Dylan B. Millet
Corinne Vigouroux
Mahesh Kumar Sha
Christian Hermans
Jean-Marc Metzger
Rigel Kivi
Pauli Heikkinen
Dan Smale
David F. Pollard
Nicholas Jones
Nicholas M. Deutscher
Thomas Blumenstock
Matthias Schneider
Mathias Palm
Justus Notholt
James W. Hannigan
Martine De Mazière
Nitrous oxide (N2O) is an important greenhouse gas and it can also generate nitric oxide, which depletes ozone in the stratosphere. It is a common target species of ground-based Fourier transform infrared (FTIR) near-infrared (TCCON) and mid-infrared (NDACC) measurements. Both TCCON and NDACC networks provide a long-term global distribution of atmospheric N2O mole fraction. In this study, the dry-air column-averaged mole fractions of N2O () from the TCCON and NDACC measurements are compared against each other at seven sites around the world (Ny-Ålesund, Sodankylä, Bremen, Izaña, Réunion, Wollongong, Lauder) in the time period of 2007–2017. The mean differences in between TCCON and NDACC (NDACC–TCCON) at these sites are between −3.32 and 1.37 ppb (−1.1 %–0.5 %) with standard deviations between 1.69 and 5.01 ppb (0.5 %–1.6 %), which are within the uncertainties of the two datasets. The NDACC N2O retrieval has good sensitivity throughout the troposphere and stratosphere, while the TCCON retrieval underestimates a deviation from the a priori in the troposphere and overestimates it in the stratosphere. As a result, the TCCON measurement is strongly affected by its a priori profile.
Trends and seasonal cycles of are derived from the TCCON and NDACC measurements and the nearby surface flask sample measurements and compared with the results from GEOS-Chem model a priori and a posteriori simulations. The trends and seasonal cycles from FTIR measurement at Ny-Ålesund and Sodankylä are strongly affected by the polar winter and the polar vortex. The a posteriori N2O fluxes in the model are optimized based on surface N2O measurements with a 4D-Var inversion method. The trends from the GEOS-Chem a posteriori simulation (0.97±0.02 (1σ) ppb yr−1) are close to those from the NDACC (0.93±0.04 ppb yr−1) and the surface flask sample measurements (0.93±0.02 ppb yr−1). The trend from the TCCON measurements is slightly lower (0.81±0.04 ppb yr−1) due to the underestimation of the trend in TCCON a priori simulation. The trends from the GEOS-Chem a priori simulation are about 1.25 ppb yr−1, and our study confirms that the N2O fluxes from the a priori inventories are overestimated. The seasonal cycles of from the FTIR measurements and the model simulations are close to each other in the Northern Hemisphere with a maximum in August–October and a minimum in February–April. However, in the Southern Hemisphere, the modeled values show a minimum in February–April while the FTIR retrievals show different patterns. By comparing the partial column-averaged N2O from the model and NDACC for three vertical ranges (surface–8, 8–17, 17–50 km), we find that the discrepancy in the seasonal cycle between the model simulations and the FTIR measurements in the Southern Hemisphere is mainly due to their stratospheric differences.
Please read the corrigendum first before continuing.
-
Notice on corrigendum
The requested paper has a corresponding corrigendum published. Please read the corrigendum first before downloading the article.
-
Article
(3574 KB)
-
The requested paper has a corresponding corrigendum published. Please read the corrigendum first before downloading the article.
- Article
(3574 KB) - Corrigendum
- BibTeX
- EndNote


Nitrous oxide (N2O) is the third most important anthropogenic greenhouse gas in the Earth's atmosphere after carbon dioxide (CO2) and methane (CH4) (IPCC, 2013). In addition, N2O is a precursor of ozone-depleting nitric oxide radicals and it is an important anthropogenic cause of stratospheric ozone depletion (Ravishankara et al., 2009; Portmann et al., 2012). The globally averaged N2O mole fraction in the atmosphere was 328.9 ppb (parts per billion by volume) in 2016, representing a 22 % increase since 1750. The annual growth rate of N2O in the last decade is about 0.90 ppb yr−1 derived from direct National Oceanic and Atmospheric Administration – Global Monitoring Division (NOAA GMD) surface measurements (WMO, 2017). Atmospheric N2O is emitted from both natural (∼60 %) and anthropogenic sources (∼40 %), including oceans, soils, biomass burning, fertilizer use and various industrial processes (WMO, 2014). Among them, the increasing use of fertilizer is likely responsible for 80 % of the increase in N2O concentrations (Park et al., 2012). Global emissions of N2O are difficult to estimate due to their heterogeneity in space and time.
Ground-based Fourier transform infrared (FTIR) spectrometers allow regular measurements of vertical total or partial column gas abundances in the atmosphere using solar absorption spectra. There are two well-known international networks based on ground-based solar FTIR instruments: the Total Carbon Column Observing Network (TCCON) established in 2004 (Wunch et al., 2011) and the Network for the Detection of Atmospheric Composition Change – the InfraRed Working Group (NDACC-IRWG; named NDACC in this study) established in 1991 (De Mazière et al., 2018). Both TCCON and NDACC networks have more than 20 sites around the world. TCCON and NDACC measurements can be made using the same instruments, with different detectors and retrieval strategies. Some sites perform both TCCON and NDACC measurements simultaneously. N2O is a target species of both networks. TCCON derives N2O total columns from near-infrared (NIR) spectra recorded with an indium gallium arsenide (InGaAs) detector and NDACC derives N2O total columns and vertical profiles from mid-infrared (MIR) spectra recorded with an indium antimonide (InSb) detector. NDACC N2O total columns or vertical profiles have been used to study the long-term trend of N2O (Zander et al., 1994; Angelbratt et al., 2011) and to evaluate MIPAS, ACE-FTS, AIRS and IASI satellite measurements (Vigouroux et al., 2007; Strong et al., 2008; Xiong et al., 2014; García et al., 2016). TCCON dry-air total column-averaged abundance of N2O () measurements have been applied to assess the performance of a chemistry transport model (CTM) based on an atmospheric general circulation model (Saito et al., 2012).
Global CTMs are able to simulate the N2O concentration in the atmosphere. Prather et al. (2015) used four independent CTMs together with Microwave Limb Sounder (MLS) satellite measurements to estimate the lifetime of N2O in the atmosphere. Thompson et al. (2014) compared five CTM simulations with different atmospheric inversion frameworks. Large discrepancies existed for the regions of South and East Asia and for tropical and South America due to the lack of observations from these places. Wells et al. (2015) described a 4D-Var inversion framework for N2O based on the GEOS-Chem CTM and evaluated the utility of different observing networks for constraining N2O sources and sinks. Subsequently, Wells et al. (2018) applied the same model framework in a multi-inversion approach to place new top-down constraints on global N2O emissions.
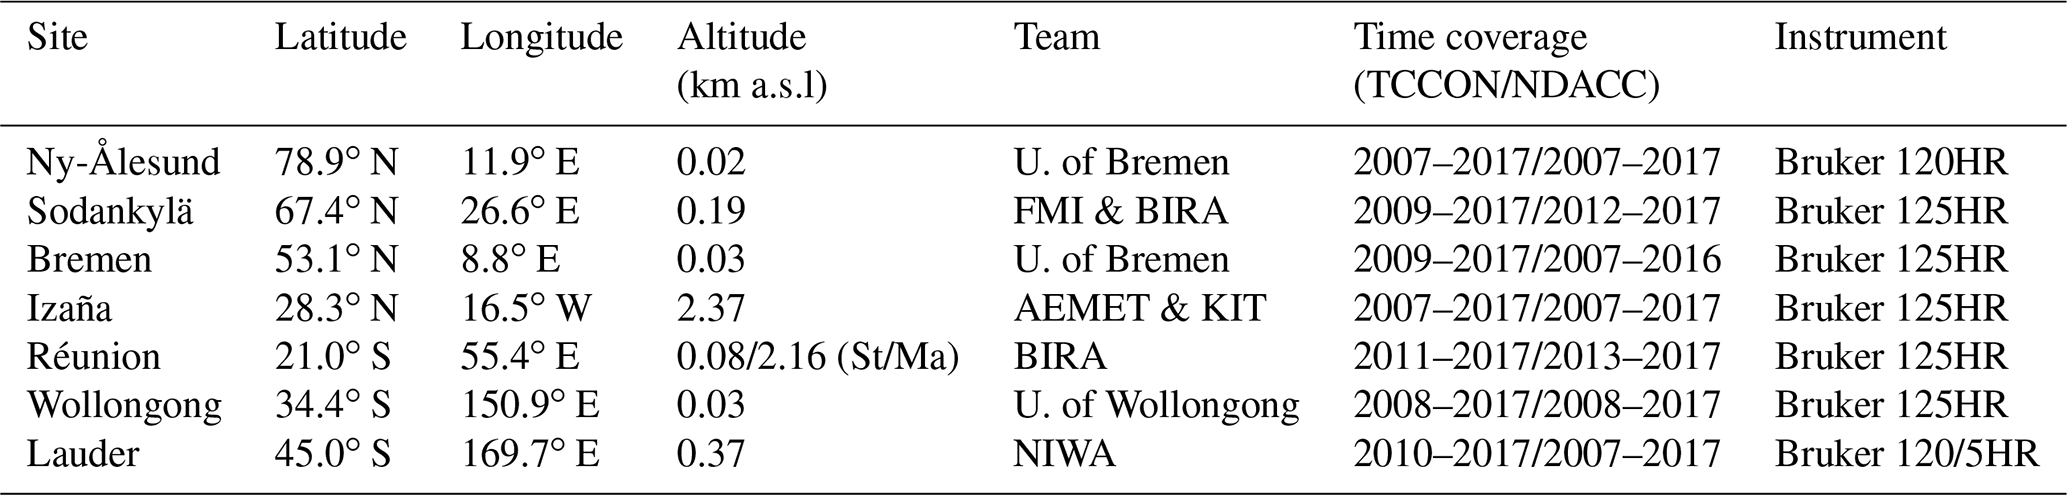
Table 1Characteristics of the FTIR sites contributing to the present work: location, altitude (km a.s.l.), research team and time coverage of data. Note that there are two observatories at Réunion, one is at Saint-Denis (“St”) performing TCCON measurements and the other one is at Maïdo (“Ma”) performing NDACC measurements.
To our knowledge, there have not yet been any studies investigating differences between the TCCON and NDACC N2O measurements. In this paper, an intercomparison between the TCCON and NDACC measurements at seven sites in the 2007–2017 period is carried out. The target of this study is to better understand the discrepancies between the TCCON and NDACC N2O measurements, and to know whether two networks can be combined with atmospheric chemistry models for evaluation, seasonal cycles and long-term trend analyses. Section 2 describes the TCCON and NDACC data used in this paper. The biases between TCCON and NDACC measurements are shown in Sect. 3. After that, discrepancies between the two datasets at a high-latitude site are investigated in terms of their respective a priori profiles and vertical sensitivities. Then trends and seasonal cycles derived from TCCON and NDACC and the nearby surface flask sample measurements are compared to the GEOS-Chem simulations in Sect. 5. Finally, conclusions are drawn in Sect. 6.
The ground-based FTIR sites used in this study are shown in Fig. 1. Both TCCON and NDACC N2O measurements are available at these sites. The coordinates of the sites together with the time coverages of the data are listed in Table 1. They cover a large latitudinal range from 45.0∘ S to 78.9∘ N. Note that there are two observatories at Réunion, one is at Saint-Denis recording NIR spectra and the other one is at Maïdo recording MIR spectra (Zhou et al., 2016). At Lauder, two spectrometers, Bruker 120HR (2004–2011) and 125HR (2010–present), have been applied to record TCCON spectra, and the same Bruker 120HR instrument is applied to record NDACC spectra. Details on the measurements can be found in Pollard et al. (2017). In this study, only the TCCON measurements from the Bruker 125HR at Lauder are used. At the other five sites, a single spectrometer measures for both networks.
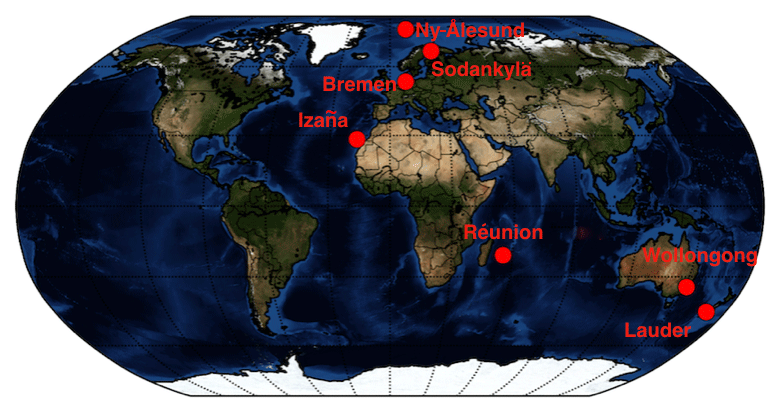
Figure 1The location of the FTIR sites providing both TCCON and NDACC N2O measurements used in this study.
The GGG2014 algorithm is applied to retrieve from TCCON spectra, and it performs a profile scaling retrieval. is obtained from the ratio between the total column of N2O () and O2 () (Yang et al., 2002)
where 0.2095 is the constant volume mixing ratio (VMR) of O2 in dry air, θ is the solar zenith angle (SZA), α and β are scaling factors, a source brightness fluctuation (SBF) correction is applied to the SZA with the formula SBF, and β⋅SBF(θ) is the empirically derived air-mass-dependent correction factor (Wunch et al., 2011, 2015). TCCON measurements have been calibrated and validated with several HIPPO aircraft measurements over Wollongong (Australia), Lauder (New Zealand), and Four Corners (USA) and a START-08 measurement over Park Falls (USA). One calibration factor (α) of 0.96 (±0.01) is applied to correct the systematic error in TCCON data. Therefore, only a random uncertainty of about 1.0 % is reported for TCCON data (Wunch et al., 2015). The a priori profile of TCCON (TCCONap) is generated on a daily basis by a stand-alone code (Toon and Wunch, 2014). The a priori VMR profiles of TCCON are based on MkIV balloon and ACE-FTS profiles measured in the 30–40∘ N latitude range from 2003 to 2007, which take into account the tropopause height variation and the secular trend.
NDACC uses either the SFIT4 algorithm (an updated version of SFIT2; Pougatchev et al., 1995) or the PROFFIT9 algorithm (Hase et al., 2004) to retrieve N2O vertical profiles. Good agreement between these two retrieval algorithms has been demonstrated (Hase et al., 2004). Since the O2 total column is not available from the MIR spectrum and the weak N2 signal in the MIR region leads to a large scatter, the NDACC is calculated from the dry-air column:
where is total column of H2O, Ps is the surface pressure, g is the column-averaged gravitational acceleration, and and are molecular masses of H2O and dry air, respectively (Deutscher et al., 2010; Zhou et al., 2018). The total column of N2O is calculated by integrating the partial column of each layer. For each site, the mean of the monthly means during 1980–2020 from the Whole Atmosphere Community Climate Model (WACCM) version 4 is applied to be the a priori profile for the NDACC retrievals (constant in time). There is no post-correction for NDACC retrievals. Therefore, the systematic uncertainty (about 2.0 %) of NDACC N2O is reported together with the random uncertainty (about 1.5 %), and the systematic uncertainty of NDACC N2O total column is mainly due to uncertainties in the spectroscopic parameters (García et al., 2018).
Table 2The main differences between the TCCON and NDACC measurements.
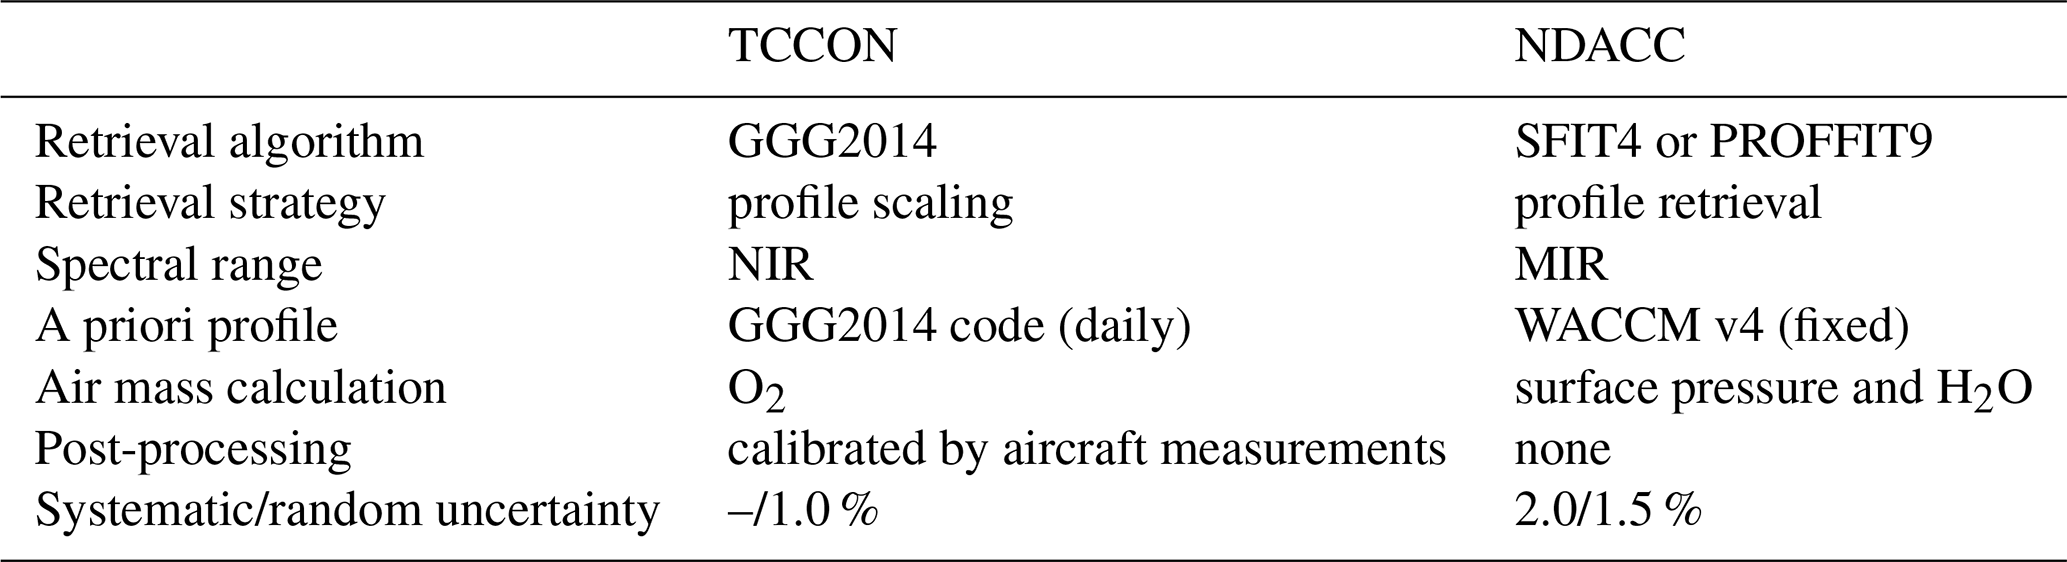
The main differences between the TCCON and NDACC retrieval strategies are listed in Table 2.
Both instrumental and retrieval settings for TCCON measurement are very consistent throughout the network (Wunch et al., 2011). The GGG2014 algorithm uses three retrieval windows (4373.5–4416.9 and 4418.55–4441.65; 4682.95–4756.05 cm−1) and the atm.101 spectroscopy (Toon, 2014) to retrieve the total column of N2O (Notholt et al., 2014a, b; Kivi et al., 2014; Blumenstock et al., 2014; De Mazière et al., 2014; Griffith et al., 2014; Sherlock et al., 2014). NDACC retrieval strategies can vary from site to site, depending on site-specific conditions, e.g., humidity, instrument and retrieval software. Table 3 lists the NDACC retrieval settings for each site. Two microwindows (MWs) (2441.8–2444.6, 2481.1–2482.5 cm−1) are employed at Ny-Ålesund and Bremen, while the other sites use four microwindows (2481.3–2482.6, 2526.4–2528.2, 2537.85–2538.8 and 2540.1–2540.7 cm−1). The Wollongong site uses the atm.101 spectroscopy, while the other sites use the HITRAN 2008 (Rothman et al., 2009). In fact, N2O line parameters are the same in these two spectroscopic databases. The optimal estimation method (OEM) (Rodgers, 2000) is applied to construct the regularization matrix of the a priori information at Ny-Ålesund, Bremen, Wollongong and Lauder, while the Tikhonov method (Tik) (Tikhonov, 1963) is applied at Sodankylä, Izaña and Réunion. The OEM a priori covariance (Sa) is based on WACCM monthly means. The inverse of the Tik a priori covariance , where L1 is the one-norm Tik regularization and the matrix T considers the thickness of each layer. The regularization strength α is the key parameter to control the strength of . The degrees of freedom for signal (DOFS) at these sites are in the range of 2.4–4.5. The range in DOFS is quite large; while it is known in the NDACC community that the DOFS of N2O retrieval is usually between 2.5 and 3.5 (Angelbratt et al., 2011; García et al., 2018). The wide range of DOFS in this study does not affect the total column, but we limit the NDACC vertical profiles to three partial columns. To better understand the influence of the spectroscopy, regularization, retrieval window and a priori profile, we test the NDACC retrieval by changing one of these parameters, and the mean and standard deviation (SD) of 1-year NDACC retrieved in 2014 at Réunion are listed in Table 4. There is no difference after changing the spectroscopy from HITRAN 2008 to atm.101. When changing the regularization method from OEM to Tik, we keep the DOFS of the N4O retrieval at about 3.0. Table 4 shows that changing the regularization method from OEM to Tik introduces a difference of 0.28 ppb or 0.09 %, which is negligible compared to the reported uncertainty. The maximum difference (0.78 ppb or 0.25 %) occurs after changing the retrieval windows from four to two microwindows. The systematic and random uncertainties of the NDACC N2O retrievals are about 2.0 % and 1.5 %, respectively. Since the difference in Table 4 is within the retrieval uncertainties of TCCON and NDACC, and there is no seasonal variation in the difference, consequently, it is assumed that the influences caused by these retrieval settings can be ignored.
Table 3NDACC retrieval settings at seven FTIR sites. For sites using two microwindows, retrieval windows are 2441.8–2444.6 and 2481.1–2482.5 cm−1. For sites using four microwindows, retrieval windows are 2481.3–2482.6, 2526.4–2528.2, 2537.85–2538.8 and 2540.1–2540.7 cm−1.
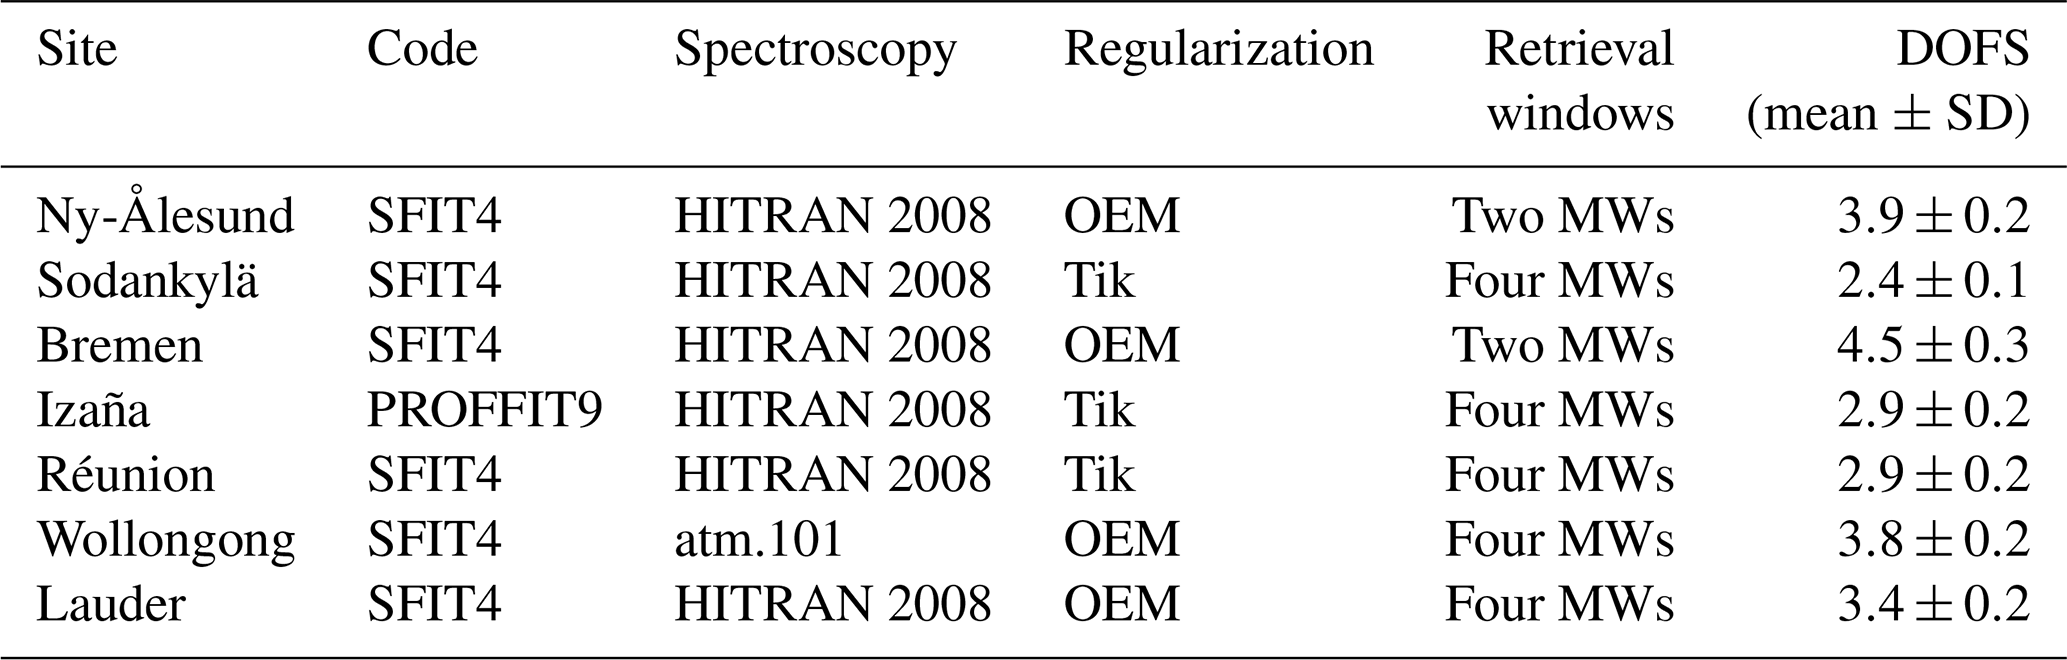
Table 4NDACC-retrieved in 2014 with different settings (spectroscopy + regularization + retrieval windows + a priori profile) at Réunion.
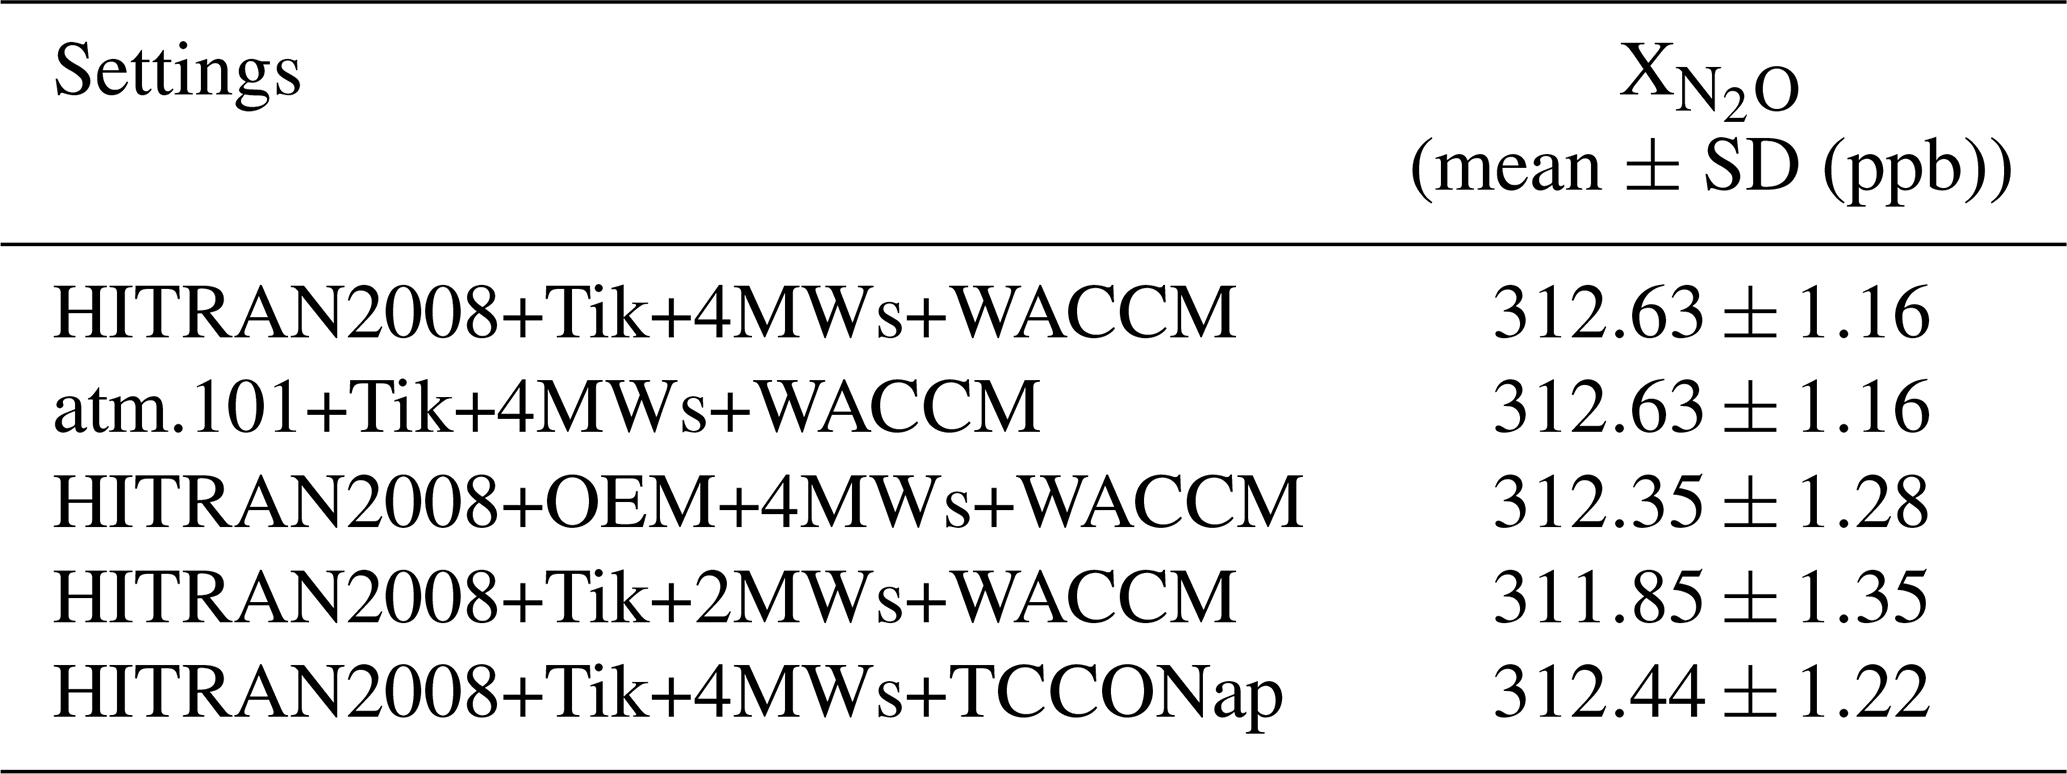
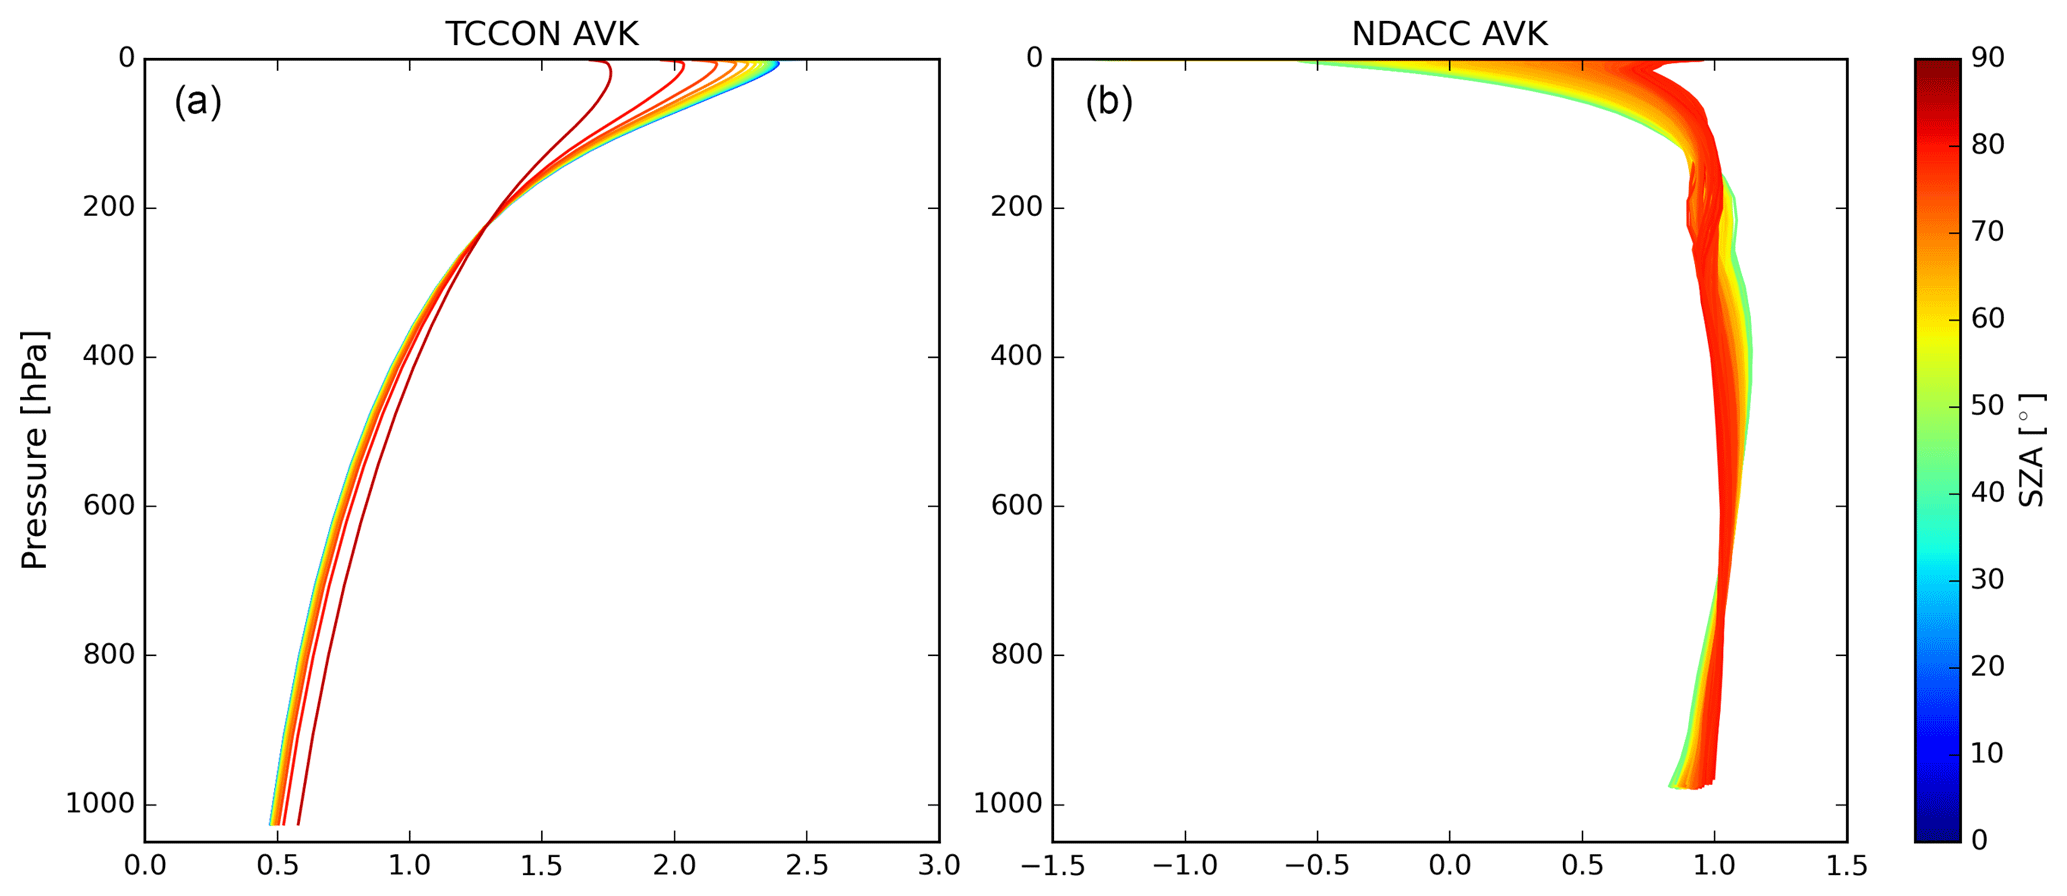
Figure 2The typical N2O column averaging kernel of TCCON (a) and NDACC (b) at Réunion. The different colors correspond to different SZAs.
The retrieved FTIR (TCCON and NDACC) N2O total column relates to the true state of the atmosphere and the a priori information via (Rodgers, 2003)
where TCr and TCa are the retrieved and a priori N2O total columns, respectively; PCa and PCt are the a priori and the true N2O partial column profiles, respectively; A is the column averaging kernels (AVKs) of the TCCON and NDACC retrievals, representing the vertical sensitivity of the retrieved N2O to the true state; and ε is the error. Figure 2 shows the TCCON and NDACC averaging kernels. Whereas NDACC exhibits uniform sensitivity throughout the troposphere and stratosphere, the TCCON sensitivity increases with altitude. As a result, TCCON retrievals will tend to underestimate a deviation from the a priori profile in the lower troposphere and overestimate it in the stratosphere. We also test the NDACC retrievals by using the TCCON a priori profile as the a priori profile at Réunion (see the last row in Table 4). The difference between the results using the WACCM model and the TCCON code as the a priori profile is negligible (0.19 ppb or 0.06 %) because the AVK of NDACC is very close to 1.0. It is thus assumed that the NDACC retrieved N2O total column is independent of the a priori profile. According to Rodgers (2003), the difference between retrieved N2O total column from TCCON and NDACC can be written as
Therefore, apart from the different sensitivity of the forward model to the underlying true state in different retrieval windows, e.g., on account of spectroscopic differences, the difference between retrieved N2O total column from TCCON and NDACC is mainly due to their AVK differences, and the difference in the N2O partial column profile between the TCCON a priori profile and the true state.
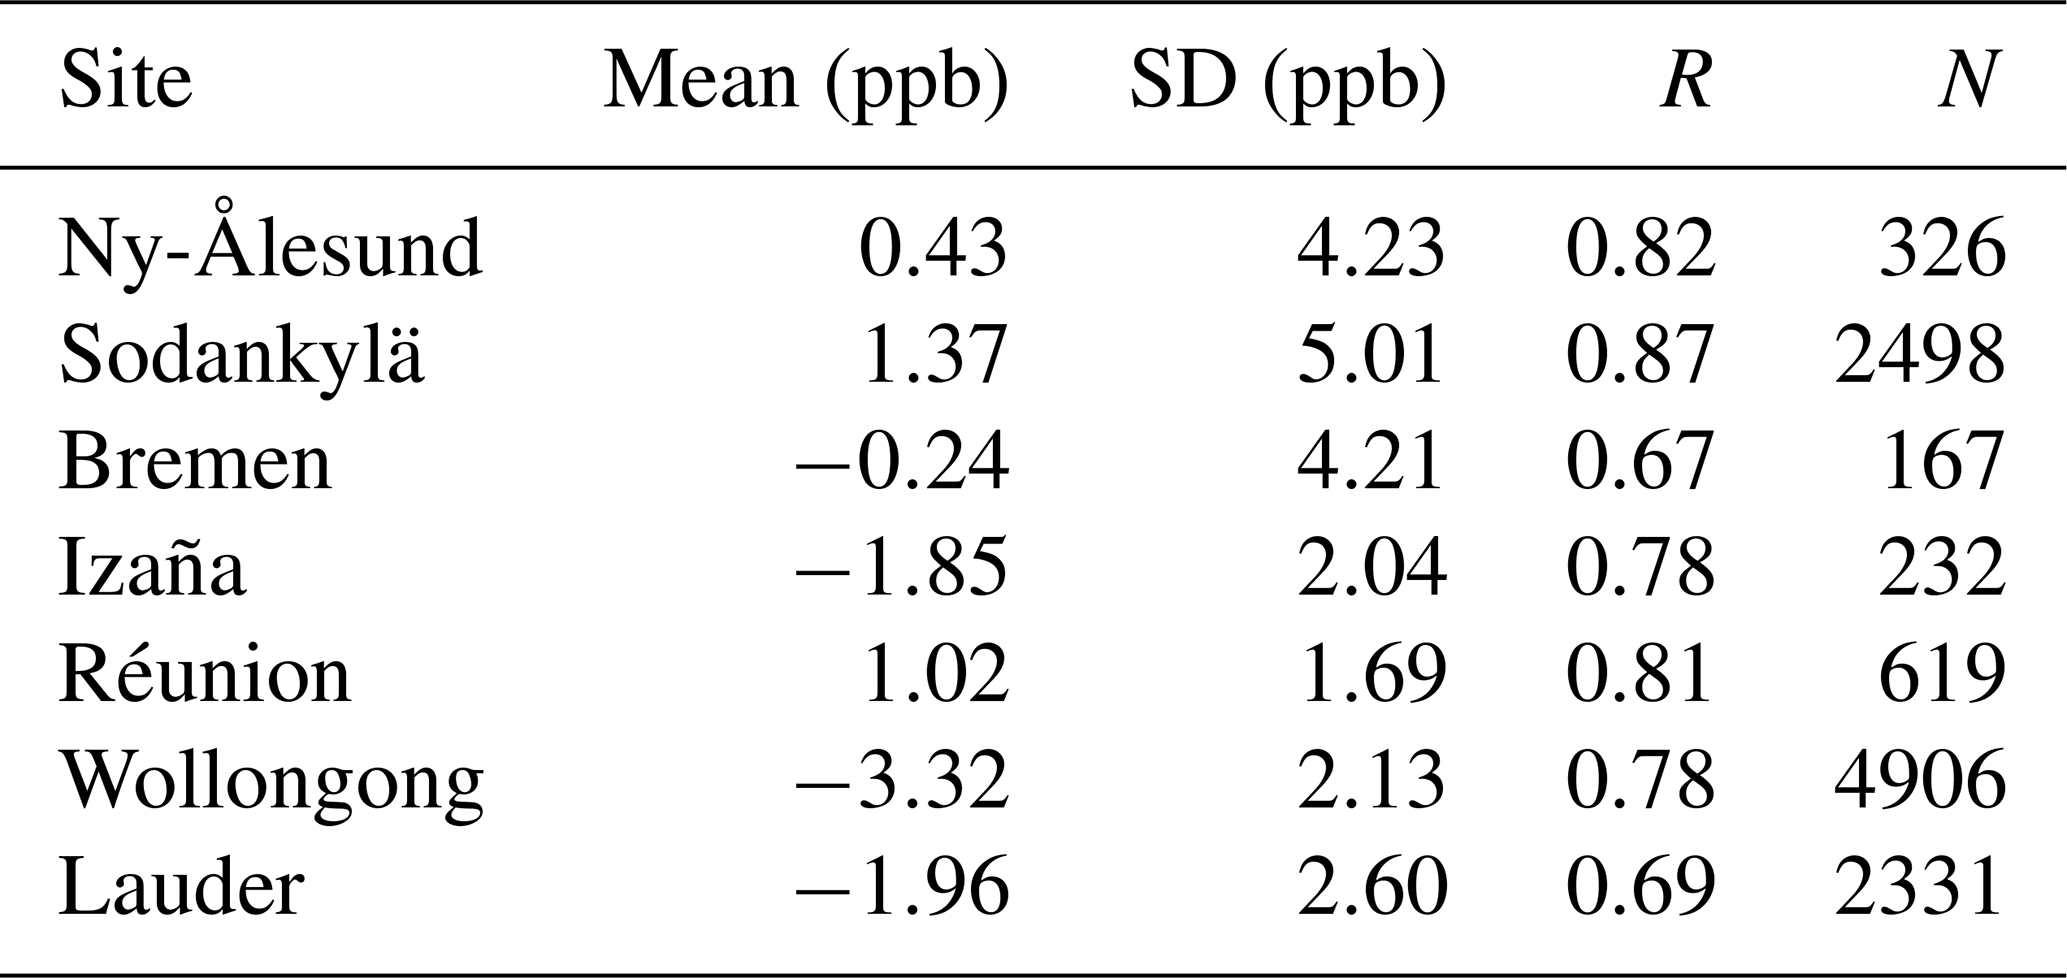
The time series of TCCON and NDACC measurements together with their differences are shown in Fig. 3. The statistical results of the co-located hourly means of TCCON and NDACC measurements are listed in Table 5. Note that the NDACC at Réunion is multiplied with a factor of 1.006 to correct the surface altitude difference between Saint-Denis (85 m a.s.l.) and Maïdo (2155 m a.s.l.). The factor of 1.006 is calculated from the ratio of the 0.085–100 km N2O partial column to the 2.155–100 km partial column based on the WACCM v4 model.
The averaged biases between the NDACC and TCCON measurements (NDACC–TCCON) at these sites range from −3.32 to 1.37 ppb (−1.1 %–0.5 %) with standard deviations of 1.69–5.01 ppb (0.5 %–1.6 %). Since the random uncertainty of the TCCON measurement is about 1.0 % and the systematic and random uncertainties of the NDACC N2O retrievals are about 2.0 % and 1.5 %, the difference between the TCCON and NDACC measurements is within their combined uncertainty. However, there is a large difference between TCCON and NDACC data in February–May at Ny-Ålesund and Sodankylä, which will be explained in the next section. In addition, the trend derived from NDACC measurements is slightly larger than that derived from TCCON measurements. This will be discussed in Sect. 5.
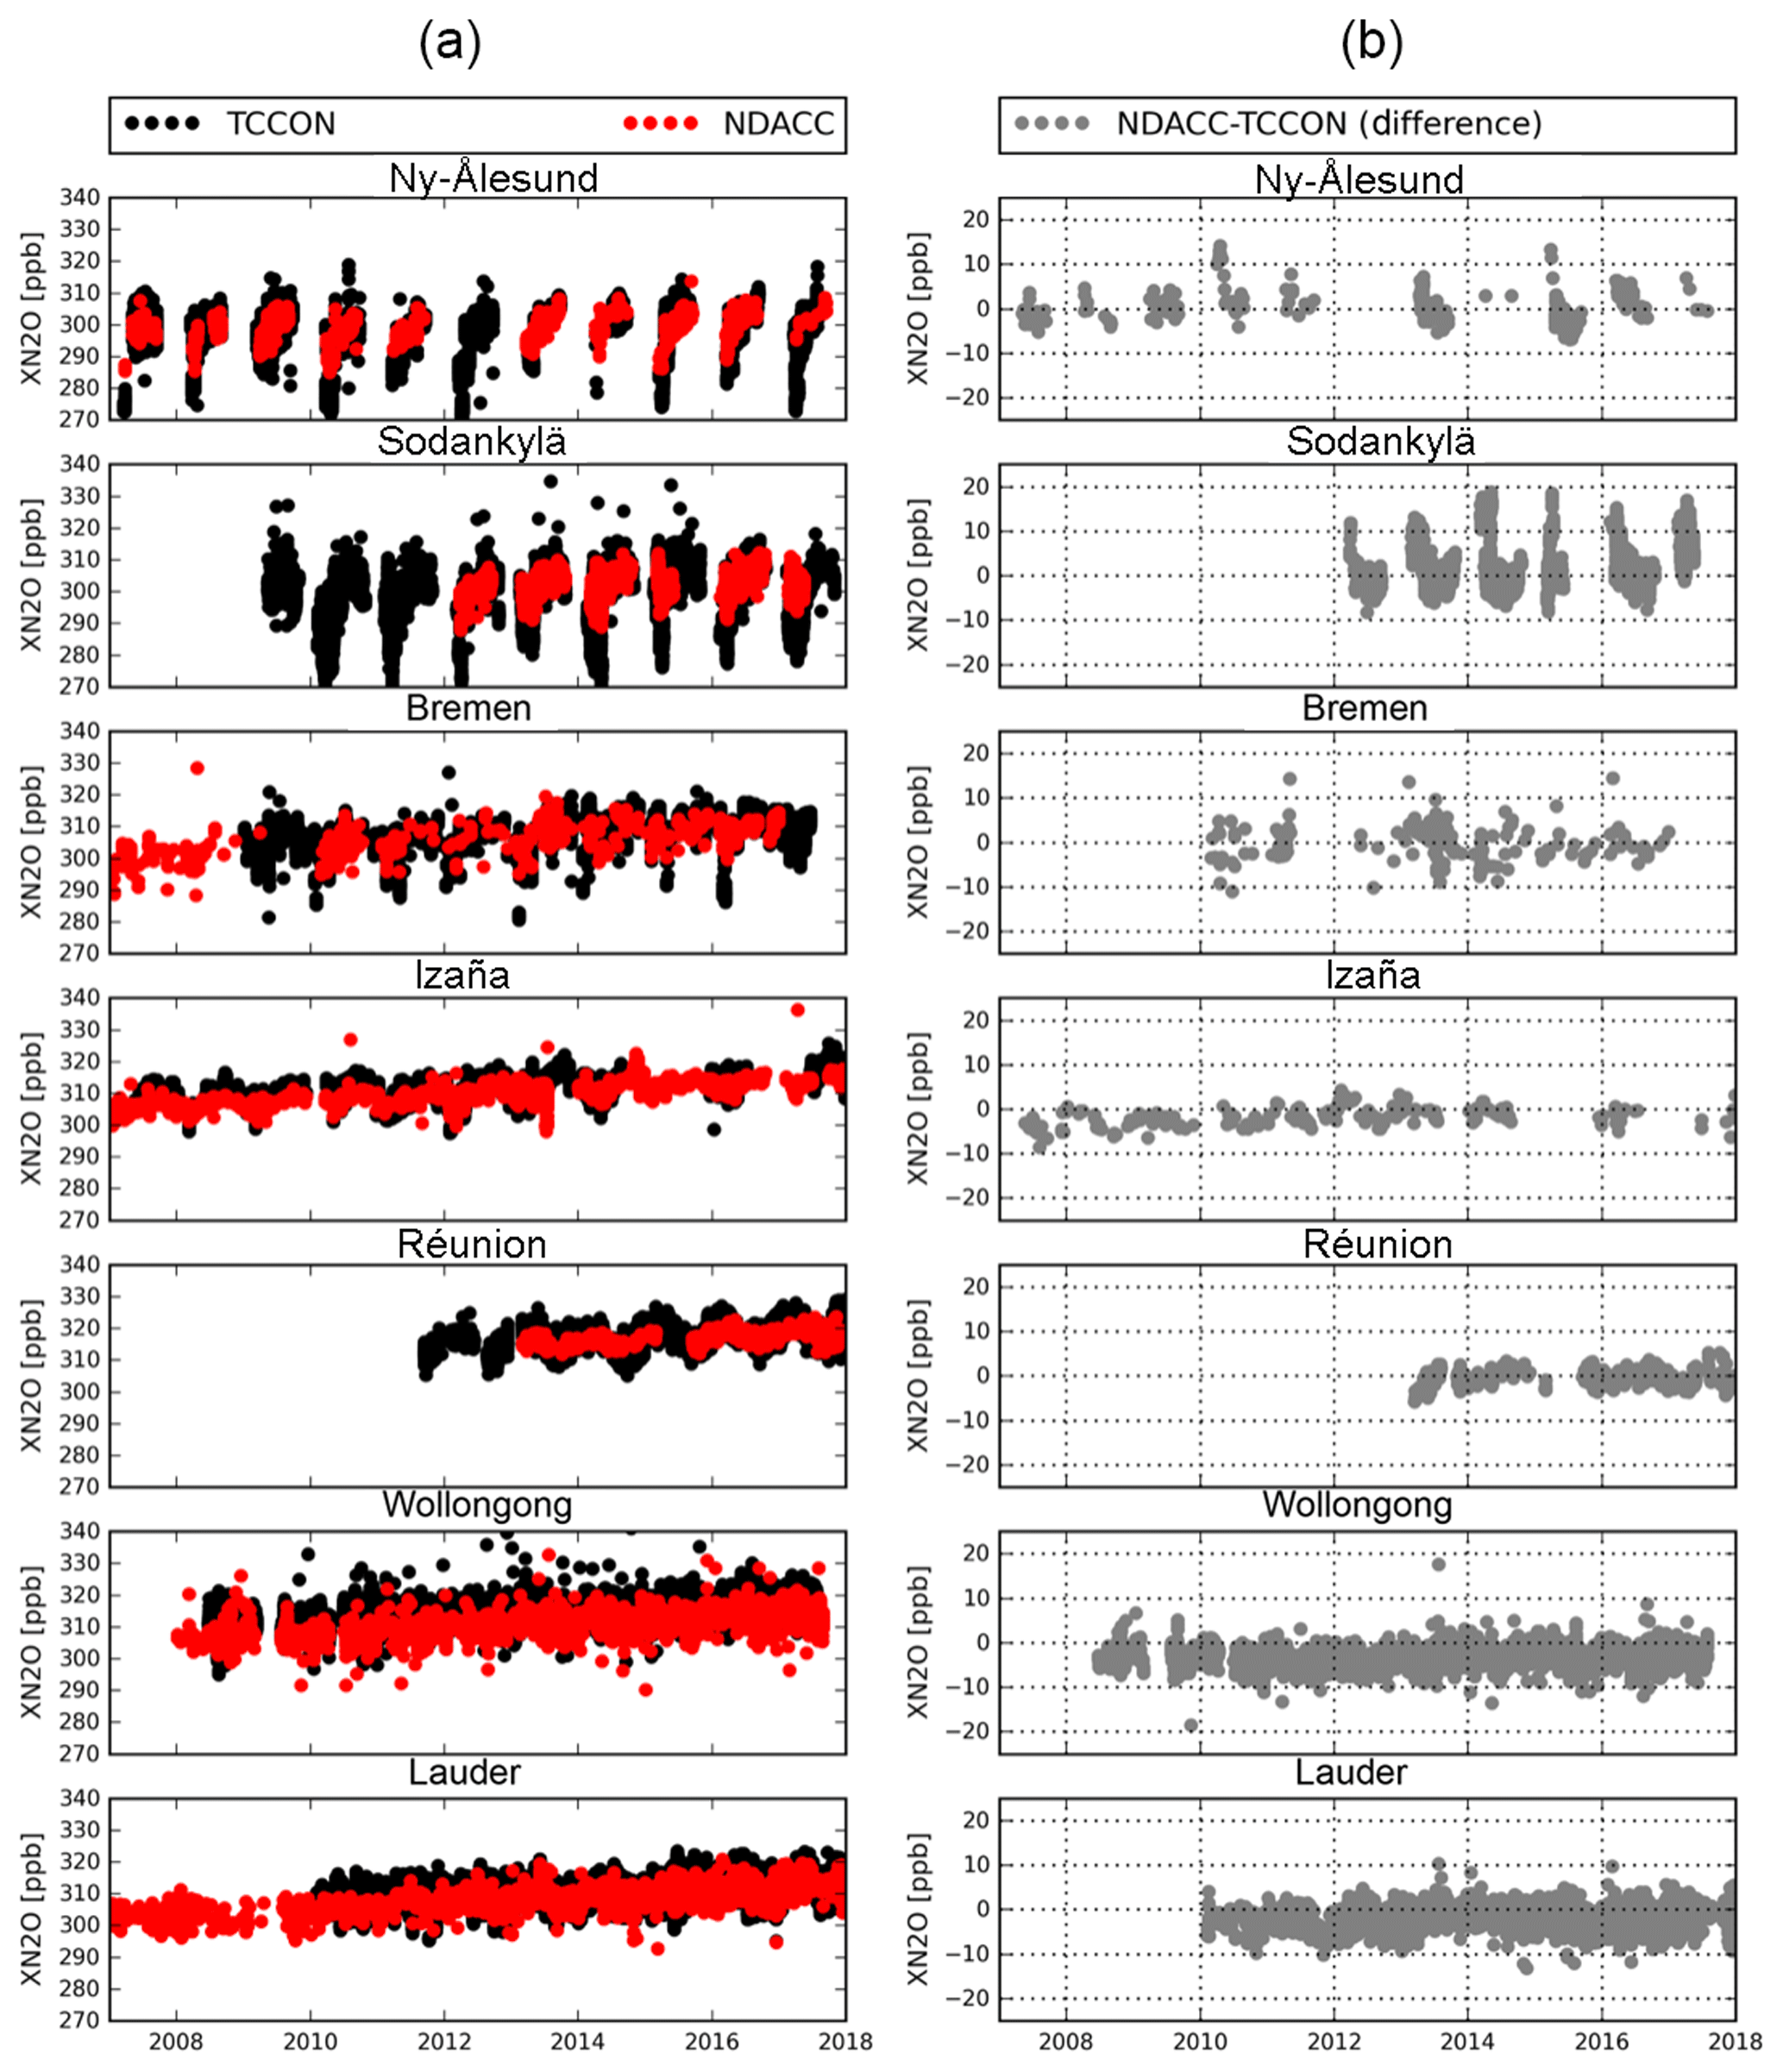
Figure 3Time series of TCCON- and NDACC-retrieved (a) together with the differences (NDACC minus TCCON) between their co-located hourly means (b) at seven sites.
Table 5The mean and the standard deviation (SD) of the difference between co-located hourly means of TCCON and NDACC data, together with the correlation coefficient (R) and total number (N) of the co-located data pairs.
The time series of TCCON and NDACC co-located hourly means together with their difference and correlation at Sodankylä are shown in Fig. 4. There is no FTIR measurement during the northern winter season due to the polar night. The TCCON measurements are very close to the NDACC data in northern summer and autumn but are lower than the NDACC data during spring. The air above Sodankylä is frequently affected by the Arctic polar vortex in winter and spring (Kivi et al., 2001, 2007; Karppinen et al., 2016; Denton et al., 2018). The high potential vorticity (PV) value at a constant potential temperature of 430 K is a useful index to identify the polar vortex (Schoeberl and Hartmann, 1991). The PV data in this study are downloaded from the ECMWF ERA-Interim reanalysis dataset (Dee et al., 2011). We find that the low values in the TCCON measurements in Fig. 4 correspond to periods of high PV, indicating that Sodankylä is inside the polar vortex. During that time, stratospheric composition is controlled by a large mass of cold and dense Arctic air. N2O decreases rapidly above the tropopause due to chemical conversion to NO globally. However, in the arctic winter the air descends due to the denser cold air in the polar night and the isolation from midlatitude refreshing. As the N2O VMR decreases with altitude during subsidence, the VMR at each altitude is less and the total column decreases. A similar issue has been found by Ostler et al. (2014) for the TCCON measurements at Ny-Ålesund influenced by the polar vortex subsidence.
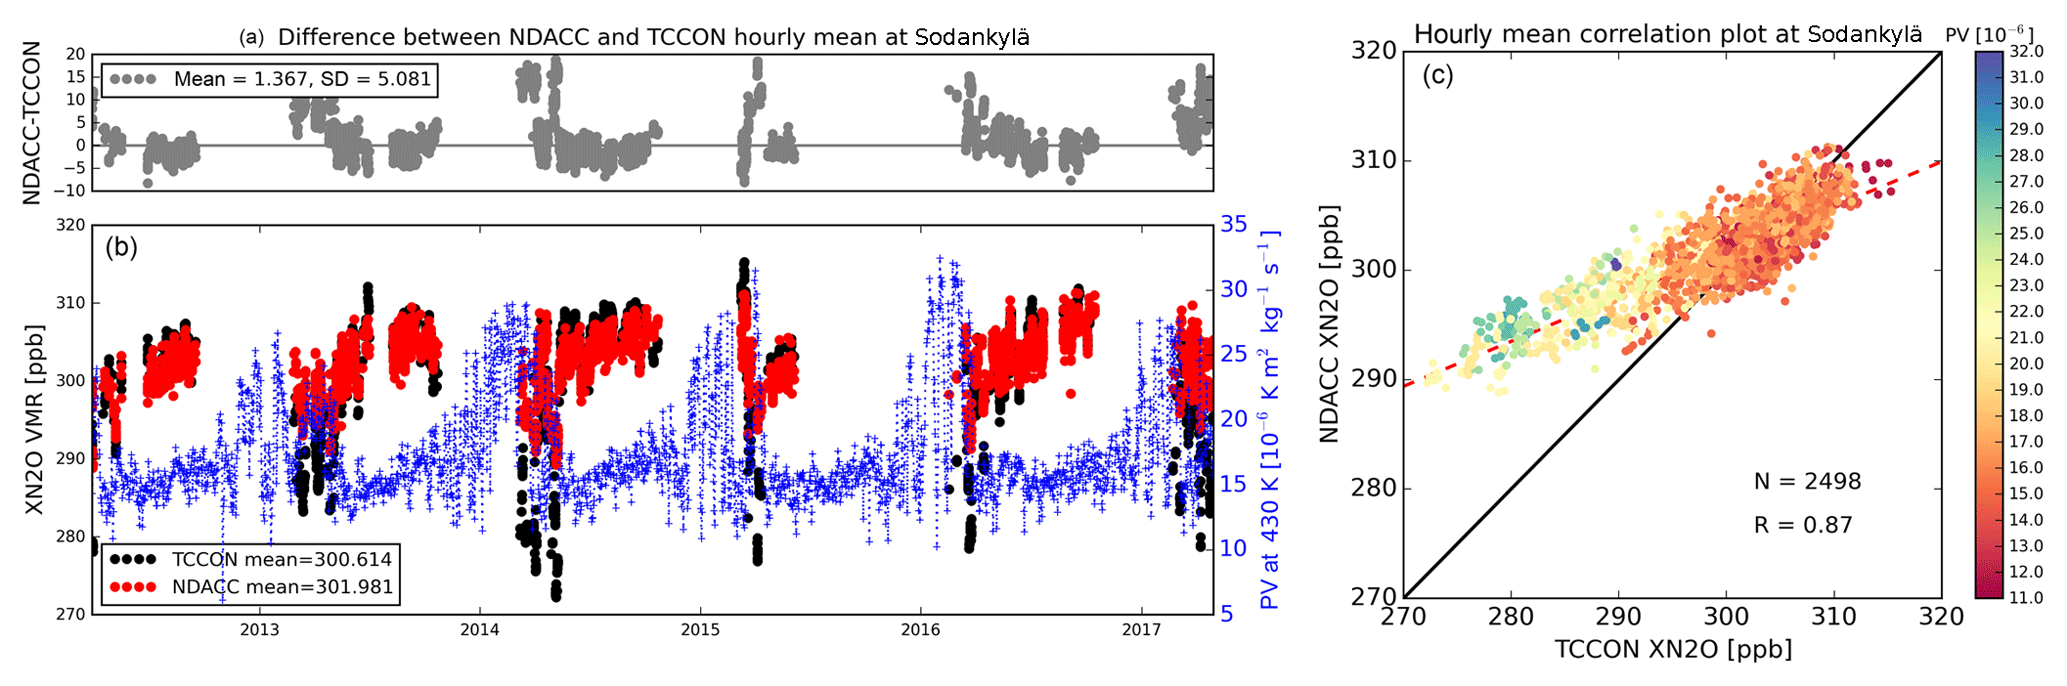
Figure 4(a, b) The time series of the hourly means from the TCCON and NDACC measurements at Sodankylä, together with the absolute difference (ppb) between them (a and b, respectively). Along with the measurements, the blue line in (b) is the potential vorticity (PV) value at a constant potential temperature of 430 K above Sodankylä. (c) The scatter plot between the TCCON and NDACC hourly means colored according to the potential vorticity (PV) value.
N2O measurements from the ACE-FTS satellite are applied to assess the change of the N2O vertical profile when Sodankylä is inside the polar vortex. ACE-FTS uses the solar occultation technique to measure mole fractions of atmospheric trace gases, mainly in the stratosphere, with a vertical resolution between 1.5 and 6 km (Boone et al., 2013). The latest ACE-FTS level 2 v3p6 N2O data are used in this study. It is assumed that ACE-FTS measurements are representative of the N2O variability in the stratosphere. Sheese et al. (2017) showed that the differences between ACE-FTS v3p6 and MLS and MIPAS N2O measurements are within 20 % below 45 km. ACE-FTS pixels are selected within (latitude by longitude) of Sodankylä during 2012–2016. In total, there are 43 individual days when TCCON, NDACC and ACE-FTS measurements are all available. The day is identified as being within the polar vortex if it satisfies the following two criteria: (1) PV value at 430 K on that day is larger than Km2 kg−1 s−1; (2) the daily mean of derived from TCCON differs by more than 6.0 ppb from the corresponding daily mean of NDACC data. The second criterion is added to avoid the days when the polar vortex just starts or ends, while the TCCON and NDACC spectra are recorded on the same day but outside the polar vortex system. As a result, three (25 March 2015, 16 February 2016 and 24 March 2016) out of these 43 days are identified as inside the polar vortex. Figure 5 shows the NDACC a priori profile, TCCON a priori profile, NDACC retrievals, collocated ACE-FTS measurements and the ACE-FTS measurements smoothed with the NDACC a priori profile and AVK on inside-vortex (three) and outside-vortex (40) days. It is confirmed by the ACE-FTS measurements that the N2O VMR decreases more rapidly above the tropopause height when the polar vortex occurs. The smoothed ACE-FTS measurements are close to the NDACC retrieved N2O profiles for both inside and outside polar vortex cases because the NDACC retrieval has a good sensitivity and the NDACC retrieval is able to capture the change in the stratosphere. However, the TCCON retrieval overestimates the deviation from the a priori profile in the stratosphere (see Fig. 2). When Sodankylä is inside the polar vortex, the ACE-FTS measurement (used here as the reference dataset) is much lower than the TCCON a priori profile in the stratosphere. As a result, the TCCON retrieved N2O column overestimates the magnitude of the N2O decrease, explaining why these data are always lower than the NDACC measurements in spring during polar vortex overpasses.
Figure 6 compares the standard TCCON and NDACC retrievals with updated versions using the ACE-FTS measurement as the a priori profile (above 10 km) for days inside the polar vortex. As expected, changing the a priori profile does not lead to much change in the NDACC retrievals, whereas the TCCON retrievals using the ACE-FTS profile as the a priori profile increase significantly and are more similar to the NDACC retrievals. After updating the a priori profile, the mean difference in between TCCON and NDACC on these three days decreases from 11.5 to 1.2 ppb. Based on this experiment, the averaged N2O profile from the ACE-FTS measurements on these three days is applied to be the a priori profile for all the TCCON retrievals inside the polar vortex. The time series of the updated TCCON and original NDACC retrievals and their correlation plot are shown in Fig. 7. The discrepancy between TCCON and NDACC measurements in spring is almost eliminated. The mean and standard deviation of the difference between TCCON and NDACC decrease to −0.74 and 2.81 ppb. The R values between TCCON and NDACC measurements are very similar in Figs. 4b and 7b, but in Fig. 7b the slope of the regression line increases from 0.41 to 0.63 along with a smaller y-intercept value.
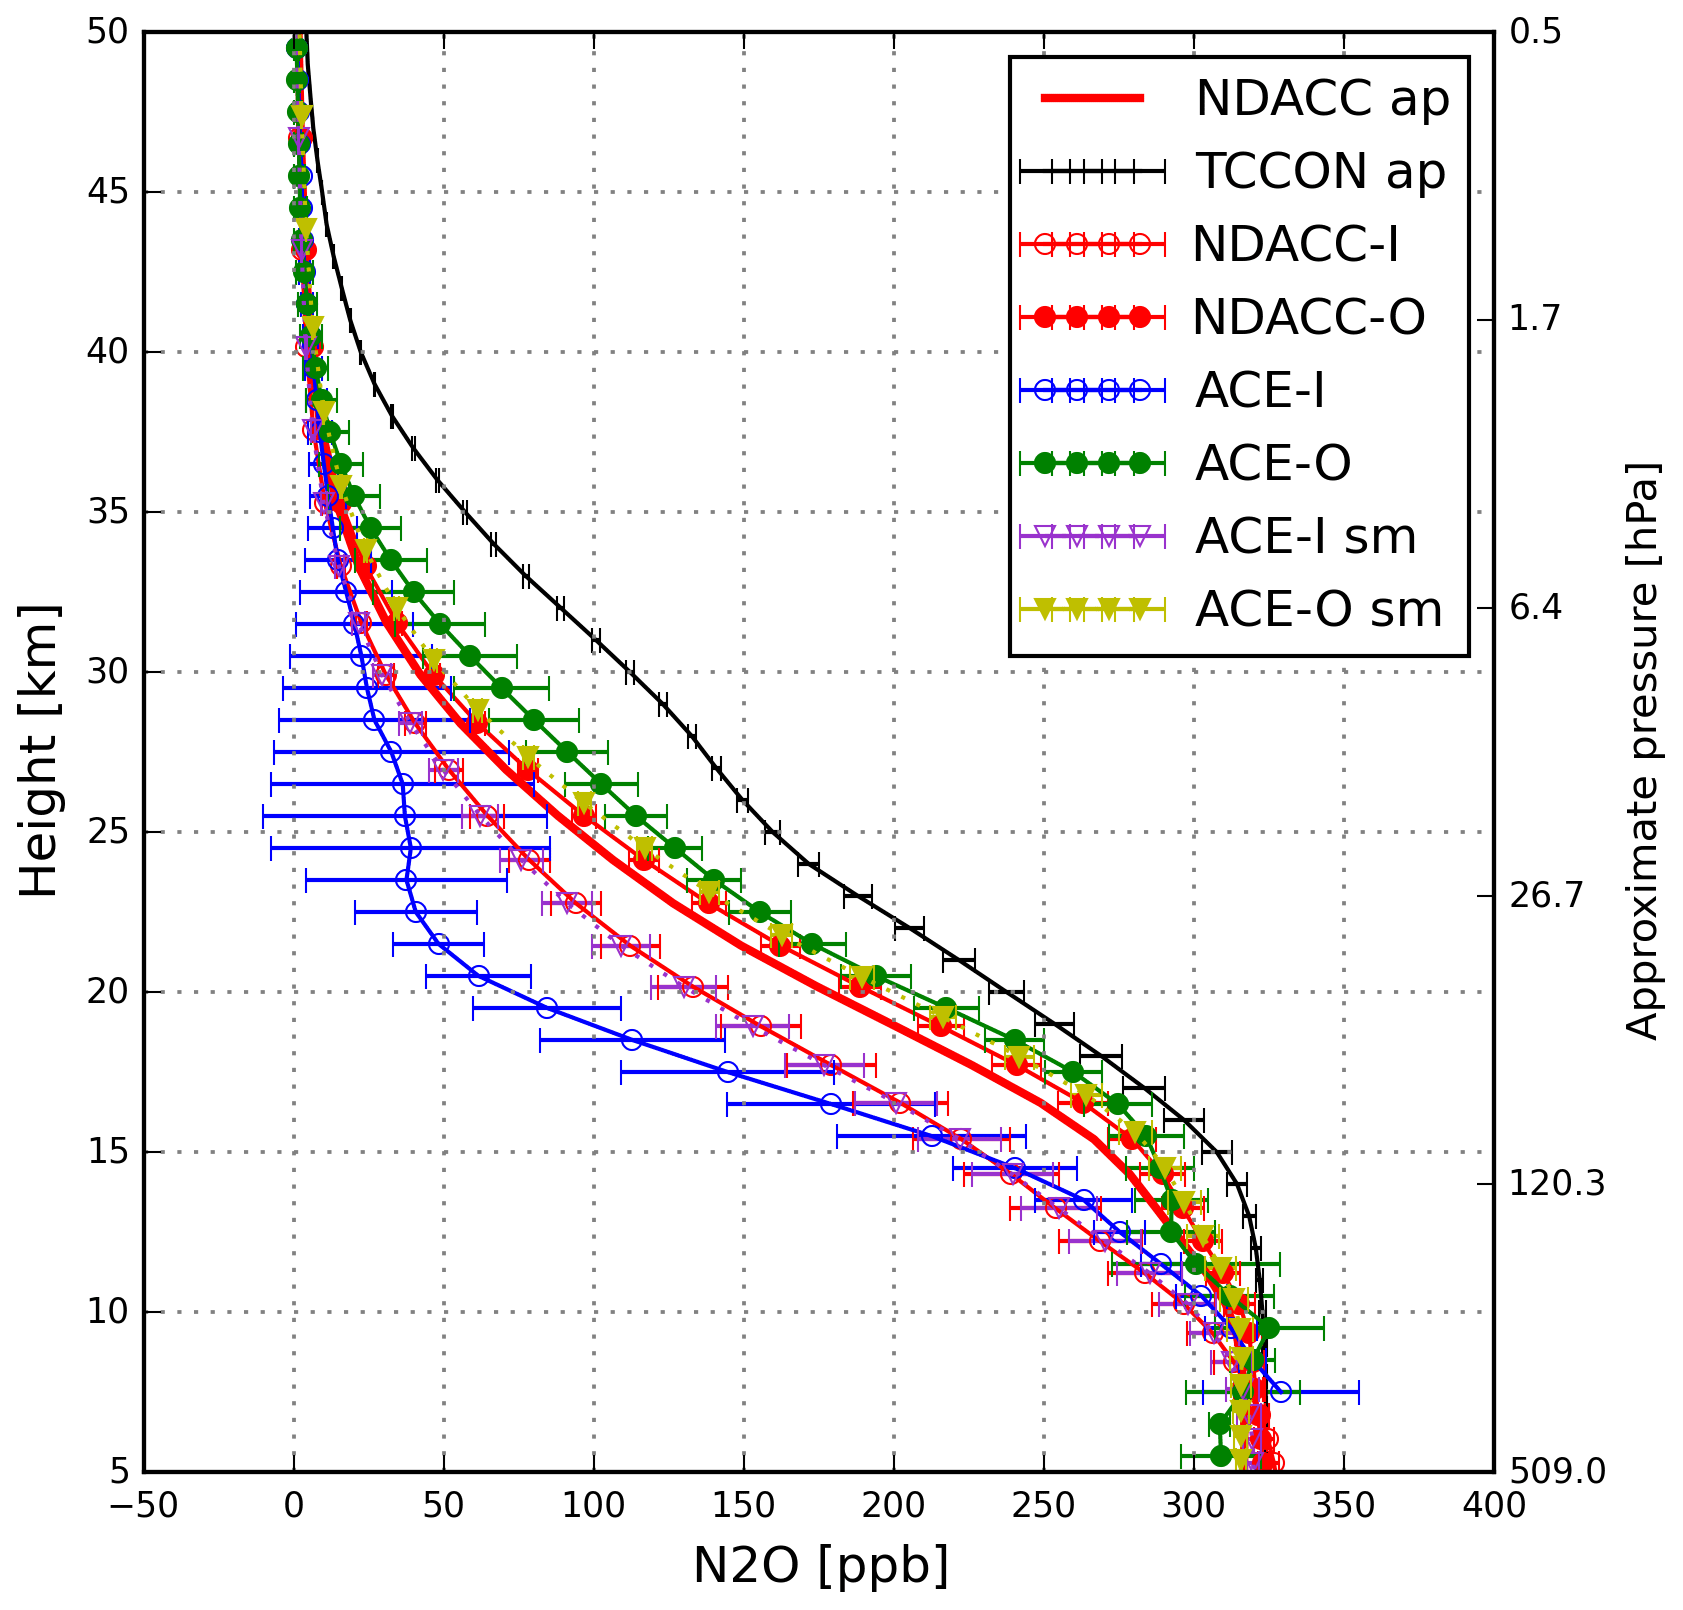
Figure 5N2O profiles from the NDACC a priori profile (NDACC ap), TCCON a priori profile (TCCON ap), NDACC retrievals inside and outside the polar vortex (NDACC-I/NDACC-O), co-located ACE-FTS measurements inside (three days) and outside (40 days) the polar vortex (ACE-I/ACE-O), and the ACE-FTS measurements smoothed with the NDACC AVK inside and outside the polar vortex (ACE-I sm/ACE-O sm). The error bar is the standard deviation of each profile.

Figure 6The standard TCCON- and NDACC-retrieved and updated retrieved using the ACE-FTS measurement as the a priori profile in the stratosphere on days when Sodankylä is inside the polar vortex (25 March 2015, 16 February 2016 and 24 March 2016).
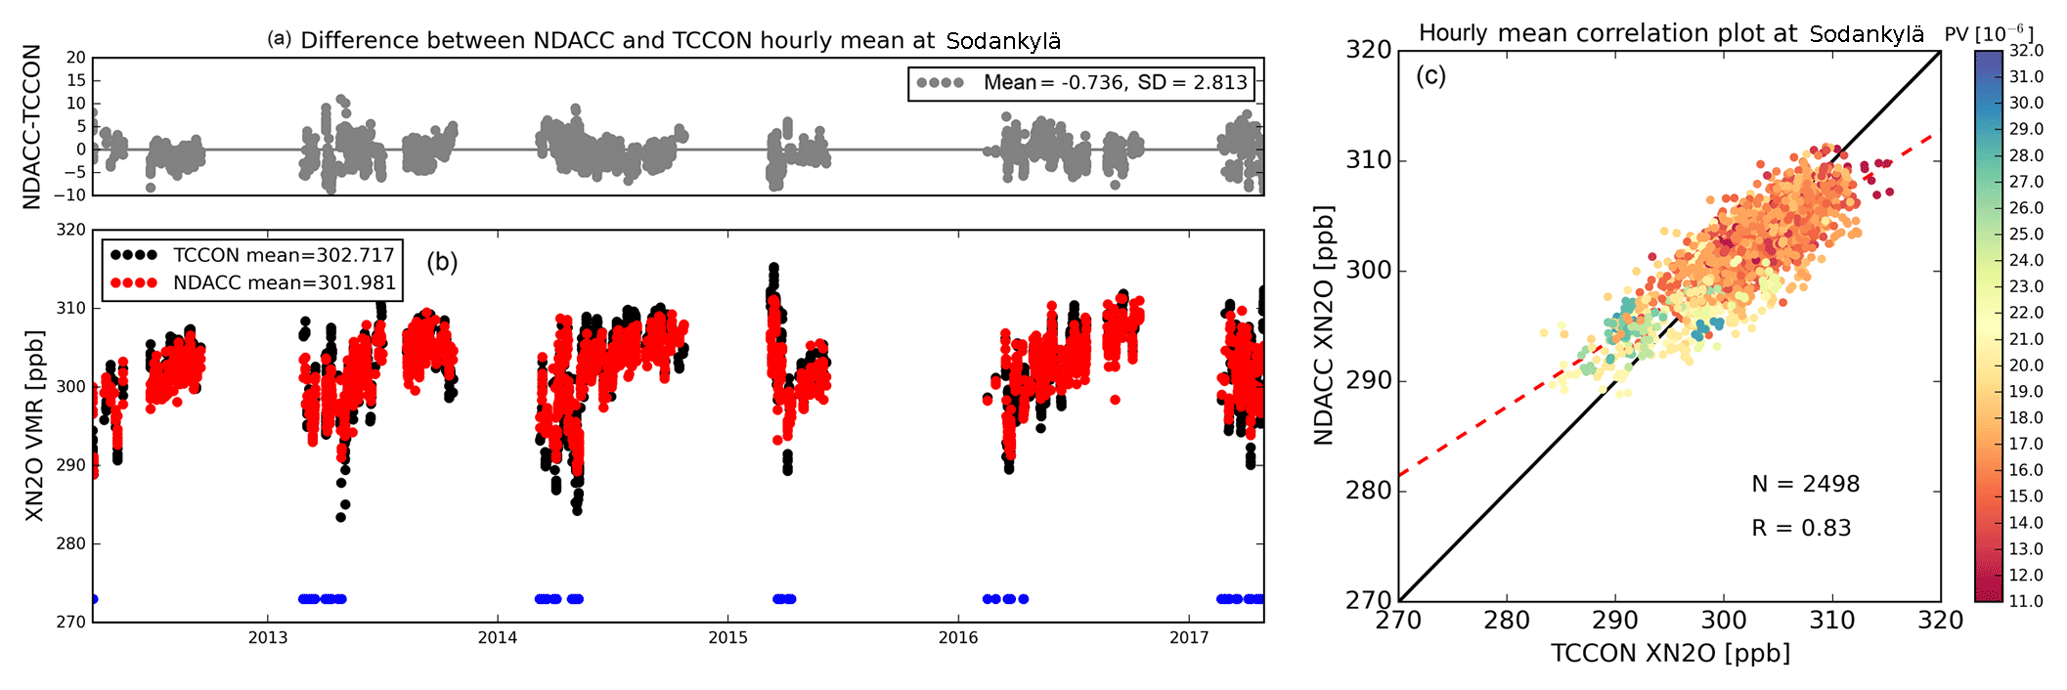
Figure 7Same as Fig. 4, but showing the TCCON retrievals on the days inside the polar vortex (blue dots) using the ACE-FTS measurement as the a priori profile.
5.1 GEOS-Chem model simulation
Here we compare the TCCON and NDACC measurements with simulated N2O fields from the GEOS-Chem CTM to better understand trends and seasonal cycles in atmospheric N2O. The GEOS-Chem simulations shown here, described in detail by Wells et al. (2015, 2018), are driven by MERRA-2 reanalysis data. The a priori simulation uses N2O emissions from the O-CN v1.1 land surface model (Zaehle et al., 2011) for soils, the marine biogeochemistry model PlankTOM5 (Buitenhuis et al., 2010) for ocean, the Emission Database for Global Atmospheric Research EDGAR v4.2 FT2010 (European Commission, 2013) for non-soil anthropogenic sources, and the Global Fire Emission Database GFED v4.1s (Van Der Werf et al., 2017) for biomass burning. These a priori inventories correspond to a global flux of 17.9–18.8 TgN yr−1 for 2007–2014. In the a posteriori simulation, N2O surface fluxes in the model have been optimized on the basis of surface measurements using a 4D-Var inversion framework as described by Wells et al. (2018). The a posteriori global flux ranges from 15.5 to 17.9 TgN yr−1. Stratospheric loss of N2O by photolysis and reaction with O(1D) is included in the model and leads to an atmospheric lifetime of approximately 127 years.
Global GEOS-Chem output shown here is monthly averages for 2007–2014, with horizontal resolution of 4∘ latitude longitude and 47 vertical levels from the surface to 0.01 hPa. Model grid points closest to the FTIR stations are employed for comparison with the TCCON and NDACC data. Following Eq. (2), the column-averaged N2O from the model a priori and a posteriori simulations is derived to compare with TCCON and NDACC measurements.
5.2 Computation method for trend and seasonal variation
As atmospheric N2O has been continuously increasing over the past decade (WMO, 2017), a linear regression model is used to calculate the N2O trend.
where Y(t) is measured or modeled N2O, A1 is the N2O trend, and A2−A7 are the amplitudes of the periodic variations during the year. Then, the detrended data (Y(t)d) are calculated as
The seasonal variation is represented by the monthly means of the detrended data and their associated uncertainty (2σ).
5.3 N2O trends
The calibrated N2O measurements from weekly surface air samples collected in glass flasks during 2007–2014 from the NOAA Earth System Research Laboratory GMD are used as a reference to compare with FTIR measurements and the model simulation. Uncertainties of the surface measurements are about 0.3 ppb (Dlugokencky et al., 2018). As most FTIR sites are not installed with a flask sampling system, we use the closest sampling site within 1000 km of each FTIR site to compare with TCCON and NDACC measurements and model output. Note that there is no flask sampling system available near Réunion. Table 6 lists the GMD sites used in this study and their corresponding TCCON and NDACC sites.
Table 6Locations of the flask sampling data around each FTIR site. There is no flask sampling site available near Réunion.
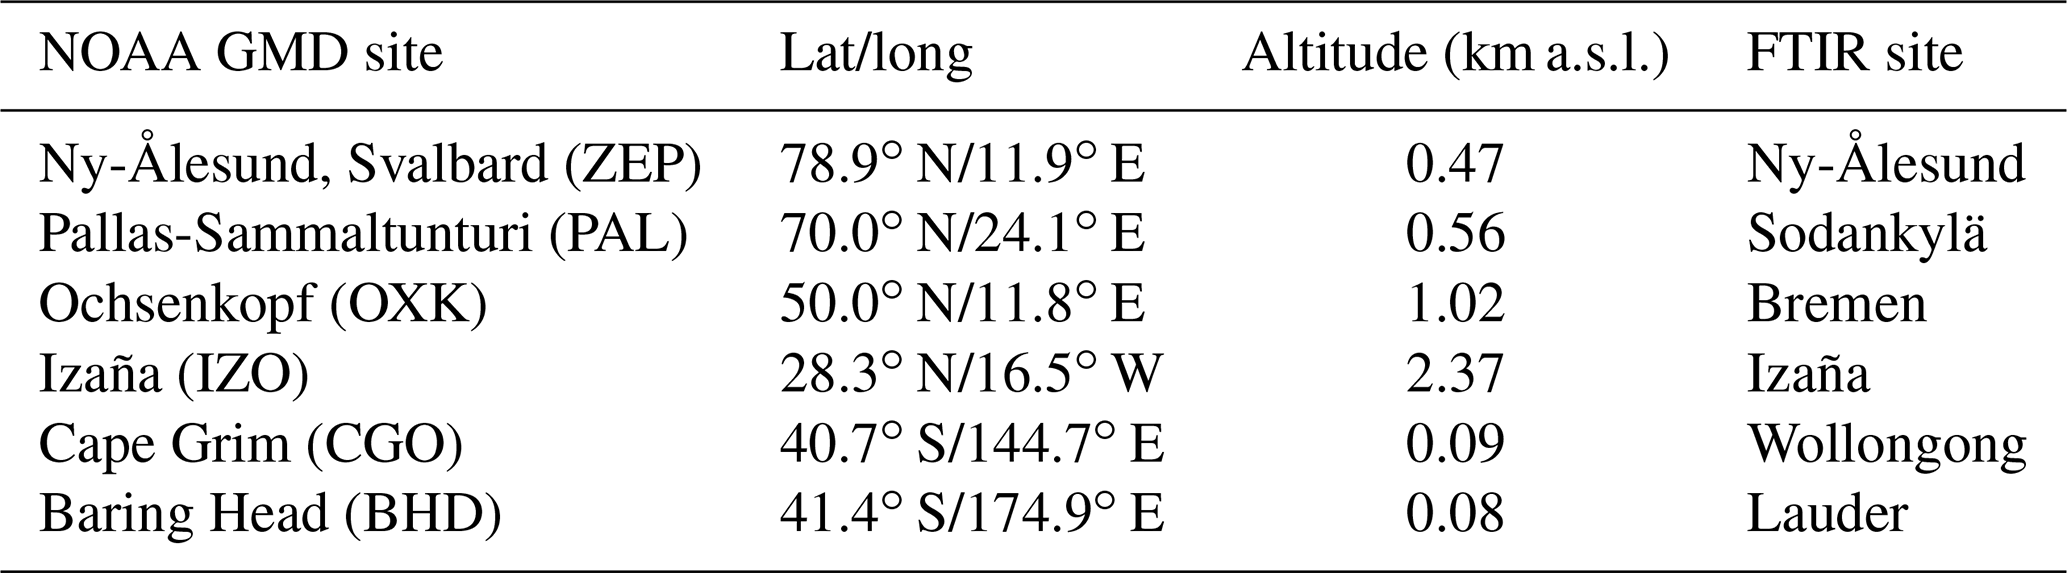
Figure 8 shows the trends from flask sample measurements, TCCON and NDACC FTIR retrievals, and the a priori and a posteriori model simulations at each site. Note that model output and flask sample data are both for the 2007–2014 period, whereas all available FTIR measurements are from the 2007–2017 period (see Fig. 3). The numbers of FTIR measurements before 2014 are very limited at Sodankylä and Réunion. As the NOAA GMD surface N2O measurements show that atmospheric N2O increases with a constant annual growth rate during the last decade, it is assumed that these two different time periods do not introduce the discrepancy in the trend and seasonal cycle computations. The a priori GEOS-Chem trend (about 1.25 ppb yr−1) is too large based on all the observational datasets in Fig. 8, implying an N2O flux overestimate in the a priori inventories used in the model. Conversely, the trend in the a posteriori GEOS-Chem simulation (0.97±0.02 ppb yr−1) is close to that seen in the NDACC and surface datasets, except at Sodankylä and Ny-Ålesund.
The trend derived from TCCON measurements (apart from Sodankylä and Ny-Ålesund) is 0.81±0.04 (1σ) ppb yr−1, which is slightly smaller compared to the results from NDACC (0.93±0.04 ppb yr−1) and flask sample measurements (0.93±0.02 ppb yr−1). The TCCON AVK (Fig. 2) indicates that the TCCON retrieval in the lower and middle troposphere includes a 30 %–50 % contribution from the a priori assumption (Eq. 3). As mentioned in Sect. 2, TCCON uses a stand-alone code to create the a priori profile for each site (Toon and Wunch, 2014). The a priori N2O profile has a trend of 0.1 % yr−1, which is much lower than the true state of the atmosphere (about 0.3 % yr−1) (WMO, 2017). Therefore, we update the TCCON retrieval using a new a priori N2O profile with an annual growth of 0.3 % yr−1 and keep the N2O mole fraction on the first day of 2007 unchanged. After updating the a priori N2O profile, the trend from the TCCON measurements increases up to 0.89±0.04 ppb yr−1 at these sites, which is within the uncertainty from the results from NDACC and the flask sample measurements.
Large uncertainties are found for the FTIR-based trends at Ny-Ålesund and Sodankylä because of a strong seasonal cycle in at high latitude, the intensity of the polar vortex varying from year to year and gaps due to polar night. The trends from the TCCON and NDACC measurements at Ny-Ålesund are much smaller than the trends from the GEOS-Chem a posteriori simulation and flask sample measurements. This might be explained by the fact that no observations are possible during winter (absence of sun) and only limited measurements are available during the other seasons. For instance, there is no full extent of the minimum from NDACC measurements at Ny-Ålesund in 2007, 2009 and 2011 compared to other years. The trends from TCCON and NDACC measurements at Sodankylä are closer to the results from the model simulations and in situ measurements, which is probably due to comparatively more (about 8 times) FTIR spectra recorded and relatively more measurement months at Sodankylä.
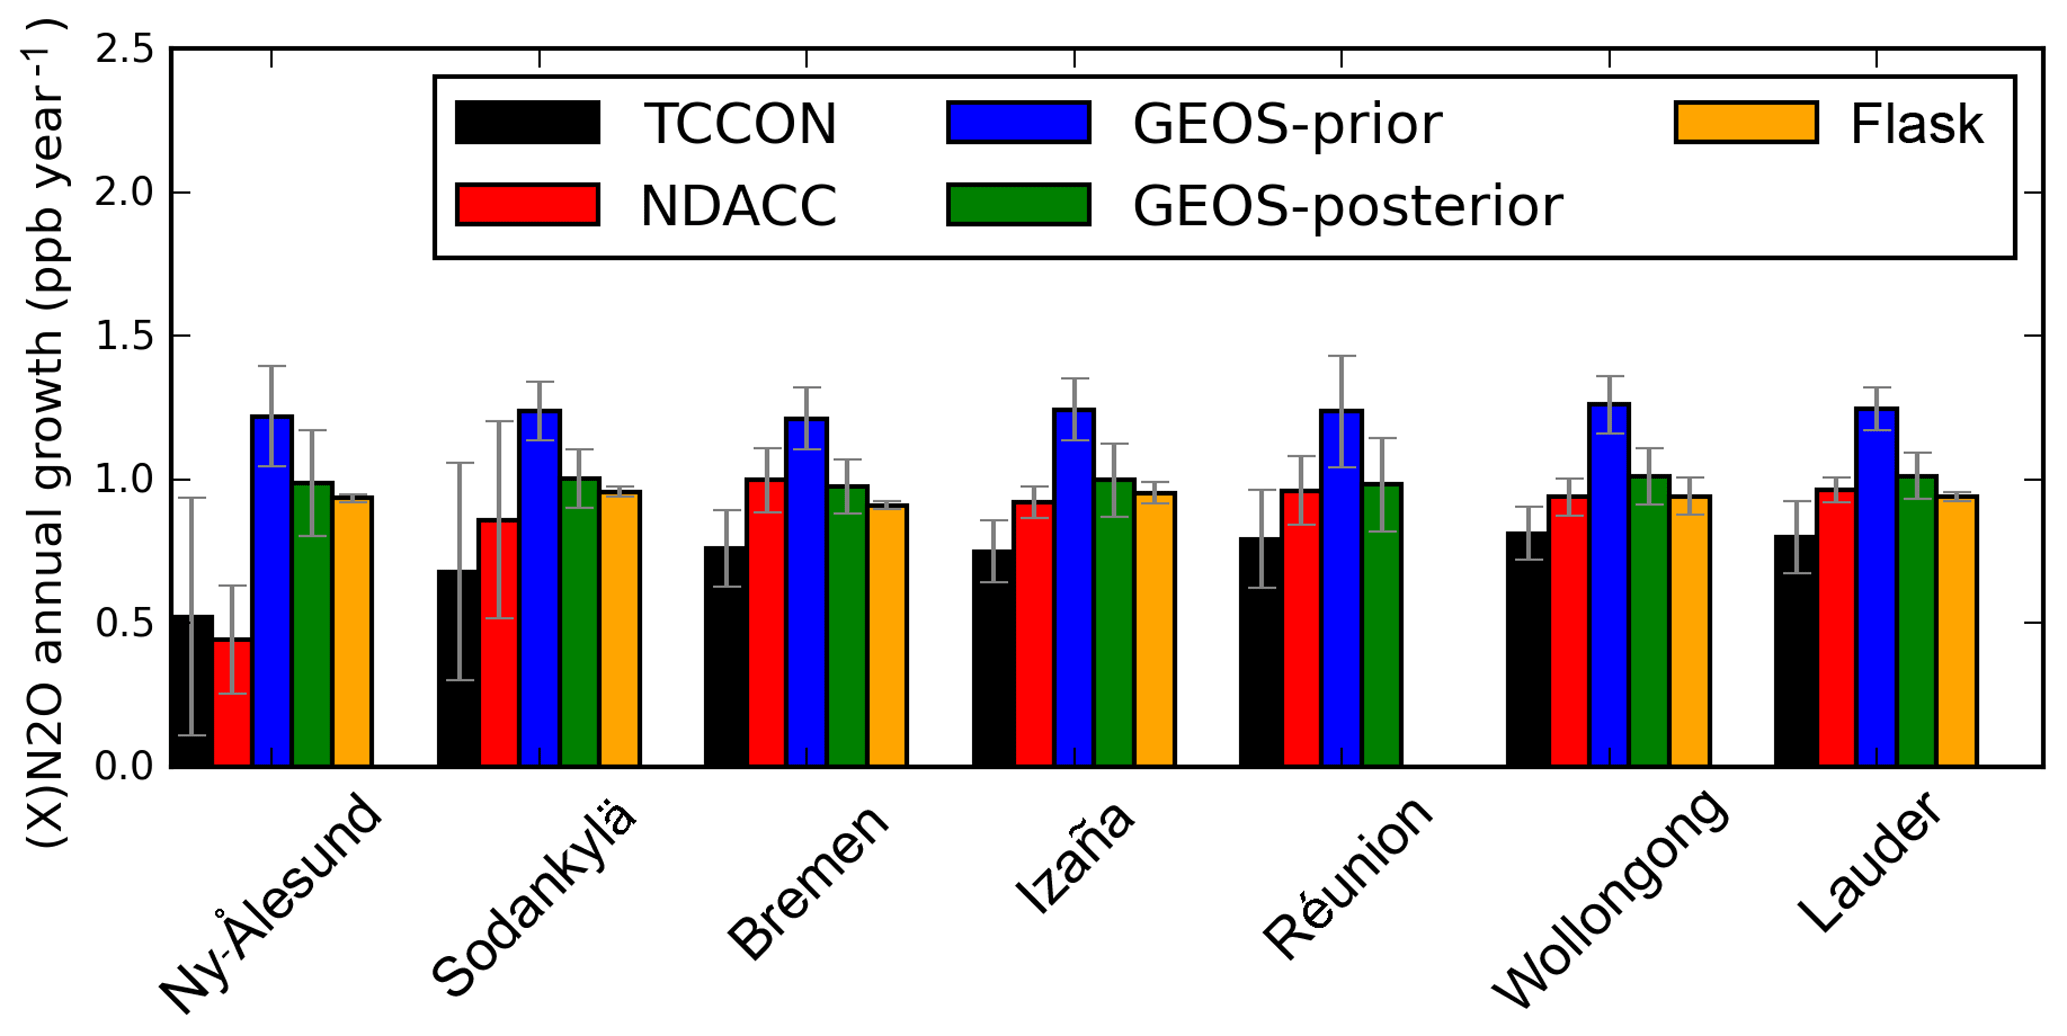
Figure 8The trends from TCCON and NDACC FTIR measurements (all available data during 2007–2017; see Fig. 3), a priori and a posteriori model simulations (2007–2014), and surface N2O trend from flask sample measurements (2007–2014), together with their uncertainties at each site.
5.4 N2O seasonal variations
The seasonal variations in from the TCCON and NDACC measurements and a priori and a posteriori GEOS-Chem model simulations are shown in Fig. 9. The seasonal variations in from a priori and a posteriori GEOS-Chem model simulations are very similar. For the Ny-Ålesund and Sodankylä sites (high latitude in the Northern Hemisphere), model simulations and TCCON measurements at Sodankylä show a maximum during August–October and a minimum during February–April. Since there is no measurement during the polar night, it is difficult to identify the maximum and minimum values from the TCCON and NDACC measurements at Ny-Ålesund and NDACC measurement at Sodankylä. The peak-to-peak amplitude of the seasonal variations from TCCON measurements (about 6 ppb) is larger than that from NDACC measurements because the TCCON measurements overestimate the contribution from the stratosphere, and the stratospheric N2O VMR is quite variable in the high latitudes. The peak-to-peak amplitude of the seasonal cycle seen in the model simulation is about 2 ppb, which is lower than that from the NDACC measurements. For the Bremen and Izaña sites (middle latitude in the Northern Hemisphere), the seasonal variations from TCCON and NDACC measurements are within 2σ uncertainty of those from the model simulations. exhibits a maximum in August–October and a minimum in February–April. For Réunion, Wollongong and Lauder (low and middle latitude in the Southern Hemisphere), the seasonal variations in the model simulations exhibit a maximum in August–October and a minimum in February–April, whereas the FTIR measurements at Réunion show the opposite pattern, and FTIR measurements at Wollongong and Lauder show weak variations. In summary, the phases of the seasonal cycles from the FTIR measurements are close to the model simulations in the Northern Hemisphere, while large discrepancies are apparent in the Southern Hemisphere.
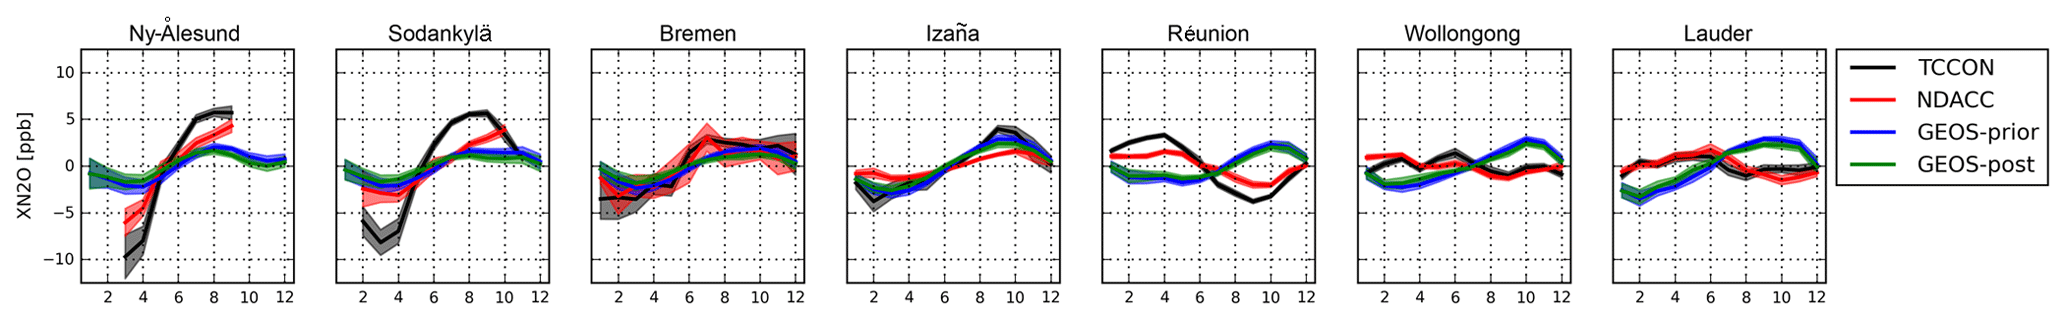
Figure 9The seasonal variations from TCCON and NDACC FTIR measurements (all available data during 2007–2017; see Fig. 3) and a priori and a posteriori model simulations (2007–2014) together with their uncertainties at each site.
Thompson et al. (2014) pointed out that many CTMs do not represent the seasonal cycle of Southern Hemisphere N2O well, due to the lack of observations to constrain atmospheric inversions. The discrepancy in the seasonal cycle of Southern Hemisphere N2O seen above could arise from a model misrepresentation of the stratosphere–troposphere exchange, errors in the seasonality of Southern Hemisphere emissions or incorrect model transport of N2O from lower latitudes. As the NDACC measurements provide N2O profiles with about three distinct partial columns (DOFS of about 3.0; see Table 3), the model simulations are compared with NDACC measurements in three vertical ranges (surface–8, 8–17 and 17–50 km; each partial column has about 1.0 DOFS). In addition, surface flask sample measurements are employed to show the seasonal cycle of N2O at the surface.
Figure 10 shows the N2O seasonal variations from flask sample measurements and a priori and a posteriori model simulations at the surface and seasonal variations from NDACC measurements and model simulations for three vertical ranges at Izaña, Réunion, Wollongong and Lauder. We mainly focus on the sites in the Southern Hemisphere, and Izaña is added to represent a site in the Northern Hemisphere. The model a posteriori N2O seasonal cycle at the surface is in good agreement with that based on flask sample measurements at Izaña but not at Wollongong and Lauder, which is consistent with the conclusions of Thompson et al. (2014) that a lack of observations limits the accuracy of inversions in the Southern Hemisphere. However, in the range from the surface to 8 km, there is no clear seasonal cycle from NDACC measurements and GEOS-Chem a posteriori simulations, and the uncertainties are about as large as the seasonal cycle amplitude. For the second layer (8–17 km), discrepancies between the NDACC measurements and the model simulations clearly exist at Wollongong and Lauder. According to the NCEP reanalysis data, the tropopause height at Izaña and Réunion is about 15–17 km, which is higher than that at Wollongong and Lauder (approximately 10–12 km). Therefore, the vertical range of 8–17 km is still in the middle and upper troposphere for Izaña and Réunion but is already in the upper troposphere and lower stratosphere for Wollongong and Lauder. The seasonal cycles of between the model simulations and NDACC measurements are still in agreement at Izaña but not at the sites in the Southern Hemisphere. Note that a larger discrepancy is observed at southern midlatitude Lauder compared to subtropical Wollongong in the vertical range of 8–17 km. Since the tropopause heights above Wollongong and Lauder are comparable, the difference might be related to these two climate systems. The vertical range of 17–50 km is in the stratosphere for all sites. It is inferred that the seasonal cycle discrepancy between model simulations and FTIR measurements in the Southern Hemisphere is dominated by their difference in the stratosphere, which is probably due to the misrepresentation of the stratosphere–troposphere exchange or the inappropriate N2O transport or loss in the stratosphere. Further investigations are needed to understand why this discrepancy occurs in the stratosphere in the Southern Hemisphere.
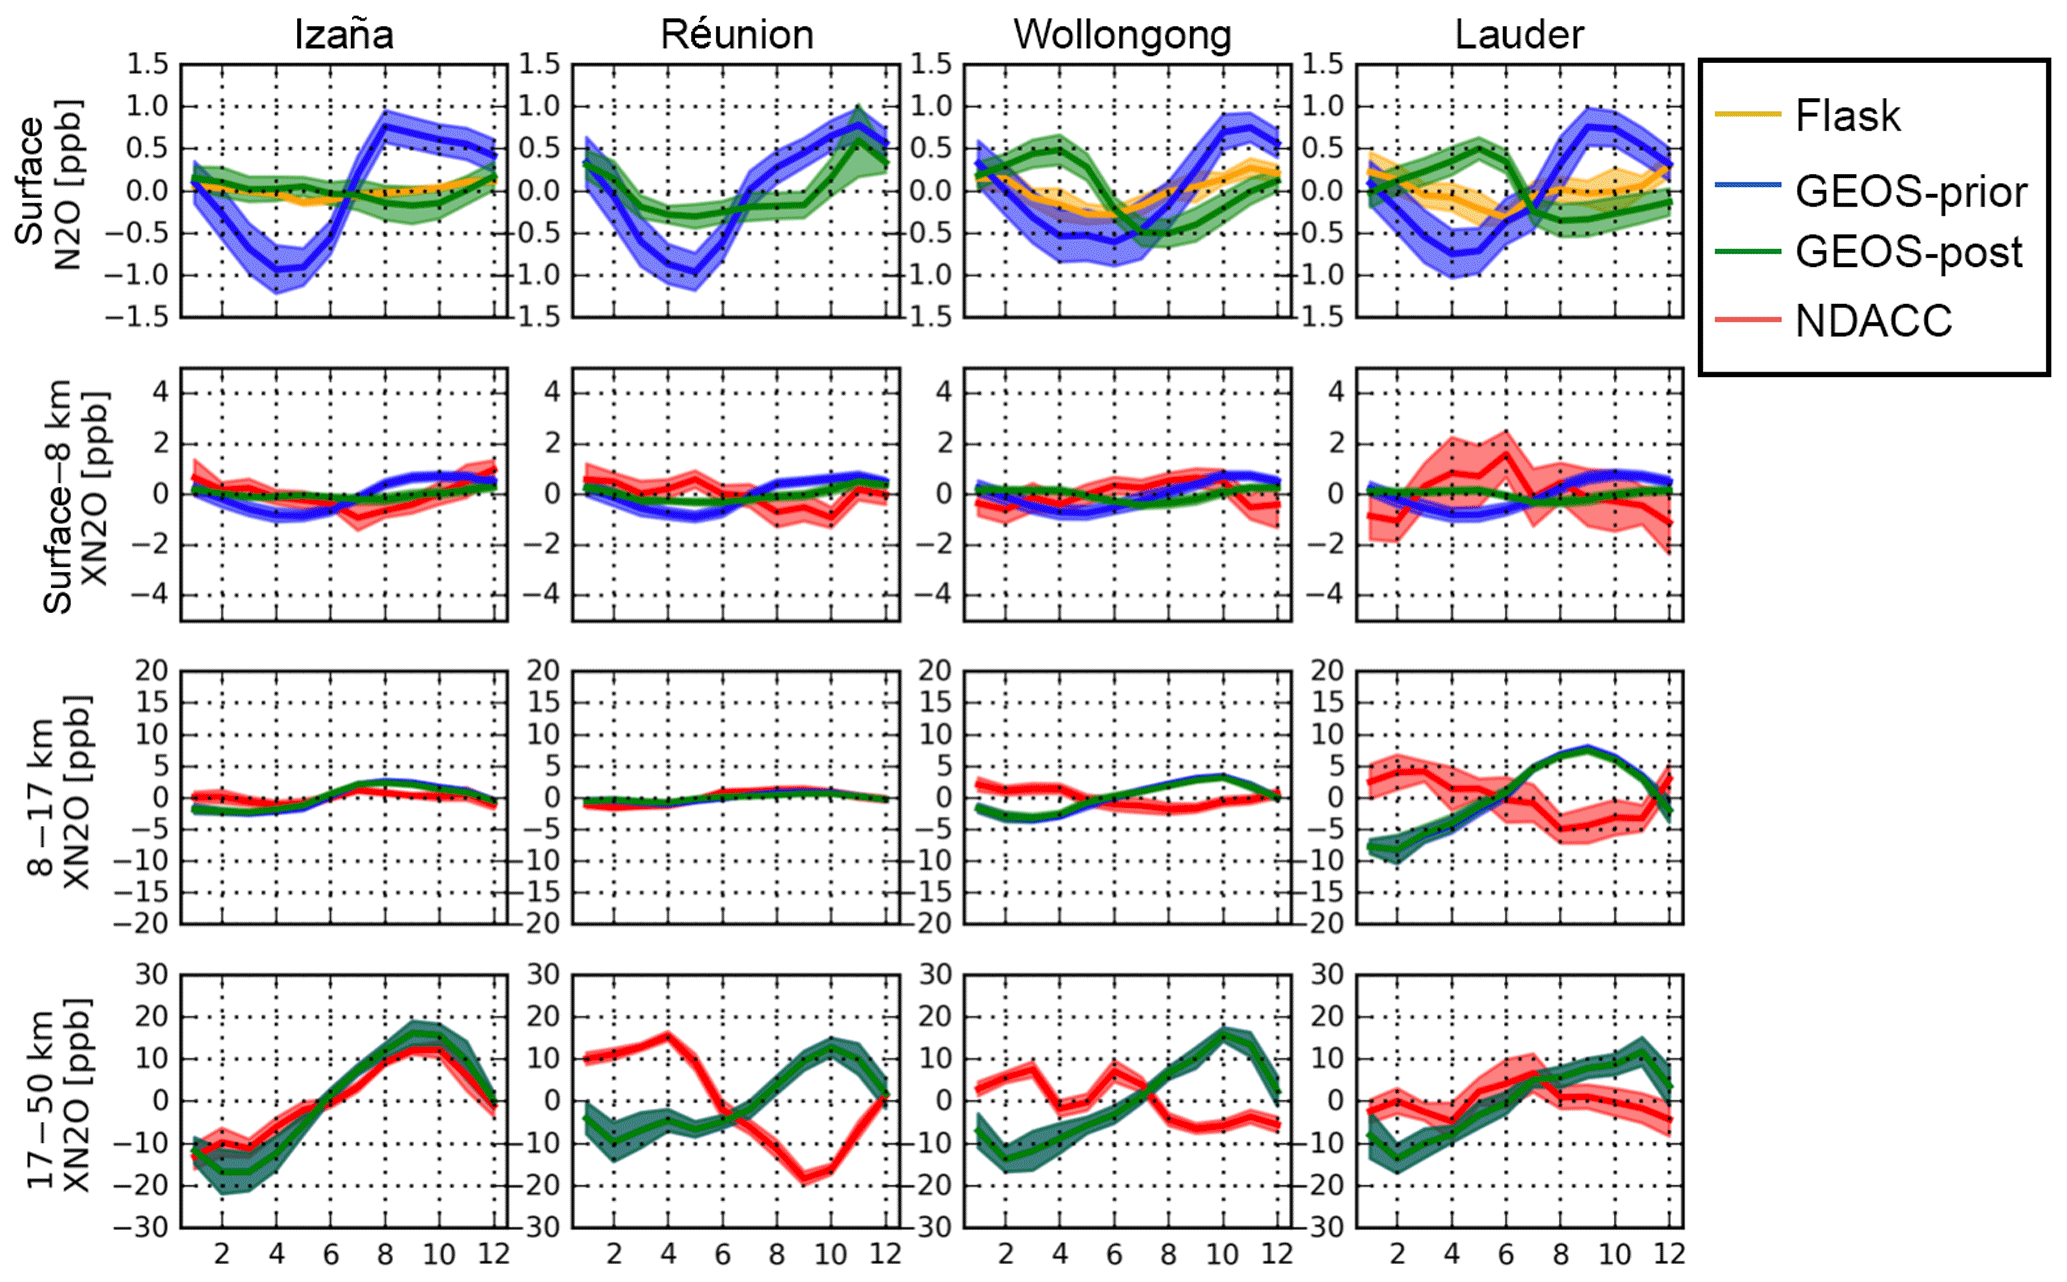
Figure 10The N2O seasonal variations from the flask sample measurements and the a priori and a posteriori model simulations at the surface at Izaña, Réunion, Wollongong and Lauder (top panels). Second to fourth row panels show the seasonal variations from NDACC measurements and the GEOS-Chem model simulations for three vertical ranges: surface–8, 8–17 and 17–50 km. Note that the seasonal variations from the GEOS-Chem a priori and a posterior simulations are almost same for the high-altitude layers (8–17 and 17–50 km).
N2O is an important greenhouse gas and it can generate nitric oxide, which depletes ozone in the stratosphere. It is a common target gas for both TCCON and NDACC networks. However, to our knowledge, no intercomparison between both datasets is available in literature. In this study, a global view of the measurement differences between these two networks is presented at seven sites (Ny-Ålesund, Sodankylä, Bremen, Izaña, Réunion, Wollongong and Lauder). The mean and standard deviation of the difference between the NDACC and TCCON (NDACC-TCCON) are −3.32–1.37 ppb (−1.1 %–0.5 %) and 1.69–5.01 ppb (0.5 %–1.6 %), which are within the uncertainties of the two datasets. The NDACC retrieval has good sensitivity throughout the troposphere and stratosphere, and the choice of the a priori profile has limited influence (within 0.1 % for retrieved N2O total column). The TCCON retrieval underestimates a deviation from the a priori in the troposphere and overestimates it in the stratosphere. As a result, the TCCON measurement is strongly affected by its a priori profile. The difference between TCCON and NDACC retrieved N2O total columns is then mainly due to the AVK differences and to N2O profile differences between the TCCON a priori and the true state of the atmosphere. The case study at Sodankylä shows that TCCON measurements are strongly affected by the polar vortex. When Sodankylä is inside the polar vortex, the N2O VMR observed by the ACE-FTS satellite is much lower than the TCCON a priori value in the stratosphere. The TCCON retrieved is then much lower than the true state of the atmosphere because the TCCON retrieval overestimates a deviation from the a priori at high altitudes. This is the reason why TCCON measurements are always lower than NDACC measurements at high latitudes in spring during polar vortex overpasses.
Trends and seasonal cycles of derived from TCCON and NDACC measurements, and nearby surface flask sample measurements are compared to the GEOS-Chem model a priori and a posteriori simulations. The a posteriori N2O fluxes are optimized based on surface N2O measurements within a 4D-Var inversion framework. The trends from the GEOS-Chem a posteriori simulation (0.97±0.02 ppb yr−1) are close to those seen in the NDACC (0.93±0.04 ppb yr−1) and flask sample measurements (0.93±0.02 ppb yr−1). It is confirmed by the FTIR measurements that the N2O fluxes of the a priori inventories in the GEOS-Chem model are overestimated. The trends of 0.81±0.04 ppb yr−1 from TCCON measurements are slightly lower compared to the NDACC and flask sample measurements because TCCON measurements have a 30 %–50 % contribution from the a priori information in the lower and middle troposphere and the annual growth in the TCCON a priori N2O VMR (0.1 %) is lower than the observed surface N2O concentration (0.3 %). The seasonal variations in from the GEOS-Chem model simulations are consistent with those from TCCON and NDACC measurements in the Northern Hemisphere but not in the Southern Hemisphere. A discrepancy exists between the surface samplings and the model a posteriori simulation in the Southern Hemisphere, and it is inferred that a lack of observations limits the improvement in the N2O a posteriori fluxes. As NDACC measurements provide N2O profiles with about three distinct partial columns, the model simulations are compared with NDACC measurements in three vertical ranges (surface–8, 8–17 and 17–50 km). It is found that the discrepancy in the seasonal cycle between model simulations and FTIR measurements in the Southern Hemisphere is mainly due to stratospheric effects.
In summary, the TCCON and NDACC measurements are in good agreement, and their differences are within the combined uncertainty. However, due to the averaging kernels, TCCON retrievals are strongly affected by a priori profiles while NDACC retrievals can capture the tropospheric and stratospheric variations in N2O as well as the trend very well using a fixed a priori profile. trends from TCCON measurements are about 0.1 ppb yr−1 underestimated because of the weak trend in its a priori N2O VMR. Fortunately, the issues of TCCON measurements could be solved with an improved a priori profile.
The TCCON data are publicly available through the TCCON wiki (https://doi.org/10.14291/TCCON.GGG2014, TCCON Team, 2014). The NDACC data except Sodankylä are publicly available from the NDACC database (http://www.ndacc.org, IRWG, 2019). The ACE-FTS data used are available from http://ace.uwaterloo.ca/data/ (registration required, ACE-FTS team, 2019). The NOAA are available from the NOAA FTP server ftp://aftp.cmdl.noaa.gov/data/greenhouse_gases/n2o/flask/ (last access: 27 February 2019). The Sodankylä MIR data and the GEOS-Chem model data can be obtained by contacting the authors.
MZ wrote the paper and produced the main analysis and results with significant input from BL, KCW, DBM and MDM. CV, MKS, CH, JMM, RK, PH, DS, DFP, NJ, NMD, TB, MS, MP, JN and JWH provided and analyzed the TCCON and NDACC measurements. All authors read and provided comments on the paper.
The authors declare that they have no conflict of interest.
Minqiang Zhou is supported by the Belgian complementary researchers program.
We would like to thank TCCON and NDACC networks for making the data publicly
available. The FTIR sites at Réunion are operated by the BIRA-IASB and
locally supported by LACy/UMR8105, Université de La Réunion. We would
like to thank Nicolas Kumps, Bart Dils and Francis Scolas (BIRA-IASB) for
their contributions to the FTIR measurement maintenance and Edward Dlugokencky (NOAA) for sharing the flask sample measurements. Development of
the GEOS-Chem N2O simulation was supported by NOAA (grant
no. NA13OAR4310086) and the Minnesota Supercomputing Institute. The Lauder FTIR
measurements are core funded by NIWA from New Zealand's Ministry of Business,
Innovation and Employment. Wollongong TCCON and NDACC measurements are
supported by the Australian Research Council, grants DP160101598,
DP140101552, DP110103118, DP0879468 and LE0668470. The Réunion TCCON
measurements are supported by Belgian Science Policy through contracts
FR/35/IC1 to IC3.
Edited by: Joanna Joiner
Reviewed by: two anonymous referees
ACE-FTS team: ACE/SCISAT Database Level 2 Data Access, available at: https://ace.uwaterloo.ca/data.php, last access: 27 February 2019. a
Angelbratt, J., Mellqvist, J., Blumenstock, T., Borsdorff, T., Brohede, S., Duchatelet, P., Forster, F., Hase, F., Mahieu, E., Murtagh, D., Petersen, A. K., Schneider, M., Sussmann, R., and Urban, J.: A new method to detect long term trends of methane (CH4) and nitrous oxide (N2O) total columns measured within the NDACC ground-based high resolution solar FTIR network, Atmos. Chem. Phys., 11, 6167–6183, https://doi.org/10.5194/acp-11-6167-2011, 2011. a, b
Blumenstock, T., Hase, F., Schneider, M., Garcia, O. E., and Sepulveda, E.: TCCON data from Izana (ES), Release GGG2014R0, TCCON data archive, hosted by CaltechDATA, https://doi.org/10.14291/tccon.ggg2014.izana01.R0/1149295, 2014. a
Boone, C. D., Walker, K. A., and Bernath, P. F.: Version 3 Retrievals for the Atmospheric Chemistry Experiment Fourier Transform Spectrometer (ACE-FTS), in: The Atmospheric Chemistry Experiment ACE at 10: A Solar Occultation Anthology, JA, Deepak Publishing 2013, Hampton, Virginia, USA, 103–127, 2013. a
Buitenhuis, E. T., Rivkin, R. B., Séailley, S., and Le Quéré, C.: Biogeochemical fluxes through microzooplankton, Global Biogeochem. Cy., 24, GB4015, https://doi.org/10.1029/2009GB003601, 2010. a
Dee, D. P., Uppala, S. M., Simmons, A. J., Berrisford, P., Poli, P., Kobayashi, S., Andrae, U., Balmaseda, M. A., Balsamo, G., Bauer, P., Bechtold, P., Beljaars, A. C., van de Berg, L., Bidlot, J., Bormann, N., Delsol, C., Dragani, R., Fuentes, M., Geer, A. J., Haimberger, L., Healy, S. B., Hersbach, H., Hólm, E. V., Isaksen, L., Kållberg, P., Köhler, M., Matricardi, M., Mcnally, A. P., Monge-Sanz, B. M., Morcrette, J. J., Park, B. K., Peubey, C., de Rosnay, P., Tavolato, C., Thépaut, J. N., and Vitart, F.: The ERA-Interim reanalysis: Configuration and performance of the data assimilation system, Q. J. Roy. Meteor. Soc., 137, 553–597, https://doi.org/10.1002/qj.828, 2011. a
De Mazière, M., Sha, M. K., Desmet, F., Hermans, C., Scolas, F., Kumps, N., Metzger, J.-M., Duflot, V., and Cammas, J.-P.: TCCON data from Reunion Island (RE), Release GGG2014R0, TCCON data archive, hosted by CaltechDATA, https://doi.org/10.14291/tccon.ggg2014.reunion01.R0/1149288, 2014. a
De Mazière, M., Thompson, A. M., Kurylo, M. J., Wild, J. D., Bernhard, G., Blumenstock, T., Braathen, G. O., Hannigan, J. W., Lambert, J.-C., Leblanc, T., McGee, T. J., Nedoluha, G., Petropavlovskikh, I., Seckmeyer, G., Simon, P. C., Steinbrecht, W., and Strahan, S. E.: The Network for the Detection of Atmospheric Composition Change (NDACC): history, status and perspectives, Atmos. Chem. Phys., 18, 4935–4964, https://doi.org/10.5194/acp-18-4935-2018, 2018. a
Denton, M. H., Kivi, R., Ulich, T., Clilverd, M. A., Rodger, C. J., and von der Gathen, P.: Northern Hemisphere Stratospheric Ozone Depletion Caused by Solar Proton Events: The Role of the Polar Vortex, Geophys. Res. Lett., 45, 2115–2124, https://doi.org/10.1002/2017GL075966, 2018. a
Deutscher, N. M., Griffith, D. W. T., Bryant, G. W., Wennberg, P. O., Toon, G. C., Washenfelder, R. A., Keppel-Aleks, G., Wunch, D., Yavin, Y., Allen, N. T., Blavier, J.-F., Jiménez, R., Daube, B. C., Bright, A. V., Matross, D. M., Wofsy, S. C., and Park, S.: Total column CO2 measurements at Darwin, Australia – site description and calibration against in situ aircraft profiles, Atmos. Meas. Tech., 3, 947–958, https://doi.org/10.5194/amt-3-947-2010, 2010. a
Dlugokencky, E., Lang, P., Crotwell, A., Mund, J., Crotwell, M., and Thoning, K.: Atmospheric Nitrous Oxide Dry Air Mole Fractions from the NOAA ESRL Carbon Cycle Cooperative Global Air Sampling Network, 1997–2017, Version: 2018-08-02, available at: ftp://aftp.cmdl.noaa.gov/data/trace_gases/n2o/flask/surface/ (last access: 27 February 2019), 2018. a
European Commission: Emission Database for Global Atmospheric Research (EDGAR), release EDGARv4.2 FT2010, Tech. rep., Joint Research Centre (JRC)/Netherlands Environmental Assessment Agency (PBL), available at: http://edgar.jrc.ec.europa.eu (last access: 12 April 2018), 2013. a
García, O. E., Sepúlveda, E., Schneider, M., Hase, F., August, T., Blumenstock, T., Kühl, S., Munro, R., Gómez-Peláez, Á. J., Hultberg, T., Redondas, A., Barthlott, S., Wiegele, A., González, Y., and Sanromá, E.: Consistency and quality assessment of the Metop-A/IASI and Metop-B/IASI operational trace gas products (O3, CO, N2O, CH4, and CO2) in the subtropical North Atlantic, Atmos. Meas. Tech., 9, 2315–2333, https://doi.org/10.5194/amt-9-2315-2016, 2016. a
García, O. E., Schneider, M., Ertl, B., Sepúlveda, E., Borger, C., Diekmann, C., Wiegele, A., Hase, F., Barthlott, S., Blumenstock, T., Raffalski, U., Gómez-Peláez, A., Steinbacher, M., Ries, L., and de Frutos, A. M.: The MUSICA IASI CH4 and N2O products and their comparison to HIPPO, GAW and NDACC FTIR references, Atmos. Meas. Tech., 11, 4171–4215, https://doi.org/10.5194/amt-11-4171-2018, 2018. a, b
Griffith, D. W., Velazco, V. A., Deutscher, N. M., Murphy, C., Jones, N., Wilson, S., Macatangay, R., Kettlewell, G., Buchholz, R. R., and Riggenbach, M.: TCCON data from Wollongong (AU), Release GGG2014R0, TCCON data archive, hosted by CaltechDATA, https://doi.org/10.14291/tccon.ggg2014.wollongong01.R0, 2014. a
Hase, F., Hannigan, J., Coffey, M., Goldman, A., Höpfner, M., Jones, N., Rinsland, C., and Wood, S.: Intercomparison of retrieval codes used for the analysis of high-resolution, ground-based FTIR measurements, J. Quant. Spectrosc. Ra., 87, 25–52, https://doi.org/10.1016/j.jqsrt.2003.12.008, 2004. a, b
IPCC: Climate change 2013: The physical science basis, Contribution of Working Group I to the Fifth Assessment Report of the Intergovernmental Panel on Climate Change, 2013. a
IRWG: Network for the Detection of Atmospheric Composition Change (NDACC) datasets, available at: http://www.ndaccdemo.org/, last access: 27 February 2019. a
Karppinen, T., Lakkala, K., Karhu, J. M., Heikkinen, P., Kivi, R., and Kyrö, E.: Brewer spectrometer total ozone column measurements in Sodankylä, Geosci. Instrum. Method. Data Syst., 5, 229–239, https://doi.org/10.5194/gi-5-229-2016, 2016. a
Kivi, R., Kyrö, E., Dörnbrack, A., and Birner, T.: Observations of vertically thick polar stratospheric clouds and record low temperature in the Arctic vortex, Geophys. Res. Lett., 28, 3661–3664, https://doi.org/10.1029/2001GL013187, 2001. a
Kivi, R., Kyrö, E., Turunen, T., Harris, N. R., von der Gathen, P., Rex, M., Andersen, S. B., and Wohltmann, I.: Ozonesonde observations in the Arctic during 1989–2003: Ozone variability and trends in the lower stratosphere and free troposphere, J. Geophys. Res.-Atmos., 112, D08306, https://doi.org/10.1029/2006JD007271, 2007. a
Kivi, R., Heikkinen, P., and Kyrö, E.: TCCON data from Sodankyla (FI), Release GGG2014R0, TCCON data archive, hosted by CaltechDATA, https://doi.org/10.14291/tccon.ggg2014.sodankyla01.R0, 2014. a
Notholt, J., Petri, C., Warneke, T., Deutscher, N. M., Buschmann, M., Weinzierl, C., Macatangay, R., and Grupe, P.: TCCON data from Bremen (DE), Release GGG2014R0, TCCON data archive, hosted by CaltechDATA, https://doi.org/10.14291/tccon.ggg2014.bremen01.R0/1149275, 2014a. a
Notholt, J., Schrems, O., Warneke, T., Deutscher, N., Weinzierl, C., Palm, M., and Buschmann, B.: TCCON data from Bialystok (PL), Release GGG2014R0, TCCON data archive, hosted by CaltechDATA, https://doi.org/10.14291/tccon.ggg2014.nyalesund01.R0, 2014b. a
Ostler, A., Sussmann, R., Rettinger, M., Deutscher, N. M., Dohe, S., Hase, F., Jones, N., Palm, M., and Sinnhuber, B.-M.: Multistation intercomparison of column-averaged methane from NDACC and TCCON: impact of dynamical variability, Atmos. Meas. Tech., 7, 4081–4101, https://doi.org/10.5194/amt-7-4081-2014, 2014. a
Park, S., Croteau, P., Boering, K. A., Etheridge, D. M., Ferretti, D., Fraser, P. J., Kim, K. R., Krummel, P. B., Langenfelds, R. L., Van Ommen, T. D., Steele, L. P., and Trudinger, C. M.: Trends and seasonal cycles in the isotopic composition of nitrous oxide since 1940, Nat. Geosci., 5, 261–265, https://doi.org/10.1038/ngeo1421, 2012. a
Pollard, D. F., Sherlock, V., Robinson, J., Deutscher, N. M., Connor, B., and Shiona, H.: The Total Carbon Column Observing Network site description for Lauder, New Zealand, Earth Syst. Sci. Data, 9, 977–992, https://doi.org/10.5194/essd-9-977-2017, 2017. a
Portmann, R. W., Daniel, J. S., and Ravishankara, A. R.: Stratospheric ozone depletion due to nitrous oxide: influences of other gases, Philos. T. Roy. Soc. B, 367, 1256–1264, https://doi.org/10.1098/rstb.2011.0377, 2012. a
Pougatchev, N. S., Connor, B. J., and Rinsland, C. P.: Infrared measurements of the ozone vertical distribution above Kitt Peak, J. Geophys. Res., 100, 16689, https://doi.org/10.1029/95JD01296, 1995. a
Prather, M. J., Hsu, J., DeLuca, N. M., Jackman, C. H., Oman, L. D., Douglass, A. R., Fleming, E. L., Strahan, S. E., Steenrod, S. D., Søvde, O. A., Isaksen, I. S., Froidevaux, L., and Funke, B.: Measuring and modeling the lifetime of nitrous oxide including its variability, J. Geophys. Res., 120, 5693–5705, https://doi.org/10.1002/2015JD023267, 2015. a
Ravishankara, A. R., Daniel, J. S., and Portmann, R. W.: Nitrous oxide (N2O): The dominant ozone-depleting substance emitted in the 21st century, Science, 326, 123–125, https://doi.org/10.1126/science.1176985, 2009. a
Rodgers, C. D.: Inverse Methods for Atmospheric Sounding – Theory and Practice, Series on Atmospheric Oceanic and Planetary Physics, vol. 2, World Scientific Publishing Co. Pte. Ltd, Singapore, https://doi.org/10.1142/9789812813718, 2000. a
Rodgers, C. D.: Intercomparison of remote sounding instruments, J. Geophys. Res., 108, 46–48, https://doi.org/10.1029/2002JD002299, 2003. a, b
Rothman, L. S., Gordon, I. E., Barbe, A., Benner, D. C., Bernath, P. F., Birk, M., Boudon, V., Brown, L. R., Campargue, A., Champion, J. P., Chance, K., Coudert, L. H., Dana, V., Devi, V. M., Fally, S., Flaud, J. M., Gamache, R. R., Goldman, A., Jacquemart, D., Kleiner, I., Lacome, N., Lafferty, W. J., Mandin, J. Y., Massie, S. T., Mikhailenko, S. N., Miller, C. E., Moazzen-Ahmadi, N., Naumenko, O. V., Nikitin, A. V., Orphal, J., Perevalov, V. I., Perrin, A., Predoi-Cross, A., Rinsland, C. P., Rotger, M., Šimečková, M., Smith, M. A., Sung, K., Tashkun, S. A., Tennyson, J., Toth, R. A., Vandaele, A. C., and Vander Auwera, J.: The HITRAN 2008 molecular spectroscopic database, J. Quant. Spectrosc. Ra., 110, 533–572, https://doi.org/10.1016/j.jqsrt.2009.02.013, 2009. a
Saito, R., Patra, P. K., Deutscher, N., Wunch, D., Ishijima, K., Sherlock, V., Blumenstock, T., Dohe, S., Griffith, D., Hase, F., Heikkinen, P., Kyrö, E., Macatangay, R., Mendonca, J., Messerschmidt, J., Morino, I., Notholt, J., Rettinger, M., Strong, K., Sussmann, R., and Warneke, T.: Technical Note: Latitude-time variations of atmospheric column-average dry air mole fractions of CO2, CH4 and N2O, Atmos. Chem. Phys., 12, 7767–7777, https://doi.org/10.5194/acp-12-7767-2012, 2012. a
Schoeberl, M. R. and Hartmann, D. L.: The Dynamics of the Stratospheric Polar Vortex and Its Relation to Springtime Ozone Depletions, Science, 251, 46–52, https://doi.org/10.1126/science.251.4989.46, 1991. a
Sheese, P. E., Walker, K. A., Boone, C. D., Bernath, P. F., Froidevaux, L., Funke, B., Raspollini, P., and von Clarmann, T.: ACE-FTS ozone, water vapour, nitrous oxide, nitric acid, and carbon monoxide profile comparisons with MIPAS and MLS, J. Quant. Spectrosc. Ra., 186, 63–80, https://doi.org/10.1016/j.jqsrt.2016.06.026, 2017. a
Sherlock, V., Connor, B. J., Robinson, J., Shiona, H., Smale, D., and Pollard, D.: TCCON data from Lauder (NZ), 125HR, Release GGG2014R0, TCCON data archive, hosted by CaltechDATA, https://doi.org/10.14291/tccon.ggg2014.lauder02.R0/1149298, 2014. a
Strong, K., Wolff, M. A., Kerzenmacher, T. E., Walker, K. A., Bernath, P. F., Blumenstock, T., Boone, C., Catoire, V., Coffey, M., De Mazière, M., Demoulin, P., Duchatelet, P., Dupuy, E., Hannigan, J., Höpfner, M., Glatthor, N., Griffith, D. W. T., Jin, J. J., Jones, N., Jucks, K., Kuellmann, H., Kuttippurath, J., Lambert, A., Mahieu, E., McConnell, J. C., Mellqvist, J., Mikuteit, S., Murtagh, D. P., Notholt, J., Piccolo, C., Raspollini, P., Ridolfi, M., Robert, C., Schneider, M., Schrems, O., Semeniuk, K., Senten, C., Stiller, G. P., Strandberg, A., Taylor, J., Tétard, C., Toohey, M., Urban, J., Warneke, T., and Wood, S.: Validation of ACE-FTS N2O measurements, Atmos. Chem. Phys., 8, 4759–4786, https://doi.org/10.5194/acp-8-4759-2008, 2008. a
Thompson, R. L., Ishijima, K., Saikawa, E., Corazza, M., Karstens, U., Patra, P. K., Bergamaschi, P., Chevallier, F., Dlugokencky, E., Prinn, R. G., Weiss, R. F., O'Doherty, S., Fraser, P. J., Steele, L. P., Krummel, P. B., Vermeulen, A., Tohjima, Y., Jordan, A., Haszpra, L., Steinbacher, M., Van der Laan, S., Aalto, T., Meinhardt, F., Popa, M. E., Moncrieff, J., and Bousquet, P.: TransCom N2O model inter-comparison – Part 2: Atmospheric inversion estimates of N2O emissions, Atmos. Chem. Phys., 14, 6177–6194, https://doi.org/10.5194/acp-14-6177-2014, 2014. a, b, c
Tikhonov, A. N.: Solution of Incorrectly Formulated Problems and the Regularisation Method, Soviet. Math. Dokl., 4, 1035–1038, https://doi.org/10.1111/J.1365-246X.2012.05699.X, 1963. a
Total Carbon Column Observing Network (TCCON) Team: 2014 TCCON Data Release (Version GGG2014) [Data set], https://doi.org/10.14291/TCCON.GGG2014, 2014. a
Toon, G. C.: Telluric line list for GGG2014, TCCON data archive, hosted by the Carbon Dioxide Information Analysis Center, Oak Ridge National Laboratory, Oak Ridge, Tennessee, USA, https://doi.org/10.14291/tccon.ggg2014.atm.R0/1221656, 2014. a
Toon, G. C. and Wunch, D.: A stand-alone a priori profile generation tool for GGG2014 release, TCCON data archive, hosted by the Carbon Dioxide Information Analysis Center, Oak Ridge National Laboratory, Oak Ridge, Tennessee, USA, https://doi.org/10.14291/TCCON.GGG2014.PRIORS.R0, 2014. a, b
van der Werf, G. R., Randerson, J. T., Giglio, L., van Leeuwen, T. T., Chen, Y., Rogers, B. M., Mu, M., van Marle, M. J. E., Morton, D. C., Collatz, G. J., Yokelson, R. J., and Kasibhatla, P. S.: Global fire emissions estimates during 1997–2016, Earth Syst. Sci. Data, 9, 697–720, https://doi.org/10.5194/essd-9-697-2017, 2017. a
Vigouroux, C., De Mazière, M., Errera, Q., Chabrillat, S., Mahieu, E., Duchatelet, P., Wood, S., Smale, D., Mikuteit, S., Blumenstock, T., Hase, F., and Jones, N.: Comparisons between ground-based FTIR and MIPAS N2O and HNO3 profiles before and after assimilation in BASCOE, Atmos. Chem. Phys., 7, 377–396, https://doi.org/10.5194/acp-7-377-2007, 2007. a
Wells, K. C., Millet, D. B., Bousserez, N., Henze, D. K., Chaliyakunnel, S., Griffis, T. J., Luan, Y., Dlugokencky, E. J., Prinn, R. G., O'Doherty, S., Weiss, R. F., Dutton, G. S., Elkins, J. W., Krummel, P. B., Langenfelds, R., Steele, L. P., Kort, E. A., Wofsy, S. C., and Umezawa, T.: Simulation of atmospheric N2O with GEOS-Chem and its adjoint: evaluation of observational constraints, Geosci. Model Dev., 8, 3179–3198, https://doi.org/10.5194/gmd-8-3179-2015, 2015. a, b
Wells, K. C., Millet, D. B., Bousserez, N., Henze, D. K., Griffis, T. J., Chaliyakunnel, S., Dlugokencky, E. J., Saikawa, E., Xiang, G., Prinn, R. G., O'Doherty, S., Young, D., Weiss, R. F., Dutton, G. S., Elkins, J. W., Krummel, P. B., Langenfelds, R., and Steele, L. P.: Top-down constraints on global N2O emissions at optimal resolution: application of a new dimension reduction technique, Atmos. Chem. Phys., 18, 735–756, https://doi.org/10.5194/acp-18-735-2018, 2018. a, b, c
WMO: Scientific Assessment of Ozone Depletion: 2014, World Meteorological Organization Global Ozone Research and Monitoring Project – Report No. 55, 2014. a
WMO: WMO Greenhouse Gas Bulletin | World Meteorological Organization, WMO Bull., ISSN 2078-0796, 2017. a, b, c
Wunch, D., Toon, G. C., Blavier, J.-F. L., Washenfelder, R. A., Notholt, J., Connor, B. J., Griffith, D. W. T., Sherlock, V., and Wennberg, P. O.: The Total Carbon Column Observing Network, Philos. T. Roy. Soc. A, 369, 2087–2112, https://doi.org/10.1098/rsta.2010.0240, 2011. a, b, c
Wunch, D., Toon, G. C., Sherlock, V., Deutscher, N. M., Liu, C., Feist, D. G., and Wennberg, P. O.: The Total Carbon Column Observing Network's GGG2014 Data Version, p. 43, https://doi.org/10.14291/tccon.ggg2014.documentation.R0, 2015. a, b
Xiong, X., Maddy, E. S., Barnet, C., Gambacorta, A., Patra, P. K., Sun, F., and Goldberg, M.: Retrieval of nitrous oxide from atmospheric infrared sounder: Characterization and validation, J. Geophys. Res., 119, 9107–9122, https://doi.org/10.1002/2013JD021406, 2014. a
Yang, Z., Toon, G. C., Margolis, J. S., and Wennberg, P. O.: Atmospheric CO2 retrieved from ground-based near IR solar spectra, Geophys. Res. Lett., 29, 53-1–53-4, https://doi.org/10.1029/2001GL014537, 2002. a
Zaehle, S., Ciais, P., Friend, A. D., and Prieur, V.: Carbon benefits of anthropogenic reactive nitrogen offset by nitrous oxide emissions, Nat. Geosci., 4, 601–605, https://doi.org/10.1038/ngeo1207, 2011. a
Zander, R., Ehhalt, D. H., Rinsland, C. P., Schmidt, U., Mahieu, E., Rudolph, J., Demoulin, P., Roland, G., Delbouille, L., and Sauval, A. J.: Secular trend and seasonal variability of the column abundance of N2O above the Jungfraujoch station determined from IR solar spectra, J. Geophys. Res., 99, 16745–16756, https://doi.org/10.1029/94JD01030, 1994. a
Zhou, M., Vigouroux, C., Langerock, B., Wang, P., Dutton, G., Hermans, C., Kumps, N., Metzger, J.-M., Toon, G., and De Mazière, M.: CFC-11, CFC-12 and HCFC-22 ground-based remote sensing FTIR measurements at Réunion Island and comparisons with MIPAS/ENVISAT data, Atmos. Meas. Tech., 9, 5621–5636, https://doi.org/10.5194/amt-9-5621-2016, 2016. a
Zhou, M., Langerock, B., Vigouroux, C., Sha, M. K., Ramonet, M., Delmotte, M., Mahieu, E., Bader, W., Hermans, C., Kumps, N., Metzger, J.-M., Duflot, V., Wang, Z., Palm, M., and De Mazière, M.: Atmospheric CO and CH4 time series and seasonal variations on Reunion Island from ground-based in situ and FTIR (NDACC and TCCON) measurements, Atmos. Chem. Phys., 18, 13881–13901, https://doi.org/10.5194/acp-18-13881-2018, 2018. a
The requested paper has a corresponding corrigendum published. Please read the corrigendum first before downloading the article.
- Article
(3574 KB) - Full-text XML