the Creative Commons Attribution 4.0 License.
the Creative Commons Attribution 4.0 License.
 | 07 Mar 2019
Laser-induced fluorescence-based detection of atmospheric nitrogen dioxide and comparison of different techniques during the PARADE 2011 field campaign
Umar Javed
Dagmar Kubistin
Monica Martinez
Jan Pollmann
Markus Rudolf
Uwe Parchatka
Andreas Reiffs
Jim Thieser
Gerhard Schuster
Martin Horbanski
Denis Pöhler
John N. Crowley
Horst Fischer
Jos Lelieveld
GANDALF (Gas Analyzer for Nitrogen Dioxide Applying Laser-induced Fluorescence), a new instrument for the detection of nitrogen dioxide based on the laser-induced fluorescence (LIF) technique, is presented in this paper. GANDALF is designed for ground-based and airborne deployment with a robust calibration system. In the current set-up, it uses a multi-mode diode laser (447–450 nm) and performs in situ, continuous, and autonomous measurements with a laser pulse repetition rate of 5 MHz. The performance of GANDALF was tested during the summer of year 2011 (15 August–10 September) in a field experiment at Kleiner Feldberg, Germany. The location is within a forested region with an urban influence, where NOx levels were between 0.12 and 22 parts per billion by volume (ppb). Based on the field results, the limit of detection is estimated at 5–10 parts per trillion by volume (ppt) in 60 s at a signal-to-noise ratio (SNR) of 2. The overall accuracy and precision of the instrument are better than 5 % (1σ) and 0.5 %+3 ppt (1σ min−1), respectively. A comparison of nitrogen dioxide measurements based on several techniques during the field campaign PARADE 2011 is presented to explore methodic differences.
- Article
(6869 KB) -
Supplement
(3441 KB) - BibTeX
- EndNote


Tropospheric nitric oxide (NO) and nitrogen dioxide (NO2) are key species in atmospheric chemistry and are strongly coupled due to their fast photochemical interconversion generally combined as NOx (). Nitrogen oxides act as a key catalyst in the formation of tropospheric ozone (O3) (Crutzen, 1979). NOx also plays an important role in the oxidation capacity of the troposphere by affecting the abundances of O3, hydroxyl radical (OH), and nitrate radical (NO3).
The main sources of NOx in the troposphere are combustion processes, predominantly fossil fuel use, biomass burning, microbial production in soils, transport from the stratosphere and lightning, the latter two directly affecting the free troposphere (e.g. Logan, 1983), along with aircraft emissions (Strand and Hov, 1996). NOx emissions from the surface are mostly in the form of NO, which is converted to NO2 by the reaction of NO with O3, the hydroperoxyl radical (HO2), organic peroxy radicals (RO2), and halogen oxides. The oxidation of nitrogen oxides in the atmosphere leads to the formation of several reactive nitrogen species, some of which act as reservoirs for NOx, denoted by NOz1. The NOx lifetime is largely determined by its oxidation into nitric acid (HNO3) by OH during the daytime, and also in polluted air through the heterogeneous loss of N2O5 (formed by NO2+NO3) on wet surfaces at night, e.g. on aerosols and cloud droplets. The tropospheric lifetime of NOx is in the range of hours to days and it is generally shorter closer to the surface of Earth compared to high altitudes (e.g. Ehhalt et al., 1992). Because of its relatively short lifetime, the transport distance of NOx is limited compared to other primary pollutants like carbon monoxide (CO) and methane (CH4) that disperse on hemispheric and global scales.
The wet and dry deposition of HNO3 is considered the major sink for NOx. Uncertainties in the NOx budget have recently been highlighted (Stavrakou et al., 2013). These include the uncertainty in the estimate of the rate coefficient for NO2+OH under tropospheric conditions (Mollner et al., 2010), a lack of proper representation in chemical mechanisms for the loss of NOx via organic nitrate formation (Browne and Cohen, 2012), and the formation of HNO3 in a minor branch of the reaction between NO and HO2 (Butkovskaya et al., 2007), which showed significant impacts on the concentrations of NOx, OH, HNO3, and related chemistry (Cariolle et al., 2008; Gottschaldt et al., 2013). Additionally, a lack of agreement between modelled and measured OH concentrations over forests (Lelieveld et al., 2008; Kubistin et al., 2010) and urban regions (Hofzumahaus et al., 2009) contribute to the uncertainty in NOx chemistry. In summary, NOx, even in the low ppt range is important for understanding the tropospheric O3 production (Lelieveld and Crutzen, 1990; Carpenter et al., 1997) and the cycling of radicals (Monks, 2005). Therefore, it is of great importance to have accurate NOx measurements from regional to global scales.
Tropospheric mixing ratios of NOx can vary from a few ppt to hundreds of ppb, depending on remote (Hosaynali Beygi et al., 2011) and urban conditions (Clapp and Jenkin, 2001). The high temporal and spatial variability of NOx with the wide concentration ranges challenges its measurements. Briefly, several different methods have been used to measure NOx in the atmosphere. The photofragmentation two-photon laser-induced fluorescence (PF-TP-LIF) (Sandholm et al., 1990; Bradshaw et al., 1999) and chemiluminescence (Fontijn et al., 1970) methods are well known for direct in situ NO detection. In the past, an indirect detection of NO2 with these techniques has been performed by converting NO2→NO via photolytic/catalytic process followed by NO detection. However, in the case of NO2 to NO conversion, a potential interference from NOz species cannot be fully excluded for the NO2 measurement, (e.g. Crawford et al., 1996; Villena et al., 2012; Reed et al., 2016). Therefore, a direct detection of NO2 is advantageous. Techniques like cavity ring-down absorption spectroscopy (Osthoff et al., 2006), tunable diode laser absorption spectroscopy (Herndon et al., 2004), cavity-enhanced absorption spectroscopy (Wojtas et al., 2007), cavity-enhanced differential optical absorption spectroscopy (Platt et al., 2009), and cavity attenuated phase shift spectroscopy (Ge et al., 2013) provide direct in situ detection of NO2. Another promising method for direct NO2 detection is based on the laser-induced fluorescence technique. The LIF method for NO2 provides highly selective and sensitive measurements and it has already been demonstrated successfully in the past with detection limits reaching down to about 5 ppt min−1 (Thornton et al., 2000; Matsumoto and Kajii, 2003).
An overview of LIF NO2 systems from the literature is given in Table 1. LIF systems have been used for many years but the detection limits are sometimes not suitable for detection in a remote region, especially in some of the earlier attempts (George and Obrien, 1991; Fong and Brune, 1997; Matsumoto et al., 2001; Taketani et al., 2007). In the last decade, owing to the advancements in lasers, better detection limits have been achieved. The LIF systems have shown good selectivity and sensitivity (Thornton et al., 2000; Matsumi et al., 2001; Matsumoto and Kajii, 2003; Dari-Salisburgo et al., 2009; Di Carlo et al., 2013), but most of these systems have large (typically >50 kg) and complex laser systems. The availability of much smaller and lighter diode lasers have made it possible to build compact instruments with the caveat of lower laser power and higher detection limits. Here, for GANDALF, a high power, lightweight diode laser (<2 kg) system is used to achieve a compact design with detection limits comparable to those of the best-performing larger instruments.
Table 1Overview of different LIF instruments.

(E) Effective absorption cross section. (C) Cooling enhancement.
(A) Ambient pressure in the detection cell.
Laser type (column 2):
a Nd: YAG laser. b Copper vapour laser-pumped dye laser. c Pulsed
YAG-pumped dye laser. d Optical parametric oscillator laser. e Nd:YLF
laser harmonic. f External-cavity tunable diode laser. g Nd:YVO4
pulse laser pumped by a solid-state laser.
h GaN-based laser diode. i Diode-pumped Nd:YAG laser. j CW
GaN semiconductor laser diode. k YAG Q-switched intra-cavity doubled
laser. l YAG Laser (Nd:YVO4 pulse laser). m CW diode laser.
In the following, the newly developed LIF instrument is described for the direct NO2 detection. Results from the first field deployment in a semi-rural region are reported to demonstrate the performance of the instrument. Measurements of trace gases along with meteorological parameters were carried out during the campaign, including NO2 measurements based on several techniques, namely LIF, cavity ring-down absorption spectroscopy, two-channel chemiluminescence detection, cavity-enhanced differential optical absorption spectroscopy, and long-path differential optical absorption spectroscopy. Being the first deployment of GANDALF, this opportunity provided the means for a detailed comparison to other methods under real atmospheric conditions.
2.1 The operational method
The measurements of GANDALF are based on laser-induced fluorescence at low pressure (<10 hPa). The NO2 molecule is excited by a diode laser with a wavelength well above the photolysis threshold (λ>420 nm for NO2) and the red-shifted fluorescence is detected during laser-off periods.
The NO2 fluorescence has a broad spectrum. It starts at the excitation wavelength and extends into the infrared region (Wehry, 1976). However, the major fraction of the fluorescence still lies in the visible region (Sakurai and Broida, 1969; Sugimoto et al., 1982). The detected fluorescence hυ′ is directly proportional to the amount of NO2 in the cell. The background signal due to scattering and dark counts of the detector is determined by frequently measuring zero air (zero NO2). The atmospheric mixing ratios of NO2 are derived by using Eq. (1).
where “signal” is in counts s−1 and αc is the calibration factor or sensitivity in . αc is derived from the slope of counts vs. known amounts of NO2. SBG is the background signal in counts s−1. The quality of zero air is further discussed in Sect. 3.
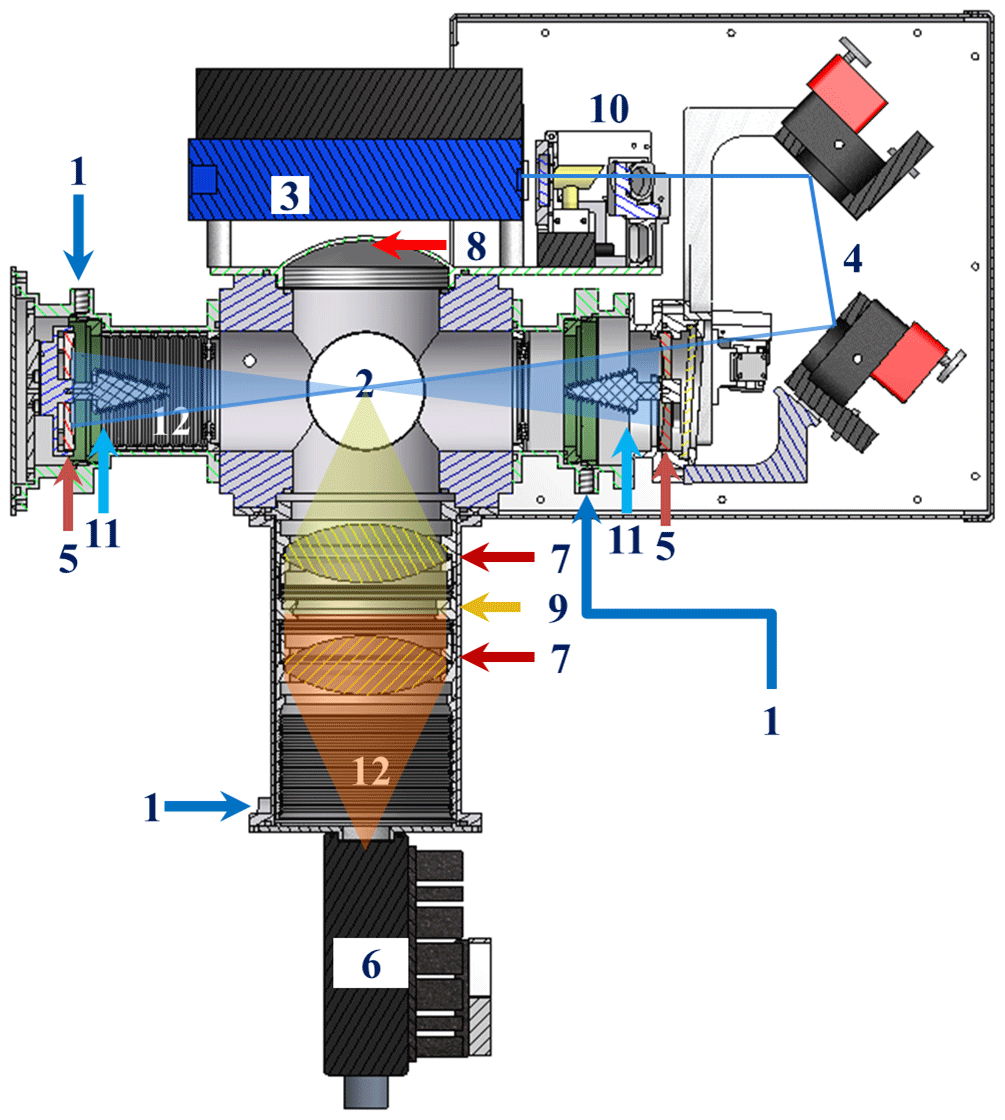
Figure 1Section view of GANDALF (section view is based on Inventor 2009. The figure is created by defining a plane used to cut through the whole assembly. 3-D AutoCAD models (1) for the diode laser by courtesy of Omicron Laserage Laserprodukte GmbH and (2) for optical mirror holders by courtesy of Newport). (1) Flushing for optics. (2) Detection area. (3) Diode laser. (4) Motorized mirrors; (5) Herriott cell's mirrors. (6) PMT. (7) Focusing lens. (8) Concave mirror. (9) Interference/optical filters. (10) Optical reference system. (11) and (12) Baffles.
The mechanical and optical parts of the LIF detection axis are presented schematically in Fig. 1. All mechanical parts inside GANDALF are black anodized and most optical components are continuously flush with zero air/nitrogen (3×50 sccm) (Fig. 1, no. 1) during the period of operation to avoid dead air pockets, fog, dust, etc. The inlet for the sampling flow line is a small orifice with a diameter of 0.7 mm. The distance from the point of entrance at the orifice to the centre of the detection cell (Fig. 1, no. 2) is about 150 mm. This combination of orifice size and scroll pump provides a pressure of 7 hPa inside the detection cell, with a sampling flow of about 4100 sccm. The time required for air molecules from the point of entrance to reach the centre of the detection cell is less than 30 ms. The diode laser2 (Fig. 1, no. 3) in this system has a maximum output power of 250 mW with an on–off modulation frequency of 5 MHz. The wavelength (λ) of the diode laser is in the range of 447→450 nm. The convolution of the laser profile and the NO2 absorption cross section (Vandaele et al., 2002) yields an effective NO2 absorption cross section of cm2 molecule−1. The laser beam is directed into the detection cell by using motorized mirrors (Fig. 1, no. 4). These mirrors are coated to achieve high reflectivity (99.8 %) for a light incidence at 45∘ with a wavelength of 450 nm. A Herriot cell (Herriott et al., 1964) is used to produce multiple passes to enhance the laser light and focus at the centre of the detection cell. The detection cell of GANDALF is positioned between the Herriott cell mirrors (Fig. 1, no. 5), which have approximately 99.99 % reflectivity (IBS coating; ATFilms (IBS coating), USA) in the spectral range of 445 to 455 nm. The distance between the mirrors is twice their radius of curvature (R=128 mm). Any fluorescent contaminants from the mirrors are measured as a part of the background signal. The multi-passed laser beam encompass a circle of about 8–10 mm diameter at the centre of the detection cell. A photomultiplier tube3 (PMT) is used for the fluorescence detection. The PMT is located in a tube (Fig. 1, no. 6) perpendicular to the sampling flow line. The effective sensor area of the PMT is 5 mm in diameter and has a GaAsP∕GaAs photocathode (Radiant sensitivity of 87.4 mA W−1). The PMT is sensitive to wavelengths between 380 nm and 890 nm, with peak sensitivity at 800 nm with a maximum quantum efficiency of 12 %. The fluorescence signal is focused onto the PMT by collimating lenses (Fig. 1, no. 7). An aluminium concave mirror (Fig. 1, no. 8) located opposite the PMT redirects additional fluorescence photons towards the detector. In front of the PMT, interference filters (Barr Associates, Inc., USA) (Fig. 1, no. 9) are used to remove contributions of light scattered from the walls of the sampling chamber, as well as from Rayleigh and Raman scattering. The filters have the cut-off wavelengths (block radiation below this wavelength) of 470 and 550 nm, with an average transmission of 98 % in the spectral range from cut-off wavelength +3 to 900 nm. The reflectivity of the filters is higher than 99.7 % for the spectral ranges of about 8 nm below the cut-off wavelengths. The filters have a very small (≪1 %) absorption for almost the entirety of the spectral regimes. However on the edge of the photonic stop band (cut-off wavelength) the absorption can be up to 7 % and 4 % for the filters with cut-off wavelengths of 470 and 550 nm. At this positon, the photon density reaches its maximum, which increases the probability of absorption of a photon. If this absorption at about the cut-off wavelength exists, then this can potentially amplify the luminescence. The fluorescence contamination is corrected using the background signal measurements. An optical system (Fig. 1, no. 10) based on photodiodes and a NO2-filled cuvette is installed to monitor the change in the wavelength and power of the diode laser. The stray light in the system is reduced to a minimum by using a combination of baffles. There are different types of baffles (Fig. 1, no. 11 and 12) used in the system to reduce scatter from walls or mirrors. The shape of a baffle surface is based on a zigzag pattern with a 30∘ angle. The sharpened edges of a baffle provide less surface area for the laser light to scatter and have the characteristics of a light trap.
The diode laser has a Deepstar mode, which is used as an advantage for the system. While operating in this mode with the repetition rate of 5 MHz, there is no laser radiation during the off period and the NO2 fluorescence is detected during the laser-off period. To determine the optimum sensitivity as a function of the repetition range, the relative NO2 fluorescence intensities for different on–off cycles was calculated by taking into account key parameters like NO2 absorption cross section, pressure, flow velocity, fluorescence lifetime, and the power of the diode laser. The calculated sensitivity for different laser-on durations is shown in Fig. 2a based on 1 ppb of NO2 as a function of an off-period duration. For a comparison to current operational on–off cycles, three different laser-on periods are shown in Fig. 2a. The best sensitivity of the instrument is achievable by operating the diode laser at 5 MHz, 100 ns on, 100 ns off.
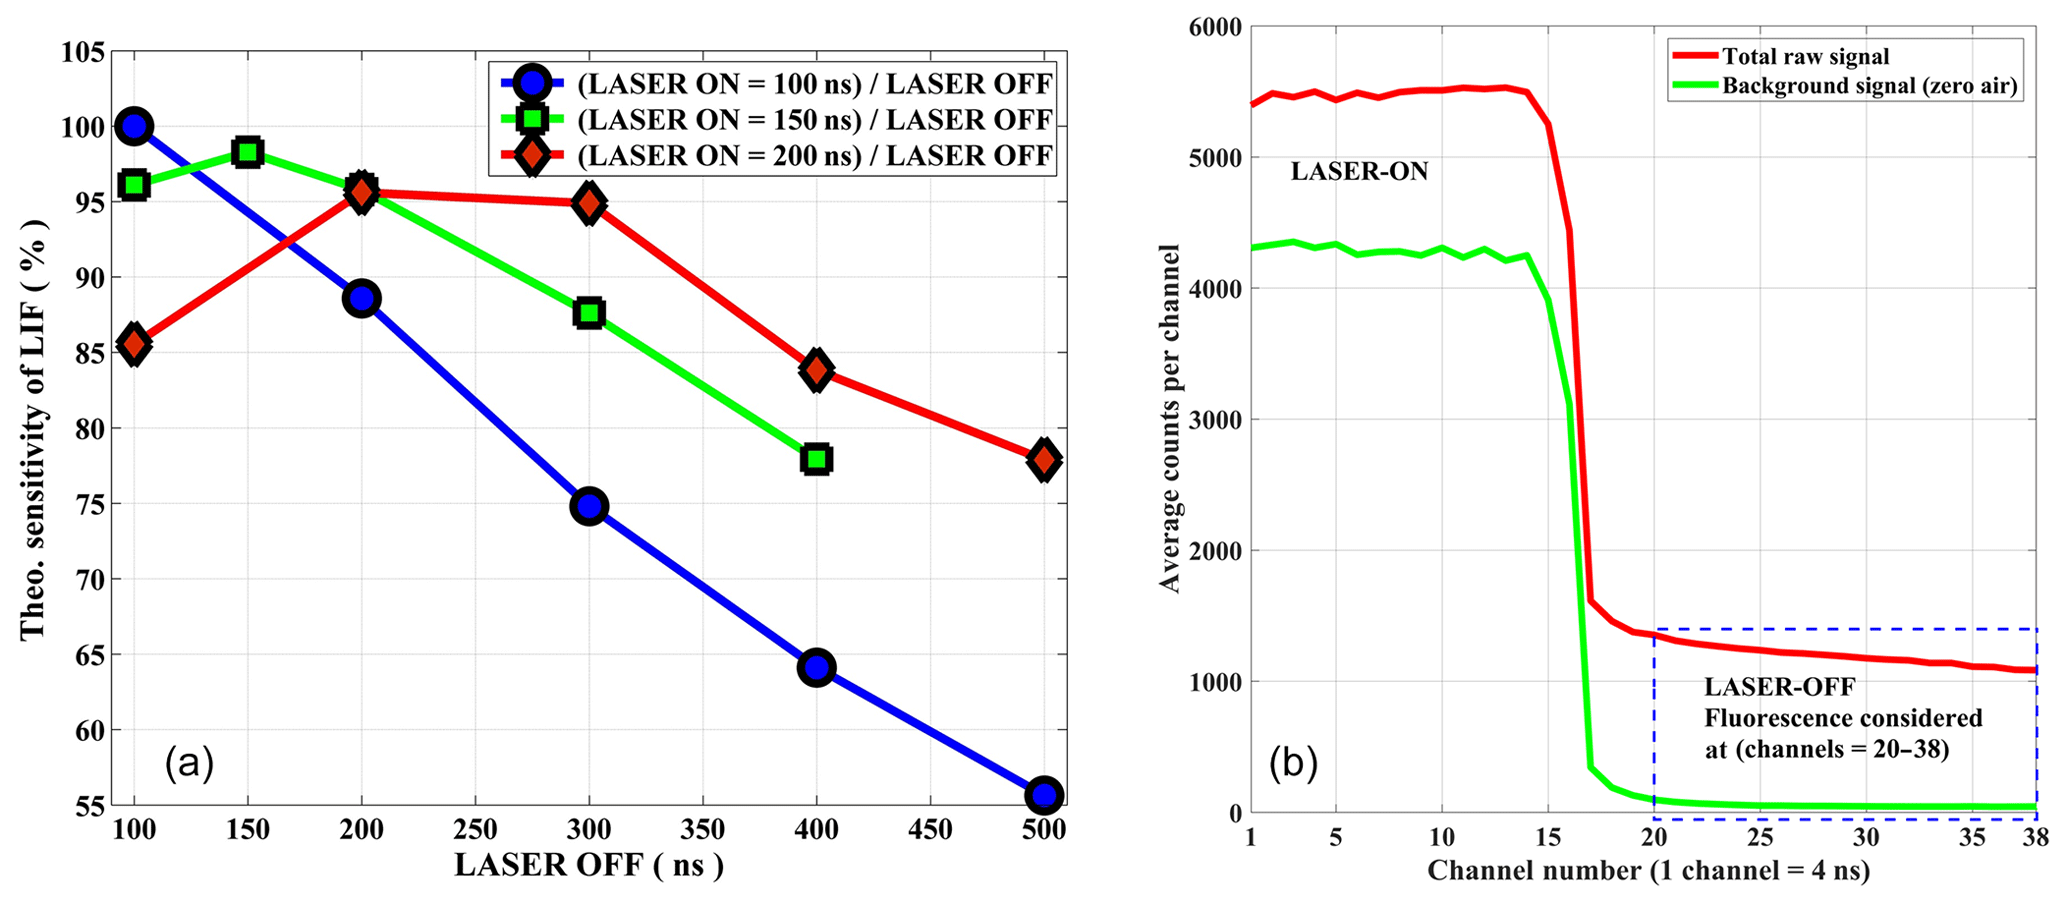
Figure 2(a) Relative sensitivity of the instrument based on the simulation is demonstrated for three different on–off cycles of diode laser operation. (b) On–off cycle of the laser is shown for a signal of about 12 ppb NO2 (y axis arb. unit). The sum of channels (20–38) is considered a fluorescence signal for the data analysis. A schematic of the data acquisition system is provided in the Supplement.
A counter card is used for the data acquisition. There is no need for synchronization as the counter card itself triggers the laser pulse. The timing system is entirely controlled by an FPGA (field programmable gate array), utilizing an external crystal oscillator of 20 MHz nominal frequency with a stability of ±2.5 ppm over the temperature range of −30 to +75 ∘C. All internal frequencies are derived from this clock by means of a PLL (phase-locked loop) in the FPGA. The triggering occurs at a fixed rate of 5 Mhz. The delay caused by the length of the trigger cable (propagation delay of the pulse), the laser power supply unit, propagation delays from detector to FPGA, etc. is compensated with a programmable delay for the data acquisition in the FPGA. Therefore, the FPGA logic recognizes when it should start recording the data after it emitted the trigger pulse and waits the specified amount of programmed clock cycles after emitting the trigger. The time-resolved raw signal (both on–off cycle) are stored in 4 ns bins (4 ns bin=1 channel) for a specified time of integration (typically 1 s). For the total fluorescence signal about 20 of these channels are summed up and used as a signal for NO2. The first five channels or 20 ns of the laser-off period are ignored because these channels still contain some scattered light signals from the laser light and walls of detection cell (Fig. 2b).
The surface temperatures of the PMT and laser are kept at 20 or 25 ∘C (avoiding condensation) by circulating water. This provides the heat sink for the internal thermoelectric cooling of the PMT (@ 0 ∘C) and laser (@ 25 ∘C). The internal cooling is the default setting from the manufacturer. The internal temperature cannot be regulated by external cooling. The external temperature should be in the range of 5–35 ∘C along a sufficient heat exchange system (fan cooling, water circulation, etc.). Moreover, the dark counts on the PMT signal are of the order of <50 counts s−1 for the channels used for the NO2 fluorescence detection. The major reason for the background signal, which is larger than the dark signal typically by a factor >25, is expected to be fluorescence contamination from the Herriot cell mirrors existing in the red region of wavelength. For a stable (parameters like power, wavelength, shape of the beam, etc.) laser operation, an external temperature range is within 15–30 ∘C. This range is sufficient to keep the internal temperature of the laser at 25 ∘C. A laser operation out of the specified range would lead to shut-off or potentially damage the laser.
2.2 Calibration system
The LIF method is not an absolute technique and requires calibration. The sensitivity (Eq. 1) of GANDALF depends on background noise, laser power or wavelength, temperature, pressure, residence time in the sampling line, etc. It is determined using NO2 concentrations generated by gas phase titration of NO to NO2 by means of O3 (Reaction R3) similar to the one described by Ryerson et al. (2000). Using commercial available NO2 gas cylinders at low concentrations (Thornton et al., 2000; Dari-Salisburgo et al., 2009) was not chosen due to open questions with its long-term stability at low concentration. The calibration system is described in the following sections.
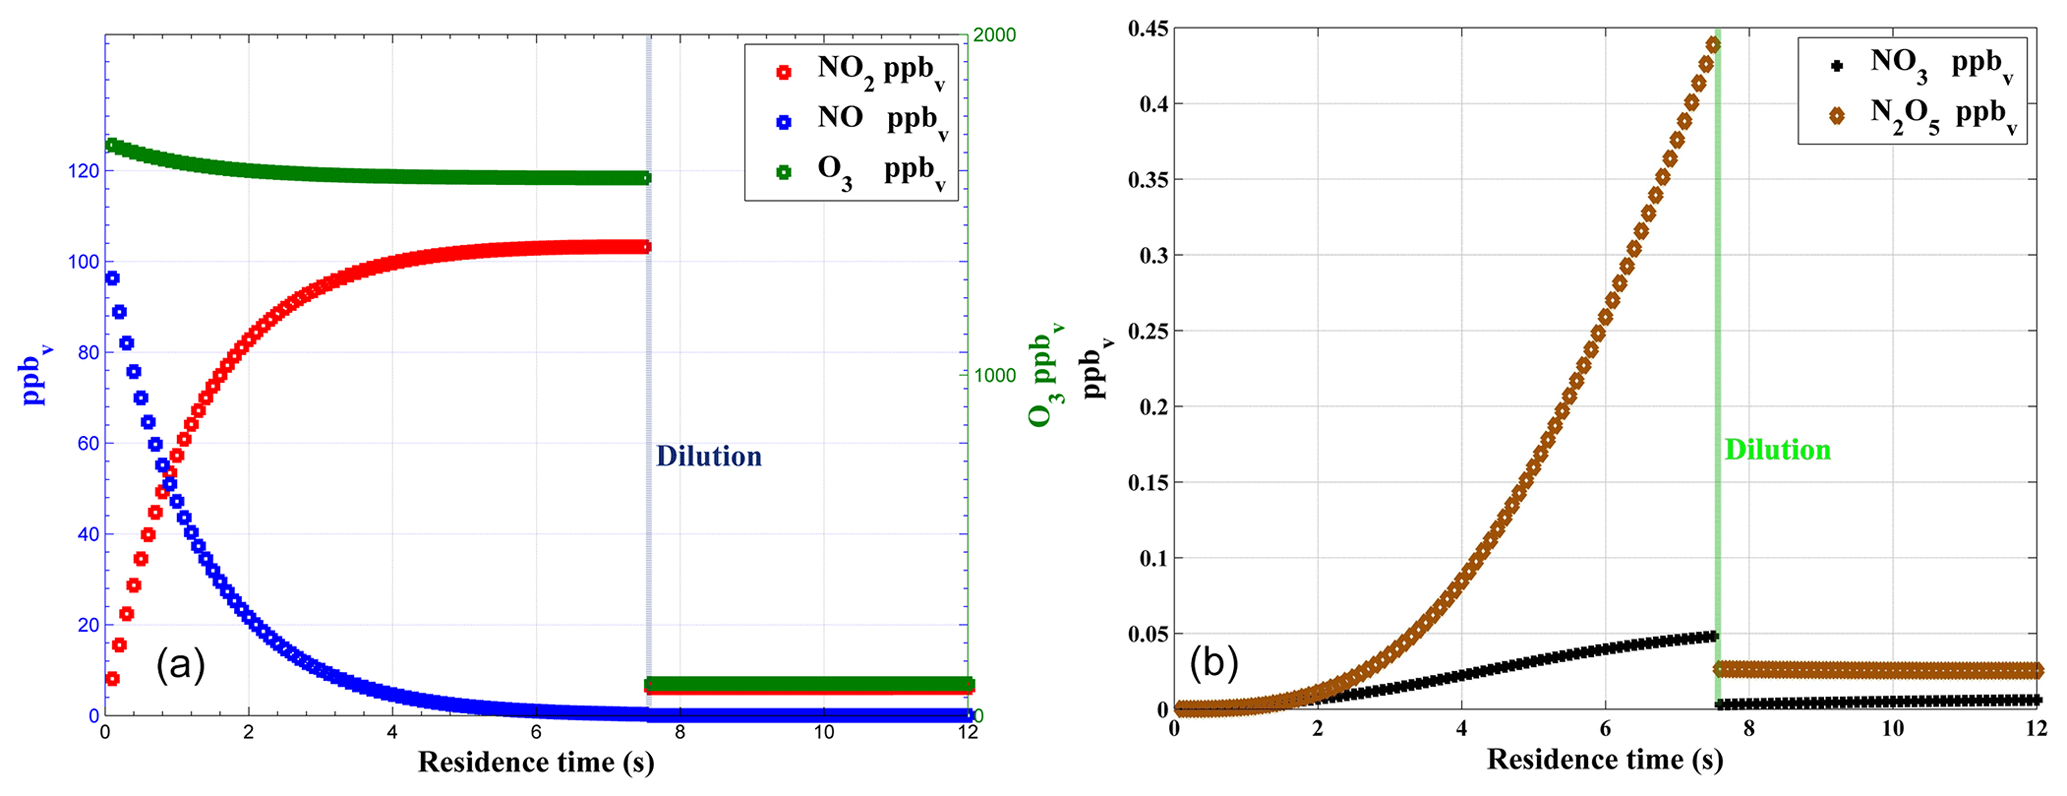
Figure 3Box model simulation of gas phase titration of NO and O3 (a) with loss of NO2 due to the formation of NO3 and N2O5 (b).
The NO calibration mixture for the gas phase titration is traceable to a primary NIST (National Institute of Standards and Technology, USA) standard (4.91±0.04 µmol mol−1 in nitrogen). The overall uncertainty in the NO calibration mixture is 2 %. NO is almost completely (>98 %) consumed during gas phase titration with O3 in the calibrator. This is achieved by using a high concentration (>1.4 ppm) of O3. NO2 also reacts with O3 to form NO3 (Reaction R4). The reaction of NO2 with O3 (Reaction R4) is slower by 3 orders of magnitude compared to the reaction of NO with O3 (Reaction R3), with a reaction rate of compared to at 298 K (Atkinson et al., 2004). However, at higher concentrations and due to the long residence times, the reaction between NO2 and O3 can be important, leading to a loss of NO2 generated in the calibrator with subsequent losses due to further reaction between NO2 and NO3 (Reaction R5).
Numerical simulations are used to assess the optimum set-up for the calibration device by studying the impact of different parameters like concentrations levels, residence time, flow rates, and pressure. Based on box model (BM) simulations and verified by lab experiments, a PFA (perfluoroalkoxy) reaction chamber for the completion of the gas phase titration between NO and O3 has been designed to achieve maximum conversion efficiency for NO→NO2. The BM simulation is shown in Fig. 3 for typical calibration parameters4. The mixing ratios of NO, O3, and NO2 are plotted as a function of residence time in Fig. 3a. This simulation predicts that more than 99 % of NO is converted to NO2 within the residence time of 7.5 s inside the reaction chamber. The formation of NO3 and N2O5 in the reaction chamber is negligible (<0.5 ppb) compared to NO2 (>100 ppb). The formation of NO3 and N2O5 can thus only increase by <1 % uncertainty in the generated NO2 for typical operating conditions of the calibrator. After the reaction chamber, the calibration gas mixture is further diluted with zero air to achieve a required range (close to ambient levels) of NO2 mixing ratios.
The calibration system was tested for different concentrations of O3. Figure 4 shows the NO2 signal of the PMT (after dilution of the calibration gas) based on different O3 mixing ratios in the reaction chamber for a constant NO concentration (about 0.1 ppm). For O3 concentrations below 1 ppm non-stoichiometric conversion of NO was observed as expected. The PMT signal reached a maximum at about 1.356 ppm and this signal is explained by the derived NO2 concentration from the BM simulation. The decrease in the PMT signals at higher O3 concentrations above 1.4 ppm mainly due to loss of NO2 in Reactions (R4) and (R5). The amount of NO2 generated in the NO+O3 titration is much less sensitive to O3 than to NO as losses of NO2 (Reaction R4) are also dependent on O3 for the chosen parameters. If O3 is increased by 1 ppm above the optimum mixing ratio of 1.3 ppm (Fig. 4), NO2 is reduced by only 1 %. The O3 concentrations are always kept above this threshold limit and the concentrations are measured using an O3 analyser (ANSYCO, O3-41M, Analytische Systeme und Componenten GmbH, Germany) with a typical precision of 5 %. Above the threshold, a 5 % change in O3 produces an uncertainty in NO2 of less than 0.5 %.
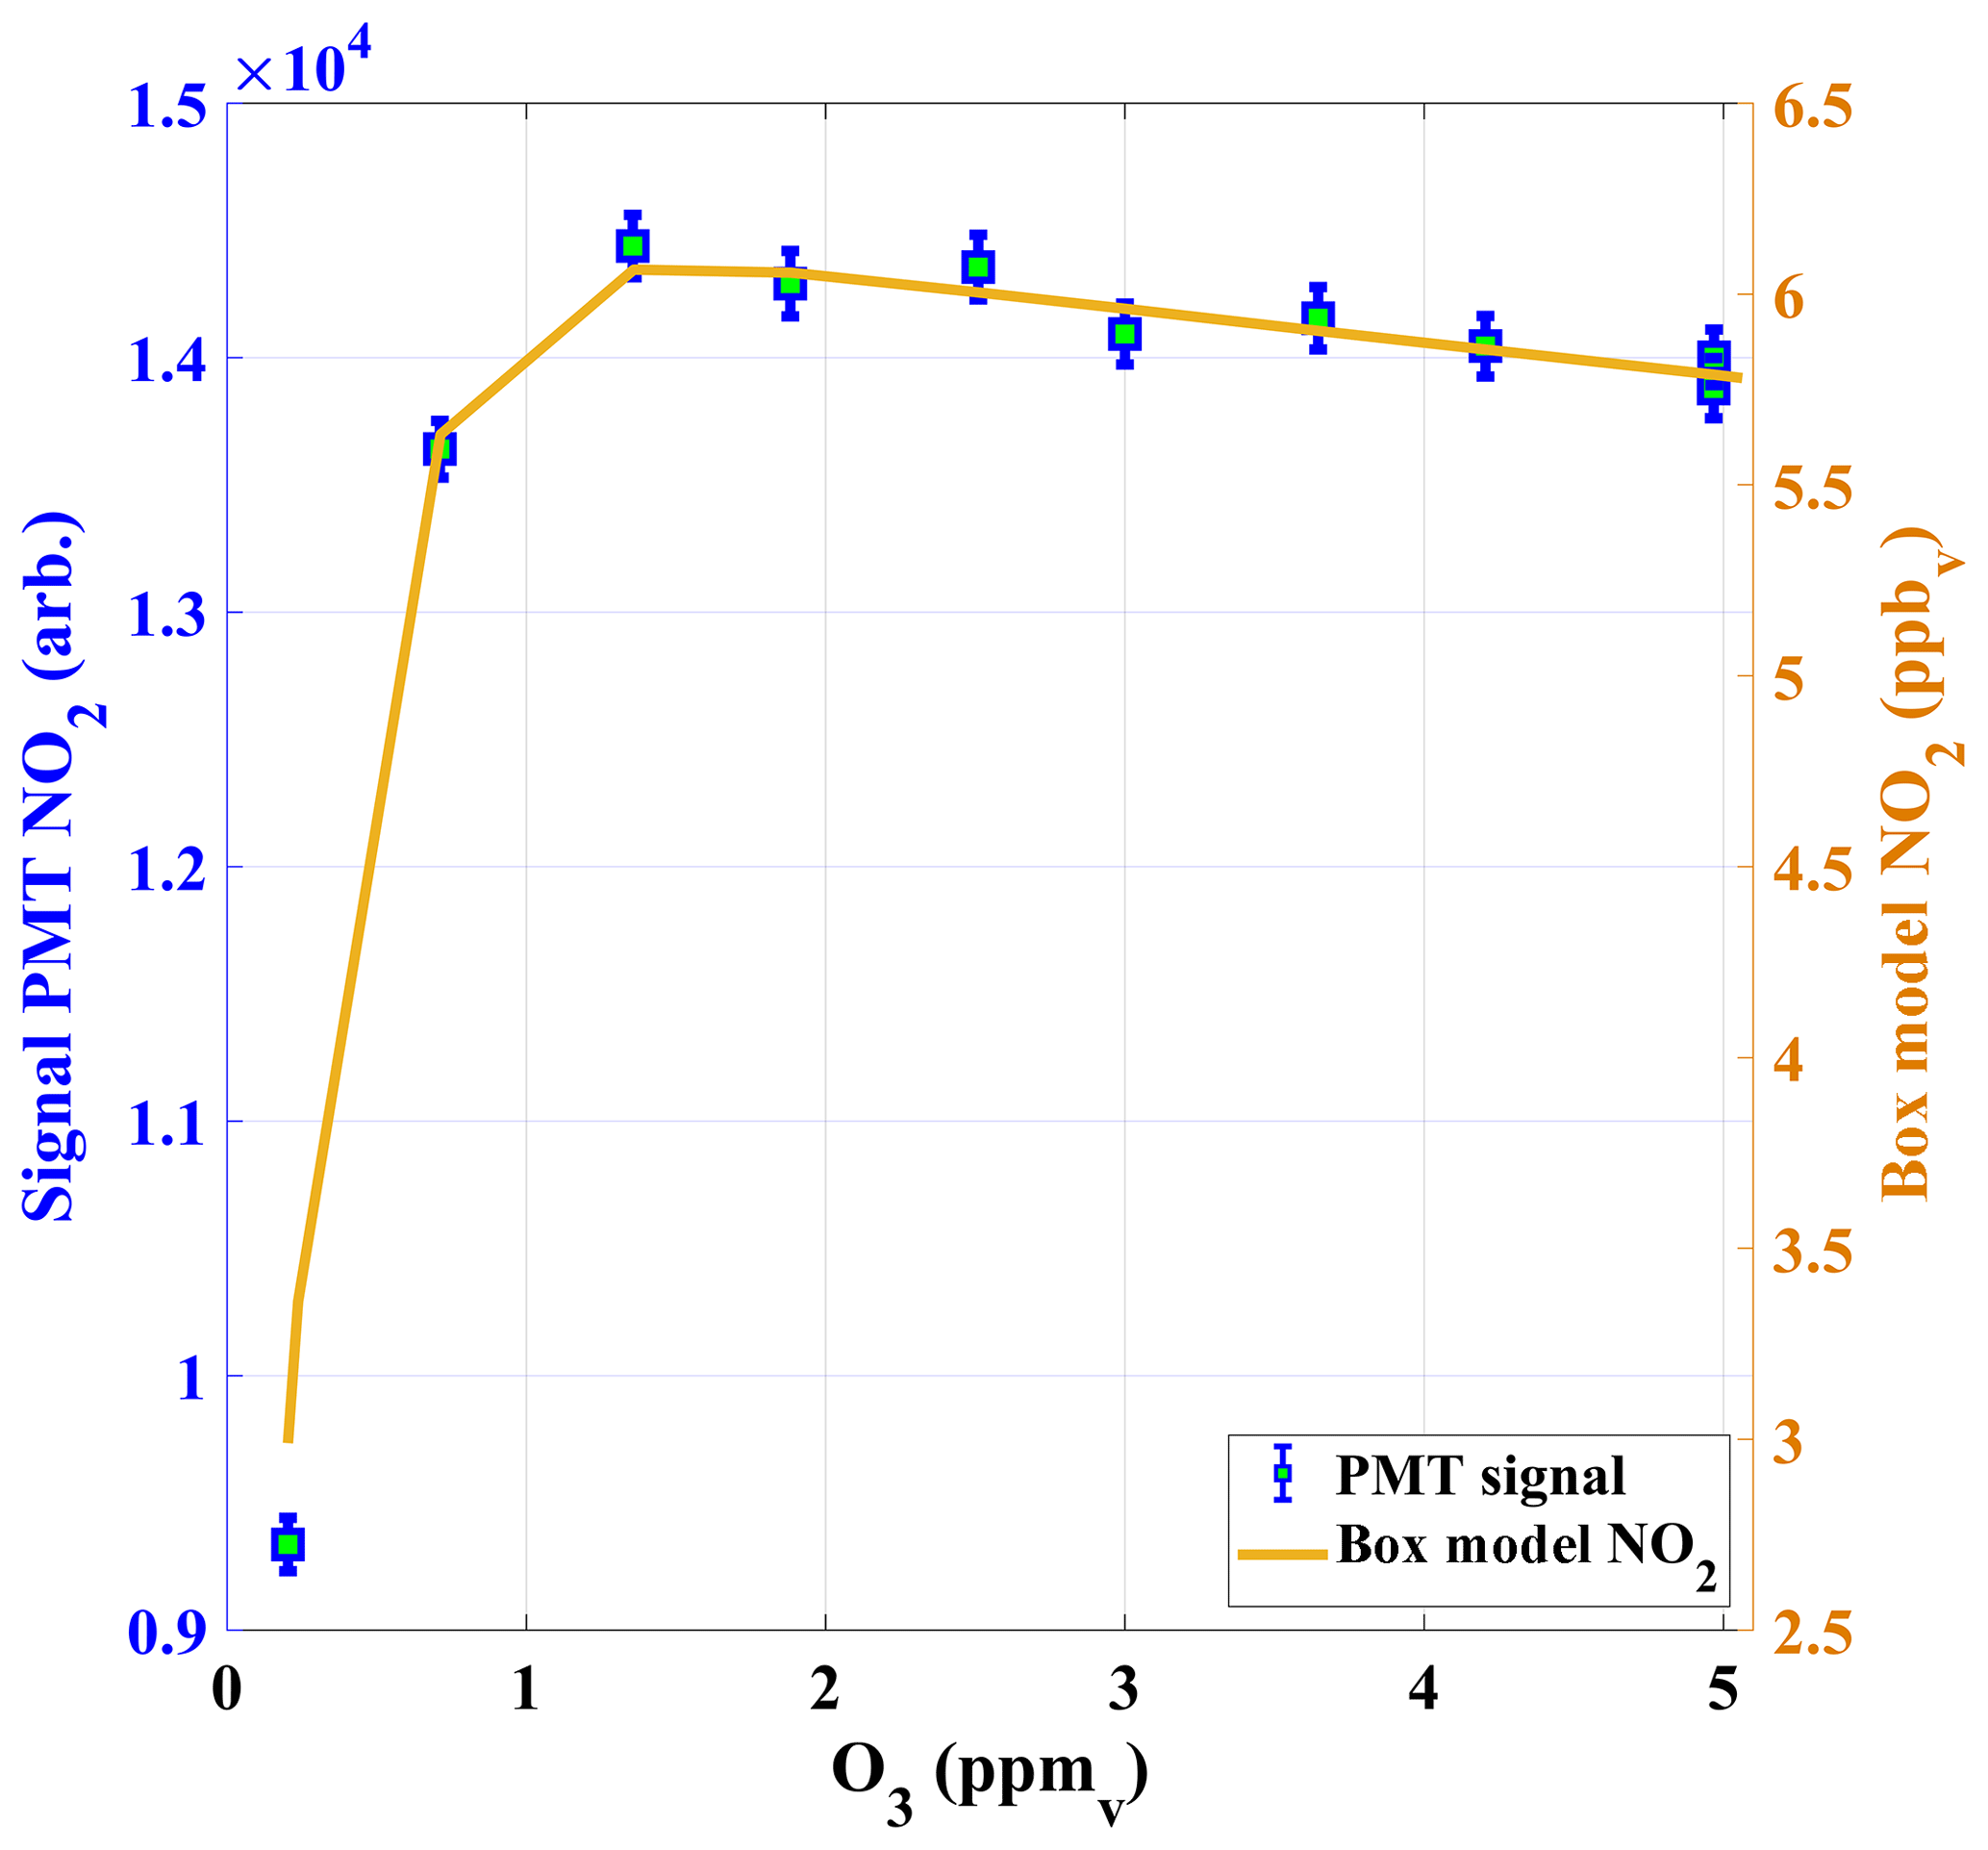
Figure 4The PMT NO2 signals in counts (cts) are shown as a function of O3 concentrations in the calibrator (left y axis), together with NO2 calculated from a box model of the NO2 production in the calibrator (right y axis).
A NOx analyser (model: ECO PHYSICS CLD 780 TR, Switzerland) was used to determine the remaining concentrations of NO inside the calibrator after the gas phase titration. About 99 % of NO is consumed in the gas phase titration for most of the cases at O3>1.4 ppm. There are two different regimes in the calibration system based on different NO and O3 concentrations and different flow rates: (1) gas phase titration in the reaction chamber and (2) dilution with zero air after the reaction chamber. Considering the flow rates and dimensions of the gas lines, the theoretically calculated total residence time based on the plug flow assumption is 7.73 s. The total residence time for the calibration gas in the calibration system is also determined experimentally by using Eq. (3).
In Eq. (3), NOGPT is measured with the NOx analyser and is defined as the NO concentration remaining in the calibration gas after the gas phase titration and dilution. [NOi] is the initial concentration of NO before the gas phase titration. D is the dilution factor after the reaction chamber. t1 is the residence time for the reaction chamber and t2 is the dilution-dependent travel time for a NO2 molecule from the exit of the reaction chamber to the inlet of GANDALF. [O3] in Eq. (3) is the concentration in the reaction chamber. k(R3) is the temperature-dependent rate coefficient for Reaction (R3). There are two slightly different (<6 % based on rate constant at 298 K) values reported in the literature for the temperature-dependent k(R3) as follows:
Based on Eq. (3), the average value of total residence time [t1+Dt2] is 7.32±0.25 s (Sander et al., 2011) or 8.38±0.29 s (Atkinson et al., 2004) as shown in Fig. 5. The estimated accuracy of these two values for the total residence time is 6.5 % (1σ).
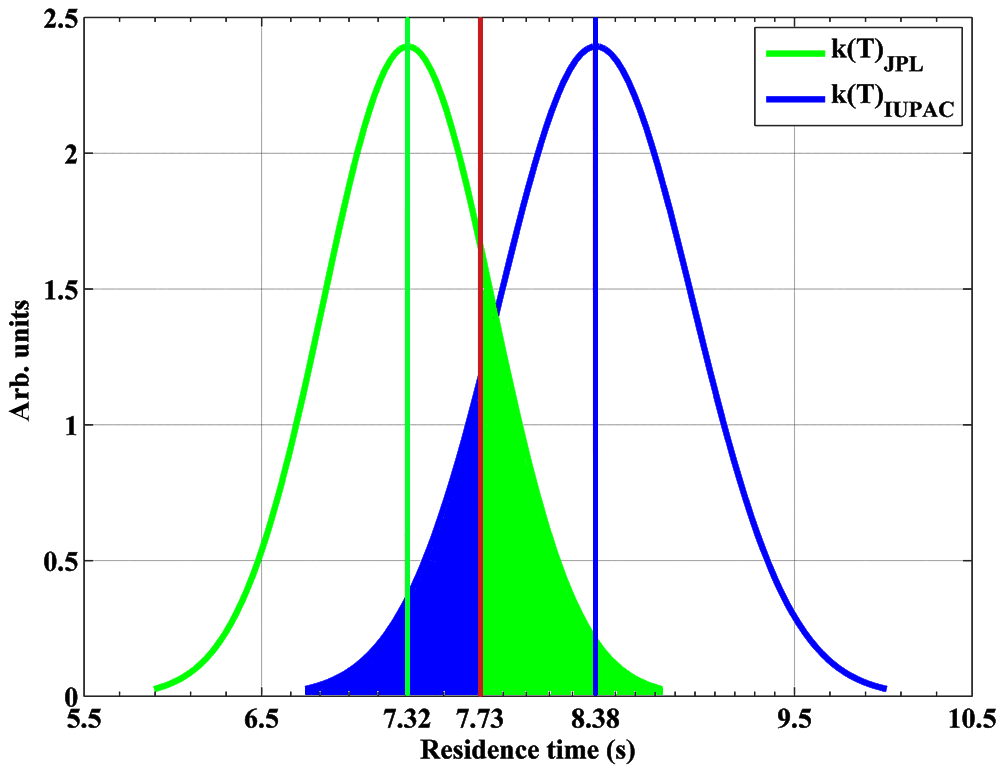
Figure 5Residence time for NO2 calibration gas in the calibrator based on Eq. (3). Also, theoretically calculated residence time (7.73 s) is shown (red line). The likelihoods (green or blue shaded areas) of residence times based on the JPL or IUPAC rate constant for being accurate are indistinguishable in comparison to the theoretically calculated residence time.
The temperature and pressure also affect the formation of NO2 inside the reaction chamber, and these effects were tested with the box model. In the simulations all parameters except temperature or pressure are kept constant. At a lower temperature the reaction between NO and O3 slows down, leading to changes in the conversion efficiency from NO to NO2. This can potentially lead to a change in the conversion efficiency from NO to NO2. In our case, many electrical parts (electronic valves, ozone generator, and mass flow controllers) are installed inside the calibration unit. In a fully operational mode for 1 day, the temperature build-up in the calibration unit is 8–10 ∘C higher than ambient temperatures. From our experience and observations, conditions with temperatures lower than 20 ∘C do not occur inside the calibrator. According to the box model simulations temperature variations within 5–45 ∘C lead to an overall relative uncertainty of 1 % (1σ) for the whole range. Similarly, the impact on the calibration gas due to a change in the atmospheric pressure is not significant. Based on the box model simulations, the relative uncertainty in the NO2 concentration of calibration gas is below 0.5 % (1σ due to a change in the atmospheric pressure over an interval of 800–1013 hPa).
The calibration gas for GANDALF primarily contains N2 (∼79.5 %) and O2 (∼20.5 %) with H2O vapour (<25 ppm). The level of H2O vapour in the atmosphere can reach up to about 3 % (Seinfeld and Pandis, 2006). The sensitivity of the instrument is reduced by atmospheric H2O vapour because collisions with H2O molecules quench the NO2 fluorescence. The H2O dependency is evaluated experimentally by diluting the calibration gas with known amounts of water vapour concentrations and its effect on sensitivity during field measurements is corrected by using simultaneous measurements of H2O vapour in the atmosphere. The H2O concentrations during calibration are determined using an existing calibration system for the LIF-OH instrument (Martinez et al., 2010). The decrease (relative to <25 ppm of water vapour) in the sensitivity for GANDALF is 5 %±1 % (1σ) at 1 % of atmospheric H2O vapour.
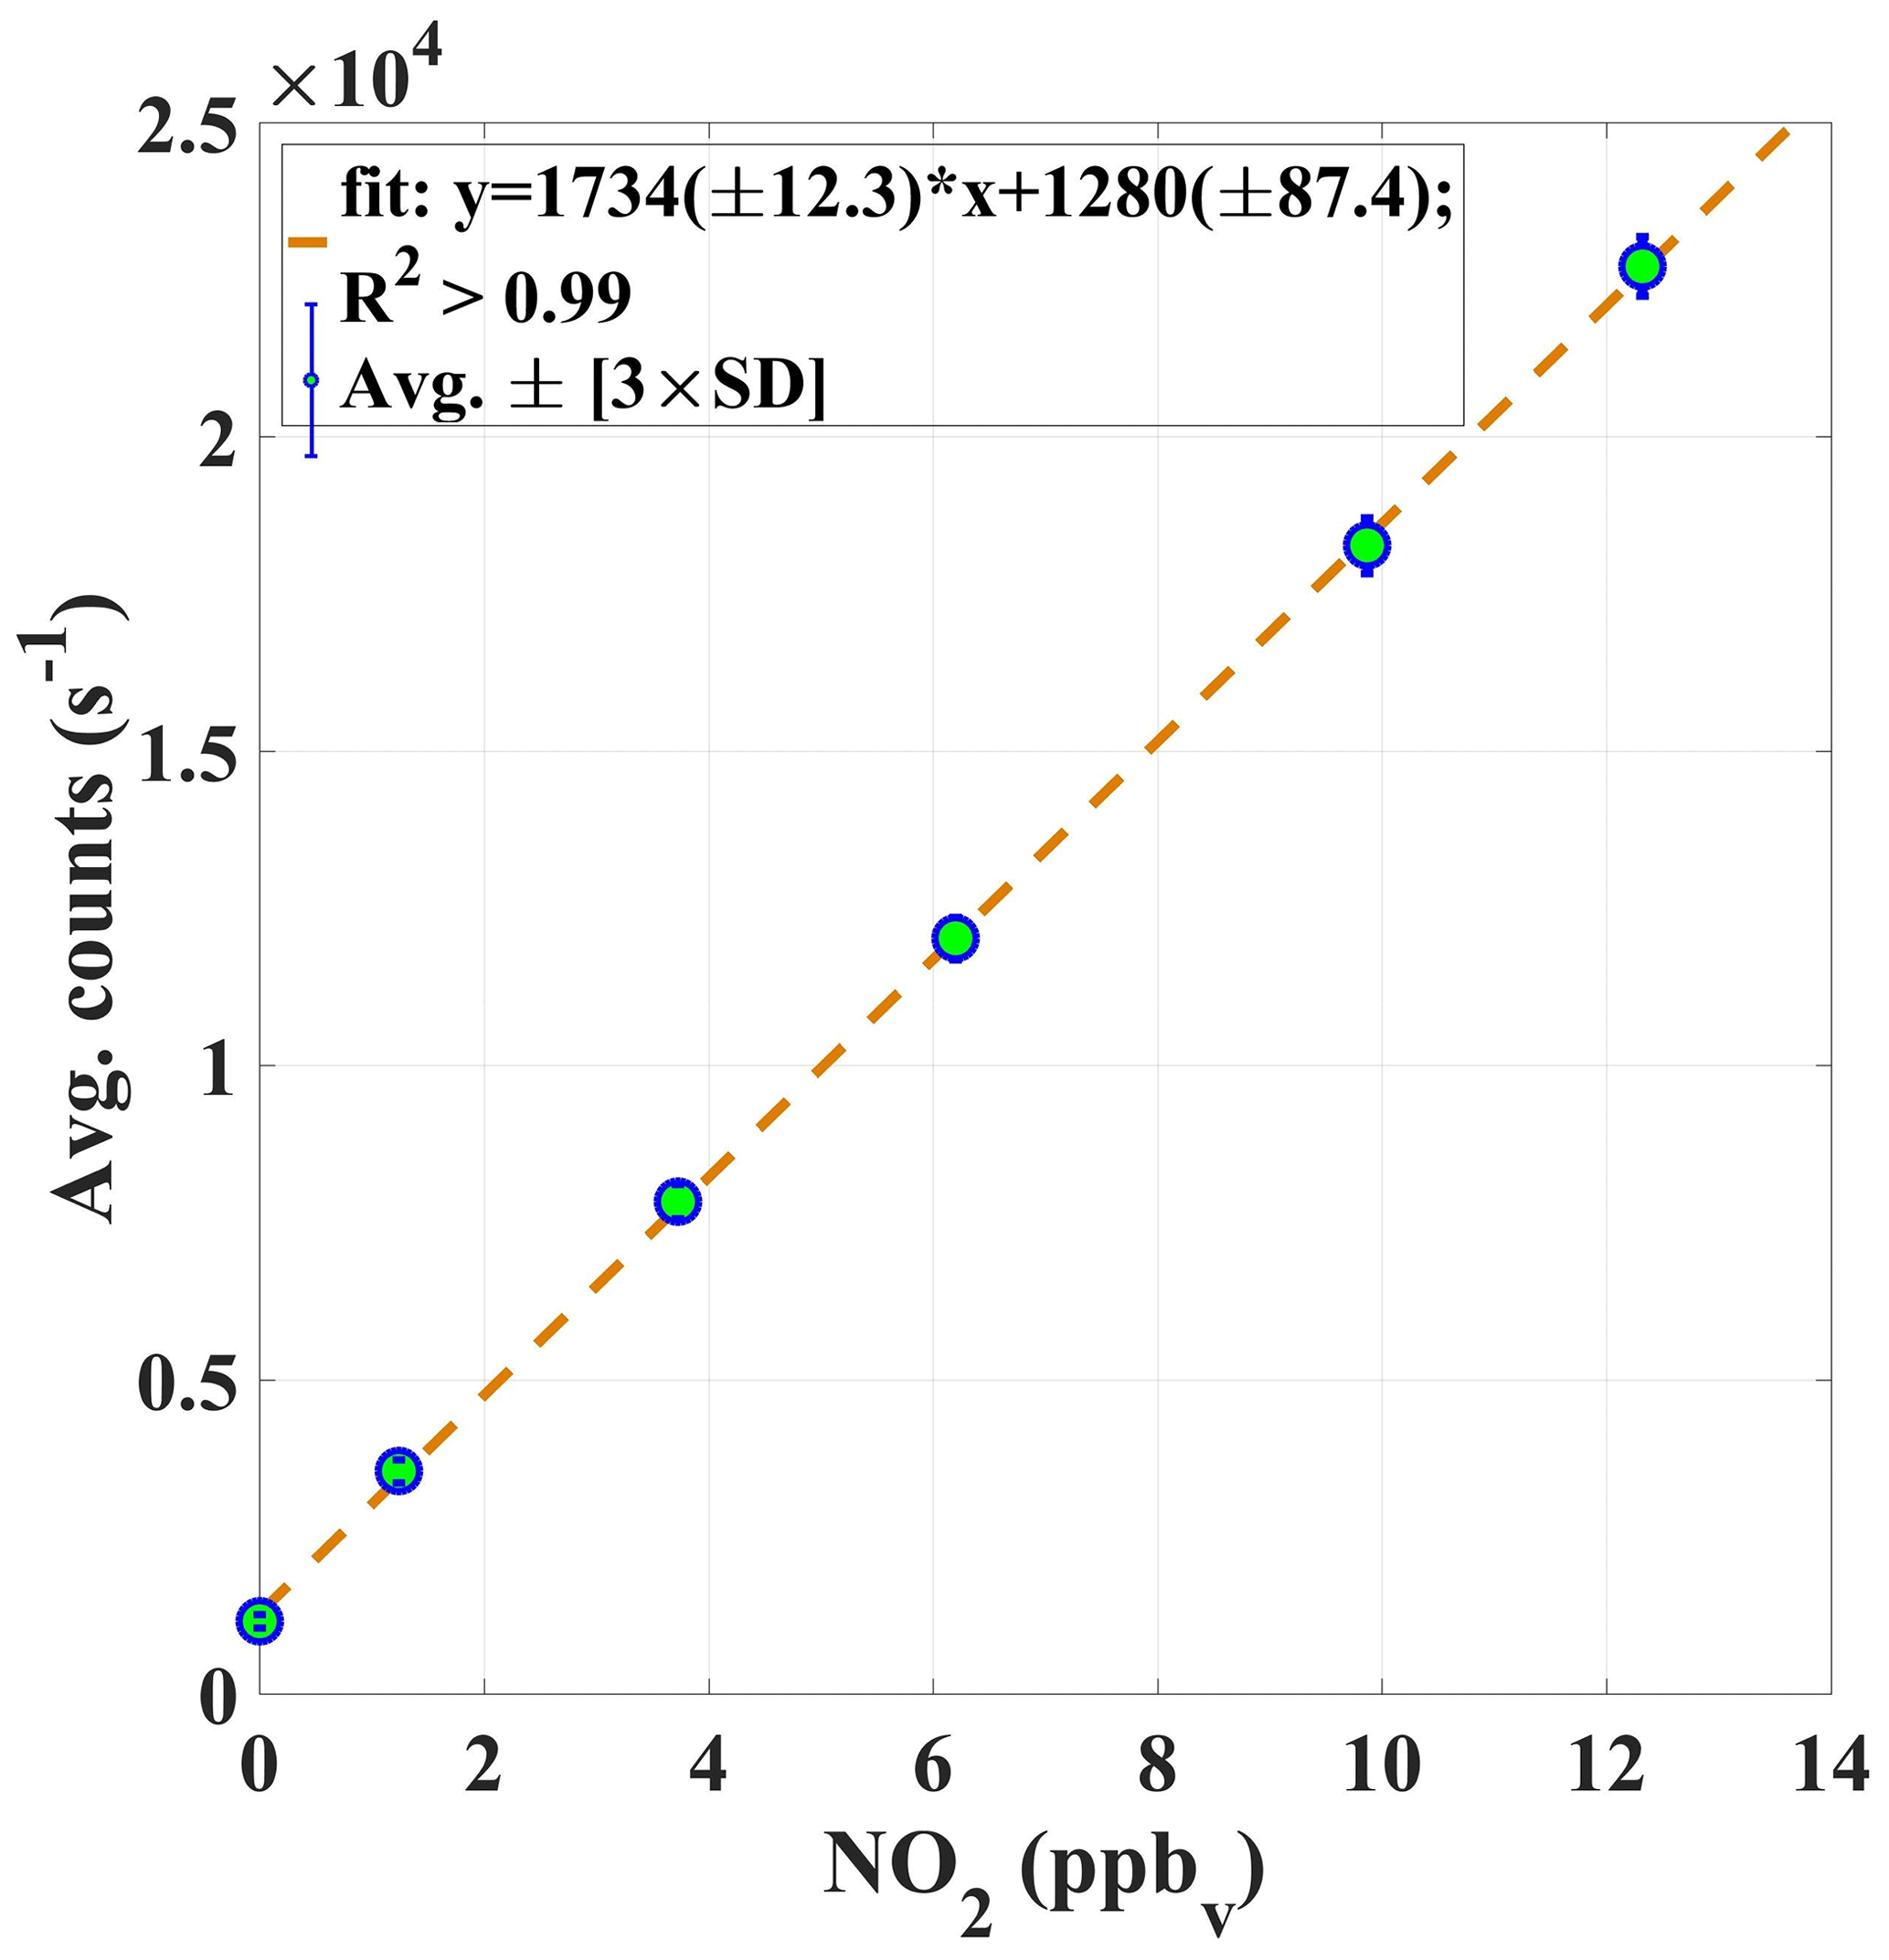
Figure 6An example of the average PMT signal in counts (s−1) vs. known mixing ratios of NO2. The calibration constant αc (Eq. 1) is given by the slope of the curve.
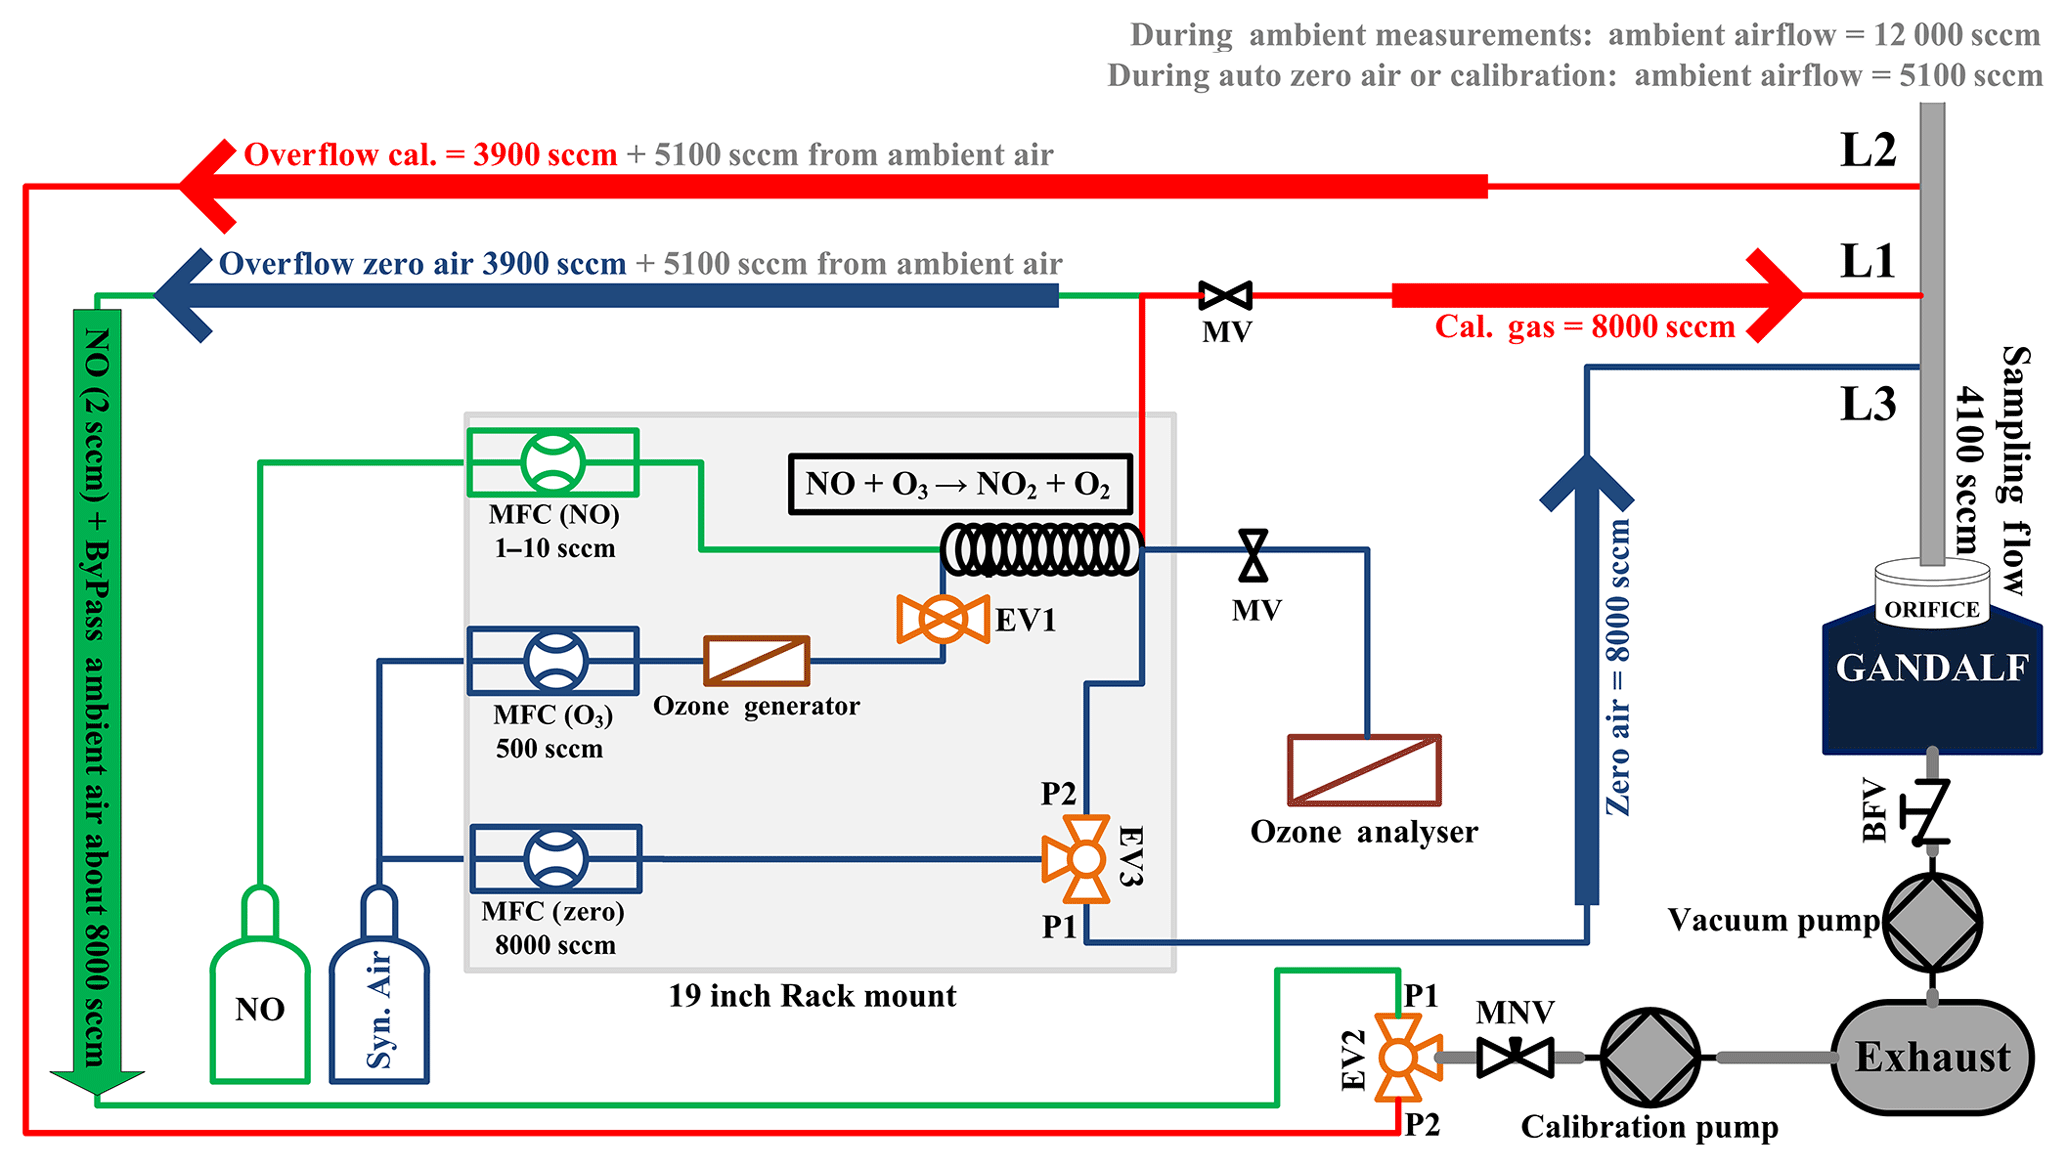
A robust calibration system has been developed for the automated calibration of the instrument. GANDALF is frequently calibrated (up to 8 times in 24 h) during field operations to track changes in sensitivity. Generally, some factors can contribute to a change in the sensitivity, e.g. stability of the optics alignment, cleanness of the optics, temperature-related effect of electronics, and stability of the calibration signal. An example of a calibration plot is shown in Fig. 6. The calibration system is controlled by mass flow controllers (MFCs; MKS Instruments, USA, and Bronkhorst HIGH-TECH B.V, the Netherlands) and electronic valves (Solenoid Operated Diaphragm, Galtek, USA). All MFCs are calibrated using a DryCal (DC-2, BIOS International Corporation , USA) sensor, which is traceable to a NIST standard (NIST traceability is confirmed by WESTPHAL measurement and control technique GmbH & Co. KG, Germany). The uncertainty in the set flows, based on a certified value, is 1 % (level of confidence 95 %). O3 is generated for the calibration using an ozone generator (SOG2, 185 nm, Ultraviolet Products, USA). Different NO2 mixing ratios are achieved by changing the NO flow (range up to 10 sccm), while the O3 concentration (>1.4 ppm) and flow (500 sccm) are kept constant. Figure 7 shows a schematic of the set-up for the automated calibration procedure of GANDALF. A small pump (calibration pump) is connected to the main sampling line of GANDALF. A three-way electronic valve (EV2) and a manual needle valve (MNV) are attached in front of the calibration pump. To minimize any line effects such as a decomposition of species like PAN, the chemical reaction of the ambient NO and O3, the residence time in the sampling line is kept at less than 0.1 s by a flow ≥10 000 sccm required during ambient air measurements. GANDALF has a flow of 4100 sccm through the pinhole and the rest of the flow is diverted to the main exhaust by the calibration pump. The amount of total sampling flow can be increased or decreased by adjusting the MNV.
During ambient air measurements, valve EV2 is opened for line L1 at the position P1 (Fig. 7) and allows an extra flow of about 8000–9000 sccm to pass from the sampling flow to the calibration pump. Line L1 is simultaneously used to condition the NO calibration line with a flow of 2 sccm NO gas, which goes directly to the exhaust without entering the sampling line. The direction for the conditioning flow along the bypass flow is shown by the green arrow in Fig. 7.
Frequent zero-air measurements are necessary to monitor changes in the background signal of GANDALF. A three-way electronic valve (EV3) and a mass flow controller (MFC zero) are used to switch the zero-air background flow (8000 sccm) on and off in the line L3 (position P1 at EV3 in Fig. 7). During background signal measurements, an excess of zero air about 3900 sccm (blue arrow in Fig. 7) is diverted to the calibration pump through line L1 by setting the valve EV2 to position P1, along with about 5100 sccm flow of ambient air.
During calibration the zero-air flow is switched on (position P2 at EV3 in Fig. 7) and used for dilution of the calibration gas. Line L2 is opened by valve EV2 (position P2 at EV2 in Fig. 7) to remove the calibration gas overflow of 3900 sccm together with 5100 sccm from the ambient (illustrated by the red arrows in Fig. 7). For the gas phase titration, the flow of O3 is switched on and off by the two-way electronic valve EV1 and MFC (O3). The O3 analyser is used to check the concentration of O3 produced by the ozone generator. The flow of NO (1–10 sccm) is controlled by a mass flow controller (MFC (NO) in Fig. 7). Since all overflows are diverted to an exhaust, this set-up allows frequent checks of the GANDALF sensitivity and background signal without disturbing the ambient conditions for a nearby operating instrument. Based on calibrations during PARADE 2011, the repeatability of the sensitivity was 2.7 % (1σ), with an overall uncertainty in the calibration system of approx. 5 % (1σ).
2.3 Precision and limit of detection
The precision of the instrument was evaluated using a set of randomly chosen PMT signals (in s−1 time resolution) during calibration periods from the field experiment (PARADE 2011). The relative precision was calculated based on the standard deviation of the PMT NO2 signal for different NO2 concentrations. The relative precision of GANDALF is shown in Fig. 8 as a function of NO2 mixing ratios. It was better than 0.5 % (1σ min−1) for most of the dataset at >1 ppb of NO2. For an overall precision of GANDALF (especially at lower levels <1 ppb), an absolute value of about 3 ppt (1σ) has to be added to the relative precision. This absolute value arises from the variations in the zero-air signal. The standard deviation of the PMT signals at different NO2 concentrations can be extrapolated to zero for determination of the precision at background levels. It can also be calculated from the standard deviation of the zero-air signal. The approaches give similar results of about 3 ppt (1σ) precision for our instrument.
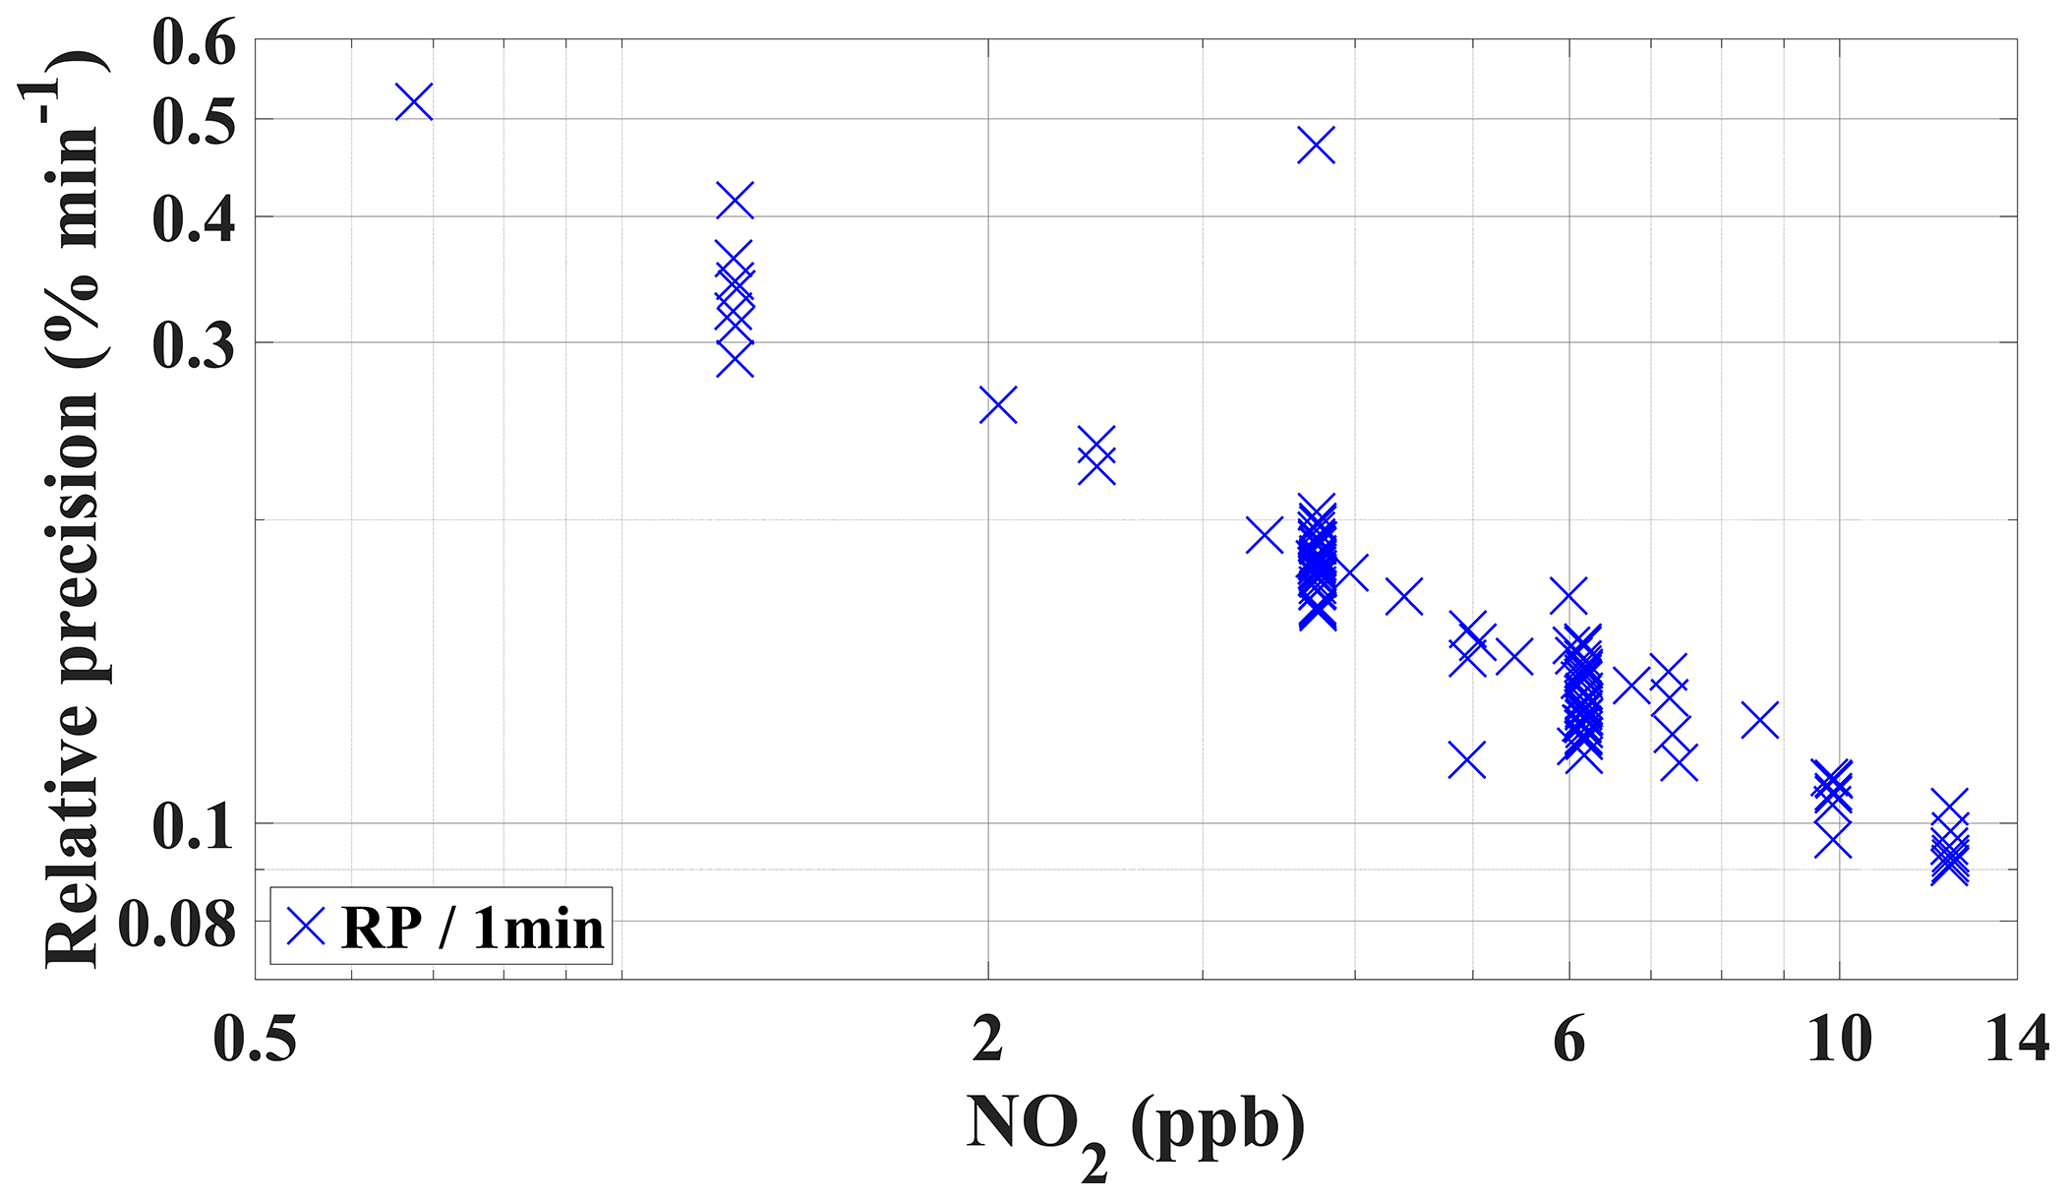
Figure 8The relative 1 min precision of GANDALF is shown for PARADE 2011 as a function of NO2 mixing ratios. The relative precision is calculated from randomly selected PMT signals during different calibration periods.
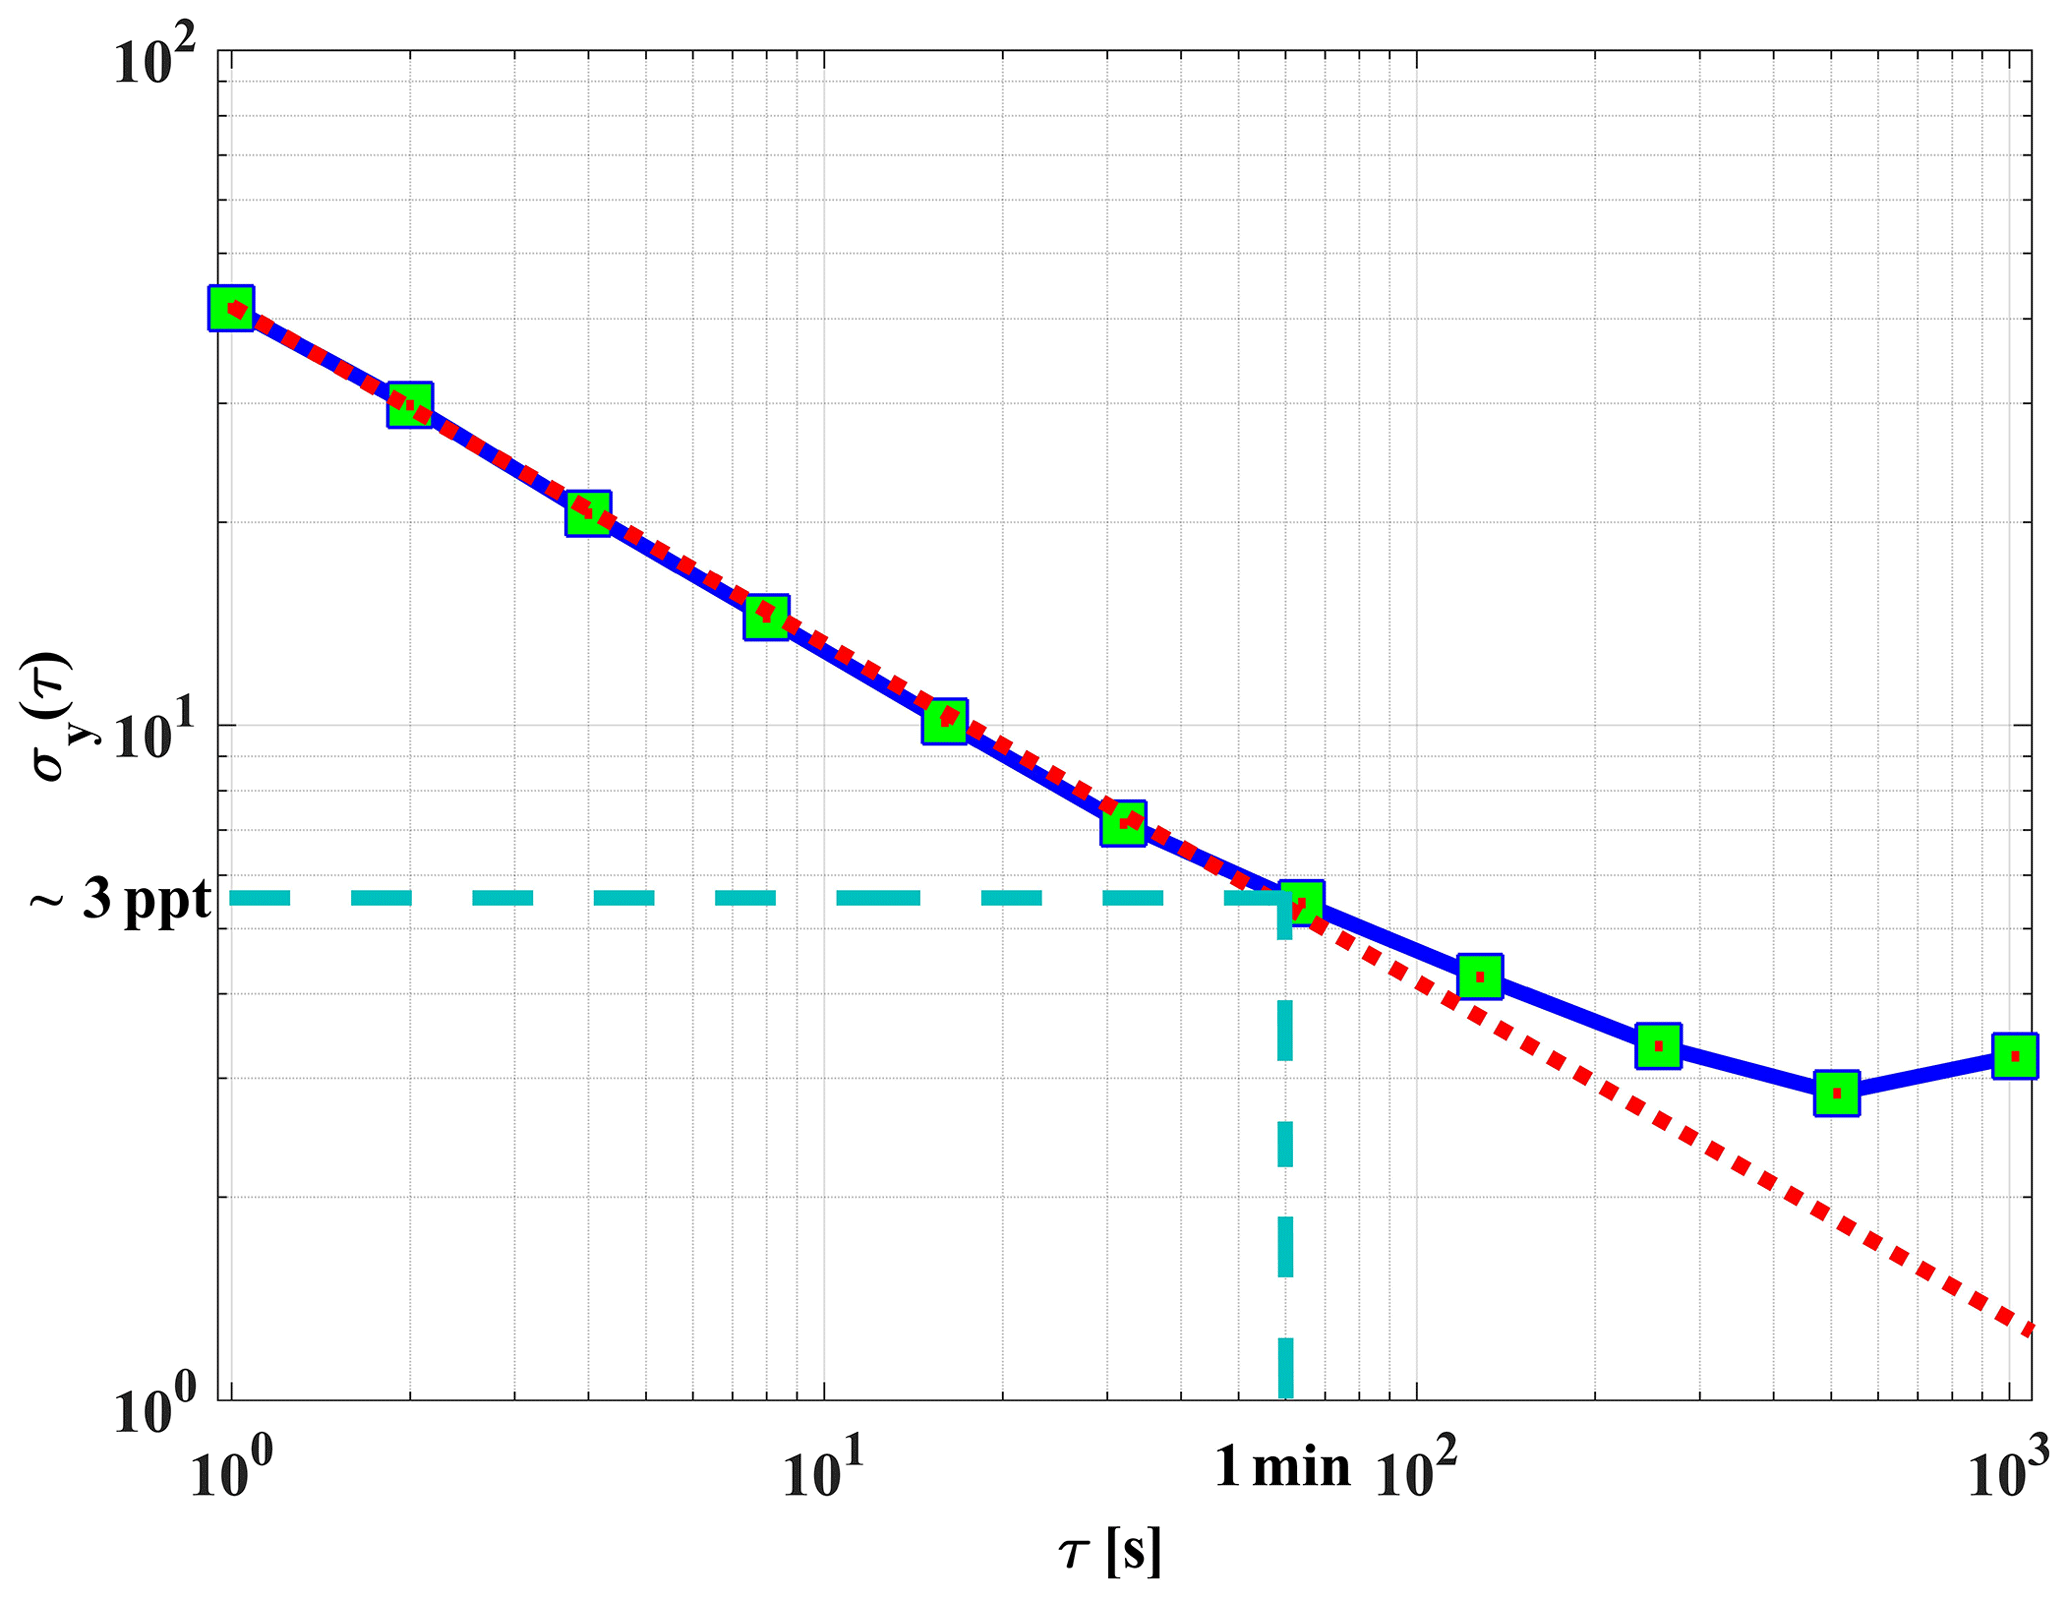
Figure 9An overlapping Allan deviation plot for the dependence of the 1σ variation in the background signal vs. integration time. The red dotted line shows the square root dependency of the signal.
The precision of the instrument background signal was also cross-checked using a continuous measurement of zero air for about 50 min. In order to verify the square root dependency of the signal variability on integration time, an Allan deviation plot is used (Riley, 1995; Land et al., 2007). Figure 9 shows an overlapping (Riley, 2008) Allan deviation plot of variations in background signal vs. averaging time. The variations in background signal with a 60 s integration time are equivalent to an absolute NO2 value of about 3 ppt (1σ). Figure 9 also shows that the random noise of the instrument background signal can be reduced by averaging, with a square root dependency on time, at least up to a 60 s period. The background signal of GANDALF is frequently checked during a field operation (e.g. during PARADE; 1 background signal measurement per hour).
The limit of detection (LOD) can be derived from the variation in the background signals. Based on the Allan deviation plot in Fig. 9, a limit of detection of about 3 ppt (1σ) NO2 for 1 min averaged measurements is expected. The stated (Table 1) LOD of GANDALF was calculated using Eq. (4) (Taketani et al., 2007) at a signal-to-noise ratio SNR of 2 and considering the background signal that is 2 times higher.
where αc is the calibration factor or sensitivity in counts (), SBG is the background signal in counts (s−1) and t is the averaging time in seconds. The LOD for GANDALF, based on sensitivity and background measurements during the field experiment (PARADE 2011), varied between 5 and 10 ppt.
2.4 Interferences by other species
Several atmospheric gas species can absorb the 449 nm laser light inside the detection cell. This can lead to interference for the NO2 measurements with GANDALF directly (photo-dissociation process) or indirectly (fluorescence).
Iodine monoxide (IO) has an absorption cross section of cm2 molecules−1 (Harwood et al., 1997) and is about a factor of 8 larger than the NO2 absorption cross section at 449 nm. Even a few ppt of IO in the atmosphere can produce a significant fluorescence signal, especially in the marine atmosphere, for which IO is mostly reported (Commane et al., 2011). The fluorescence lifetime of IO is only 1–10 ns (Bekooy et al., 1983; Newman et al., 1998). As described earlier, the initial 20 ns fluorescence signal is ignored in the GANDALF data evaluation. Therefore, the IO fluorescence signal after 20 ns becomes too small to significantly interfere with the NO2 fluorescence signal.
Nitrogen-containing inorganic species (NO3, N2O5, HONO2, HO2NO2, PAN, ClONO, ClNO2, and ClONO2) can produce NO2 by photo-dissociation, which can happen inside the detection cell. N2O5 (Harwood et al., 1993), HONO2 (Burkholder et al., 1993), HO2NO2 (Singer et al., 1989) PAN (Talukdar et al., 1995), and ClONO (Molina and Molina, 1977) are not known to photo-dissociate at this wavelength. The absorption cross sections for ClONO2 (Molina and Molina, 1979) and ClNO2 (Ghosh et al., 2012) are smaller by about 4 orders of magnitude compared to that of NO2 at 449 nm. The tropospheric concentrations of ClONO2 and ClNO2 are generally smaller or similar compared to ambient NO2. Hence, an interference from these species is highly unlikely.
NO3 has a larger absorption cross section (Wayne et al., 1991) at 449 nm compared to the previously described nitrogen-containing species. The effective absorption cross section, calculated from (Wayne et al., 1991), is about a factor of 2 smaller than that of NO2 at the wavelength of the diode laser. The recommended quantum yield for the photo-dissociation of NO3 to NO2+O is about 1 at wavelengths below 585 nm (Sander et al., 2011); hence, its fluorescence (Wood et al., 2003) is insignificant compared to its photo-dissociation to NO2. Interference from photo-dissociation of NO3 is therefore a two-photon process:
The lifetime of NO3 can be estimated from Eq. (5).
where σ (λ,T) is the effective absorption cross section of NO3 which is cm2 molecules−1; φ (λ,T) is the quantum yield for NO3, and F(λ,t) is the photon flux from the diode laser of about 1020 . The residence time of sampling air in the effective beam area of the laser is much smaller (<0.001 s) compared to the NO3 photo-dissociation lifetime (>0.01 s). Due to this reason, any chance of a significant interference from the NO3 photo-dissociation is highly unlikely. Moreover, the ratio of the atmospheric concentration between NO2 and NO3 is very high; e.g. during PARADE the median ratio NO2∕NO3 was 430 for NO3>0 with a minimum value of 12.
Alkenes and aromatics (aldehydes and benzene) are also abundant in the troposphere. However, absorption of alkenes and aromatics occurs in the UV range (<300 nm) (Keller-Rudek et al., 2013), well below the wavelengths used in GANDALF. Some carbonyls like glyoxal (CHOCHO) and methylglyoxal (CH3COCOH) also have absorption in the blue region of the visible spectrum. The absorption cross section values of CHOCHO and CH3COCOH are cm2 molecule−1 (Horowitz et al., 2001) and cm2 molecule−1 (Meller et al., 1991; Staffelbach et al., 1995) at 449 nm, factors of about 10 and 5 smaller than the NO2 absorption cross section. Also, the fluorescence from these species is not known to be present in the region of NO2 fluorescence. Therefore, the interference from these species is not important.
To minimize the impact (prior to the orifice) of heterogeneous or thermal conversion of species like PAN (lifetime5 ≈2327 s), HO2NO2(lifetime ≈16 s), CH3OONO2 (lifetime ≈0.3 s), and N2O5 (lifetime ≈22 s) yielding NO2, a short residence time of <0.1 s is generally used by keeping the sampling flow high, e.g. 12 000 sccm in a 0.5 m long sampling line with a 4 mm internal diameter during PARADE 2011. After the orifice, the cell pressure is about 7 hPa and this would lead to increase the lifetime of above-specified species even further, whereas the residence time after the orifice is less than 30 ms. Therefore, a chance of interference in the low-pressure region from the thermal conversion is highly unlikely. An intercomparison of GANDALF and other measurements of NO2 during PARADE 2011 was conducted to look for systematic dependencies of the differences between the different measurements on several measured atmospheric quantities. No evidence of a potential interference has been found for GANDALF (Sect. 3.2).
The PARADE, PArticles and RAdicals: Diel observations of the impact of urban and biogenic Emissions, field experiment took place at the Taunus Observatory on Kleiner Feldberg (825 m a.s.l. (above sea level); 50.22∘ N, 8.45∘ E) in Germany from 15 August (DOY, day of year 2011, =226) to 10 September (DOY=252) 2011. The general focus of PARADE was to characterize summertime biogenic emissions and photochemistry in a forested environment with anthropogenic influence. The observatory is located in the vicinity of the Taunus region at the hilltop of Kleiner Feldberg. A total area of 5 km radius around the observatory is dominated by coniferous, broadleaved and mixed forest. The measurement platform was located at the top of the observatory. The site is often affected by anthropogenically influenced air from nearby cities such as Frankfurt (Main) (30 km SE), Wiesbaden (20 km SW), Mainz (25 km SSW), and some roads within 5–10 km, depending on the wind direction. The temperature during PARADE varied within a range of 5–28 ∘C with an overall average of 14.8 ∘C. The temperature conditions during PARADE can be subdivided into two phases. The periods of DOY=226–237 and 243–246 for PARADE were slightly warmer and the temperature mostly stayed above 15 ∘C, whereas during the other periods of DOY=238–242 and 248–252 the temperature was below 15 ∘C. The relative humidity (RH) had an overall average value of 77 % and variations within the interval of 37–100 %. There were several episodes of rain during PARADE. In the later part of the campaign, fog persisted in the early morning hours. Air masses at the observatory arrived predominantly from the southwest (SW) to the northwest (NW) side of Kleiner Feldberg. Sampling lines for most of the trace gas monitoring instruments were located within a 5 m2 area at the top of the platform. The platform was about 8 m above ground and the top of the platform was above the forest canopy. An overview of the instrumentation and conditions during PARADE can be found, e.g. in Phillips et al. (2012) and Bonn et al. (2014). Note that all data sets for analysis are based on available 10 min averages.
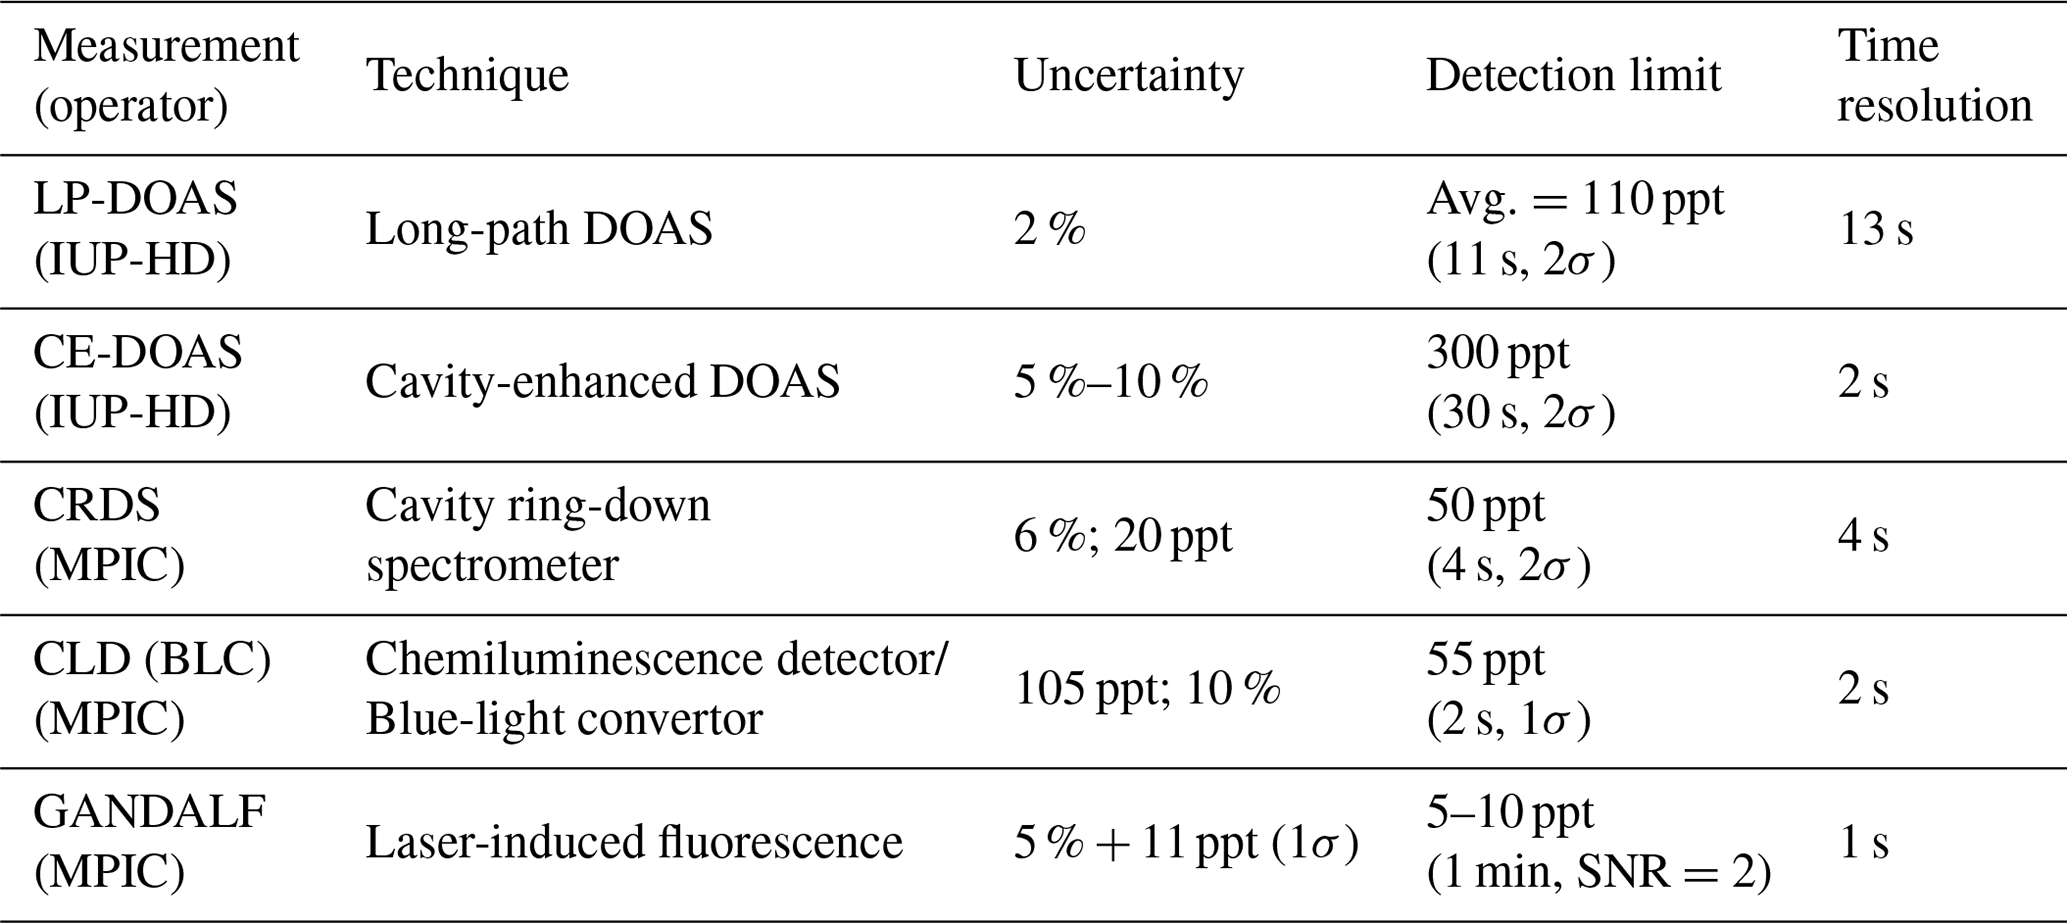
Table 2NO2 instruments located or sampling at the top of the platform during PARADE 2011.
3.1 NO2 intercomparison during PARADE
NO2 concentrations were measured with eight different instruments. Six out of eight instruments sampled at the top of the platform. The measurement techniques, uncertainties, time resolutions and LOD are summarized in Table 2 for the instruments located on the platform. The average ambient concentrations of NO2 during PARADE were approx. 2–3 ppb with a range of approx. 0.13 to 22 ppb. NO2 instruments listed in Table 2 represent in situ measurement techniques with the exception of the LP-DOAS (long-path differential optical absorption spectroscopy).
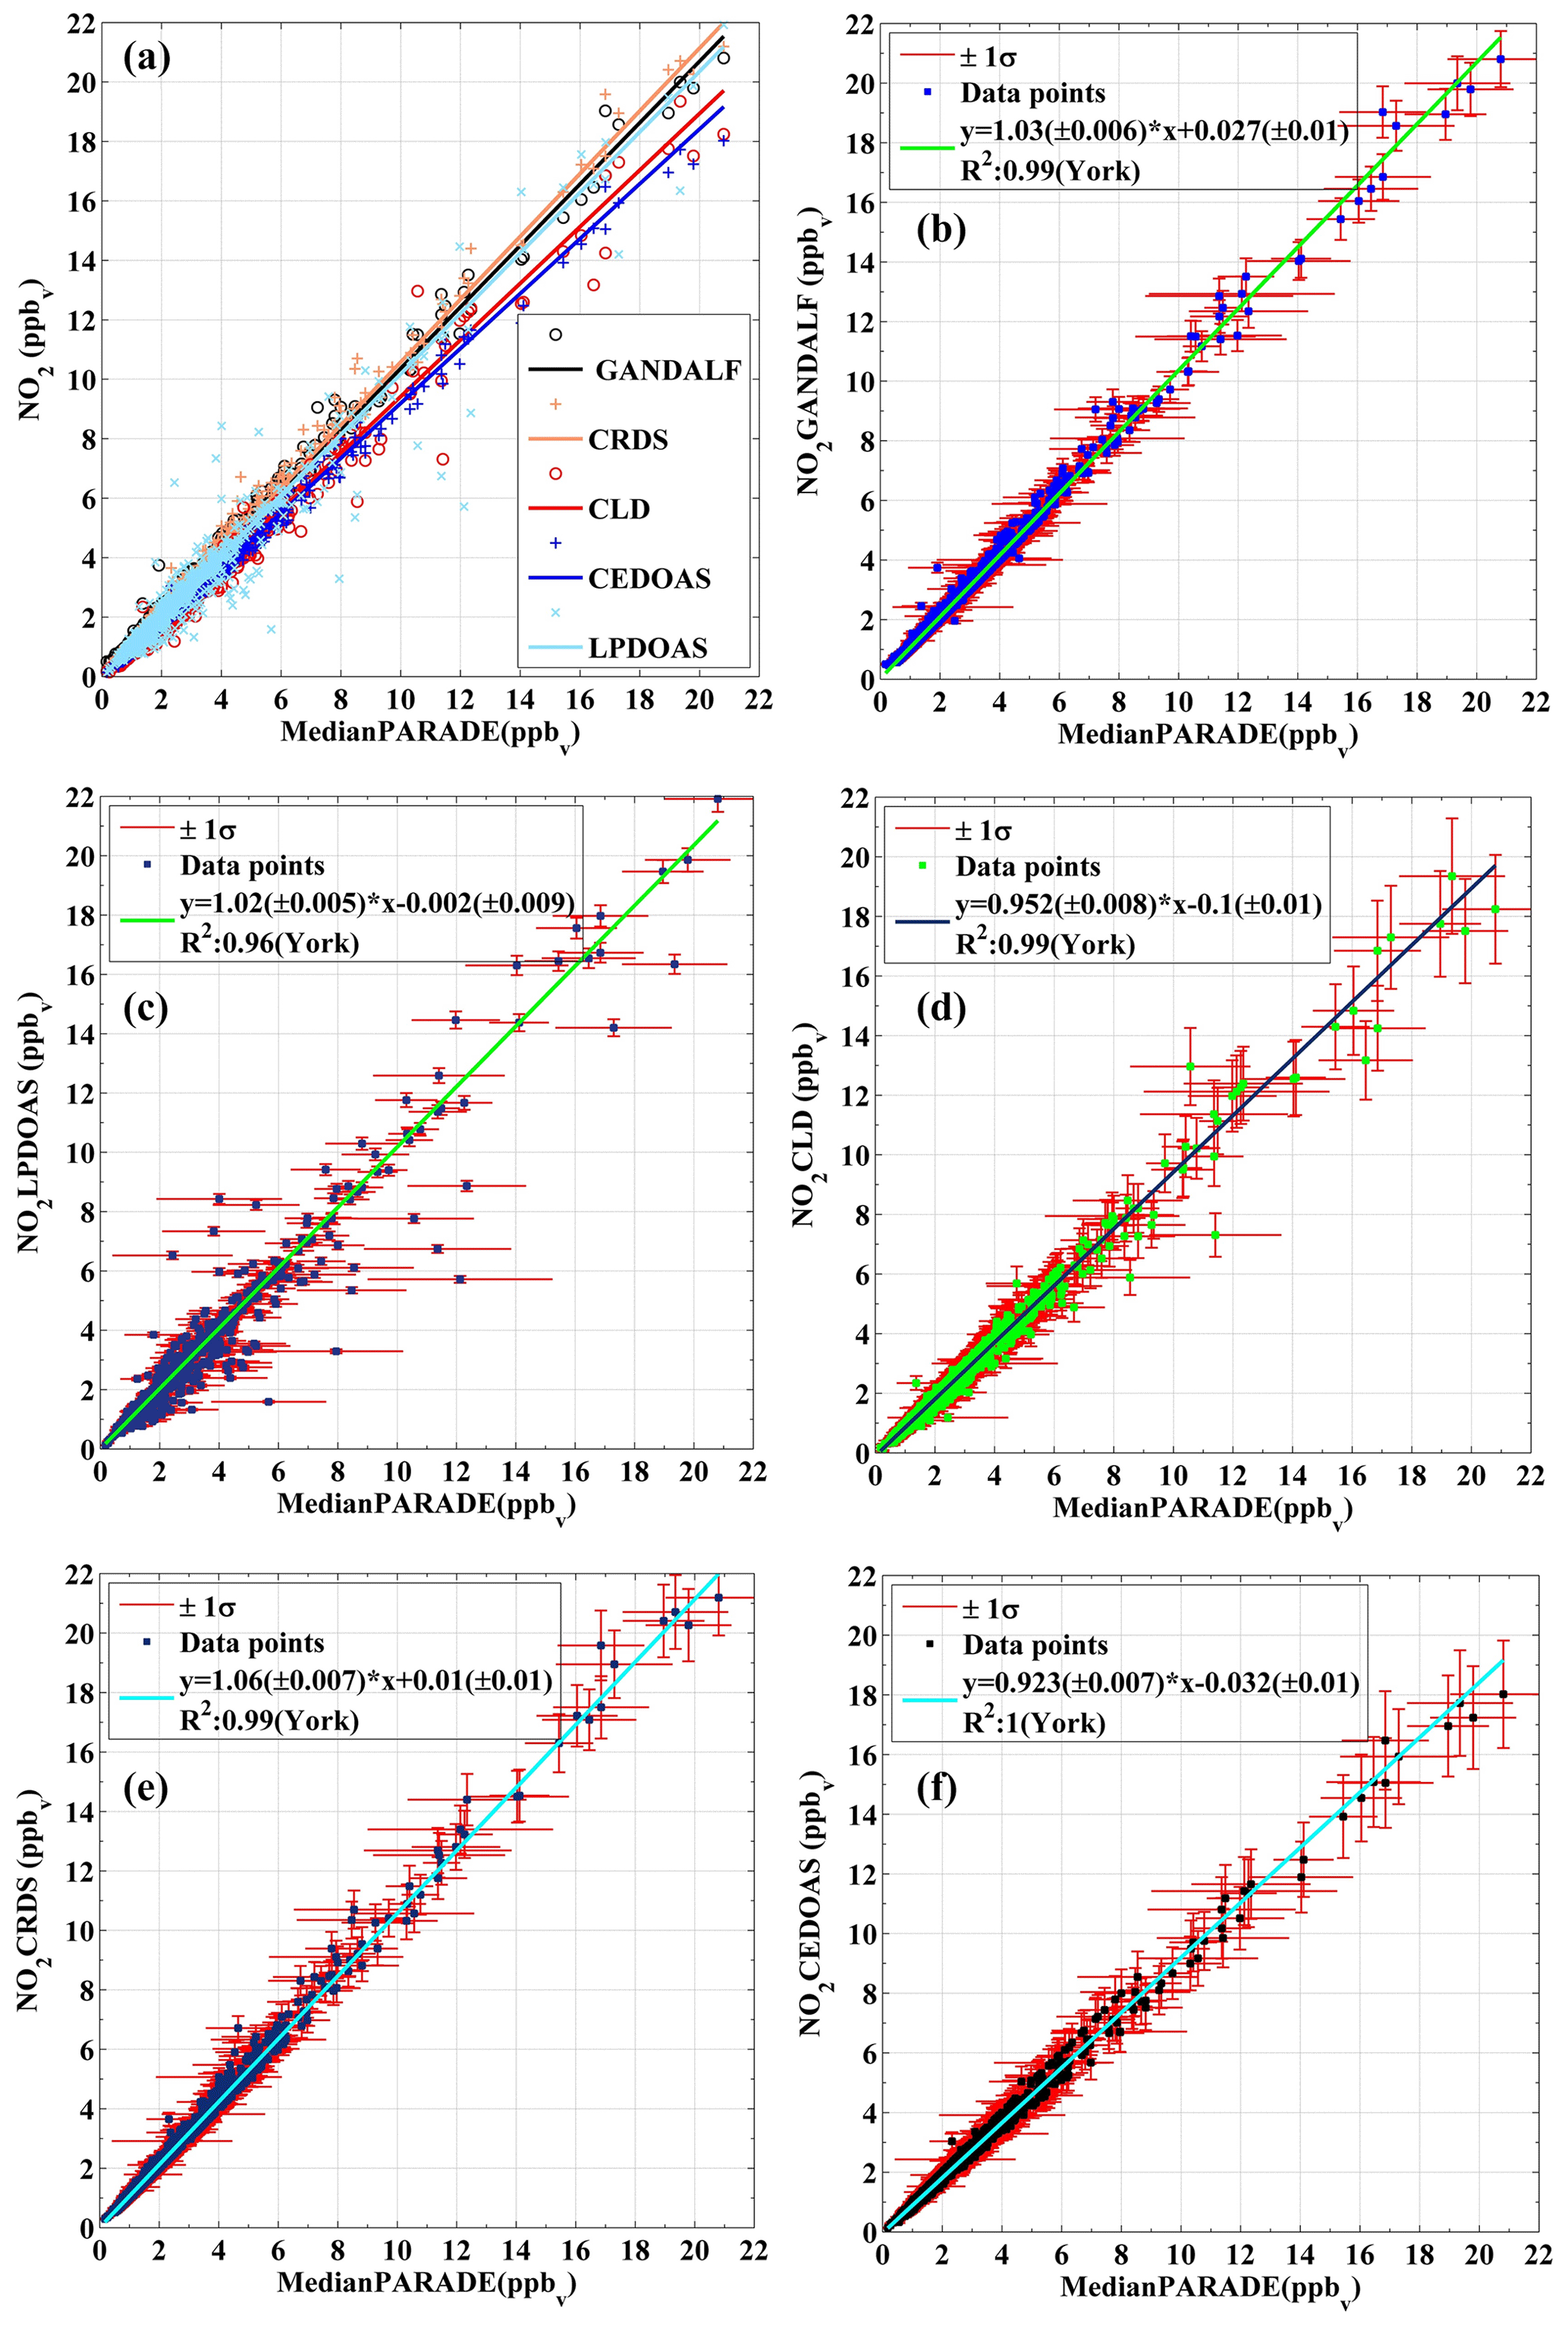
Figure 10Correlation plots of individual NO2 measurement vs. the derived median values of all NO2 measurement at the platform during PARADE. (a) Overall, (b) GANDALF, (c) CLD, (d) CRDS, (e) LP-DOAS, and (f) CE-DOAS.
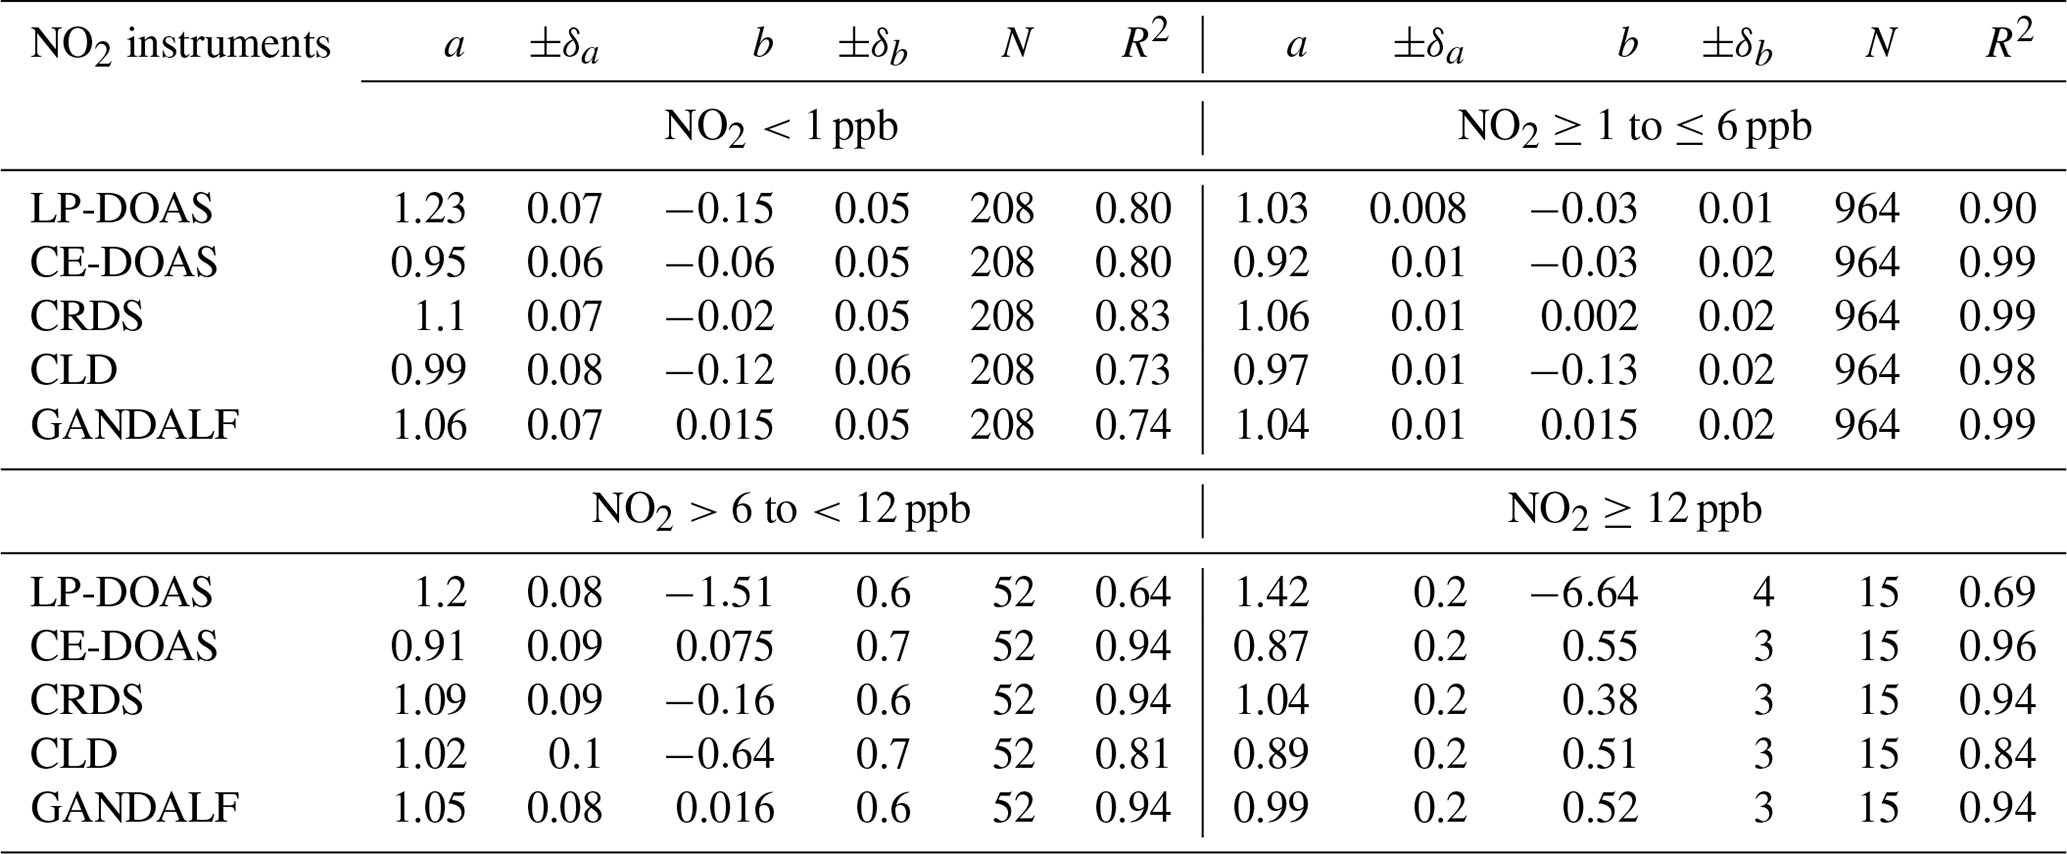
Table 3Fit parameters based on the bivariate model function according to the relation (NO2 instruments ) at different NO2 ranges. The value of NO2 instrument intercept b is in ppb. N is number of data points and R2 is the square correlation coefficient. ±δ is the standard error of slope a and intercept b.
A median value (based on 10 min averages) of the atmospheric NO2 concentration is derived from the NO2 measurements of all individual instruments at the platform, including LP-DOAS. For a valid correlation between the derived median NO2 and individual NO2 measurements, only those values of the median NO2 were selected, for which simultaneous data for all NO2 measurements were available. Figure 10 shows the correlation between individual NO2 measurements and the derived median NO2 concentrations. The total uncertainties of individual instruments are shown as error bars on the y axis, while horizontal bars represent the standard deviation of the derived median NO2. The regression is done by using a bivariate fit according to the method described in York et al. (2004) and Cantrell (2008).
- LP-DOAS:
-
This instrument is based on traditional differential optical absorption spectroscopy (DOAS) (Platt et al., 1979; Perner and Platt, 1979) and follows the Beer–Lambert law. DOAS allows direct and absolute measurements of multiple trace gases in the atmosphere by using the distinct absorption band structure of the specific molecule (i.e. calibration is not needed) (Platt and Stutz, 2008). LP-DOAS is based on active remote sensing and requires an artificial light source (Pöhler et al., 2010). It provides an average concentration of NO2 or other trace gases through quantitative detection using the absorption over a light path of typically a few kilometres. The instrument in this study is a well-established instrument and has been a part of many field campaigns (Pöhler et al., 2010). During PARADE, the optical path length was approximately 2.5 km and the light source, as well as the spectrograph, was located on the platform. The optical retro-reflector reflecting the light back to the telescope was located on the mountain Großer Feldberg (distance of 1.23 km and height of 37 m). Therefore the LP-DOAS measurement delivers values integrated along a 1.2 km straight line starting at the platform to the retro-reflector. The correlation (R2=0.96) plot between LP-DOAS and the derived median NO2 values is shown in Fig. 10c. The slope of the fit is 1.02±0.005 with a negligible y intercept of ppb and these values are within the uncertainty in the instrument. The uncertainty in LP-DOAS is mainly due to errors in the absorption cross sections of NO2. A larger scatter between the LP-DOAS to the in situ instruments is expected due to the sampling of different air masses (A1 in Fig. 11).
- CE-DOAS:
-
Cavity-enhanced DOAS (Platt et al., 2009) measurements of NO2 were also available during PARADE. This method is based on differential optical absorption spectroscopy (DOAS) combined with a cavity and provides in situ measurements of trace gases (Platt et al., 2009). CE-DOAS (cavity-enhanced differential optical absorption spectroscopy) requires calibration of the absorption light path in the cavity. This was performed with the measurement of two different Rayleigh absorbers (Helium, and air) according to Washenfelder et al. (2008). The campaign was also the first field trial for this instrument, with a reported error of measurements in the range of 5 %–10 %, mainly due to the accuracy of the light path calibration. The CE-DOAS and the CRDS shared the same sampling line. The slope and the y intercept for CE-DOAS vs. the derived median NO2 are 0.92±0.007 and ppb, with R2=1 as shown in Fig. 10f. The difference from the median value is well within the range of instrumental uncertainty in this prototype. A further development of this prototype is the ICAD (iterative cavity-enhanced DOAS) from Airyx GmbH.
- CRDS:
-
Besides the DOAS instruments, another NO2 measurement technique was available using a cavity ring-down spectrometer (CRDS) (Thieser et al., 2016). CRDS is a cavity-assisted method like CE-DOAS (Platt et al., 2009). It is a direct method for in situ measurements which requires no calibration but only the background (zero air) measurements. In CRDS, reflective mirrors are used across an optical cavity. To obtain the concentration of a trace gas with CRDS, absorption measurements are made in the optical cavity to determine the time constant for exponential decay of the light intensity with and without an absorber. During PARADE, the instrument inlet was located 2 m above the platform. A PFA tube about 8 m long was used for the sampling air. The slope and y intercept in the case of CRDS are 1.06±0.007 and 0.01±0.01 ppb with correlation R2=0.99 as shown in Fig. 10e. The reported upper limit of uncertainty in the case of CRDS is (Thieser et al., 2016). The differences between CRDS and the derived median NO2 values are smaller than the instrument errors.
- CLD/blue-light converter (BLC):
-
Along with the above-mentioned absolute methods, the concentrations of NO2 and NO were determined with a two-channel chemiluminescence detector (CLD). The instrument sampled air via ∼8 m long PFA tubing at 2 m above the platform. The CLD instrument of MPIC is well established, being an improved version (Hosaynali Beygi et al., 2011) of the ECO-Physics CLD 790 SR. In this instrument, NO2 is detected by conversion via photolysis to NO, using a blue-light converter at the wavelength of 395 nm, with subsequent detection of NO by chemiluminescence. The calibration of the system is done by using gas phase titration between NO and O3 to produce stoichiometric quantities of NO2. The correlation (R2=0.99) between CLD and the derived median NO2 values is shown in Fig. 10d. Overall, the data on the CLD are about 5 % below the median, but this difference is within the uncertainty in the CLD measurement. The reported uncertainty in the CLD for the NO2 measurements is 105 ppt or 10 % (Li et al., 2015). The slope and y intercept are 0.95±0.008 and ppb. A larger negative intercept could be related to measurements of higher background for the BLC unit (switch ON) leading to underestimation of ambient NO2. An additional background signal is most likely due to decomposition of surface-absorbed NO or NO2 during the operational mode of the BLC unit (Teflon block).
- GANDALF:
-
The sampling flow rate (12 000 sccm) provided a residence time of less than 0.1 s in a 0.5 m sampling line. This was sufficient to suppress the impact of heterogeneous or thermal conversion of NO2-containing species to yield NO2. The formation of NO2 due to the reaction between ambient NO and O3 in the sampling line was negligible. The campaign averages of the observed concentrations of NO, O3, and NO2 were 0.25, 44, and 2.6 ppb, respectively. Based on average NO and O3 concentrations, the formation of NO2 from the reaction NO+O3 in the sampling line was less than 0.01 % with respect to the ambient NO2 concentrations. Line loss or photolysis of NO2 was avoided by using PTFE lines (polytetrafluoroethylene) covered with a dark insulating material. The average pressure inside the detection cell for the entire period of PARADE was 6.95±0.27 (1σ) hPa. Several automated calibrations (2–8 per day) and background level measurements (once per hour) were conducted during PARADE to ensure the precision and accuracy of the instrument. Based on the hourly background level measurements, we established that the deviations for about 70 % (1σ) of successive background signal measurements (number of measurements >500) were within an equivalent value of ±8 ppt of NO2. Any NO2 impurity in the used zero air (Synthetische Luft, KW frei 12er MBdl, Westfalen AG, Germany) (synthetic air hydrocarbon free, without subsequent scrubbing) would lead to an underestimation of ambient NO2 levels for PARADE and further contribute to the uncertainty. Nevertheless, previously described deviations of 8 ppt in the background signal during PARADE could be a good indicator of this uncertainty. Another indication that the NO2 contamination in zero air used during PARADE 2011 was less than GANDALF's detection limit is that in the data analysis the y intercept of other NO2 in situ instruments (y axis) vs. GANDALF (x axis) always showed a negative number. If the GANDALF zero measurements had significant NO2 contamination the y intercept should be positive (this figure is provided in the Supplement). A malfunction of the O3 generator occurred in the period 4 to 10 September that disturbed the GANDALF calibration system. A correction of 12 % is introduced for the period 4–10 September, based on the correlation of GANDALF with the CRDS instrument prior to 4 September. During the last few days of this period, an extra baffle was installed in GANDALF. The baffle can be inserted easily into the detection block of GANDALF without disturbing the alignment of the laser. The advantage of the baffle is that it reduces the background counts by ∼50 % while decreasing sensitivity by less than 5 %. The overall correlation between GANDALF and the derived median NO2 is R2=0.99 as shown in Fig. 10b. The measurements of GANDALF tend to be 3 % higher compared to the derived median values of NO2. This overestimation of the slope from unity compared to the derived median value is within the range of the instrument uncertainties. The overall relative uncertainty in GANDALF during PARADE was about 5 %+11 ppt and it showed an exponentially increasing trend from a higher to lower concentration of NO2. This increasing trend is mainly driven by the error in the background measurements. The slope and y intercept of the fit are 1.03 and 0.027 ppb with the absolute errors of the fit being 0.006 and 0.01 ppb.
Generally, all instruments for NO2 showed reasonable agreement with the derived median NO2. Based on Fig. 10, GANDALF (+3 %), CRDS (+6 %), and LP-DOAS (+2 %) showed overestimations compared to the derived median values, while the data were about −5 % from CLD and about −8 % lower than the median values from CE-DOAS. The overall differences are within the experimental limitations and instrumental uncertainties. Results of the comparison between individual NO2 measurements and the derived median NO2 at different ranges of NO2 mixing ratios are summarized in Table 3.
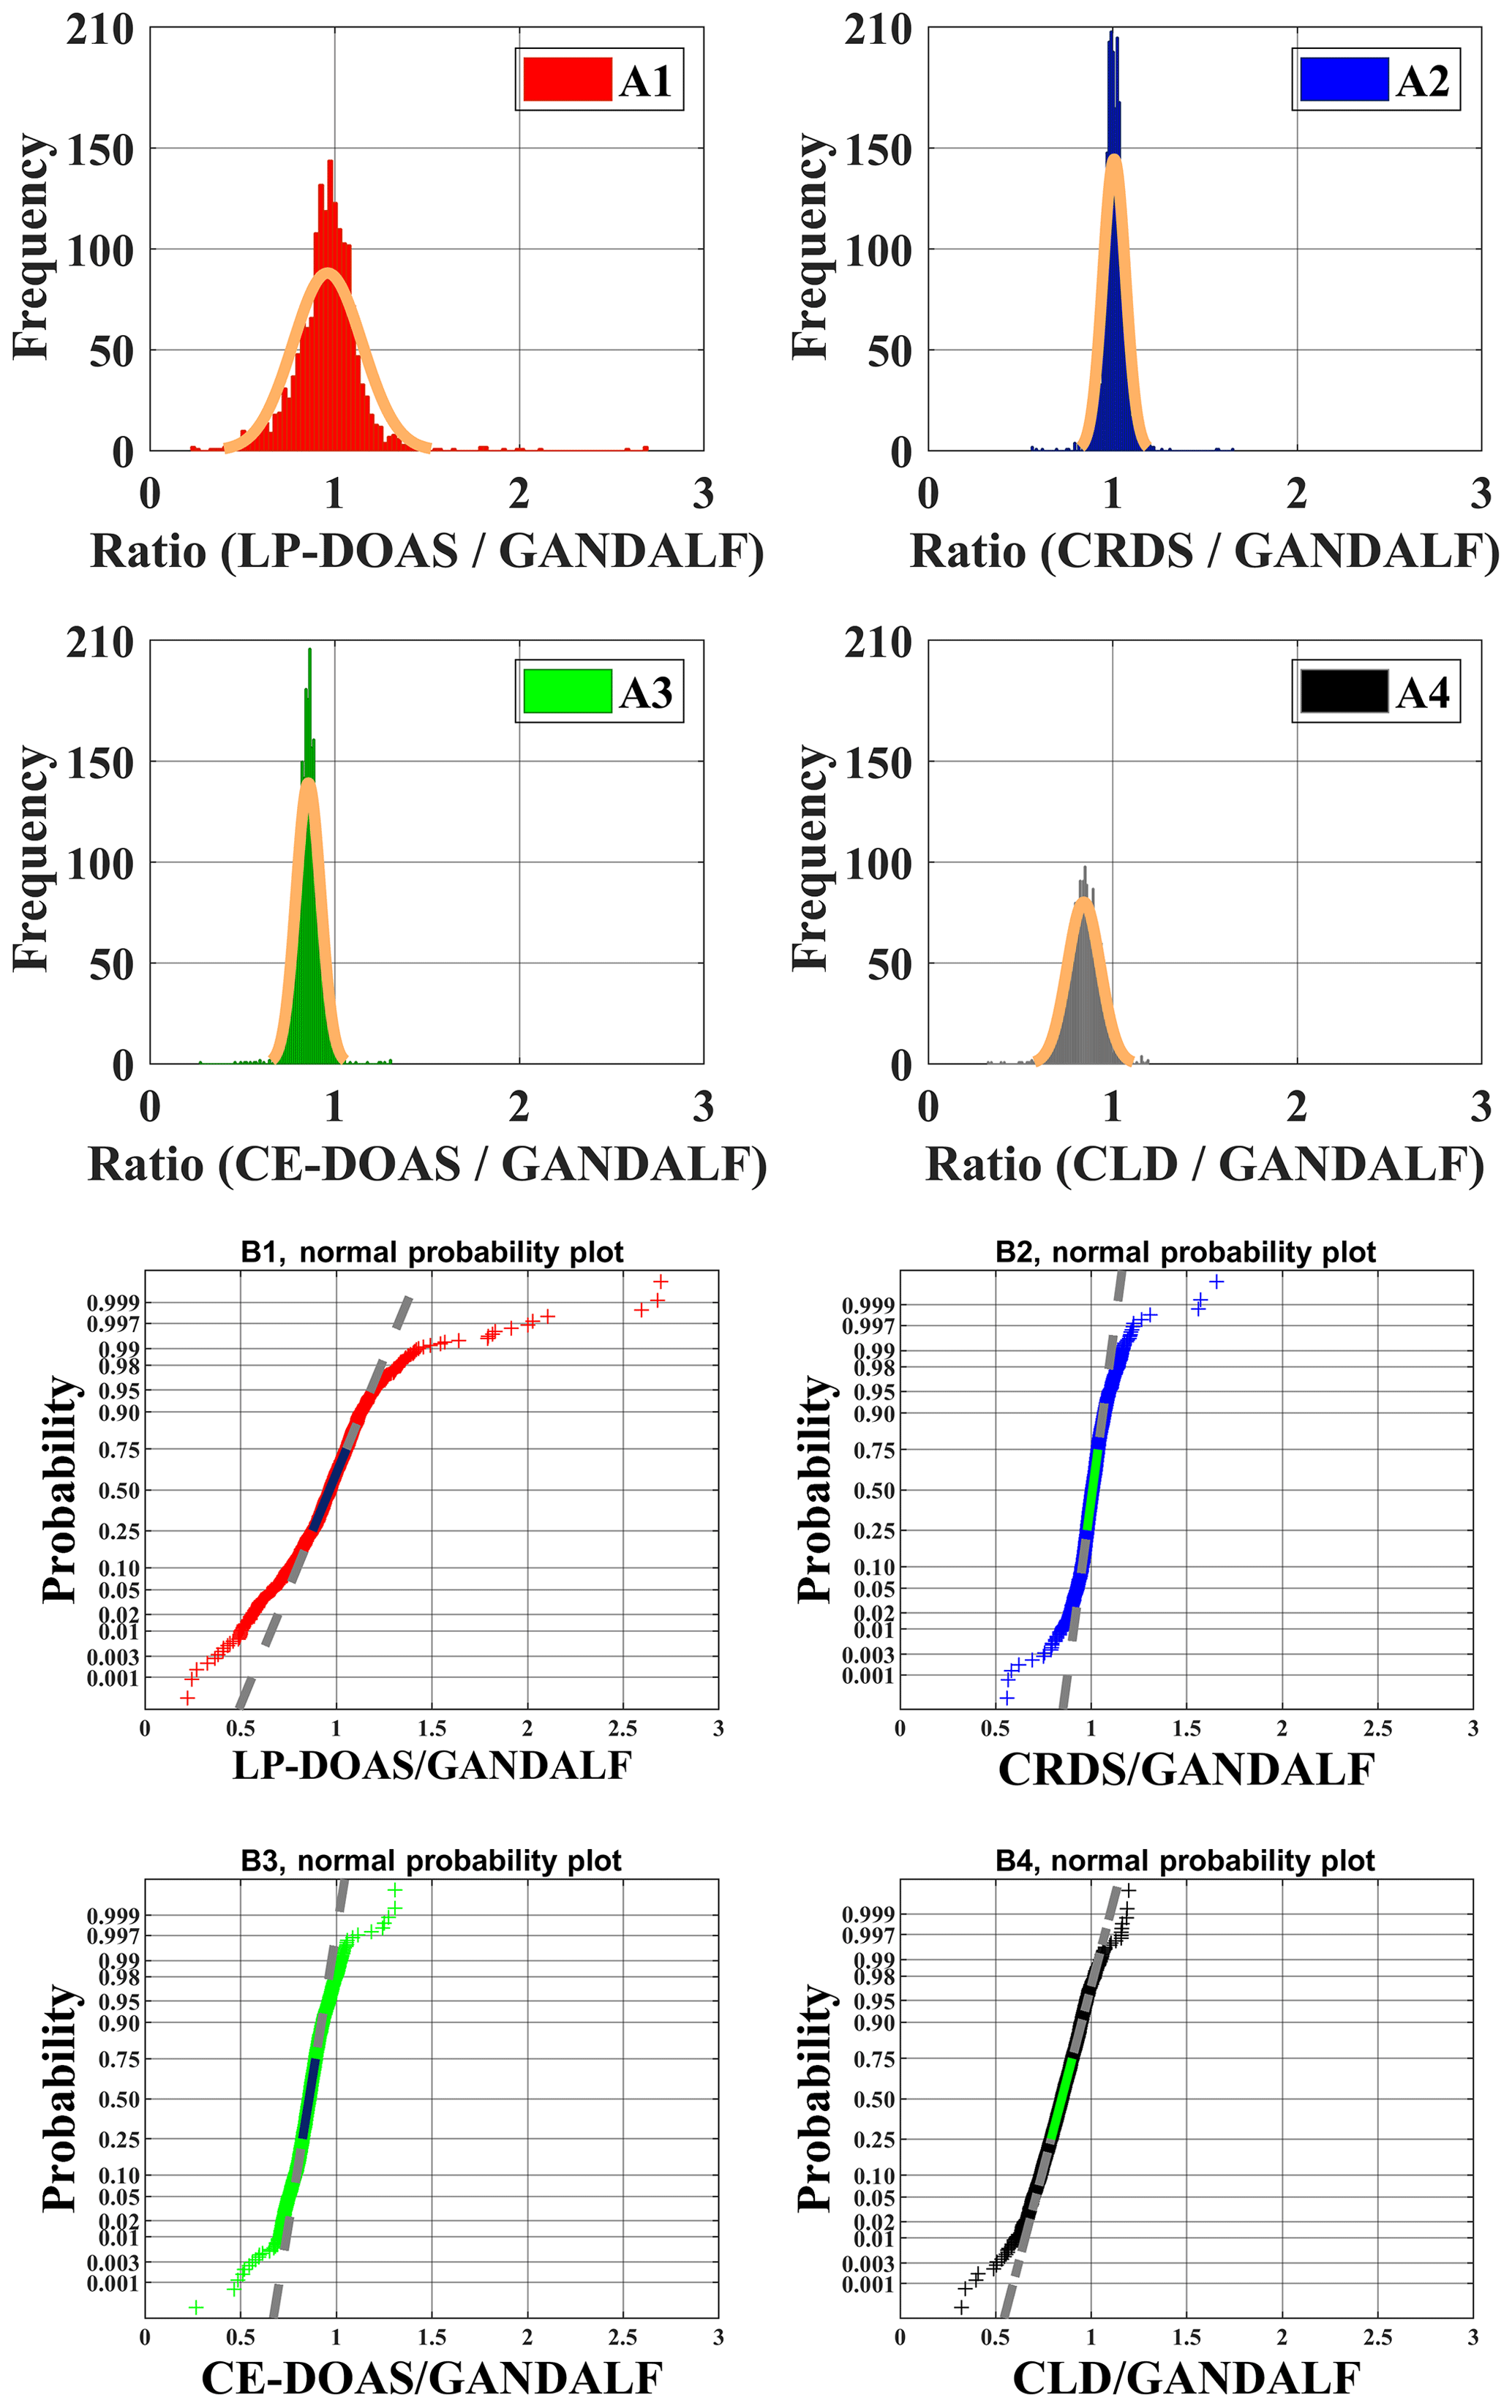
Figure 11Distribution of comparative instrument ratios of NO2 measurements from different instruments is shown in upper panels (A1 to A4) and a normal probability plot for comparative instrument ratios is shown in lower panels (B1 to B4).
3.2 Ratio distribution of NO2 measurements
Various measurements of trace gases, meteorological parameters, and photolysis frequencies during PARADE provided an opportunity to look for indications of systematic differences between NO2 instruments. Ratios of the individual NO2 measurements to GANDALF, which are referred to as “ratios” further on in this section, are compared with respect to different atmospheric conditions. The distribution of ratios is shown as a histogram in the upper panel of Fig. 11 (A1, A2, A3, and A4) along their respective fits based on the normal distribution. The normal probability plot for empirical probability vs. ratios is shown in the lower panels (B1, B2, B3, and B4) of Fig. 11. This plot is a graphical representation of the normal distribution of ratios. The plot stays linear as long as the distributions are normal, and the deviation from the linear fit shows the divergence from the normal distribution. The solid line in the lower panels of Fig. 11 is in the 25th and 75th interquartile range of a ratio. The probability's grid (y grid lines) is not linear and it is representative of the distance between quantiles of normal distribution.
Table 4Average values of NO2 ratios during PARADE 2011. These are derived from the different overall NO2 measurements with respect to GANDALF overall NO2 measurement.
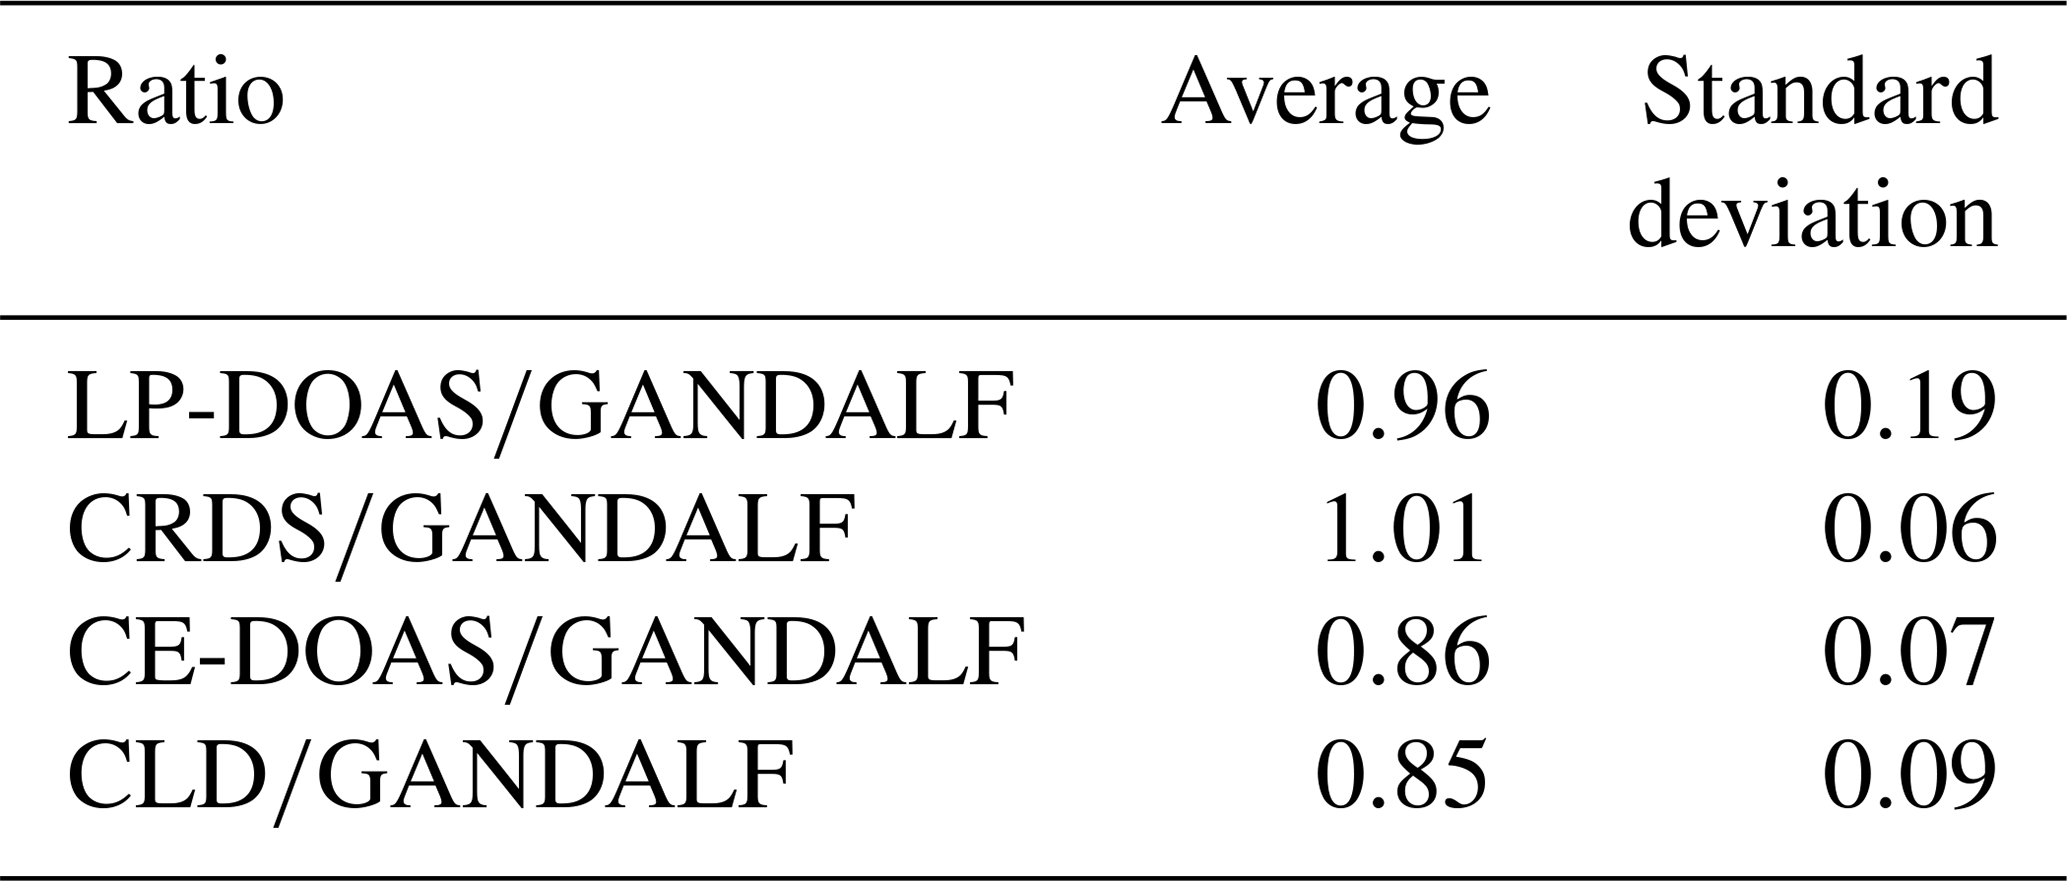
The average, median, and standard deviations of ratios comparing GANDALF with other instruments are given in Table 4. The variation in these ratios (CRDS∕GANDALF, CE-DOAS∕GANDALF, and CLD∕GANDALF) is small compared to LP-DOAS∕GANDALF. This is expected as the LP-DOAS is not an in situ technique and instead measures an average concentration along the light path. The ratios CRDS∕GANDALF and LP-DOAS∕GANDALF are close to unity, whereas in the case of CE-DOAS∕GANDALF and CLD∕GANDALF they deviate from unity by 0.15. All ratio distributions generally show a trend close to a normal distribution (Fig. 11, A1, A2, A3, and A4) but the skewness in LP-DOAS∕GANDALF (A1 in Fig. 11) on both sides of the average value is relatively large. In the lower panel of Fig. 11 (B1, B2, B3, and B4), the probabilities show a deviation from the norm and a tail on the top (towards the right) and bottom (towards the left) sides can be observed. The tail could be an indicator of outliers, for example caused by the non-normality of the precision at low values, background level, and potential interferences of NO2 instruments. The lower panels (B1, B2, B3, and B4) of Fig. 11 show that a major fraction of the ratios is normally distributed, evident from the 25th to 75th interquartile range of probability in all cases. The percentile of probability towards normality is slightly greater (about 10th to 90th percentile) in the case of CLD∕GANDALF compared to the others. The percentile is about 15th to 80th and 25th to 90th with CRD∕GANDALF, CE-DOAS∕GANDALF and LP-DOAS∕GANDALF. A perfect normal distribution should not be expected in these cases as, mathematically, a ratio between two normally distributed quantities does not follow a normal distribution, but it can be a distribution like the Cauchy distribution (Weisstein, 2003). The long tails in the lower panel of Fig. 11 (B1, B2, B3, and B4) also indicates the characteristics of the Cauchy distribution. In this type of distribution, the accuracy of average and standard deviation values cannot be increased by increasing the number of data points.
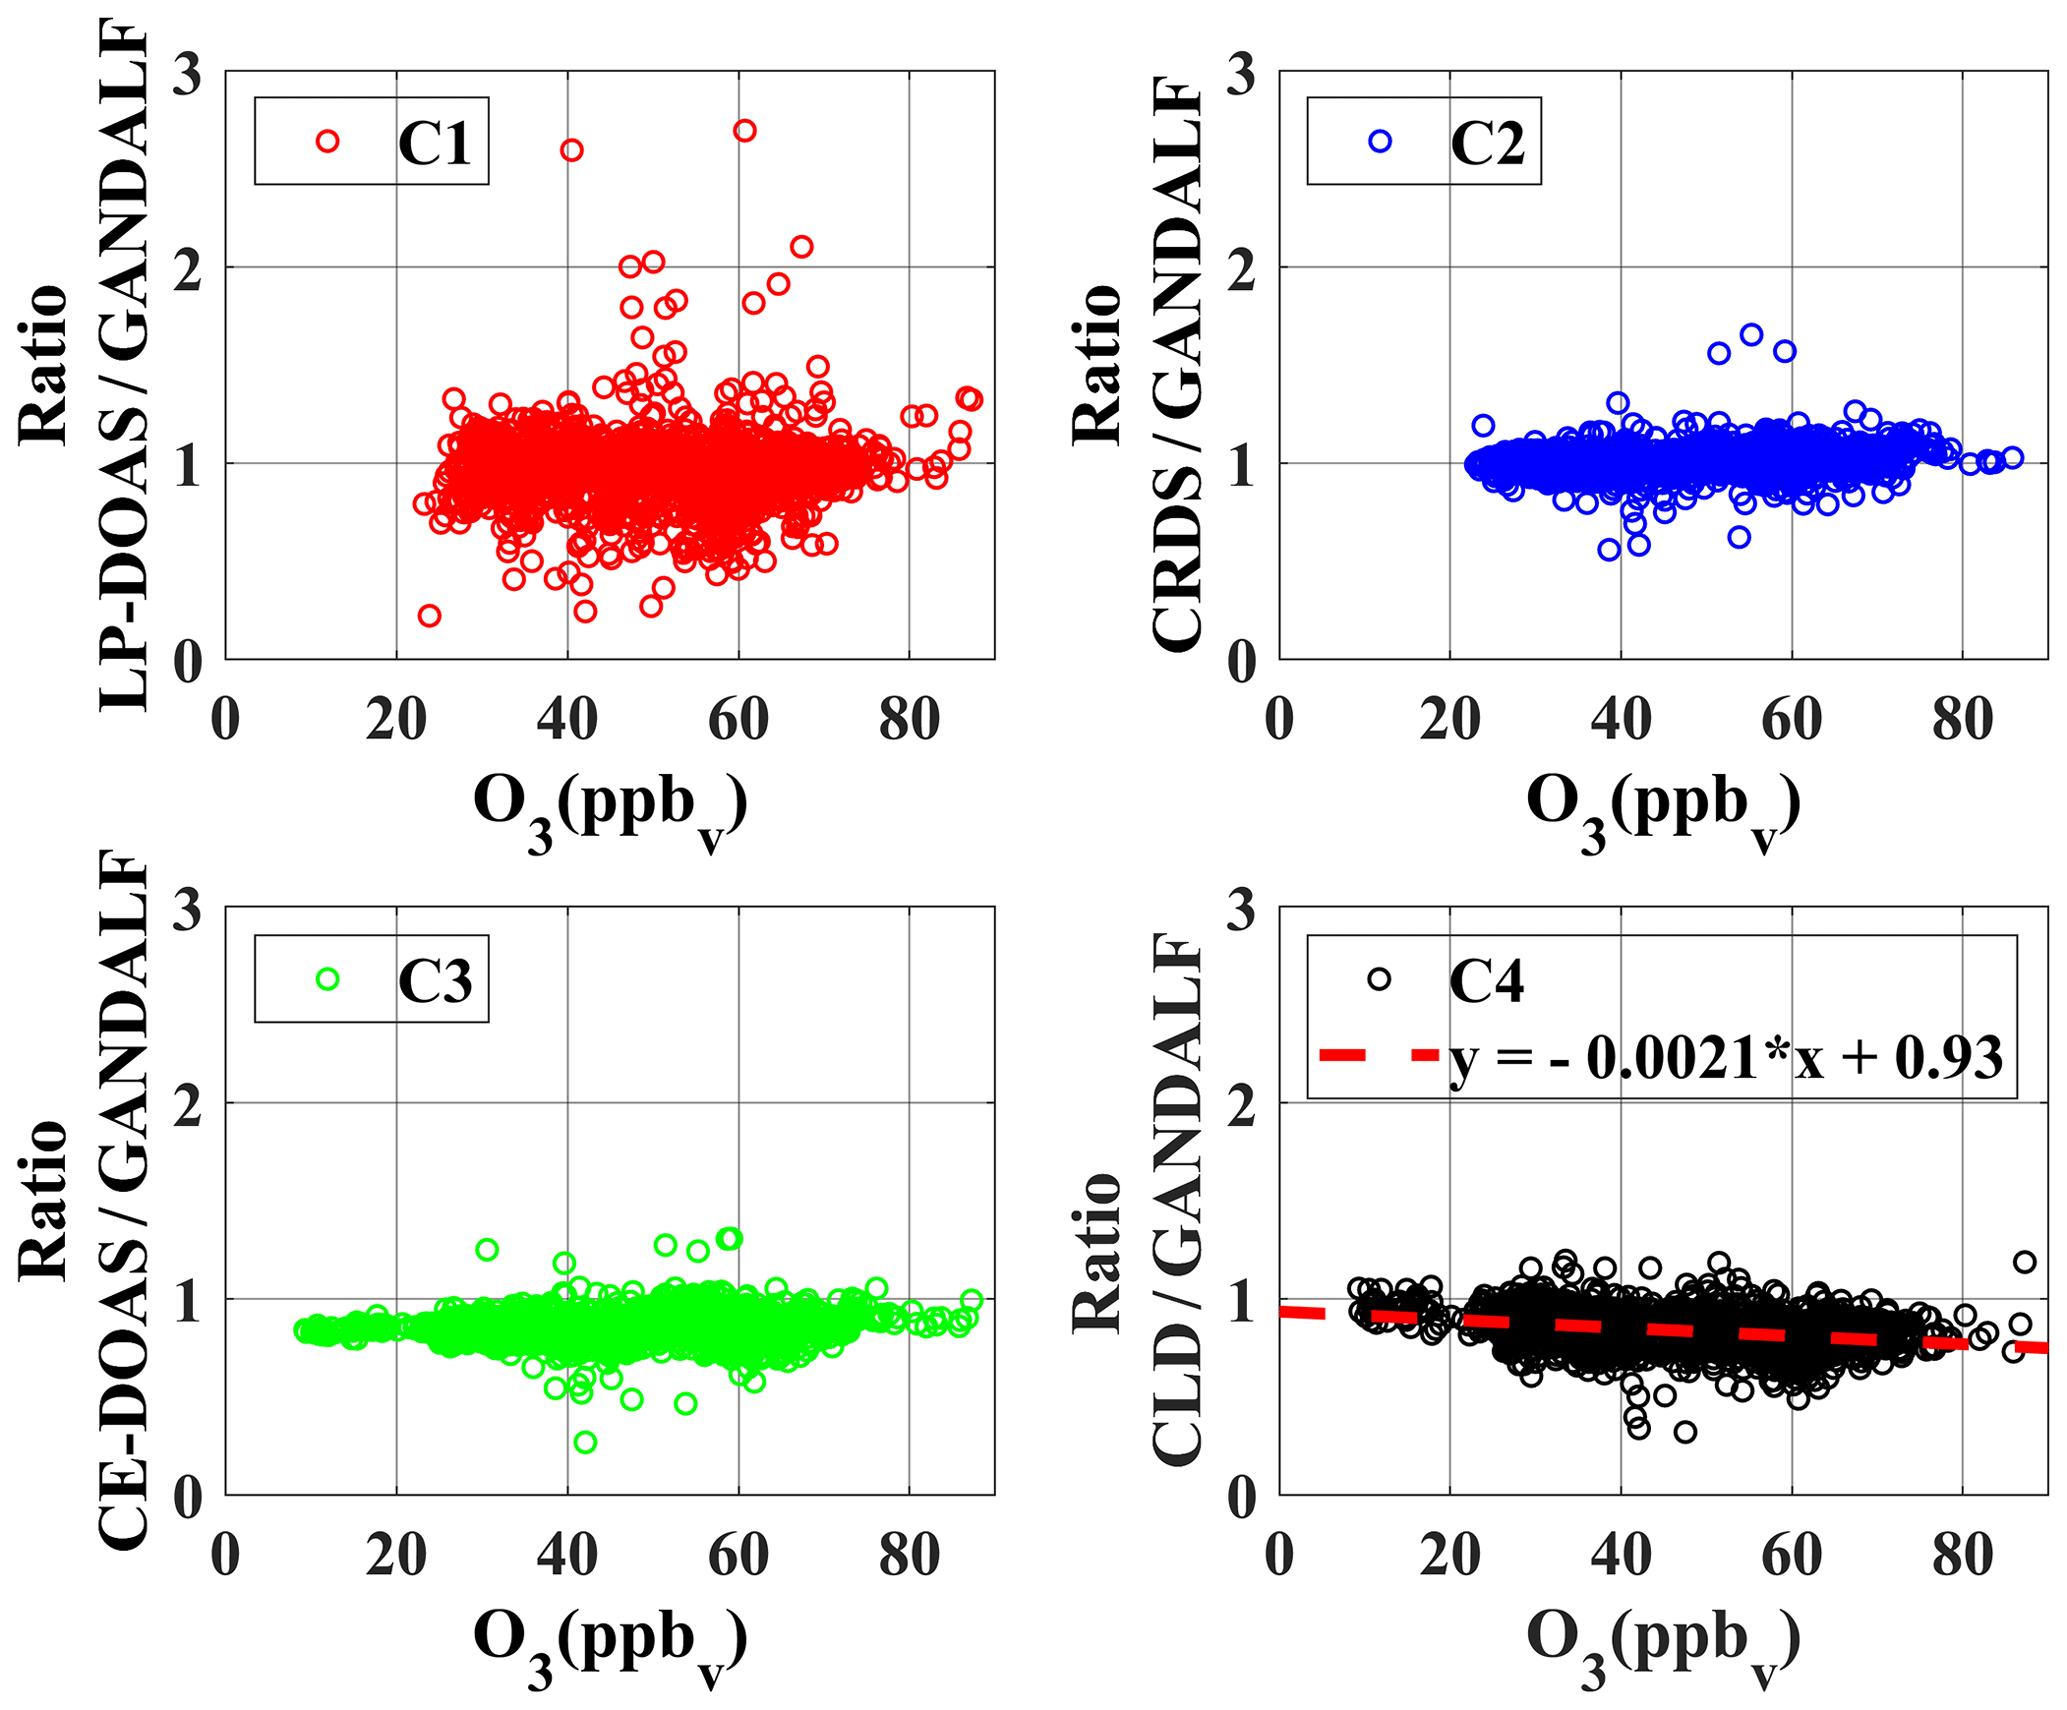
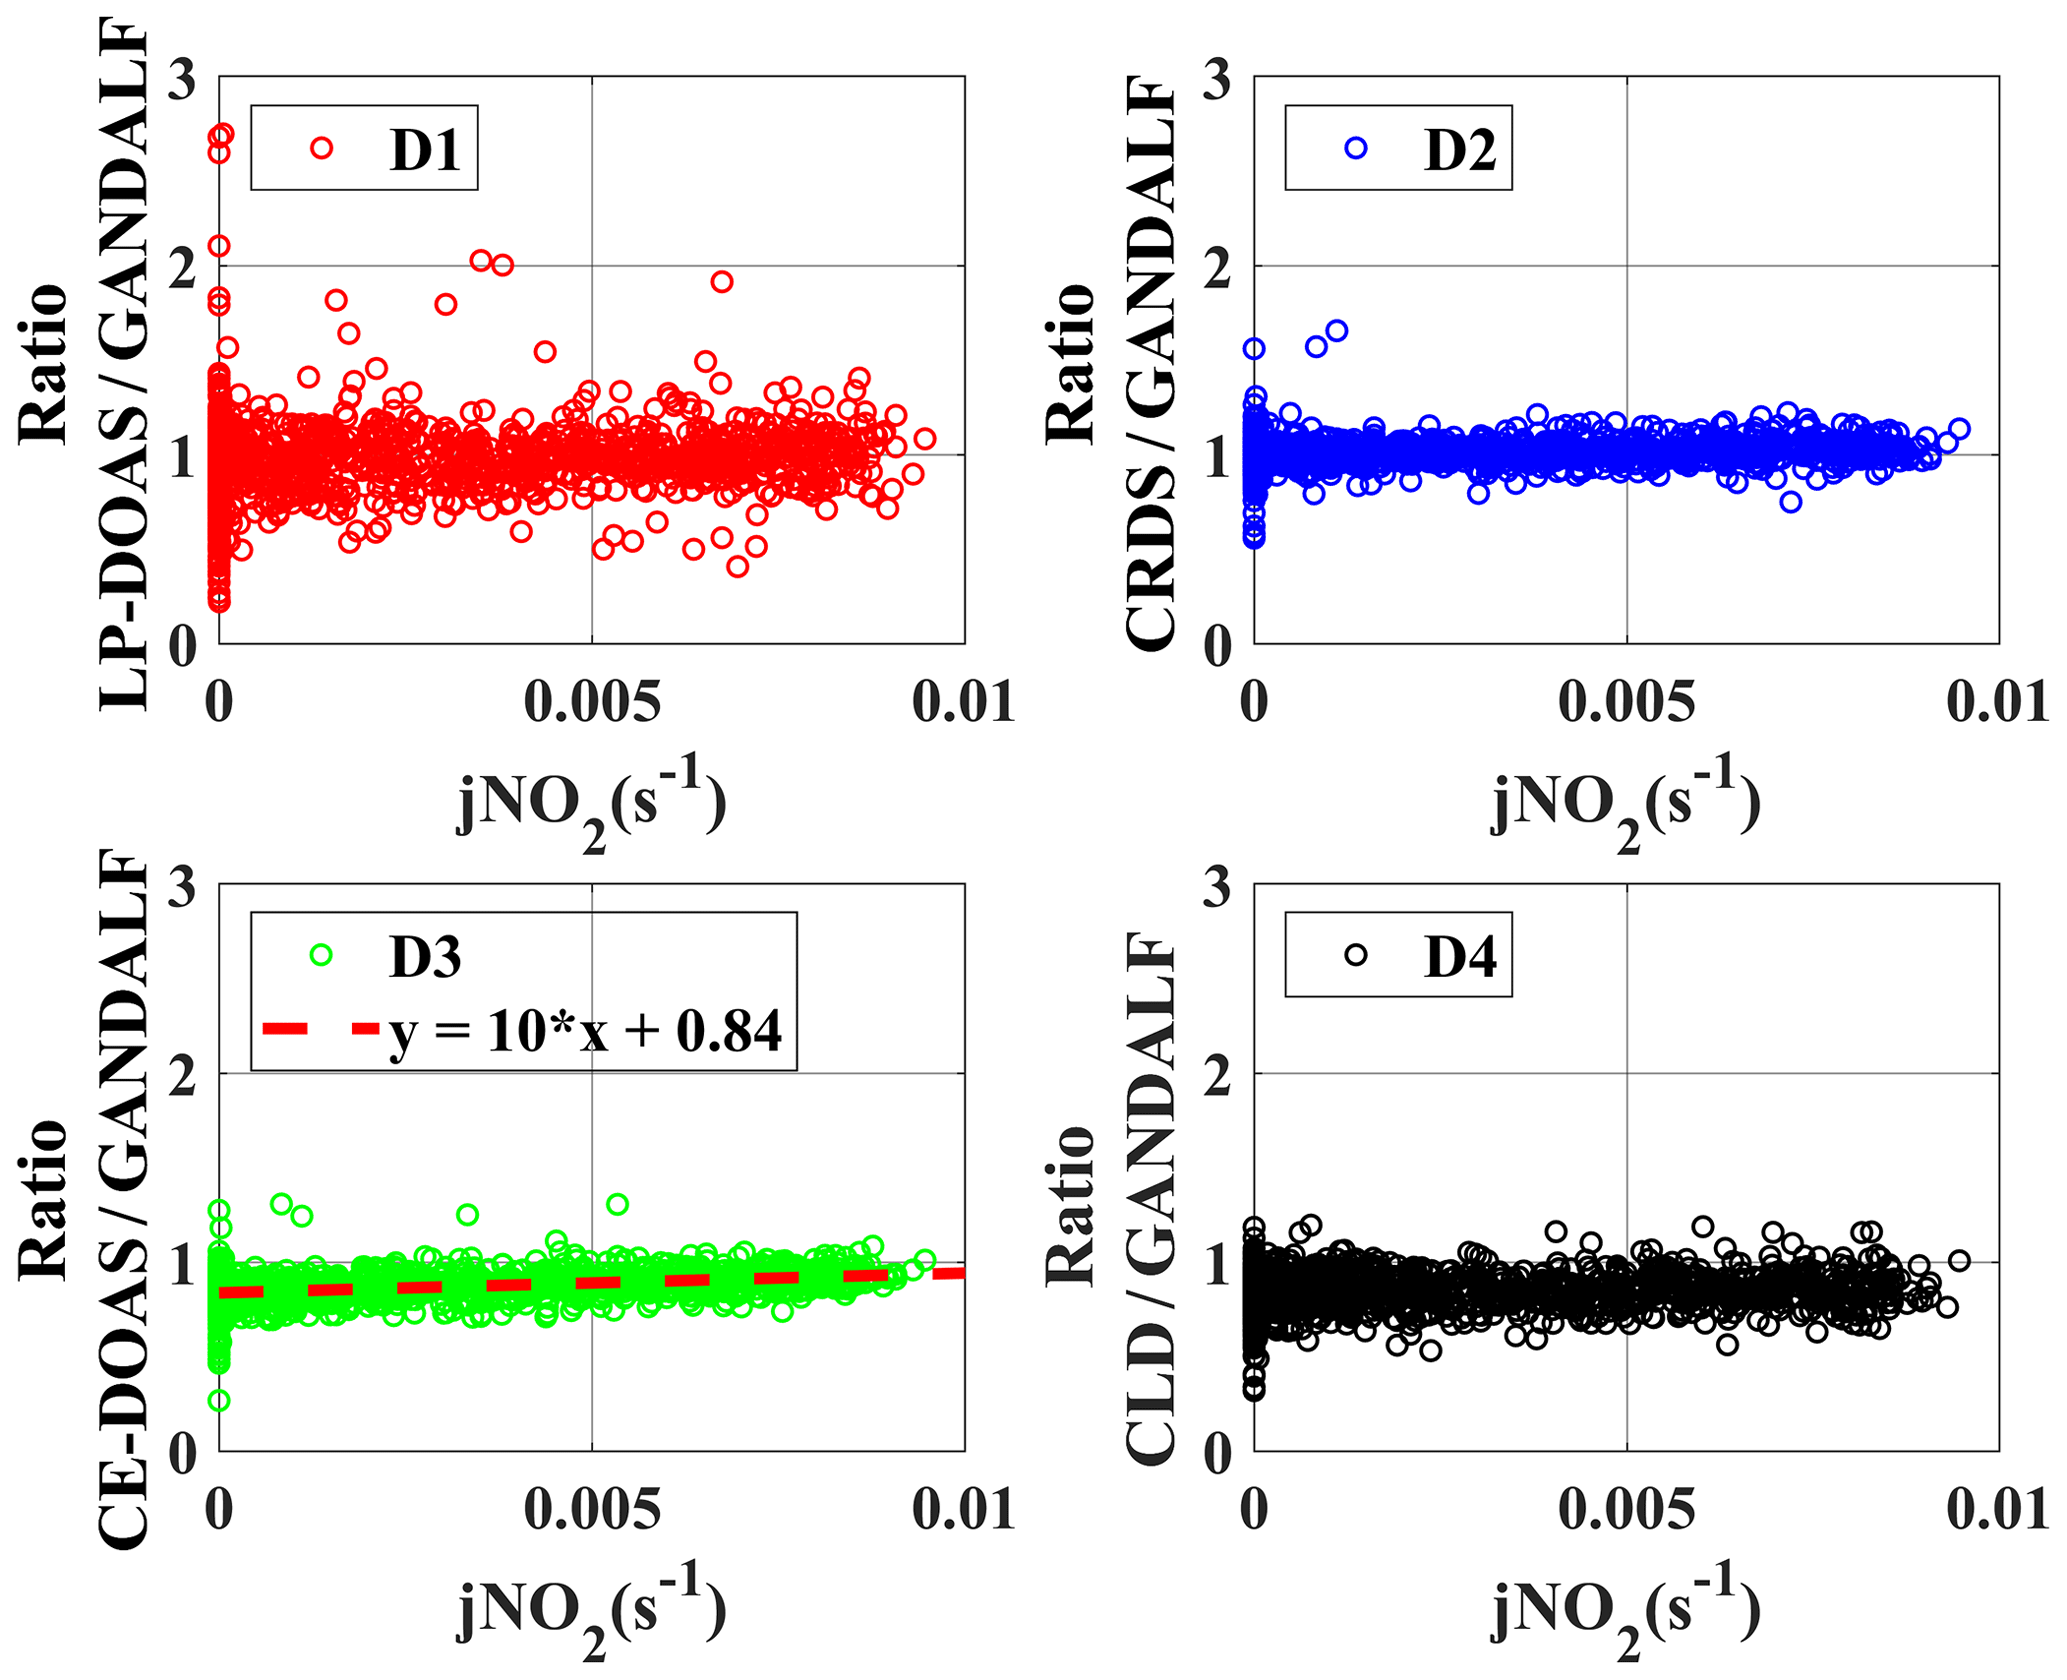
To identify systematic deviations based on other trace gases or parameters, ratios are further compared with the observed data of several trace gases, radiation, and meteorological parameters. There are only two cases in which a systematic correlation of ratios was observed with the observed quantities during PARADE, as shown in Figs. 12 and 13. In Case 1, ratios are presented as a function of the observed O3 concentrations. The ratio between CLD and GANDALF shows a decreasing trend with respect to an increase in the O3 concentrations (panel C4, Fig. 12). This ratio (CLD∕GANDALF) averages 0.95 at levels less than 20 ppb O3. It decreases to an average of 0.86 over the interval of 20 to 42 ppb O3, while averaging 0.81 at levels above 42 ppb of O3. There is no trend observed in other ratios (CRDS∕GANDALF, LP-DOAS∕GANDALF, and CE-DOAS∕GANDALF) as shown in Fig. 12. The subplot (C4, Fig. 12) has been cross-checked by altering the GANDALF data in the denominator to the other three measurements (LP-DOAS, CRDS, and CE-DOAS) and qualitatively similar trends were observed as with GANDALF. The reason for this CLD∕GANDALF trend is not clear at the moment. However, it seems that this trend may be an indirect impact due to the zero-air measurement of the CLD with the BLC unit ON, which is dependent on the converter's history (exposition to ambient NO, NO2, and HNO3 concentrations along humidity) and potentially affects the ambient NO2 measurements. Therefore, the dependency on O3 might be an indirect effect: high ozone could point to transport from above with lower H2O and lower NOx, which could affect the zero, leading to an overestimation of the subtracted zero signal. In Case 2 (subplot D3, Fig. 13), a correlation is observed for the ratio between CE-DOAS/GANDALF as a function of jNO2. At higher values of jNO2, the ratio approaches unity. The sampling line for CE-DOAS and CRDS was the same and no correlation for the ratio between CRDS and GANDALF is seen with respect to jNO2. However, the data for the CRDS instrument were corrected for the effect of in the sampling line and this correction for the CE-DOAS instrument was not implemented. Hence, the jNO2 trend in the ratio could be indirectly from NO+O3. A residence time of 10 s in the sampling line for the reaction (using measured NO, and O3) is sufficient to explain this trend. This correlation is also not observed for the ratios of LP-DOAS and CLD with respect to GANDALF. A cross-check was done for panel D3 (Fig. 13) by exchanging GANDALF in the denominator to three other measurements (LP-DOAS, CRDS, and CLD); qualitatively similar trends were observed as previously. Besides the above-described systematic correlations, no indication of a potential interference is obtained for any of the instruments.
The laser-induced fluorescence-based instrument (GANDALF) has been developed for the measurement of atmospheric NO2. GANDALF has been tailored towards a compact design with a low detection limit (5–10 ppt min−1) and high precision (0.5 %+3 ppt min−1), making it capable of measuring NO2 throughout the troposphere with a time resolution of 1 min. The reliability of GANDALF was successfully tested during the PARADE 2011 field campaign. Several available NO2 measurements based on different methods (absorption spectroscopy, chemiluminescence, and fluorescence) provided a unique chance of successful intercomparison. In general, all instruments performed well. GANDALF showed a very good correlation (R2≈0.99) in comparison to other in situ instruments (Fig. S11 in the Supplement), and even with LP-DOAS the correlation was R2≈0.9. The differences in the absolute values were within the specified range of individual measurement errors. The main advantages and disadvantages of GANDALF compared to the other instruments are summarized as follows.
In comparison to the CRDS instrument, the main advantage for GANDALF is that the sampling can be achieved without an inlet line. This is not possible for the closed-path CRDS system. This provides the capability of the detection at ambient temperature for GANDALF, which is especially an advantage for aircraft measurements of NO2, where avoiding interference from CH3OONO2 and HO2NO2 (via unwanted thermal dissociation) is very important. The requirement of calibration is the main disadvantage of GANDALF compared to CRDS (absolute technique). However, both instruments require frequent zero-air measurements. The limits of detection for the instruments were of similar magnitude during PARADE 2011.
The CE-DOAS instrument is comparable to the CRDS instrument. It also needs frequent background measurements but no absolute calibration. GANDALF has a much better sensitivity compared to the CE-DOAS instrument. During PARADE 2011, the detection limit for CE-DOAS was around 300 ppt (2σ, 30 s), while for GANDALF the detection limit was 5–10 ppt (min−1). A low cell pressure is typically required to achieve good sensitivity for LIF instruments (Table 1), while the detection in the other instruments (CRDS and CE-DOAS) is performed at sub-ambient pressures (>800 hPa). The requirement of calibration and usage of a larger scroll-pump (to achieve a low-cell-pressure) adds extra effort and cost to the GANDALF measurements.
The basic requirements for a calibration and background measurements are the same in CLD and GANDALF. In the case of CLD, the maintenance is relatively easy compared to GANDALF. However, GANDALF provides a direct detection of NO2 compared to the indirect detection of NO2 (via NO2→NO) in the CLD instrument. The sensitivity of GANDALF was better than the CLD instrument during PARADE 2011.
LP-DOAS does not require calibration or the zero-air measurement. For this reason, the uncertainty in the data is also very small compared to GANDALF or other in situ measurements. This is the main advantage of the LP-DOAS instrument over GANDALF. The restriction of this method is that it does not provide a local measurement. Also, the temporal resolution is limited compared to other in situ instruments. The sensitivity of the LP-DOAS instrument generally depends on the length of a light path and variations in visibility. It was on average about 110 ppt (2σ, 11 s) during PARADE 2011.
The selectivity of the NO2 measurement with GANDALF compared to other measurements in ambient air was assessed during PARADE and no potential interference was found. This prototype could provide useful measurements of NO2 under remote conditions where an interference-free detection is absolutely essential for the study of NOx chemistry, especially in the context of O3 formation, and radical loss processes.
NO2 in the free troposphere is variable (seasonally) and generally lower than 50 ppt (Gil-Ojeda et al., 2015). Depending on the location, in the free troposphere and the marine boundary layer, NO2 can be as low as a few ppt (Hosaynali Beygi et al., 2011; Schreier et al., 2016). These NO2 ranges are below the detection limit for the instrument (GANDALF) for short time resolutions of 1 s, for example. Improvements for future use on the aircraft are possible by further reducing the background of the instrument. Since most of the background signal is from the fluorescence contamination of the Herriot's cell mirrors, this could be avoided by using a single beam (as demonstrated by Di Carlo et al., 2013) of the laser for detection without a Herriott cell or by using different coatings on the Herriott cell mirrors to increase reflectivity and reduce fluorescence. The current CW diode laser of the instrument may be replaced by an already available monomode dual-diode laser [λ (online) =445 nm and λ (offline) =442 nm] for on and off resonance measurements of NO2. Replacement of the current laser by a dual-diode laser will partially decrease the dependency on the frequent zero-air background measurements.
The formation of RONO2 is an important sink for NOx and affects the ozone production efficiency (Browne and Cohen, 2012). The accurate measurement of RONO2 is important for the assessment of local O3 abundances. LIF systems in combination with the thermal dissociation method (Day et al., 2002) are also used and are very useful for the detection of RONO2, RONO2, and HNO3. GANDALF will be capable (currently under development) of measuring these species by coupling them with the thermal dissociation inlets. This further development could provide very useful data in the future to constrain models.
Details about the field campaign can be found at http://parade2011.mpich.de/ (last access: 28 February 2019). The data related to PARADE 2011 can be obtained on request (by Hartwig Harder) from the responsible persons/owners.
The supplement related to this article is available online at: https://doi.org/10.5194/amt-12-1461-2019-supplement.
The authors declare that they have no conflict of interest.
This work was done as a part of the first author's PhD, who is grateful for
the constructive comments of Peter Hoor during the PhD advisory committee
meetings. The financial support from DFG (Deutsche Forschungsgemeinschaft)
within the “DFG-Verfahren: Schwerpunktprogramm, SPP 1294: Bereich
Infrastruktur – Atmospheric and Earth system research with the `High
Altitude and Long Range Research Aircraft' (HALO)” is gratefully
acknowledged. The authors are thankful to Mingjin Tang, Birger Bohn, Florian Berkes, and
Gavin J. Phillips for the data on NO3/N2O5, jNO2, H2O,
and ClNO2, respectively. The acknowledgement extends to Korbinian Hens, Anna Novelli, Eric Regelin, Cheryl T. Ernest, and Chinmay Mallik for their useful
comments/logistics, the site engineers, DWD (Germany's National
Meteorological Service) for meteorological data, and to the Goethe
University, Frankfurt, for use of the Taunus Observatory facilities. We are
thankful to the three anonymous referees for their comments and suggestions
that helped us to improve the draft. We are also thankful to Lisa Whalley
(editor) for the review process.
The article processing charges for this open-access
publication were covered by a Research
Centre of the Helmholtz
Association.
Edited by: Lisa Whalley
Reviewed by: three anonymous referees
Atkinson, R., Baulch, D. L., Cox, R. A., Crowley, J. N., Hampson, R. F., Hynes, R. G., Jenkin, M. E., Rossi, M. J., and Troe, J.: Evaluated kinetic and photochemical data for atmospheric chemistry: Volume I – gas phase reactions of Ox, HOx, NOx and SOx species, Atmos. Chem. Phys., 4, 1461–1738, https://doi.org/10.5194/acp-4-1461-2004, 2004.
Bekooy, J. P., Meerts, W. L., and Dymanus, A.: High-Resolution Laser-rf Spectroscopy on the A2Π3∕2-X2Π3∕2 System of Iodine Oxide (IO), J. Mol. Spectrosc., 102, 320–343, https://doi.org/10.1016/0022-2852(83)90044-9, 1983.
Bonn, B., Bourtsoukidis, E., Sun, T. S., Bingemer, H., Rondo, L., Javed, U., Li, J., Axinte, R., Li, X., Brauers, T., Sonderfeld, H., Koppmann, R., Sogachev, A., Jacobi, S., and Spracklen, D. V.: The link between atmospheric radicals and newly formed particles at a spruce forest site in Germany, Atmos. Chem. Phys., 14, 10823–10843, https://doi.org/10.5194/acp-14-10823-2014, 2014.
Bradshaw, J., Davis, D., Crawford, J., Chen, G., Shetter, R., Muller, M., Gregory, G., Sachse, G., Blake, D., Heikes, B., Singh, H., Mastromarino, J., and Sandholm, S.: Photofragmentation two-photon laser-induced fluorescence detection of NO2 and NO: Comparison of measurements with model results based on airborne observations during PEM-Tropics A, Geophys. Res. Lett., 26, 471–474, https://doi.org/10.1029/1999gl900015, 1999.
Browne, E. C. and Cohen, R. C.: Effects of biogenic nitrate chemistry on the NOx lifetime in remote continental regions, Atmos. Chem. Phys., 12, 11917–11932, https://doi.org/10.5194/acp-12-11917-2012, 2012.
Burkholder, J. B., Talukdar, R. K., Ravishankara, A. R., and Solomon, S.: Temperature-Dependence of the HNO3 UV Absorption Cross-Sections, J. Geophys. Res.-Atmos., 98, 22937–22948, https://doi.org/10.1029/93jd02178, 1993.
Butkovskaya, N., Kukui, A., and Le Bras, G.: HNO3 forming channel of the HO2 + NO reaction as a function of pressure and temperature in the ranges of 72–600 torr and 223–323 K, J. Phys. Chem. A, 111, 9047–9053, https://doi.org/10.1021/jp074117m, 2007.
Cantrell, C. A.: Technical Note: Review of methods for linear least-squares fitting of data and application to atmospheric chemistry problems, Atmos. Chem. Phys., 8, 5477–5487, https://doi.org/10.5194/acp-8-5477-2008, 2008.
Cariolle, D., Evans, M. J., Chipperfield, M. P., Butkovskaya, N., Kukui, A., and Le Bras, G.: Impact of the new HNO3-forming channel of the HO2 + NO reaction on tropospheric HNO3, NOx, HOx and ozone, Atmos. Chem. Phys., 8, 4061–4068, https://doi.org/10.5194/acp-8-4061-2008, 2008.
Carpenter, L. J., Monks, P. S., Bandy, B. J., Penkett, S. A., Galbally, I. E., and Meyer, C. P.: A study of peroxy radicals and ozone photochemistry at coastal sites in the northern and southern hemispheres, J. Geophys. Res.-Atmos., 102, 25417–25427, https://doi.org/10.1029/97jd02242, 1997.
Clapp, L. J. and Jenkin, M. E.: Analysis of the relationship between ambient levels Of O3, NO2 and NO as a function of NO chi in the UK, Atmos. Environ., 35, 6391–6405, https://doi.org/10.1016/S1352-2310(01)00378-8, 2001.
Cleary, P. A., Wooldridge, P. J., and Cohen, R. C.: Laser-induced fluorescence detection of atmospheric NO2 with a commercial diode laser and a supersonic expansion, Appl. Optics, 41, 6950–6956, https://doi.org/10.1364/Ao.41.006950, 2002.
Commane, R., Seitz, K., Bale, C. S. E., Bloss, W. J., Buxmann, J., Ingham, T., Platt, U., Pöhler, D., and Heard, D. E.: Iodine monoxide at a clean marine coastal site: observations of high frequency variations and inhomogeneous distributions, Atmos. Chem. Phys., 11, 6721–6733, https://doi.org/10.5194/acp-11-6721-2011, 2011.
Crawford, J., Davis, D., Chen, G., Bradshaw, J., Sandholm, S., Gregory, G., Sachse, G., Anderson, B., Collins, J., Blake, D., Singh, H., Heikes, B., Talbot, R., and Rodriguez, J.: Photostationary state analysis of the NO2-NO system based on airborne observations from the western and central North Pacific, J. Geophys. Res.-Atmos., 101, 2053–2072, https://doi.org/10.1029/95jd02201, 1996.
Crutzen, P. J.: Role of NO and NO2 in the Chemistry of the Troposphere and Stratosphere, Annu. Rev. Earth Pl. Sc., 7, 443–472, https://doi.org/10.1146/annurev.ea.07.050179.002303, 1979.
Dari-Salisburgo, C., Di Carlo, P., Giammaria, F., Kajii, Y., and D'Altorio, A.: Laser induced fluorescence instrument for NO2 measurements: Observations at a central Italy background site, Atmos. Environ., 43, 970–977, https://doi.org/10.1016/j.atmosenv.2008.10.037, 2009.
Day, D. A., Wooldridge, P. J., Dillon, M. B., Thornton, J. A., and Cohen, R. C.: A thermal dissociation laser-induced fluorescence instrument for in situ detection of NO2, peroxy nitrates, alkyl nitrates, and HNO3, J. Geophys. Res.-Atmos., 107, 4046, https://doi.org/10.1029/2001jd000779, 2002.
Di Carlo, P., Aruffo, E., Busilacchio, M., Giammaria, F., Dari-Salisburgo, C., Biancofiore, F., Visconti, G., Lee, J., Moller, S., Reeves, C. E., Bauguitte, S., Forster, G., Jones, R. L., and Ouyang, B.: Aircraft based four-channel thermal dissociation laser induced fluorescence instrument for simultaneous measurements of NO2, total peroxy nitrate, total alkyl nitrate, and HNO3, Atmos. Meas. Tech., 6, 971–980, https://doi.org/10.5194/amt-6-971-2013, 2013.
Ehhalt, D. H., Rohrer, F., and Wahner, A.: Sources and distribution of NOx in the upper troposphere at northern midlatitudes, J. Geophys. Res., 97, 3725–3738, https://doi.org/10.1029/91JD03081, 1992..
Fong, C. and Brune, W. H.: A laser induced fluorescence instrument for measuring tropospheric NO2, Rev. Sci. Instrum., 68, 4253, https://doi.org/10.1063/1.1148384, 1997.
Fontijn, A., Sabadell, A. J., and Ronco, R. J.: Homogeneous Chemiluminescent Measurement of Nitric Oxide with Ozone – Implications for Continuous Selective Monitoring of Gaseous Air Pollutants, Anal. Chem., 42, 575–579, https://doi.org/10.1021/Ac60288a034, 1970.
Ge, B. Z., Sun, Y. L., Liu, Y., Dong, H. B., Ji, D. S., Jiang, Q., Li, J., and Wang, Z. F.: Nitrogen dioxide measurement by cavity attenuated phase shift spectroscopy (CAPS) and implications in ozone production efficiency and nitrate formation in Beijing, China, J. Geophys. Res.-Atmos., 118, 9499–9509, https://doi.org/10.1002/Jgrd.50757, 2013.
George, L. A. and Obrien, R. J.: Prototype Fage Determination of NO2, J. Atmos. Chem., 12, 195–209, https://doi.org/10.1007/Bf00048073, 1991.
Ghosh, B., Papanastasiou, D. K., Talukdar, R. K., Roberts, J. M., and Burkholder, J. B.: Nitryl Chloride (CINO2): UV/Vis Absorption Spectrum between 210 and 296 K and O(P-3) Quantum Yield at 193 and 248 nm, J. Phys. Chem. A, 116, 5796–5805, https://doi.org/10.1021/Jp207389y, 2012.
Gil-Ojeda, M., Navarro-Comas, M., Gómez-Martín, L., Adame, J. A., Saiz-Lopez, A., Cuevas, C. A., González, Y., Puentedura, O., Cuevas, E., Lamarque, J.-F., Kinninson, D., and Tilmes, S.: NO2 seasonal evolution in the north subtropical free troposphere, Atmos. Chem. Phys., 15, 10567–10579, https://doi.org/10.5194/acp-15-10567-2015, 2015.
Gottschaldt, K., Voigt, C., Jöckel, P., Righi, M., Deckert, R., and Dietmüller, S.: Global sensitivity of aviation NOx effects to the HNO3-forming channel of the HO2 + NO reaction, Atmos. Chem. Phys., 13, 3003–3025, https://doi.org/10.5194/acp-13-3003-2013, 2013.
Harwood, M. H., Jones, R. L., Cox, R. A., Lutman, E., and Rattigan, O. V.: Temperature-Dependent Absorption Cross-Sections of N2O5, J. Photoch. Photobio. A, 73, 167–175, https://doi.org/10.1016/1010-6030(93)90001-2, 1993.
Harwood, M. H., Burkholder, J. B., Hunter, M., Fox, R. W., and Ravishankara, A. R.: Absorption cross sections and self-reaction kinetics of the IO radical, J. Phys. Chem. A, 101, 853–863, https://doi.org/10.1021/Jp962429b, 1997.
Herndon, S. C., Shorter, J. H., Zahniser, M. S., Nelson, D. D., Jayne, J., Brown, R. C., Miake-Lye, R. C., Waitz, I., Silva, P., Lanni, T., Demerjian, K., and Kolb, C. E.: NO and NO2 emission ratios measured from in-use commercial aircraft during taxi and takeoff, Environ. Sci. Technol., 38, 6078–6084, https://doi.org/10.1021/Es049701c, 2004.
Herriott, D., Kompfner, R., and Kogelnik, H.: Off-Axis Paths in Spherical Mirror Interferometers, Appl. Optics, 3, 523, https://doi.org/10.1364/Ao.3.000523, 1964.
Hofzumahaus, A., Rohrer, F., Lu, K. D., Bohn, B., Brauers, T., Chang, C. C., Fuchs, H., Holland, F., Kita, K., Kondo, Y., Li, X., Lou, S. R., Shao, M., Zeng, L. M., Wahner, A., and Zhang, Y. H.: Amplified Trace Gas Removal in the Troposphere, Science, 324, 1702–1704, https://doi.org/10.1126/science.1164566, 2009.
Horowitz, A., Meller, R., and Moortgat, G. K.: The UV-VIS absorption cross sections of the alpha-dicarbonyl compounds: Pyruvic acid, biacetyl and glyoxal, J. Photoch. Photobio. A, 146, 19–27, https://doi.org/10.1016/S1010-6030(01)00601-3, 2001.
Hosaynali Beygi, Z., Fischer, H., Harder, H. D., Martinez, M., Sander, R., Williams, J., Brookes, D. M., Monks, P. S., and Lelieveld, J.: Oxidation photochemistry in the Southern Atlantic boundary layer: unexpected deviations of photochemical steady state, Atmos. Chem. Phys., 11, 8497–8513, https://doi.org/10.5194/acp-11-8497-2011, 2011.
Keller-Rudek, H., Moortgat, G. K., Sander, R., and Sörensen, R.: The MPI-Mainz UV ∕ VIS Spectral Atlas of Gaseous Molecules of Atmospheric Interest, Earth Syst. Sci. Data, 5, 365–373, https://doi.org/10.5194/essd-5-365-2013, 2013.
Kubistin, D., Harder, H., Martinez, M., Rudolf, M., Sander, R., Bozem, H., Eerdekens, G., Fischer, H., Gurk, C., Klüpfel, T., Königstedt, R., Parchatka, U., Schiller, C. L., Stickler, A., Taraborrelli, D., Williams, J., and Lelieveld, J.: Hydroxyl radicals in the tropical troposphere over the Suriname rainforest: comparison of measurements with the box model MECCA, Atmos. Chem. Phys., 10, 9705–9728, https://doi.org/10.5194/acp-10-9705-2010, 2010.
Land, D. V., Levick, A. P., and Hand, J. W.: The use of the Allan deviation for the measurement of the noise and drift performance of microwave radiometers, Meas. Sci. Technol., 18, 1917–1928, https://doi.org/10.1088/0957-0233/18/7/018, 2007.
Lelieveld, J. and Crutzen, P. J.: Influences of Cloud Photochemical Processes on Tropospheric Ozone, Nature, 343, 227–233, https://doi.org/10.1038/343227a0, 1990.
Lelieveld, J., Butler, T. M., Crowley, J. N., Dillon, T. J., Fischer, H., Ganzeveld, L., Harder, H., Lawrence, M. G., Martinez, M., Taraborrelli, D., and Williams, J.: Atmospheric oxidation capacity sustained by a tropical forest, Nature, 452, 737–740, https://doi.org/10.1038/nature06870, 2008.
Li, J. S., Reiffs, A., Parchatka, U., and Fischer, H.: In Situ Measurements of Atmospheric Co and Its Correlation with NOx and O3 at a Rural Mountain Site, Metrol. Meas. Syst., 22, 25–38, 2015.
Logan, J. A.: Nitrogen-Oxides in the Troposphere – Global and Regional Budgets, J. Geophys. Res.-Oc. Atm., 88, 785–807, https://doi.org/10.1029/Jc088ic15p10785, 1983.
Martinez, M., Harder, H., Kubistin, D., Rudolf, M., Bozem, H., Eerdekens, G., Fischer, H., Klüpfel, T., Gurk, C., Königstedt, R., Parchatka, U., Schiller, C. L., Stickler, A., Williams, J., and Lelieveld, J.: Hydroxyl radicals in the tropical troposphere over the Suriname rainforest: airborne measurements, Atmos. Chem. Phys., 10, 3759–3773, https://doi.org/10.5194/acp-10-3759-2010, 2010.
Matsumi, Y., Murakami, S., Kono, M., Takahashi, K., Koike, M., and Kondo, Y.: High-sensitivity instrument for measuring atmospheric NO2, Anal. Chem., 73, 5485–5493, https://doi.org/10.1021/Ac010552f, 2001.
Matsumoto, J. and Kajii, Y.: Improved analyzer for nitrogen dioxide by laser-induced fluorescence technique, Atmos. Environ., 37, 4847–4851, https://doi.org/10.1016/j.atmosenv.2003.08.023, 2003.
Matsumoto, J., Hirokawa, J., Akimoto, H., and Kajii, Y.: Direct measurement of NO2 in the marine atmosphere by laser-induced fluorescence technique, Atmos. Environ., 35, 2803–2814, https://doi.org/10.1016/S1352-2310(01)00078-4, 2001.
Meller, R., Raber, W., Crowley, J. N., Jenkin, M. E., and Moortgat, G. K.: The Uv-Visible Absorption-Spectrum of Methylglyoxal, J. Photoch. Photobio. A, 62, 163–171, https://doi.org/10.1016/1010-6030(91)87017-P, 1991.
Molina, L. T. and Molina, M. J.: Ultraviolet-Absorption Spectrum of Chlorine Nitrite, Clono, Geophys. Res. Lett., 4, 83–86, https://doi.org/10.1029/Gl004i002p00083, 1977.
Molina, L. T. and Molina, M. J.: Chlorine Nitrate Ultraviolet-Absorption Spectrum at Stratospheric Temperatures, J. Photochem., 11, 139–144, https://doi.org/10.1016/0047-2670(79)80047-7, 1979.
Mollner, A. K., Valluvadasan, S., Feng, L., Sprague, M. K., Okumura, M., Milligan, D. B., Bloss, W. J., Sander, S. P., Martien, P. T., Harley, R. A., McCoy, A. B., and Carter, W. P. L.: Rate of Gas Phase Association of Hydroxyl Radical and Nitrogen Dioxide, Science, 330, 646–649, https://doi.org/10.1126/science.1193030, 2010.
Monks, P. S.: Gas-phase radical chemistry in the troposphere, Chem. Soc. Rev., 34, 376–395, https://doi.org/10.1039/b307982c, 2005.
Newman, S. M., Howie, W. H., Lane, I. C., Upson, M. R., and Orr-Ewing, A. J.: Predissociation of the A2Π3∕2 state of IO studied by cavity ring-down spectroscopy, J. Chem. Soc. Faraday. T., 94, 2681–2688, https://doi.org/10.1039/A805103h, 1998.
Osthoff, H. D., Brown, S. S., Ryerson, T. B., Fortin, T. J., Lerner, B. M., Williams, E. J., Pettersson, A., Baynard, T., Dube, W. P., Ciciora, S. J., and Ravishankara, A. R.: Measurement of atmospheric NO2 by pulsed cavity ring-down spectroscopy, J. Geophys. Res.-Atmos., 111, D12305, https://doi.org/10.1029/2005jd006942, 2006.
Parra, J. and George, L. A.: Development of an ambient pressure laser-induced fluorescence instrument for nitrogen dioxide, Appl. Optics, 48, 3355–3361, https://doi.org/10.1364/AO.48.003355, 2009.
Perner, D. and Platt, U.: Detection of Nitrous-Acid in the Atmosphere by Differential Optical-Absorption, Geophys. Res. Lett., 6, 917–920, https://doi.org/10.1029/Gl006i012p00917, 1979.
Phillips, G. J., Tang, M. J., Thieser, J., Brickwedde, B., Schuster, G., Bohn, B., Lelieveld, J., and Crowley, J. N.: Significant concentrations of nitryl chloride observed in rural continental Europe associated with the influence of sea salt chloride and anthropogenic emissions, Geophys. Res. Lett., 39, L10811, https://doi.org/10.1029/2012gl051912, 2012.
Platt, U. and Stutz, J.: Differential Optical Absorption Spectroscopy, Springer-Verlag, Berlin Heidelberg, 2008.
Platt, U., Perner, D., and Patz, H. W.: Simultaneous Measurement of Atmospheric CH2O, O3, and NO2 by Differential Optical-Absorption, J. Geophys. Res.-Oc. Atm., 84, 6329–6335, https://doi.org/10.1029/Jc084ic10p06329, 1979.
Platt, U., Meinen, J., Pöhler, D., and Leisner, T.: Broadband Cavity Enhanced Differential Optical Absorption Spectroscopy (CE-DOAS) – applicability and corrections, Atmos. Meas. Tech., 2, 713–723, https://doi.org/10.5194/amt-2-713-2009, 2009.
Pöhler, D., Vogel, L., Friess, U., and Platt, U.: Observation of halogen species in the Amundsen Gulf, Arctic, by active long-path differential optical absorption spectroscopy, P. Natl. Acad. Sci. USA, 107, 6582–6587, https://doi.org/10.1073/pnas.0912231107, 2010.
Reed, C., Evans, M. J., Di Carlo, P., Lee, J. D., and Carpenter, L. J.: Interferences in photolytic NO2 measurements: explanation for an apparent missing oxidant?, Atmos. Chem. Phys., 16, 4707–4724, https://doi.org/10.5194/acp-16-4707-2016, 2016.
Riley, W. J.: A test suite for the calculation of time domain frequency stability, Proceedings of the 1995 Ieee International Frequency Control Symposium, 360–366, https://doi.org/10.1109/Freq.1995.483922, 1995.
Riley, W. J.: Handbook of Frequency Stability Analysis, National Institute of Standards and Technology (NIST), U.S. Department of Commerce, USA, 136 pp., 2008.
Ryerson, T. B., Williams, E. J., and Fehsenfeld, F. C.: An efficient photolysis system for fast-response NO2 measurements, J. Geophys. Res.-Atmos., 105, 26447–26461, https://doi.org/10.1029/2000jd900389, 2000.
Sakurai, K. and Broida, H. P.: Spectral Study of NO2 Fluorescence Excited by 11 Lines of Argon and Krypton Ion Lasers, J. Chem. Phys., 50, 2404, https://doi.org/10.1063/1.1671395, 1969.
Sander, S. P., Abbatt, J., Barker, J. R., Burkholder, J. B., Friedl, R. R., Golden, D. M., Huie, R. E., Kolb, C. E., Kurylo, M. J., Moortgat, G. K., Orkin, V. L., and Wine, P. H.: Chemical Kinetics and Photochemical Data for Use in Atmospheric Studies, JPL Publication, Jet Propulsion Laboratory, Pasadena, 10-6, 2011.
Sandholm, S. T., Bradshaw, J. D., Dorris, K. S., Rodgers, M. O., and Davis, D. D.: An Airborne Compatible Photofragmentation 2-Photon Laser-Induced Fluorescence Instrument for Measuring Background Tropospheric Levels of NO, NOx, and NO2, J. Geophys. Res.-Atmos., 95, 10155–10161, https://doi.org/10.1029/JD095iD07p10155, 1990.
Schreier, S. F., Richter, A., Wittrock, F., and Burrows, J. P.: Estimates of free-tropospheric NO2 and HCHO mixing ratios derived from high-altitude mountain MAX-DOAS observations at midlatitudes and in the tropics, Atmos. Chem. Phys., 16, 2803–2817, https://doi.org/10.5194/acp-16-2803-2016, 2016.
Seinfeld, J. H. and Pandis, S. N.: Atmospheric Chemistry and Physics – From Air Pollution to Climate Change, 2nd edn., John Wiley & Sons, Hoboken, New Jersey, 2006.
Singer, R. J., Crowley, J. N., Burrows, J. P., Schneider, W., and Moortgat, G. K.: Measurement of the Absorption Cross-Section of Peroxynitric Acid between 210 and 330 nm in the Range 253–298 K, J. Photoch. Photobio. A, 48, 17–32, https://doi.org/10.1016/1010-6030(89)87086-8, 1989.
Staffelbach, T. A., Orlando, J. J., Tyndall, G. S., and Calvert, J. G.: The Uv-Visible Absorption-Spectrum and Photolysis Quantum Yields of Methylglyoxal, J. Geophys. Res.-Atmos., 100, 14189–14198, https://doi.org/10.1029/95jd00541, 1995.
Stavrakou, T., Müller, J.-F., Boersma, K. F., van der A, R. J., Kurokawa, J., Ohara, T., and Zhang, Q.: Key chemical NOx sink uncertainties and how they influence top-down emissions of nitrogen oxides, Atmos. Chem. Phys., 13, 9057–9082, https://doi.org/10.5194/acp-13-9057-2013, 2013.
Strand, A. and Hov, O.: The impact of man-made and natural NOx emissions on upper tropospheric ozone: A two-dimensional model study, Atmos. Environ., 30, 1291–1303, https://doi.org/10.1016/1352-2310(95)00413-0, 1996.
Sugimoto, N., Takezawa, S., and Takeuchi, N.: Time-Resolved, Dispersed Laser-Induced Fluorescence of NO2 – Observation of Collision-Induced Energy-Transfer Effect, Jpn. J. Appl. Phys., 1, 1536–1538, https://doi.org/10.1143/Jjap.21.1536, 1982.
Taketani, F., Kawai, M., Takahashi, K., and Matsumi, Y.: Trace detection of atmospheric NO2 by laser-induced fluorescence using a GaN diode laser and a diode-pumped YAG laser, Appl. Optics, 46, 907–915, https://doi.org/10.1364/Ao.46.000907, 2007.
Talukdar, R. K., Burkholder, J. B., Schmoltner, A. M., Roberts, J. M., Wilson, R. R., and Ravishankara, A. R.: Investigation of the Loss Processes for Peroxyacetyl Nitrate in the Atmosphere – UV Photolysis and Reaction with OH, J. Geophys. Res.-Atmos., 100, 14163–14173, https://doi.org/10.1029/95jd00545, 1995.
Thieser, J., Schuster, G., Schuladen, J., Phillips, G. J., Reiffs, A., Parchatka, U., Pöhler, D., Lelieveld, J., and Crowley, J. N.: A two-channel thermal dissociation cavity ring-down spectrometer for the detection of ambient NO2, RO2NO2 and RONO2, Atmos. Meas. Tech., 9, 553–576, https://doi.org/10.5194/amt-9-553-2016, 2016.
Thornton, J. A., Wooldridge, P. J., and Cohen, R. C.: Atmospheric NO2: In situ laser-induced fluorescence detection at parts per trillion mixing ratios, Anal. Chem., 72, 528–539, https://doi.org/10.1021/Ac9908905, 2000.
Vandaele, A. C., Hermans, C., Fally, S., Carleer, M., Colin, R., Merienne, M. F., Jenouvrier, A., and Coquart, B.: High-resolution Fourier transform measurement of the NO2 visible and near-infrared absorption cross sections: Temperature and pressure effects, J. Geophys. Res.-Atmos., 107, 4348, https://doi.org/10.1029/2001jd000971, 2002.
Villena, G., Bejan, I., Kurtenbach, R., Wiesen, P., and Kleffmann, J.: Interferences of commercial NO2 instruments in the urban atmosphere and in a smog chamber, Atmos. Meas. Tech., 5, 149–159, https://doi.org/10.5194/amt-5-149-2012, 2012.
Washenfelder, R. A., Langford, A. O., Fuchs, H., and Brown, S. S.: Measurement of glyoxal using an incoherent broadband cavity enhanced absorption spectrometer, Atmos. Chem. Phys., 8, 7779–7793, https://doi.org/10.5194/acp-8-7779-2008, 2008.
Wayne, R. P., Barnes, I., Biggs, P., Burrows, J. P., Canosamas, C. E., Hjorth, J., Lebras, G., Moortgat, G. K., Perner, D., Poulet, G., Restelli, G., and Sidebottom, H.: The Nitrate Radical – Physics, Chemistry, and the Atmosphere, Atmos. Environ. A, 25, 1–203, https://doi.org/10.1016/0960-1686(91)90192-A, 1991.
Wehry, E. L.: Modern fluorescence spectroscopy, Modern analytical chemistry, Plenum Press, New York, 1, 4 pp., 1976.
Weisstein, E. W.: CRC concise encyclopedia of mathematics, 2nd edn., Chapman & Hall/CRC, Boca Raton, 3242 pp., 2003.
Wojtas, J., Stacewicz, T., Bielecki, Z., Czyzewski, A., and Nowakowski, M.: NO2 monitoring setup applying cavity enhanced absorption spectroscopy, Eurocon 2007, The International Conference on Computer as a Tool, 1–6, 2152–2154, https://doi.org/10.1109/EURCON.2007.4400586, 2007.
Wood, E. C., Wooldridge, P. J., Freese, J. H., Albrecht, T., and Cohen, R. C.: Prototype for In Situ Detection of Atmospheric NO3 and N2O5 via Laser-Induced Fluorescence, Environ. Sci. Technol., 37, 5732–5738, https://doi.org/10.1021/es034507w, 2003.
York, D., Evensen, N. M., Martinez, M. L., and Delgado, J. D.: Unified equations for the slope, intercept, and standard errors of the best straight line, Am. J. Phys., 72, 367–375, https://doi.org/10.1119/1.1632486, 2004.
Omicron Laserage (CW Diode-Laser), laserproduckte
GmbH, Germany.
Power stability <1 % h−1, pointing
stability <10 µrad.
Beam diameter: 2.55 (perpendicular:
0∘ mm−1) and 2.53 (parallel:
90∘ mm−1)
Hamamatsu (H7421-50), Japan, count sensitivity: 2.1×10⁵ at 550 nm and 3.9×10⁵ at 800 nm.
Initial parameters for this specific simulation: , , residence time in the reaction chamber is 7.5 s, flow is 8000 sccm, temperature and pressure are 298 K and 1013.25 hPa
The lifetime is calculated from an IUPAC rate coefficient (temperature =298 K and pressure =1 bar) for the sampling line before the orifice.