the Creative Commons Attribution 4.0 License.
the Creative Commons Attribution 4.0 License.
 | 26 Mar 2019
Chemical ionization quadrupole mass spectrometer with an electrical discharge ion source for atmospheric trace gas measurement
Philipp G. Eger
Frank Helleis
Gerhard Schuster
Gavin J. Phillips
Jos Lelieveld
We present a chemical ionization quadrupole mass spectrometer (CI-QMS) with a radio-frequency (RF) discharge ion source through N2∕CH3I as a source of primary ions. In addition to the expected detection of PAN, peracetic acid (PAA) and ClNO2 through well-established ion–molecule reactions with I− and its water cluster, the instrument is also sensitive to SO2, HCl and acetic acid (CH3C(O)OH) through additional ion chemistry unique to our ion source. We present ionization schemes for detection of SO2, HCl and acetic acid along with illustrative datasets from three different field campaigns underlining the potential of the CI-QMS with an RF discharge ion source as an alternative to 210Po. The additional sensitivity to SO2 and HCl makes the CI-QMS suitable for investigating the role of sulfur and chlorine chemistry in the polluted marine and coastal boundary layer.
- Article
(2712 KB) -
Supplement
(805 KB) - BibTeX
- EndNote


Chemical ionization mass spectrometry using iodide anions (commonly referred to as I-CIMS) is a widely used technique to measure various atmospheric trace gases with a high temporal resolution and low detection limit. The potential of I-CIMS for atmospheric trace gas measurement was established in laboratory studies (Huey et al., 1995) on chlorine nitrate (ClONO2), which plays a central role in polar stratospheric O3 depletion (Molina et al., 1987), and dinitrogen pentoxide (N2O5), which, through its heterogeneous hydrolysis on cloud droplets and aerosols, acts as a sink of gas-phase NOx (NO+NO2) (Lelieveld and Crutzen, 1990; Dentener and Crutzen, 1993). The first applications of I-CIMS for monitoring atmospheric composition were for measurement of N2O5, peroxyacyl nitric anhydride (PAN, CH3C(O)O2NO2) and other peroxycarboxylic nitric anhydrides (Huey, 2007). Since then it has been recognized that several classes of organic and inorganic trace gases can be detected sensitively by I-CIMS including organic and inorganic acids, organic nitrates, halogen nitrates and di-halogens (Phillips et al., 2013; Lee et al., 2014; Neuman et al., 2016; Priestley et al., 2018). Our instrument has previously been deployed with a radioactive ion source (210Po) to investigate the atmospheric chemistry of nitryl chloride (ClNO2), PAN and peracetic acid (PAA, CH3C(O)OOH) (Phillips et al., 2012, 2013, 2016; Crowley et al., 2018).
PAN (and other peroxycarboxylic nitric anhydrides) are formed in the atmosphere via the reaction of NO2 with peroxyacyl radicals (RC(O)O2) generated during the photo-oxidation of volatile organic compounds. Slusher et al. (2004) reported the first detection of PAN, PPN (peroxypropionic nitric anhydride), MPAN (peroxymethacrylic nitric anhydride) and PiBN (peroxyisobutyric nitric anhydride) using thermal decomposition chemical ionization mass spectrometry (TD-CIMS) with iodide ions. The most abundant, PAN, is of great importance owing to its role in transportation of NO2 from source regions to remote areas (Moxim et al., 1996). The detection of PAN and its analogues via I-CIMS requires thermal dissociation (generally at temperatures close to 100 ∘C) to the peroxy radical, which then reacts with I− primary ions to form the carboxylate anion, which is then detected. Compared to gas chromatographic methods for detection of peroxycarboxylic nitric anhydrides, the I-CIMS technique allows faster measurements with comparable sensitivity and selectivity (Slusher et al., 2004; Roiger et al., 2011), enabling eddy covariance flux measurements (Turnipseed et al., 2006; Wolfe et al., 2009). Although the bond dissociation energy of the peroxycarboxylic nitric anhydrides is similar, Zheng et al. (2011) report lower sensitivity for APAN (peroxyacrylic nitric anhydride), PiBN, PnBN (peroxy-n-butyric nitric anhydride) and CPAN (peroxycrotonyl nitric anhydride) and Mielke and Osthoff (2012) report lower sensitivity for MPAN compared to PPN and PAN. Peroxycarboxylic nitric anhydrides have been measured using I-CIMS in various locations including boreal forests (Phillips et al., 2013), pine forests (Turnipseed et al., 2006; Wolfe et al., 2009), urban areas (Slusher et al., 2004; LaFranchi et al., 2009; Wang et al., 2017) and the Arctic (Roiger et al., 2011).
Detection of PAA by I-CIMS was reported by Phillips et al. (2013), who performed the first combined measurement of PAN and PAA in a boreal forest in Finland. PAA acts as a significant sink for CH3C(O)O2 and HO2 under low-NOx conditions and can compete with PAN formation, especially at high temperatures (Crowley et al., 2018). As for PAN, PAA was detected as the acetate anion at a mass-to-charge ratio (m∕z) of 59. Unlike other TD-CIMS instruments that describe an absence of a residual signal when NO is added to the inlet (e.g. Warneke et al., 2016), the I-CIMS deployed by Phillips et al. (2013) and the instrument presented in this study are very sensitive to PAA at m∕z 59. Furgeson et al. (2011) also describe an interference at m∕z 59 that is not titrated by NO and suggest detection of PAA, which is produced in their photochemical source used for PAN generation. In addition, Veres et al. (2015) report a very similar mechanism to PAA detection for the detection of pernitric acid (PNA). Differences in the sensitivities of various I-CIMS instruments to PAA at m∕z 59 are likely to be associated with different de-clustering potentials. At m∕z 59, the I-CIMS deployed by Phillips et al. (2013) was insensitive to acetic acid. A wide range of organic acids can be detected as an I− cluster, with the parent molecule (Le Breton et al., 2012; Lee et al., 2014) using time-of-flight mass spectrometers (I-CIMS-TOF), which have a high mass resolution and exploit the iodine mass defect for the identification of the elemental composition of the organic trace gases detected.
ClNO2 is formed in the heterogeneous reaction of N2O5 on chloride-containing particles and surfaces during the night (Behnke et al., 1997). The daytime photolysis of ClNO2 results in the release of chlorine atoms, which enhance oxidation rates of organic trace gases, especially during early morning hours (Phillips et al., 2012; Riedel et al., 2012). Nitryl chloride has been observed by I-CIMS as and ICl− in the polluted marine boundary layer (Osthoff et al., 2008; Riedel et al., 2012) close to the coast, for example, in Hong Kong (Wang et al., 2016) and London (Bannan et al., 2015) but also inland in continental North America (Thornton et al., 2010; Mielke et al., 2011; Faxon et al., 2015), rural continental Europe (Phillips et al., 2012) and northern China (Tham et al., 2016).
Most I-CIMS systems in operation for atmospheric measurement use a radioactive ion source (usually 210polonium, an α-emitter) to generate the primary iodide ions from methyl iodide (CH3I). Although this type of ion source is well-established and known for its high stability and low chemical background, important and sometimes unsurmountable obstacles to its use are the safety regulations for the shipment, storage and operation of radioactive devices containing polonium. Potential alternatives are corona discharge and X-ray ion sources, as commonly used in atmospheric pressure chemical ionization mass spectrometers (AP-CIMS) (Jost et al., 2003; Skalny et al., 2007; Kürten et al., 2011; Zheng et al., 2015), though the former have not been used for iodide ion generation.
We have developed a CI-QMS instrument (chemical ionization quadrupole mass spectrometer) with an electrical discharge ion source that generates iodide ions without the use of a radioactive ionizer. Although this instrument was originally intended for measurement of PAN, PAA and ClNO2, we discovered that a wider variety of gas-phase species, including SO2, HCl and acetic acid could be detected. In the following we show that the instrument is suitable for measurement (at the tens of pptv level) of trace gases connected with sulfur and chlorine chemistry, for example, in the anthropogenically influenced marine boundary layer. Its deployment as a PAN detector is limited to environments where PAN mixing ratios regularly exceed 100 pptv or when high temporal resolution is not necessary.
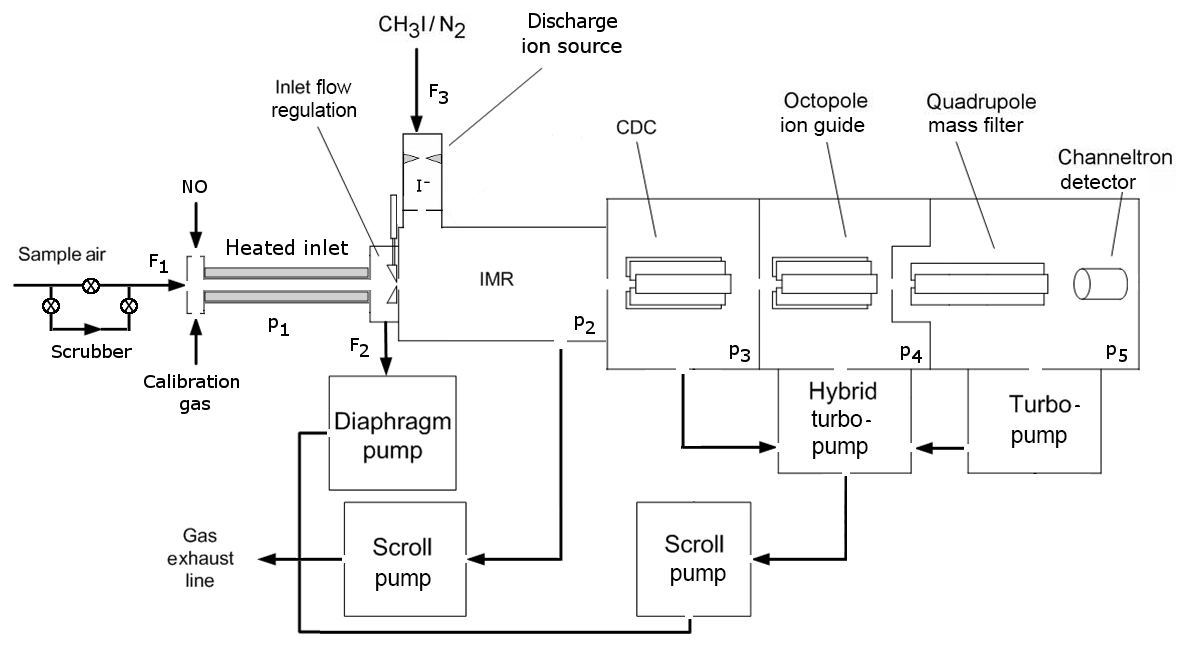
Figure 1Schematic diagram of the CI-QMS. The air is sampled through the TDR (heated inlet) and enters the IMR after optional bypassing through the scrubber and mixing with calibration gas or nitrogen oxide (NO) for PAN background measurement. Ions are guided to the detector via the CDC, OCT and QMF. Typical flows (F) and pressures (p) are F1=2.2, F2=1.0, F3=0.8 slm, p1= ambient pressure, p2=24, p3=0.6, , and mbar.
Our chemical ionization quadrupole mass spectrometer (CI-QMS) is based on the thermal dissociation technique described by Slusher et al. (2004) and Zheng et al. (2011) and was originally constructed in collaboration with Georgia Tech as a prototype THS Instruments product. A schematic diagram of the instrument in its present form is given in Fig. 1. The major modification, forced by issues of the restricted use of polonium on some platforms, is the replacement of the 210Po ionizer with an electrical discharge ion source (see Fig. 2). The instrument as sketched in Fig. 1 consists of a thermal dissociation region (TDR), discharge ion source (DIS), ion molecule reactor (IMR), collisional dissociation chamber (CDC), octopole ion guide (OCT), quadrupole mass filter (QMF) and detector (DET). The four different vacuum chambers are separated by critical orifices and pumped by a combination of scroll pumps and turbo-molecular pumps. The CI-QMS is built into an aircraft rack (HALO, Gulfstream G550) to facilitate airborne operation. A description of the various parts of the instrument as identified in Fig. 1 is given in the following.
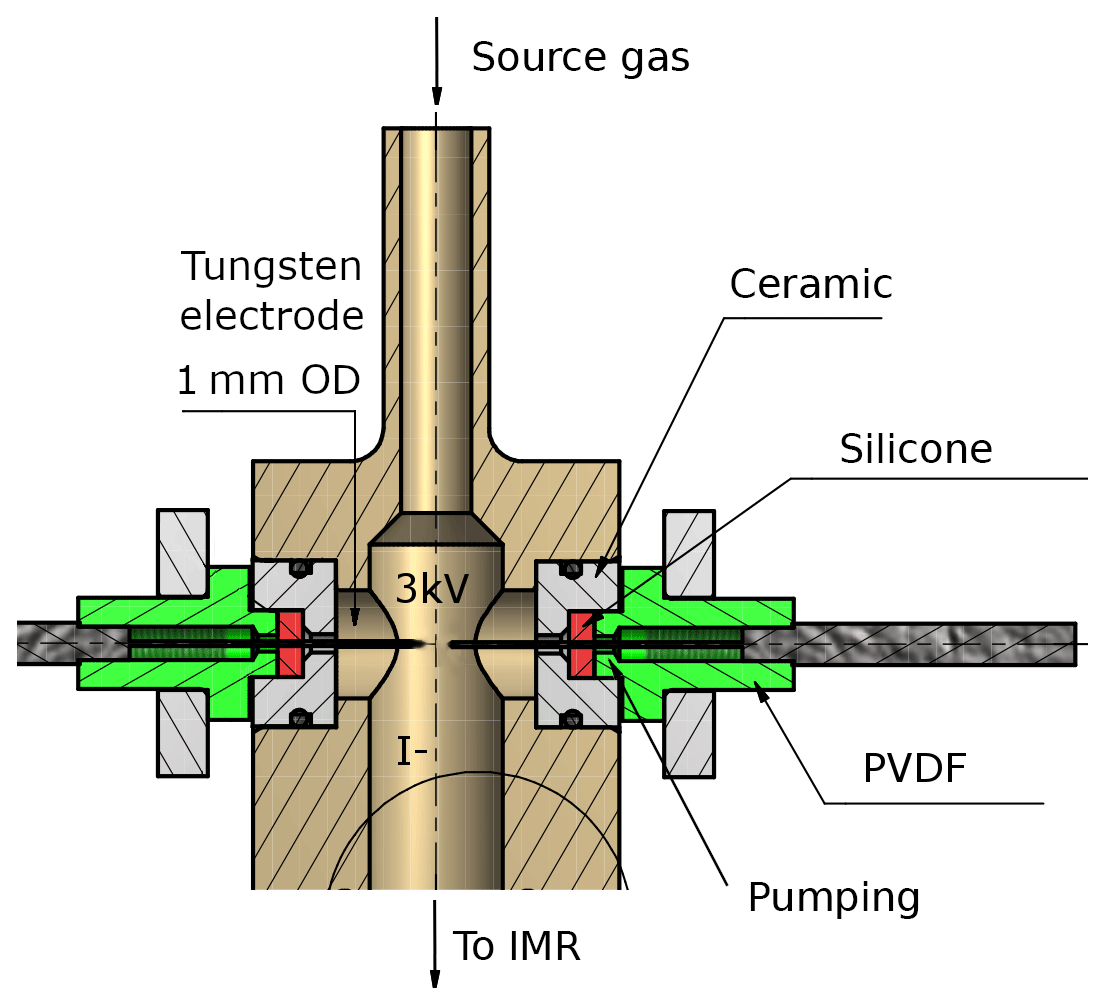
Figure 2Schematic drawing of the RF discharge ion source. The high voltage and the distance between the tips of the tungsten electrodes are variable, as described in the text. A transformer, which is supplied with up to 200 V AC from the internal V25 unit, applies temporarily fluctuating potentials to both electrodes. The body of the ion source (coloured in light brown) is made of stainless steel. PVDF is polyvinylidene fluoride. The region around the electrodes can optionally be pumped as described in the text.
2.1 Thermal dissociation region (TDR)
During standard operation, a flow (F1) of 2.2 L (standard pressure and diameter, STD) min−1 (slm) is sampled through the instrument inlet (see Fig. 1). Ambient air entering the TDR first passes through a 2 µm pore size membrane filter (Pall Teflon) to efficiently remove particles. The thermal decomposition of PAN takes place in a 20 cm length of perfluoroalkoxy (PFA) tubing (9.3 mm internal diameter, ID) enclosed in a snugly fitting stainless steel shell heated to 200 ∘C. A gas temperature of 160–170 ∘C was measured inside the heated section of tubing. The last 4 cm long section of PFA in front of the orifice to the IMR is not actively heated but the gas temperature still remains at ≈130 ∘C, suppressing PAN recombination. Due to space restrictions inside the aircraft rack, the oven is curved over a 90∘ bend; however, no significant reduction in sensitivity due to a loss of CH3C(O)O2 on the PFA walls could be observed when compared to a straight TD inlet. A bypass flow of 1 slm (F2) decreases the inlet residence time and therefore optimizes the peroxyacyl radical transmission. However, as PAN is calibrated in situ with a photochemical source (see Sect. 2.7), the fractional transmission of CH3C(O)O2 does not need to be known. A total of 1.2 slm (F1 minus F2) of the inlet flow enters the IMR via a constant-pressure orifice (see Sect. 2.3) and mixes with the 0.8 slm flow (F3) of CH3I∕N2 passing through the ion source. For ground-level deployment, the TDR is held at ambient pressure resulting in a residence time of ≈200 ms at 1 bar. For application in an aircraft, the arrangement of the TDR and constant-pressure orifice can be switched so that a constant pressure of p1=100 hPa is established in the TDR, resulting in a 40 ms residence time. With this mode of operation, measurements can be made at altitudes up to ≈15 km depending on aircraft inlet configuration.
2.2 Discharge ion source (DIS)
The radio-frequency (RF) discharge ion source represents the major difference to I-CIMS instruments commonly described in the literature. It consists of two tungsten needles, their tips placed at a distance of approximately 6 mm (adjustable) from each other (see Fig. 2); changing this distance by a few millimetres did not have a large effect on the overall ion count rate. The vacuum fittings through which the needles enter the discharge volume can optionally be evacuated to eliminate an air leak into the ion source. A 2.5 kV voltage (20 kHz) applied across the tungsten needles leads to the formation of a stable glow discharge (3 mA). An RF discharge was chosen for its advantages for operation in negative ion mode and because it is easier to handle with regard to electric field geometry and polarity. The discharge between the tungsten needles can be observed by eye or spectroscopically through a quartz viewing port; a photograph of the glow and the dispersed N2 emission spectrum due to the B3Πg← C3Πu transition (Lofthus and Krupenie, 1977; Bayram and Freamat, 2012) is shown in Fig. S1 of the Supplement. The line intensities increase with the voltage applied (≈ factor of 2.5 from 1500 to 3000 V), but the relative intensities do not change significantly. From the relative line intensities we calculate that the N2 molecules have a vibrational temperature of ≈3000 K (Svarnas, 2013).
In normal operation, a flow of 0.8 slm (F3) of 2 ppmv methyl iodide (CH3I) in nitrogen passes through the ionization region. In order to prevent the backflow of air from the IMR into the discharge region, the flow through the ionization region is kept high (0.8 slm) and passes through a 0.9 mm aperture before entering the IMR.
Similar to the α radiation of a 210Po ionizer, I− ions are formed via dissociative electron attachment to CH3I. In contrast to typical corona discharge ion sources with a current of a few µA (see, e.g. Kürten et al., 2011), our glow discharge operates at ≈3 mA, which leads to highly energetic electrons and ions in the ionization region and a more complex mass spectrum (see Sect. 3).
2.3 Ion molecule reactor (IMR)
Under standard operating conditions for ground-level measurements, a flow of 1.2 slm of the air to be analysed (F1 minus F2) is mixed with the 0.8 slm flow of CH3I∕N2 (F3) entering the IMR from the ion source. The IMR is evacuated by a dry scroll vacuum pump (ULVAC DISL-101, 100 L min−1) and is held at a constant pressure of 24 mbar (p2). For operation above the boundary layer, an extra 50 cm3 (standard temperature and pressure, STP) min−1 (sccm) flow of humidified air is added just in front of the IMR to ensure that sufficient water vapour is present to form I−(H2O) clusters. The role of I−(H2O) and other primary-ion clusters with water is discussed in Sect. 5.
The constant pressure within the IMR is achieved by use of a variable orifice consisting of two metal plates, one with a hole shaped like the 2-D projection of a bike saddle and one with a circular hole, the relative position of which (i.e. the degree of overlap of the holes) is controlled by a stepper motor. The saddle form was chosen as it results in a roughly linear relationship between stepper motor position and mass flow through the orifice, enabling rapid and precise adaptation to changes in ambient pressure even during steep ascents or dives of an aircraft.
The temperature in the IMR is above ambient owing to the inflow of heated gas through the TDR. The exact residence time for trace gases to react with primary ions in the IMR is not accurately known, as the mixing of the gas flows and temperature evolution in the IMR are not well characterized. Based on the mass flow rate into the IMR and its volume (≈100 cm3) and disregarding ion drift due to the potential applied between the IMR and the CDC, we calculate an approximate reaction time of ≈70 ms.
2.4 Collisional dissociation chamber (CDC) and octopole ion guide (OCT)
The CDC region consists of an octopole ion guide to accelerate and collimate the effusive ion beam entering from the IMR. It is separated from the IMR by a critical orifice (0.8 mm diameter) and held at a pressure of 0.6 mbar (p3) by the Holweck stage of a turbo-molecular pump (Leybold Turbovac 90 i, 90 L s−1 with an Agilent IDP-3 scroll pump, 50 L min−1 as a backup pump). A potential difference of typically 20 V is applied in the CDC, which results in the de-clustering of weakly bound adducts (often with H2O), a simplified mass spectrum and a higher sensitivity to the product ion of interest. The de-clustering voltage can be varied independently for each ion of interest, thus optimizing sensitivity for individual trace gases. An example of the variable de-clustering potential during operation of the CI-QMS in the selected ion monitoring mode (e.g. to measure the I−(H2O) cluster or differentiate between acetic and peracetic acid) is given below.
An additional octopole ion guide in the subsequent vacuum chamber ( mbar, p4) further collimates the ion beam and guides it to the detector region. This octopole ion guide is evacuated by the turbo-molecular stage of the Leybold Turbovac 90 i.
2.5 Quadrupole mass filter (QMF) and detector (DET)
A radio-frequency generator (Balzers QMH 410-3, 1.44 MHz) provides a combination of direct and alternating voltage to the quadrupole rods (10 mm) so that ions with a specific m∕z are forced on stable trajectories and reach the detector. These ions are then detected with a channel electron multiplier (ITT Ceramax 7550M). The detector chamber is pumped to a pressure of mbar (p5) by a turbo-molecular pump (Varian V70LP, 70 L s−1).
2.6 Scrubber
To determine the instrumental and chemical background, the sampled air is automatically and periodically bypassed into a scrubber (see Fig. 1) consisting of a 20 cm long stainless steel oven filled with steel wool and heated to 120 ∘C. The trace gases discussed in this work are all destroyed efficiently by the hot metal surfaces whilst leaving the relative humidity unaffected.
2.7 Photochemical PAN source
For in situ PAN calibration we use a photochemical source based on the method of Warneck and Zerbach (1992) but with a phosphor-coated Pen-Ray mercury lamp (Jelight, broad emission centred at 285 nm) as described by Flocke et al. (2005). Typically, 50 sccm of acetone (200 ppmv in synthetic air, Air Liquide) and 5 sccm of NO (1 ppmv in N2, Air Liquide) are mixed in a quartz glass reactor (150 mL volume, actively cooled by a fan) at 1050 mbar forming PAN (Reactions R1–R4). The calibration source converts NO almost stoichiometrically to PAN (conversion > 95 %) and results in a mixing ratio of about 4 ppbv of PAN in the TDR. The PAN source is continuously operated and its 55 sccm output drains into the exhaust line, periodically switching into the main flow during scrubbing. The conversion efficiency of NO to PAN was checked using thermal dissociation cavity ring-down spectroscopy as described previously (Phillips et al., 2013). The PAN source also generates both PAA and acetic acid (Reactions R5–R6), which, as described below, are also detected by the CI-QMS.
2.8 Electronics and data acquisition
The vast majority of the instrument's electronics are controlled by a “V25” system developed in-house. The V25 handles the interplay between single components such as flow controllers, pressure gauges, magnetic valves, thermocouples, heaters, MS potentials and RF generators. All command sequences and measurement cycles (background, calibration, etc.) can be customized and fully automated for operation in aircraft or in remote locations. During measurement campaigns we usually focus on specific trace gases and operate in selected ion monitoring mode, typically monitoring between 3 and 10 different values of m∕z. Different m∕z values can be adjusted in a few milliseconds by variation in the direct voltage and the amplitude of the alternating voltage applied to the quadrupole rods. The integration time of the detector for a single channel is usually set to 10 ms for primary ions and 100 ms for product ions, which represents a compromise between high signal-to-noise ratio (S∕N) and high temporal resolution. For each m∕z monitored, the integrated signal is calculated by summing up eight individual channels, resulting in a total integration time (for one product ion) of about 800 ms. Higher-frequency measurements are possible at the cost of a reduction in the signal-to-noise ratio. The counts for each channel and the integrated counts as well as the most important system parameters are saved on an internal PC card and can additionally be collected and monitored online using customized LabView software. To identify additional traces gases of interest, the whole mass spectrum (m∕z 1–256) is occasionally scanned and recorded, which takes about 1–2 min.
2.9 Size, weight and power consumption
The CI-QMS is situated in a compact aircraft rack (65 cm×55 cm×140 cm, HALO, Gulfstream G550) with a total weight of 135 kg and a power consumption of 0.9 kW with the vacuum pumps as the main power consumers. The two vacuum scroll pumps require 230 V AC input whereas all the other components are operated with 24 V DC from an AC/DC converter that either can be supplied with 230 V AC or 115 V AC (three phases, 400 Hz, for aircraft operation).
Table 1Ion source configurations according to Fig. 3 and primary ions observed.
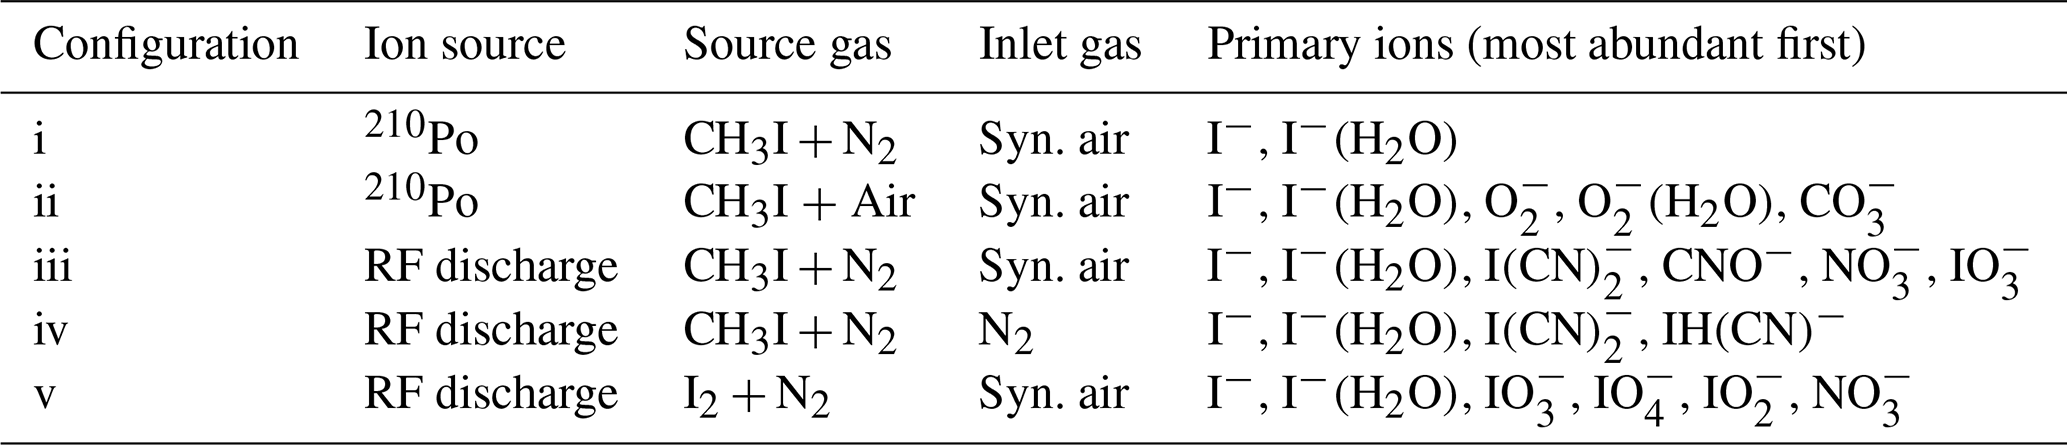
The deployment of an RF discharge source for iodide ion production leads to a more complex primary-ion mass spectrum when compared to use of 210Po; consequently, a wider variety of trace gases can be detected. Here we compare both ion sources with respect to sensitivity and achievable detection limits of a number of trace gases. Figure 3 illustrates the primary-ion spectrum with a discharge ion source under various conditions and compares it to that obtained using 210Po. The absolute ion count rates for both ion sources are comparable, i.e. up to ( Hz for I−. Details of the configurations (i–v) and primary ions observed are summarized in Table 1.

Figure 3Primary-ion spectra (using I2∕N2 (v) or CH3I∕N2 (iii–iv) and using either pure synthetic air (iii) or N2 (iv) for the inlet gas) obtained using the RF discharge (iii–v) or 210Po (i–ii) as an ion source. The integrated counts (eight channels) for each m∕z normalized to the highest peak present are shown, which is I−. For this reason, true peak shapes are not visible. A description of the different configurations can be found in Table 1.
The primary-ion mass spectrum obtained by passing CH3I∕N2 through the 210Po ionizer (370 MBq, configuration i) at typical relative humidity (50 % at 25 ∘C) and low de-clustering voltage (0–2 V) in the CDC is dominated by I− and I−(H2O) at m∕z 127 and 145, with no other significant ion peaks present at > 0.1 % relative signal strength to I−. The background signal for all trace gases of interest, i.e. PAN and PAA at m∕z 59 and ClNO2 at m∕z 208 and 210, is consequently negligible and the detection limits are correspondingly low (a few pptv in 1 s integration time).
With RF discharge and CH3I∕N2 as an ion source gas (configuration iii, applied in all the field measurements we discuss below), the primary-ion mass spectrum is more complex with additional ions such as CNO− (m∕z 42, 37 % of I− at low de-clustering), (m∕z 60, 32 % of I−), (m∕z 62, 5 % of I−), (m∕z 175, 28 % of I−) and (m∕z 179, 67 % of I−). With the de-clustering voltage set to 20 V (the best S∕N ratio for most molecules of interest), the background count rate compared with 210Po is elevated by at least 1 order of magnitude for m∕z 59, which is used to monitor PAN and PAA. The high chemical background is assumed to originate from CH3I breakdown in the discharge ion source and formation of in the ion source and IMR. When pumping the region around the ion source needles, the formation of (m∕z 62) can be reduced by a factor of 2 but the other ions still show similar ion count rates. This observation suggests that a small amount of O2 entering the ion source can form additional . According to manufacturer's specifications the nitrogen supply (N2 6.0, Westfalen AG) can contain up to 0.5 ppmv O2 and H2O, which can also result in the formation of in the ion source.
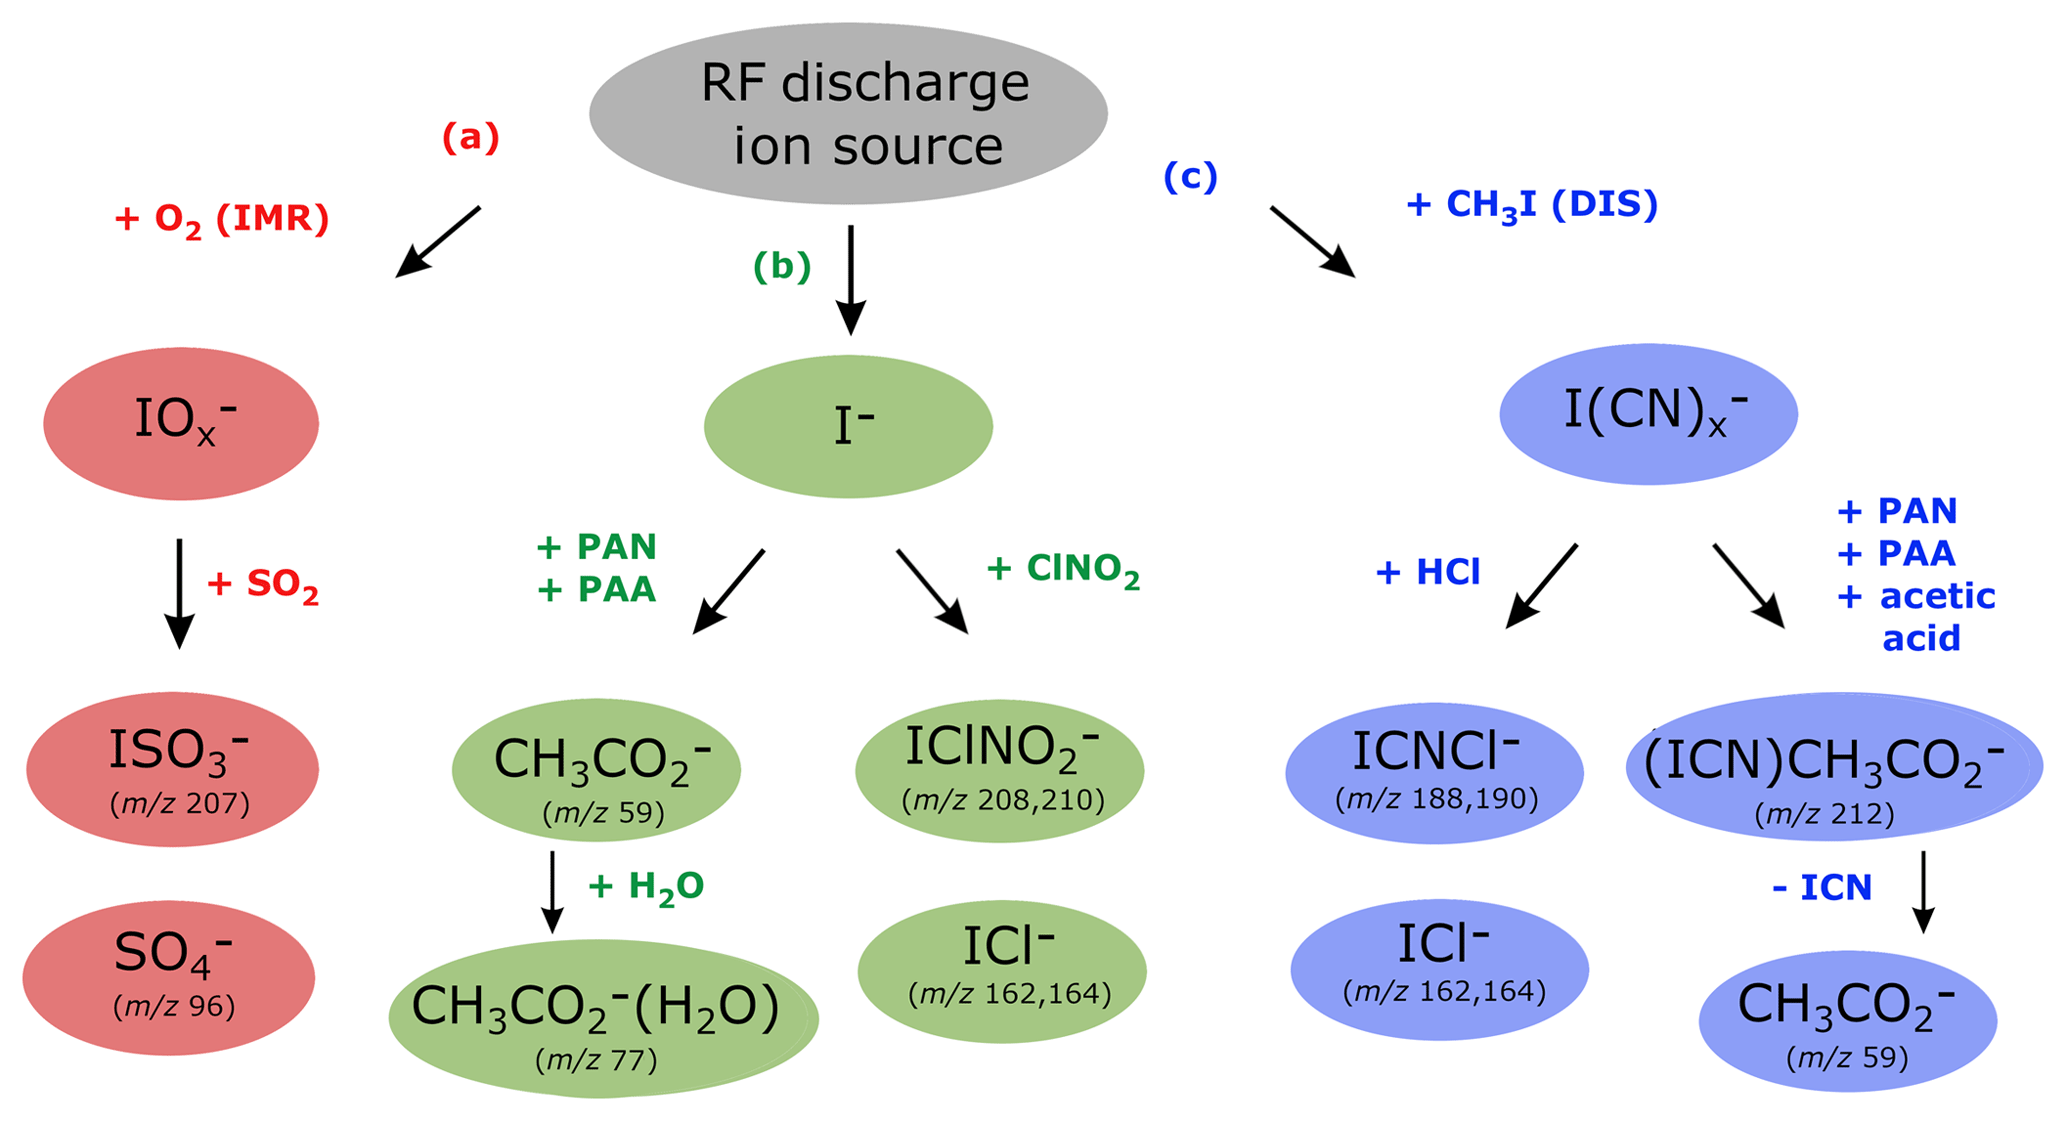
Figure 4Ion detection schemes for SO2, PAN, PAA, acetic acid, ClNO2 and HCl using the RF discharge ion source.
To examine the influence of oxygen in the IMR on the primary ions formed, we switched the main gas flow (i.e. that which does not pass through the RF discharge) from ambient air to pure nitrogen (configuration iv). In this case, apart from I−, only CN− (m∕z 26, 2 % of I− at low de-clustering), IH(CN)− (m∕z 154, 6 % of I−) and (m∕z 179, 9 % of I−) remained. While these conditions are unrealistic for atmospheric measurements they clearly indicate that the presence of additional primary ions containing O atoms and the elevated chemical background on m∕z of interest are highly dependent on the amount of O2 present in the IMR. With pure N2 in the inlet (configuration iv), background signals at m∕z 59, 188, 207 and 208 could be lowered by about an order of magnitude. The use of N2 results in a drastically reduced sensitivity to SO2, as the primary ion used to detect it (; see Sect. 4.2) is no longer abundant. This is illustrated in Fig. S2, where we plot the dependence of the signal (m∕z 175) on the fractional pressure of O2 in the inlet and the signal at m∕z 207 (ISO) used to monitor SO2 (see Sect. 4.2). Clearly, detection of SO2 is not possible without the presence of O2 and is not available when using 210Po as an ion source.
In an attempt to improve the detection limit for PAN by lowering the background signal on m∕z 59, I2, produced from a flow of nitrogen over iodine crystals (configuration v), was used instead of CH3I. This resulted in a significant reduction of background signals, especially on m∕z 59 and the disappearance of all the ion peaks containing C and N atoms with just (m∕z 175, 51 % of I−), (m∕z 191, 38 % of I−), (m∕z 159, 12 % of I−) and (m∕z 62, 8 % of I−) remaining. However, use of I2 was accompanied by a drastic lowering of the sensitivity to PAN, despite comparable I− ion counts at m∕z 127. The decrease in sensitivity can be traced back to equilibrium between I−, I2 and .
An equilibrium constant (Keq, in bar−1) of Keq= []/[I−][I2]= exp(11300/T) for Reaction (R7) (based on the Gibbs free energy of −94.14 kJ mol−1; NIST Webbook, 2010) and an estimate (based on its saturation vapour pressure) of the concentration of I2 of bar results in the complete dominance (by several orders of magnitude) of [] compared to [I−] in the IMR. While the presence of large concentrations of may explain the large signal at m∕z 127 following de-clustering, we conclude that the reaction between and CH3C(O)O2 is very inefficient or does not lead to formation. I2 does not represent a feasible alternative to CH3I for PAN measurement and HCl detection is not possible. However, we can still detect SO2 via primary ions and also acetic acid, presumably due to () clusters with CH3C(O)OH.
In another experiment performed with the 210Po source, synthetic air instead of nitrogen was flowing over the polonium ionizer (configuration ii), simulating a huge leak of oxygen into the source. Besides I− and I−(H2O), (m∕z 32, 5 % of I−), (m∕z 50, 3 % of I−) and (m∕z 60, 2 % of I−) were present, but ions like and that are probably responsible for the detection of SO2 and HCl (see below) were not observed as they are unique to the RF discharge ion source. In combination with the experiment where the housing around the tungsten needles was evacuated, we conclude that a leak of O2 into the discharge region might increase and but is not responsible for the complex primary-ion spectrum observed with our discharge ion source. No change in the ion spectrum was observed when the linear steel tubing between the ion source and IMR was replaced by tubing with a 90∘ bend. This result precludes an important role for ion formation via highly energetic radiation from the ionization region reaching the IMR interacting with O2. The diffusion of oxygen from the IMR into the ion source is also very unlikely due to a high-volume flow between the ion source and IMR and the use of a small aperture. We conclude that the role of O2 in the formation of primary ions containing I, O, C and N atoms in the IMR is most likely related to its role as a trapper and carrier of electrons, possibly as excited anions.
Figure 4 shows which trace gases we can detect with our instrument using the RF discharge ion source. The middle branch (b) represents ionization via I− and its water cluster ion and is the same as 210Po-based ion generation schemes frequently used for detection of PAN (Slusher et al., 2004), PAA (Phillips et al., 2013) and ClNO2 (McNeill et al., 2006). The outer branches (a and c) are unique to our CI-QMS using the discharge ion source and can be attributed to the presence of different primary ions. The presence of H, C and N atoms from CH3I∕N2 breakdown in the discharge region leads to the existence of the right-hand branch (c) that disappears when CH3I is replaced by I2 (see Sect. 3, configuration v). The usual presence of oxygen inside the IMR is responsible for the existence of the left-hand branch (a) and is not available with configuration (iv) in which nitrogen was used for the main gas flow instead of synthetic air. For the combined detection of PAN, ClNO2, SO2, HCl, peracetic and acetic acid, configuration (iii) was used in all of our field measurements. In the following we discuss in detail the ion–molecule reactions involved in the detection of these trace gases and also outline how the CI-QMS is calibrated and which sensitivities and detection limits can be achieved.
Table 2Sensitivity and limit of detection of the CI-QMS for PAN, PAA, acetic acid, ClNO2, SO2 and HCl.
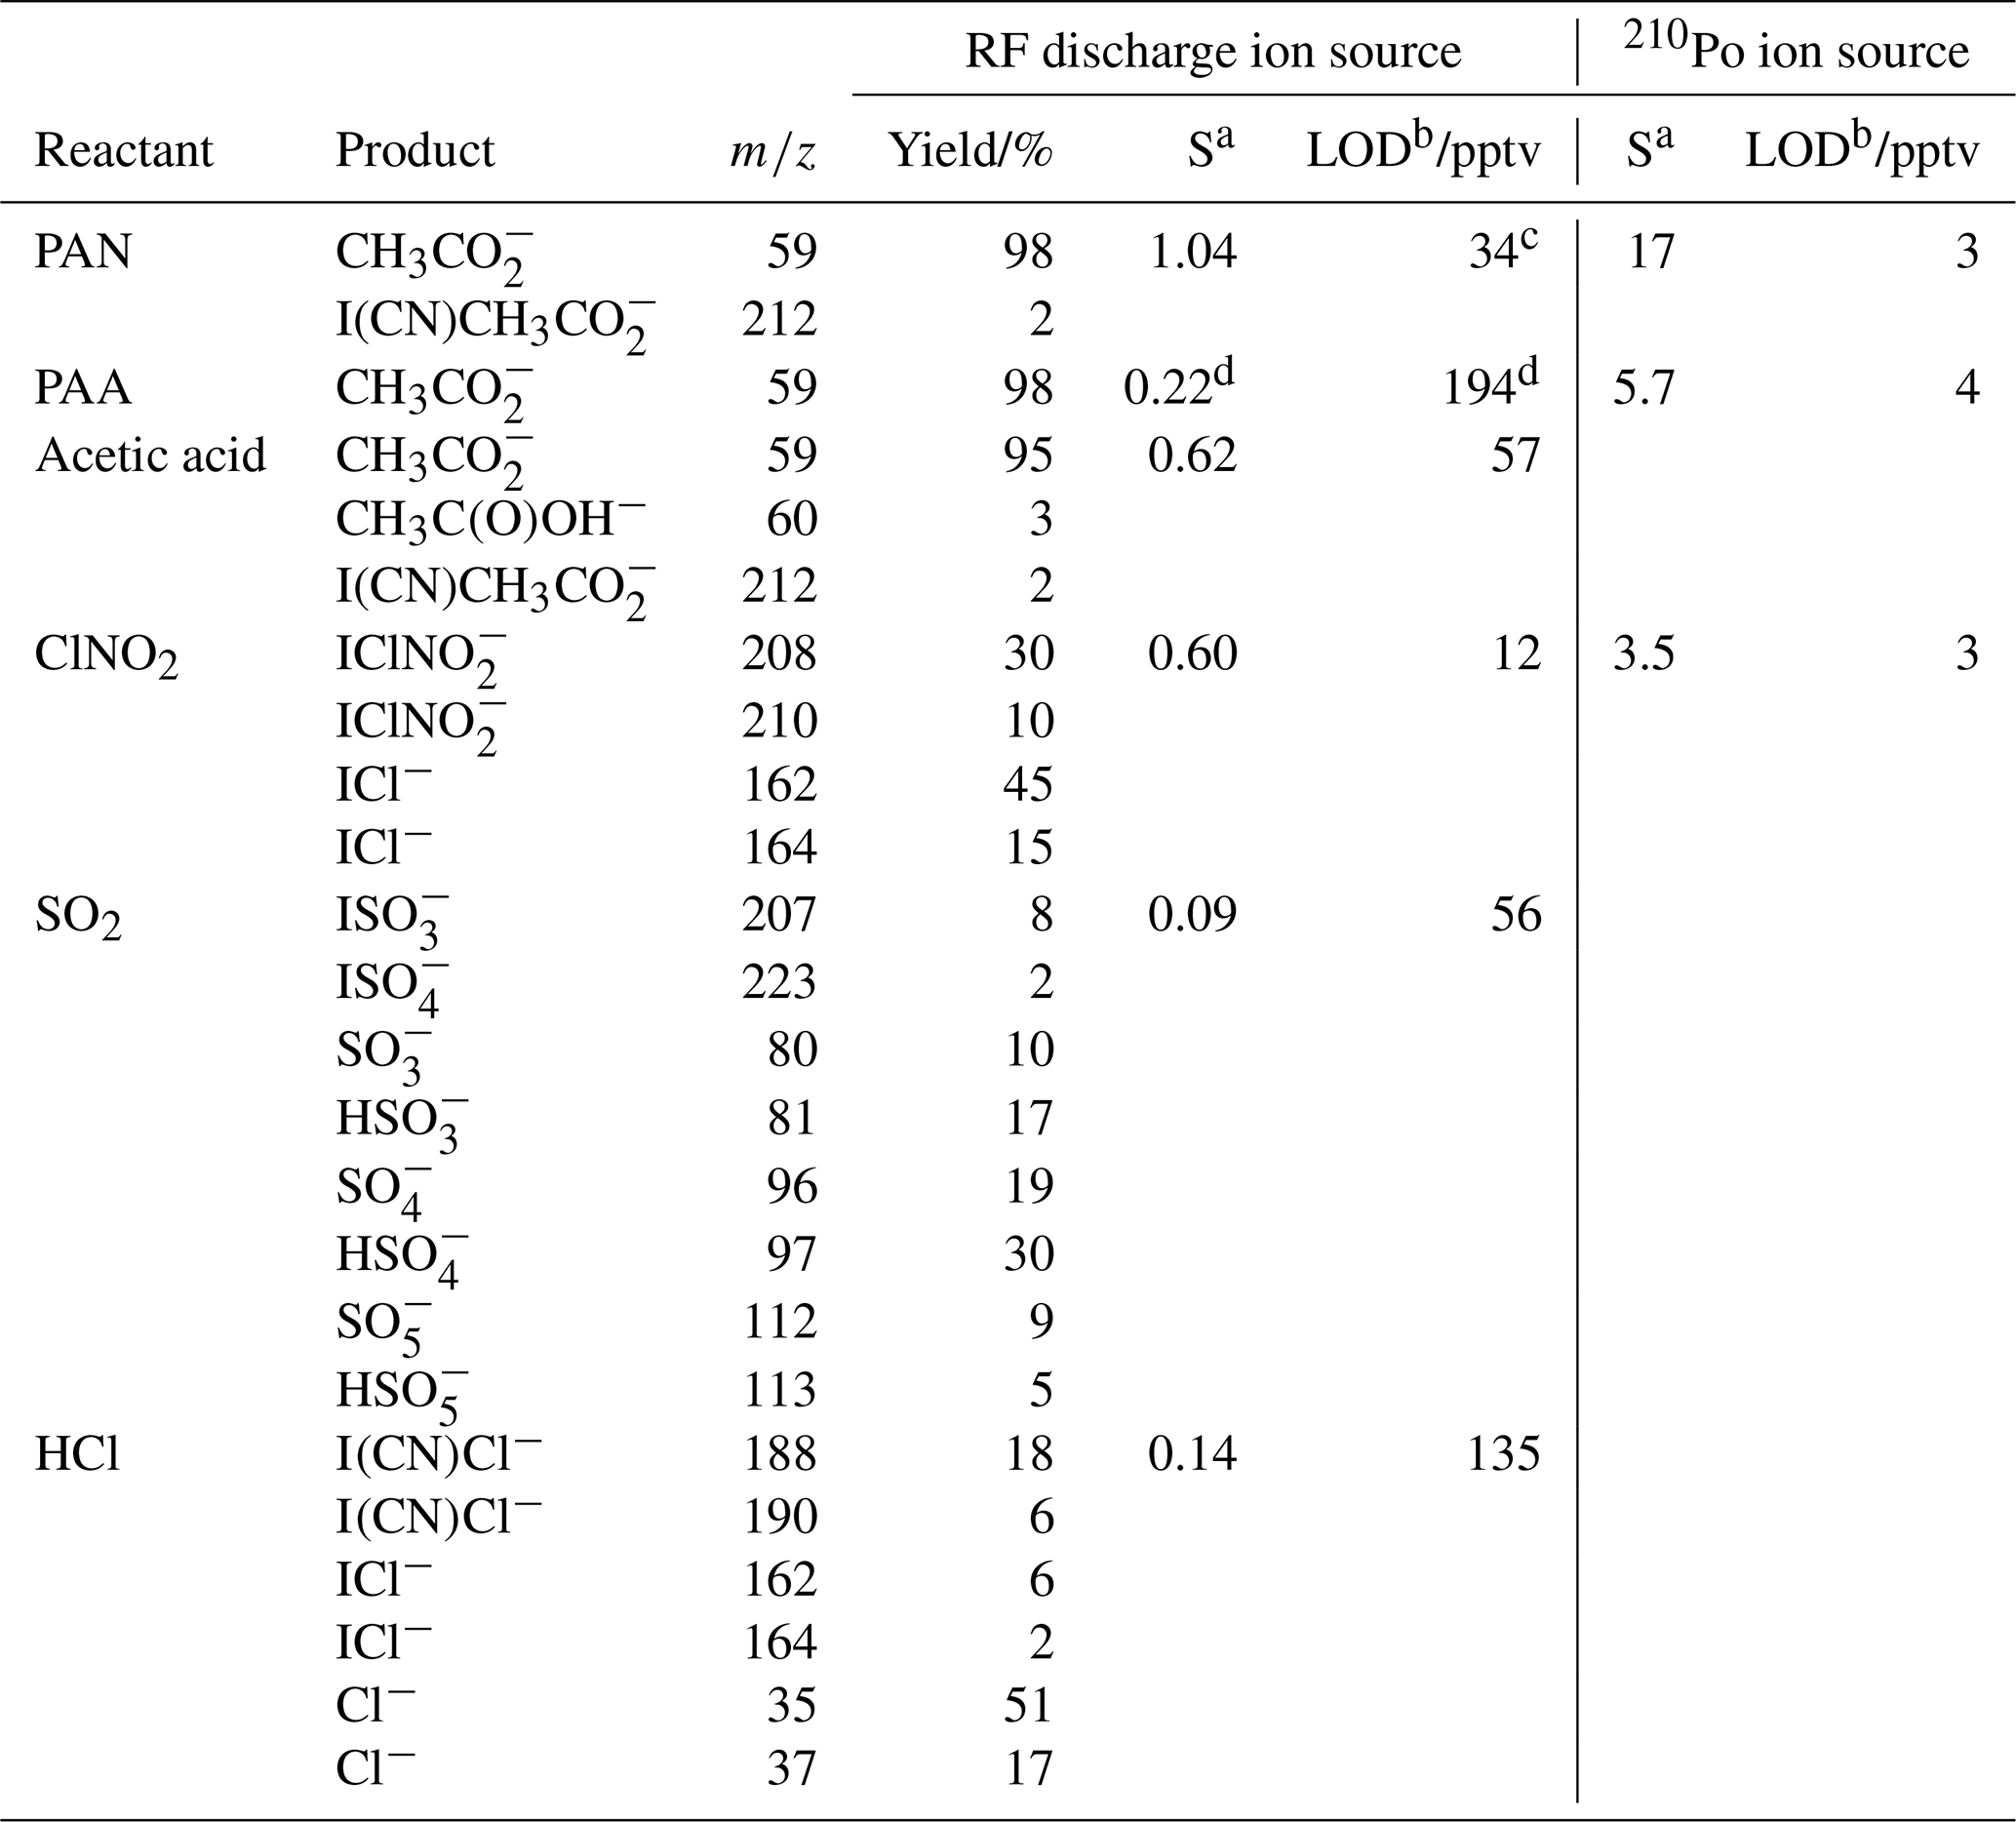
a Sensitivity S (in Hz ppt−1) at 50 % RH (25 ∘C), normalized to 106 Hz I− with de-clustering set to 20 V. b Limit of detection (LOD, 2σ, 1 s integration time). c The LOD is calculated from the background signal at m∕z 59 and does not include the reduction in detection limit incurred when acetic acid and PAA are present at the same m∕z as described in the text. d Without de-clustering applied.
4.1 PAN, PAA and acetic acid
PAN, PAA and acetic acid are all detected as at m∕z 59. Depending on the relative humidity and the de-clustering potential in the CDC, clusters of with H2O are observed at m∕z 77. Sensitivities and product yields for the detection of these three molecules are summarized in Table 2. The detection mechanism for PAN using I− primary ions is the same as that reported when using 210Po as an ion source (Slusher et al., 2004). PAN is thermally decomposed inside the TDR into a peroxy radical (CH3C(O)O2) and NO2 via Reaction (R8). The rate coefficient for the thermal decomposition of PAN (at 453 K and 1 bar) is ≈2000 s−1 (Atkinson et al., 2006; IUPAC, 2018), so that > 99.99 % of PAN should be thermally dissociated within 200 ms. This could be confirmed by measurement of the signal due to a stable PAN source whilst varying the inlet temperature. The CH3C(O)O2 product reacts with I− in the IMR to form (m∕z 59) via Reaction (R9) involving clusters with water vapour. The detection of PAA with I− primary ions is believed to be direct via Reaction (R10) (Phillips et al., 2013).
When using the RF discharge ion source there is also an additional pathway for PAN and PAA detection, involving primary ions, resulting in the formation of I(CN), which is observed at m∕z 212 when de-clustering is switched off. With de-clustering this ion fragments to m∕z 59. However, the sensitivity is relatively low, and the selectivity is not improved as acetic acid is also detected at this m∕z (see Table 2).
The separation of PAN from PAA and acetic acid signals when sampling air masses which contain both trace gases can be achieved by cooling the TDR to prevent formation of CH3C(O)O2 and thus detection of PAN (Phillips et al., 2013) or by adding NO to the TDR in order to remove CH3C(O)O2 (Reaction R11).
The latter method has the advantage of being more rapid, as NO can be switched in and out of the TDR in a matter of seconds, whereas cooling of the inlet may take minutes. Generally we add NO (100 ppmv in nitrogen, Air Liquide) to the TDR at a mixing ratio of 0.23 ppmv (3.7×10¹² molecule cm−3). Given the approximate residence time of ca. 200 ms in the TDR (calculated from the volume of the TDR and the volumetric flow rate) and the rate coefficient for Reaction (R11) of cm3 molecule−1 s−1 at 453 K (Atkinson et al., 2004; IUPAC, 2018), we calculate that more than 99.99 % of the CH3C(O)O2 is removed by titration with NO. When NO is added, we therefore measure only PAA (or the sum of PAA and acetic acid, depending on de-clustering potential; see below). The signal due to PAN is then calculated by subtracting the interpolated signal during NO addition.
The use of the RF discharge source also results in sensitivity to acetic acid at m∕z 59, which is not observed using 210Po as an ion source. Rather, detection of acetic acid has been reported at m∕z 187 (ICH3C(O)OH−) (Lee et al., 2014). Our instrument is relatively insensitive for acetic acid at m∕z 187 and, without de-clustering, we measure acetic acid mainly as (CNO)CH3C(O)OH− (m∕z 102) and I(CN) (m∕z 212).
When monitoring m∕z 59 using the discharge ion source, the background signal during NO addition consists of both PAA and acetic acid. To differentiate between them we make use of the fact that the relative sensitivity to PAA and acetic acid at m∕z 59 depends on the de-clustering potential applied in the CDC. We find that acetic acid is only detected at m∕z 59 when a de-clustering voltage of about 20 V is applied, whereas PAA is detected at m∕z 59 both with and without de-clustering, albeit with different sensitivity. The difference is related to the fact that for PAA the product ion is formed directly in Reaction (R10), whereas acetic acid is believed to initially form a cluster with (Reaction R12) and only dissociate to when the 20 V de-clustering voltage is applied (Reaction R13). ICN−, IH(CN)− and are all potential primary ions for detection of acetic acid, though is the most abundant. When NO is added, the mixing ratio of acetic acid can be calculated by subtracting the signal without de-clustering from the signal with de-clustering. Unfortunately, the chemical background without de-clustering at m∕z 59 is a factor of 2.5 higher than with de-clustering and the sensitivity is reduced, which increases the LOD for detection of PAA significantly (see Table 2).
Results of combined PAA and acetic acid measurements from the CYPHEX field campaign and speciation via changing the CDC parameters can be found in Derstroff et al. (2017). An exemplary time series showing the different measurement modes of the CI-QMS (scrubber, ambient, NO addition) and the differences in detection of PAA and acetic acid when applying a de-clustering voltage is provided in Fig. S3.
An enhancement in sensitivity to acetic acid at m∕z 59 when using the RF discharge ion source compared to 210Po is illustrated by the signals obtained from the photochemical source used to generate PAN, which also generates unquantified amounts of both PAA and acetic acid (Sect. 2.7, Reactions R5 and R6). When using the RF discharge ion source and 20 V de-clustering voltage, the signal ratio of PAN ∕ (PAN + PAA + acetic acid) at m∕z 59 is ≈0.2. In contrast, using 210Po as an ion source the ratio is ca. 0.9. As the relative sensitivity (m∕z 59) to PAN and PAA is similar, this change in ratio reflects enhanced instrument sensitivity to acetic acid when using the discharge ion source with de-clustering. This represents a significant disadvantage of the RF discharge source for PAN detection compared to 210Po. Not only is the instrumental background at m∕z 59 higher, the presence of acetic acid in ambient air samples means that a larger and more variable chemical background signal has to be subtracted to calculate the PAN mixing ratio, which increases the limit of detection and overall uncertainty significantly.
Calibration of PAN, PAA and acetic acid
The in situ calibration of PAN is described in Sect. 2.7. The overall uncertainty of the calibration, based on the uncertainty in dilution, the mixing ratio of the NO calibration cylinder (1 ppmv) and the conversion efficiency from NO to PAN is ≈10 %.
For PAA, two methods, both using a diffusion source containing a commercially available 39 % solution of PAA in acetic acid, have been used to calibrate the CI-QMS. In the first, we use simultaneous CI-QMS and wet-chemical peroxide-specific detection of PAA based on the horseradish peroxidase/catalase/p-hydroxyphenyl fluorescence measurement technique (Lazrus et al., 1986) in which organic peroxides (and peracids) are converted to H2O2 (AL2021, Aero-Laser GmbH). The wet chemical method is calibrated via standard H2O2 solutions and the overall uncertainty (related to scrubbing efficiency of PAA) is 13 %. As the AL2021 is not always available during the campaign, we developed a second approach in which PAA undergoes transformation to (aq), which can be quantified using aqueous-phase absorption spectroscopy (Awtrey and Connick, 1951; Friedrich, 2015). Based on uncertainty in the scavenging of PAA into an acidified, aqueous solution, uncertainty associated with the absorption cross section of and the reproducibility of signals when sampling from a constant source of PAA, we estimate the total uncertainty of the method to be ≈30 %.
For the calibration of acetic acid we use a permeation source (7.33 ng min−1 at 30 ∘C, Metronics) with an uncertainty of 8 %. Additionally, we sampled the output of a diffusion source of pure liquid acetic acid simultaneously using the CI-QMS (41.2 ppbv after dilution) and an infrared absorption spectrometer measuring CO2 (LI-COR) following the stoichiometric thermal oxidation of acetic acid to CO2 (Veres et al., 2010). The uncertainty of this calibration method is ≈10 %. Within combined uncertainty both methods indicated the same sensitivity of the CI-QMS to acetic acid.
4.2 Sulfur dioxide
The “standard” use of 210Po ionization does not allow for the sensitive detection of SO2 using I− ions. As outlined in Sect. 3, additional primary ions () formed with our RF discharge ion source enable SO2 detection as, for example, (m∕z 207). In addition, , and are also formed and the relative yields are listed in Table 2. Although the underlying ion–molecule reactions resulting in their formation are not fully characterized, based on the observation of and in the primary-ion mass spectrum we propose the following scheme (Reactions R14–17).
As written, Reactions (R14) and (R16) involving the anion are exothermic with reaction enthalpies of and −113 kJ mol−1, respectively. The enthalpies of formation used to derive these values were taken from the literature: ΔH(SO2) kJ mol−1 (Chase, 1998), ΔH(IO) =126 kJ mol−1 (Goos et al., 2005) and ΔH() kJ mol−1 (NIST Webbook, 2010) or calculated from other thermodynamic properties. The formation enthalpy for (ΔH() kJ mol−1) was calculated from its electron affinity (453.5 kJ mol−1; Wen et al., 2011) and the formation enthalpy of IO3 (242 kJ mol−1; Goos et al., 2005). The formation enthalpy for (ΔH() kJ mol−1) was calculated from the bond strength (161 kJ mol−1; Hao et al., 2005) and the formation enthalpies of I− (−195 kJmol−1; Goos et al., 2005) and SO3 (−396 kJ mol−1; Goos et al., 2005). In the absence of thermodynamic data for , we cannot assess the reaction enthalpies for Reactions (R15) and (R17). The iodine-containing (m∕z 207) is most specific and suitable for monitoring SO2 with good sensitivity.
Calibration of SO2
SO2 is calibrated by the addition of a small flow of SO2 from a gas cylinder (1 ppmv in synthetic air, Air Liquide). The true mixing ratio of SO2 flowing from the bottle into the absorption cell at 1 bar pressure was determined via UV-absorption spectroscopy using a white cell and diode array set-up (Wollenhaupt et al., 2000) and an absorption spectrum (290–320 nm) from the literature (Bogumil et al., 2003). The mixing ratio that was determined in this manner was found to agree to within 10 % of the manufacturers specifications. The linearity of the CI-QMS signal with the SO2 mixing ratio (up to 60 ppbv) is shown as Fig. S4a.
4.3 Nitryl chloride
The scheme for detection of ClNO2 using I− ions generated using 210Po is well-established (Osthoff et al., 2008; Thornton et al., 2010). Both ICl− (m∕z 162 and 164) and (m∕z 208 and 210) are formed, the latter generally preferred to monitor ClNO2 in ambient air owing to potential interference through reactions of other chlorine-containing trace gases forming ICl−.
The same ions are observed during operation with the RF discharge ion source with similar product yields for 210Po as the ones for the RF discharge reported in Table 2.
Calibration of ClNO2
ClNO2 was calibrated by passing Cl2 (50 ppmv in nitrogen, Air Liquide) over NaNO2 (30 g) and NaCl (10 g) crystals in a glass flask (Thaler et al., 2011). The ClNO2 generation efficiency was found to be improved by moistening the crystals by adding 2–3 drops of water. The gas mixture exiting the glass flask, which contains unreacted Cl2, NO2 and ClNO2, was diluted in 5 slm air and sampled simultaneously with the CI-QMS and a cavity ring-down spectrometer that detects both NO2 and ClNO2 after thermal decomposition at 420 ∘C to NO2 (Thieser et al., 2016). ClNO2 thermograms (Sobanski et al., 2016; Thieser et al., 2016) indicate that, under the flow and pressure conditions of these calibrations, ClNO2 is thermally decomposed to NO2 at 420 ∘C (Reaction R20), but there is no significant loss at 200 ∘C, the TDR temperature of the CI-QMS.
The total uncertainty (≈25 %) associated with the calibration derives from uncertainty in the NO2 cross section used to calculate NO2 mixing ratios in the cavity ring-down spectrometer and the assumption that all ClNO2 is detected as NO2.
4.4 Hydrogen chloride
Using the discharge ion source we detect HCl as Cl−, ICl− and I(CN)Cl−, presumably via Reactions (R21)–(23).
Reactions (R22) and (R23) are weakly exothermic with reaction enthalpies of and −73 kJ mol−1, respectively. If available, the enthalpies of formation used to derive these values were taken from Goos et al. (2005), ΔH(HCl) , ΔH(HCN) =130, ΔH(Cl−) , ΔH(CN−) =61 kJ mol−1, and Refaey and Franklin (1977), ΔH(ICl−) kJ mol−1. ΔH(ICN−) =92 kJ mol−1 was calculated from ΔH(ICN) =222 kJ mol−1 (Goos et al., 2005) and the electron affinity of ICl (130 kJ mol−1, (Miller et al., 2012). The ion is stable in an aqueous solution (Chadwick et al., 1980), but a lack of thermodynamic data for it and for I(CN)Cl− precludes calculation of the energetics of Reaction (R21).
As I(CN)Cl−, formed by reaction of dicyanoiodate anion with HCl in Reaction (R21), is the most abundant and specific product ion, HCl is generally monitored at m∕z 188. In the absence of interferences, the ratio of signals at m∕z 188 to m∕z 190 and m∕z 162 to m∕z 164 should be determined by the natural relative abundance of the 35Cl and 37Cl isotopes, which is ≈3.13. Plots of the relative ion signals at m∕z 188 versus m∕z 190 and m∕z 162 versus m∕z 164 obtained during the CYPHEX campaign are given in Fig. S5. The tight correlation and the slope of 3.09 for the ratio m∕z 162 to m∕z 164 is very close to the expected value, indicating that to a good approximation only one trace gas containing one Cl atom was measured. In contrast, the ratio of m∕z 188 to m∕z 190 is significantly lower than expected, and the correlation displays more scatter. This low ratio indicates that m∕z 190 suffers from interference from another trace gas. A likely candidate is HNO3, detected as at m∕z 190 (Lee et al., 2014). The signals at m∕z 188 and m∕z 162 are correlated very well (R2=0.96) indicating that they both represent HCl only, as no significant ClNO2 was present during CYPHEX.
Calibration of HCl
A bottle of gaseous HCl diluted in N2 (60 ppmv) was used to calibrate the CI-QMS during laboratory operation. The concentration of HCl was determined using UV-absorption spectroscopy (184.95 nm) using a cross section of cm2 molecule−1 (Bahou et al., 2001), as described by Zimmermann et al. (2016). Once the sensitivity of the CI-QMS to HCl was established using bottled gas, the output of a laboratory-built permeation source was measured by comparing signals in the CI-QMS at m∕z 188. The permeation source consisted of a few mL of concentrated HCl-solution welded into a short length (4 cm) of 6.35 mm (OD) PFA tubing, housed in 20 cm of 12.7 mm (OD) PFA tubing (at 30 ∘C) through which 50 sccm of air flows. The permeation rate measured was sccm with an uncertainty of the HCl calibration of 10 %. The linearity of the CI-QMS signal with the HCl mixing ratio was characterized in the laboratory (R2=0.99) and is shown as Fig. S4b.
The CI-QMS sensitivity for the trace gases discussed here is dependent on the amount of water vapour present in the IMR, which will vary with ambient relative humidity (RH). Broadly speaking, we observe a positive dependence of the sensitivity (see Fig. 5) on relative humidity between 0 % and 20 % at 25 ∘C, with a flattening of the curve between 20 % and 80 % RH. This effect is generally explained by the reactions proceeding predominantly through clustered primary ions, e.g. I−(H2O), which is observed at m∕z 145. Under weak de-clustering conditions, the product ions are also clustered with H2O, confirming the participation of I−(H2O). For the and primary ions used to detect SO2 and HCl, the water clusters (H2O)n and (H2O)n are not observed or are very weak, even without de-clustering. We observe that the concentration of and in the primary-ion spectra is dependent on the presence of H2O, which explains the RH dependence of the sensitivity of detection for SO2 and HCl. All ambient measurements of the trace gases discussed here are therefore corrected for RH effects using calibration curves based on data such as those displayed in Fig. 5.
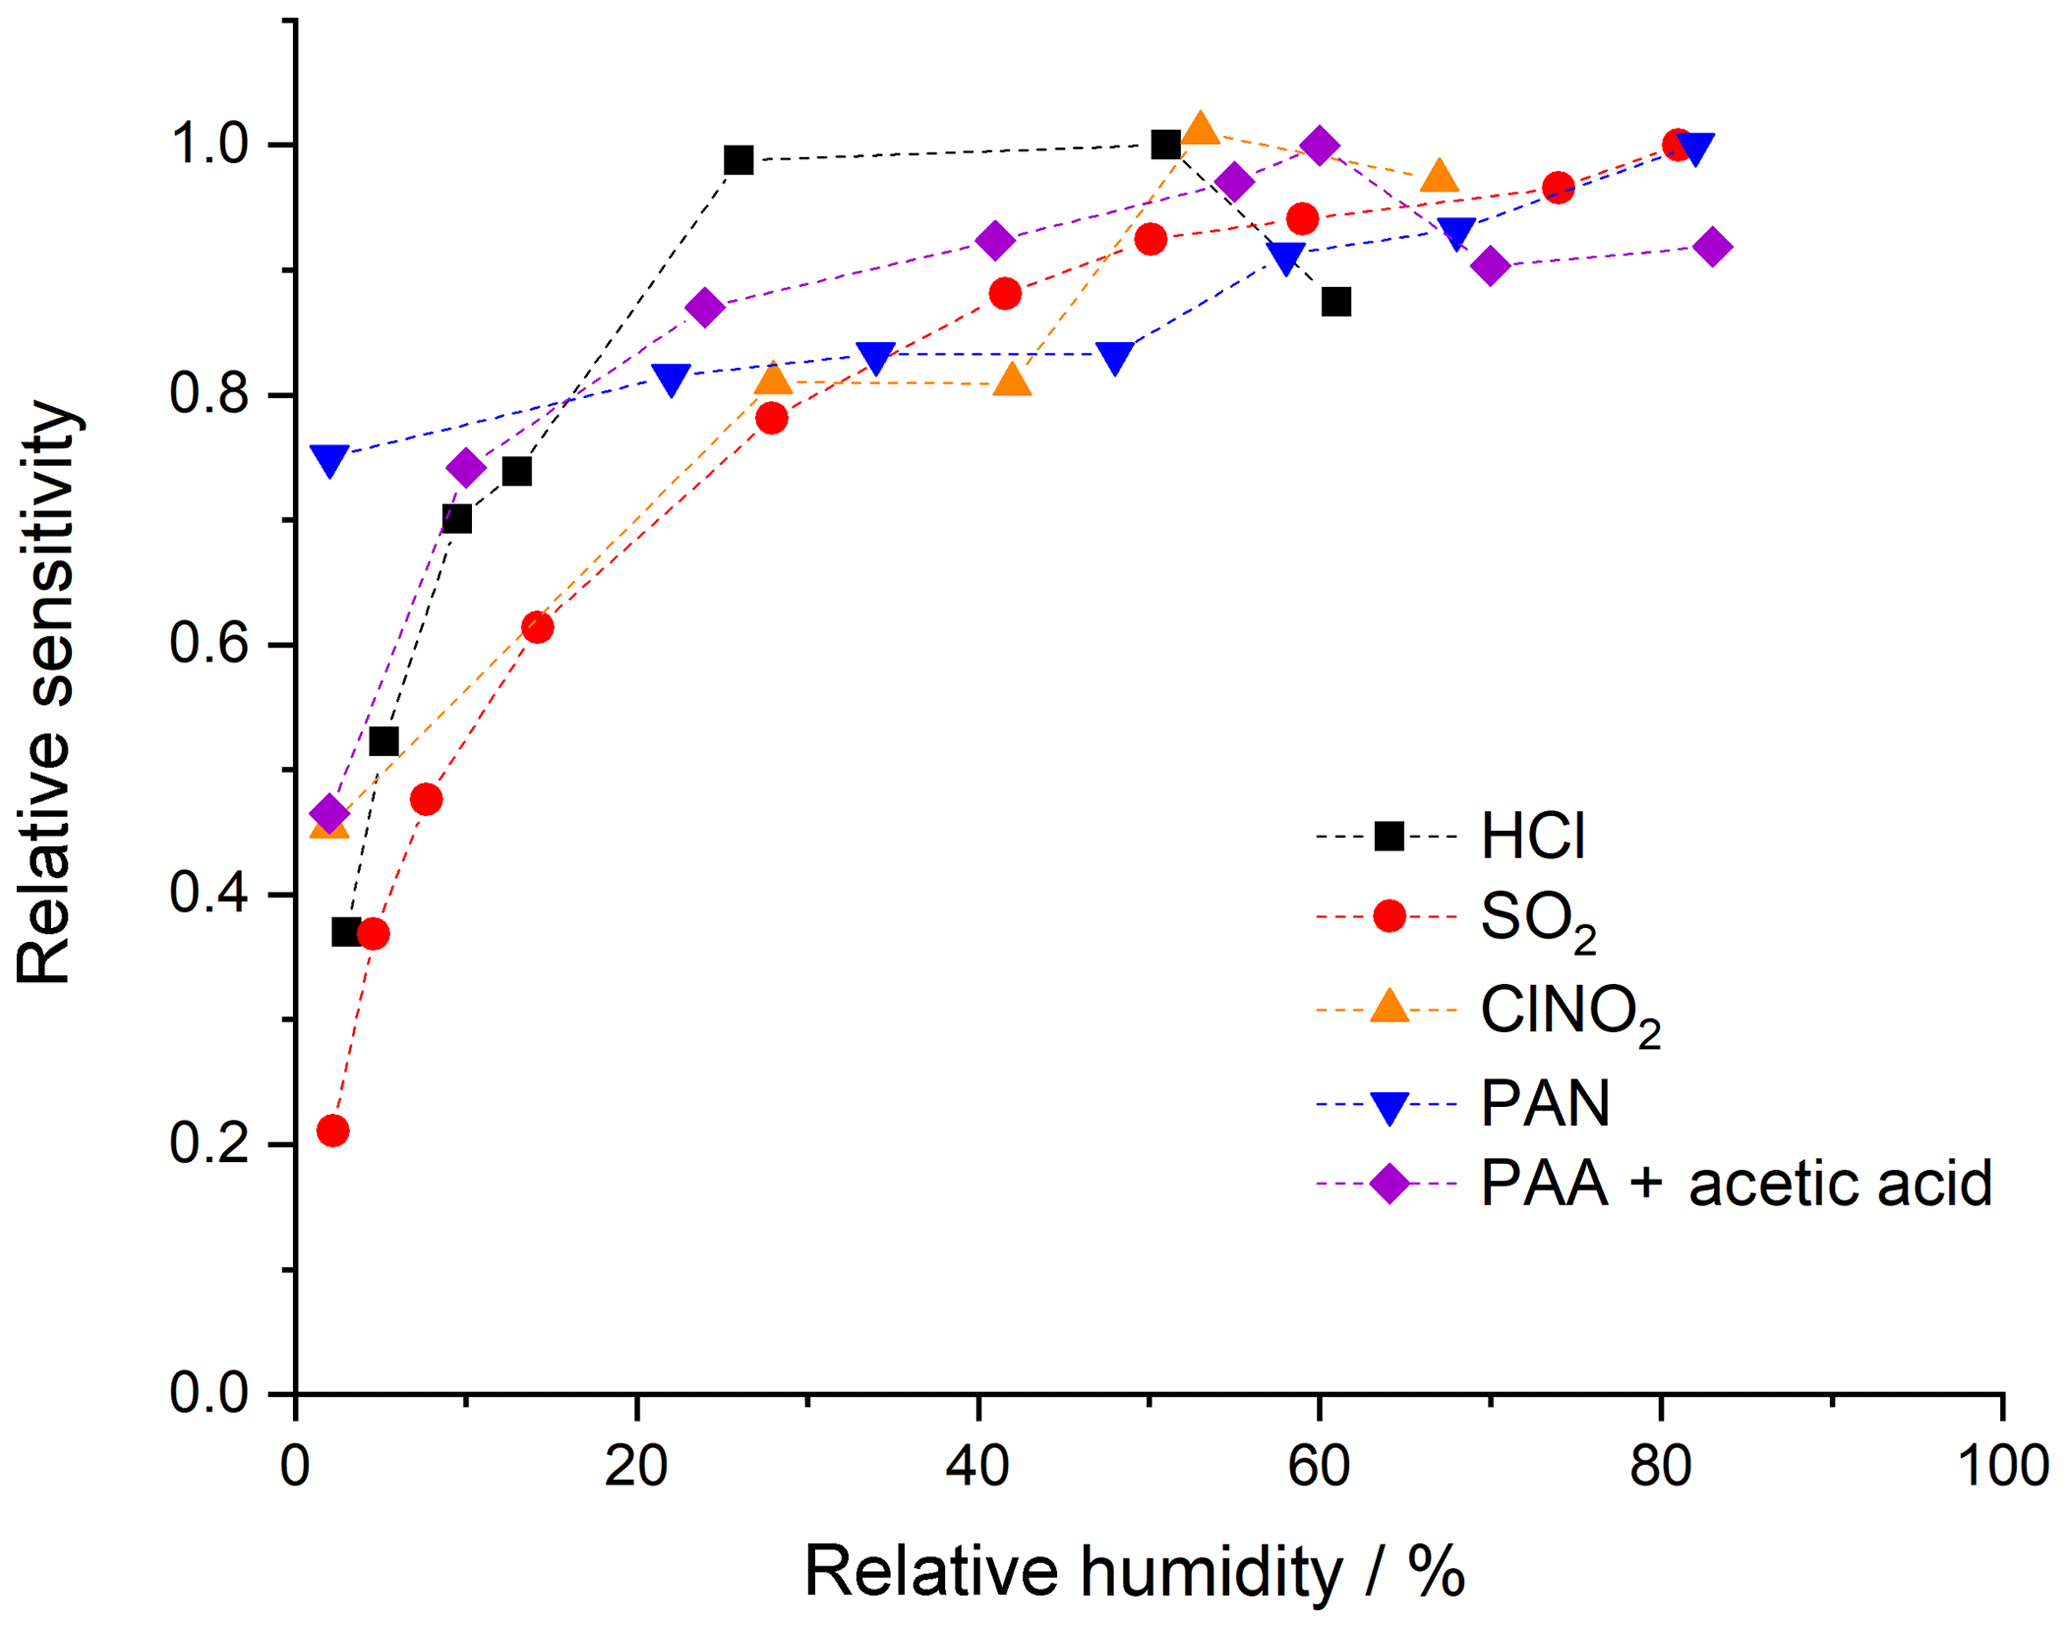
Figure 5Dependence of the ion signal on the relative humidity (at 25 ∘C and 1 bar) of the air sampled. For PAA + acetic acid on m∕z 59 only a combined humidity dependence is given as their contributions to the signal could not reliably be quantified.
The total uncertainty of the measurement of any of the trace gases listed above is determined mainly by the uncertainty associated with the calibration method (and its reproducibility) but may also be influenced by, for example, scrubbing efficiency and drifts between background measurements (variable for different field campaigns). The response of the CI-QMS to any one trace gas may also vary over a period from days to a few weeks due to drifts in temperature, resolution of the mass spectrometer and degradation of the detector. The sensitivity (i.e. signal in Hz per pptv of trace gas) depends on the rate coefficient for the reaction between primary ions and trace gases and the yield of product ions. The sensitivity may also depend on relative humidity (abundance of H2O clusters) and de-clustering potential (breakup of weak bonds). The limit of detection (LOD) is mainly dependent on variability in the background signal for the respective m∕z and can be calculated as 2 times the standard deviation when using synthetic (i.e. hydrocarbon-free) air or when passing the air through the scrubber (as usually performed during field measurements). In the text below (summarized in Table 2), we report sensitivities (in Hz pptv−1) and limits of detection (LOD, 2σ, in pptv) obtained under typical measurement conditions (configuration iii from Sect. 3) and, when applicable, compare them to values obtained using 210Po as an ion source.
6.1 PAN, PAA and acetic acid
When using 210Po as an ion source, an LOD of 3 pptv PAN (1 s) is achievable, which is adequate for, e.g. airborne operation (Roiger et al., 2011) or flux measurements (Wolfe et al., 2009). The use of the RF discharge for PAN detection results in an increase in background signal (from a few hertz when using 210Po to several hundred hertz when using the RF discharge ion source) even in hydrocarbon-free synthetic air. The LOD calculated from twice the standard deviation of a background measurement during the NOTOMO campaign is 34 pptv (1 s). The total uncertainty calculated from measurement precision, background subtraction (signal drifts, interpolation) and uncertainty in the calibration method is 15 % ±27 pptv. However, the uncertainty of the PAN measurement is highly dependent on the levels and variability of PAA and acetic acid present in the air, as their signal has to be interpolated and subtracted. In ambient air masses, the larger part of the signal at m∕z 59 with the RF discharge is due to acetic acid, which sometimes displays variability on the timescale of minutes. In this case the uncertainty of the background interpolation and therefore the overall uncertainty of the PAN measurement is drastically increased. This is essentially a selectivity problem, which limits deployment of the instrument for PAN measurements to more polluted regions where PAN mixing ratios regularly exceed 100 pptv and/or high time resolution is not necessary. As described above, the selectivity to PAN can be improved by switching off de-clustering (no acetic acid detection at m∕z 59), which comes with a significant reduction in sensitivity (see below).
In order to differentiate between PAA and acetic acid, the de-clustering voltage has to be modulated between 20 and 2 V. At the lower voltage, only PAA is detected but the resultant high chemical background and worsened sensitivity were found to lead to a poor limit of detection of a few hundred pptv (1 s) (see Table 2), which is about a factor of 100 higher than with use of 210Po (4 pptv in 1 s). At the higher potential the LOD would be much better but the sensitivity to acetic acid at m∕z 59 reduces the selectivity of the measurement. The total uncertainty calculated from measurement precision, background subtraction (signal drifts, interpolation) and uncertainty in the calibration method is 20 %±39 pptv.
The LOD for acetic acid at m∕z 59 is 57 pptv (1 s) but the selectivity is reduced due to the PAA contribution. The total uncertainty calculated from measurement precision, background subtraction (signal drifts, interpolation) and uncertainty in the calibration method is 15 %±45 pptv.
6.2 SO2
The sensitivity of the CI-QMS to SO2 reported in Table 2 is dependent on the relative humidity (see Sect. 5) and is especially dependent on the de-clustering voltage, the best signal-to-noise ratio being found at 20 V. Although (m∕z 97) has the highest sensitivity of all product ions, we generally monitor the ion (m∕z 207) as the background signal is lower and the detection limit improved. Figure S6 displays the correlation between both m∕z over a period of 4 weeks during the NOTOMO campaign. The correlation coefficient (R2=0.95) is large, from which we conclude that both m∕z can be used to calculate SO2 mixing ratios. The detection limit for m∕z 207 is 56 pptv (1 s) (based on noise in background measurements during the NOTOMO field campaign), which is sufficient to monitor SO2 in lightly polluted areas. At a lower temporal resolution and when monitoring only and I−, the LOD can be improved to a few pptv (e.g. in 10 min). The total uncertainty, calculated from measurement precision, background subtraction (signal drifts, interpolation) and uncertainty in the calibration method is 20 %±23 pptv.
6.3 ClNO2
Very good detection limits have been reported (Osthoff et al., 2008; Thornton et al., 2010; Phillips et al., 2012) for the measurement of ClNO2 via I-CIMS using 210Po ionization, a result of low background signal at m∕z 208 () and an efficient reaction with I−. Using 210Po, Phillips et al. (2012) achieved an LOD (2σ) of 3 pptv (1 s), which can be compared to the value of 12 pptv (1 s) (see Table 2) obtained with the RF discharge ion source, the difference stemming from a higher chemical background signal. With an averaging interval of 5 min the LOD can be reduced to 2–3 pptv. ClNO2 can also be detected as ICl− (m∕z 162 and 164), which provides higher sensitivity compared to (see Table 2) but can suffer from a significant interference due to HCl, which is likely to be present in air masses containing ClNO2. For example, 1 ppbv HCl contributes a signal at m∕z 162 which is equivalent to 60 pptv ClNO2 at this m∕z. Monitoring ClNO2 at m∕z 208 is more specific, with an equivalent signal due to 1 ppb HCl of less than 10 pptv, which can be accounted for when measuring HCl in parallel (at m∕z 188; see above). It should be noted that the interference at m∕z 162 is not unique to the RF discharge but has also been observed when using a 210Po ionizer (Phillips et al., 2012). The total uncertainty for ClNO2 measurement, calculated from precision, background subtraction (signal drifts, interpolation) and uncertainty in the calibration method, is 30 %±6 pptv.
6.4 HCl
Sensitivities and product yields for several ions connected to HCl detection are reported in Table 2. As ICl(m∕z 162 and 164) suffers from a ClNO2 interference (see above) and Cl− (m∕z 35 and 37) could possibly arise from other Cl-containing species, the more specific ion I(CN)Cl− (m∕z 188 and 190) is used to monitor HCl. The LOD for m∕z 188 is 135 pptv (1 s), which can be further improved by extended averaging if high time resolution is not required. The total uncertainty calculated from measurement precision, background subtraction (signal drifts, interpolation), scrubbing efficiency (it takes more time to remove HCl in the scrubber than, e.g. SO2) and uncertainty in the calibration method is 20 %±72 pptv.
Our CI-QMS instrument has been deployed in different ground-based field campaigns including ones at coastal (CYPHEX, 2014), forested (IBAIRN, 2016) and mountain sites (NOTOMO, 2015) in Europe. In the following we present subsets of the data from these campaigns in order to indicate how the instrument with an RF discharge ion source (configuration iii in Sect. 3) performs in the field.
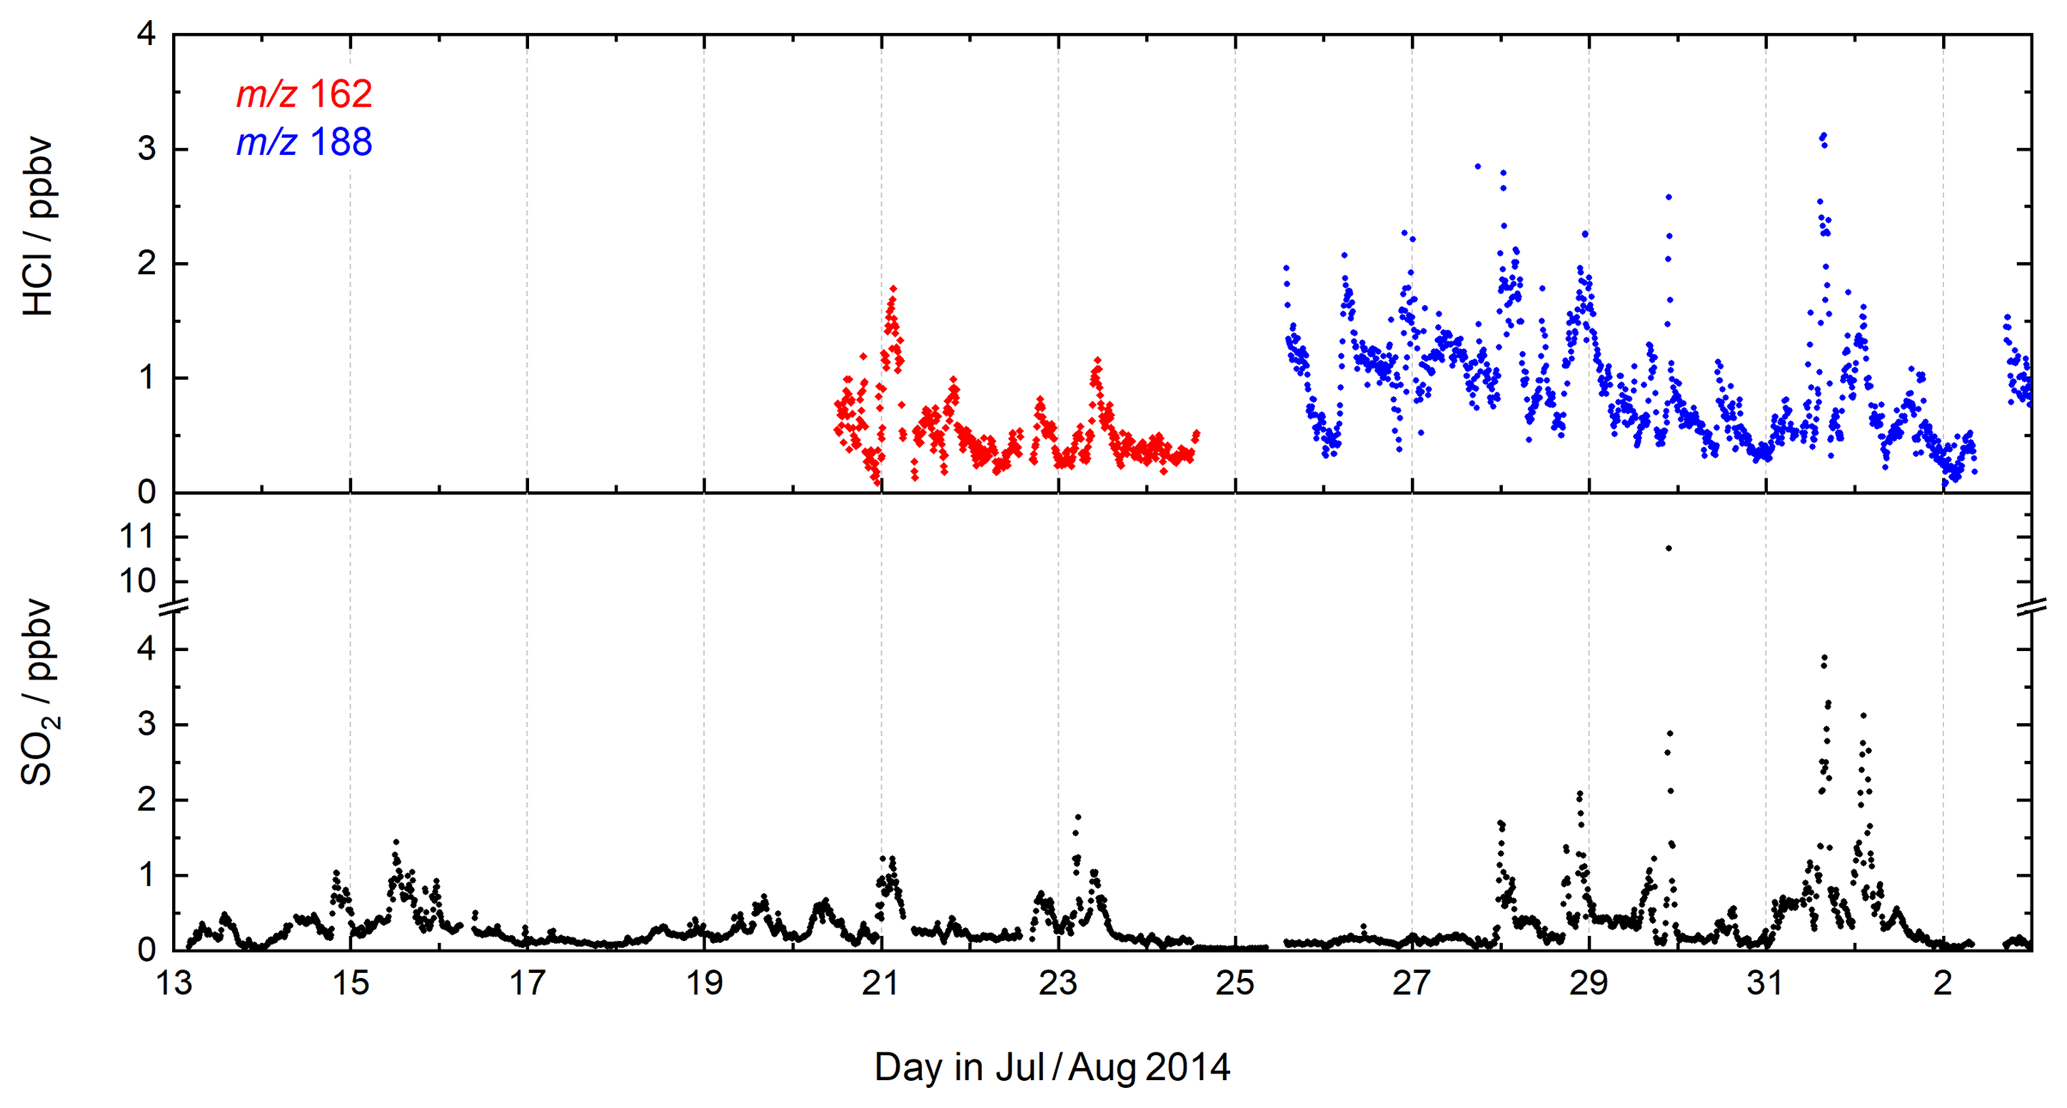
Figure 6CI-QMS time series of SO2 and HCl mixing ratios during the CYPHEX field campaign in Cyprus.
7.1 CYPHEX 2014
During CYPHEX (Cyprus Photochemistry Experiment, summer 2014), located at a coastal site on the eastern Mediterranean island of Cyprus, we measured chemically aged air masses with origins in continental Europe (Meusel et al., 2016; Derstroff et al., 2017). A time series of SO2 and HCl for a 3-week period of the campaign is shown in Fig. 6. SO2 was detected for the first time using the CI-QMS during CYPHEX in which observations of covariance between the signal at m∕z 207 and particulate sulfate provided the first clues to the identity of the mass peak as and indications of sensitivity to SO2. As we had not anticipated CI-QMS sensitivity to SO2, calibration was performed post-campaign. We observed SO2 mixing ratios as high as 11 ppbv, the plume-like nature of which strongly suggests nearby point sources such as ship traffic or air masses originating from power plants in continental Europe. Our measurements are consistent with other observations in the coastal Mediterranean boundary layer. Bardouki et al. (2003) found SO2 mixing ratios up to 3 ppbv in Crete (August 2001) and Schembari et al. (2012) report average daily mean values of several ppbv in different western Mediterranean harbours measured in the summers of 2009 and 2010. Kanakidou et al. (2011) conclude that megacities can be hotspots of air pollution in the eastern Mediterranean, with average SO2 mixing ratios of 1 ppbv measured in Crete (1997–1999), 8 ppbv in Istanbul (1998–2008), 10–15 ppbv in Athens (1995–1997) and 48 ppbv in Cairo (1999–2000), where about 70 % originates from industrial activities.
Similar to SO2, the measurement of HCl was unexpected, the isotopic ratio of 3:1 for the signals at m∕z 162 and 164 (ICl−) providing evidence that the trace gas measured contained one Cl atom. The identification of HCl was confirmed during the campaign, in which a permeation source was built and used to periodically supply HCl to the CI-QMS. Calibration of the permeation source ensued post-campaign as described in Sect. 4.4. HCl mixing ratios up to 3 ppbv were observed, which could be attributed to the release of HCl from sea salt aerosols when polluted air masses from continental Europe reached the coastal site. The covariance between HCl and SO2 in Fig. 6 suggests that an acid displacement mechanism involving SO2 oxidation to H2SO4 and transfer of H2SO4 to aqueous sea salt aerosol was involved. The median value of the HCl mixing ratio for the CYPHEX campaign was 790 pptv, which can be compared with reports of median values of 600–700 pptv HCl over the Atlantic near Europe and values of up to 6 ppbv in the polluted coastal boundary layer on the Isles of Shoals, 10 km off the southern Maine coast, USA, with an average of 600 pptv (July–August 2004) (Keene et al., 2007, 2009).
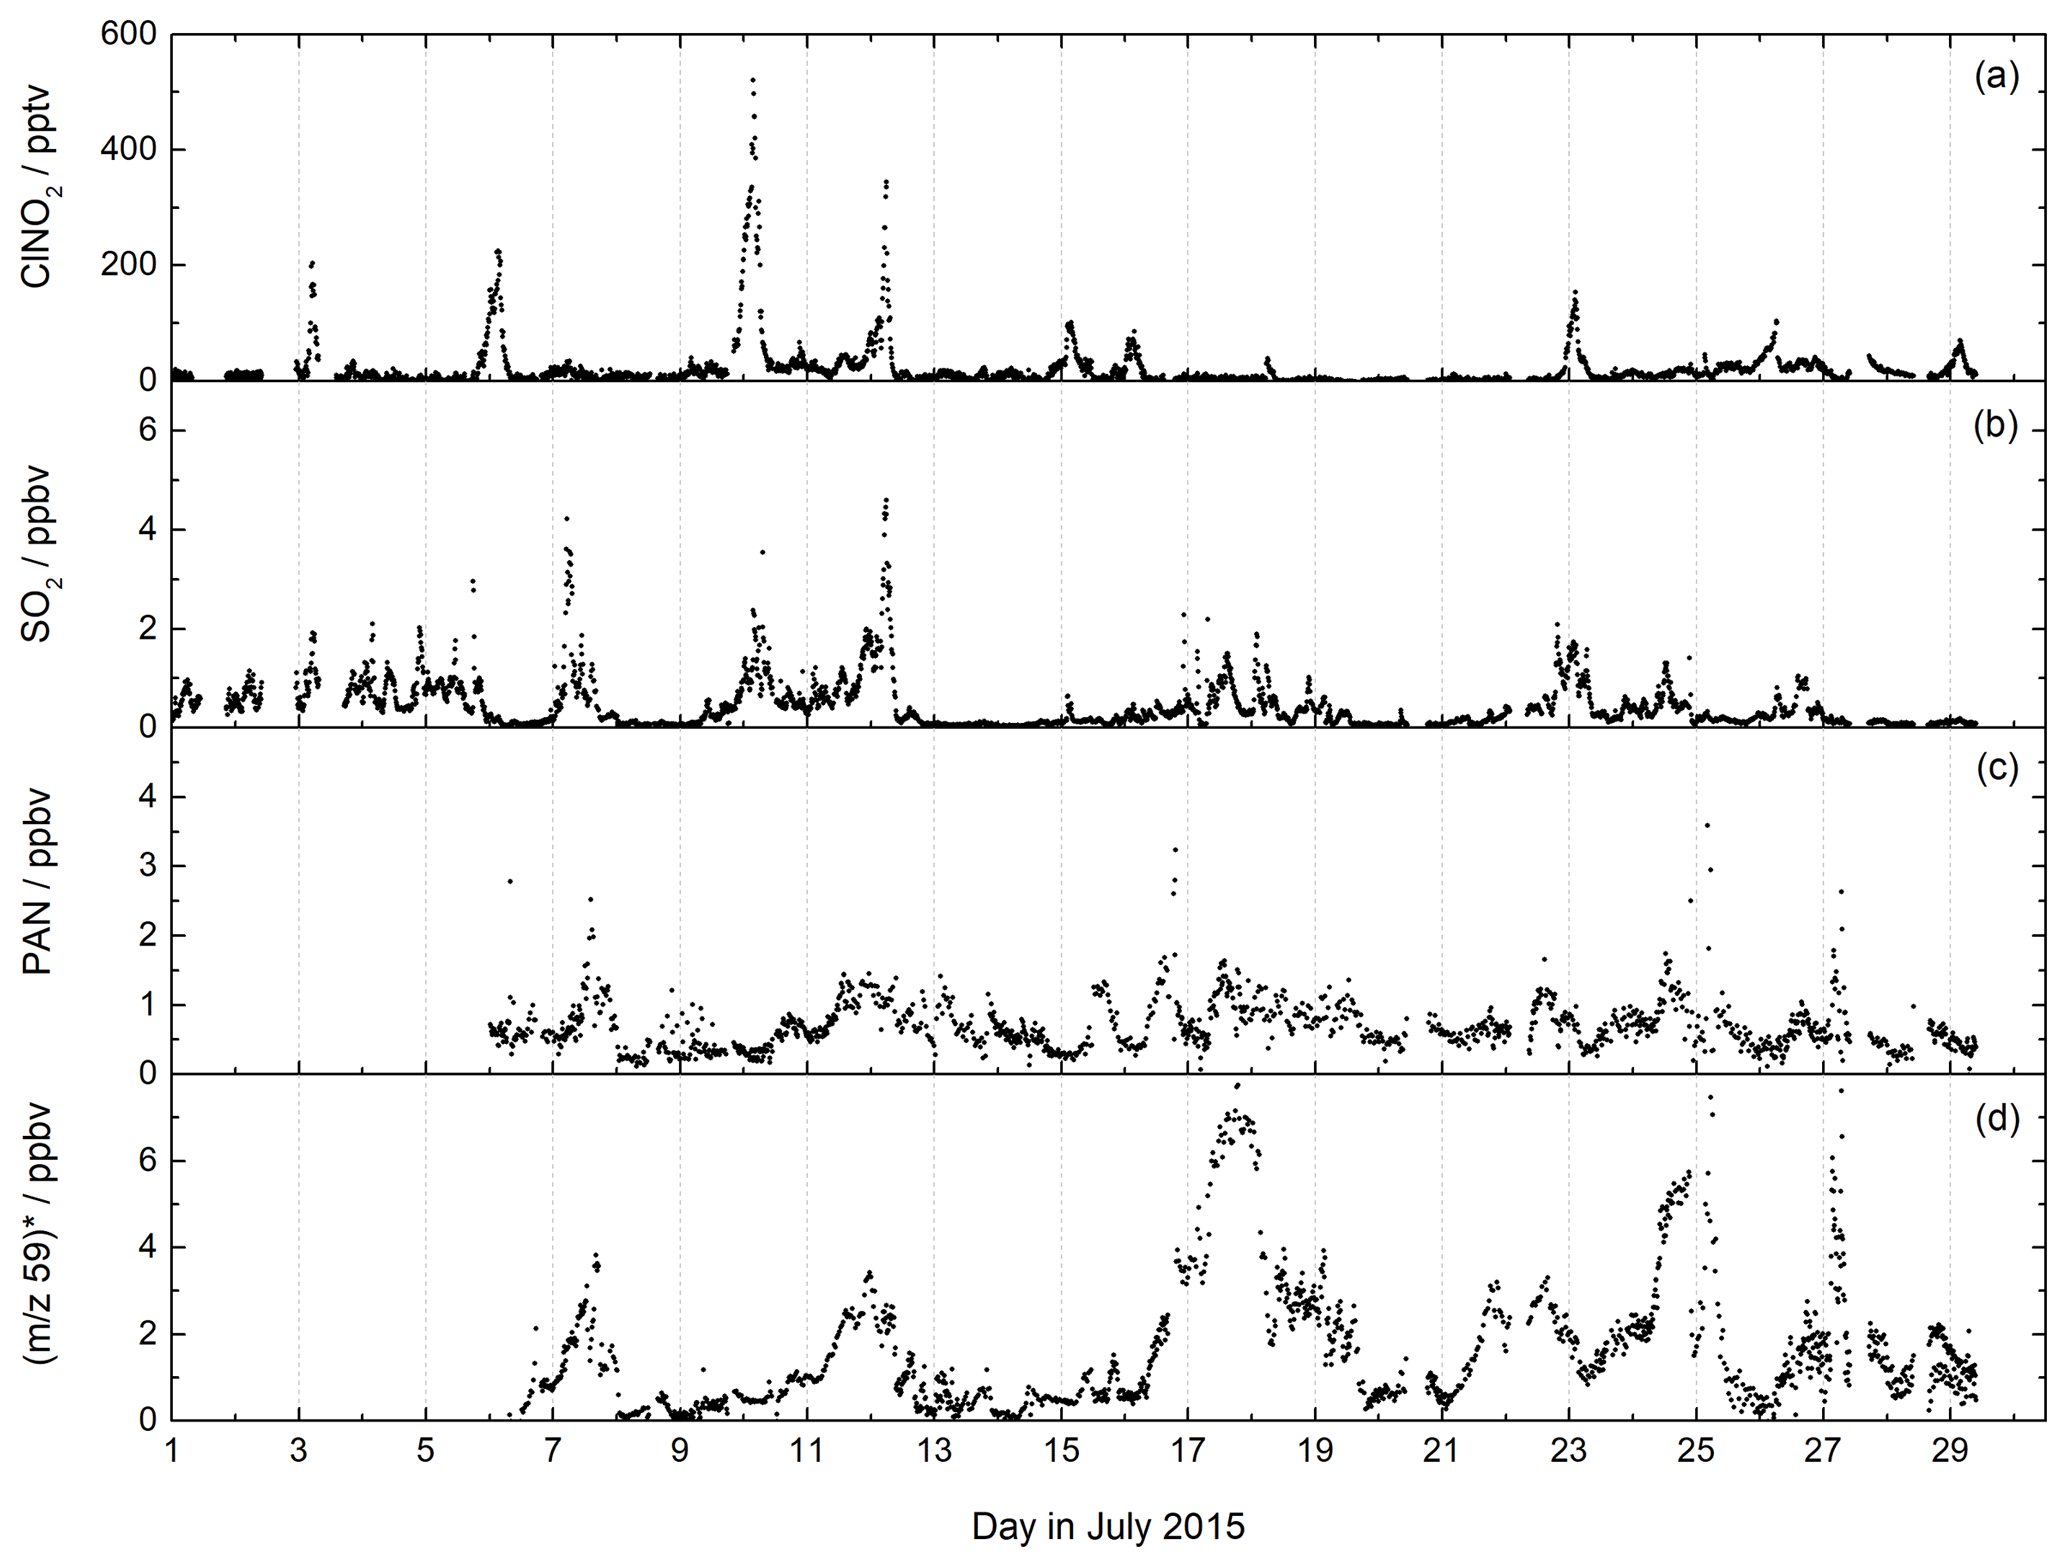
Figure 7CI-QMS time series of ClNO2, SO2, PAN mixing ratios and m∕z 59 during the NOTOMO field campaign in Germany. The signal at m∕z 59 was converted to ppbv, assuming that it consists only of acetic acid (no peracetic acid). The mixing ratios are therefore only an upper limit. For comparison with the PARADE campaign at the same location see Fig. S7.
7.2 NOTOMO 2015
The mountain-site campaign NOTOMO (NOcturnal chemistry at the Taunus Observatory: insights into Mechanisms of Oxidation, summer 2015) took place in a rural location in south-western Germany with significant urban influence (Sobanski et al., 2017). A time series of SO2, ClNO2 and PAN mixing ratios and the signal at m∕z 59 (contributions from acetic and peracetic acid) is displayed in Fig. 7. During NOTOMO, SO2 was monitored as ISO3- (m∕z 207) and HSO4- (m∕z 97), and a very good correlation between both signals (R2=0.95) within a period of 4 weeks confirmed that both ions reliably represent the same molecule (see Fig. S6). The SO2 mixing ratios exceeded 1 ppbv on most days, with maximum values up to 5 ppbv. The likely origins of SO2 at this site are emissions from coal-burning power plants in the local Rhine–Main urban conglomeration and the heavily industrialized Ruhr area to the north-west.
ClNO2 was detected during NOTOMO as (m∕z 208 and 210). Mixing ratios ranged from 0 to 500 pptv and were above 50 pptv during 10 out of 29 campaign nights. High levels of ClNO2 were generally associated with mixed marine and continental air masses from the north-west which had passed over the English Channel and the polluted Ruhr area. The data are consistent with previous measurements (using the CI-QMS equipped with a 210Po ionizer) at the same location and similar time of year (Phillips et al., 2012), whereby comparable ClNO2 mixing ratios were observed (see Fig. S7).
We measured PAN at m∕z 59 and observed mixing ratios generally ranging between 0 and 2 ppbv throughout NOTOMO, occasionally reaching 3 ppbv. PAN levels predominantly peaked in the afternoon, when photochemical activity is usually highest. Compared with results from PARADE (see Fig. S7) in which PAN had been measured with a precursor version of this instrument with a 210Po ionizer, frequency and amplitude of the PAN mixing ratios throughout the campaign were very similar. However, due to the high and variable chemical background at m∕z 59, as already pointed out in Sect. 4.1, the detection limit during NOTOMO was about an order of magnitude worse than in PARADE (see Table 2). As we did not require higher temporal resolution than a few minutes for analysis, this was not a key issue here. The measurements with the RF discharge ion source had adequate sensitivity towards PAN in this moderately polluted region and have the additional advantage over 210Po of simultaneous detection of SO2 and HCl. In contrast, the differentiation between PAA and acetic acid is problematic. During NOTOMO, we were unaware of the sensitivity towards acetic acid at m∕z 59, and the signal without PAN (i.e. during titration of CH3C(O)O2 with NO) was measured with 20 V de-clustering only and therefore represents a combined signal of PAA and acetic acid. Although peracetic acid calibration was performed during the campaign, this is not considered reliable because the PAA diffusion source also contains significant amounts of acetic acid. For this reason, we present only an upper limit for acetic acid, ranging between 0 and 8 ppbv. From the PAN-to-PAA ratio calculated for PARADE (about 10) we would also expect several hundred pptv of PAA to be present (see Fig. S7), which would lower this approximate acetic acid mixing ratio significantly.

Figure 8CI-QMS time series of SO2, HCl, PAN, PAA mixing ratios and m∕z 59 during the IBAIRN campaign, which was undertaken in boreal forest. The red SO2 trace was obtained using a TEI 43 CTL fluorescence analyser (SMEAR II). The signal at m∕z 59 was converted to ppbv assuming that it consists only of acetic acid (no peracetic acid). The mixing ratios are therefore only an upper limit.
7.3 IBAIRN 2016
The IBAIRN campaign (Influence of Biosphere–Atmosphere Interactions on the Reactive Nitrogen budget, summer 2016) took place in boreal forest at Hyytiälä, Finland, an area with large biogenic emissions and low-NOx conditions (Liebmann et al., 2018). The CI-QMS inlet was located at about 6 m height within the canopy. A time series of SO2, HCl, PAN, PAA and the signal at m∕z 59 that has contributions from both acetic and peracetic acid is shown in Fig. 8.
During IBAIRN SO2 was monitored by the CI-QMS as (m∕z 207) with mixing ratios up to 1 ppbv. SO2 mixing ratios were largest when the air originated from the north-east (point sources like coal-burning power plants in northern Finland and Russia) but only occasionally exceeded 100 pptv in this remote, forested environment. Independent SO2 measurements, using a TEI 43 CTL fluorescence analyser (SMEAR II station, University of Helsinki), were made on a tower at a 16 m height (5 m distant from the CI-QMS inlet but approximately at canopy height) and allow a direct comparison to be made. The datasets are generally in good agreement (Fig. 8a), although some SO2 plumes were only observed at the higher inlet due to strong gradients in trace gas concentrations resulting from boundary layer dynamics.
HCl (Fig. 8b) was measured as I(CN)Cl− (m∕z 188 and 190) with mixing ratios up to 300 pptv showing a distinct diurnal profile with a maximum in the afternoon, which reflects temperature-dependent changes in partitioning between the gas phase and particle phase in which HCl is converted into NH4Cl.
The combined PAA and acetic acid signal at m∕z 59 obtained with de-clustering at 20 V (Fig. 8e) displays the diurnal profile expected from photochemically generated trace gases with night-time depositional losses. However, as explained in Sect. 7.2, we cannot easily separate the contribution to the signal from PAA and acetic acid. When NO is added (see Fig. S3), the signal at m∕z 59 with low de-clustering is due to PAA only (Fig. 8d), but the PAA detection limit is poor due to a low sensitivity and elevated and variable background signal during zeroing. The PAA contribution to the total signal at m∕z 59 is likely to be substantial but cannot be calculated as the sensitivity of the CI-QMS to PAA during de-clustering (Fig. 8e) is unknown, a result of the presence of unknown amounts of acetic acid in the PAA diffusion source. The use of a 210Po ionizer would have greatly improved the PAN (see Fig. 8c) and PAA data quality, as evidenced by the PAN and PAA measurements reported for the same location during 2010 (Phillips et al., 2013; Crowley et al., 2018).
The CI-QMS with an RF discharge ion source is a promising alternative to similar instruments using 210Po-based ion sources and can be deployed in environments for which permission to use 210Po may be difficult or impossible to obtain or to which transportation of 210Po is not feasible. The use of the RF discharge results in an extension of the established detection schemes (e.g. for ClNO2 and PAN) using I− ions, and we have identified ion schemes involving and primary ions that additionally enable detection of SO2 and HCl. Detection limits (2σ, 1 s integration) are 56 pptv for SO2, 135 pptv for HCl and 12 pptv for ClNO2, which makes the CI-QMS a useful tool for investigation of atmospheric processes related to sulfur and chlorine chemistry. Application of the instrument with the RF discharge ion source for PAN detection is limited to polluted environments where mixing ratios usually exceed a hundred pptv and a high temporal resolution is not needed. This restriction is mainly due to a background count rate that is higher by 1–2 orders of magnitude compared to the use of 210Po and due to a strong dependence of the measurement uncertainty on the variability of the subtracted interpolated background signal (consisting of PAA and acetic acid). A PAN detection limit (in the absence of PAA and acetic acid) of 34 pptv (1 s) was obtained, though this value will rarely be reached in boundary layer air masses where acetic acid and peracetic acid are abundant. Similarly, while sensitive detection of PAA (requiring de-clustering) is precluded by the detection of acetic acid at the same m∕z, the selective detection of acetic acid is uncertain due to the contribution of PAA.
The deployment of the CI-QMS with RF discharge and its advantages and disadvantages compared to instruments using 210Po-based ionization are illustrated in three campaign datasets, which demonstrate its potential to monitor trace gases at mixing ratios ranging from a few tens of pptv to a few ppbv. If the scientific focus is on PAA and PAN, the RF-discharge-based CI-QMS is clearly disadvantaged compared to the more selective and sensitive 210Po-based ionization. On the other hand, the potential to measure ClNO2 without logistical obstacles related to transport and (mobile) operation of radioactive sources and the added benefit of simultaneous measurement of HCl and SO2 may in some instances tip the balance in its favour.
The datasets presented in the field studies are archived and distributed through the KEEPER service of the Max Planck Digital Library (https://keeper.mpdl.mpg.de, last acess: 25 March 2019). Details required to access the data will be granted subsequent to agreeing to the relevant data protocol. We are grateful for the provision of automated SO2 measurement data from the SMEAR II site in Hyytiälä (Junninen et al., 2009).
The supplement related to this article is available online at: https://doi.org/10.5194/amt-12-1935-2019-supplement.
PGE developed and tested the RF discharge ion source in the laboratory, deployed the CI-QMS during the NOTOMO and IBAIRN campaigns, evaluated the field data and wrote the paper. FH and GS helped to design and modify the CI-QMS for the constant pressure and RF discharge operations. JNC and JL designed the field campaigns and contributed to the paper; GJP operated the CI-QMS during CYPHEX and helped evaluate the data.
The authors declare that they have no conflict of interest.
We thank the Cyprus Ministry of Defence for the use of the base of the
Cypriot National Guard at Ineia and the generous assistance of the Lara Naval
Observatory staff during the CYPHEX campaign. Our thanks also go to the
Department of Labour Inspection of Cyprus for helping us set up the campaign. We thank
Heinz Bingemer for logistical support and use of the facilities at the Taunus
Observatory during the NOTOMO campaign. We are grateful to the technical
staff of SMEAR II station for technical support and ENVRIplus for partial
financial support of the IBAIRN campaign.
We thank Jan Schuladen for his technical assistance with the CI-QMS and the
design of the TDR. We thank Thomas Klüpfel and Jonathan Williams at the
Max Planck Institute, Mainz, for the loan of a CO2 detector (LI-COR).
The article processing charges for this
open-access
publication were covered by the Max Planck
Society.
This paper was edited by Bin Yuan and reviewed by two anonymous referees.
Atkinson, R., Baulch, D. L., Cox, R. A., Crowley, J. N., Hampson, R. F., Hynes, R. G., Jenkin, M. E., Rossi, M. J., and Troe, J.: Evaluated kinetic and photochemical data for atmospheric chemistry: Volume I – gas phase reactions of Ox, HOx, NOx and SOx species, Atmos. Chem. Phys., 4, 1461–1738, https://doi.org/10.5194/acp-4-1461-2004, 2004.
Atkinson, R., Baulch, D. L., Cox, R. A., Crowley, J. N., Hampson, R. F., Hynes, R. G., Jenkin, M. E., Rossi, M. J., Troe, J., and IUPAC Subcommittee: Evaluated kinetic and photochemical data for atmospheric chemistry: Volume II – gas phase reactions of organic species, Atmos. Chem. Phys., 6, 3625–4055, https://doi.org/10.5194/acp-6-3625-2006, 2006.
Awtrey, A. D. and Connick, R. E.: The absorption spectra of I2, , I−, , and . Heat of the reaction , J. Am. Chem. Soc., 73, 1842–1843, https://doi.org/10.1021/ja01148a504, 1951.
Bahou, M., Chung, C. Y., Lee, Y. P., Cheng, B. M., Yung, Y. L., and Lee, L. C.: Absorption cross sections of HCl and DCl at 135-232 nanometers: Implications for photodissociation on Venus, Astrophys. J., 559, L179–L182, 2001.
Bannan, T. J., Booth, A. M., Bacak, A., Muller, J. B. A., Leather, K. E., Le Breton, M., Jones, B., Young, D., Coe, H., Allan, J., Visser, S., Slowik, J. G., Furger, M., Prevot, A. S. H., Lee, J., Dunmore, R. E., Hopkins, J. R., Hamilton, J. F., Lewis, A. C., Whalley, L. K., Sharp, T., Stone, D., Heard, D. E., Fleming, Z. L., Leigh, R., Shallcross, D. E., and Percival, C. J.: The first UK measurements of nitryl chloride using a chemical ionization mass spectrometer in central London in the summer of 2012, and an investigation of the role of Cl atom oxidation, J. Geophys. Res.-Atmos., 120, 5638–5657, https://doi.org/10.1002/2014jd022629, 2015.
Bardouki, H., Berresheim, H., Vrekoussis, M., Sciare, J., Kouvarakis, G., Oikonomou, K., Schneider, J., and Mihalopoulos, N.: Gaseous (DMS, MSA, SO2, H2SO4 and DMSO) and particulate (sulfate and methanesulfonate) sulfur species over the northeastern coast of Crete, Atmos. Chem. Phys., 3, 1871–1886, https://doi.org/10.5194/acp-3-1871-2003, 2003.
Bayram, S. B. and Freamat, M. V.: Vibrational spectra of N-2: An advanced undergraduate laboratory in atomic and molecular spectroscopy, Am. J. Phys., 80, 664–669, https://doi.org/10.1119/1.4722793, 2012.
Behnke, W., George, C., Scheer, V., and Zetzsch, C.: Production and decay of ClNO2 from the reaction of gaseous N2O5 with NaCl solution: Bulk and aerosol experiments, J. Geophys. Res.-Atmos., 102, 3795–3804, 1997.
Bogumil, K., Orphal, J., Homann, T., Voigt, S., Spietz, P., Fleischmann, O. C., Vogel, A., Hartmann, M., Kromminga, H., Bovensmann, H., Frerick, J., and Burrows, J. P.: Measurements of molecular absorption spectra with the SCIAMACHY pre-flight model: instrument characterization and reference data for atmospheric remote-sensing in the 230-2380 nm region, J. Photoch. Photobio. A, 157, 167–184, https://doi.org/10.1016/s1010-6030(03)00062-5, 2003.
Chadwick, B. M., Long, D. A., and Qureshi, S. U.: The Raman and infra-red spectra of the dicyanoiodate(I) ion, J. Raman Spectrosc., 9, 1–4, https://doi.org/10.1002/jrs.1250090103, 1980.
Chase Jr., M. W.: NIST-JANAF Themochemical Tables, Fourth Edition, J. Phys. Chem. Ref. Data, Monograph 9, 1–1951, 1998.
Crowley, J. N., Pouvesle, N., Phillips, G. J., Axinte, R., Fischer, H., Petäjä, T., Nölscher, A., Williams, J., Hens, K., Harder, H., Martinez-Harder, M., Novelli, A., Kubistin, D., Bohn, B., and Lelieveld, J.: Insights into HOx and ROx chemistry in the boreal forest via measurement of peroxyacetic acid, peroxyacetic nitric anhydride (PAN) and hydrogen peroxide, Atmos. Chem. Phys., 18, 13457–13479, https://doi.org/10.5194/acp-18-13457-2018, 2018.
Dentener, F. J. and Crutzen, P. J.: Reaction of N2O5 on tropospheric aerosols – Impact on the global distributions of NOX, O3, and OH, J. Geophys. Res.-Atmos., 98, 7149–7163, 1993.
Derstroff, B., Hüser, I., Bourtsoukidis, E., Crowley, J. N., Fischer, H., Gromov, S., Harder, H., Janssen, R. H. H., Kesselmeier, J., Lelieveld, J., Mallik, C., Martinez, M., Novelli, A., Parchatka, U., Phillips, G. J., Sander, R., Sauvage, C., Schuladen, J., Stönner, C., Tomsche, L., and Williams, J.: Volatile organic compounds (VOCs) in photochemically aged air from the eastern and western Mediterranean, Atmos. Chem. Phys., 17, 9547–9566, https://doi.org/10.5194/acp-17-9547-2017, 2017.
Faxon, C. B., Bean, J. K., and Hildebrandt Ruiz, L.: Inland Concentrations of Cl2 and ClNO2 in Southeast Texas Suggest Chlorine Chemistry Significantly Contributes to Atmospheric Reactivity, Atmosphere, 6, 1487–1506, https://doi.org/10.3390/atmos6101487, 2015.
Flocke, F. M., Weinheimer, A. J., Swanson, A. L., Roberts, J. M., Schmitt, R., and Shertz, S.: On the measurement of PANs by gas chromatography and electron capture detection, J. Atmos. Chem., 52, 19–43, 2005.
Friedrich, N.: Development and characterisation of two methods for the wet-chemical calibration of peracetic acid for chemical ionisation mass-spectrometry (in German), MSc, Inorganic and analytical chemistry, Johannes Gutenberg Universität Mainz, Mainz, 2015.
Furgeson, A., Mielke, L. H., Paul, D., and Osthoff, H. D.: A photochemical source of peroxypropionic and peroxyisobutanoic nitric anhydride, Atmos. Env., 45, 5025–5032, 2011.
Goos, E., Burcat, A., and Ruscic, B.: Extended Third Millennium Ideal Gas and Condensed Phase Thermochemical Database for Combustion with Updates from Active Thermochemical Tables: Update of “Third Millennium Ideal Gas and Condensed Phase Thermochemical Database for Combustion with Updates from Active Thermochemical Tables by Alexander Burcat and Branko Ruscic”, Report ANL 05/20 and TAE 960 Technion-IIT, Aerospace Engineering, and Argonne National Laboratory, Chemistry Division, September 2005., 2005.
Hao, C. T., Gilbert, T. M., and Sunderlin, L. S.: The bond dissociation energies of (X = F, Cl, Br, and I), Can. J. Chem., 83, 2013–2019, 2005.
Huey, L. G.: Measurement of trace atmospheric species by chemical ionization mass spectrometry: Speciation of reactive nitrogen and future directions, Mass Spectrom. Rev., 26, 166–184, https://doi.org/10.1002/mas.20118, 2007.
Huey, L. G., Hanson, D. R., and Howard, C. J.: Reactions of Sf6- and I- with Atmospheric Trace Gases, J. Phys. Chem., 99, 5001–5008, 1995.
IUPAC: Task Group on Atmospheric Chemical Kinetic Data Evaluation, (Ammann, M., Cox, R. A., Crowley, J. N., Herrmann, H., Jenkin, M. E., McNeill, V. F., Mellouki, A., Rossi, M. J., Troe, J. and Wallington, T. J.), available at: http://iupac.pole-ether.fr/index.html (last access: January 2019), 2018.
Jost, C., Sprung, D., Kenntner, T., and Reiner, T.: Atmospheric pressure chemical ionization mass spectrometry for the detection of tropospheric trace gases: the influence of clustering on sensitivity and precision, Int. J. Mass Spectrom., 223, 771–782, https://doi.org/10.1016/S1387-3806(02)00963-6, 2003.
Junninen, H., Lauri, A., Keronen, P., Aalto, P., Hiltunen, V., Hari, P., and Kulmala, M.: Smart-SMEAR: on-line data exploration and visualization tool for SMEAR stations, Boreal Environ. Res., 14, 447–457, 2009.
Kanakidou, M., Mihalopoulos, N., Kindap, T., Im, U., Vrekoussis, M., Gerasopoulos, E., Dermitzaki, E., Unal, A., Kocak, M., Markakis, K., Melas, D., Kouvarakis, G., Youssef, A. F., Richter, A., Hatzianastassiou, N., Hilboll, A., Ebojie, F., Wittrock, F., von Savigny, C., Burrows, J. P., Ladstaetter-Weissenmayer, A., and Moubasher, H.: Megacities as hot spots of air pollution in the East Mediterranean, Atmos. Environ., 45, 1223–1235, https://doi.org/10.1016/j.atmosenv.2010.11.048, 2011.
Keene, W. C., Stutz, J., Pszenny, A. A. P., Maben, J. R., Fischer, E. V., Smith, A. M., von Glasow, R., Pechtl, S., Sive, B. C., and Varner, R. K.: Inorganic chlorine and bromine in coastal New England air during summer, J. Geophys. Res.-Atmos., 112, D10s12, https://doi.org/10.1029/2006jd007689, 2007.
Keene, W. C., Long, M. S., Pszenny, A. A. P., Sander, R., Maben, J. R., Wall, A. J., O'Halloran, T. L., Kerkweg, A., Fischer, E. V., and Schrems, O.: Latitudinal variation in the multiphase chemical processing of inorganic halogens and related species over the eastern North and South Atlantic Oceans, Atmos. Chem. Phys., 9, 7361–7385, https://doi.org/10.5194/acp-9-7361-2009, 2009.
Kürten, A., Rondo, L., Ehrhart, S., and Curtius, J.: Performance of a corona ion source for measurement of sulfuric acid by chemical ionization mass spectrometry, Atmos. Meas. Tech., 4, 437–443, https://doi.org/10.5194/amt-4-437-2011, 2011.
LaFranchi, B. W., Wolfe, G. M., Thornton, J. A., Harrold, S. A., Browne, E. C., Min, K. E., Wooldridge, P. J., Gilman, J. B., Kuster, W. C., Goldan, P. D., de Gouw, J. A., McKay, M., Goldstein, A. H., Ren, X., Mao, J., and Cohen, R. C.: Closing the peroxy acetyl nitrate budget: observations of acyl peroxy nitrates (PAN, PPN, and MPAN) during BEARPEX 2007, Atmos. Chem. Phys., 9, 7623–7641, https://doi.org/10.5194/acp-9-7623-2009, 2009.
Lazrus, A. L., Kok, G. L., Lind, J. A., Gitlin, S. N., Heikes, B. G., and Shetter, R. E.: Automated Fluorometric Method for Hydrogen-Peroxide in Air, Anal. Chem., 58, 594–597, 1986.
Le Breton, M., McGillen, M. R., Muller, J. B. A., Bacak, A., Shallcross, D. E., Xiao, P., Huey, L. G., Tanner, D., Coe, H., and Percival, C. J.: Airborne observations of formic acid using a chemical ionization mass spectrometer, Atmos. Meas. Tech., 5, 3029–3039, https://doi.org/10.5194/amt-5-3029-2012, 2012.
Lee, B. H., Lopez-Hilfiker, F. D., Mohr, C., Kurten, T., Worsnop, D. R., and Thornton, J. A.: An Iodide-Adduct High-Resolution Time-of-Flight Chemical-Ionization Mass Spectrometer: Application to Atmospheric Inorganic and Organic Compounds, Environ. Sci. Technol., 48, 6309–6317, https://doi.org/10.1021/es500362a, 2014.
Lelieveld, J. and Crutzen, P. J.: Influences of Cloud Photochemical Processes on Tropospheric Ozone, Nature, 343, 227–233, 1990.
Liebmann, J., Karu, E., Sobanski, N., Schuladen, J., Ehn, M., Schallhart, S., Quéléver, L., Hellen, H., Hakola, H., Hoffmann, T., Williams, J., Fischer, H., Lelieveld, J., and Crowley, J. N.: Direct measurement of NO3 radical reactivity in a boreal forest, Atmos. Chem. Phys., 18, 3799–3815, https://doi.org/10.5194/acp-18-3799-2018, 2018.
Lofthus, A. and Krupenie, P. H.: Spectrum of molecular nitrogen, J. Phys. Chem. Ref. Data, 6, 113–307, https://doi.org/10.1063/1.555546, 1977.
McNeill, V. F., Patterson, J., Wolfe, G. M., and Thornton, J. A.: The effect of varying levels of surfactant on the reactive uptake of N2O5 to aqueous aerosol, Atmos. Chem. Phys., 6, 1635–1644, https://doi.org/10.5194/acp-6-1635-2006, 2006.
Meusel, H., Kuhn, U., Reiffs, A., Mallik, C., Harder, H., Martinez, M., Schuladen, J., Bohn, B., Parchatka, U., Crowley, J. N., Fischer, H., Tomsche, L., Novelli, A., Hoffmann, T., Janssen, R. H. H., Hartogensis, O., Pikridas, M., Vrekoussis, M., Bourtsoukidis, E., Weber, B., Lelieveld, J., Williams, J., Pöschl, U., Cheng, Y., and Su, H.: Daytime formation of nitrous acid at a coastal remote site in Cyprus indicating a common ground source of atmospheric HONO and NO, Atmos. Chem. Phys., 16, 14475–14493, https://doi.org/10.5194/acp-16-14475-2016, 2016.
Mielke, L. H. and Osthoff, H. D.: On quantitative measurements of peroxycarboxylic nitric anhydride mixing ratios by thermal dissociation chemical ionization mass spectrometry, Int. J. Mass Spectrom., 310, 1–9, https://doi.org/10.1016/j.ijms.2011.10.005, 2012.
Mielke, L. H., Furgeson, A., and Osthoff, H. D.: Observation of CINO2 in a mid-continental urban environment, Environ. Sci. Technol., 45, 8889–8896, https://doi.org/10.1021/es201955u, 2011.
Miller, E. M., Sheps, L., Lu, Y. J., Case, A. S., McCoy, A. B., and Lineberger, W. C.: New view of the ICN A continuum using photoelectron spectroscopy of ICN, J. Chem. Phys., 136, 044313, https://doi.org/10.1063/1.3679170, 2012.
Molina, M. J., Tso, T. L., Molina, L. T., and Wang, F. C. Y.: Antarcctic stratospheric chemistry of chlorine nitrate, hydrogen chloride and ice – Release of active chlorine, Science, 238, 1253–1257, https://doi.org/10.1126/science.238.4831.1253, 1987.
Moxim, W. J., Levy, H., and Kasibhatla, P. S.: Simulated global tropospheric PAN: Its transport and impact on NOx, J. Geophys. Res.-Atmos., 101, 12621–12638, 1996.
Neuman, J. A., Trainer, M., Brown, S. S., Min, K. E., Nowak, J. B., Parrish, D. D., Peischl, J., Pollack, I. B., Roberts, J. M., Ryerson, T. B., and Veres, P. R.: HONO emission and production determined from airborne measurements over the Southeast US, J. Geophys. Res.-Atmos., 121, 9237–9250, https://doi.org/10.1002/2016jd025197, 2016.
NIST Webbook: National Institute of Standards and Technology, available at: http://webbook.nist.gov (last access: January 2019), 2010.
Osthoff, H. D., Roberts, J. M., Ravishankara, A. R., Williams, E. J., Lerner, B. M., Sommariva, R., Bates, T. S., Coffman, D., Quinn, P. K., Dibb, J. E., Stark, H., Burkholder, J. B., Talukdar, R. K., Meagher, J., Fehsenfeld, F. C., and Brown, S. S.: High levels of nitryl chloride in the polluted subtropical marine boundary layer, Nat. Geosci., 1, 324–328, 2008.
Phillips, G. J., Tang, M. J., Thieser, J., Brickwedde, B., Schuster, G., Bohn, B., Lelieveld, J., and Crowley, J. N.: Significant concentrations of nitryl chloride observed in rural continental Europe associated with the influence of sea salt chloride and anthropogenic emissions, Geophys. Res. Lett., 39, L10811, https://doi.org/10.1029/2012GL051912, 2012.
Phillips, G. J., Pouvesle, N., Thieser, J., Schuster, G., Axinte, R., Fischer, H., Williams, J., Lelieveld, J., and Crowley, J. N.: Peroxyacetyl nitrate (PAN) and peroxyacetic acid (PAA) measurements by iodide chemical ionisation mass spectrometry: first analysis of results in the boreal forest and implications for the measurement of PAN fluxes, Atmos. Chem. Phys., 13, 1129–1139, https://doi.org/10.5194/acp-13-1129-2013, 2013.
Phillips, G. J., Thieser, J., Tang, M., Sobanski, N., Schuster, G., Fachinger, J., Drewnick, F., Borrmann, S., Bingemer, H., Lelieveld, J., and Crowley, J. N.: Estimating N2O5 uptake coefficients using ambient measurements of NO3, N2O5, ClNO2 and particle-phase nitrate, Atmos. Chem. Phys., 16, 13231–13249, https://doi.org/10.5194/acp-16-13231-2016, 2016.
Priestley, M., le Breton, M., Bannan, T. J., Worrall, S. D., Bacak, A., Smedley, A. R. D., Reyes-Villegas, E., Mehra, A., Allan, J., Webb, A. R., Shallcross, D. E., Coe, H., and Percival, C. J.: Observations of organic and inorganic chlorinated compounds and their contribution to chlorine radical concentrations in an urban environment in northern Europe during the wintertime, Atmos. Chem. Phys., 18, 13481–13493, https://doi.org/10.5194/acp-18-13481-2018, 2018.
Refaey, K. M. A. and Franklin, J. L.: Endoergic ion-molecule collision processes of negaive ions. 6. Collisions of I− on (CN)2 and NOCl, Int. J. Mass Spectrom., 23, 13–20, https://doi.org/10.1016/0020-7381(77)80002-8, 1977.
Riedel, T. P., Bertram, T. H., Crisp, T. A., Williams, E. J., Lerner, B. M., Vlasenko, A., Li, S. M., Gilman, J., de Gouw, J., Bon, D. M., Wagner, N. L., Brown, S. S., and Thornton, J. A.: Nitryl Chloride and Molecular Chlorine in the Coastal Marine Boundary Layer, Environ. Sci. Technol., 46, 10463–10470, https://doi.org/10.1021/es204632r, 2012.
Roiger, A., Aufmhoff, H., Stock, P., Arnold, F., and Schlager, H.: An aircraft-borne chemical ionization – ion trap mass spectrometer (CI-ITMS) for fast PAN and PPN measurements, Atmos. Meas. Tech., 4, 173–188, https://doi.org/10.5194/amt-4-173-2011, 2011.
Schembari, C., Cavalli, F., Cuccia, E., Hjorth, J., Calzolai, G., Perez, N., Pey, J., Prati, P., and Raes, F.: Impact of a European directive on ship emissions on air quality in Mediterranean harbours, Atmos. Environ., 61, 661–669, https://doi.org/10.1016/j.atmosenv.2012.06.047, 2012.
Skalny, J. D., Horvath, G., and Mason, N. L.: Mass spectrometric analysis of small negative ions (e/m < 100) produced by Trichel pulse negative corona discharge fed by ozonised air, J. Optoelectron. Adv. M., 9, 887–893, 2007.
Slusher, D. L., Huey, L. G., Tanner, D. J., Flocke, F. M., and Roberts, J. M.: A thermal dissociation-chemical ionization mass spectrometry (TD-CIMS) technique for the simultaneous measurement of peroxyacyl nitrates and dinitrogen pentoxide, J. Geophys. Res.-Atmos., 109, D19315, https://doi.org/10.1029/2004JD004670, 2004.
Sobanski, N., Schuladen, J., Schuster, G., Lelieveld, J., and Crowley, J. N.: A five-channel cavity ring-down spectrometer for the detection of NO2, NO3, N2O5, total peroxy nitrates and total alkyl nitrates, Atmos. Meas. Tech., 9, 5103–5118, https://doi.org/10.5194/amt-9-5103-2016, 2016.
Sobanski, N., Thieser, J., Schuladen, J., Sauvage, C., Song, W., Williams, J., Lelieveld, J., and Crowley, J. N.: Day and night-time formation of organic nitrates at a forested mountain site in south-west Germany, Atmos. Chem. Phys., 17, 4115–4130, https://doi.org/10.5194/acp-17-4115-2017, 2017.
Svarnas, P.: Vibrational temperature of excited nitrogen molecules detected in a 13.56 MHz electrical discharge by sheath-side optical emission spectroscopy, Plasma Sci. Technol., 15, 891–895, https://doi.org/10.1088/1009-0630/15/9/11, 2013.
Thaler, R. D., Mielke, L. H., and Osthoff, H. D.: Quantification of nitryl chloride at part per trillion mixing ratios by thermal dissociation cavity ring-down spectroscopy, Anal. Chem., 83, 2761–2766, https://doi.org/10.1021/ac200055z, 2011.
Tham, Y. J., Wang, Z., Li, Q., Yun, H., Wang, W., Wang, X., Xue, L., Lu, K., Ma, N., Bohn, B., Li, X., Kecorius, S., Größ, J., Shao, M., Wiedensohler, A., Zhang, Y., and Wang, T.: Significant concentrations of nitryl chloride sustained in the morning: investigations of the causes and impacts on ozone production in a polluted region of northern China, Atmos. Chem. Phys., 16, 14959–14977, https://doi.org/10.5194/acp-16-14959-2016, 2016.
Thieser, J., Schuster, G., Schuladen, J., Phillips, G. J., Reiffs, A., Parchatka, U., Pöhler, D., Lelieveld, J., and Crowley, J. N.: A two-channel thermal dissociation cavity ring-down spectrometer for the detection of ambient NO2, RO2NO2 and RONO2, Atmos. Meas. Tech., 9, 553–576, https://doi.org/10.5194/amt-9-553-2016, 2016.
Thornton, J. A., Kercher, J. P., Riedel, T. P., Wagner, N. L., Cozic, J., Holloway, J. S., Dube, W. P., Wolfe, G. M., Quinn, P. K., Middlebrook, A. M., Alexander, B., and Brown, S. S.: A large atomic chlorine source inferred from mid-continental reactive nitrogen chemistry, Nature, 464, 271–274, https://doi.org/10.1038/nature08905, 2010.
Turnipseed, A. A., Huey, L. G., Nemitz, E., Stickel, R., Higgs, J., Tanner, D. J., Slusher, D. L., Sparks, J. P., Flocke, F., and Guenther, A.: Eddy covariance fluxes of peroxyacetyl nitrates (PANs) and NOy to a coniferous forest, J. Geophys. Res.-Atmos., 111, D09304, 2006.
Veres, P., Gilman, J. B., Roberts, J. M., Kuster, W. C., Warneke, C., Burling, I. R., and de Gouw, J.: Development and validation of a portable gas phase standard generation and calibration system for volatile organic compounds, Atmos. Meas. Tech., 3, 683–691, https://doi.org/10.5194/amt-3-683-2010, 2010.
Veres, P. R., Roberts, J. M., Wild, R. J., Edwards, P. M., Brown, S. S., Bates, T. S., Quinn, P. K., Johnson, J. E., Zamora, R. J., and de Gouw, J.: Peroxynitric acid (HO2NO2) measurements during the UBWOS 2013 and 2014 studies using iodide ion chemical ionization mass spectrometry, Atmos. Chem. Phys., 15, 8101–8114, https://doi.org/10.5194/acp-15-8101-2015, 2015.
Wang, T., Tham, Y. J., Xue, L., Li, Q., Zha, Q., Wang, Z., Poon, S. C. N., Dube, W. P., Blake, D. R., Louie, P. K. K., Luk, C. W. Y., Tsui, W., and Brown, S. S.: Observations of nitryl chloride and modeling its source and effect on ozone in the planetary boundary layer of southern China, J. Geophys. Res.-Atmos., 121, 2476–2489, https://doi.org/10.1002/2015jd024556, 2016.
Wang, X. F., Wang, T., Xue, L. K., Nie, W., Xu, Z., Poon, S. C. N., and Wang, W. X.: Peroxyacetyl nitrate measurements by thermal dissociation-chemical ionization mass spectrometry in an urban environment: performance and characterizations, Front. Env. Sci. Eng., 11, 3, https://doi.org/10.1007/s11783-017-0925-7, 2017.
Warneck, P. and Zerbach, T.: Synthesis of peroxyacetyl nitrate in air by acetone photolysis, Environ. Sci. Technol., 26, 74–79, 1992.
Warneke, C., Trainer, M., de Gouw, J. A., Parrish, D. D., Fahey, D. W., Ravishankara, A. R., Middlebrook, A. M., Brock, C. A., Roberts, J. M., Brown, S. S., Neuman, J. A., Lerner, B. M., Lack, D., Law, D., Hübler, G., Pollack, I., Sjostedt, S., Ryerson, T. B., Gilman, J. B., Liao, J., Holloway, J., Peischl, J., Nowak, J. B., Aikin, K. C., Min, K.-E., Washenfelder, R. A., Graus, M. G., Richardson, M., Markovic, M. Z., Wagner, N. L., Welti, A., Veres, P. R., Edwards, P., Schwarz, J. P., Gordon, T., Dube, W. P., McKeen, S. A., Brioude, J., Ahmadov, R., Bougiatioti, A., Lin, J. J., Nenes, A., Wolfe, G. M., Hanisco, T. F., Lee, B. H., Lopez-Hilfiker, F. D., Thornton, J. A., Keutsch, F. N., Kaiser, J., Mao, J., and Hatch, C. D.: Instrumentation and measurement strategy for the NOAA SENEX aircraft campaign as part of the Southeast Atmosphere Study 2013, Atmos. Meas. Tech., 9, 3063–3093, https://doi.org/10.5194/amt-9-3063-2016, 2016.
Wen, H., Hou, G. L., Huang, W., Govind, N., and Wang, X. B.: Photoelectron spectroscopy of higher bromine and iodine oxide anions: Electron affinities and electronic structures of BrO2,3 and IO2−4 radicals, J. Chem. Phys., 135, 184309, https://doi.org/10.1063/1.3658858, 2011.
Wolfe, G. M., Thornton, J. A., Yatavelli, R. L. N., McKay, M., Goldstein, A. H., LaFranchi, B., Min, K.-E., and Cohen, R. C.: Eddy covariance fluxes of acyl peroxy nitrates (PAN, PPN and MPAN) above a Ponderosa pine forest, Atmos. Chem. Phys., 9, 615–634, https://doi.org/10.5194/acp-9-615-2009, 2009.
Wollenhaupt, M., Carl, S. A., Horowitz, A., and Crowley, J. N.: Rate coefficients for reaction of OH with acetone between 202 and 395 K, J. Phys. Chem., 104, 2695–2705, 2000.
Zheng, J., Yang, D. S., Ma, Y., Chen, M. D., Cheng, J., Li, S. Z., and Wang, M.: Development of a new corona discharge based ion source for high resolution time-of-flight chemical ionization mass spectrometer to measure gaseous H2SO4 and aerosol sulfate, Atmos. Environ., 119, 167–173, https://doi.org/10.1016/j.atmosenv.2015.08.028, 2015.
Zheng, W., Flocke, F. M., Tyndall, G. S., Swanson, A., Orlando, J. J., Roberts, J. M., Huey, L. G., and Tanner, D. J.: Characterization of a thermal decomposition chemical ionization mass spectrometer for the measurement of peroxy acyl nitrates (PANs) in the atmosphere, Atmos. Chem. Phys., 11, 6529–6547, https://doi.org/10.5194/acp-11-6529-2011, 2011.
Zimmermann, S., Kippenberger, M., Schuster, G., and Crowley, J. N.: Adsorption isotherms for hydrogen chloride (HCl) on ice surfaces between 190 and 220 K, Phys. Chem. Chem. Phys., 18, 13799–13810, https://doi.org/10.1039/c6cp01962e, 2016.
- Abstract
- Introduction
- Instrumentation
- Primary-ion spectra
- Detection schemes and calibration methods
- Dependence of sensitivity on relative humidity
- Sensitivity, detection limits and total uncertainty
- Application in the field
- Conclusions
- Data availability
- Author contributions
- Competing interests
- Acknowledgements
- Review statement
- References
- Supplement