the Creative Commons Attribution 4.0 License.
the Creative Commons Attribution 4.0 License.
 | 04 Apr 2019
Using the tracer flux ratio method with flight measurements to estimate dairy farm CH4 emissions in central California
Stephen Conley
Ian C. Faloona
Claudia Arndt
Tara I. Yacovitch
Joseph R. Roscioli
Scott C. Herndon
Tracer flux ratio methodology was applied to airborne measurements to quantify methane (CH4) emissions from two dairy farms in central California during the summer. An aircraft flew around the perimeter of each farm measuring downwind enhancements of CH4 and a tracer species released from the ground at a known rate. Estimates of CH4 emission rates from this analysis were determined for whole sites and major sources within a site (animal housing and liquid manure lagoons). Whole-site CH4 flux rates for each farm, Dairy 1 (6108±821 kg CH4 d−1, 95 % confidence interval) and Dairy 2 (4018±456 kg CH4 d−1, 95 % confidence interval), closely resembled findings by established methods: ground-based tracer flux ratio and mass balance. Individual source emission rates indicate a greater fraction of the whole-site emissions come from liquid manure management than animal housing activity, similar to bottom-up estimates. Despite differences in altitude, we observed that the tracer release method gave consistent results when using ground or air platforms.
- Article
(2754 KB) -
Supplement
(236 KB) - BibTeX
- EndNote


Methane (CH4) released into the atmosphere as a result of agricultural activity, such as enteric fermentation and anaerobic digestion, significantly contributes to overall greenhouse gas emissions in the United States (USEPA, 2017). The California Air Resources Board (CARB) attributes approximately 60 % of recent anthropogenic CH4 emissions in California to agriculture, with 45 % of CH4 emissions directly related to dairy farm activity for 2013 (CARB, 2017). Reduction strategies proposed by CARB seek to lower California's CH4 emissions to 40 % below 2013 rates by 2030 (CARB, 2017), thereby emphasizing the need for accurate methods to directly quantify the contribution of different CH4 sources within agricultural operations. Estimates of CH4 emissions due to dairy livestock can be calculated using inventory emission factors combined with activity data on animal populations, animal types, and details about feed intake in a particular country (Dong et al., 2006). Other methods to estimate CH4 emissions from ruminants involve direct atmospheric measurements. Emissions from dairy farms have been estimated in the Los Angeles Basin, California, using downwind airborne flux measurements (Peischl et al., 2013). Farm-scale measurements of CH4 have been made using a variety of techniques and instruments, such as open-path infrared spectrometers (Leytem et al., 2017), tunable-infrared direct absorption spectroscopy (Hacker et al., 2016), and column measurements employing solar absorption spectrometers with comparisons to cavity ring-down spectrometers (Viatte et al., 2017). Several studies of various CH4 sources (e.g., natural gas pipelines, landfills, dairy farms) assert that inventory-based calculations tend to underestimate emissions compared to atmospheric observations and modeling (Brandt et al., 2014; Miller et al., 2013; Peischl et al., 2013; Trousdell et al., 2016).
Atmospheric studies have often used specific gases as tracers to distinguish a sample of interest from background conditions or interferences. Tracer gases released at known rates have been employed in experiments looking at chemical transport (Ferber et al., 1986), dispersion (Record and Cramer, 1958), source allocation (Lamb et al., 1995; Mønster et al., 2014), and model verification (Sykes et al., 1993) using mobile laboratories (Wang et al., 2009; Yacovitch et al., 2015), radiosondes, sampling towers, and ground-based equipment. Application of tracer gases in agricultural studies have involved insertion of a sulfur hexafluoride (SF6) permeation tube into the rumen of a cow with subsequent collection of time-integrated breath samples (Grainger et al., 2007). Inverse-dispersion techniques have employed line-source releases of SF6 within a dairy farm combined with open-path measurements to understand whole-site emissions (McGinn et al., 2006). Release of a tracer gas directly into the atmosphere, 2–3 m above ground level, can be used to determine and distinguish CH4 emissions from various sources within a site (Roscioli et al., 2015). This study quantifies CH4 emissions using the well-established tracer flux ratio method at two dairy farms over the course of 8 summer days (Lamb et al., 1995; Roscioli et al., 2015). Controlled releases of tracer gas from various areas on each farm mixed with site-derived emissions were observed by an instrumented aircraft and mobile laboratory (Arndt et al., 2018). Using this technique provided the flexibility to estimate entire dairy farm emissions and apportion emissions among sources (animal housing, liquid manure management, etc.) on multiple scales.
Uncertainty in measurements from low-flying airborne studies has been attributed to the need to extrapolate results below the minimum safe flight heights (∼150 m) as regulated by the Federal Aviation Administration (Conley et al., 2017; Hacker et al., 2016). Prior to this study, Aerodyne Research, Inc. (ARI) performed controlled ground releases of ethane (C2H6) in Colorado and Arkansas, while Scientific Aviation (SA) made measurements in a similar aircraft to the one used in this study (Conley et al., 2017). The original release rate of C2H6 was estimated via a refined mass balance technique, with a +2 % difference observed during tests in Colorado (50 laps flown) and +24 % difference in Arkansas (19 laps flown) as described in Conley et al. (2017). These releases did not correspond to any CH4 source (natural gas site, dairy farm, etc.) but demonstrated the feasibility of using a low-flying aircraft to successfully quantify flow rates from controlled tracer gas releases. Using tracer flux ratio in this study, we again utilized the aircraft to detect emitted tracer gas and then compared with dairy farm emissions to evaluate CH4 emission rates.
This field study was originally focused on estimating CH4 emissions from dairy farms and distinguishing on-site sources using established techniques (Arndt et al., 2018). An intentional effort was made to align measurement time windows of the mobile laboratory and aircraft for the purpose of inter-comparison between the tracer flux ratio and mass balance methods. As a result, the aircraft was exposed to several hours of ground-released tracer gas. Due to this overlap in time, we were able to (1) further assess the viability of observing enhanced concentrations of a ground-released tracer gas from an aircraft at low flow rates, (2) compare CH4 and C2H6 enhancements emitted from within dairy farms via tracer flux ratio to determine emission rates, and (3) directly compare the application of tracer flux ratio methodology to simultaneous ground and airborne measurements of the same air mass.
2.1 Participants
In a collaborative effort, SA and ARI attempted a flight-based tracer release experiment to quantify CH4 emissions from two dairy farms in central California. This study reanalyzes data collected as part of an Environmental Defense Fund coordinated project that occurred in June 2016 (Arndt et al., 2018). Both groups performed established techniques in the field to estimate dairy farm emissions. ARI employed tracer flux ratio methodology with two tracer gases and a mobile laboratory, while SA conducted a mass balance experiment from a light aircraft.
Aerodyne Research, Inc. (ARI) drove ground-based transects in a mobile laboratory (miniature Aerodyne Mobile Laboratory, “minAML”) equipped with highly precise Aerodyne tunable infrared laser direct absorption spectrometers (TILDAS) measuring a variety of species (CH4, C2H2, C2H6, CO, and H2O). A LI-COR (Lincoln, Nebraska, USA) non-dispersive infrared (NDIR) instrument (Model 6262) measured CO2 and H2O. Meteorological and positional data (wind, temperature, relative humidity, barometric pressure, and GPS) were collected at all tracer release sites and on the vehicle, using multiple AIRMAR (Milford, NH, USA) 200WX WeatherStation® instruments and a Hemisphere (Scottsdale, AZ, USA) V103 GPS Compass. To minimize drift and maintain accurate baseline values on the TILDAS instruments in the minAML, a valve sequence enabled overblowing of the inlet with ultra-zero air every 15 min for 45 s (including cell purging). Scientific Aviation equipped an aircraft with a Picarro (Santa Clara, CA) G2301-f cavity ring-down spectrometer (CO2, CH4, H2O), TILDAS (C2H6, CH4, H2O) Vaisala (Helsinki, Finland) HMP60 humidity and temperature probe, and Hemisphere VS330 GPS Compass used for positioning and calculating wind velocity (Conley et al., 2014). Since SA had a TILDAS on board measuring C2H6 during these times, it was possible to treat these flights as a tracer release experiment similar to that performed with the ground-based equipment. A full description of the equipment used during this project can be found in the Supplement of Arndt et al. (2018).
During this study, the aircraft flew low and close to the sites, at an average distance of ∼900 m and an altitude of ∼325 m. Each site had a combination of spread out point source emitters (cows) and large open area sources (anaerobic lagoon and settling cells). SA conducted 11 flights over 6 d, usually flying twice a day, in the late morning and mid-afternoon. Flights typically lasted 1–2 h for a given farm, flying in spirals looping around the perimeter of the animal housing and manure management areas. ARI measured for 3 d at Dairy 1 and 5 d at Dairy 2. The mobile lab drove at several different times of day for each site, trying to capture any diurnal effect, but always overlapped with the aircraft at least once a day.
2.2 Tracer release
Tracer gases, ethane and acetylene, were released from ground-based tripods (2–3 m high) at a variety of locations on the dairy farms with the intention of co-locating with known emission sources (animal housing, anaerobic lagoons, settling cells, etc.). Tracers were used to distinguish and quantify sources by positioning them within each respective emission area. Often, each tracer was released at a single point from each major source, typically the liquid manure management (anaerobic lagoon and settling cells) and animal housing areas (barns and lots). For this study, only the position and release rate of C2H6 is relevant. Release rates of C2H6 ranged from 10 to 40 slpm throughout the project (averaged 15 slpm). A schematic of tracer release being performed at a dairy farm is shown in Fig. 1. Detailed descriptions of the tracer flux ratio technique used during this work can be found in Arndt et al. (2018) or more generally in Roscioli et al. (2015). In summary, tracer gas released close to a source produces a plume that experiences the local wind dynamics and meteorological conditions akin to the nearby emission of interest, thereby proving a representation of those emissions. A plume is considered to be a co-located enhancement above ambient concentrations of CH4 and tracer gas. Active tracer release overlapped with on-site flight transects for approximately 11 h during this week-long project. Exact timing of the overlap between the release of C2H6 and sampling periods by the aircraft is shown in Table 1.
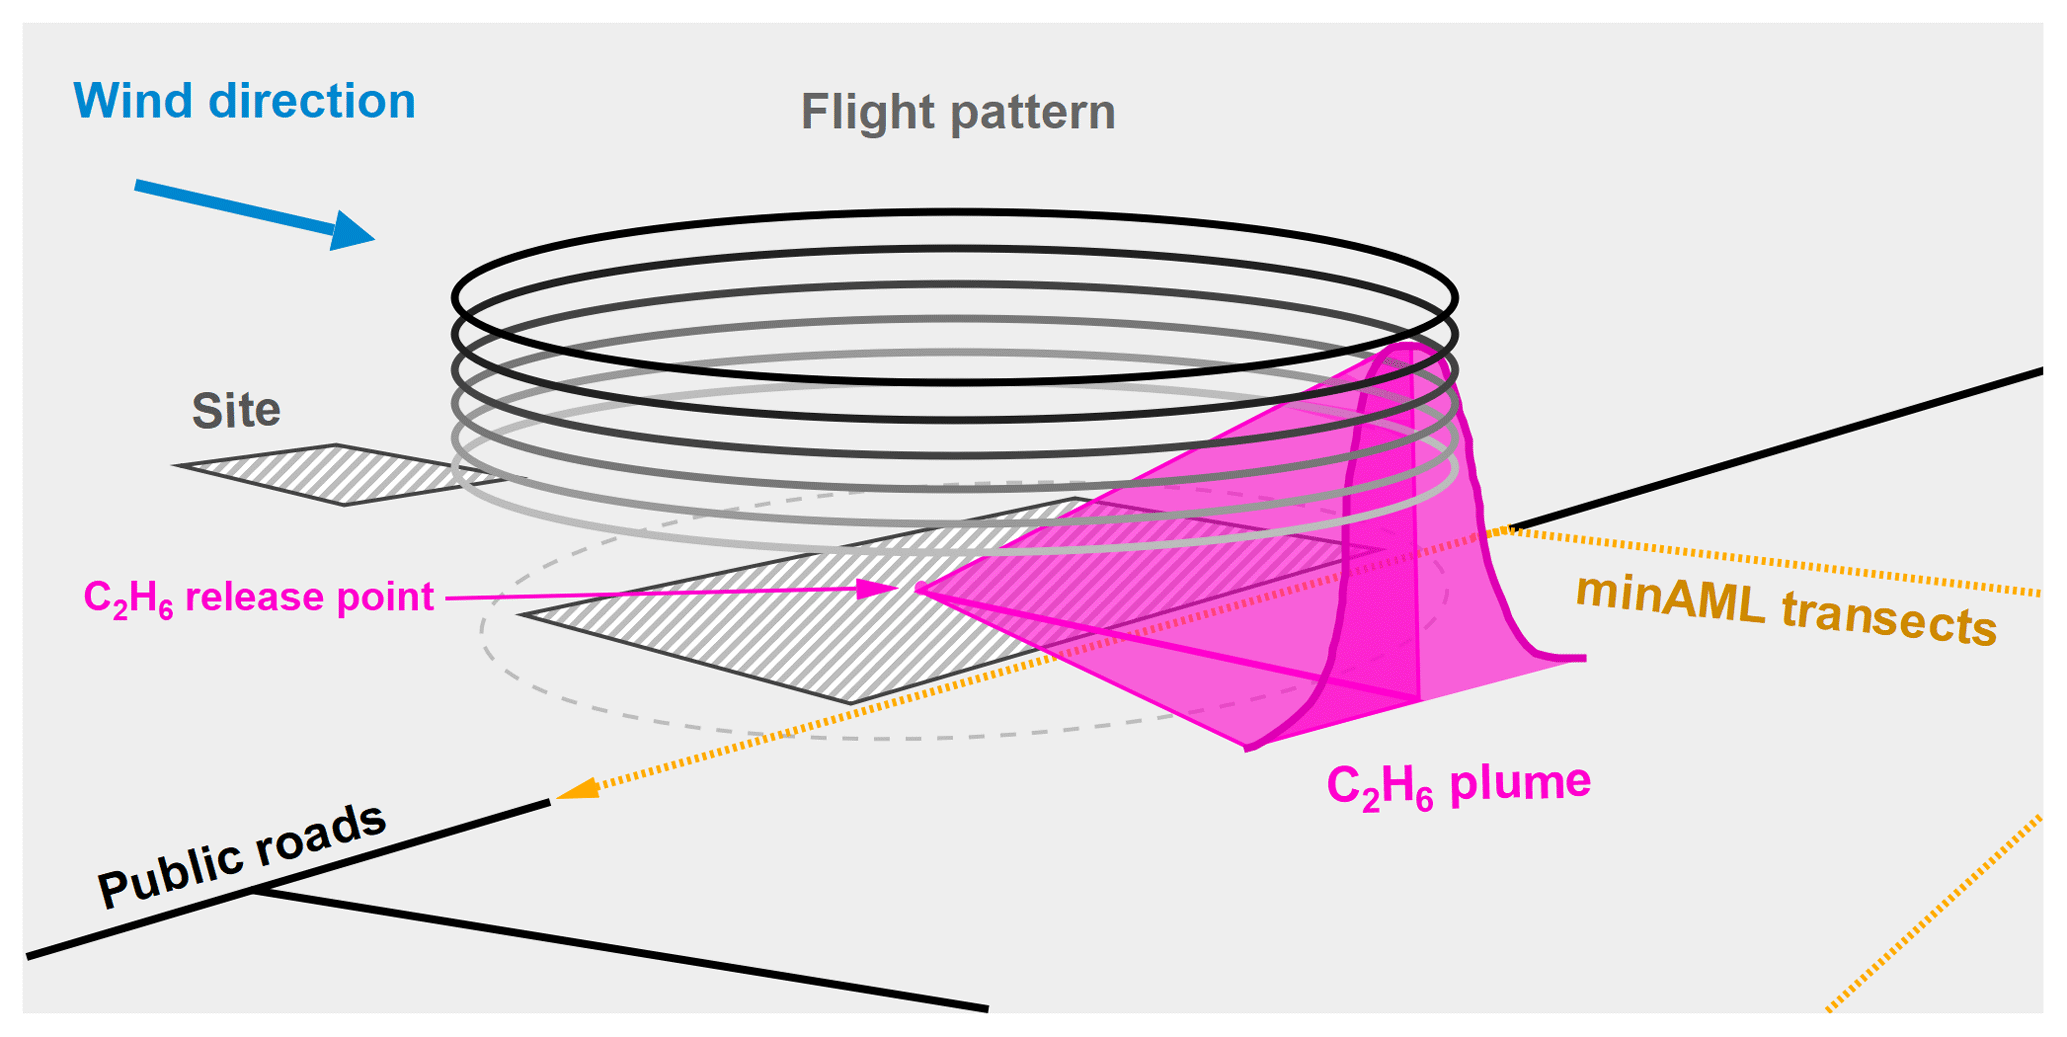
Figure 1Experimental schematic of tracer release (ethane; C2H6) at a dairy farm, as observed by a small aircraft and miniature Aerodyne Mobile Laboratory (minAML). In this ideal scenario, the wind is carrying the plume across the site perpendicular to accessible public roads.
Table 1Overlap between flight times and release of tracer gas (ethane) over the course of the field campaign.

∗ Release on 25 June but no flights.
Ethane was selected over other gases due to the lack of potential interference with nearby sources and its long atmospheric lifetime. At one of the two sites, C2H6 from a small well pad (∼2.5 km from closest point of the farm) could be observed on the ground at close distances. This interference was characterized and eliminated using its measured C2H6:CH4 ratio (Yacovitch et al., 2014) in combination with wind direction and farm layout.
2.3 Data quality assurance
Analysis of tracer flux data involves comparing slopes or areas of enhancements between tracer gas and site CH4 emissions. Linear regression of the time-aligned CH4 and C2H6 results in a molar enhancement ratio (CH4:C2H6). The molar enhancement ratio, scaled by the amount of tracer gas released, determines a CH4 emission rate for the specific plume encounter. Area analysis compares integrated plumes of CH4 and C2H6, particularly necessary during close transects when plumes do not temporally or spatially co-align. Both analysis methods were performed on this dataset and are discussed in further detail in Sect. 3.2. Due to the speed of the aircraft (typically ∼65 m s−1), observations of plume emissions were brief. On average, identified plumes lasted 12 s (8 s for Dairy 1; 15 s for Dairy 2), not including a significant amount of time collected before and after enhancements to ensure accuracy of baseline calculations during analysis.
Prior to analysis, all data had appropriate calibration factors applied, correcting minor deviations in flow rate by mass flow controllers and instrument performance for specific species. Instrument calibrations occurred in the field at several times during this campaign using mixed-gas standards diluted with ultra-zero air. Distance between tracer release locations and aircraft position was determined using basic trigonometry. Uncertainties for emission rate estimates are determined as 95 % confidence intervals.
Plumes observed by the aircraft were included in the analysis after meeting certain criteria. Requirements included tracer gas flowing on-site for more than 10 min prior to observation, correlated plumes of CH4 and C2H6 based on high coefficient of determination from a least-squares fit (R2>0.5), and positive enhancements above baseline for CH4 and C2H6. After meeting these standards, each plume was viewed and additional conditions were manually considered: wind direction and speed (as recorded on the aircraft and on-site), duration of the enhancement, validity of the linear regression fits, quality of calculated baseline for integration purposes, location of the aircraft relative to the sources, and correlation between CH4 and other species (CO2, CO, C2H6) indicating interferences or source allocation.
3.1 Flight conditions by site
While flying transects around each site, plumes of CH4 and C2H6 were observed as frequently as once per minute. Short-lived enhancements ranged hundreds of ppb for CH4 (typically ∼200–300 ppb) and sub-ppb for C2H6 (typically ∼0.5–1.5 ppb). Figure 2 depicts an example plume event during a transect at Dairy 1 with correlated enhancements of CH4 and C2H6 observed as the aircraft passed to the SW of the site. At each dairy farm, the plane gradually flew a sequence of stacked circles around the facility with an average radius of ∼900 m depending on the ratio of the strength of the horizontal wind to the surface heating (Conley et al., 2017.) At Dairy 1, flights went as low as 79 m above ground level (a.g.l.), while achieving a maximum altitude of 1244 m a.g.l. Flyovers at Dairy 2 went even lower, with minima between 33 and 56 m a.g.l., and consistently reached heights of ∼550 m a.g.l. Flying at low altitudes improved the signal-to-noise ratio for C2H6, helping to partially compensate for the relatively low release rates. Wind direction varied at Dairy 1 between the morning (NW) and afternoon (SW), with speeds building in strength throughout the day (∼3–4.5 m s−1) as is common in the Central Valley due to the diurnal thermal forcing of the vast mountain-valley circulation (Zhong et al., 2004). Dairy 2, situated farther into the San Joaquin Valley, experienced consistent NNW winds that were sampled on days with a slightly greater average speed (∼6 m s−1).
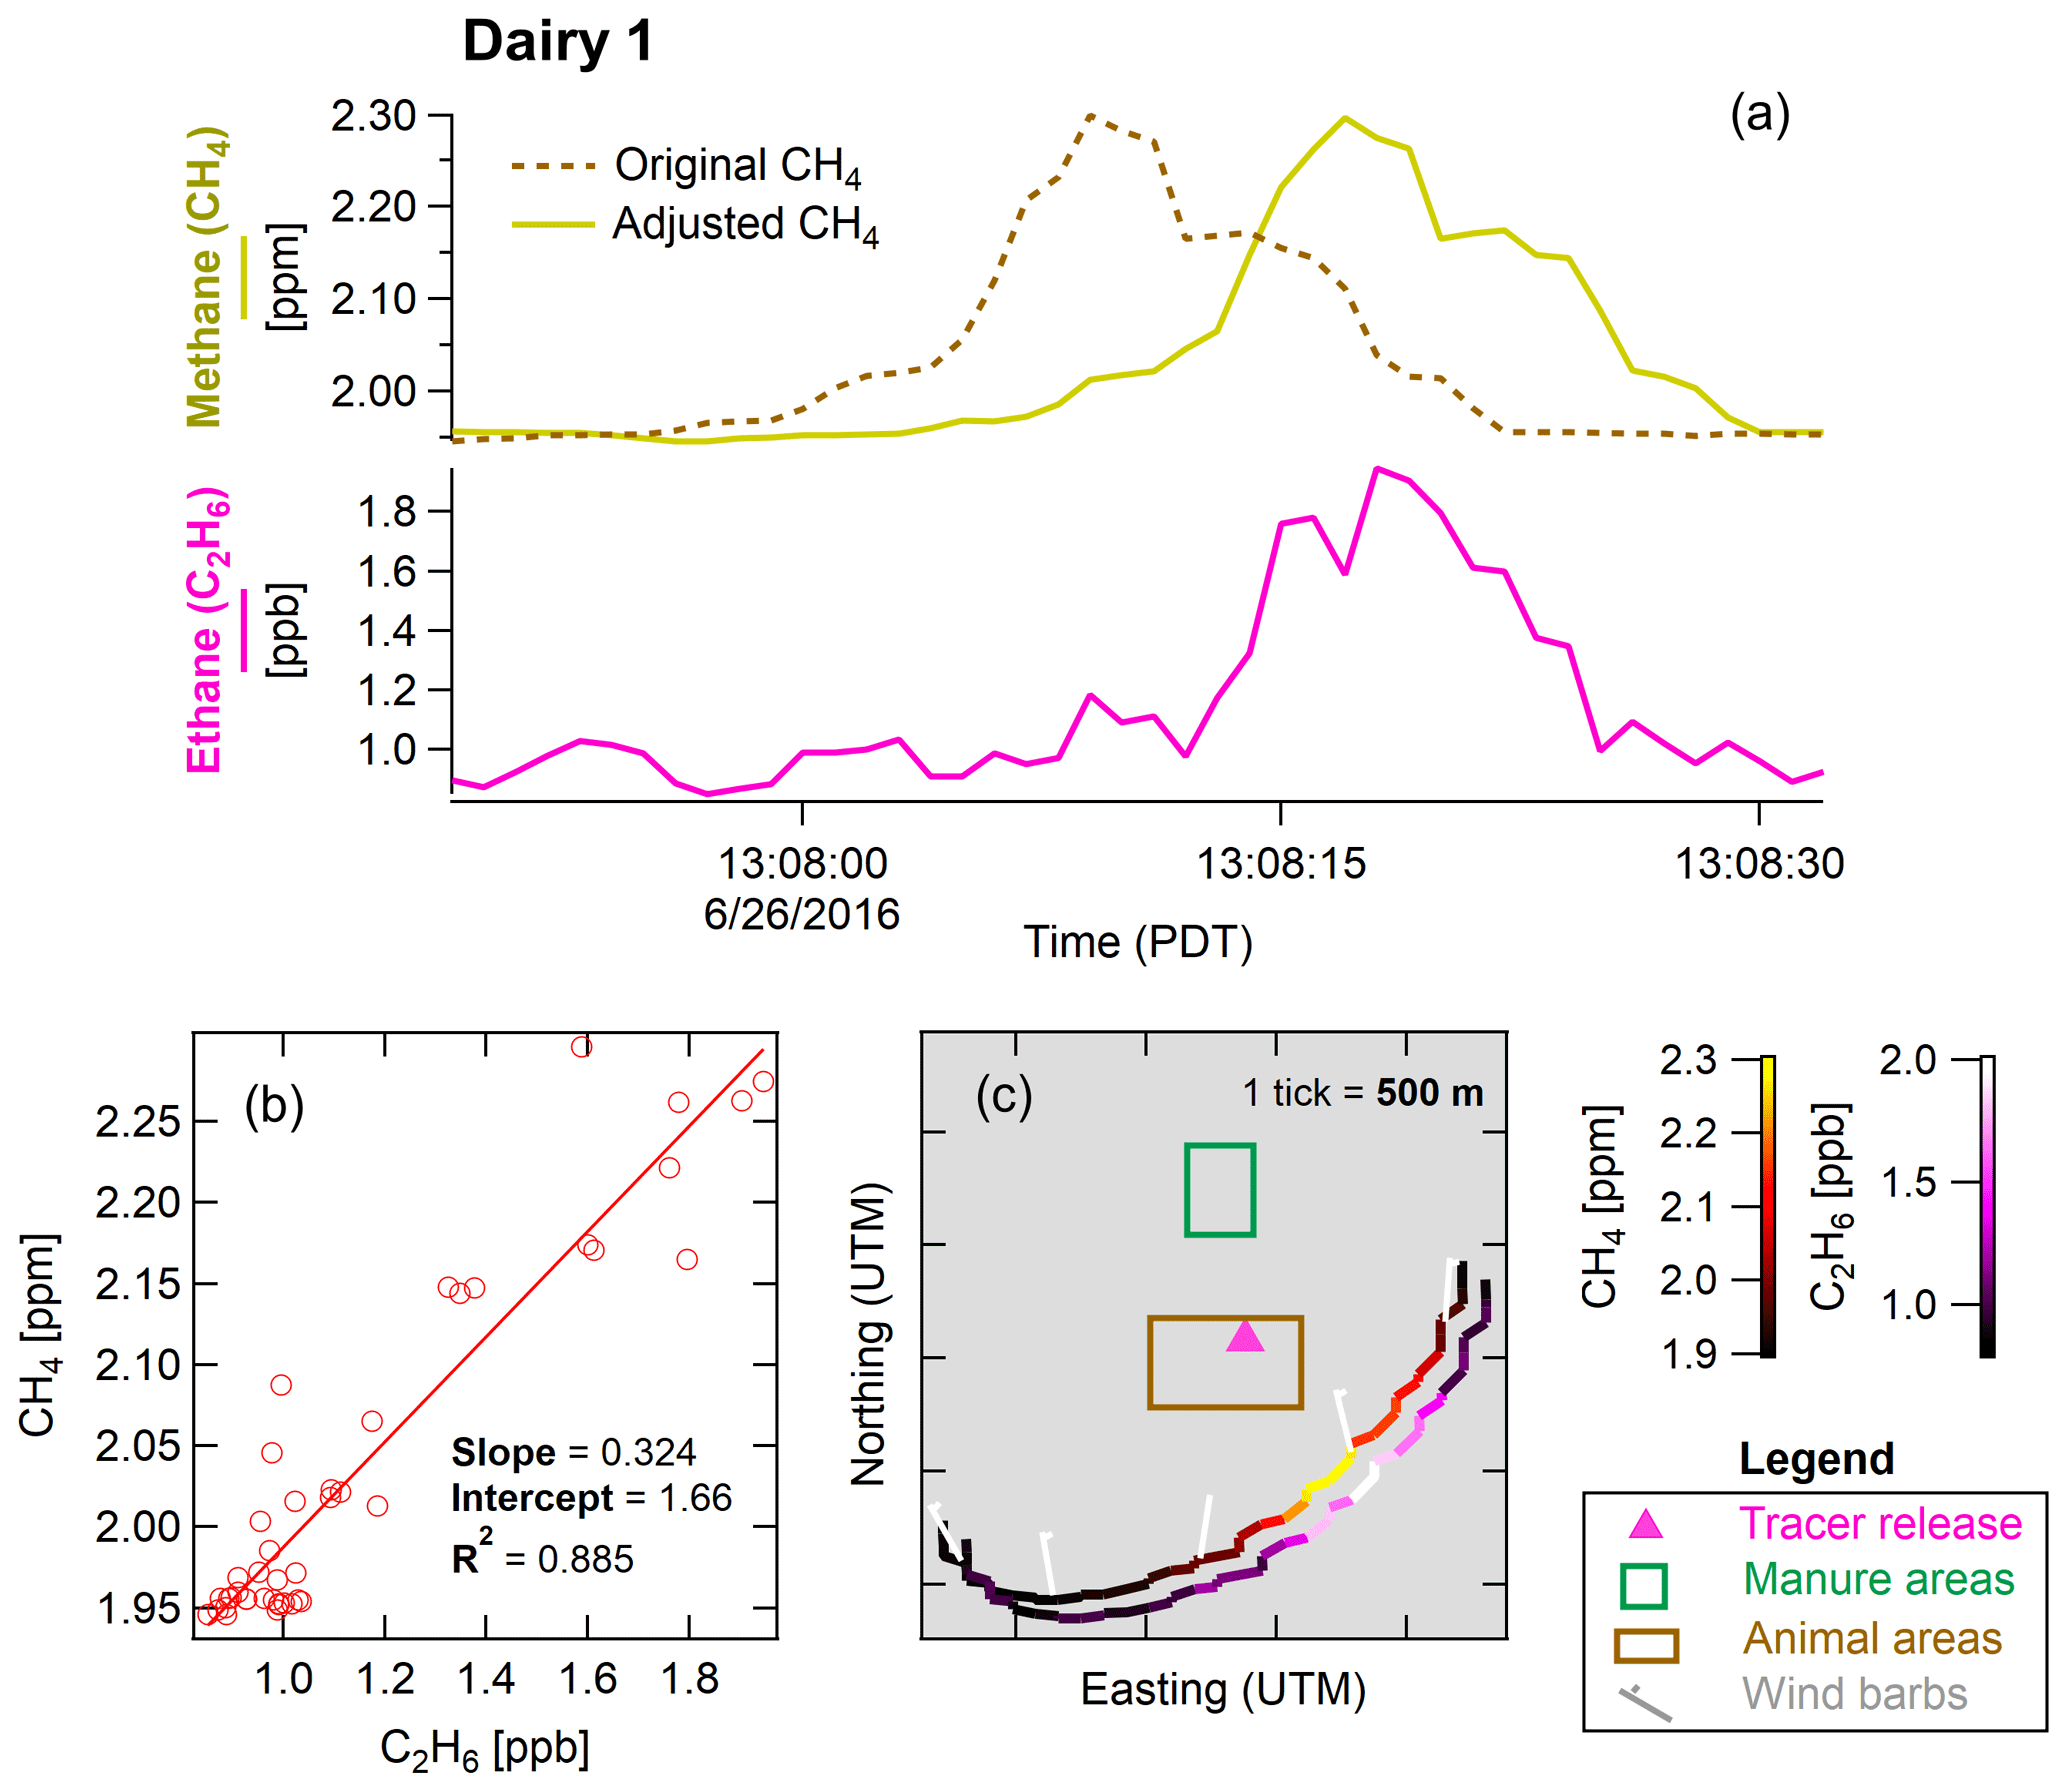
Figure 2Time traces of methane (CH4) and ethane (C2H6) during a flight around Dairy 1 (a). A correlation plot with a best-fit line (b) compares enhancements above baseline of CH4 and C2H6 after accounting for differences in instrument response times and tracer position relative to site emissions. See text for discussion of alternate analysis by area ratios. A map of Dairy 1 overlaid with the flight path is colored by CH4 concentration (c). An identical transect colored by C2H6 is offset slightly for clarity. Wind barbs depict the wind velocity (averaging 2.4 m s−1 from NNW) at several points during the transect.
Dairy 2 consisted of a long rectangular area of animal housing, made up of large free stall barns and open lots. In the northeast of the farm, an open-air manure lagoon was set just north of two long settling cells. Larger than Dairy 2, Dairy 1 had more free stall barns and open lots. Separated from the animal housing, a large lagoon and settling cell extend side by side to the north of the barns. Detailed descriptions of meteorological conditions and depictions of each farm layout can be found in Arndt et al. (2018).
3.2 Tracer flux emission estimates via aircraft
Some plumes represent the entire site and all of its sources (“whole site”). Other plumes can represent an individual source (e.g., animal housing), when observed during a transect from a certain position at a particular wind direction. For close and fast transects, it can be difficult to have the tracer in a position that represents the site or an individual source. Designating each observed plume to a source considers many factors but is ultimately up to the discretion of the analyst. Efforts to understand this interpretive bias are described in the Supplement and use two validation methods, one analyst-driven and one automated.
Plumes from each site were analyzed using two different methods: linear regression and integration (Roscioli et al., 2015). Each method brings benefits and challenges. In the linear regression approach, outliers can deflect a slope off-trend for otherwise consistent data. Highly correlated relationships can be misleading, if not inspected closely. When applying the peak integration, subtle differences when drawing a baseline can have a significant effect on emission rates. Isolating enhancements by area during times of low signal to noise can be challenging. Automatically determined baselines were manually readjusted when necessary, requiring consistency and attention to detail. Both methods delivered similar emission rates for each designated source within measurement uncertainties. Emission rates determined by integration analysis were 6108±821 kg d−1 for the whole site and 2188±391 kg d−1 for animal housing at Dairy 1 and 4018±456 kg d−1 for whole site and 1675±747 kg d−1 for animal housing at Dairy 2. Using correlation analysis, emission rates were 5854±841 kg d−1 for the whole site and 1867±299 kg d−1 for animal housing at Dairy 1 and 3699±685 kg d−1 for the whole site and 1283±536 kg d−1 for animal housing at Dairy 2. Given the favorable comparison between methods, we present area analysis only in Table 2. These results indicate that the selected plumes were adequately co-dispersed with the tracer gas, as both analysis methods compare within uncertainty. Differences in emission rates by method would imply that the observed CH4 and C2H6 plumes were spatially disparate air masses. Whole-site emission estimates averaged for each farm agree with the quantification results using other methods (Arndt et al., 2018) (Table 2) and fall within the stated uncertainties. Emissions associated with animal housing (based on tracer proximity and wind direction) resemble mobile laboratory findings. Animal housing emission rates cannot be directly compared to the results of the mass balance technique from the original study as there was no apportionment by source (only whole-site estimates). Measurements of manure emissions were not compared with established techniques due to uncertainty in representation of the source by the tracer gas.
3.3 Overlapping measurements between platforms
Occasionally, the aircraft flew over the mobile lab while both vehicles were sampling the same plume. One example of this coincidence can be seen in Fig. 3, providing a direct comparison between these two methods. Around midday of 22 June 2016, the aircraft (11:41:25–11:41:50 PDT) and the minAML (11:40:45–11:42:00 PDT) encountered the tracer gas and site emission plumes for 25 and 75 s respectively. For this section of flight, the aircraft flew at around 74 m s−1 (165 mph), covering 1.3 km (0.8 mi) at an average altitude of 428 m. Meanwhile, the minAML drove on a paved road at about 16 m s−1 (35 mph) over 0.8 km (0.5 mi). Both transects occurred in the same direction, from east to west on the southern side of the site. During the overlapping transects, each platform saw a sharp increase in CH4 concentration followed by a broad enhancement at lower concentrations while a similarly rapid rise in C2H6 concentration was followed by a steady decrease. Differences in baseline values of CH4 and C2H6 are attributed to different schedules of acquiring backgrounds (inlet overblown with zero air more frequently on the minAML). Given the similar spatial characteristics of these plumes, it seems likely both platforms were observing the same air mass. As expected, the aircraft-based observations show a lower temporal resolution versus the mobile lab due to speed differences. While these plumes would not be used for emission estimations based on tracer ratio due to poor tracer representation, they show how the same air mass appears when sampled on the ground and in the air.
Table 2Comparison of methane emission estimates (kg d−1 ± 95 % C.I.) for two dairy farms between this paper (“tracer plane”) and established tracer release (“ARI”) and mass balance (“SA”) methods.

a Arndt et al. (2018). b Settling basin value only, from Arndt et al. (2018).
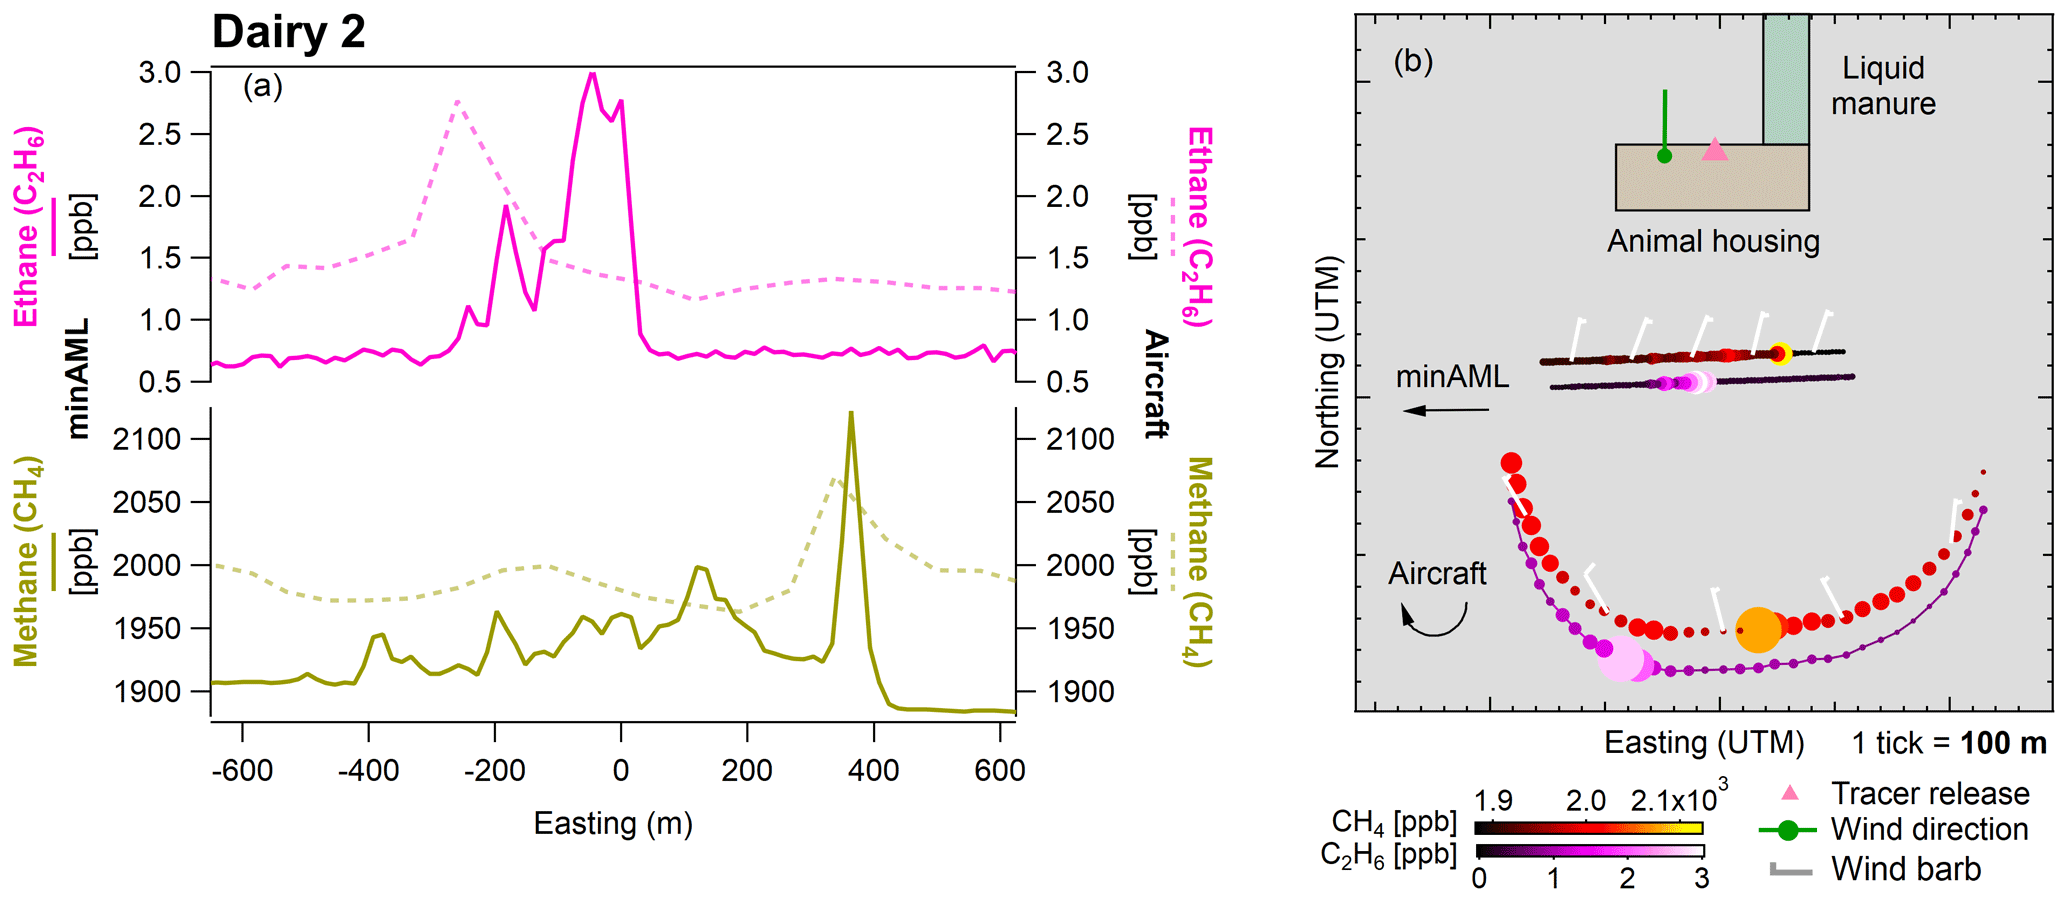
Figure 3Plumes observed by the miniature Aerodyne Mobile Laboratory (minAML) and aircraft. Plots of methane (CH4) and ethane (C2H6) are overlaid for each platform (a). Observations occurred during transects by each vehicle to the south of Dairy 2, during a release of C2H6 into a southerly wind (b). Potential emission sources on the farm have been identified as colored sections, though not as an exact scaled representation.
4.1 On-site sampling by aircraft
During each flight, identifiable plumes of CH4 were observed regularly, approximately every 1–2 min. Figure 4 depicts repeated measurements of CH4 emissions representative of the whole farm, revealing characteristics about emission sources at each site. Viewed from the south, manure and animal housing areas at Dairy 1 line up together, whereas at Dairy 2 the anaerobic lagoon and settling cells are offset from the housing areas. While these observations largely depend on wind direction and distance from the source, some features gave insight into where emissions came from on-site. Broad emissions can be readily attributed to the large collection of point source emitters milling around barns and open lots (cows of various ages). Sharp peaks and broad plateaus indicate an encounter with outgassing by a large area source (liquid manure ponds). Gaussian shapes appear to be an amalgamation of both major sources mixed downwind.
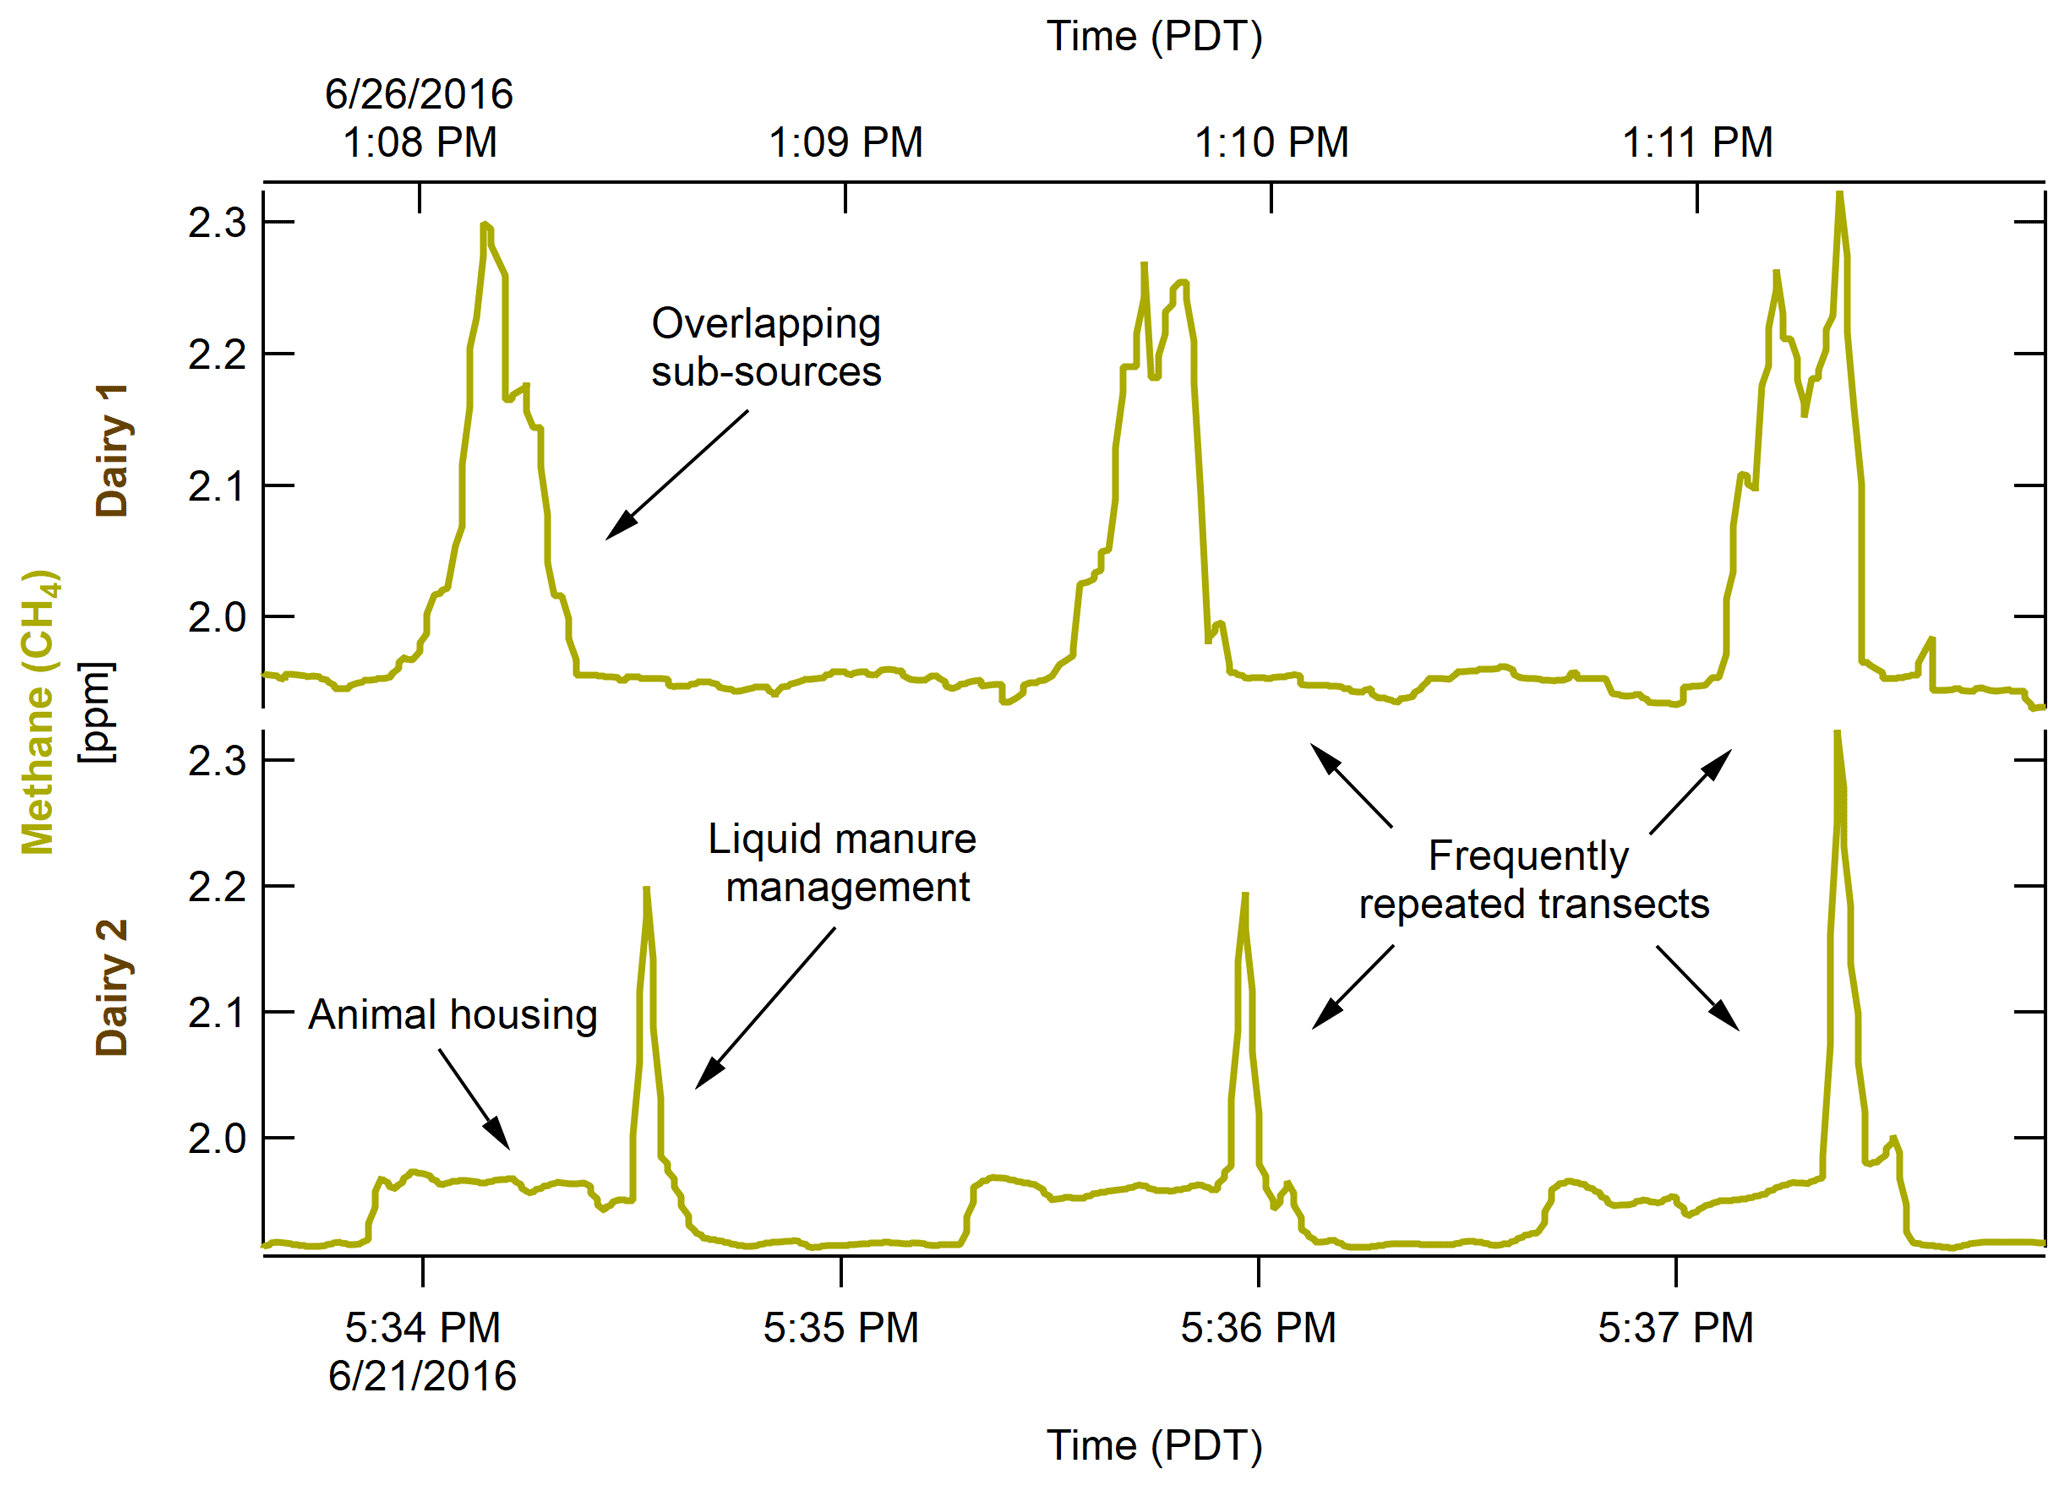
Figure 4Selected sampling periods (approximately 5 min) at each dairy farm showing characteristics of emitted methane plumes as observed by the aircraft downwind to the south. Each time trace depicts the high rate of repetition in the flown transects around each site.
Temporal and spatial differences exist between the aircraft measurements used in this dataset and the ground-based measurements collected as part of the initial study (Arndt et al., 2018). Measurements by the minAML occurred during the day and night at a variety of distances from each site (up to 6 km). The aircraft had good coverage during the middle of the day, with flights in the late morning and early afternoon performing frequently repeated transects around each site (∼1 km radius). The ground-based tracer release experiment observed very low plume enhancements in the hot midday conditions due to low winds and strong vertical mixing while the aircraft saw good signal, but it had no issue collecting nighttime measurements when the aircraft did not operate.
Tracer flux ratio methodology thrives with strong winds and downwind road access perpendicular to the dominant wind direction. Close placement of tracer gas to a point source and distant measurements by the mobile lab allow time and space for the tracer to co-disperse with emission gas and merge together in the measured plume. During this field campaign, the aircraft flew close to the site measuring emissions in a calm wind and saw an abundance of signal due to strong surface heating. These conditions proved favorable for the aircraft and mass balance calculations but stretch the possible application of the tracer release method. Even so, the attempt to perform a tracer release experiment observed from an aircraft proved largely successful and provided direct insight as to how these measurements relate to the ground-based observations.
Due to the sensitivity of the C2H6 instrument on the aircraft, it was readily apparent when the tracer gas was present and intermingling with the farm emissions. Figure 5 visualizes the initiation of tracer release at Dairy 2 and the time it takes for tracer gas to disperse on-site. Prior to releasing any tracer gas, the concentration of C2H6 shows a relatively steady baseline. After initiating the release of tracer gas at 20 slpm, it took approximately 20 min before the aircraft begins to detect it initially and another 15 min before the plume characteristics were stabilized. We suspect this was due to the prevailing conditions of weak horizontal winds and strong but varying vertical mixing at the site. The aircraft ascended above the emission plume for 10–20 min after the release began, taking it out of plume detection range, which may have lengthened the time it took to first detect tracer gas. Based on the average wind direction (from the NW) and horizontal speed (4.2 m s−1) from 10:39 PDT (start of tracer release) to 11:00 PDT (first spike of C2H6), we could expect to begin seeing tracer gas after ∼6 min at a distance of 1.6 km (from release point to the intersection between the circular transect and wind direction). Instead, we saw the first spike around 11 min after beginning release.

Figure 5Comparison of flight sampling periods prior to and during release of tracer gas (ethane, C2H6), showing enhancements of methane above Dairy 2 with and without corresponding peaks of C2H6 depending on release rate, altitude (a.g.l.), and dispersion.
For the plumes reported in this dataset, there is no observed dependence of emission rate with sampling altitude. In Fig. 6, CH4 emissions are plotted versus aircraft altitude. Emissions between 0 and 6500 kg d−1 appear to be randomly distributed between 100 and 600 m at each site (Fig. 5). Two outliers show higher emission rates at low altitudes, unmatched at higher altitudes. Above 650 m are three other points scattered across a wide range of emissions (2000–6500 kg). These outliers occurred when the aircraft flew close to the site at an angle that put the lagoon between the aircraft and the tracer release point. The impact of measuring a source closer than the tracer is a potential overestimation of the emission due to differences in dispersion (Goetz et al., 2015). Increasing emissions with decreasing height, in some cases, could be attributed to the influence of a strongly lofted lagoon signal at a site. Lower flights could then cause the aircraft to encounter a larger proportion of the manure-related emissions instead of the ideal case: a well-mixed plume representative of the entire site.
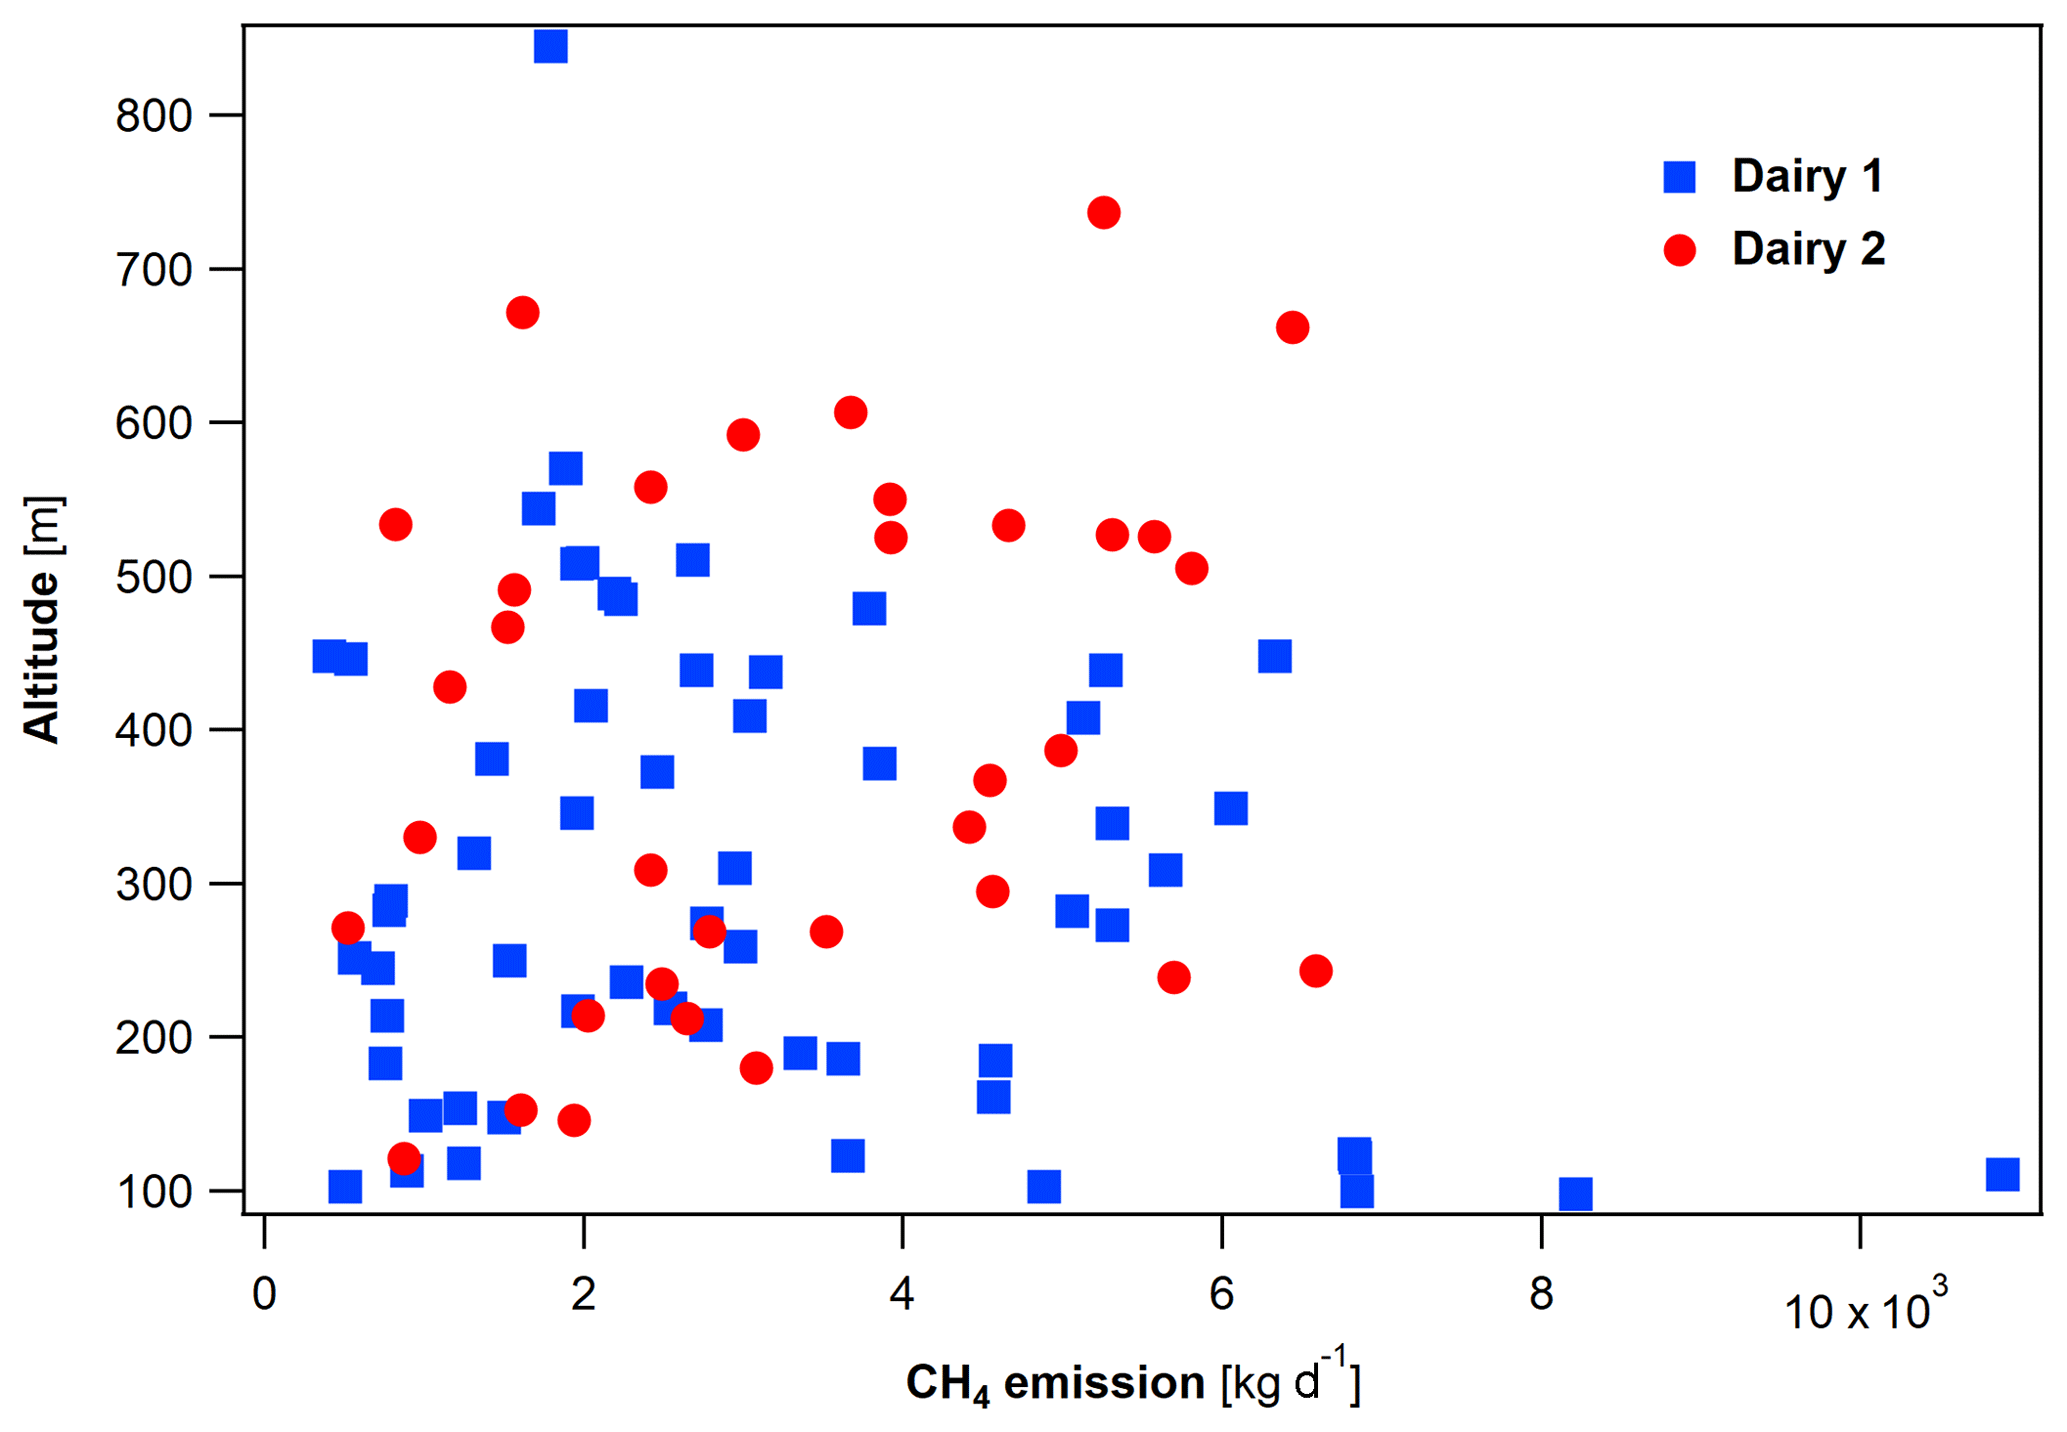
Figure 6Observed methane emissions (CH4; kg d−1) plotted by aircraft altitude at both dairy farms (Dairy 1 and Dairy 2). Emission rates are distributed randomly across hundreds of meters in altitude with a handful of outliers at lower and higher altitudes.
4.2 Experimental challenges
Swirling and calm winds shifted emissions around each site at various times over multiple days. When selecting valid plumes, proximity of the aircraft during an enhancement to a single source introduces a dilemma. Varying distances between the tracer gas release point and presumed source could affect the determined emission rate, due to imperfect co-dispersion. For example, using a tracer plume located 500 m away to represent a source 300 m away would be problematic. When measuring at greater distances with better resolution (due to sampling in a slower vehicle), it is often trivial to identify when the tracer inadequately represents the emission. Flying several times faster than the driven transect provided notable repeatability but made spatial understanding of the site difficult with respect to emission sources.
Direct estimates of liquid manure emissions proved unrealistic at both dairies due to sparse number of CH4 plumes with sufficient tracer representation, despite favorable wind direction and aircraft position. A few plumes of acceptable data quality were identified as being related to liquid manure emissions at Dairy 2 (n=4), but estimates were significantly higher than reported in Arndt et al. (2018) at 4893±1331 kg CH4 d−1 (area analysis). Due to concerns that the tracer release location was not close enough to the liquid manure source to be representative, especially due to nonideal transect geometry and limited horizontal wind, these data are not reported in Table 2. Relative apportionment of CH4 between sources (using only whole-site and animal housing values) showed manure-associated plumes leading the fractional contribution at Dairy 1 (73:27) and Dairy 2 (71:29). This was an expected finding based on US EPA methodology estimates (Arndt et al., 2018) for this month at Dairy 2 (73:27). Given the temporal nature of manure emissions, as reported by Leytem et al. (2017), it should be reinforced that these results only represent a short period of time (6 measurement days) in a single season. Despite the difficulty of collecting or identifying many distinct manure-associated plumes via measurements taken from this aircraft, the general apportionment of source emissions appears to remain evident.
Clear hot measurement days could have stimulated anaerobic activity in manure lagoons and caused greater release of gases (Safley and Westerman, 1988), while strong thermal convection lofted concentrated and unmixed plumes. Aside from refinements to the method (e.g., moving the tracer gas closer to the source), performing this technique in different seasons, meteorological conditions, and during mixing events (e.g., flushing) would enhance our understanding of the variability in emissions from liquid manure management on dairy farms.
For the mobile laboratory, road access was a challenge at times. Large plots of surrounding cropland typically had a limited number of roads crossing through them, with those available often being private or undeveloped. In order to collect plumes adequately downwind of each site on accessible public roads, the ground-based ARI team required winds to come from certain directions. Being able to fly above the site eliminates these challenges. However, the aircraft flew a set pattern at each site, circling at a particular radius to optimize the established mass balance method, and did not explore downwind like the vehicle. As seen in Fig. 7, plumes used for determining emission rates were clustered in areas above each site that typically agreed with the dominant wind directions along the looping flight path. Wind rose plots for each site represent the wind conditions observed by the aircraft during the midpoint of each plume event (Fig. 7c and d). On-site wind measurements during these events provided additional insight as to how the wind evolved between the site and aircraft. Other plume events sometimes occurred inside of the dominant downwind fetch, especially during calm wind conditions, but lacked the prerequisites to be included in emission estimations.
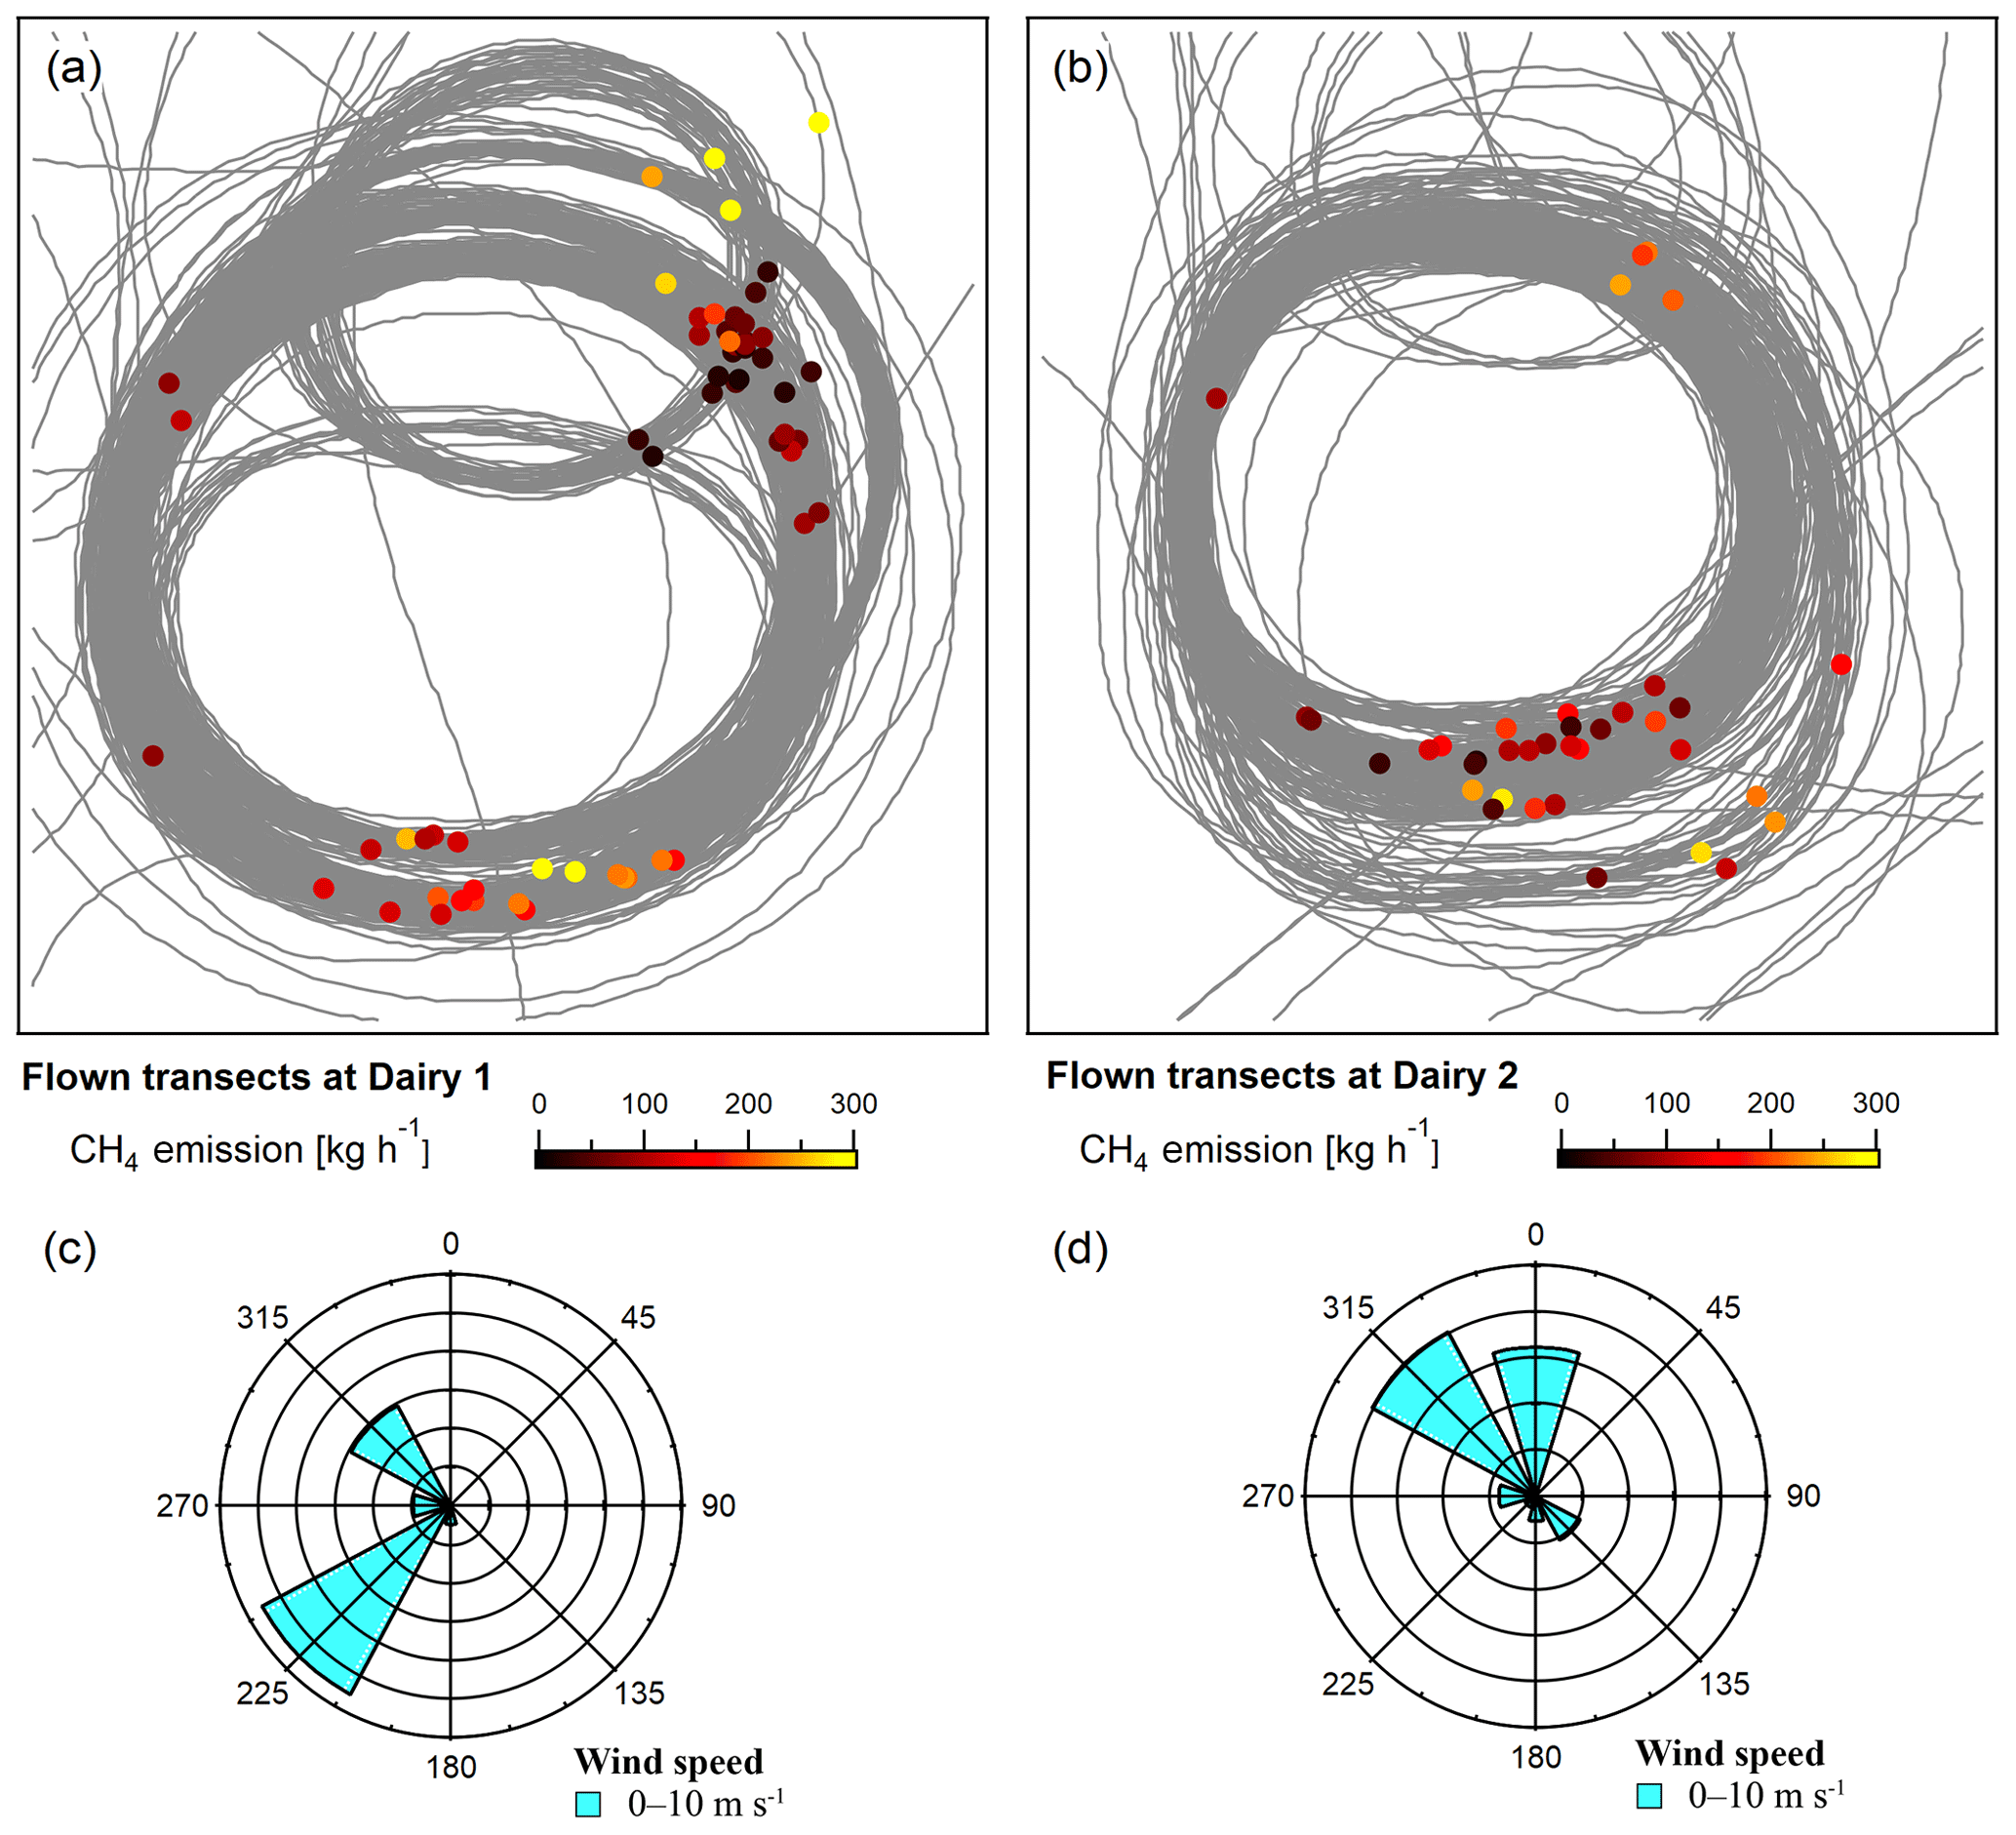
Figure 7Methane (CH4) emission rates displayed on every flight track as dots, positioned at the midpoint of each enhancement event (a and b). Corresponding wind roses average the originating direction and magnitude of the wind from the midpoint of each plume event (c and d).
4.3 Future work
Future work towards refining the tracer release method with an aircraft will require several improvements to the current experimental design. Instead of flying around the perimeter of a dairy farm or other emission source in a circle as part of an established mass balance approach (Conley et al., 2017), the aircraft could mimic the driven transects of the mobile lab via long horizontal transects at varying distances perpendicular to the dominant wind direction (Hacker et al., 2016). Conducting downwind transects at greater distances (e.g., 500 m to 5 km) would allow for better comparisons between platforms but may not be feasible in conditions similar to those experienced in this study (strong surface heating combined with calm horizontal winds), as it could be difficult to encounter the plume.
Rather than relying on only a couple point source releases, tracer gas could be released as a line or grid source along the border of liquid manure management areas or animal housing fence lines (Lamb et al., 1995; McGinn et al., 2006). Increasing the flow rate of tracer gas from 15 slpm by several factors would improve signal-to-noise ratios of tracer enhancements. Furthermore, an aircraft carrying a second instrument on board that quickly (1 Hz) and precisely (ppt sensitivity) monitors a second tracer gas (e.g., C2H2) would provide a check on the observed tracer concentrations or could aid source identification. With two tracer gases, the initial ratio of release rates ought to persist throughout the migration of the plumes and be reflected in the ratio of downwind enhancements (“dual tracer ratio”; Roscioli et al., 2015). Deviations from the expected value indicate loss of tracer gas and inadequate representation of a source. It should be noted that the two tracers used in this original study were employed as independent tracers for better coverage over large multisource areas, while the scenario described above applies to overlapping use of tracer gases (two tracers for a single source). Benefits of adding a second tracer (dual-tracer flux ratio methodology) are described further in Roscioli et al. (2015).
Overall, combining these measurement techniques through aircraft-observed tracer release promotes positive aspects of each method. Low-flying aircraft measurements occur rapidly on a versatile platform with no road access restrictions. Tracer gases can indicate sources, identify interferences, and enable quantification without relying on modeling or highly accurate wind measurements. Using this method, an aircraft can have greater confidence identifying sources and can confirm ground-based observations.
By quantifying CH4 emissions to within the uncertainties of independent ground-based tracer and aircraft mass balance measurements, this study demonstrates the viability of performing a tracer release experiment from the ground observed by an aircraft flying overhead. Other than intentionally overlapping measurement times, we were able to demonstrate a third method of monitoring dairy emissions using data collected for previously established techniques, without prior coordination or making any procedural changes in the field. In this case, an aircraft flying transects prioritized for a mass balance methodology successfully collected data viable for single-tracer flux ratio analysis. Simultaneous observations by the aircraft and mobile laboratory on a similar spatial scale provide a brief look into how each technique experiences single-tracer flux ratio methodology. Considering the success in applying this method, a refined approach could greatly improve and further demonstrate the feasibility of this technique.
A table containing Site IDs, source designations, measurement durations, CH4 emission rates, plane altitude, measurement distance from the point of tracer release, wind direction and speed, and coefficients of determination for CH4/C2H6 can be found in Supplementary Materials (SM Dataset).
The supplement related to this article is available online at: https://doi.org/10.5194/amt-12-2085-2019-supplement.
CA coordinated the field campaign. SC and ICF collected the aircraft data. CD, TIY, and JRR participated in the mobile laboratory measurements. CD, TIY, JRR, SC, ICF, and SCH performed data interpretation and analysis. CD prepared the manuscript with contributions from ICF. All authors critically reviewed the manuscript. All authors approved the submitted version for publication.
The authors declare that they have no conflict of interest.
Claudia Arndt's postdoctoral fellowship at the Environmental Defense Fund was funded by a gift from Sue and Steve Mandel and the Kravis Scientific Research Fund (New York, NY). The measurements were funded by a gift from Sue and Steve Mandel and the Robertson Foundation (New York, NY). Ian C. Faloona's effort was supported by the USDA National Institute of Food and Agriculture (Hatch project CA-D-LAW-2229-H, “Improving Our Understanding of California's Background Air Quality and Near-Surface Meteorology”).
This paper was edited by Huilin Chen and reviewed by two anonymous referees.
Arndt, C., Leytem, A. B., Hristov, A., Zavala-Araiza, D., Cativiela, J. P., Conley, S., Daube, C., Faloona, I., and Herndon, S. C.: Case Study: Short-Term Methane Emissions from Two Dairy Farms in California Estimated by Different Measurement Techniques and USEPA Inventory Methodology, J. Dairy Sci., 101, 11461–11479, https://doi.org/10.3168/jds.2017-13881, 2018.
Brandt, A. R., Heath, G. A., Kort, E. A., O'Sullivan, F., Pétron, G., Jordaan, S. M., Tans, P., Wilcox, J., Gopstein, A. M., Arent, D., Wofsy, S., Brown, N. J., Bradley, R., Stucky, G. D., Eardley, D., and Harriss, R.: Methane Leaks from North American Natural Gas Systems, Science, 343, 733–735, https://doi.org/10.1126/science.1247045, 2014.
CARB (California Air Resources Board): Short-Lived Climate Pollutant Reduction Strategy, March, California Air Resource Board, Sacramento, CA, available at: https://www.arb.ca.gov/cc/shortlived/meetings/03142017/final_slcp_report.pdf (last access: 1 October 2018), 2017.
Conley, S. A., Faloona, I. C., Lenschow, D. H., Karion, A., and Sweeney, C.: A Low-Cost System for Measuring Horizontal Winds from Single-Engine Aircraft, J. Atmos. Ocean. Technol., 31, 1312–1320, https://doi.org/10.1175/JTECH-D-13-00143.1, 2014.
Conley, S., Faloona, I., Mehrotra, S., Suard, M., Lenschow, D. H., Sweeney, C., Herndon, S., Schwietzke, S., Pétron, G., Pifer, J., Kort, E. A., and Schnell, R.: Application of Gauss's theorem to quantify localized surface emissions from airborne measurements of wind and trace gases, Atmos. Meas. Tech., 10, 3345–3358, https://doi.org/10.5194/amt-10-3345-2017, 2017.
Dong, H., Mangino, J., McAllister, T. A., Hatfield, J. L., Johnson, D. E., Lassey, K. R., de Lima, M. A., and Romanovskaya, A., Bartram, D., Gibb, D., Martin Jr., J. H.: Chapter 10: Emissions from livestock and manure management, Intergovernmental Panel on Climate Change, available at: https://www.ipcc-nggip.iges.or.jp/public/2006gl/pdf/4_Volume4/V4_10_Ch10_Livestock.pdf (last access: 1 October 2018), 2006.
Ferber, G. J., Heffter, J. L., Draxler, R. R., Lagomarsino, R. J., Thomas, F. L., Dietz, R. N., and Benkovitz, C. M.: Cross-Appalachian Tracer Experiment (CAPTEX '83) Final Report, Air Resources Laboratory NOAA Tech. Memo. ERL ARL-142, 60 pp., available at: https://www.arl.noaa.gov/documents/reports/arl-142.pdf (last access: 1 October 2018), 1986.
Goetz, J. D., Floerchinger, C., Fortner, E. C., Wormhoudt, J., Massoli, P., Knighton, W. B., Herndon, S. C., Kolb, C. E., Knipping, E., Shaw, S. L., and DeCarlo, P. F.: Atmospheric Emission Characterization of Marcellus Shale Natural Gas Development Sites, Environ. Sci. Technol., 49, 7012–7020, https://doi.org/10.1021/acs.est.5b00452, 2015.
Grainger, C., Clarke, T., McGinn, S. M., Auldist, M. J., Beauchemin, K. A., Hannah, M. C., Waghorn, G. C., Clark, H., and Eckard, R. J.: Methane Emissions from Dairy Cows Measured Using the Sulfur Hexafluoride (SF6) Tracer and Chamber Techniques, J. Dairy Sci., 90, 2755–2766, https://doi.org/10.3168/jds.2006-697, 2007.
Hacker, J. M., Chen, D., Bai, M., Ewenz, C., Junkermann, W., Lieff, W., McManus, B., Neininger, B., Sun, J., Coates, T., Denmead, T., Flesch, T., McGinn, S., and Hill, J.: Using airborne technology to quantify and apportion emissions of CH4 and NH3 from feedlots, Anim. Prod. Sci., 56, 190–203, https://doi.org/10.1071/AN15513, 2016.
Lamb, B. K., McManus, J. B., Shorter, J. H., Kolb, C. E., Mosher, B., Harriss, R. C., Allwine, E., Blaha, D., Howard, T., Guenther, A., Lott, R. A., Siverson, R., Westburg, H., and Zimmerman, P.: Development of Atmospheric Tracer Methods To Measure Methane Emissions from Natural Gas Facilities and Urban Areas, Environ. Sci. Technol., 29, 1468–1479, https://doi.org/10.1021/es00006a007, 1995.
Leytem, A. B., Bjorneberg, D. L., Koehn, A. C., Moraes, L. E., Kebreab, E., and Dungan, R. S.: Methane emissions from dairy lagoons in the western United States, J. Dairy Sci., 100, 6785–6803, https://doi.org/10.3168/jds.2017-12777, 2017.
McGinn, S. M., Flesch, T. K., Harper, L. A., and Beauchemin, K. A.: An approach for measuring methane emissions from whole farms, J. Environ. Qual., 35, 14–20, https://doi.org/10.2134/jeq2005.0250, 2006.
Miller, S. M., Wofsy, S. C., Michalak, A. M., Kort, E. A., Andrews, A. E., Biraud, S. C., Dlugokencky, E. J., Eluszkiewicz, J., Fischer, M. L., Janssens-Maenhout, G., Miller, B. R., Miller, J. B., Montzka, S. A., Nehrkorn, T., and Sweeney, C.: Anthropogenic emissions of methane in the United States, P. Natl. Acad. Sci. USA, 110, 20018–20022, https://doi.org/10.1073/pnas.1314392110, 2013.
Mønster, J. G., Samuelsson, J., Kjeldsen, P., Rella, C. W., and Scheutz, C.: Quantifying methane emission from fugitive sources by combining tracer release and downwind measurements – A sensitivity analysis based on multiple field surveys, Waste Manage., 34, 1416–1428, https://doi.org/10.1016/j.wasman.2014.03.025, 2014.
Peischl, J., Ryerson, T. B., Brioude, J., Aikin, K. C., Andrews, A. E., Atlas, E., Blake, D., Daube, B. C., Gouw, J. A., Dlugokencky, E., Frost, G. J., Gentner, D. R., Gilman, J. B., Goldstein, A. H., Harley, R. A., Holloway, J. S., Kofler, J., Kuster, W. C., Lang, P. M., Novelli, P. C., Santoni, G. W., Trainer, M., Wofsy, S. C., and Parrish, D. D.: Quantifying sources of methane using light alkanes in the Los Angeles basin, California, J. Geophys. Res.-Atmos., 118, 4974–4990, https://doi.org/10.1002/jgrd.50413, 2013.
Record, F. A. and Cramer, H. E.: Preliminary Analysis of Project Prairie Grass Diffusion Measurements, JAPCA J. Air Waste Ma., 8, 240–248, https://doi.org/10.1080/00966665.1958.10467851, 1958.
Roscioli, J. R., Yacovitch, T. I., Floerchinger, C., Mitchell, A. L., Tkacik, D. S., Subramanian, R., Martinez, D. M., Vaughn, T. L., Williams, L., Zimmerle, D., Robinson, A. L., Herndon, S. C., and Marchese, A. J.: Measurements of methane emissions from natural gas gathering facilities and processing plants: measurement methods, Atmos. Meas. Tech., 8, 2017–2035, https://doi.org/10.5194/amt-8-2017-2015, 2015.
Safley, L. M. and Westerman, P. W.: Biogas production from anaerobic lagoons, Biol. Waste, 23, 181–193, https://doi.org/10.1016/0269-7483(88)90033-X, 1988.
Sykes, R. I., Parker, S. F., Henn, D. S., and Lewellen, W. S.: Numerical Simulation of ANATEX Tracer Data Using a Turbulence Closure Model for Long-Range Dispersion, J. Appl. Meterol., 32, 929–947, https://doi.org/10.1175/1520-0450(1993)032<0929:nsoatd>2.0.co;2, 1993.
Trousdell, J. F., Conley, S. A., Post, A., and Faloona, I. C.: Observing entrainment mixing, photochemical ozone production, and regional methane emissions by aircraft using a simple mixed-layer framework, Atmos. Chem. Phys., 16, 15433–15450, https://doi.org/10.5194/acp-16-15433-2016, 2016.
USEPA: United States Environmental Protection Agency: Inventory of U.S. Greenhouse Gas Emissions and Sinks: 1990–2015, U.S. EPA, Washington, D.C., U.S.A, available at: https://www.epa.gov/sites/production/files/2017-02/documents/2017_complete_report.pdf (last access: 1 October 2018), 2017.
Viatte, C., Lauvaux, T., Hedelius, J. K., Parker, H., Chen, J., Jones, T., Franklin, J. E., Deng, A. J., Gaudet, B., Verhulst, K., Duren, R., Wunch, D., Roehl, C., Dubey, M. K., Wofsy, S., and Wennberg, P. O.: Methane emissions from dairies in the Los Angeles Basin, Atmos. Chem. Phys., 17, 7509–7528, https://doi.org/10.5194/acp-17-7509-2017, 2017.
Wang, M., Zhu, T., Zheng, J., Zhang, R. Y., Zhang, S. Q., Xie, X. X., Han, Y. Q., and Li, Y.: Use of a mobile laboratory to evaluate changes in on-road air pollutants during the Beijing 2008 Summer Olympics, Atmos. Chem. Phys., 9, 8247–8263, https://doi.org/10.5194/acp-9-8247-2009, 2009.
Yacovitch, T. I., Herndon, S. C., Roscioli, J. R., Floerchinger, C., McGovern, R. M., Agnese, M., Pétron, G., Kofler, J., Sweeney, C., Karion, A., Conley, S. A., Kort, E. A., Nähle, L., Fischer, M., Hildebrandt, L., Koeth, J., McManus, J. B., Nelson, D. D., Zahniser, M. S., and Kolb, C. E.: Demonstration of an Ethane Spectrometer for Methane Source Identification, Environ. Sci. Technol., 48, 8028–8034, https://doi.org/10.1021/es501475q, 2014.
Yacovitch, T. I., Herndon, S. C., Pétron, G., Kofler, J., Lyon, D., Zahniser, M. S., and Kolb, C. E.: Mobile Laboratory Observations of Methane Emissions in the Barnett Shale Region, Environ. Sci. Technol., 49, 7889–7895, https://doi.org/10.1021/es506352j, 2015.
Zhong, S., Whiteman, C. D., and Bian, X.: Diurnal Evolution of Three-Dimensional Wind and Temperature Structure in California's Central Valley, J. Appl. Meterol., 43, 1679–1699, https://doi.org/10.1175/jam2154.1, 2004.