the Creative Commons Attribution 4.0 License.
the Creative Commons Attribution 4.0 License.
 | 17 Jan 2019
HOx and NOx production in oxidation flow reactors via photolysis of isopropyl nitrite, isopropyl nitrite-d7, and 1,3-propyl dinitrite at λ = 254, 350, and 369 nm
Jordan E. Krechmer
Jason R. Casar
Anthony J. Carrasquillo
Jonathan D. Raff
Jose L. Jimenez
Douglas R. Worsnop
Oxidation flow reactors (OFRs) are an emerging technique for studying the formation and oxidative aging of organic aerosols and other applications. In these flow reactors, hydroxyl radicals (OH), hydroperoxyl radicals (HO2), and nitric oxide (NO) are typically produced in the following ways: photolysis of ozone (O3) at λ=254 nm, photolysis of H2O at λ=185 nm, and via reactions of O(1D) with H2O and nitrous oxide (N2O); O(1D) is formed via photolysis of O3 at λ=254 nm and/or N2O at λ=185 nm. Here, we adapt a complementary method that uses alkyl nitrite photolysis as a source of OH via its production of HO2 and NO followed by the reaction NO + HO2 → NO2 + OH. We present experimental and model characterization of the OH exposure and NOx levels generated via photolysis of C3 alkyl nitrites (isopropyl nitrite, perdeuterated isopropyl nitrite, 1,3-propyl dinitrite) in the Potential Aerosol Mass (PAM) OFR as a function of photolysis wavelength (λ=254 to 369 nm) and organic nitrite concentration (0.5 to 20 ppm). We also apply this technique in conjunction with chemical ionization mass spectrometer measurements of multifunctional oxidation products generated following the exposure of α-Pinene to HOx and NOx obtained using both isopropyl nitrite and O3 + H2O + N2O as the radical precursors.
- Article
(3288 KB) -
Supplement
(1002 KB) - BibTeX
- EndNote


Hydroxyl (OH) radicals govern the concentrations of most atmospheric organic compounds, including those that lead to secondary organic aerosol (SOA) formation. The relative importance of different primary OH precursors varies in different parts of the atmosphere and may include contributions from O(1D)–H2O reactions, hydrogen peroxide (H2O2), methyl peroxide (CH3OOH), nitrous acid (HONO) photolysis, and ozone–alkene reactions. Additionally, ozone-hydroperoxy (HO2) reactions and NO–HO2 reactions recycle HO2 back to OH (Lee et al., 2016; Mao et al., 2009). For decades, a handful of radical precursors have been used to generate OH radicals in the laboratory to initiate SOA production under controlled conditions. Environmental chambers most commonly photolyze nitrous acid (HONO), methyl nitrite (CH3ONO), or hydrogen peroxide (H2O2) at λ>310 nm to mimic SOA production, over experimental timescales of hours to days, simulating up to 2 days of equivalent atmospheric exposure (Atkinson et al., 1981; Chhabra et al., 2011; Finewax et al., 2018; Matsunaga and Ziemann, 2010).
Oxidation flow reactors (OFRs) photolyze H2O and O3 at λ=185 and 254 nm over experimental timescales of minutes, simulating multiple days of equivalent atmospheric exposure (Lambe et al., 2012; Peng et al., 2015). Recent application of reactions to study NOx-dependent SOA formation pathways facilitated characterization of oxidation products generated over a range of low- to high-NOx conditions (Lambe et al., 2017; Peng et al., 2018). Potential limitations of the method include (1) the inability to unambiguously deconvolve contributions from multiple oxidants (O3, OH, NO3), which may compete with each other under certain conditions and for specific unsaturated precursors; (2) required use of 254 nm photolysis, which may enhance photolytic losses that compete with OH oxidation, especially for species that are characterized by strong absorption/quantum yield at 254 nm and low-OH reactivity (Peng et al., 2016); (3) optimal high-NOx application at OH exposures corresponding to multiple equivalent days of oxidative aging rather than 1 day or less.
Here, we adapt a complementary method that uses alkyl nitrite photolysis to generate an alkoxy radical (RO⋅) and NO. In the presence of air, RO⋅ reacts with O2 to generate a carbonyl product (R'O) and a hydroperoxyl (HO2) radical, and NO and HO2 subsequently react to generate OH and NO2. Using this method, O3 is not required to generate OH radicals, and insignificant amounts of O3 or NO3 are generated as byproducts. We present experimental and model characterization of OH and NOx levels that are generated as a function of photolysis wavelength, and organic nitrite concentration and composition. We furthermore carried out chemical ionization mass spectrometer measurements to compare nitrogen-containing photooxidation products obtained from the reaction of α-Pinene with radicals generated via alkyl nitrite photolysis or the reaction.
2.1 Alkyl nitrite preparation
Figure 1 shows molecular structures of the alkyl nitrites that were used. Isopropyl nitrite (iPrONO; Pfaltz and Bauer, >95 % purity) was used without additional purification. Perdeuterated isopropyl nitrite (iPrONO-d7) and 1,3-propyl dinitrite [1,3-Pr(ONO)2] were synthesized from the action of HONO on isopropanol-d8 or 1,3-propanediol, respectively, as described elsewhere (Carrasquillo et al., 2014; Noyes, 1933). Briefly, sodium nitrite (>99.999 %, Sigma-Aldrich) and alcohol were combined in a 1.1:1.0 molar ratio and stirred with a magnetic stirrer inside a round-bottom flask. Sulfuric acid was added dropwise to the flask – thereby generating HONO upon reaction with sodium nitrite – until a 0.5:1.0 acid : alcohol molar ratio was achieved. The resulting clear yellow liquid was dried over sodium sulfate, neutralized with excess sodium bicarbonate and then stored in amber vials and refrigerated at 4 ∘C until use (within 1 week of synthesis in this work). Under these storage conditions, the nominal shelf life of iPrONO and similar organic nitrites is approximately 2 years (Robert Milburn, personal communication, 29 October 2018).
Figure 1Molecular structures of isopropyl nitrite, isopropyl nitrite-d7 (d = deuterium = 2H), and 1,3-propyl dinitrite.
A syringe pump was used to introduce iPrONO, iPrONO-d7, and 1,3-Pr(ONO)2 through a 10.2 cm length of 0.0152 cm ID teflon tubing at liquid flow rates ranging from 0.016 to 0.63 µL min−1. The liquid organic nitrite was evaporated into a 1 L min−1 N2 carrier gas at the end of the tubing. The flow containing organic nitrite vapor was then mixed with a 7 L min−1 synthetic air carrier gas at the reactor inlet.
The organic nitrite mixing ratio entering the reactor, rRONO, was equal to , where QRONO,g was the volumetric flow rate of organic nitrite vapor (L min−1) and Qcarrier was the volumetric flow rate of carrier gas (L min−1). QRONO,g was calculated using the ideal gas law as applied by Liu et al. (2015):
where QRONO,l (µL min−1) is the volumetric flow of organic nitrite liquid, ρ (g cm−3) and MW (g mol−1) are the organic nitrite liquid density and molecular weight, R (8.314 J mol−1 K−1) is the universal gas constant, T (K) is temperature, P (hPa) is pressure, and 0.01 is a lumped pressure, volume and density unit conversion factor.
2.2 Alkyl nitrite photolysis
Alkyl nitrites were photolyzed inside a Potential Aerosol Mass (PAM) oxidation flow reactor (Aerodyne Research, Inc.), which is a horizontal 13.3 L aluminum cylindrical chamber (46 cm long ×22 cm ID) operated in continuous flow mode (Lambe et al., 2017), with 5.1±0.3 L min−1 flow through the reactor unless stated otherwise. The relative humidity (RH) in the reactor was controlled in the range of 31 %–63 % at 21–32 ∘C using a Nafion humidifier (Perma Pure LLC), with corresponding H2O volumetric mixing ratios of approximately 1.5 %–1.7 %. Four UV lamps centered at λ=254 nm (GPH436T5L; Light Sources, Inc.), 350 nm (F436T5/BL/4P-350; Aerodyne Research, Inc.), or 369 nm (F436T5/BLC/4P-369; Aerodyne Research, Inc.) were used. Emission spectra obtained from the primary manufacturer (Light Sources, Inc. or LCD Lighting, Inc.) are shown in Fig. S1 in the Supplement. A fluorescent dimming ballast (IZT-2S28-D, Advance Transformer Co.) was used to regulate current applied to the lamps. The UV irradiance was measured using a photodetector (TOCON-GaP6, sglux GmbH) and was varied by changing the control voltage applied to the ballast between 1.6 and 10 VDC.
NO and NO2 mixing ratios were measured using a NOx analyzer (Model 405 nm, 2B Technologies), which quantified [NO2] (ppb) from the measured absorbance at λ=405 nm, and [NO] (ppb) by reaction with O3 to convert to NO2. Alkyl nitrites introduced to the reactor with the lamps turned off consistently generated signals in both the NO and NO2 measurement channels of the NOx analyzer, possibly due to impurities and/or species generated via iPrONO+O3 reactions inside the analyzer. For example, background NO and NO2 mixing ratios increased from 0 to 1526 and 0 to 1389 ppb as a function of injected [iPrONO] =0 to 18.7 ppm with the lamps off (Fig. S2). We attempted to correct [NO] and [NO2] for this apparent alkyl nitrite interference by subtracting background signals measured in the presence of alkyl nitrite with lamps off, to no avail, because background signals (alkyl nitrite present with lamps off) were large compared to signals obtained with alkyl nitrite present with lamps on. Instead, we constrained [NO] and [NO2] using the photochemical model discussed in Sect. 2.4.
2.2.1 Actinic flux calibration
To quantify the actinic flux I in the reactor for each lamp type, we measured the rate of NO2 photolysis as a function of UV irradiance (Fig. S4). Measurements were conducted in the absence of oxygen to avoid O3 formation. The first-order NO2 photolysis rate () was calculated using Eq. (2):
where NO2,0 and NO2,τ were the steady-state NO2 mixing ratios measured at the exit of the reactor with the lamps turned off and on, respectively. The mean NO2 residence time in the reactor, , was characterized using 10 s pulsed inputs of NO2. To mimic the effect of axial dispersion induced by temperature gradients from the lamps being turned on (Huang et al., 2017; Lambe et al., 2011), residence time distributions were measured in the presence of four lamps centered at λ=658 nm (F436T5/4P-658; Aerodyne Research, Inc.), where the NO2 quantum yield is zero (Gardner et al., 1987). NO2 residence time distributions are shown in Fig. S3, where ranged from 120±34 s (±1σ; lamps off) to 98±63 s (±1σ; lamps on) in a manner that is consistent with previous observations (Huang et al., 2017; Lambe et al., 2011). Assuming s, maximum values were 0.12, 0.36, and 0.50 min−1 following photolysis at full lamp power at λ=254, 350, and 369 nm, respectively.
Table 1Absorption cross section (σA,λ; cm2) or A + B bimolecular rate constant (kA+B, cm3 molec−1 s−1) reference values.
1 This work. 2 Raff and Finlayson-Pitts (2010). 3 Atkinson et al. (2004). 4 Raff and Finlayson-Pitts (2010). 5 Estimated from kiPrONO+OH scaled by relative rate constants of n-C3H8 + OH and n-C3D8 + OH (Nielsen et al., 1988, 1991). 6 Raff et al. (2005). 7 Burkholder et al. (2015). 8 Orlando and Tyndall (2012).
Corresponding I254, I350, and I369 values were calculated using a photochemical model implemented in the KinSim chemical kinetics solver (Peng et al., 2015; implemented within Igor Pro 7, WaveMetrics Inc.) that incorporated the following reactions:
NO2 absorption cross sections were averaged across the 254, 350, and 369 nm lamp emission spectra, respectively (Table 1) (Atkinson et al., 2004) and input to the model. Maximum , , and photons cm−2 s−1 were obtained. While I350 and I369 values were in agreement with values calculated from lamp manufacturer specifications ( and photons cm−2 s−1) within uncertainties, I254 obtained from our calibration was ∼13 times larger than expected. We hypothesize that this discrepancy was due to the presence of additional minor mercury lines (e.g., λ∼313, 365, 405) that induce NO2 photolysis and that were not fully accounted for using Eq. (2) or the manufacturer spectra (Fig. S1). Thus, we instead assume maximum photons cm−2 s−1 based on manufacturer specifications.
2.2.2 OH exposure calibration
The OH exposure (OHexp) obtained from alkyl nitrite photolysis, that is, the product of the OH concentration and mean residence time, was calculated from the addition of between 280 and 420 ppb SO2 at the reactor inlet. Over the course of these experiments, NOx generated from alkyl nitrite photolysis significantly interfered with the SO2 mixing ratio measured with an SO2 analyzer (Model 43i, Thermo Scientific); a representative example is shown in Fig. S5. To circumvent this issue, we measured the initial SO2 mixing ratio, [SO2,0], prior to alkyl nitrite photolysis, then used an Aerosol Chemical Speciation Monitor (ACSM; Aerodyne Research, Inc.) to measure the concentration of particulate sulfate generated from SO2+OH reactions.
To relate the measured [SO2,0] and sulfate to OHexp, we conducted an offline calibration where 493 ppb SO2 was added to the reactor and OH was generated via O3+ hν254 → O(1D)+O2 followed by O(1D)+H2O → 2OH in the absence of NOx (OFR254 mode). The reactor was operated at the same residence time and humidity that was used in alkyl nitrite experiments, although we note that humidity will not change the response of the ACSM to sulfuric acid aerosols. Because no particulate ammonia was present aside from trace background levels, we assumed an ACSM collection efficiency of unity for the sulfate particles. SO2 decay and particulate sulfate formation were measured across a range of UV irradiance and [O3], from which a calibration equation relating sulfate to OHexp was obtained (Fig. S6) and applied to alkyl nitrite photolysis experiments. In a separate experiment conducted with 2.2 ppm of iPrONO input to the reactor at photons cm−2 s−1, we verified that the mass of particulate sulfate detected by the ACSM responded linearly to a change in the input mixing ratio of SO2 between 200 and 473 ppb (Fig. S7). This suggests that the sulfate particles were large enough for efficient transmission through the inlet lens of the ACSM across the range of OHexp used in our experiments. While not applicable in this work, we note that heterogeneous uptake of SO2 into organic aerosol may bias OH exposure measurements (Ye et al., 2018).
2.3 Chemical ionization mass spectrometer (CIMS) measurements
In a separate set of experiments, mass spectra of gas-phase α-Pinene photooxidation products were obtained with an Aerodyne high-resolution time-of-flight chemical ionization mass spectrometer using nitrate as the reagent ion (-HRToF-CIMS, hereafter abbreviated as -CIMS) (Ehn et al., 2012; Eisele and Tanner, 1993). Nitrate () and its higher-order clusters (e.g., ) generated from X-ray ionization of HNO3 were used as the reagent due to their selectivity to highly oxidized organic compounds, including species that contribute to SOA formation (Ehn et al., 2014; Krechmer et al., 2015; Lambe et al., 2017). The -CIMS sampled the reactor output at 10.5 L min−1. α-Pinene oxidation products were detected as adduct ions of . In these experiments, the reactor was operated with a residence time of approximately 80 s to accommodate the undiluted -CIMS inlet flow requirement. OFR369-i(iPrONO) and OFR369-i(iPrONO-d7) were operated using photons cm−2 s−1 and >7 ppm alkyl nitrite; in these experiments, α-Pinene was evaporated into the carrier gas by flowing 1 sccm N2 through a bubbler containing liquid α-Pinene. Assuming the N2 flow was saturated with α-Pinene vapor, we estimate ∼500 ppb α-Pinene was introduced to the OFR based on its vapor pressure at room temperature and known dilution ratio into the main carrier gas. In a separate experiment, OFR254-iN2O was operated using photons cm−2 s−1 and 5 ppm O3 + 1 % H2O + 3.2 % N2O. Here, α-Pinene was introduced by flowing 1 sccm of a gas mixture containing 150 ppm α-Pinene in N2 into the main carrier gas (this gas mixture was unavailable for the iPrONO photolysis experiments); the calculated α-Pinene mixing ratio that was introduced to the OFR was ∼16 ppb.
2.4 Photochemical model
We used the KinSim OFR photochemical model to calculate concentrations of radical/oxidant species produced (Peng and Jimenez, 2017; Peng et al., 2015). In addition to NO+HO2 → OH+NO2 and other reactions included in Peng and Jimenez (2017), the following reactions were added for this study:
Model input parameters included pressure, temperature, [H2O], [iPrONO], mean residence time, actinic flux, and absorption cross sections and bimolecular rate constants shown in Table 1. We assumed the quantum yield of Reaction (2) to be 0.50 above 350 nm (Raff and Finlayson-Pitts, 2010). We assumed the quantum yield of Reaction (2) to be 0.04 above 350 nm (value for t-butyl nitrite) (Calvert and Pitts, 1966), suggesting minimal influence of CH3O2⋅ and CH3C(O)O2⋅ that are generated via Reactions (2), (2), and (2) following iPrONO decomposition to CH3⋅ and CH3CHO⋅ via Reaction (2). At 254 nm, the influence of CH3O2 and CH3C(O)O2⋅ on ensuing photochemistry may be more significant. This is due to a higher quantum yield of Reaction (2) at 254 nm, which is estimated to be 0.86 under a vacuum (Calvert and Pitts, 1966). Assuming that all 254 nm photons initiate photolysis, the quantum yield of Reaction (2) is 0.14. Due to collisional deactivation at 1 atm that prevents i-C3H7O⋅ decomposition, the quantum yield of Reaction (2) at λ=254 nm and 1 atm is expected to be higher than 0.14. Because quantum yield measurements were unavailable at these conditions, we applied an upper-limit quantum yield of 0.50 as applicable at λ>350 nm and 1 atm (Raff and Finlayson-Pitts, 2010). We calculated a corresponding nominal quantum yield of 0.32 by averaging the lower- and upper-limit values of 0.14 and 0.50, resulting in a quantum yield of 0.68 for Reaction (2).
We assumed that the residence time distribution of iPrONO in the reactor was similar to the residence time distribution of NO2. To model iPrONO photolysis at λ=254 nm, we extended the range of previously measured σiPrONO values by measuring the gas-phase absorption cross sections of iPrONO (purified via four freeze-pump-thaw cycles prior to measurement) down to λ=220 nm using a custom-built absorption cell (Raff and Finlayson-Pitts, 2010). Results at λ=220 to 436 nm are shown in Fig. S1 and are in agreement with previous work (Raff and Finlayson-Pitts, 2010) over the range of overlap at λ=300 to 450 nm.
To account for uncertainties associated with the assumptions we made for quantum yield values, as well as uncertainties in other kinetic parameters, temperature, residence time, actinic flux, and organic nitrite concentration, we performed Monte Carlo uncertainty propagation (BIPM et al., 2008) as described previously (Peng and Jimenez, 2017; Peng et al., 2015). All uncertain kinetic parameters were assumed to follow lognormal distributions unless stated otherwise below. Uncertainties in rate constants and cross sections newly included in this study were adopted from Burkholder et al. (2015) if available. The relative uncertainty in the rate constant of Reaction (2) was estimated to be 40 % based on the dispersion of rate constant measurements of published RO2+NO reactions. We assumed the random samples of the quantum yields of Reactions (2) and (2) at 254 nm and Reaction (2) at 369 nm followed uniform distributions in the range of [0.50, 0.86], [0.14, 0.50] and [0, 0.20], respectively. We assumed uncertainties of 5 K and 20 s in temperature and residence time (normal distributions assumed) and relative uncertainties of 50 %, 100 %, and 25 % in actinic flux at 369 nm, actinic flux at 254 nm, and organic nitrite concentration.
We first characterized OHexp and NOx by separately varying the photolysis wavelength (Sect. 3.1.1) and input organic nitrite concentration to the reactor (Sect. 3.1.2), with the goal of identifying optimal OFR conditions for OH and NOx generation via iPrONO photolysis. Second, we synthesized novel alkyl nitrites and compared their performances to iPrONO (Sect. 3.2). Third, we parameterized OHexp and NO2 production in a set of algebraic equations to guide selection of OFR experimental conditions. Finally, we compared -CIMS spectra of photooxidation products generated from reaction of α-Pinene with radicals produced via alkyl nitrite photolysis and reactions.
Figure 2Measured and modeled (a–b) OH exposure, (c–d) NO mixing ratio, and (e–f) NO2 mixing ratio values as a function of actinic flux (I) following photolysis of 1.9 ppm isopropyl nitrite (iPrONO) at λ=254 (OFR254-i(iPrONO)), 350 (OFR350-i(iPrONO)), or 369 nm (OFR369-i(iPrONO)) in the PAM oxidation flow reactor. Error bars for measurements represent ±50 % uncertainty in OHexp and I values.
3.1 OHexp and NOx generated from iPrONO photolysis
3.1.1 Effect of photolysis wavelength
Figure 2 shows OHexp, [NO], and [NO2] obtained as a function of actinic flux following photolysis of 1.9 ppm of iPrONO injected into the reactor at λ=254, 350, or 369 nm. These systems are hereafter designated as OFR254-i(iPrONO), OFR350-i(iPrONO), and OFR369-i(iPrONO), respectively; similar nomenclature is adapted for other alkyl nitrites. In these notations, the numbers following “OFR” are the photolysis wavelengths (in nm), and the “i” preceding the parentheses means initial injection of the radical precursor compound noted in the parentheses. Modeled OHexp, NO, and NO2 values for the OFR254-i(PrONO) and OFR369-i(PrONO) modes are shown in Fig. 2 at the same nominal operating conditions.
At a fixed photolysis wavelength, OHexp, NO, and NO2 increased with increasing actinic flux. Measured and modeled OHexp values were in agreement within uncertainties at λ=369 nm. At λ=254 nm, model OHexp results were higher than the measurements, perhaps due to uncertainty in assumptions that were necessary to model OFR254-i(iPrONO) (Sect. 2.4). Higher NO2 concentrations were modeled at λ=254 nm than at λ=369 nm because more iPrONO was photolyzed and the NO2 yield was only weakly dependent on the fate of i-C3H7O⋅. For example, NO is converted to NO2 either via reaction with HO2 obtained via Reaction (2) or CH3O2⋅ and CH3C(O)O2⋅ obtained via Reaction (2). However, the effect of photolysis wavelength on NO and OHexp was different. Specifically, the highest NO concentration and OHexp were achieved via OFR369-i(iPrONO). OHexp achieved via OFR369-i(iPrONO) was slightly higher than OHexp attained using OFR350-i(iPrONO), likely because photolysis of both iPrONO and NO2, the reaction of which with OH suppresses OHexp, is more efficient at λ=369 nm than at λ=350 nm (Fig. S1 and Table 1). Further, the NO and OH yields achieved via OFR254-i(iPrONO) were suppressed due to significant (>73 %) decomposition of iC3H7O⋅ (Calvert and Pitts, 1966). The dependence of OH, NO, and NO2 on the quantum yields of Reactions (2) and (2) was confirmed by sensitivity analysis of uncertainty propagation inputs and outputs as described in Sect. 2.4. OHexp and NO were strongly anticorrelated with the quantum yield of Reaction (2), whereas the correlation between NO2 and the quantum yield of Reaction (2) was negligible.
The products of this decomposition, i.e., CH3CHO and CH3⋅, both have adverse effects with regard to our experimental goals: CH3CHO is reactive toward OH and can thus suppress OH; the RO2⋅ formed through this reaction, CH3C(O)O2⋅, consumes NO and generates NO2 but does not generate OH; CH3⋅ rapidly converts to CH3O2⋅, which also consumes NO and generates NO2 but does not directly produce OH. Importantly, Fig. 2 suggests that it is preferable to photolyze alkyl nitrites at λ>350 because optimal OHexp and NO:NO2 were attained via OFR369-i(iPrONO). Moreover there is added risk of significant unwanted photolysis of organics via OFR254-i(iPrONO) (Peng et al., 2016).
3.1.2 Effect of alkyl nitrite concentration
Figure 3 shows measured OHexp and modeled NOx concentrations obtained from photolysis of 0.5 to 20 ppm iPrONO at photons cm−2 s−1. [NO] and [NO2] increased with increasing [iPrONO], as expected. For [iPrONO] ≤5 ppm, OHexp increased with increasing [iPrONO] because the rate of OH production increased faster than the rate of OH destruction from reaction with iPrONO and NO2. The model results showed that for [iPrONO] >5 ppm, the opposite was true and OHexp plateaued or decreased. A maximum OH molecules cm−3 s was achieved via photolysis of 10 ppm iPrONO, with corresponding modeled [NO] and [NO2] values of 148 and 405 ppb respectively. Modeled NO3 concentrations were negligible in OFR369-i(iPrONO) (≤1 ppt) because there was no O3 present and NO3 production via HNO3+OH → NO3+H2O reactions was insignificant.
Figure 3Measured and modeled (a) OH exposure, (b) NO mixing ratio, and (c) NO2 mixing ratio values obtained using OFR369-i(iPrONO) at ph cm−2 s−1 as a function of the iPrONO mixing ratio. Error bars for measurements represent ±50 % uncertainty in OHexp and estimated ±30 % uncertainty in the iPrONO mixing ratio values.
3.2 OHexp generated from photolysis of perdeuterated iPrONO and 1,3-propyl dinitrite
Although OH molecules cm−3 s (approximately 0.6 days of equivalent atmospheric OH exposure) may be suitable for some OFR applications, it may be insufficient to simulate multigenerational oxidative aging of precursors with OH rate constants slower than cm3 molecule−1 s−1. We attempted to synthesize three C3 alkyl nitrites that we hypothesized could generate higher OHexp than iPrONO: perdeuterated isopropyl nitrite (iPrONO-d7), 1,3-propyl dinitrite [1,3-Pr(ONO)2], and hexafluoroisopropyl nitrite (HFiPrONO). We successfully synthesized 1,3-Pr(ONO)2 and iPrONO-d7, but were unable to synthesize HFiPrONO (Sect. 3.5.3). Figure 4 shows OHexp attained from photolysis of 1.2 ppm 1,3-Pr(ONO)2 and 1.7 ppm iPrONO-d7 as a function of I369, along with the model output for OFR369-i(iPrONO) shown for reference. At these organic nitrite concentrations and I369 values, maximum OHexp measurements were 1.1×10¹¹ (iPrONO-d7), 4.0×10¹⁰ (iPrONO), and 1.8×10¹⁰ molecules cm−3 s [1,3-Pr(ONO)2], respectively. At maximum I369 and after correcting for the different iPrONO, iPrONO-d7, and 1,3-Pr(ONO)2 concentrations that were used (Fig. 3), OH ≈ 2.9 × OHexp,iPrONO and OH ≈ 0.81 × OHexp,iPrONO.
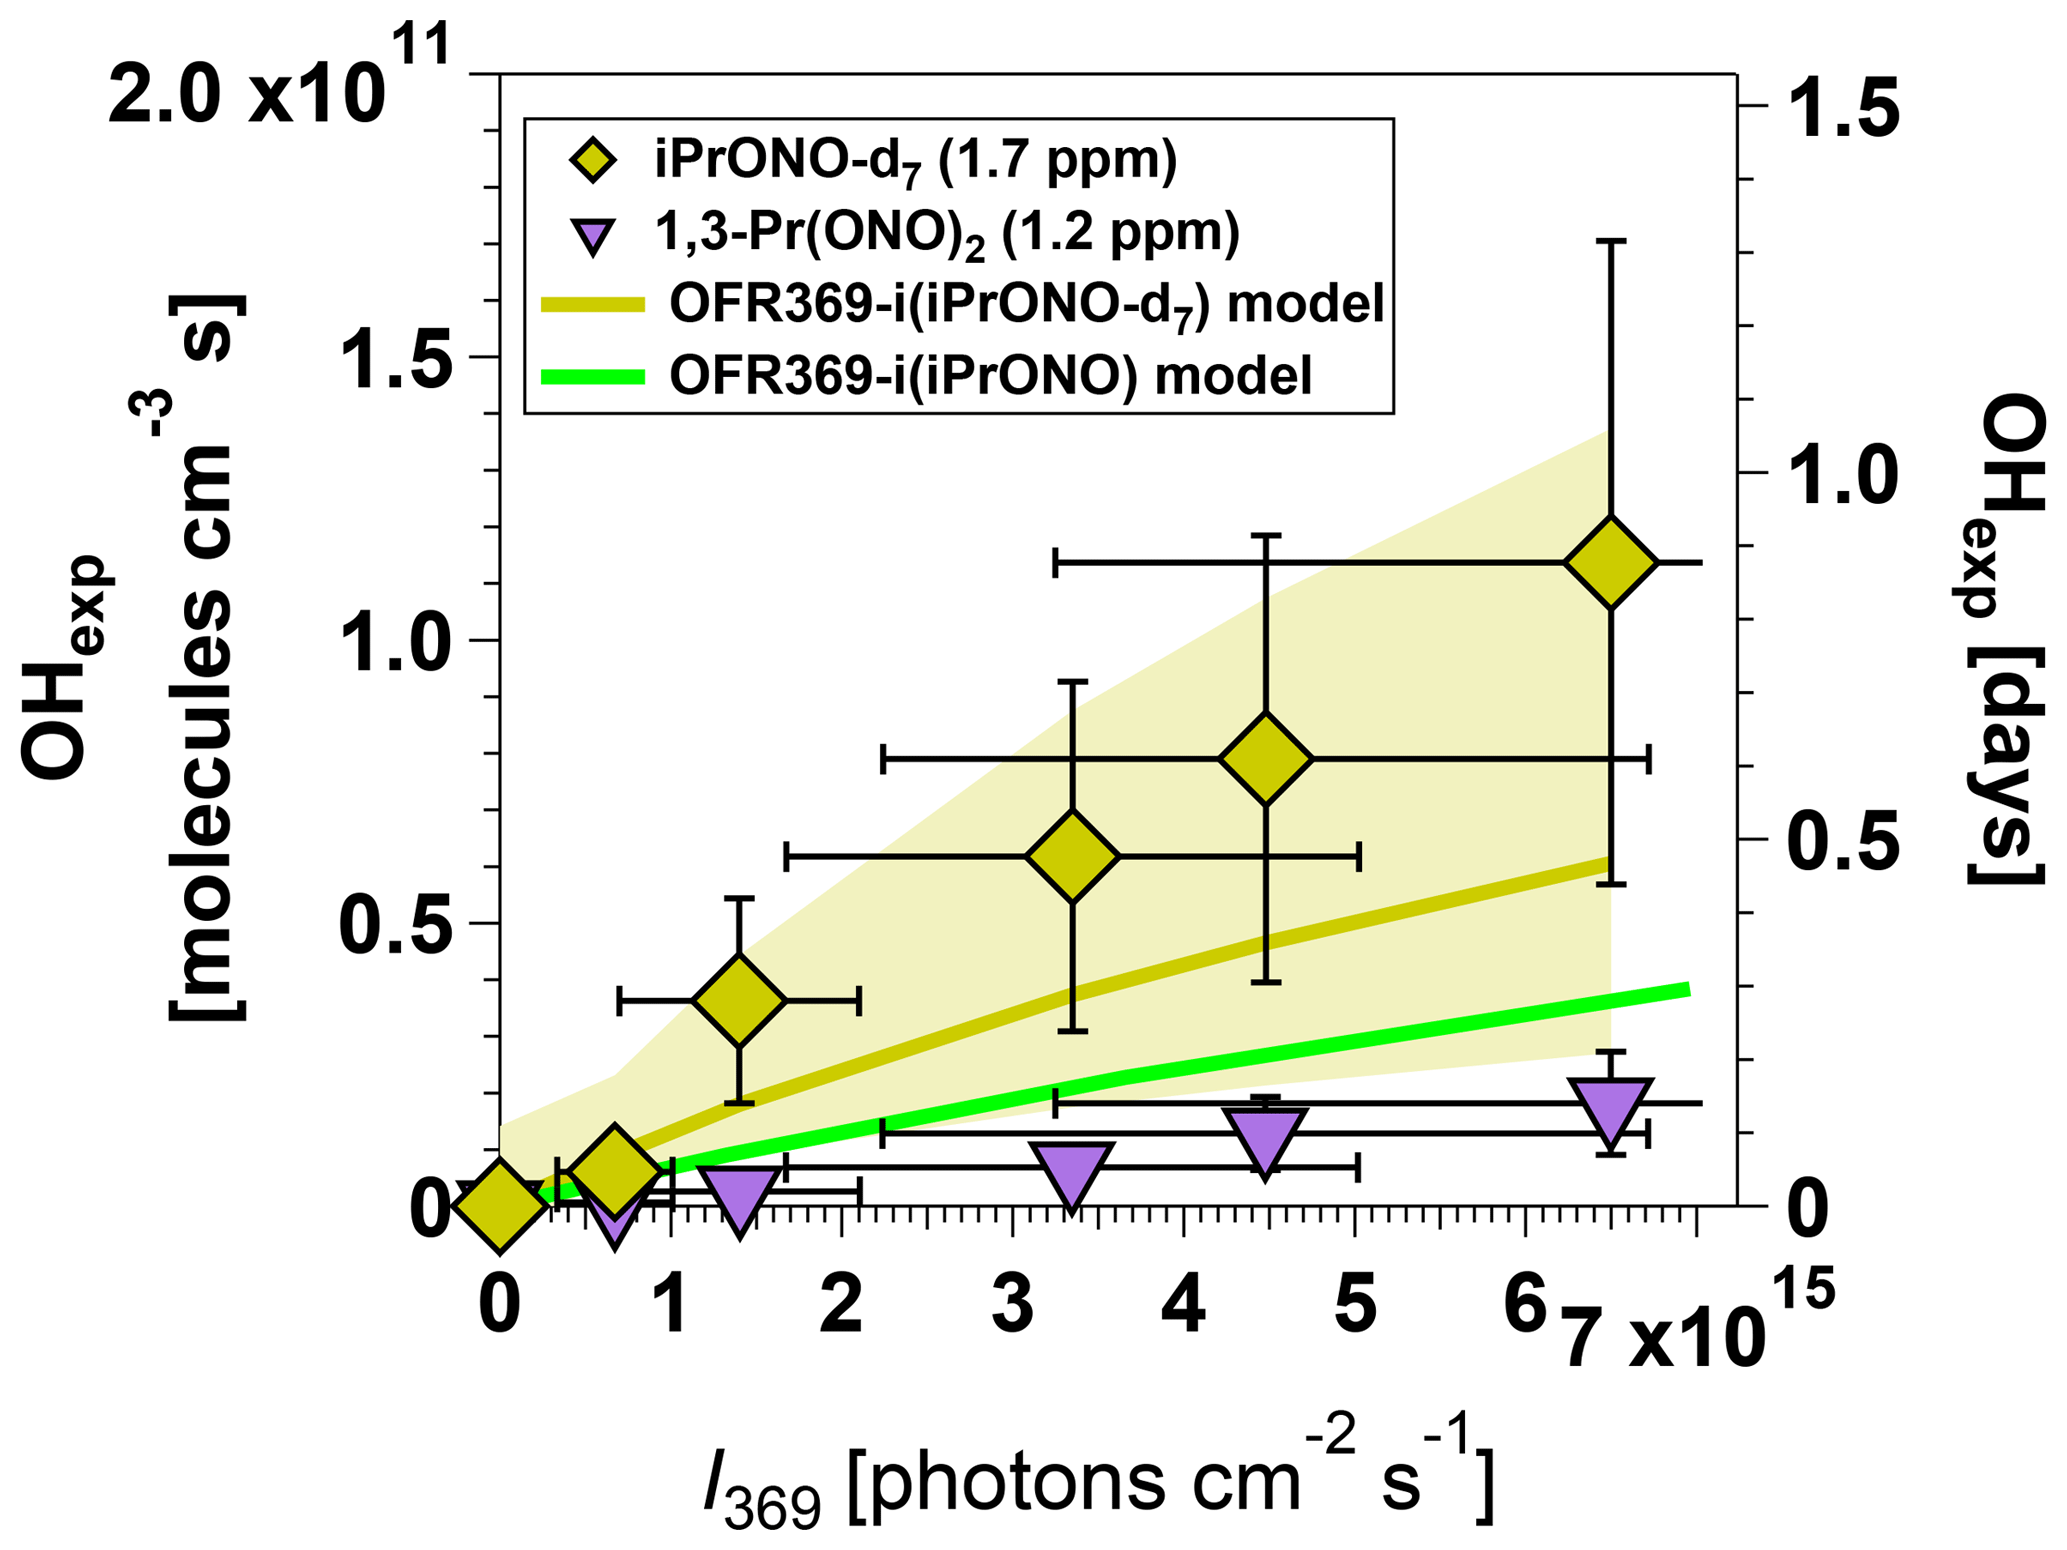
Figure 4Measured and modeled OH exposure values measured as a function of I369 following photolysis of perdeuterated isopropyl nitrite (iPrONO-d7) and 1,3-propyl dinitrite (1,3-Pr(ONO)2). Modeled OHexp values obtained from OFR369-i(iPrONO-d7) and OFR369-i(iPrONO) (Fig. 2d) are shown for reference. Error bars for measurements represent ±50 % uncertainty in OHexp and I values.
We hypothesize that higher OHexp obtained from OFR369-i(iPrONO-d7) relative to OFR369-i(iPrONO) was due to ∼2.6 times lower OH reactivity of iPrONO-d7 relative to iPrONO (Nielsen et al., 1988, 1991) and 6 times lower OH reactivity of acetone-d6 relative to acetone (Raff et al., 2005). This hypothesis is supported by the modeled OHexp attained via OFR369-i(iPrONO-d7), which is in agreement with measured OHexp within uncertainties and is 41 % higher than modeled OHexp attained via OFR369-i(iPrONO). Model simulations revealed that this effect was most pronounced near the reactor inlet (e.g., at low residence time), where the local OH concentration was higher than elsewhere in the reactor because NOx was very low, resulting in higher sensitivity of [OH] to the OH reactivity of the specific organic nitrite that was used. On the other hand, OFR369-i(1,3-Pr(ONO)2) was less efficient than OFR369-i(iPrONO). In this case, it is possible that higher NO2 production during 1,3-Pr(ONO)2 photolysis and/or production of more reactive intermediates (e.g., malonaldehyde) offset any benefit gained from faster OH production via photolysis of both -ONO groups or more efficient photolysis of one -ONO group (Wang and Zu, 2016).
3.3 OHexp and NO2 estimation equations for OFR369-i(iPrONO) and OFR369-i(iPrONO-d7)
Previous studies reported empirical OHexp algebraic estimation equations for OFR185 and OFR254 (Li et al., 2015; Peng et al., 2015). These equations parameterize OHexp as a function of readily measured experimental parameters, therefore providing a simpler alternative to detailed photochemical models that aids in experimental planning and analysis. Here, we expand on those studies by deriving OHexp and NO2 estimation equations for OFR369-i(iPrONO) and OFR369-i(iPrONO-d7). Model results (14 641 model runs in total) obtained from the base case of the model (SO2 as surrogate of external OH reactivity, OHRext) were used to derive the following equations that allow an estimation the OH exposure for OFR369-i(iPrONO) and OFR369-i(PrONO-d7):
where OHexp, I369, OHRext, [iPrONO or iPrONO-d7], and τ are in units of molecules cm−3 s, photons cm−2 s−1, s−1, ppm, and s, respectively. Fit coefficients were obtained by fitting Eqs. (3) and (4) to OHexp model results over the following range of OFR parameters: ([iPrONO/iPrONO-d7]; 0.2–20 ppm), I369 (1×10¹⁵–2×10¹⁶ photons cm−2 s−1), OHRext (1–200 s−1), and residence time, τ, between 30 and 200 s. We explored 11 logarithmically evenly distributed values in these ranges for each parameter and thus performed simulations for 14641 model cases in total. To determine the functional form of Eqs. (3) and (4), we used the sum of the logarithms of first-, second- and third-order terms of the four parameters and iteratively removed the terms with very small fit coefficients until further removal of the remaining terms significantly worsened the fit quality.
Figure 5a and c compare OHexp estimated from Eqs. (3) and (4) and calculated from the model described in Sect. 2.4. The mean absolute value of the relative deviation is 29 %, indicating that the estimation equations are typically producing results within the inherent model uncertainties. Care should be taken to not use the equations away from the range in which they were derived, as much larger errors are possible when extrapolating.

Figure 5Comparison of OHexp and NO2 values obtained from estimation equations and photochemical model for (a–b) OFR369-i(iPrONO) and (c–d) OFR369-i(iPrONO-d7).
While several techniques are available to monitor NO2, interferences from other nitrogen-containing species are well known and may create issues similar to those shown in Fig. 2f. NO2 production and loss rates are primarily governed by the alkyl nitrite concentration, actinic flux, and residence time in the OFR. These parameters were experimentally constrained (Sect. 2.2.2). Thus, we derived NO2 estimation equations for OFR369-i(iPrONO) (Eq. 5) and OFR369-i(iPrONO-d7) (Eq. 6) as a function of [RONO], I369, and τ, to all of which NO2 production is proportional, over the same phase space used to fit Eqs. (3) and (4):
Figure 5b and d compare NO2 estimated from Eqs. (3) and (4) and calculated from the model described in Sect. 2.4. The mean absolute value of the relative deviation between NO2 estimated by Eqs. (5) and (6) and NO2 computed by the photochemical model is 19 %. The mean model NO:NO2 fraction is approximately 0.33 (Figs. 2–3).
3.4 -CIMS spectra of organic nitrates generated from α-Pinene + OH/OD reactions via OFR369-i(iPrONO), OFR369-i(iPrONO-d7), and OFR254-iN2O
To evaluate the efficacy of OFR369-i(iPrONO), OFR369-i(iPrONO-d7), and OFR254-iN2O for generating HOx under high-NOx photooxidation conditions, we obtained -CIMS spectra of α-Pinene + OH/OD nitrogen-containing oxidation products generated using each method, with experimental conditions described in Sect. 2.3. Calculated OH exposures for OFR369-i(iPrONO), OFR369-i(iPrONO-d7), and OFR254-iN2O were 2.9×10¹⁰, 5.9×10¹⁰ and 5.0×10¹¹ molecules cm−3 s, respectively, in the absence of OH consumption due to α-Pinene. These calculated steady-state OHexp values decreased to 8.5×10⁸, 6.8×10⁸ and 4.6×10¹¹ molecules cm−3 s after accounting for OH consumption. This suggests that most of the OH that was produced in these OFR369-i(iPrONO/iPrONO-d7) experiments was consumed by α-Pinene and its early-generation photooxidation products. OH suppression relative to 254 nm photons, O3, and O is not a concern in OFR369-i(iPrONO), unlike in OFR254-iN2O (Peng et al., 2016).
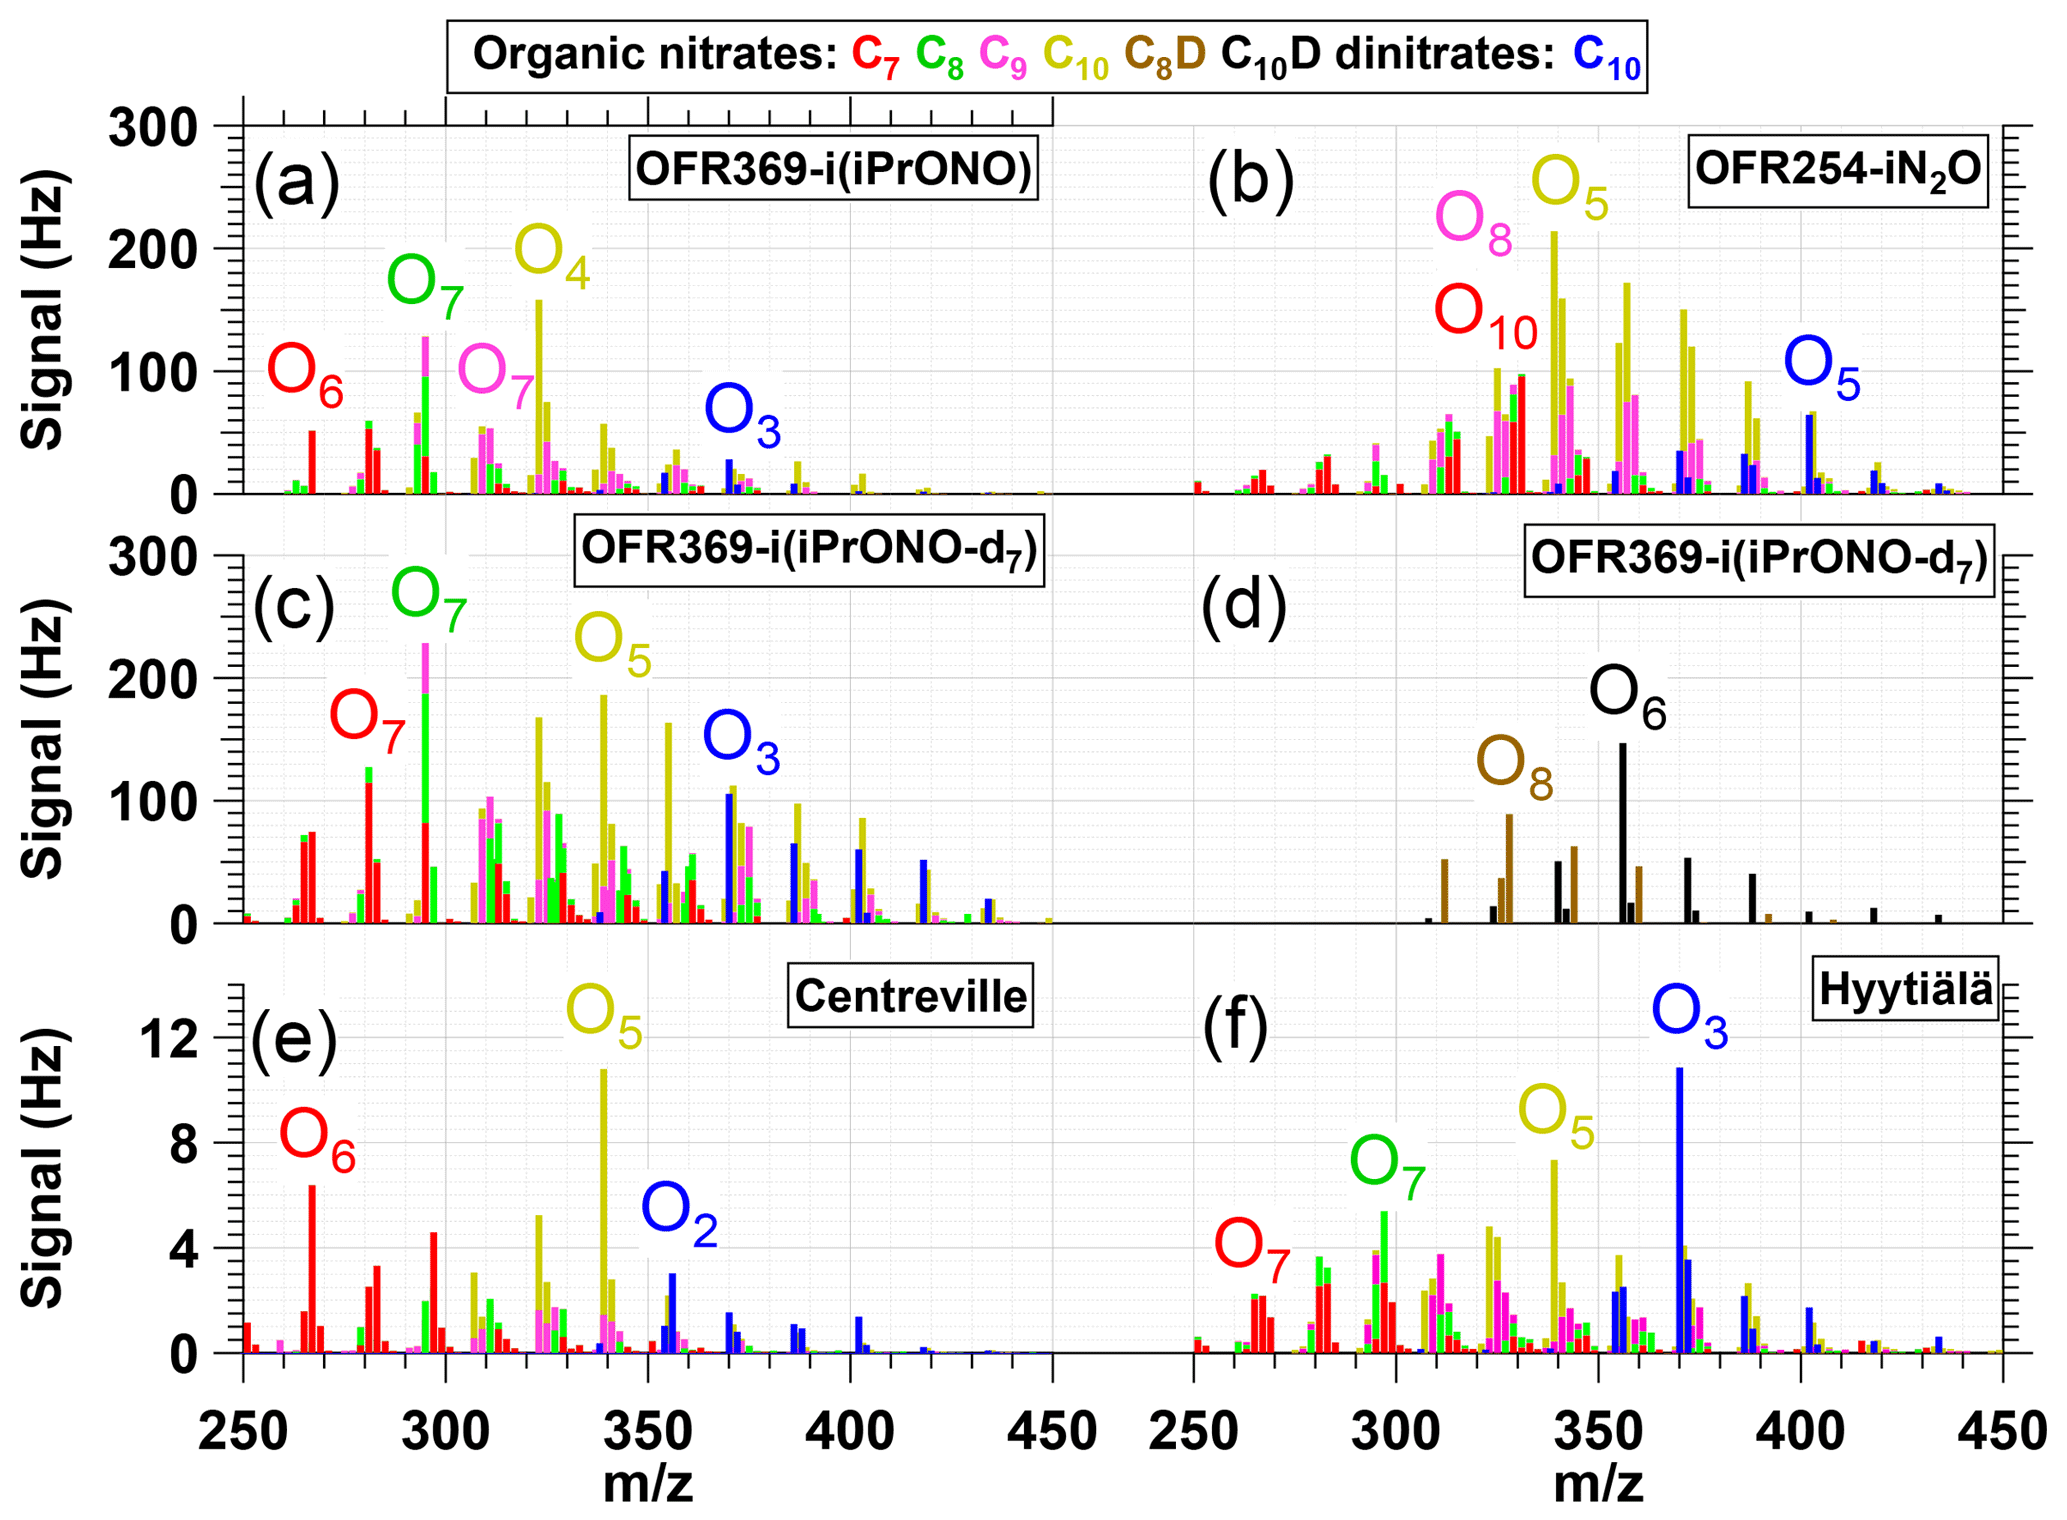
Figure 6NO-CIMS spectra of nitrogen-containing α-Pinene photooxidation products with (C7, C8, C9), (C10), (C8D), (C10D) or (C10 dinitrate) formulas generated via (a) OFR369-i(iPrONO) (b) OFR254-iN2O (H2O = 1 %, N2O = 3.2 %). (c, d) OFR369-i(iPrONO-d7) and observed in ambient measurements at (e) Centreville, Alabama, United States (Massoli et al., 2018) and (f) Hyytiälä, Finland (Yan et al., 2016). Ox indicates the number of oxygen atoms in corresponding signals (excluding three oxygen atoms per nitrate functional group).
Exposure of α-Pinene to OH/OD generated via OFR369-iPrONO, OFR369-iPrONO-d7, and OFR254-iN2O produced C7–C10 organic nitrate and C10 dinitrate signals that are shown in Fig. 6a–d. ([(NO3)C7H9NO8]− and [(NO3)C7H11NO8]− signals at and 299 are excluded due to significant intra- and inter-experiment variability for unknown reasons). Figure 6 shows that many of the same products are observed independent of radical precursors. The Fig. 6a spectrum (OFR369-i(iPrONO)) is shifted to a lower oxygen-to-carbon ratio relative to Fig. 6b (OFR254-iN2O) and c (OFR369-i(iPrONO-d7)), consistent with the lower OHexp achieved with OFR369-i(iPrONO) compared to OFR369-i(iPrONO-d7) and OFR254-iN2O. For example, [(NO3)C10H15NO7]− was the largest C10 nitrate signal observed via OFR369-i(iPrONO), whereas [(NO3)C10H15NO8]− was the largest C10 nitrate signal observed via OFR369-i(iPrONO-d7) and OFR254-iN2O. Qualitatively similar trends were observed for C7–C9 organic nitrates and C10 dinitrates across the three systems.
Two additional features are of note in Fig. 6. First, a series of ion signals at , 328, 344, 360, 376, 392, 408 and 340, 356, 372, 388, 402, 420 were observed at higher levels via OFR369-i(iPrONO-d7) relative to OFR369-i(iPrONO). These ions are plotted separately in Fig. 6d. The most plausible explanation is the additional contribution of [(NO3)C8H10DNO8−14]− and [(NO3)C10H14DNO7−14]− ions that retain -OD functionality following initial addition of OD (rather than OH) to α-Pinene. There is evidence of other deuterium-containing ions in Fig. 6b that are either less prominent or more difficult to resolve from other ions at the same integer mass. Second, C10 dinitrates were present in all three spectra, with the highest dinitrate fractions observed in Fig. 6b (0.090) and c (0.081), and the lowest dinitrate fraction observed in Fig. 6a (0.056). Dinitrates are presumably generated from α-Pinene following (1) two OH reactions followed by two RO2+ NO termination reactions or (2) one NO3 reaction followed by one RO2+ NO termination reaction. Previous application of OFR254-iN2O could not exclude the contribution of α-Pinene + NO3 reactions, with NO3 radicals generated from NO2 + O3 and other reactions (Lambe et al., 2017). However, generation of dinitrates via OFR369-i(iPrONO-d7), which produced negligible NO3, suggests that dinitrates are not an artifact of unwanted α-Pinene + NO3 reactions.
The ability of OFR369-i(iPrONO) and OFR369-i(iPrONO-d7) to mimic polluted atmospheric conditions can be evaluated by comparing signals observed in Fig. 6a–c with -CIMS spectra obtained in Centreville, AL, USA (Massoli et al., 2018) and in Hyytiälä, Finland (Yan et al., 2016) that are shown in Fig. 6e–f. Both measurement locations are influenced by local biogenic emissions mixed with occasional anthropogenic outflow. Figure 6e and f were obtained on 25 June 2013 (07:30–11:00 Centreville time) and 11 April 2012 (10:00–13:00 Hyytiälä time). The mean NO mixing ratios during these periods were 0.53±0.17 (Centreville) and 0.27±0.09 ppb (Hyytiälä). In Centreville, a terpene nitrate source factor that peaked during the early morning contained C9H15NO5-7, , and C10H14,16N2O8-11 compounds (Massoli et al., 2018). The largest C10 nitrate and dinitrate species in that factor were C10H15NO6, C10H15NO8, C10H16N2O9 and C10H16N2O10. In Hyytiälä, concentrations of C10H15NO7-11 and C10H16N2O8-11 peaked in the morning and early afternoon. Elevated C10 dinitrate levels during the daytime in Hyytiälä (Fig. 6f) suggest their formation from monoterpenes following two OH reactions followed by two RO2+ NO termination reactions, as proposed earlier.
Overall, Fig. 6 shows that many of the C7–C10 nitrogen-containing compounds observed in Centreville and Hyytiälä were generated via OFR369-i(iPrONO), OFR369-i(iPrONO-d7), and OFR254-iN2O. Due to the local nature of the ambient terpene emissions at the Centreville and Hyytiälä sites, the associated photochemical age was presumably <1 day. Thus, while the ambient -CIMS spectra at those sites were more complex and contained contributions from precursors other than α-Pinene, the oxidation state of the ambient terpene-derived organic nitrates was more closely simulated via OFR369-i(iPrONO) or OFR369-i(iPrONO-d7), where the largest C10 nitrates and dinitrates were C10H15NO7 and C10H16N2O9 (OFR369-i(iPrONO); Fig. 6a), and C10H15NO8, C10H15NO9 and C10H16N2O9 (OFR369-i(iPrONO-d7); Fig. 6c). By comparison, C10H15NO8 and C10H16N2O11 were the largest nitrate and dinitrate species generated via OFR254-iN2O (Fig. 6b).
3.5 Anticipated performance of alternative high-NOx HOx precursors in OFRs
3.5.1 Methyl nitrite (MeONO)
MeONO is commonly used as an OH radical source in environmental chamber studies (Atkinson et al., 1981; Chhabra et al., 2011; Finewax et al., 2018; Matsunaga and Ziemann, 2010). To evaluate its potential use in OFRs, we examined previous measurements in an environmental chamber equipped with blacklights ( min−1, assumed 350 nm wavelength), where photolysis of 10 ppm MeONO generated [OH] molecules cm−3 for a few minutes (Atkinson et al., 1981). In our OFR, min−1 at λ=350 nm. Thus, over 98 s exposure time, we anticipate OH molecules cm−3 s would be obtained via photolysis of 10 ppm MeONO in OFRs. This is lower than the OHexp attained via photolysis of 10 ppm iPrONO even after correcting for different values in the different studies. Lower OHexp achieved from MeONO photolysis is presumably due to the higher reactivity of formaldehyde, the primary photolysis product of MeONO, relative to acetone, the primary photolysis product of iPrONO at 369 nm (Raff and Finlayson-Pitts, 2010). Along with less efficient OH production, MeONO must be synthesized, trapped at low temperature, and stored under a vacuum. Thus, there is no advantage to using OFR350-iMeONO (or OFR350-MeONO-d4) in OFRs relative to OFR369-i(iPrONO) or OFR369-i(iPrONO-d7).
3.5.2 Nitrous acid (HONO)
HONO is also commonly used as an OH radical source in environmental chamber studies. To evaluate its potential application in OFRs, we examined previous measurements in an environmental chamber equipped with blacklights, where photolysis of 3–20 ppm HONO generated initial [OH] molecules cm−3 (Cox et al., 1980), which is 3.3 times lower than [OH] obtained from photolysis of comparable levels of MeONO (Sect. 3.5.1). Lower OHexp achieved from HONO photolysis is presumably due to higher OH reactivity of HONO relative to MeONO/iPrONO. Additionally, HONO is difficult to prepare without NO2 impurities (Febo et al., 1995) that may cause additional OH suppression. For these reasons, we believe that there is no advantage to using HONO as a HOx precursor in OFRs.
3.5.3 Hexafluoroisopropyl nitrite (HFiPrONO)
HFiPrONO has been synthesized from O-nitrosation of hexafluoroisopropanol (Andersen et al., 2003; Shuping et al., 2006). We predict that OFR369-i(HFiPrONO) should attain higher OHexp than OFR369-i(iPrONO) and OFR369-i(iPrONO-d7) due to similar photolysis rates (Andersen et al., 2003) and ∼200 times lower OH reactivity of HFiPrONO/hexafluoroacetone relative to iPrONO/acetone (Atkinson et al., 1992; Tokuhashi et al., 1999). Simple modeling calculations suggest that application of OFR369-i(HFiPrONO) may achieve up to a week of equivalent OH exposure. We made several unsuccessful attempts to synthesize HFiPrONO and other fluorinated alkyl nitrites with a procedure similar to that used by Andersen et al. (2003) and Shuping et al. (2006). The synthesis product was blue (not yellow) in color when trapped or stored in nitrogen, generated negligible OH upon irradiation in the reactor, and evolved into brown vapor in the presence of air or upon warming to room temperature (Fig. S8). These observations suggest the formation of N2O3, which we hypothesize was formed in solution from the reactions
This pathway may have been favored if the O-nitrosation of hexafluoroisopropanol was slow compared to non-fluorinated alcohols.
Recently, we developed new methods that enable NOx-dependent photooxidation studies in OFRs using O(1D) reactions via O3 photolysis at λ=254 nm and/or H2O+N2O photolysis at 185 nm (OFR254-iN2O and OFR185-iN2O) (Lambe et al., 2017; Peng et al., 2018). Alkyl nitrite photolysis is an established method that facilitates high-NOx photooxidation studies in modern OFRs. Here, we adapted alkyl nitrite photolysis for new OFR applications by characterizing the photolysis wavelength, nitrite concentration, and nitrite composition that result in optimal HOx and NOx generation capabilities. Based on our results, we recommend photolysis of 5–10 ppm isopropyl nitrite at λ≈365–370 nm photolysis wavelength and I>1015 photons cm−2 s−1. If the user has the resources to synthesize iPrONO-d7, better performance is expected relative to iPrONO. Alkyl nitrite photolysis at λ=254 nm is not recommended. Taken together, OFR254/185-iN2O and OFR369-i(iPrONO/iPrONO-d7) are complementary methods that provide additional flexibility for NOx-dependent OFR studies. OFR254/185-iN2O generate variable-NOx photooxidation conditions (NO:HO2 ≈0–100) and are suitable for the characterization of multigenerational oxidative aging processes at up to OHexp≈ (5–10)×1011 molecules cm−3 s (∼5–10 equivalent days). OFR369-i(iPrONO/iPrONO-d7) generate high-NO photooxidation conditions (NO:HO2 ≈10–10 000; NO:NO2 ≈0.2–0.7) with minimal O3 and NO3 formation at longer photolysis wavelength than OFR254/185-iN2O. We anticipate that alkyl nitrite photolysis is advantageous for the characterization of first-generation, high-NOx photooxidation products of most precursors at up to OH molecules cm−3 s (1 equivalent day), which is comparable to environmental chambers investigating high-NOx conditions. The generation of OD (rather than OH) via OFR369-i(iPrONO-d7) may be useful in photooxidation studies of unsaturated precursors due to the shift in the m∕z of the addition products, though at the potential expense of generating more complex distributions of oxidation products. Potential disadvantages of the OFR369-i(iPrONO) method are (1) restriction to high-NO photochemical conditions, (2) restriction to OHexp of 1 equivalent day or less, (3) additional complexity involved with integration of the alkyl nitrite source (compared to ), (4) additional cost and complexity to retrofit a specific OFR design with blacklights, and (5) that it acts as an interference that precludes NOx measurements by chemiluminescence detection. Future work will evaluate the ability of each method to mimic polluted atmospheric conditions in specific source regions.
Data presented in this manuscript are available upon request to the corresponding authors.
The supplement related to this article is available online at: https://doi.org/10.5194/amt-12-299-2019-supplement.
AL conceived and planned the experiments. JC, AL and JK carried out the experiments. ZP and JJ planned and carried out the model simulations. AL, JK, JC, and AC performed alkyl nitrite syntheses. JR contributed new iPrONO absorption measurements. AL, JK, ZP, JR, JJ and DW contributed to the interpretation of the results. AL took the lead in writing the manuscript. All authors provided feedback on the manuscript.
The authors declare that they have no conflict of interest.
This research was supported by the Atmospheric Chemistry Program of the US National Science Foundation under grants
AGS-1536939, AGS-1537446, AGS-1537009, and AGS-1352375 (to Jonathan Raff).
Zhe Peng and Jose Jimenez were supported by DOE (BER/ASR) DE-SC0016559 and NOAA NA18OAR4310113.
Andrew T. Lambe thanks Paola Massoli, Penglin Ye, and Phil Croteau (ARI) for experimental assistance, and Chao Yan (University of Helsinki),
William Brune (Penn State), Pengfei Liu (Harvard), Wai Yip Fan (National University of Singapore), Manjula Canagaratna (ARI),
John Jayne (ARI), Charles Kolb (ARI), and Paul Ziemann (CU Boulder) for helpful discussions.
Edited by: Eric C. Apel
Reviewed by: three anonymous referees
Andersen, M. P. S., Hurley, M. D., Ball, J. C., Schneider, W. F., Wallington, T. J., and Nielsen, O. J.: CF3CH(ONO)CF3: Synthesis, IR spectrum, and use as OH radical source for kinetic and mechanistic studies, Int. J. Chem. Kinet., 35, 159–165, https://doi.org/10.1002/kin.10116, 2003. a, b, c
Atkinson, R., Carter, W. P. L., Winer, A. M., and Pitts Jr., J. N.: An Experimental Protocol for the Determination of OH Radical Rate Constants with Organics Using Methyl Nitrite Photolysis as an OH Radical Source, JAPCA J. Air Waste Ma., 31, 1090–1092, https://doi.org/10.1080/00022470.1981.10465331, 1981. a, b, c
Atkinson, R., Baulch, D., Cox, R., Hampson, R., Kerr, J., and Troe, J.: Evaluated kinetic and photochemical data for atmospheric chemistry: Supplement IV: IUPAC subcommittee on gas kinetic data evaluation for atmospheric chemistry, Atmos. Environ.-A Gen., 26, 1187–1230, https://doi.org/10.1016/0960-1686(92)90383-V, 1992. a
Atkinson, R., Baulch, D. L., Cox, R. A., Crowley, J. N., Hampson, R. F., Hynes, R. G., Jenkin, M. E., Rossi, M. J., and Troe, J.: Evaluated kinetic and photochemical data for atmospheric chemistry: Volume I – gas phase reactions of Ox, HOx, NOx and SOx species, Atmos. Chem. Phys., 4, 1461–1738, https://doi.org/10.5194/acp-4-1461-2004, 2004. a, b
BIPM, IEC, IFCC, ILAC, ISO, IUPAC, and IUPAPOIML: JCGM 101: Evaluation of measurement data – Supplement 1 to the “Guide to the expression of uncertainty in measurement” – Propagation of distributions using a Monte-Carlo method, available at: http://www.bipm.org/utils/common/documents/jcgm/JCGM_101_2008_E.pdf (last access: 11 January 2019), 2008. a
Burkholder, J. B., Sander, S. P., Abbatt, J. P. D., Barker, J. R., Huie, R. E., Kolb, C. E., Kurylo, M. J., L., O. V., Wilmouth, D. M., and Wine, P. H.: Chemical Kinetics and Photochemical Data for Use in Atmospheric Studies, Evaluation Number 18, Pasadena, CA, USA,, available at: http://jpldataeval.jpl.nasa.gov/ (last access: 11 January 2019), 2015. a, b
Calvert, J. G. and Pitts, J. N.: Photochemistry, John Wiley & Sons, Inc.: New York, NY, 1966. a, b, c
Carrasquillo, A. J., Hunter, J. F., Daumit, K. E., and Kroll, J. H.: Secondary Organic Aerosol Formation via the Isolation of Individual Reactive Intermediates: Role of Alkoxy Radical Structure, J. Phys. Chem. A, 118, 8807–8816, https://doi.org/10.1021/jp506562r, 2014. a
Chhabra, P. S., Ng, N. L., Canagaratna, M. R., Corrigan, A. L., Russell, L. M., Worsnop, D. R., Flagan, R. C., and Seinfeld, J. H.: Elemental composition and oxidation of chamber organic aerosol, Atmos. Chem. Phys., 11, 8827–8845, https://doi.org/10.5194/acp-11-8827-2011, 2011 a, b
Cox, R. A., Derwent, R. G., and Williams, M. R.: Atmospheric photooxidation reactions. Rates, reactivity, and mechanism for reaction of organic compounds with hydroxyl radicals, Environ. Sci. Technol., 14, 57–61, https://doi.org/10.1021/es60161a007, 1980. a
Ehn, M., Kleist, E., Junninen, H., Petäjä, T., Lönn, G., Schobesberger, S., Dal Maso, M., Trimborn, A., Kulmala, M., Worsnop, D. R., Wahner, A., Wildt, J., and Mentel, Th. F.: Gas phase formation of extremely oxidized pinene reaction products in chamber and ambient air, Atmos. Chem. Phys., 12, 5113–5127, https://doi.org/10.5194/acp-12-5113-2012, 2012. a
Ehn, M., Thornton, J. A., Kleist, E., Sipilä, M., Junninen, H., Pullinen, I., Springer, M., Rubach, F., Tillmann, R., Lee, B., Lopez-Hilfiker, F., Andres, S., Acir, I.-H., Rissanen, M., Jokinen, T., Schobesberger, S., Kangasluoma, J., Kontkanen, J., Nieminen, T., Kurten, T., Nielsen, L. B., Jørgensen, S., Kjaergaard, H. G., Canagaratna, M., Maso, M. D., Berndt, T., Petäjä, T., Wahner, A., Kerminen, V.-M., Kulmala, M., Worsnop, D. R., Wildt, J., and Mentel, T. F.: A large source of low-volatility secondary organic aerosol, Nature, 506, 476–479, 2014. a
Eisele, F. L. and Tanner, D. J.: Measurement of the gas phase concentration of H2SO4 and methane sulfonic acid and estimates of H2SO4 production and loss in the atmosphere, J. Geophys. Res.-Atmos., 98, 9001–9010, https://doi.org/10.1029/93JD00031, 1993. a
Febo, A., Perrino, C., Gherardi, M., and Sparapani, R.: Evaluation of a high-purity and high-stability continuous generation system for nitrous acid, Environ. Sci. Technol., 29, 2390–2395, 1995. a
Finewax, Z., de Gouw, J. A., and Ziemann, P. J.: Identification and Quantification of 4-Nitrocatechol Formed from OH and NO3 Radical-Initiated Reactions of Catechol in Air in the Presence of NOx: Implications for Secondary Organic Aerosol Formation from Biomass Burning, Environ. Sci. Technol., 52, 1981–1989, https://doi.org/10.1021/acs.est.7b05864, 2018. a, b
Gardner, E. P., Sperry, P. D., and Calvert, J. G.: Primary quantum yields of NO2 photodissociation, J. Geophys. Res.-Atmos., 92, 6642–6652, https://doi.org/10.1029/JD092iD06p06642, 1987. a
Huang, Y., Coggon, M. M., Zhao, R., Lignell, H., Bauer, M. U., Flagan, R. C., and Seinfeld, J. H.: The Caltech Photooxidation Flow Tube reactor: design, fluid dynamics and characterization, Atmos. Meas. Tech., 10, 839–867, https://doi.org/10.5194/amt-10-839-2017, 2017. a, b
Krechmer, J. E., Coggon, M. M., Massoli, P., Nguyen, T. B., Crounse, J. D., Hu, W., Day, D. A., Tyndall, G. S., Henze, D. K., Rivera-Rios, J. C., Nowak, J. B., Kimmel, J. R., Mauldin, III, R. L., Stark, H., Jayne, J. T., Sipilä, M., Junninen, H., Clair, J. M. S., Zhang, X., Feiner, P. A., Zhang, L., Miller, D. O., Brune, W. H., Keutsch, F. N., Wennberg, P. O., Seinfeld, J. H., Worsnop, D. R., Jimenez, J. L., and Canagaratna, M. R.: Formation of Low Volatility Organic Compounds and Secondary Organic Aerosol from Isoprene Hydroxyhydroperoxide Low-NO Oxidation, Environ. Sci. Technol., 49, 10330–10339, 2015. a
Lambe, A. T., Ahern, A. T., Williams, L. R., Slowik, J. G., Wong, J. P. S., Abbatt, J. P. D., Brune, W. H., Ng, N. L., Wright, J. P., Croasdale, D. R., Worsnop, D. R., Davidovits, P., and Onasch, T. B.: Characterization of aerosol photooxidation flow reactors: heterogeneous oxidation, secondary organic aerosol formation and cloud condensation nuclei activity measurements, Atmos. Meas. Tech., 4, 445–461, https://doi.org/10.5194/amt-4-445-2011, 2011. a, b
Lambe, A. T., Onasch, T. B., Croasdale, D. R., Wright, J. P., Martin, A. T., Franklin, J. P., Massoli, P., Kroll, J. H., Canagaratna, M. R., Brune, W. H., Worsnop, D. R., and Davidovits, P.: Transitions from Functionalization to Fragmentation Reactions of Laboratory Secondary Organic Aerosol (SOA) Generated from the OH Oxidation of Alkane Precursors, Environ. Sci. Technol., 46, 5430–5437, 2012. a
Lambe, A., Massoli, P., Zhang, X., Canagaratna, M., Nowak, J., Daube, C., Yan, C., Nie, W., Onasch, T., Jayne, J., Kolb, C., Davidovits, P., Worsnop, D., and Brune, W.: Controlled nitric oxide production via O(1D)+N2O reactions for use in oxidation flow reactor studies, Atmos. Meas. Tech., 10, 2283–2298, https://doi.org/10.5194/amt-10-2283-2017, 2017. a, b, c, d, e
Lee, J. D., Whalley, L. K., Heard, D. E., Stone, D., Dunmore, R. E., Hamilton, J. F., Young, D. E., Allan, J. D., Laufs, S., and Kleffmann, J.: Detailed budget analysis of HONO in central London reveals a missing daytime source, Atmos. Chem. Phys., 16, 2747–2764, https://doi.org/10.5194/acp-16-2747-2016, 2016. a
Li, R., Palm, B. B., Ortega, A. M., Hlywiak, J., Hu, W., Peng, Z., Day, D. A., Knote, C., Brune, W. H., De Gouw, J. A., and Jimenez, J. L.: Modeling the Radical Chemistry in an Oxidation Flow Reactor: Radical Formation and Recycling, Sensitivities, and the OH Exposure Estimation Equation, J. Phys. Chem. A, 119, 4418–4432, https://doi.org/10.1021/jp509534k, 2015. a
Liu, P. F., Abdelmalki, N., Hung, H.-M., Wang, Y., Brune, W. H., and Martin, S. T.: Ultraviolet and visible complex refractive indices of secondary organic material produced by photooxidation of the aromatic compounds toluene and m-xylene, Atmos. Chem. Phys., 15, 1435–1446, https://doi.org/10.5194/acp-15-1435-2015, 2015. a
Mao, J., Ren, X., Brune, W. H., Olson, J. R., Crawford, J. H., Fried, A., Huey, L. G., Cohen, R. C., Heikes, B., Singh, H. B., Blake, D. R., Sachse, G. W., Diskin, G. S., Hall, S. R., and Shetter, R. E.: Airborne measurement of OH reactivity during INTEX-B, Atmos. Chem. Phys., 9, 163–173, https://doi.org/10.5194/acp-9-163-2009, 2009. a
Massoli, P., Stark, H., Canagaratna, M. R., Krechmer, J. E., Xu, L., Ng, N. L., Mauldin, R. L., Yan, C., Kimmel, J. R., Misztal, P. K., Jimenez, J. L., Jayne, J. T., and Worsnop, D. R.: Ambient Measurements of Highly Oxidized Gas Phase Molecules during the Southern Oxidant and Aerosol Study (SOAS) 2013, ACS Earth and Space Chemistry, 2, 653–672, https://doi.org/10.1021/acsearthspacechem.8b00028, 2018. a, b, c
Matsunaga, A. and Ziemann, P. J.: Yields of -β-hydroxynitrates, dihydroxynitrates, and trihydroxynitrates formed from OH radical-initiated reactions of 2-methyl-1-alkenes, P. Natl. Acad. Sci. USA, 107, 6664–6669, https://doi.org/10.1073/pnas.0910585107, 2010. a, b
Nielsen, O. J., Sidebottom, H. W., O'Farrell, D. J., Donlon, M., and Treacy, J.: Absolute and relative rate constants for the gas-phase reaction of OH radicals with CH3NO2, CD3NO2 and CH3CH2CH3 at 295 K and 1 atm, Chem. Phys. Lett., 146, 197–203, https://doi.org/10.1016/0009-2614(88)87430-X, 1988. a, b
Nielsen, O. J., Sidebottom, H. W., Donlon, M., and Treacy, J.: Rate constants for the gas-phase reactions of OH radicals and Cl atoms with n-alkyl nitrites at atmospheric pressure and 298 K, Int. J. Chem. Kinet., 23, 1095–1109, https://doi.org/10.1002/kin.550231204, 1991. a, b
Noyes, W. A.: Explanation of the Formation of Alkyl Nitrites in Dilute Solutions; Butyl and Amyl Nitrites, J. Am. Chem. Soc., 55, 3888–3889, https://doi.org/10.1021/ja01336a503, 1933. a
Orlando, J. J. and Tyndall, G. S.: Laboratory studies of organic peroxy radical chemistry: an overview with emphasis on recent issues of atmospheric significance, Chem. Soc. Rev., 41, 6294–6317, https://doi.org/10.1039/C2CS35166H, 2012. a
Peng, Z. and Jimenez, J. L.: Modeling of the chemistry in oxidation flow reactors with high initial NO, Atmos. Chem. Phys., 17, 11991–12010, https://doi.org/10.5194/acp-17-11991-2017, 2017. a, b, c
Peng, Z., Day, D. A., Stark, H., Li, R., Lee-Taylor, J., Palm, B. B., Brune, W. H., and Jimenez, J. L.: HOx radical chemistry in oxidation flow reactors with low-pressure mercury lamps systematically examined by modeling, Atmos. Meas. Tech., 8, 4863–4890, https://doi.org/10.5194/amt-8-4863-2015, 2015. a, b, c, d, e
Peng, Z., Day, D. A., Ortega, A. M., Palm, B. B., Hu, W., Stark, H., Li, R., Tsigaridis, K., Brune, W. H., and Jimenez, J. L.: Non-OH chemistry in oxidation flow reactors for the study of atmospheric chemistry systematically examined by modeling, Atmos. Chem. Phys., 16, 4283–4305, https://doi.org/10.5194/acp-16-4283-2016, 2016. a, b, c
Peng, Z., Palm, B. B., Day, D. A., Talukdar, R. K., Hu, W., Lambe, A. T., Brune, W. H., and Jimenez, J. L.: Model Evaluation of New Techniques for Maintaining High-NO Conditions in Oxidation Flow Reactors for the Study of OH-Initiated Atmospheric Chemistry, ACS Earth and Space Chemistry, 2, 72–86, https://doi.org/10.1021/acsearthspacechem.7b00070, 2018. a, b
Raff, J. D. and Finlayson-Pitts, B. J.: Hydroxyl Radical Quantum Yields from Isopropyl Nitrite Photolysis in Air, Environ. Sci. Technol., 44, 8150–8155, https://doi.org/10.1021/es102218d, 2010. a, b, c, d, e, f, g
Raff, J. D., Stevens, P. S., and Hites, R. A.: Relative Rate and Product Studies of the OH-Acetone Reaction, J. Phys. Chem. A, 109, 4728–4735, https://doi.org/10.1021/jp0501547, 2005. a, b
Shuping, L., Chwee, T. S., and Fan, W. Y.: FTIR studies on the gas phase laser-induced decomposition of CF3CH2ONO, Chem. Phys., 320, 259–266, https://doi.org/10.1016/j.chemphys.2005.07.020, 2006. a, b
Tokuhashi, K., Nagai, H., Takahashi, A., Kaise, M., Kondo, S., Sekiya, A., Takahashi, M., Gotoh, Y., and Suga, A.: Measurement of the OH Reaction Rate Constants for CF3CH2OH, CF3CF2CH2OH, and CF3CH(OH)CF3, J. Phys. Chem. A, 103, 2664–2672, https://doi.org/10.1021/jp983961x, 1999. a
Wang, L. and Zu, L.: Photodissociation dynamics of dinitrite at 355 nm: initiation of a reactive pathway, Phys. Chem. Chem. Phys., 18, 25249–25256, https://doi.org/10.1039/C6CP03049A, 2016. a
Yan, C., Nie, W., Äijälä, M., Rissanen, M. P., Canagaratna, M. R., Massoli, P., Junninen, H., Jokinen, T., Sarnela, N., Häme, S. A. K., Schobesberger, S., Canonaco, F., Yao, L., Prévôt, A. S. H., Petäjä, T., Kulmala, M., Sipilä, M., Worsnop, D. R., and Ehn, M.: Source characterization of highly oxidized multifunctional compounds in a boreal forest environment using positive matrix factorization, Atmos. Chem. Phys., 16, 12715–12731, https://doi.org/10.5194/acp-16-12715-2016, 2016. a, b
Ye, J., Abbatt, J. P. D., and Chan, A. W. H.: Novel pathway of SO2 oxidation in the atmosphere: reactions with monoterpene ozonolysis intermediates and secondary organic aerosol, Atmos. Chem. Phys., 18, 5549–5565, https://doi.org/10.5194/acp-18-5549-2018, 2018. a