the Creative Commons Attribution 4.0 License.
the Creative Commons Attribution 4.0 License.
Validation of Solar Occultation for Ice Experiment (SOFIE) nitric oxide measurements
Mark E. Hervig
Benjamin T. Marshall
Scott M. Bailey
David E. Siskind
James M. Russell III
Charles G. Bardeen
Kaley A. Walker
Bernd Funke
Nitric oxide (NO) measurements from the Solar Occultation for Ice Experiment (SOFIE) are validated through detailed uncertainty analysis and comparisons with independent observations. SOFIE was compared with coincident satellite measurements from the Atmospheric Chemistry Experiment (ACE) – Fourier Transform Spectrometer (FTS) instrument and the Michelson Interferometer for Passive Atmospheric Sounding (MIPAS) instrument. The comparisons indicate mean differences of less than ∼50 % for altitudes from roughly 50 to 105 km for SOFIE spacecraft sunrise and 50 to 140 km for SOFIE sunsets. Comparisons of NO time series show a high degree of correlation between SOFIE and both ACE and MIPAS for altitudes below ∼130 km, indicating that measured NO variability in time is robust. SOFIE uncertainties increase below ∼80 km due to interfering H2O absorption and signal correction uncertainties, which are larger for spacecraft sunrise compared to sunset. These errors are sufficiently large in sunrises that reliable NO measurements are infrequent below ∼80 km.
The Solar Occultation for Ice Experiment (SOFIE) has measured nitric oxide (NO) from the Aeronomy of Ice in the Mesosphere (AIM) satellite since May 2007. SOFIE NO measurements have been the topic of numerous science investigations, including studies of thermosphere–stratosphere coupling (Bailey et al., 2014; Siskind et al., 2015; Hendrickx et al., 2018), effects of the 27 d solar rotation (Hendrickx et al., 2015), and the roles of dynamics and chemistry in diurnal variability (Siskind et al., 2019). SOFIE NO observations have also been used to determine the importance of changes in geomagnetic activity and solar radiation (Hendrickx et al., 2017), and to characterize the response of NO to electron precipitation (Smith-Johnsen et al., 2017, 2018; Newnham et al., 2018). SOFIE version 1.3 (V1.3) NO measurements are validated here through uncertainty analysis and comparisons with correlative measurements.
Coincident satellite measurements are from the Atmospheric Chemistry Experiment (ACE) – Fourier Transform Spectrometer (FTS) instrument and the Michelson Interferometer for Passive Atmospheric Sounding (MIPAS) instrument. The ACE-FTS instrument has used solar occultation to measure more than 30 trace gases and over 20 isotopologues from 2004 to present (Bernath et al., 2005). ACE NO measurements span ∼6 to 107 km altitude with a vertical resolution of ∼3.5 km, and retrievals are reported at the oversampled vertical interval of 1 km. This work used version 3.5 NO retrievals, which are based on measurements at 5.056–6.063 µm wavelengths sampled with 39 micro-windows (Kerzenmacher et al., 2008; Sheese et al., 2016). The main interfering species in this region is O3, with smaller contributions from CO2, H2O, and COF2. MIPAS operated on board the Envisat satellite during 2005–2012 in a sun-synchronous orbit with Equator crossings at 10:00 and 22:00 local time. MIPAS measured limb emission spectra covering the 4.15 to 14.6 µm wavelengths using a Fourier transform spectrometer. MIPAS primarily observed altitudes from 6 to 68 km, with periodic (1 day in 10) observations extending into the thermosphere (∼150 km). The MIPAS NO product is reported at 1 km intervals, but has a vertical resolution of 5–15 km, except within the upper mesosphere outside polar winter where the resolution degrades up to 20 km. NO emission measured at 5.3 µm was used to retrieve NO volume mixing ratios (VMRs) (Funke et al., 2005; Bermejo-Pantaléon et al., 2011). The mixing ratios were converted to number densities (NDs, molecules cm−3) using temperatures derived from 15 µm emissions below 100 km and from 5.3 µm above (jointly retrieved with NO). This work uses data version V5r_NOwT_622. Bender et al. (2015) report NO measurement comparisons including ACE, MIPAS, the SCanning Imaging Absorption spectroMeter for Atmospheric CHartographY (SCIAMACHY) instrument, and the sub-millimeter radiometer (SMR) satellite instrument. They found mean differences of 30 % to 100 %, depending on latitude, season, and altitude. While this work does not include SCIAMACHY or SMR results, the agreement of these observations with SOFIE can be inferred through inspection of Bender et al. (2015).
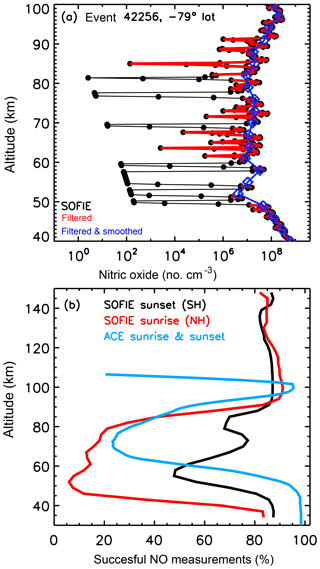
Figure 1(a) Example SOFIE NO retrieval from 12 March 2011, showing the original profile, the profile with erroneous values filtered (see text), and the filtered profile smoothed to 3 km spacing. (b) The percentage of successful NO retrievals vs. altitude for SOFIE sunrise and sunset observations. ACE results are similar for sunrise and sunset, and are shown here for all measurements combined. Note that MIPAS only reports successful retrievals.
SOFIE uses solar occultation to measure vertical profiles of temperature, five gaseous species (O3, H2O, CO2, CH4, and NO), polar mesospheric clouds (PMCs), and meteoric smoke (Gordley et al., 2009; Hervig et al., 2009). Spacecraft sunset measurements always occurred in the Southern Hemisphere (SH), with sunrise in the Northern Hemisphere (NH), for the measurements during 2007–2017 used here. In late 2018 this changed with sunsets switching to the NH. NO measurements are accomplished using broadband (∼2 % filter width) measurements centered at the 5.32 μm wavelength. Gomez-Ramirez et al. (2013) provide a detailed description of the SOFIE NO measurements, signal corrections, and retrievals. The photoconductive detector experiences a response oscillation due to the thermal shock of transitioning the field of view (FOV) from dark space to the sun, at the start of each observation. This thermal response artifact was successfully corrected in ground processing, as discussed in detail by Gomez-Ramirez et al. (2013). The subsequent NO retrievals are conducted in terms of VMR, for altitudes of ∼30 to 149 km. The SOFIE FOV subtends ∼1.5 km vertically, but retrieved NO has a coarser effective vertical resolution (∼2.5 km) due to measurement noise and retrieval errors. Gomez-Ramirez et al. compared SOFIE version 1.2 NO profiles to coincident ACE measurements for altitudes from 87 to 105 km, showing negligible differences for SH SOFIE measurements (spacecraft sunset) and ∼18 % differences in the NH (sunrise). SOFIE retrieves temperatures (T) from 17 to 100 km altitude, and T values from the Mass Spectrometer Incoherent Scatter (MSIS) model are used above 100 km (see Marshall et al., 2011). Because VMR requires knowledge of air density (and thus T), the retrieved VMRs likely contain large errors above 100 km due to MSIS T uncertainties. SOFIE VMRs are thus converted to ND in post-processing, using the appropriate T∕P values (SOFIE or MSIS). NO ND has the advantage of being independent of T, and thus is recommended for use above 100 km (available online).
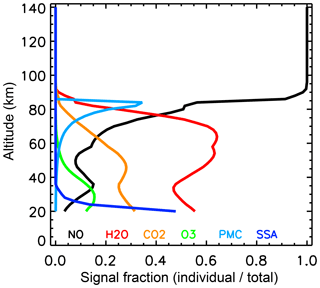
Figure 2Relative contribution of various gases, PMCs (a layer from 81 to 87 km, centered at 84 km), and stratospheric sulfate aerosols (SSAs), in the SOFIE 5.32 µm band used to measure NO. The results were simulated using average conditions near 66∘ S latitude in summer.
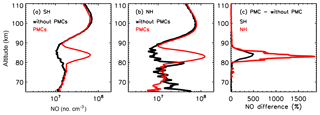
Figure 3Comparison of average NO profiles during polar summer (−30 to 60 d from solstice, during 2007 to 2013) with and without PMCs present, for the (a) SH and (b) NH. (c) Difference in average NO ND for the profiles with and without PMCs, for both hemispheres.
SOFIE NO profiles contain values that indicate missing data (−1024), which imply that the signal was either not measured or contained artifacts that rendered it unusable. There are also values which indicate a good measurement, but an unsuccessful retrieval (10−14 in VMR). These instances correspond to cases where the simulated signal considering interfering gases was greater than the observed signal. These situations clearly indicate errors in the interference, and/or the measured signals. In V1.3, the unsuccessful retrievals were included in vertical smoothing of the NO VMR profile prior to output, which resulted in large errors in the two points above and below the unsuccessful layer. These values were filtered (set to the missing data value of −1024) in post-processing, along with points associated with PMCs, which have erroneously increased NO (see details below). PMCs are clearly identified in SOFIE profiles using multiwavelength observations as described in Hervig et al. (2009). The filtered profiles were then smoothed by box-car averaging on a 3 km vertical grid (see Fig. 1a). The filtered and smoothed V1.3 NO profiles are available (as a mission data file, SOFIE_L2m_2007135_2017026_NO_den_filt_sm_01.3.nc) on the SOFIE web page (http://sofie.gats-inc.com/sofie/index.php, last access: 29 May 2019).
Figure 1b shows the fraction of successful SOFIE NO measurements as a function of altitude for SOFIE spacecraft sunrise and sunset. Between ∼45 and 80 km, sunrises are successful less than 20 % of the time, while sunsets are successful more than 50 % of the time. This is comparable to ACE, which has a similar fraction of retrieval success at these heights, although no appreciable difference between spacecraft sunrise and sunset (Fig. 1b). MIPAS has very few unsuccessful NO retrievals (< 3 %), and only reports the valid results. The often low fraction of good NO results below ∼80 km should be borne in mind when using the SOFIE (and ACE) NO products.
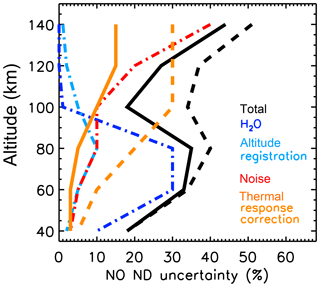
Figure 4SOFIE NO uncertainties vs. height. Results are shown for the four largest error mechanisms (by color), and for the total (random plus systematic) uncertainty. Values are as given in Table 1. Dashed curves represent sunrise and solid curves indicate sunset results. Dotted–dashed lines apply to both sunrise and sunset.
2.1 Uncertainty analysis
The SOFIE NO uncertainty analysis presented here is an extension of the analysis described in Gomez-Ramirez et al. (2013). Retrieved NO error mechanisms can be categorized as due to either the SOFIE measurements or the signal simulations used in the retrievals. Simulation uncertainties include modeling errors, the representation of instrument characteristics (e.g., relative spectral response, RSR), and the description of interfering gases and aerosols.
It is useful to first understand the relative signal contributions from interfering gases and aerosols in the SOFIE NO bandpass, as these can be the largest error sources. Figure 2 shows calculated signals considering polar summer conditions. The signal is due entirely to NO above ∼85 km, with the main interference at lower altitudes coming from H2O, CO2, and O3. H2O interference is removed using SOFIE H2O measurements, which cover ∼20 to 95 km altitude and have uncertainties of ∼15 % (Rong et al., 2010). CO2 is described using model results (Garcia et al., 2007), which have uncertainties of < 5 %. O3 interference is removed using SOFIE O3 retrievals that span ∼55–110 km with uncertainties of < 10 % (Smith et al., 2013). Climatological O3 is used below 55 km, which can have large uncertainties. Fortunately the O3 contribution to the SOFIE NO signal is small at these heights (Fig. 2). The upcoming SOFIE version (V1.4) will use new SOFIE O3 retrievals that extend down to ∼15 km altitude. Interference from stratospheric sulfate aerosols (SSAs) is negligible above ∼30 km, where NO is retrieved.
PMCs, which appear during polar summer, can contribute a large fraction of the total SOFIE NO signal at PMC heights (∼80–90 km). The example in Fig. 2 is for a moderate PMC, which contributes ∼50 % of the total signal near 84 km. This example also illustrates that the PMC signal can extend from 20 to 30 km below the PMC layer because the tangent path view includes a contribution from altitudes above. PMC interference is not corrected during the retrievals in V1.3 (it will be in V1.4). As an interim step, the portion of NO profiles contaminated by PMCs (75–89 km when PMCs were present) was filtered (i.e., set to missing) in existing V1.3 profiles, for the new V1.3 SOFIE data file described above. The artificial increase in retrieved NO when PMCs are present is illustrated by comparing concurrent profiles with and without PMCs present, where the contamination is obvious at ∼80 to 90 km (Fig. 3a and b). NO can be erroneously increased by factors of 10 or more by PMC contamination (Fig. 3c), and it is thus imperative to not use NO when PMCs are present. Note that this effect is typically worse in the NH where PMCs typically have greater volume density (e.g., Hervig et al., 2009). It is therefore recommended to either use the new V.13 file or ensure that PMC profiles are screened using the reported SOFIE PMC observations (Hervig et al., 2009). Because PMC-induced errors occur only during polar summer and not necessarily in every profile, PMC-induced NO errors are not included in the total uncertainty estimates below.
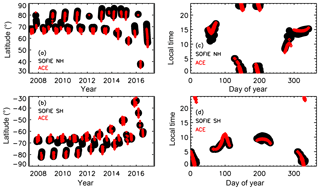
Figure 5Summary of SOFIE–ACE coincidences. Measurement latitude vs. year in the (a) NH (SOFIE sunrise; local sunset) and (b) SH (SOFIE sunset; local sunrise). Measurement LT versus day of year in the (c) NH and (d) SH. There were 2968 coincidences in the NH with average separations of 0.7 h, 1.7∘ latitude, and 8.0∘ longitude. There were 2473 coincidences in the SH with average separations of 0.6 h, 2.3∘ latitude, and 8.0∘ longitude.
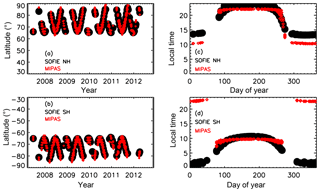
Figure 6Summary of SOFIE–MIPAS coincidences. Measurement latitude vs. year in the (a) NH (SOFIE sunrise; local sunset) and (b) SH (SOFIE sunset; local sunrise). Measurement LT versus day of year in the (c) NH and (d) SH. The NH had 894 coincidences with average separations of 0.9 h, 1.3∘ latitude, and 9.6∘ longitude. The SH had 985 coincidences with average separations of 0.8 h, 1.4∘ latitude, and 8.7∘ longitude. Note that the MIPAS solar zenith angles ranged from 82 to 95∘ for the SH SOFIE comparisons and from 84 to 94∘ for the NH comparisons, which is near local sunrise (or sunset).
The main error sources in retrieved NO are summarized in Table 1 for a range of altitudes. The largest measurement errors are due to noise and the thermal response correction, which is larger for sunrise observations than in sunsets (see Gomez-Ramirez et al., 2013, for details). The remaining errors are in the category of measurement interpretation as encompassed by model simulations of the SOFIE signal. Errors in the interfering gases (measured or modeled) were taken from the relevant publications, as discussed above. Each error mechanism was imposed in the V1.3 SOFIE retrieval algorithm to determine the uncertainty induced in retrieved NO ND. The V1.3 SOFIE forward model uses HITRAN 2004 line parameters, which are estimated to have ∼7 % systematic uncertainties for NO near 5.32 µm. Altitude registration errors are estimated to be ∼100 m (Marshall et al., 2011). While errors in temperature propagate directly into NO VMR, they do not affect ND, which is a strong argument for using ND in the thermosphere where SOFIE does not measure temperatures. The uncertainties in retrieved NO are summarized at key altitudes in Table 1 for each mechanism, along with the total uncertainty. The largest four error sources are shown versus height in Fig. 4, where it is clear that water vapor interference errors dominate below ∼90 km, for both sunrise and sunset. For sunset measurements NO ND errors are dominated by noise above ∼100 km. Sunrise NO errors are dominated by the thermal response correction above ∼90 km, as discussed by Gomez-Ramirez et al. (2013).
Table 1Uncertainty (%) in retrieved NO number density versus altitude due to various random (R) and systematic (S) error mechanisms. Two values are listed when they were different for sunrise/sunset.
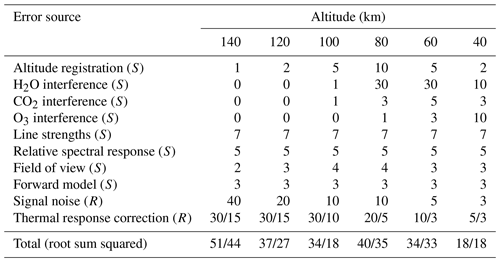
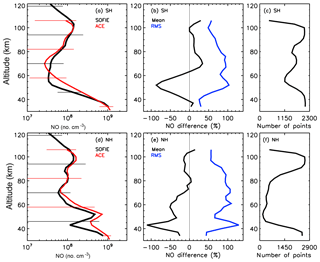
Figure 7Comparison of SOFIE and ACE NO number density profiles, for the coincidences shown in Fig. 5. Comparisons in the SH (SOFIE spacecraft sunset; local sunrise) as (a) average profiles, (b) mean and rms differences, and (c) number of points in the comparison at each altitude. Comparisons in the NH (SOFIE sunrise; local sunset) as (d) average profiles, (e) mean and rms differences, and (f) number of points in the comparison. Horizontal lines on the average NO profiles indicate standard deviations.
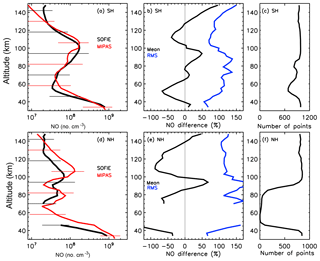
Figure 8Comparison of SOFIE and MIPAS NO vertical profiles, for the coincidences shown in Fig. 6. Comparisons in the SH (SOFIE spacecraft sunset; local sunrise) as (a) average profiles, (b) mean and rms differences, and (c) number of points in the comparison at each altitude. Comparisons in the NH (SOFIE sunrise) as (d) average profiles, (e) mean and rms differences, and (f) number of points in the comparison. Mean NO and NO differences are only shown when there were more than 30 points in the comparison. Horizontal lines on the average profiles indicate standard deviations.
Time separation is important in the measurement comparisons because NO abundance can have a strong diurnal dependence, with more than 10 % per hour changes in ND near local sunrise or sunset, depending on altitude, latitude, and season (e.g., Siskind et al., 2019). This effect can be managed in the comparisons by (1) keeping the measurement separations as small as possible or (2) applying a modeled diurnal correction to measurements that are separated in time. Removing diurnal dependence using a model description was determined to induce unacceptably large uncertainties, in part because the model results are dependent on transport as well as photochemistry. The first approach was therefore adopted here, finding coincident measurement pairs for maximum separations of 2 h UT, 4∘ latitude, and 20∘ longitude. Note that 20∘ longitude corresponds to ∼1.3 h in local time. These coincidence criteria insured that average measurement separations were less than 1 h. Note that when this work mentions sunrise or sunset (for SOFIE and/or ACE) it always refers to the view from orbit. SOFIE spacecraft sunset is always Earth sunrise (and vice versa), due to the retrograde polar orbit. ACE can have varying correspondence between sunset or sunrise as viewed from orbit or Earth, and thus it is important to track LT in the comparisons. Finally, the comparisons shown below include SOFIE profiles with PMCs, and the results do not change when excluding profiles with PMCs. This is because SOFIE NO results used here have been filtered at PMC heights when PMCs were present (see Sect. 2), and because the MIPAS and ACE NO measurements are not affected by PMC contamination (Funke et al., 2005; Kerzenmacher et al., 2008). SOFIE–ACE coincidences are illustrated in Fig. 5 including a summary of the coincidence statistics, and SOFIE–MIPAS coincidences are shown in Fig. 6.
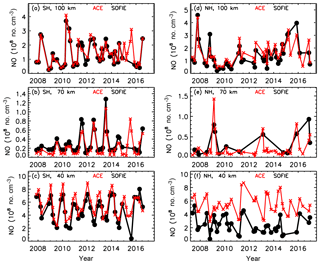
Figure 10Comparison of SOFIE and ACE NO time series as monthly zonal means, for the coincidences shown in Fig. 5. SH results are shown for (a) 100 km, (b) 70 km, and (c) 40 km altitude. NH results are shown for (d) 100 km, (e) 70 km, and (f) 40 km altitude.
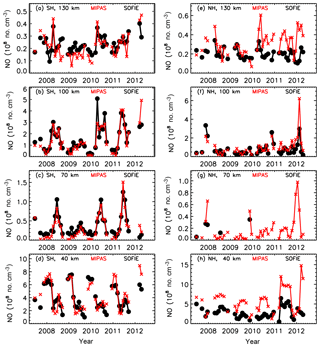
Figure 11Comparison of SOFIE and MIPAS NO time series as monthly zonal means, for the coincidences shown in Fig. 6. SH results are shown for (a) 130 km, (b) 100 km, (c) 70 km, and (d) 40 km altitude. NH results are shown for (e) 130 km, (f) 100 km, (g) 70 km, and (h) 40 km altitude.
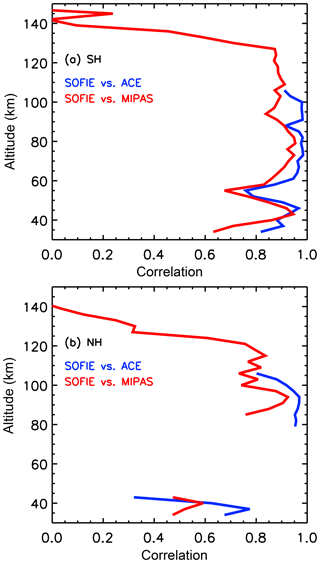
Figure 12SOFIE–ACE and SOFIE–MIPAS correlation coefficients for comparison of monthly mean NO time series (as in Figs. 10 and 11). Results are shown versus height in the (a) SH and (b) NH. Note that results are only shown when more than half of the monthly mean points were valid for both instruments, which was primarily a concern for the NH below ∼80 km. Where results are shown, there were typically more than 40 points in the comparison, for which the 95 % significance level is a correlation coefficient of ∼0.3 or greater.
SOFIE, ACE, and MIPAS have effective vertical resolution of roughly 2.5, 3.5, and > 5 km, respectively, despite differences in the FOVs and reported vertical spacing. For the comparisons shown here, the ACE and MIPAS results were interpolated to the SOFIE 3 km vertical scale, with no additional smoothing applied. Note that the results below are essentially unchanged if the NO profiles are interpolated to either the ACE or MIPAS vertical scales instead. Comparison of NO vertical profiles is shown in Fig. 7 for SOFIE vs. ACE, and in Fig. 8 for SOFIE vs. MIPAS. The comparisons are shown as average profiles, mean and root-mean-square (rms; i.e., random plus systematic) differences, and the number of points used in the comparison at each altitude. SOFIE–ACE mean differences are within 50 % for altitudes from ∼50 to 107 km in both the SH and NH (Fig. 7b and d). SOFIE–MIPAS differences are within ∼50 % for ∼55–140 km in the SH (Fig. 8). The NH MIPAS comparison indicates larger differences than in the SH, but with some similarities in the dependence on height (e.g., SOFIE > MIPAS near 140 km). The SOFIE–MIPAS comparison above ∼130 km in the SH (∼140 km in the NH) indicates an increasing bias with SOFIE suggesting higher NO. Siskind et al. (2019) noted a similar bias from indirect comparisons of SOFIE with the Student Nitric Oxide Explorer (SNOE) results. Note that the number of measurement pairs used in the comparisons is fairly consistent in height for the SH (SOFIE sunset), in both the ACE and MIPAS comparisons (Figs. 7c and 8c). The NH (SOFIE sunrise) comparisons, however, have very few valid measurements between ∼50 and 80 km (Figs. 7f and 8f), due to the lack of good SOFIE (and sometimes ACE) results at these altitudes for sunrise.
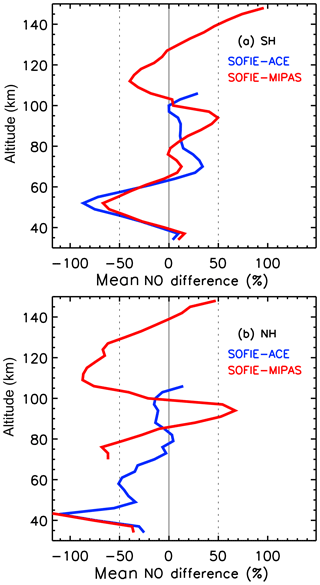
Comparing the SOFIE–ACE and SOFIE–MIPAS mean differences shows notable similarities in both the height dependence and magnitude of the differences, especially in the SH (Fig. 9a). In particular, SOFIE NO is consistently ∼50 % or more lower than ACE and MIPAS near the stratopause (∼50 km) in both the SH and NH (Fig. 9). These similarities suggest the presence of a systematic error in SOFIE, although a potential error mechanism has not yet been identified. It should be noted that diurnal variations in NO, which are strongest in the stratosphere and thermosphere, can determine that occultation measurements are viewing through strong spatial gradients along the tangent path. The impact of such gradients has not yet been quantified, but could appear as a systematic bias in retrieved NO. The measurement coincidences were close enough in LT that diurnal variations should be a small part of the comparison differences. It is rather the increased SOFIE errors for sunrise (NH) that explain differences in the SOFIE–ACE and SOFIE–MIPAS comparisons between the NH and SH. Note that the comparisons in the NH additionally indicate that MIPAS NO is greater than ACE, particularly below ∼90 km (Fig. 9b), a difference that was also reported by Bender et al. (2015).
Time series of monthly zonal mean NO at selected altitudes are compared for the SOFIE–ACE coincidences in Fig. 10, and for the SOFIE–MIPAS coincidences in Fig. 11. These time series indicate good agreement on the timing and magnitude of NO variations, despite systematic differences at certain altitudes. To better quantify the agreement concerning time variations, linear correlation coefficients were determined for each height in the SOFIE–ACE and SOFIE–MIPAS comparisons. Results in the SH (Fig. 12a) show a strong correlation between SOFIE and ACE or MIPAS for altitudes below ∼130 km. Results in the NH (Fig. 12b) indicate a significant correlation between SOFIE and ACE for 90–107 km. The NH SOFIE–MIPAS comparisons also indicate a high correlation for ∼90–110 km. Note that the correlations were not determined in the NH for ∼50 to 85 km because there were very few SOFIE NO retrievals (e.g., Figs. 10e and 11g).
Comparisons of SOFIE NO with coincident measurements from ACE and MIPAS indicate mean differences of less than ∼50 % for altitudes from roughly 50 to 105 km for SOFIE spacecraft sunrise, and ∼50 to 140 km for SOFIE sunsets. Comparisons of NO time series show significant correlation between SOFIE and either ACE or MIPAS for altitudes of ∼40–130 km in the SH, indicating that measured NO variability is robust. Correlations were significant in the NH for ∼90 to 130 km, but not at lower heights due to the sparse SOFIE results in that altitude range. SOFIE uncertainties increase below ∼85 km due primarily to interfering H2O absorption and signal correction errors. These effects are sufficiently large in SOFIE sunrise measurements that retrieved NO is only reliable below ∼80 km during enhancement events (in < 20 % of the data), such as downward transport due to a sudden stratospheric warming (e.g., Bailey et al., 2014). SOFIE sunset signals have lower signal correction errors, and the retrieved NO is reliable in more than half of the measurements below 80 km. SOFIE NO should not be used when PMCs are present due to the often extreme contamination, and these instances were filtered (i.e., flagged as missing) in the latest SOFIE V1.3 NO product, which is available online.
SOFIE data are available online at http://sofie.gats-inc.com/sofie/index.php (last access: 29 May 2019). ACE data are available online at https://databace.scisat.ca/ (last access: 29 May 2019). MIPAS data are available online at http://share.lsdf.kit.edu/imk/asf/sat/mipas-export/ (last access: 29 May 2019).
The authors declare that they have no conflict of interest.
This work was funded by the AIM mission through NASA Small Explorer contract NAS5-03132, and through NASA Heliophysics Guest Investigator project 80NSSC19K0281 “Quantifying Drivers of Nitric Oxide Variability in the MLT Using SOFIE, WACCM, and DART”. ACE is funded by the Canadian Space Agency with Peter Bernath (University of Waterloo and Old Dominion University) as the mission scientist.
This research has been supported by NASA (grant no. NAS5-03132, Heliophysics Guest Investigator project 80NSSC19K0281).
This paper was edited by Markus Rapp and reviewed by Martin Friedrich and one anonymous referee.
Bailey, S. M., Thurairajah, B., Randall, C. E., Holt, L., Siskind, D. E., Harvey, V. L., Venkataramani, K., Hervig, M. E., Rong, P., and Russell III, J. M.: A multi tracer analysis of thermosphere to stratosphere descent triggered by the 2013 Stratospheric Sudden Warming, Geophys. Res. Lett., 41, 5216–5222, https://doi.org/10.1002/2014GL059860, 2014.
Bender, S., Sinnhuber, M., von Clarmann, T., Stiller, G., Funke, B., López-Puertas, M., Urban, J., Pérot, K., Walker, K. A., and Burrows, J. P.: Comparison of nitric oxide measurements in the mesosphere and lower thermosphere from ACE-FTS, MIPAS, SCIAMACHY, and SMR, Atmos. Meas. Tech., 8, 4171–4195, https://doi.org/10.5194/amt-8-4171-2015, 2015.
Bermejo-Pantaleón, D., Funke, B., López-Puertas, M., García-Comas, M., Stiller, G. P., von Clarmann, T., Linden, A., Grabowski, U., Höpfner, M., Kiefer, M., Glatthor, N., Kellmann, S., and Lu, G.: Global observations of thermospheric temperature and nitric oxide from MIPAS spectra at 5.3 µm, J. Geophys. Res., 116, A10313, https://doi.org/10.1029/2011JA016752, 2011.
Bernath, P.: Atmospheric Chemistry Experiment (ACE): Mission Overview, Fourier Transform Spectroscopy/ Hyperspectral Imaging and Sounding of the Environment, 24–27, https://doi.org/10.1364/FTS.2005.JMA3, 2005.
Funke, B., Stiller, G. P., Fischer, H., Glatthor, N., Grabowski, U., Hopfner, M., Kellmann, S., Kiefer, M., Linden, A., Mengistu Tsidu, G., Milz, M., Steck, T., and Wang, D. Y.:, Retrieval of stratospheric NOx from 5.3 and 6.2 µm nonlocal thermodynamic equilibrium emissions measured by Michelson Interferometer for Passive Atmospheric Sounding (MIPAS) on Envisat, J. Geophys. Res., 110, D09302, https://doi.org/10.1029/2004JD005225, 2005.
Garcia, R. R., Marsh, D. R., Kinnison, D. E., Boville, B. A., and Sassi, F.: Simulations of secular trends in the middle atmosphere, 1950–2003, J. Geophys. Res., 112, D09301, https://doi.org/10.1029/2006JD007485, 2007.
Gomez-Ramirez, D., McNabb, J. W. C., Russell III, J. M., Hervig, M. E., Deaver, L. E., Paxton, G., and Bernath, P. F.: Empirical correction of thermal responses in the SOFIE nitric oxide measurements and initial data validation results, Appl. Optics, 52, 2950–2959, 2013.
Gordley, L. L., Hervig, M., Fish, C., Russell III, J. M., Bailey, S., Cook, J., Hansen, S., Shumway, A., Paxton, G., Deaver, L., Marshall, T., Burton, J., Magill, B., Brown, C., Thompson, E., and Kemp, J.: The Solar Occultation For Ice Experiment (SOFIE), J. Atmos. Sol.-Terr. Phy., 71, 300–315, https://doi.org/10.1016/j.jastp.2008.07.012, 2009.
Hendrickx, K., Megner, L., Gumbel, J., Siskind, D. E., Orsolini, Y. J., Nesse Tyssøy, H., and Hervig, M.: Observation of 27 day solar cycles in the production and mesospheric descent of EPP-produced NO, J. Geophys. Res.-Space, 120, 8978–8988, https://doi.org/10.1002/2015JA021441, 2015.
Hendrickx, K., Megner, L., Marsh, D., Gumbel, J., Strandberg, R., and Martinsson, F.: Relative Importance of Nitric Oxide Physical Drivers in the Lower Thermosphere, Geophys. Res. Lett., 44, 10081–10087, https://doi.org/10.1002/2017GL074786, 2017.
Hendrickx, K., Megner, L., Marsh, D. R., and Smith-Johnsen, C.: Production and transport mechanisms of NO in the polar upper mesosphere and lower thermosphere in observations and models, Atmos. Chem. Phys., 18, 9075–9089, https://doi.org/10.5194/acp-18-9075-2018, 2018.
Hervig, M. E., Gordley, L. L., Stevens, M., Russell III, J. M., Bailey, S., and Baumgarten, G.: Interpretation of SOFIE PMC measurements: Cloud identification and derivation of mass density, particle shape, and particle size, J. Atmos. Sol.-Terr. Phy., 71, 316–330, https://doi.org/10.1016/j.jastp.2008.07.009, 2009.
Kerzenmacher, T., Wolff, M. A., Strong, K., Dupuy, E., Walker, K. A., Amekudzi, L. K., Batchelor, R. L., Bernath, P. F., Berthet, G., Blumenstock, T., Boone, C. D., Bramstedt, K., Brogniez, C., Brohede, S., Burrows, J. P., Catoire, V., Dodion, J., Drummond, J. R., Dufour, D. G., Funke, B., Fussen, D., Goutail, F., Griffith, D. W. T., Haley, C. S., Hendrick, F., Höpfner, M., Huret, N., Jones, N., Kar, J., Kramer, I., Llewellyn, E. J., López-Puertas, M., Manney, G., McElroy, C. T., McLinden, C. A., Melo, S., Mikuteit, S., Murtagh, D., Nichitiu, F., Notholt, J., Nowlan, C., Piccolo, C., Pommereau, J.-P., Randall, C., Raspollini, P., Ridolfi, M., Richter, A., Schneider, M., Schrems, O., Silicani, M., Stiller, G. P., Taylor, J., Tétard, C., Toohey, M., Vanhellemont, F., Warneke, T., Zawodny, J. M., and Zou, J.: Validation of NO2 and NO from the Atmospheric Chemistry Experiment (ACE), Atmos. Chem. Phys., 8, 5801–5841, https://doi.org/10.5194/acp-8-5801-2008, 2008.
Marshall, B. T., Deaver, L. E., Thompson, R. E., Gordley, L. L., McHugh, M. J., Hervig, M. E., and Russell III, J. M.: Retrieval of temperature and pressure using broadband solar occultation: SOFIE approach and results, Atmos. Meas. Tech., 4, 893–907, https://doi.org/10.5194/amt-4-893-2011, 2011.
Newnham, D. A., Clilverd, M. A., Rodger, C. J., Hendrickx, K., Megner, L., Kavanagh, A. J., Seppälä, A., Verronen, P. T., Andersson, M. E., Marsh, D. R., Kovács, T., Feng, W., and Plane, J. M. C.: Observations and modeling of increased nitric oxide in the Antarctic polar middle atmosphere associated with geomagnetic storm-driven energetic electron precipitation, J. Geophys. Res.-Space, 123, 6009–6025, https://doi.org/10.1029/2018JA025507, 2018.
Rong, P., Russell III, J. M., Gordley, L. L., Hervig, M. E., Deaver, L., Siskind, D., Bernath, P. F., and Walker, K. A.: Validation of v1.022 mesospheric water vapor observed by the SOFIE instrument onboard the AIM satellite, J. Geophys. Res., 115, D24314, https://doi.org/10.1029/2010JD014269, 2010.
Sheese, P. E., Walker, K. A., Boone, C. D., McLinden, C. A., Bernath, P. F., Bourassa, A. E., Burrows, J. P., Degenstein, D. A., Funke, B., Fussen, D., Manney, G. L., McElroy, C. T., Murtagh, D., Randall, C. E., Raspollini, P., Rozanov, A., Russell III, J. M., Suzuki, M., Shiotani, M., Urban, J., von Clarmann, T., and Zawodny, J. M.: Validation of ACE-FTS version 3.5 NOy species profiles using correlative satellite measurements, Atmos. Meas. Tech., 9, 5781–5810, https://doi.org/10.5194/amt-9-5781-2016, 2016.
Siskind, D. E., Sassi, F., Randall, C. E., Harvey, V. L., Hervig, M. E., Bailey, S. M., and Russell III, J. M.: Is a high-altitude meteorological analysis necessary to simulate thermosphere-stratosphere coupling?, Geophys. Res. Lett., 42, 8225–8230, https://doi.org/10.1002/2015GL065838, 2015.
Siskind, D. E., Jones Jr., M., Drob, D. P., McCormack, J. P., Hervig, M. E., Marsh, D. R., Mlynczak, M. G., Bailey, S. M., Maute, A., and Mitchell, N. J.: On the relative roles of dynamics and chemistry governing the abundance and diurnal variation of low-latitude thermospheric nitric oxide, Ann. Geophys., 37, 37–48, https://doi.org/10.5194/angeo-37-37-2019, 2019.
Smith, A. K., Harvey, V. L., Mlynczak, M. G., Funke, B., Garcia-Comas, M., Hervig, M., Kaufmann, M., Kyrola, E., Lopez-Puertas, M., McDade, I., Randall, C. E., Russell III, J. M., Sheese, P. E., Shiotani, M., Skinner, W. R., Suzuki, M., and Walker, K. A.: Satellite observations of ozone in the upper atmosphere, J. Geophys. Res., 118, 5803–5821, https://doi.org/10.1002/jgrd.50445, 2013.
Smith-Johnsen, C., Nesse Tyssøy, H., Hendrickx, K., Orsolini, Y., Kishore Kumar, G., Ødegaard, L.-K. G., Sandanger, M. I., Stordal, F., and Megner, L.: Direct and indirect electron precipitation effect on nitric oxide in the polar middle atmosphere, using a full-range energy spectrum, J. Geophys. Res.-Space, 122, 8679–8693, https://doi.org/10.1002/2017JA024364, 2017.
Smith-Johnsen, C., Marsh, D. R., Orsolini, Y., Nesse Tyssøy, H., Hendrickx, K., Sandanger, M. I., Glesnes Ødegaard, L., and Stordal, F.: Nitric oxide response to the April 2010 electron precipitation event: Using WACCM and WACCM-D with and without medium-energy electrons, J. Geophys. Res.-Space, 123, 5232–5245, https://doi.org/10.1029/2018JA025418, 2018.


