the Creative Commons Attribution 4.0 License.
the Creative Commons Attribution 4.0 License.
 | 13 Jun 2019
A sampler for atmospheric volatile organic compounds by copter unmanned aerial vehicles
Daniel Wang
Jianhuai Ye
Jean-Baptiste de Fouchier
Patricia C. Guimarães
Carla E. Batista
Rodrigo A. F. Souza
Eliane G. Alves
Alex B. Guenther
Scot T. Martin
A sampler for volatile organic compounds (VOCs) was developed for deployment on a multicopter unmanned aerial vehicle (UAV). The sampler was designed to collect gas- and aerosol-phase VOCs on up to four commercially available VOC-adsorbent cartridges for subsequent offline analysis by thermal-desorption gas chromatography. The sampler had a mass of 0.90 kg and dimensions of 19 cm ×20 cm ×5 cm. Power consumption was < 10 kJ in a typical 30 min flight, representing < 3 % of the total UAV battery capacity. Autonomous sampler operation and data collection in flight were accomplished with a microcontroller. Sampling flows of 100 to 400 sccm were possible, and a typical flow of 150 sccm was used to balance VOC capture efficiency with sample volume. The overall minimum detection limit of the analytical method for a 10 min sample was 3 ppt and the uncertainty was larger than 3 ppt or 20 % for isoprene and monoterpenes. The sampler was mounted to a commercially available UAV and flown in August 2017 over tropical forest in central Amazonia. Samples were collected sequentially for 10 min each at several different altitude–latitude–longitude collection points. The species identified, their concentrations, their uncertainties, and the possible effects of the UAV platform on the results are presented and discussed in the context of the sampler design and capabilities. Finally, design challenges and possibilities for next-generation samplers are addressed.
- Article
(3285 KB) -
Supplement
(244 KB) - BibTeX
- EndNote


Biogenic volatile organic compound (VOC) emissions from forests vary widely across plant species, ecosystem type, season, time of day, and environmental conditions at many scales, including from tens to hundreds of meters (Gu et al., 2017; Fuentes et al., 2000; Goldstein and Galbally, 2007; Alves et al., 2018; Greenberg et al., 2004; Guenther et al., 2006; Klinger et al., 1998; Kuhn et al., 2004; Pugh et al., 2011; Wang et al., 2011). These variations can have significant effects on and be affected by atmospheric chemistry, air quality, and climate (Chameides et al., 1988; Fuentes et al., 2000; Laothawornkitkul et al., 2009; Goldstein et al., 2009; Kesselmeier et al., 2013; Peñuelas and Staudt, 2010). They may also be indicators of ecosystem change, plant health, and stress (Karl et al., 2008; Kravitz et al., 2016; Niinemets, 2010; Peñuelas and Llusià, 2003). Most field observations of biogenic VOC emissions are made from fixed-location towers, from tethered balloons, or from aircraft flying at high velocities well above the forest canopy (see Table 1 of Alves et al. (2016) for a summary of studies in the Amazon). As such, detailed information on the spatial distribution of emissions at tens to hundreds of meters has been difficult to obtain. This information is most critically needed in globally important and highly spatially heterogeneous source regions of VOCs, such as the Amazon, which is not well characterized even at large spatial scales. Thus, this scale is not represented in current VOC data sets, yet it is critical for understanding and quantitatively modeling VOC emission and uptake and is vital to advancing our present-day understanding of VOCs in atmospheric chemistry. New VOC measurements with increased horizontal coverage and resolution that could be used to test and improve existing emission models would be extremely valuable. Similarly, knowledge of VOC concentrations as a function of altitude throughout the boundary layer over a range of underlying land cover types is needed to better constrain emissions, chemical reactions, and atmospheric mixing of these compounds and to thereby inform atmospheric chemistry model development. New approaches that are suited to spatially resolved sampling at these intermediate scales are therefore needed by the atmospheric chemistry community.
Table 1Summary of biogenic VOC types and concentrations collected on 2 August 2017. Results are shown for sample collection by the UAV-based sampler at 711 m from the tower launch location as well as by use of a handheld pump at the top of the tower. Local time is UTC − 4. The overall uncertainty is larger than 3 ppt or 20 % for the UAV samples and 3 ppt or 23 % for the tower samples.
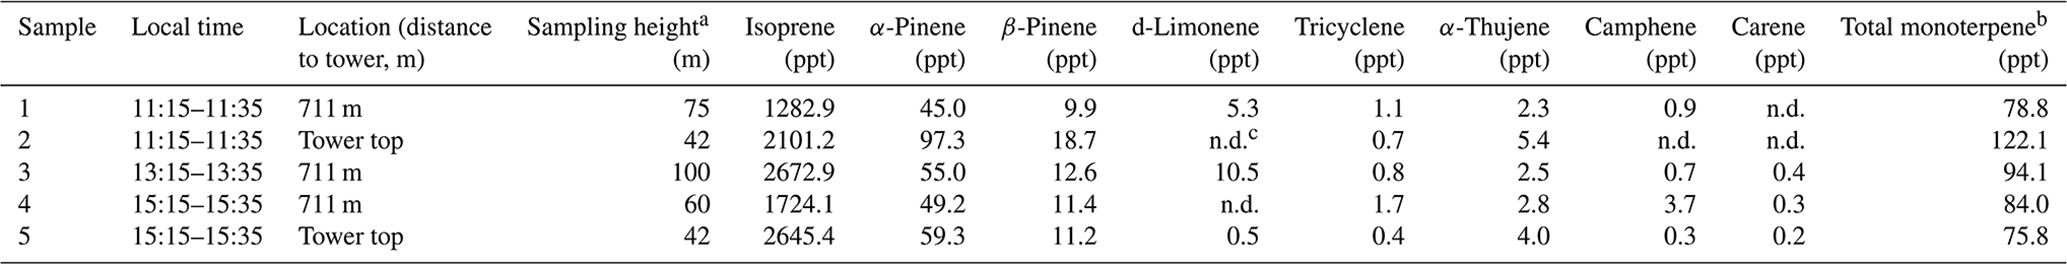
a Sampling height relative to ground level at the MUSA tower. b Only major monoterpenes are listed here. In addition to isoprene and monoterpenes, four sesquiterpenes including β-caryophyllene were detected. c “n.d.” denotes that the VOC concentration was below the detection limit of the instrument.
Small, commercially available unmanned aerial vehicles (UAVs, commonly called drones) have the potential to fill this gap in knowledge due to their extreme maneuverability (Villa et al., 2016). UAVs are available as either fixed-wing aircraft, helicopters, or multicopters. Multicopters (most often quad- or hexacopters) offer the advantages of being highly maneuverable and easy to fly, as well as offering straightforward accessory mounting options. Flight durations of up to 45 min and payload capacities of 6 kg are attainable with mid-priced, commercially available copter-type UAVs. Development or adaptation of lightweight instruments for UAV platforms is, however, still in the early stages. To date, several researchers have utilized UAVs to carry sensors to measure atmospheric trace gases in situ (Villa et al., 2016, and references therein). Commercially available sensors for some trace gases (e.g., CO2, CO, and NOx) are sufficiently compact to be carried by a UAV, but these are often limited by insufficient sensitivity or difficult calibration (Cross et al., 2017). In situ techniques for quantifying VOCs at the required sensitivity (< 10 ppt) are, however, large and complex instruments that exceed the payload capacity of midrange UAVs available to most researchers (Lindinger et al., 1998; Millet et al., 2005; Blake et al., 2009; Kim et al., 2013).
As an alternative, the UAV platform offers the possibility to collect air samples for later laboratory analysis. Black et al. (2018) used a commercial quadcopter to collect samples of airborne mercury by drawing air through gold-coated quartz cartridges for later analysis by cold vapor atomic fluorescence spectroscopy. The results showed the ability to resolve vertical concentration profiles above a source and to differentiate between urban and rural mercury concentrations. Although remote control of the sampler was not implemented, the authors suggested this as a possible future improvement. Chang et al. (2016) demonstrated the use of a whole-air sampling apparatus mounted on a multicopter UAV platform to collect air samples for offline analysis. The sampler consisted of a single evacuated 2 L canister with a remote-controlled valve actuated by a separate remote control unit independent of the UAV controller. The flow rate and total sample volume were not monitored during flight. The authors successfully detected VOCs, CO, CO2, and CH4 in the collected air samples and were able to distinguish between samples collected upwind and downwind of an exhaust shaft. Both studies cite maneuverability in three dimensions, spatial resolution, and the ability to evaluate emissions from otherwise inaccessible locations as key advantages of UAV-based atmospheric sampling. They also point out flight stability, an easily accessed and symmetrically positioned mounting location, low cost, and lack of engine exhaust as features of battery-powered multicopters that make them particularly well suited for environmental applications. As with any new sampling method, the possible introduction of artifacts due to the platform should be considered. For the case of UAVs, as with manned aircraft, the platform itself disturbs the surrounding air, which could lead to issues such as loss of target species on surfaces, outgassing of interfering species, or artifacts in measured concentrations due to enhanced mixing of the sample air. Nonetheless, while the ability to detect atmospheric trace species and to map spatial gradients depends strongly upon the target species, including its atmospheric variability and the detection threshold of the analytical method, these several studies suggest that UAV-based sample collection is a viable approach that promises to greatly expand access to previously inaccessible locations and to provide a means to map spatial patterns in atmospheric trace species concentrations.
The use of VOC-adsorbent cartridges to capture VOCs from air with subsequent analysis by thermal-desorption gas-chromatography mass spectrometry (TD-GC-MS) is well established (Woolfenden, 2010b; Pankow et al., 2012). The adsorbent cartridges are small glass or metal tubes, typically 9 cm in length and 0.64 cm in diameter. The cartridges are filled with a sorbent material with a high affinity for VOCs. Woolfenden (2010a, b) and Pankow (2012) review the performance of adsorbent cartridges for quantitative VOC measurements and compare their retention and recovery of VOCs with whole-air samples. They conclude that adsorbent cartridges are a quantitative method of VOC sampling and may be preferable to whole-air canister sampling in some cases as losses of terpenes and other VOCs have been shown to occur in some canisters. Whole-air canisters have the advantage of a very short (seconds) fill time and therefore higher time resolution, resulting in the potential to capture more rapid atmospheric variability. They are large (1 L volume) and heavy, however, making them less ideal for drone sampling. The small size and light weight (10 g) of adsorbent cartridges make them well suited to carrying on a UAV. The resulting samples represent VOC concentrations averaged over the duration of the sampling period (several minutes). The cartridges provide a lightweight, simple, sensitive, and quantitative approach for determining a wide range of VOCs at ambient atmospheric levels. The aim of this work was to design and construct an automated sample collection system for cartridges suited to deployment on a multicopter UAV.
The primary scientific requirement of the sampler is that the total mass of analyte collected be greater than the method detection limit, which depends on both the detection limit of the analytical system for each compound and on the background level measured in field blanks. The detection limit of volatile organic compounds detected by GC-MS has previously been approximately 10 pg. Commercial detectors are now available with detection limits of < 1 pg, including the GC-ToF-MS (gas-chromatography time-of-flight mass spectrometer) used for this study (Hoker et al., 2015), implying detectable VOC mixing ratios an order of magnitude lower. The method detection limit is, however, still limited by the background level of VOC measured in field blanks, which is approximately 10 pg VOC. This corresponds to a VOC detection limit of less than 10 pptv for a sample volume of a few liters of air, which can be collected in 5 to 15 min by typical flow rates through adsorbent cartridges (Pankow et al., 2012). This suggests that detection of VOCs in cartridge samples collected within current multicopter flight durations of approximately 30 min is feasible. Automated operation of the cartridge sampler, controlled either algorithmically based on elapsed time or position, or remotely by sending commands to the sampler during flight, is desirable. Furthermore, the mass and dimensions of the sampler must fit within the payload capacity of available UAV platforms. Herein, the design, operation, and field validation of a VOC sampler using adsorption/thermal desorption cartridges on a midsize multicopter UAV that meets these requirements is described, and an example data set collected in central Amazonia including a discussion of uncertainties is presented. The possible effects of the UAV platform on the surrounding air and thereby on the collected sample are an important consideration which is explored by computational fluid dynamics simulations.
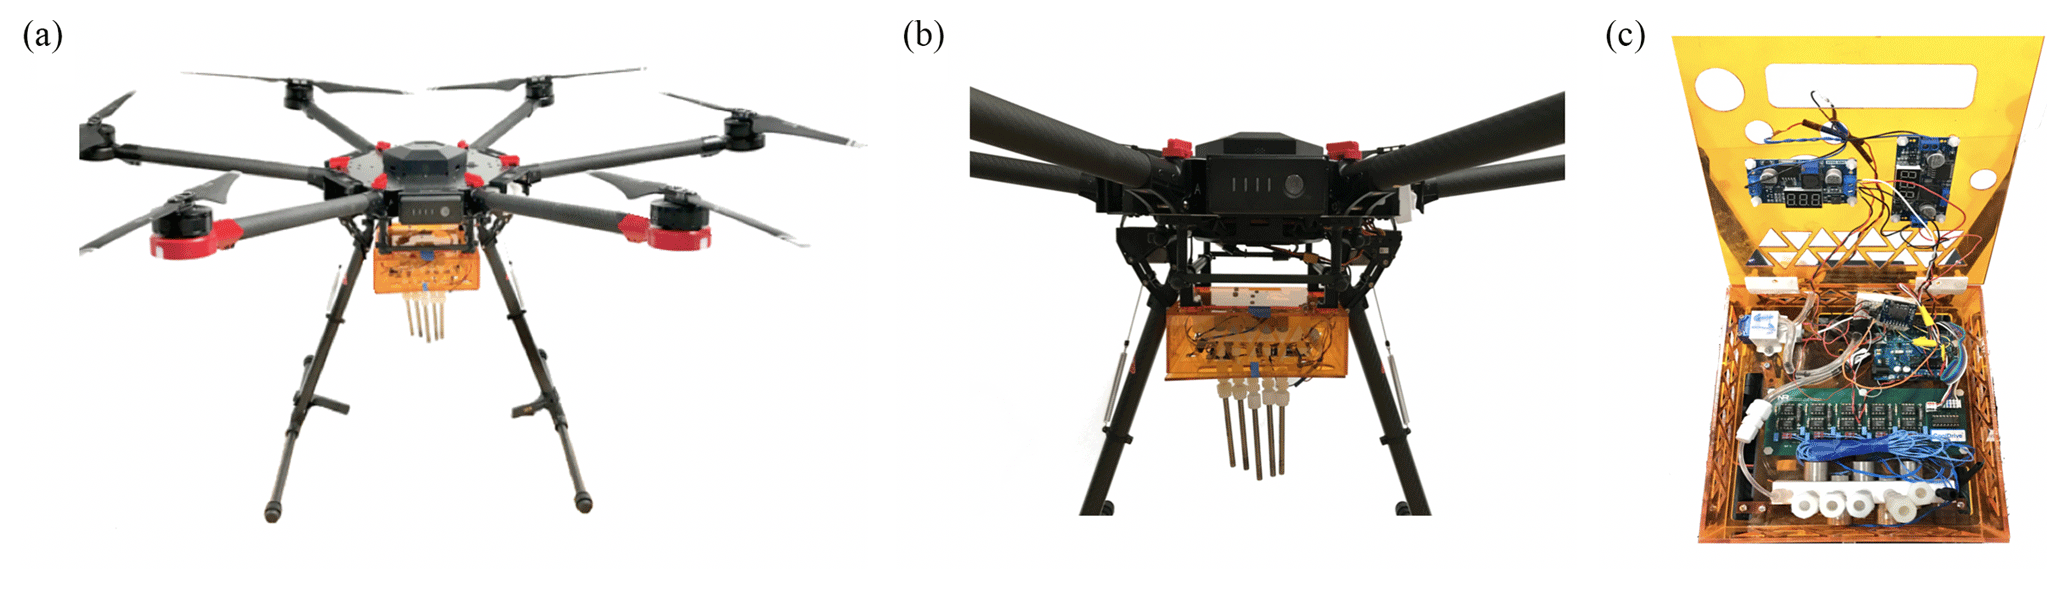
Figure 1UAV equipped with VOC sampler: (a) DJI Matrice 600 hexacopter UAV. (b) Custom-built sampler visible in orange mounted to UAV. Five VOC sorbent cartridges (Markes International, Inc.) are seen on the undercarriage. (c) Sampler with lid open to show pump and electronics package seen in panel (b) for differentially actuating sample flow through the sorbent cartridges.
2.1 Flight platform
The UAV platform was a DJI Matrice 600 professional grade (Fig. 1), which is a hexacopter design with onboard stabilization. With propeller arms extended, the UAV measured 1.668 m across by 0.759 m high. Without the sampler attached, it weighed 9.6 kg with its six batteries installed (model TB48S; 130 Wh, 18 V). The maximum ascent rate was 5 m s−1, and the maximum horizontal speed was 18 m s−1. It had GPS positioning and maintained two-way communication with DJI programs developed for iPad and Android tablet systems. The positioning accuracy was ±0.5 m in the vertical and ±1.5 m in the horizontal. The maximum flight time specified by the manufacturer was 40 min without a payload and 18 min for the maximum payload mass of 5.5 kg at sea level. The VOC sampler was mounted to a mounting frame underneath the UAV platform (DJI Matrice 600 Series Z15 Gimbal Mounting Connector kit). Testing for the sampler load of this study indicated 25 min of flight time with a margin of security of an additional 5 min. Actual battery use in each flight depended on the flight plan and strength of local winds during the flight. The UAV was tested to a horizontal flight distance of 1000 m and a height of 150 m. A ceiling of 500 m above local ground level is hardwired into the device by the manufacturer.
2.2 Sampler description
Figure 2 shows the full system schematic, including the pump system flow paths and the major power and signal connections within the sampler casing. The adsorbent cartridges are positioned at the inlet of the flow path. The sampler also requires a pump to draw air flow through the sorbent cartridge, flow and pressure sensors, a flow regulation valve, and a cartridge selection manifold to allow for multiple samples, as well as electronics to provide power, issue commands, and collect data from the sensors during flight. The overall system layout of the sampler is designed to fit a stand-alone, modular form factor in order to simplify installation and troubleshooting as well as to maximize electromechanical compatibility with multiple UAV platforms in the field. A table with a complete list of the sampler components is provided in the Supplement.
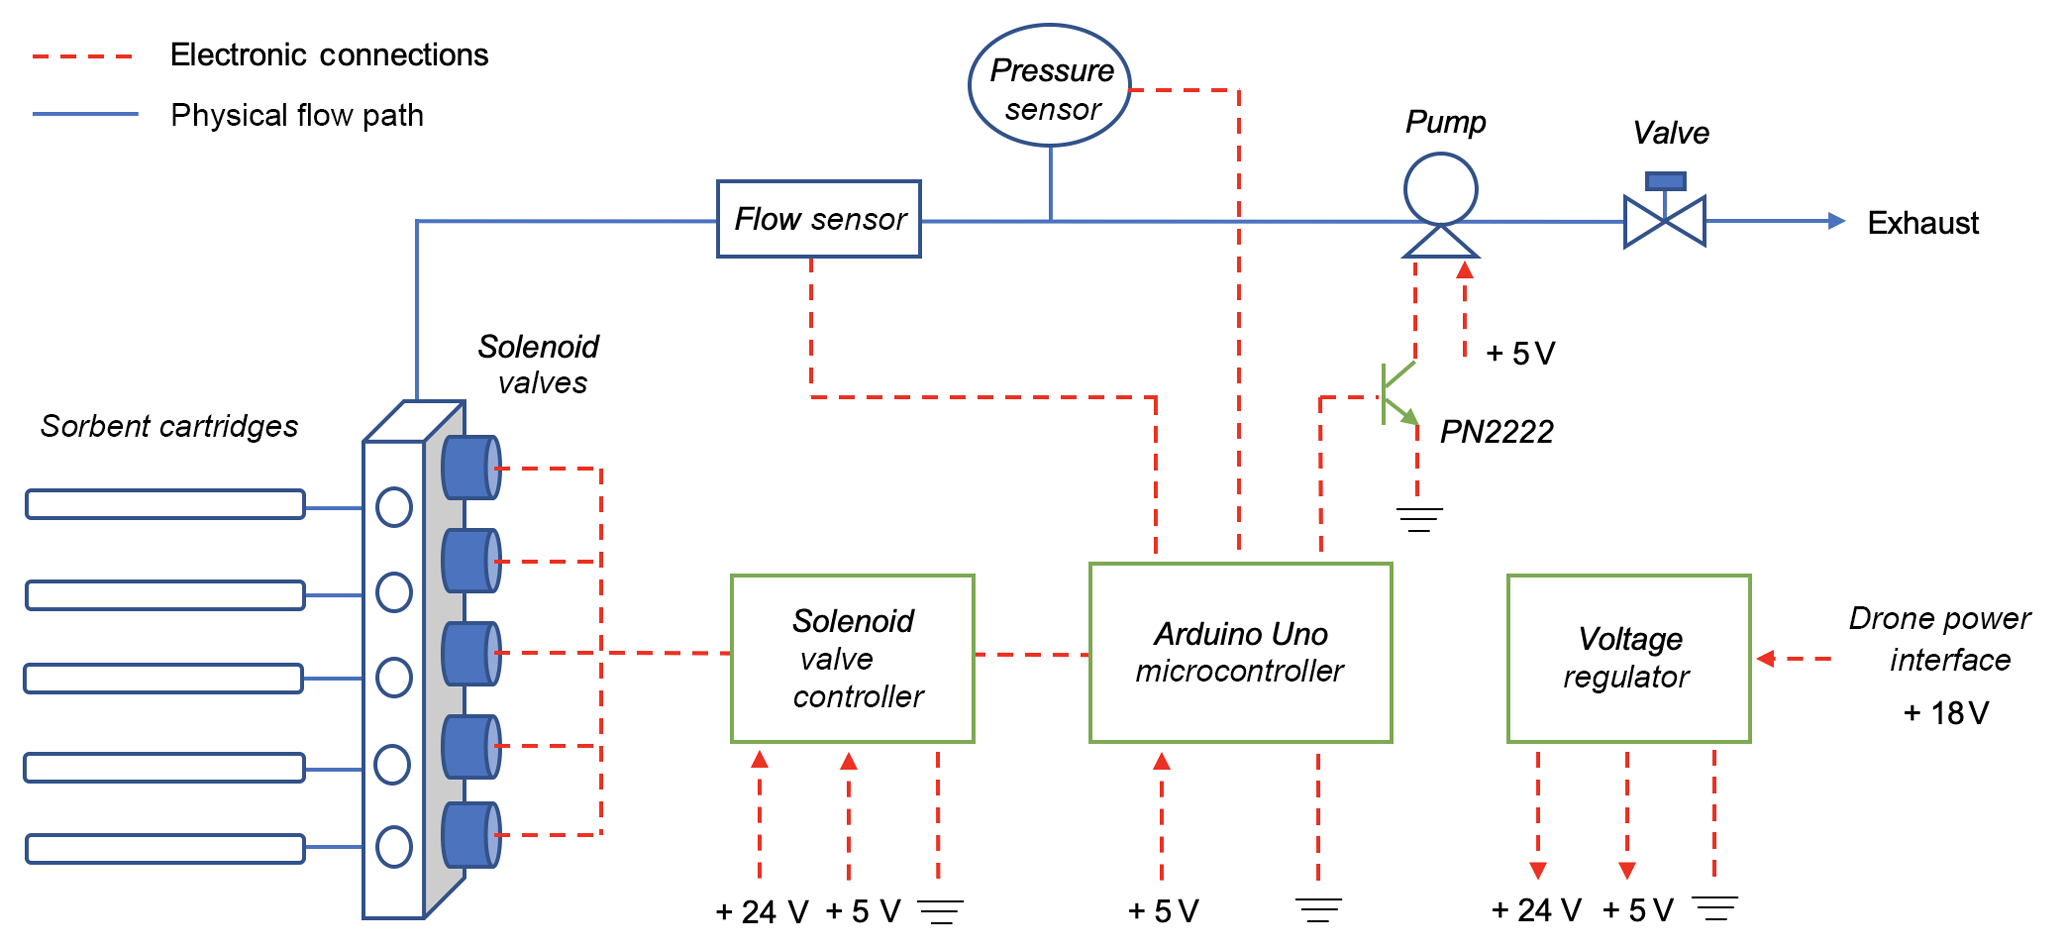
Figure 2Schematic diagram of sampling device. All components are powered by the UAV batteries through the 18 V DC power output on the Matrice 600 and are controlled by an Arduino Uno microcontroller. Gas flows from the ambient atmosphere through the sorbent cartridges and out to the pump and exhaust.
2.2.1 Casing
The sampling system resides in a rectangular acrylic casing that can be opened for easy access for repairs and software updates to the onboard microcontroller. The completed sampler measures 19 cm ×20 cm ×5 cm. The casing remains closed and attached to the chassis of the UAV platform for exchanging sorbent cartridges between flights. The sampler casing is directly integrated to the underside of the UAV chassis and does not interfere with standard flight operations, including the functionality of the Matrice 600's automatically retracting landing legs. The total sampler mass is 0.90 kg. The flight time decreases approximately linearly with increasing payload mass below 5 kg. Based on the relationship between payload mass and flight time provided by the UAV manufacturer, the decrease in flight time for a 1 kg payload is estimated as 3.4 min (DJI.com, 2019).
2.2.2 Flow system
Cartridge sampling requires a sample stream at a calibrated flow rate in order to determine the volume captured over the sampling period. The sample flow is drawn through the system by a Parker CTS Micro Diaphragm pump, which can pull between 100 and 600 sccm of flow in a compact form factor. The volumetric flow of the pump is a function of the pressure drop across the inlet and outlet, and is controlled via a manually adjustable pinch valve (model 44560; US Plastic Corp.) at the output of the flow system. The pump is driven by a 5.0 V DC brush-sleeve bearing motor.
A mass flow sensor (model D6F-P; Omron) was installed upstream of the pump to provide a continuous analog voltage output signal corresponding to the mass flow at standard temperature and pressure. The flow sensor supports a flow range of 0 to 1000 sccm and includes a built-in cyclone dust segregation system, which diverts particulates from the sensor element. The mass flow sensor was calibrated periodically against a reference standard in the lab. The mass flow sensor is used to calculate the total moles of gas in each sample (see Sect. 2.4). The flow sensor also serves as an indicator of sampler malfunction due to factors such as valve failure or obstruction of the flow by debris during flight.
2.2.3 Pressure system
An absolute pressure transducer (MX4100AP; NXP) is positioned adjacent to the flow sensor in order to measure the pressure in the flow path. The measured pressure is used as a diagnostic of proper operation of the flow system. The device operates across a pressure range of 20 to 105 kPa. It outputs an analog voltage signal recorded by the microcontroller that can be converted to a pressure value using a function provided by the manufacturer. Laboratory calibration of the pressure sensor is possible but was deemed unnecessary due to its purely diagnostic function.
2.2.4 Manifold
Activation of each sample cartridge is achieved with a solenoid valve manifold (model 161T102; NResearch Inc.) consisting of five independently actuated two-way, normally closed solenoid valves. All five valves have a nominal orifice of 1.0 mm and share a common output port. The manifold is controlled by a valve driver board (CoolDrive model 161D5X24; NResearch Inc.). Valve actuation requires 200 mA at 24 V. The board uses a holding voltage that is one third of the actuation voltage and is automatically achieved within 100 ms of activating the solenoid. The five solenoid valves are independently controlled using 5 V logic level signals.
2.2.5 Control system
Autonomous sampler operation and data collection in flight is accomplished with an Arduino Uno microcontroller. The microcontroller coordinates the activation and operation of the pump and valves using a pre-programmed algorithm based on elapsed flight time and collects data from the sensors.
2.2.6 Electrical system
The sampling system is powered by the UAV batteries via the 18 V DC power output of the Matrice 600. The UAV power supplies two voltage regulators, which provide 5 V DC output for the pump, pressure and flow sensors, Arduino Uno, and valve driver board and 24 V DC output for the valve manifold. The system consumes 2.5 Wh of electricity during a 30 min flight (25 min of sample time), which is less than 2 % of the total UAV battery capacity. The remaining 98 % of battery capacity is available for UAV flight operations. The use of a separate onboard battery to power the sampler was considered; however, the extra power capacity was more than offset by the effect of the weight of an additional battery on total available flight time.
2.3 Sampling methods
Air samples are collected using cartridge tubes packed with Tenax TA and Carbograph 5TD (Markes International, Inc. C2-AXXX-5149). Tenax TA is a relatively weak sorbent that collects components with volatility less than benzene (e.g., > C6) including monoterpenes, C10, and sesquiterpenes, C15, whereas Carbograph 5TD shows strong sorbate affinity and captures low-molecular-weight VOCs with carbon numbers of C3 to C8 (Woolfenden, 2010b) including isoprene, C5. The combination of these sorbent materials enables sampling VOCs with carbon numbers from C3 to C30, covering the expected range of atmospheric compounds from biogenic and anthropogenic sources (Goldstein and Galbally, 2007). Both of the sorbent materials are hydrophobic and suitable for air sampling at high-relative-humidity (RH) conditions. Prior to sampling, tubes are preconditioned at 320 ∘C for 2 h, then at 330 ∘C for 4 h, and are then capped using 0.25 inch (6.35 mm) Swagelok fittings with PTFE ferrules and kept sealed until they are installed on the sampler just prior to flight.
The sorbent cartridges are mounted at the sampler inlet to ensure that the sample gas that passes through the cartridges has not contacted other surfaces in the flow system, thus preventing potential analyte losses or contamination from the flow system components. The cartridges are oriented in a vertical position for sampling since horizontal installation can cause “channeling” to occur as a result of sorbent falling away from the walls of the cartridge (ASTM D6196-15, 2015). No particle or ozone filter was used upstream of the cartridges to prevent loss of analytes on the filter surfaces. Although a particle filter could be useful in preventing debris from entering the sampling system, filters can also adsorb and later desorb semi-volatile VOCs, possibly introducing sampling artifacts (Zhao et al., 2013). As this was judged to be a greater drawback, an inlet filter was omitted. As such, both gas- and aerosol-phase VOCs are sampled. Williams et al. (2010) show that for compounds with vapor pressures greater than 10−2 hPa, including hydrocarbons with 10 or fewer carbon atoms, partitioning into the aerosol phase is negligible. Thus the measurements of isoprene (C5, Pvap=733 hPa at 25 ∘C) and monoterpenes (C10, Pvap approximately 1–10 hPa at 25 ∘C) reported herein represent the gas-phase mixing ratios of these compounds (Fichan et al., 1999; Linstrom and Mallard, 2019). Semi-volatile compounds (i.e., those with vapor pressures in the range of 10−2 to 10−8 hPa) are likely to have significant fractions in both the gas and aerosol phases. In such cases, cartridge measurements without a filter represent the sum of the two phases. These compounds will be the subject of a future study. The presence of ozone in the sample cartridges may contribute to oxidation of the most reactive VOCs between collection and analysis. The use of an ozone filter may help to mitigate this effect. The effect of ozone filters on the samples is therefore being evaluated in ongoing work.
The total sample volume depends upon the flow rate and sample collection time. Both of these parameters are easily adjusted in the field between flights. The flow is adjusted using the manual pinch valve downstream of the pump. The sample collection time is programmed in the flight algorithm executed by the Arduino Uno microcontroller. A constant low volumetric flow rate is required to allow for optimal sorbent–sorbate interaction and uptake onto the sorbent matrix. A target flow rate of 150 sccm was defined to maximize both VOC capture efficiency and sample volume (Woolfenden, 2010a; Markes International Ltd., 2014). Based on the relationship between sample volume and minimum detection limit reported by past studies (Pankow et al., 2012), a minimum sampling volume of 1.5 L per adsorbent cartridge collected, corresponding to approximately 2.5 ppt VOC, is targeted. This results in 10 min of sampling time per cartridge. Two to three cartridge samples of this volume can be collected in a single flight while also allowing time for takeoff, landing, and transits between sampling locations. The Arduino Uno microcontroller provides the operational flexibility to obtain smaller or larger sample volumes by utilizing either more tubes and shorter collection times or fewer tubes and longer collection times during a single flight.
Alongside the sampling, blanks are collected to examine sampling artifacts such as passive diffusion of VOCs into the tube. For the blanks, a sorption cartridge is installed at one of the five sampling channels on the UAV and uncapped, but the sampling valve is not opened during flight. After sample collection, the sample tubes and blanks are capped using the Swagelok fittings with PTFE ferrules, and stored at room temperature. The collected tubes are transported from Brazil to the USA for chromatographic analysis. Tubes were analyzed within 1 week after collection. Greenberg et al. (1999) showed that cartridge samples can be stored for > 10 d at ambient temperatures or 4 weeks at 0 ∘C without significant losses (< 10 %). Under proper transport and storage, sample artifacts have also been shown to be minimal (Pollmann et al., 2005).
2.4 Analysis by thermal-desorption gas-chromatography mass spectrometry (TD-GC-MS)
The cartridge tubes are mounted into a thermally desorbing autosampler (TD-100, Markes International, Inc). The VOCs are pre-concentrated at 10 ∘C followed by injection into a gas chromatograph (GC, model 7890B, Agilent Technologies, Inc) equipped with a time-of-flight mass spectrometer (Markes BenchTOF-SeV) and a flame ionization detector (TD-GC–FID/TOF-MS) (Woolfenden and McClenny, 1999; ASTM D6196-15, 2015). Internal standards tetramethylethylene and decahydronaphtalene are injected into each sample after collection and prior to analysis. The system is calibrated daily with a commercial standard from Apel Riemer Environmental Inc. (see Supplement). The external gas standard is prepared using a dynamic dilution system and the effluent is added to sorbent cartridges under conditions similar to those used for sampling. The calibration cartridges are then analyzed using the same thermal desorption GC analysis method. Response factors for additional VOCs are determined using liquid standards injected on the cartridges or using FID signals by effective carbon number (Faiola et al., 2012).
The mixing ratio XVOC of VOCs is related to the measured mass of each compound in the sample and the volumetric flow rate according to the following governing equation:
where mVOC is the mass of the VOC measured in the sample, MVOC is the molar mass, R is the gas constant, T is the temperature, P is the pressure, Q is the volumetric flow rate, and τ is the sampling time. The mass flow sensor reports the equivalent volume of gas flow per unit of time at standard temperature and pressure conditions (273 K and 1 atm). Inserting these constant values in Eq. (1) and combining them with R gives
where Qstd specifies mass flow. Equation (2) is used to calculate the VOC mixing ratios. The measured quantities used in calculating XVOC are the mass of VOC in the sample mVOC, the mass flow rate Qstd,and the sampling time τ. In practice, since the mass flow rate can vary over the sampling period (Fig. 3), a time integral of the measured mass flow rate is used.

The detection limit of the GC-TOF-MS analysis for isoprene is 1 pg, which is 0.25 ppt for a 1.5 L sample. The detection limit of the measurement is, however, limited by the uncertainty in the background (blank), which ranges from approximately 10 to 380 pg for the compounds shown in Table 1, equivalent to 2.5 ppt or 5 %, whichever is greater, for a 1.5 L sample, and by the uncertainty in the in-flight flow rate measurement, which is 15 %. Combining these factors, the overall uncertainty in the measured mixing ratio is then the larger of 3 ppt or 20 %. A comparison of the chromatograms of samples and blanks collected by the sampler with those collected on the tower (Supplement Table S2) does not indicate the presence of any artifacts in the sampler cartridges attributed to outgassing of volatile compounds from the UAV.
2.5 Computational fluid dynamics (CFD) simulation
CFD simulations are carried out using SOLIDWORKS Flow Simulation (ver. 2017 SP3.0) (Waltham, USA). Dimensions and an input geometric model of the UAV are obtained from the DJI company (DJI Downloads, 2019). A box with the dimensions and location of the sampler is added to the geometry file. The propellers are simulated by discs of the same diameter, and to simulate a hovering UAV a downward velocity of 11 m s−1 is imposed through each disc so that the lift produced by the motors balanced the system weight. The domain size was 2.4 m in width and 2.0 m in height, with the UAV centered horizontally and at 1.2 m vertically. An adaptive grid was used, such that the grid spacing is smaller where gradients are larger. Boundary conditions include atmospheric pressure far from the UAV, which is set to 1 atm. As the actual pressure during sampling may differ from this value, it is used only as a baseline for comparison. The results are optimized by performing iterations until the pressure difference between the last two iterations was within 2 Pa, which corresponds to a change in speed of 0.004 m s−1. Uncertainties in the CFD simulations could arise from the choice of domain size or grid resolution, which were limited by available computational resources, or assumptions such as the use of solid disks to model the rotors. In flight the legs are retracted to horizontal. The simulations do not account for possible changes to the circulation patterns due to the retraction of the landing gear, although this effect is expected to be minor relative to the volume of the disturbance created by the drone (see Sect. 3).
Samples were collected on 2 August 2017 of the dry season in central Amazonia at the Manaus Botanical Gardens (“MUSA”) of the Adolfo Ducke Forest Reserve. It is a 10 km ×10 km area set aside since 1963 to the north of Manaus, Amazonas, Brazil, and it has served as a study site for several thousand publications. Three major terra firme forest classifications describe the forest, including valley, slope, and plateau forests (Ribeiro et al., 1994; Oliveira et al., 2008). The tree canopy height is typically in the range of 25 to 30 m. The UAV equipped with the sample collector was launched and recovered from a platform of 3.5 m ×3.5 m atop a 42 m tower (3.0032∘ S, 59.9397∘ W, 120 m above sea level). Samples were collected on the UAV at point A (3.0030∘ S, 59.9333∘ W, 122 m above sea level; Fig. S1 in the Supplement). The collection point was 711 m from the launch point. The UAV successfully flew to the sample location repeatedly based on pre-programmed GPS coordinates. Three samples were collected in separate flights at heights of 60, 75, and 100 m relative to the ground level at the tower location.
A sample flow rate of 150 sccm and duration of 10 min were used to collect a total sample volume of approximately 1.5 L (standard) with each cartridge. Data from the sampler showing flow and pressure for the three in-flight samples are shown in Fig. 3. To conserve battery power, the pump is turned off between samples and no data are recorded. The results show that each valve successfully activated. After the initial start-up, a uniform flow rate of 150 sccm and a pressure of 1 atm was maintained during each sampling period. The measured flow rate was used to calculate the standard volume of each sample to account for small variations in flow. Mixing ratios were then calculated using Eq. (2).
For comparison, VOC collections were performed concurrently atop the MUSA Tower with a handheld motorized pump (model 210-1002, SKC). These samples were collected using a volumetric flow rate of 200 cm3 min−1 and sampling time of 20 min for a total sample volume of 2.0 L (non-standard). Mixing ratios were calculated from Eq. (1) using a pressure of 0.983 atm and temperature of 32.0 ∘C. Temperature and pressure were not measured at the tower. Values from the MUSA meteorological station for 3–31 August 2017 (no data were available for 1–2 August 2017) averaged over the time period 11:00 to 16:00 LT were therefore used in the calculation. To account for the use of average values, uncertainties in pressure of ±10 % and temperature of ±5 ∘C (±2 %) were used to estimate an overall uncertainty of 23 % for the tower samples.
VOC mixing ratios determined from samples collected by the UAV sampler and from atop the tower are presented in Table 1. The raw mass measurements for each sample and blank cartridge are included in the Supplement (Table S2). The results all fall within the expected range of concentrations (e.g., approximately <1–10 ppb for isoprene) for the near-canopy environment over the Amazon rain forest based on previous gas-phase measurements using both sample collection and fast in situ techniques (Alves et al., 2016; Harley et al., 2004). VOC emissions depend on many conditions, including season, time of day, temperature, light levels (i.e., cloudiness), and forest composition, which can vary on spatial scales of tens of meters. Atmospheric concentrations are also affected by atmospheric turbulent mixing and photochemistry. It is therefore difficult to make direct comparisons among the samples presented in Table 1, which were all collected at different locations (tower vs. point A), altitudes, and times. More samples with systematic vertical, horizontal, and temporal coverage and a modeling framework incorporating emissions, atmospheric mixing, and chemistry are needed in order to draw firm scientific conclusions about the implications of atmospheric variability across these coordinates. Further analysis and scientific interpretation of these results and a larger data set are the subject of separate forthcoming publications.
The possible effects of air circulation created by the UAV multicopter rotors on the sampling were considered. Specifically, there were two main questions to be addressed. The first was to determine the timescale at which the air in the sampling region beneath the UAV is flushed. If the flushing timescale is significantly less than the sampling time, then, rather than being drawn from a stagnant pool, the sampled air can be taken as representative of the surrounding air. The second was to determine the spatial scale of the disturbance created by the rotors, in order to assess whether smoothing of concentration gradients by rotor-induced mixing is likely to influence the measured values. Unlike many real-time sensors, which have integration times on the order of a second, cartridge samples were collected over relatively long time periods (minutes). Over this time period, atmospheric mixing serves to average out gas concentration gradients at fine spatial scales (less than a few meters). Gradients at this scale would therefore not be resolved by cartridge samples, even when not collected from a UAV platform. If the spatial scale of mixing induced by the UAV is smaller than that of the atmosphere itself over the sampling period, the perturbation of fine-spatial-scale gradients by the UAV circulation will not significantly affect the measured concentrations. Hence, the second critical question to be addressed by the CFD simulations is whether the spatial scale of atmospheric mixing induced by the UAV rotors is larger than the spatial scale of atmospheric mixing over the sampling period. If it is not, then the mixing due to the UAV should have little effect on the cartridge samples.
As there are no published computational fluid dynamics (CFD) studies specifically of the DJI Matrice 600, CFD simulations of the UAV were performed. As shown in Fig. 4a, the pressure difference between the area underneath the sampling box and the area under the propellers was calculated as < 100 Pa, indicating that the effect of the UAV on the pressure in the sampling region is minimal. Because the mass flow sensor inherently accounts for changes in sample pressure and temperature, small deviations in the pressure of the sampling region should not affect the measured total mass of air sampled or the resulting VOC mixing ratio. This result also suggests that any possible effects of UAV pressure fields on a pressure-sensitive sensor mounted in this area would be small.
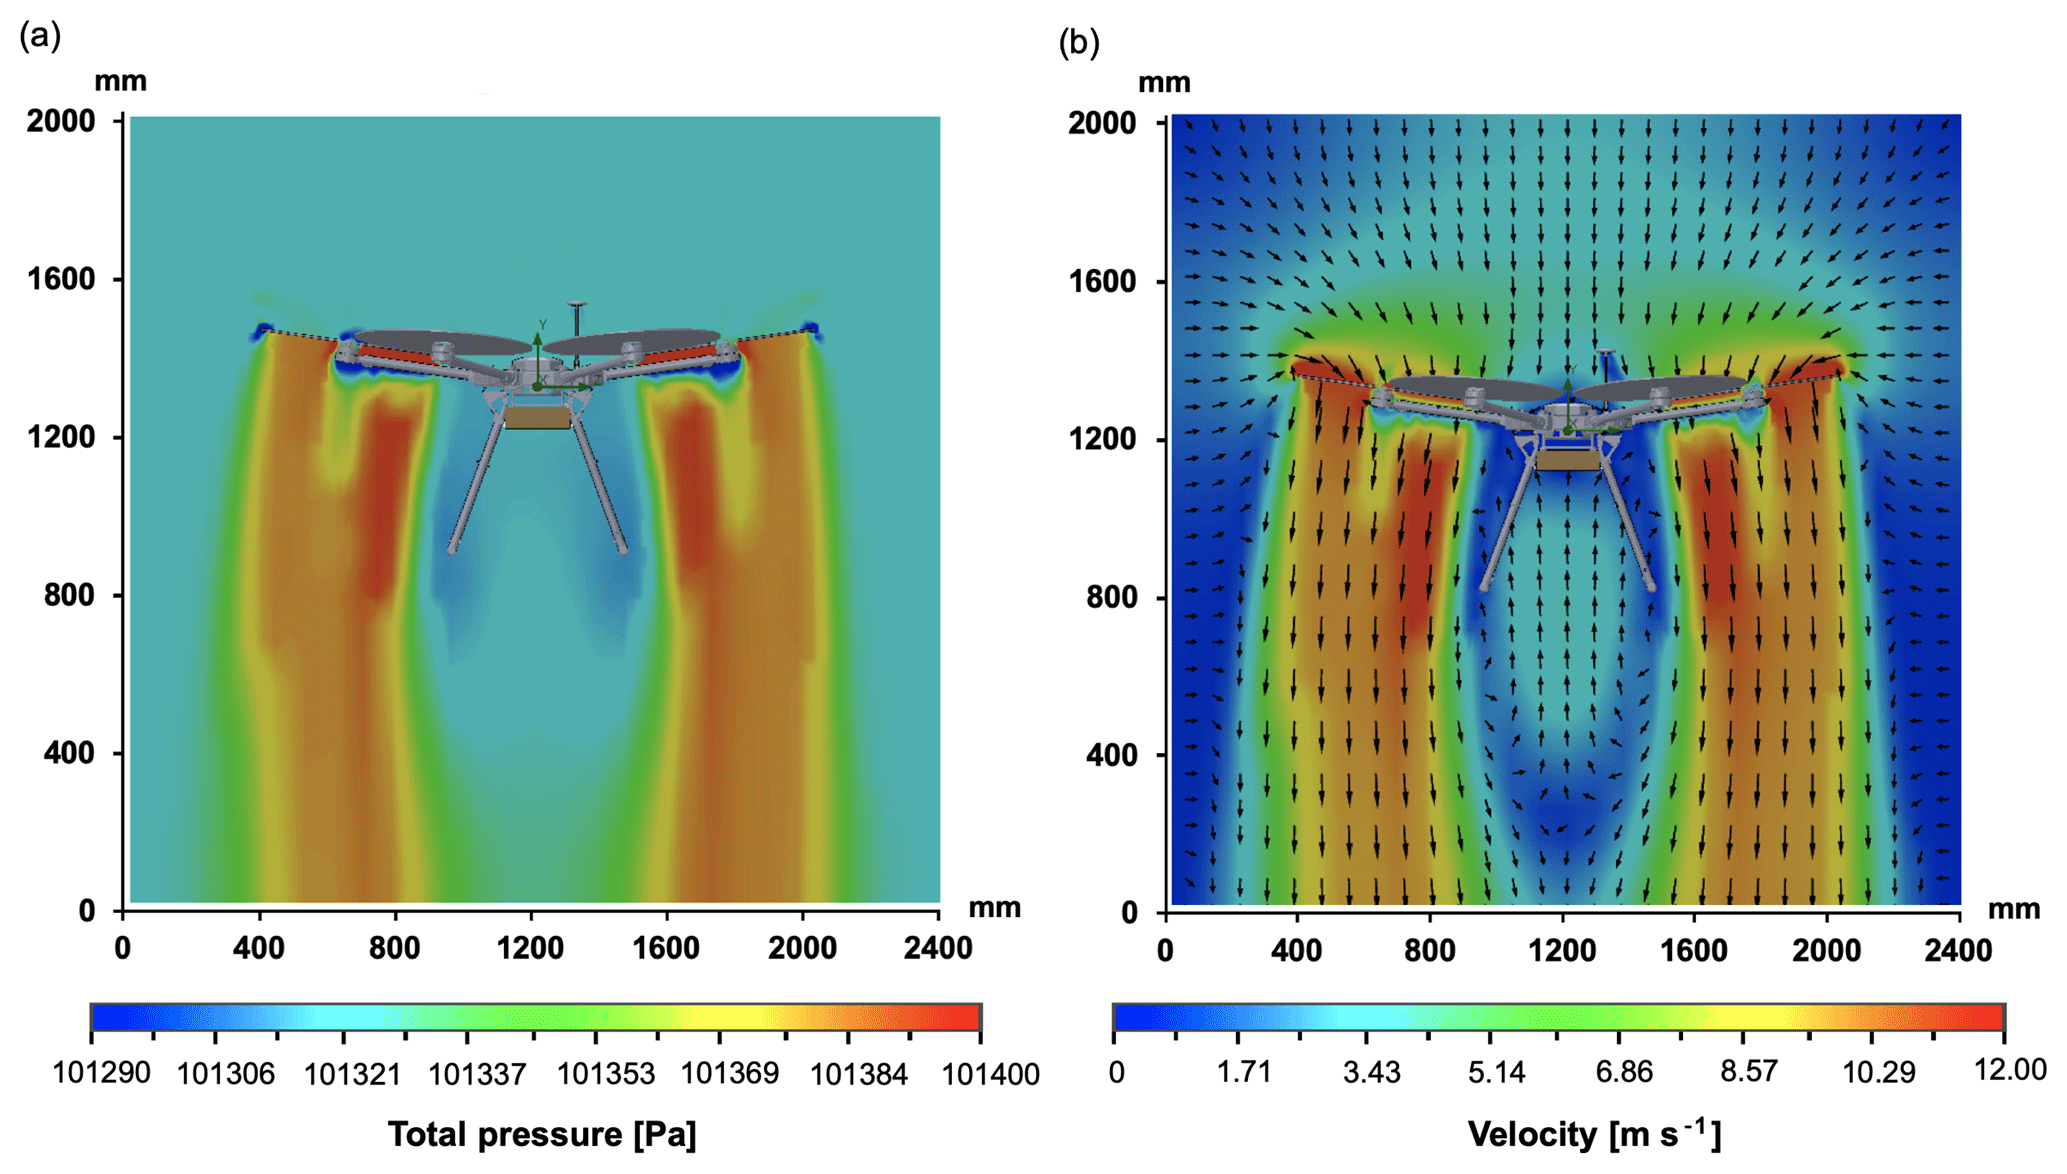
Figure 4(a) Vertical pressure distribution and (b) air velocity distribution around the UAV from the CFD simulation. Pressure difference between the UAV sampling area and the area under the propellers was simulated to be less than 100 Pa, indicating a minimal effect of pressure on sampling. The air velocity was 1.65 m s−1 upward around the UAV sampling region, suggesting a fast air flushing time underneath the sampling box.
Figure 4b shows the calculated air velocity distribution around the UAV. The simulation suggests that air experiences roughly laminar downward flow from above the propellers, undergoes turbulent recirculation to the UAV sampling region, and then is ejected below the UAV. The simulation shows that the air flushing time in the sample region is fast (i.e., several seconds) compared to the timescale of VOC sampling (i.e., 5–10 min). According to the CFD simulations, the disturbance due to the rotors extends approximately 5 m above and below the UAV. This is consistent with the CFD study by Ventura Diaz and Yoon (2018), which suggested that for their smaller quadcopter (1.2 kg), the sample represented an air parcel extending approximately 1 m above the UAV. As expected for a larger drone, the disturbed air volume derived from Fig. 4 is significantly larger than in their study. The flow patterns, however, are remarkably similar considering the simplifying assumptions and lower grid resolution used in this study (see Sect. 2.5), lending credence to the general flow features shown in Fig. 4.
The magnitudes of the pressure variations around the UAV are used as an estimate of the uncertainty in the simulation results. The pressure variations (±100 Pa, or ±0.10 %) correspond to speed variations of approximately ±0.2 m s−1 or approximately 2 % to 25 % of speeds of 1 to 12 m s−1. A 25 % uncertainty of the calculated speeds would suggest a similar uncertainty in the spatial scale for the dissipation of the resulting disturbance. Hence, applying a +25 % uncertainty to the ±5 disturbance from the CFD simulations, we estimate a range for the mixing scale of ±7 m. The simulations thus indicate that the sampler performs representative sampling of ambient VOC concentrations averaged across ±7 m around the UAV. For comparison, the spatial scale of atmospheric vertical mixing over the sampling period (10 min) can be estimated from the relationship , where K is the eddy diffusivity, τ is the time period, and Δz is the vertical distance. Estimates of the eddy diffusivity within 10 m above a forest canopy are in the range of approximately 2 to 15 m2 s−1 during the day, though the values are uncertain and vary with local meteorology and canopy roughness (Bryan et al., 2012; Saylor, 2013; Freire et al., 2017). K then generally increases with altitude for several hundred meters above the canopy (Wyngaard and Brost, 1984; Saylor, 2013). Using the canopy-top values as a lower limit on the eddy diffusivity at the UAV height results in an estimated lower limit on the vertical mixing scale of approximately 50 to 150 m, substantially larger than that due to the UAV. A paper treating atmospheric mixing above the forest canopy more explicitly using a large-eddy simulation (LES) method is currently underway. Nevertheless, this estimate suggests that mixing due to the UAV is expected to exert minimal influence on the measured VOC mixing ratios.
As noted above, the sampled air is drawn systematically from above the altitude of the UAV. It is therefore expected that the sampled air represents an altitude slightly higher than the flight altitude. Based on a mixing volume extending 7 m above the drone, a vertical bias of approximately −3 m altitude is inferred.
Several other studies investigated the effects of a multicopter on air sampling and reached similar conclusions. Roldán et al. (2015) simulated flow around a quadcopter and validated the simulations with air velocity measurements. The results showed that air speeds were greatest near the propellers and smallest near the center of the UAV. The optimal location for air sensors was at the center of the vehicle. Further testing involved measurements of CO2 concentrations with an onboard sensor near a CO2 source, with and without the propellers rotating. There were small differences (< 5 %) in the measured CO2 concentrations, supporting the conclusions of the simulations. Similarly, Black et al. (2018) demonstrated that no difference was observed in the measured atmospheric mercury concentrations using a copter-based sampler when the UAV was powered compared to when it was unpowered. Together with the results of the current simulations, these studies suggest that valid measurements of many atmospheric gas concentrations can be obtained from multicopter platforms. As a further test of the sampler, intercomparison with other measurement methods, including online techniques, would be desirable and is planned for the future.
There are both advantages and disadvantages to mounting the sampler either atop or beneath the UAV. The advantages of top mounting include faster time response and potentially higher spatial resolution due to laminar flow and less mixing. One disadvantage is the potential for more vertical bias due to the strong laminar downwash of air above the UAV. As the cartridges sample both gas and aerosols, another disadvantage when sampling from laminar flow rather than well mixed air is the potential for bias in sampling of particles relative to gas due to inertial differences. Any effect on particle sampling should be insignificant for the current measurements of volatile compounds, but may become important for measurements of semi-volatile species. In addition, the temperatures at the top surface of the UAV have been observed to become extremely hot (approximately 40 ∘C), especially during the dry season. This is particularly problematic for collecting VOCs on adsorbent cartridges, as the sampling efficiency may be reduced at elevated temperatures. Conversely, the advantages to mounting beneath the UAV are that the sampler is protected from direct sunlight and therefore cooler. Also, the flow beneath the UAV is well mixed, which avoids flow effects such as a bias towards large particles. Disadvantages, such as the presence of turbulent eddies and resulting mixing of concentration gradients and decreased time resolution, are most significant for sensors with fast time response. They are less of an issue for this application, where samples are collected over a 10 min period. Atmospheric mixing and temporal averaging will smooth out mixing ratio gradients over this time period, so drone-induced mixing should have little effect on the measurement. Since the disadvantage of overheating if the sampler is mounted on top of the UAV potentially outweighs the disadvantage of sampling from the turbulent flow underneath, the decision to mount the sampler beneath the UAV is a reasonable one for this particular application.
One of the key constraints on VOC sample collection by UAVs is the flight duration. Although the manufacturer specifies a maximum flight time of 40 min, when carrying the sampler under tested flight conditions and factoring in a margin of safety, the maximum flight duration is limited to 25 min. Because the volumetric flow rate is also constrained to < 200 sccm for the manufacturer-recommended operation of the cartridges to avoid breakthrough, the maximum air volume that can be collected during a flight is 5.0 L. Equation (1) in conjunction with the method detection limit of 10 pg suggests a minimum detectable atmospheric mixing ratio of 1 ppt for this sample volume at standard temperature and pressure. This sensitivity is sufficient for abundant primary emissions such as isoprene and monoterpenes, which can have mixing ratios of 102 to 104 ppt in tropical forests (Yáñez-Serrano et al., 2018). It may not, however, be sufficient for quantifying primary compounds in other ecosystems with low-emitting flora species, such as forests at higher latitudes or other ecosystem types such as grasslands. It may also not allow for the detection of species of lower concentrations such as sesquiterpenes. Characterization of these compounds is needed to fully understand the reactive chemistry and aerosol formation potential of VOCs in forest environments. Additional strategies to be explored for these compounds include more-rapid flow through the cartridge for low-volatility compounds for which breakthrough is less of a concern or parallel sampling with several cartridges simultaneously followed by common desorption at the TD-GC/MS.
There is a trade-off between the number of samples collected per flight and the individual sample volume. Collecting multiple samples in one flight necessitates smaller volumes for each sample and thus higher detection limits. For example, as noted above, a single sample collected over 25 min with a flow rate of 150 sccm will result in a detection limit of 1 ppt. For two 10 min samples, the detection limit for each will be 3 ppt, whereas 5 and 2 min samples will have detection limits of 5 and 12 ppt, respectively. Subject to the overall flight time limitation, the design of the sampler allows flexibility in the sample count and duration to best achieve the experimental objectives. For each individual flight, scientific choices can be made whether to collect a single, large volume sample to target less abundant species or multiple smaller samples for surveying the major VOC components.
A number of strategies can ameliorate these limitations. To facilitate the continuous operation of the UAV, multiple sets of batteries can be used, allowing the UAV to be relaunched immediately instead of waiting for the batteries to charge. Extension of the sample time can also be achieved by initiating a sample on one flight, pausing while the UAV returns for battery replacement, then returning to the same location and resuming collection with the same cartridge. A modification to this approach would be to use a single cartridge to collect air at the same location and time of day over multiple days, resulting in an average for that time period.
A major goal of ongoing development is to enable control of sampler functions and collection of sampler data from the tablet-based UAV control software, either manually or as part of a pre-programmed GPS-based flight algorithm. In the current version, the flight trajectory is programmed with the UAV control software, whereas the sampler operation is controlled by a stand-alone program on the Arduino Uno microcontroller, which is synchronized in time with the flight trajectory. In order to fully integrate these functions, real-time communication among the sampler, the UAV onboard computer, and the user control interface on the tablet is required. Communication between the sampler and user interface would also enable monitoring of the status of the valves and pump during the flight. The Arduino Uno microcontroller does not have the capability to communicate with the UAV onboard computer. To address this issue, the next step in the development is the replacement of the Arduino Uno microcontroller with a Raspberry Pi miniature computer, followed by development of the communication software.
Launching the UAV from a tower permitted the pilot to maintain visual contact during flight, as required by current regulations in many countries, including the USA. Appropriate towers may not be available in all locations, however. In the future, as regulations permit, navigation from the ground to above the canopy, aided by a camera for visualization, should be possible and would allow sampling in more remote and densely forested regions.
Together with the flight capabilities offered by modern-day UAV platforms, this sampler enables the study of VOC emission and uptake at previously inaccessible locations and scales. Specifically, UAVs are well suited to investigating variations in the type and magnitude of VOC emissions due to forest heterogeneity over distances of hundreds to thousands of meters. The resulting data can be used to improve VOC emission models and to better understand the interplay between VOC emissions and atmospheric chemistry, biodiversity, and ecosystem stress within the context of global climate change.
All data used in this study are included in tables in the main text or in the Supplement.
The supplement related to this article is available online at: https://doi.org/10.5194/amt-12-3123-2019-supplement.
KAM, DW, RAFS, ABG, and STM designed the research; KAM, DW, JY, JBdF, PCG, CEB, RAFS, EGA, DG, ABG, and STM performed the research; DG, JY, and JBdF analyzed the data; and KAM, JY, and STM wrote the paper.
The authors declare that they have no conflict of interest.
Support from the Harvard Climate Change Solutions Fund is gratefully acknowledged. The Museu de Amazonia of the Manaus Botanical Gardens kindly provided access and logistical support. A Senior Visitor Research Grant of the Amazonas State Research Foundation (FAPEAM) is acknowledged.
This paper was edited by Eric C. Apel and reviewed by two anonymous referees.
Alves, E. G., Jardine, K., Tota, J., Jardine, A., Yãnez-Serrano, A. M., Karl, T., Tavares, J., Nelson, B., Gu, D., Stavrakou, T., Martin, S., Artaxo, P., Manzi, A., and Guenther, A.: Seasonality of isoprenoid emissions from a primary rainforest in central Amazonia, Atmos. Chem. Phys., 16, 3903–3925, https://doi.org/10.5194/acp-16-3903-2016, 2016.
Alves, E. G., Tóta, J., Turnipseed, A., Guenther, A. B., Vega Bustillos, J. O. W., Santana, R. A., Cirino, G. G., Tavares, J. V., Lopes, A. P., Nelson, B. W., de Souza, R. A., Gu, D., Stavrakou, T., Adams, D. K., Wu, J., Saleska, S., and Manzi, A. O.: Leaf phenology as one important driver of seasonal changes in isoprene emissions in central Amazonia, Biogeosciences, 15, 4019–4032, https://doi.org/10.5194/bg-15-4019-2018, 2018.
ASTM D6196-15: Standard Practice for Choosing Sorbents, Sampling Parameters and Thermal Desorption Analytical Conditions for Monitoring Volatile Organic Chemicals in Air, ASTM International, West Conshohocken, PA, https://doi.org/10.1520/D6196-15, 2015.
Black, O., Chen, J., Scircle, A., Zhou, Y., and Cizdziel, J. V.: Adaption and use of a quadcopter for targeted sampling of gaseous mercury in the atmosphere, Environ. Sci. Pollut. R., 25, 13195–13202, https://doi.org/10.1007/s11356-018-1775-y, 2018.
Blake, R. S., Monks, P. S., and Ellis, A. M.: Proton-Transfer Reaction Mass Spectrometry, Chem. Rev., 109, 861–896, https://doi.org/10.1021/cr800364q, 2009.
Bryan, A. M., Bertman, S. B., Carroll, M. A., Dusanter, S., Edwards, G. D., Forkel, R., Griffith, S., Guenther, A. B., Hansen, R. F., Helmig, D., Jobson, B. T., Keutsch, F. N., Lefer, B. L., Pressley, S. N., Shepson, P. B., Stevens, P. S., and Steiner, A. L.: In-canopy gas-phase chemistry during CABINEX 2009: sensitivity of a 1-D canopy model to vertical mixing and isoprene chemistry, Atmos. Chem. Phys., 12, 8829–8849, https://doi.org/10.5194/acp-12-8829-2012, 2012.
Chameides, W., Lindsay, R., Richardson, J., and Kiang, C.: The role of biogenic hydrocarbons in urban photochemical smog: Atlanta as a case study, Science, 241, 1473–1475, https://doi.org/10.1126/science.3420404, 1988.
Chang, C. C., Wang, J. L., Chang, C. Y., Liang, M. C., and Lin, M. R.: Development of a multicopter-carried whole air sampling apparatus and its applications in environmental studies, Chemosphere, 144, 484–492, 2016.
Cross, E. S., Williams, L. R., Lewis, D. K., Magoon, G. R., Onasch, T. B., Kaminsky, M. L., Worsnop, D. R., and Jayne, J. T.: Use of electrochemical sensors for measurement of air pollution: correcting interference response and validating measurements, Atmos. Meas. Tech., 10, 3575–3588, https://doi.org/10.5194/amt-10-3575-2017, 2017.
DJI.com: DJI Matrice 600 Pro – DJI, available at: https://www.dji.com/matrice600-pro, last access: 29 May 2019.
DJI Downloads: Matrice 600 Specs, FAQ, Tutorials and Downloads – DJI, available at: https://www.dji.com/matrice600/info#downloads, last access: 29 May 2019.
Faiola, C. L., Erickson, M. H., Fricaud, V. L., Jobson, B. T., and VanReken, T. M.: Quantification of biogenic volatile organic compounds with a flame ionization detector using the effective carbon number concept, Atmos. Meas. Tech., 5, 1911–1923, https://doi.org/10.5194/amt-5-1911-2012, 2012.
Fichan, I., Larroche, C., and Gros, J. B.: Water Solubility, Vapor Pressure, and Activity Coefficients of Terpenes and Terpenoids, J. Chem. Eng. Data, 44, 56–62, https://doi.org/10.1021/je980070+, 1999.
Freire, L. S., Gerken, T., Ruiz-Plancarte, J., Wei, D., Fuentes, J. D., Katul, G. G., Dias, N. L., Acevedo, O. C., and Chamecki, M.: Turbulent mixing and removal of ozone within an Amazon rainforest canopy, J. Geophys. Res.-Atmos., 122, 2791–2811, https://doi.org/10.1002/2016JD026009, 2017.
Fuentes, J. D., Gu, L., Lerdau, M., Atkinson, R., Baldocchi, D., Bottenheim, J. W., Ciccioli, P., Lamb, B., Geron, C., Guenther, A., Sharkey, T. D., and Stockwell, W.: Biogenic hydrocarbons in the atmospheric boundary layer: a review, B. Am. Meteorol. Soc., 81, 1537–1575, https://doi.org/10.1175/1520-0477(2000)081<1537:bhitab>2.3.co;2, 2000.
Goldstein, A. H. and Galbally, I. E.: Known and unexplored organic constituents in the earth's atmosphere, Environ. Sci. Technol., 41, 1514–1521, https://doi.org/10.1021/es072476p, 2007.
Goldstein, A. H., Koven, C. D., Heald, C. L., and Fung, I. Y.: Biogenic carbon and anthropogenic pollutants combine to form a cooling haze over the southeastern United States, P. Natl. Acad. Sci., 106, 8835–8840, https://doi.org/10.1073/pnas.0904128106, 2009.
Greenberg, J. P., Guenther, A., Zimmerman, P., Baugh, W., Geron, C., Davis, K., Helmig, D., and Klinger, L. F.: Tethered balloon measurements of biogenic VOCs in the atmospheric boundary layer, Atmos. Environ., 33, 855–867, https://doi.org/10.1016/S1352-2310(98)00302-1, 1999.
Greenberg, J. P., Guenther, A. B., Ptron, G., Wiedinmyer, C., Vega, O., Gatti, L. V., Tota, J., and Fisch, G.: Biogenic VOC emissions from forested Amazonian landscapes, Glob. Change Biol., 10, 651–662, https://doi.org/10.1111/j.1365-2486.2004.00758.x, 2004.
Gu, D., Guenther, A. B., Shilling, J. E., Yu, H., Huang, M., Zhao, C., Yang, Q., Martin, S. T., Artaxo, P., Kim, S., Seco, R., Stavrakou, T., Longo, K. M., Tóta, J., de Souza, R. A. F., Vega, O., Liu, Y., Shrivastava, M., Alves, E. G., Santos, F. C., Leng, G., and Hu, Z.: Airborne observations reveal elevational gradient in tropical forest isoprene emissions, Nat. Commun., 8, 15541, https://doi.org/10.1038/ncomms15541, 2017.
Guenther, A., Karl, T., Harley, P., Wiedinmyer, C., Palmer, P. I., and Geron, C.: Estimates of global terrestrial isoprene emissions using MEGAN (Model of Emissions of Gases and Aerosols from Nature), Atmos. Chem. Phys., 6, 3181–3210, https://doi.org/10.5194/acp-6-3181-2006, 2006.
Harley, P., Vasconcellos, P., Vierling, L., Pinheiro, C. C. d. S., Greenberg, J., Guenther, A., Klinger, L., Almeida, S. S., Neill, D., Baker, T., Phillips, O., and Malhi, Y.: Variation in potential for isoprene emissions among Neotropical forest sites, Glob. Change Biol., 10, 630–650, https://doi.org/10.1111/j.1529-8817.2003.00760.x, 2004.
Hoker, J., Obersteiner, F., Bönisch, H., and Engel, A.: Comparison of GC/time-of-flight MS with GC/quadrupole MS for halocarbon trace gas analysis, Atmos. Meas. Tech., 8, 2195–2206, https://doi.org/10.5194/amt-8-2195-2015, 2015.
Karl, T., Guenther, A., Turnipseed, A., Patton, E. G., and Jardine, K.: Chemical sensing of plant stress at the ecosystem scale, Biogeosciences, 5, 1287–1294, https://doi.org/10.5194/bg-5-1287-2008, 2008.
Kesselmeier, J., Guenther, A., Hoffmann, T., Piedade, M. T., and Warnke, J.: Natural volatile organic compound emissions from plants and their roles in oxidant balance and particle formation, in: Amazonia and Global Change, American Geophysical Union, 183–206, 2013.
Kim, S., Guenther, A., and Apel, E.: Quantitative and qualitative sensing techniques for biogenic volatile organic compounds and their oxidation products, Environ. Sci.-Proc. Imp., 15, 1301, https://doi.org/10.1039/c3em00040k, 2013.
Klinger, L. F., Greenburg, J., Guenther, A., Tyndall, G., Zimmerman, P., M'Bangui, M., Moutsamboté, J. M., and Kenfack, D.: Patterns in volatile organic compound emissions along a savanna-rainforest gradient in central Africa, J. Geophys. Res.-Atmos., 103, 1443–1454, https://doi.org/10.1029/97jd02928, 1998.
Kravitz, B., Guenther, A. B., Gu, L., Karl, T., Kaser, L., Pallardy, S. G., Peñuelas, J., Potosnak, M. J., and Seco, R.: A new paradigm of quantifying ecosystem stress through chemical signatures, Ecosphere, 7, e01559, https://doi.org/10.1002/ecs2.1559, 2016.
Kuhn, U., Rottenberger, S., Biesenthal, T., Wolf, A., Schebeske, G., Ciccioli, P., Brancaleoni, E., Frattoni, M., Tavares, T. M., and Kesselmeier, J.: Seasonal differences in isoprene and light-dependent monoterpene emission by Amazonian tree species, Glob. Change Biol., 10, 663–682, https://doi.org/10.1111/j.1529-8817.2003.00771.x, 2004.
Laothawornkitkul, J., Taylor, J. E., Paul, N. D., and Hewitt, C. N.: Biogenic volatile organic compounds in the Earth system, New Phytol., 183, 27–51, https://doi.org/10.1111/j.1469-8137.2009.02859.x, 2009.
Lindinger, W., Hansel, A., and Jordan, A.: On-line monitoring of volatile organic compounds at pptv levels by means of proton-transfer-reaction mass spectrometry (PTR-MS) medical applications, food control and environmental research, Int. J. Mass Spectrom., 173, 191–241, https://doi.org/10.1016/S0168-1176(97)00281-4, 1998.
Linstrom, P. J. and Mallard, W. G. (Eds.): NIST Chemistry WebBook, NIST Standard Reference Database Number 69, National Institute of Standards and Technology, Gaithersburg MD, 20899, https://doi.org/10.18434/T4D303, 2019.
Markes International Ltd.: Thermal desorption technical support – Application Note 5: Advice on sorbent selection, tube conditioning, tube storage and air sampling, Markes International Ltd., 2014.
Millet, D. B., Donahue, N. M., Pandis, S. N., Polidori, A., Stanier, C. O., Turpin, B. J., and Goldstein, A. H.: Atmospheric volatile organic compound measurements during the Pittsburgh Air Quality Study: Results, interpretation, and quantification of primary and secondary contributions, J. Geophys. Res.-Atmos., 110, D07S07, https://doi.org/10.1029/2004JD004601, 2005.
Niinemets, Ü.: Mild versus severe stress and BVOCs: thresholds, priming and consequences, Trends Plant Science, 15, 145–153, https://doi.org/10.1016/j.tplants.2009.11.008, 2010.
Oliveira, A. N. D., Amaral, I. L. D., Ramos, M. B. P., Nobre, A. D., Couto, L. B., and Sahdo, R. M.: Composição e diversidade florístico-estrutural de um hectare de floresta densa de terra firme na Amazônia Central, Amazonas, Brasil (Translation: Composition and floristic-structural diversity of one hectare of dense terra firme forest in Central Amazonia, Amazonas, Brazil), Acta Amazon., 38, 627–641, 2008.
Pankow, J. F., Luo, W., Melnychenko, A. N., Barsanti, K. C., Isabelle, L. M., Chen, C., Guenther, A. B., and Rosenstiel, T. N.: Volatilizable Biogenic Organic Compounds (VBOCs) with two dimensional Gas Chromatography-Time of Flight Mass Spectrometry (GC × GC-TOFMS): sampling methods, VBOC complexity, and chromatographic retention data, Atmos. Meas. Tech., 5, 345–361, https://doi.org/10.5194/amt-5-345-2012, 2012.
Peñuelas, J. and Llusià, J.: BVOCs: plant defense against climate warming?, Trends Plant Sci., 8, 105–109, https://doi.org/10.1016/S1360-1385(03)00008-6, 2003.
Peñuelas, J. and Staudt, M.: BVOCs and global change, Trends in Plant Science, 15, 133-144, https://doi.org/10.1016/j.tplants.2009.12.005, 2010.
Pollmann, J., Ortega, J., and Helmig, D.: Analysis of atmospheric sesquiterpenes: Sampling losses and mitigation of ozone interferences, Environ. Sci. Technol., 39, 9620–9629, https://doi.org/10.1021/es050440w, 2005.
Pugh, T. A. M., MacKenzie, A. R., Langford, B., Nemitz, E., Misztal, P. K., and Hewitt, C. N.: The influence of small-scale variations in isoprene concentrations on atmospheric chemistry over a tropical rainforest, Atmos. Chem. Phys., 11, 4121–4134, https://doi.org/10.5194/acp-11-4121-2011, 2011.
Ribeiro, J. E. L. S., Nelson, B. W., Silva, M. F. D., Martins, L. S. S., and Hopkins, M.: Reserva Florestal Ducke: Diversidade E ComposiÇÃo Da Flora Vascular, Acta Amazon., 24, 19–30, https://doi.org/10.1590/1809-43921994242030, 1994.
Roldán, J., Joossen, G., Sanz, D., del Cerro, J., and Barrientos, A.: Mini-UAV Based Sensory System for Measuring Environmental Variables in Greenhouses, Sensors, 15, 3334–3350, https://doi.org/10.3390/s150203334, 2015.
Saylor, R. D.: The Atmospheric Chemistry and Canopy Exchange Simulation System (ACCESS): model description and application to a temperate deciduous forest canopy, Atmos. Chem. Phys., 13, 693–715, https://doi.org/10.5194/acp-13-693-2013, 2013.
Ventura Diaz, P. and Yoon, S.: High-Fidelity Computational Aerodynamics of Multi-Rotor Unmanned Aerial Vehicles, in: 2018 AIAA Aerospace Sciences Meeting, AIAA SciTech Forum, American Institute of Aeronautics and Astronautics, 2018.
Villa, T., Gonzalez, F., Miljievic, B., Ristovski, Z., and Morawska, L.: An Overview of Small Unmanned Aerial Vehicles for Air Quality Measurements: Present Applications and Future Prospectives, Sensors, 16, 1072, https://doi.org/10.3390/s16071072, 2016.
Wang, X., Situ, S., Guenther, A., Chen, F. E. I., Wu, Z., Xia, B., and Wang, T.: Spatiotemporal variability of biogenic terpenoid emissions in Pearl River Delta, China, with high-resolution land-cover and meteorological data, Tellus B, 63, 241–254, https://doi.org/10.1111/j.1600-0889.2010.00523.x, 2011.
Williams, B. J., Goldstein, A. H., Kreisberg, N. M., and Hering, S. V.: In situ measurements of gas/particle-phase transitions for atmospheric semivolatile organic compounds, P. Natl. Acad. Sci. USA, 107, 6676–6681, https://doi.org/10.1073/pnas.0911858107, 2010.
Woolfenden, E.: Sorbent-based sampling methods for volatile and semi-volatile organic compounds in air. Part 2. Sorbent selection and other aspects of optimizing air monitoring methods, J. Chromatogr. A, 1217, 2685–2694, https://doi.org/10.1016/j.chroma.2010.01.015, 2010a.
Woolfenden, E.: Sorbent-based sampling methods for volatile and semi-volatile organic compounds in air: Part 1: Sorbent-based air monitoring options, J. Chromatogr. A, 1217, 2674–2684, https://doi.org/10.1016/j.chroma.2009.12.042, 2010b.
Woolfenden, E. A. and McClenny, W. A.: Compendium Method TO-17: Determination of Volatile Organic Compounds in Ambient Air Using Active Sampling Onto Sorbent Tubes, US EPA, Cincinnati, OH, 1999.
Wyngaard, J. C. and Brost, R. A.: Top-Down and Bottom-Up Diffusion of a Scalar in the Convective Boundary Layer, J. Atmos. Sci., 41, 102–112, https://doi.org/10.1175/1520-0469(1984)041<0102:Tdabud>2.0.Co;2, 1984.
Yáñez-Serrano, A. M., Nölscher, A. C., Bourtsoukidis, E., Gomes Alves, E., Ganzeveld, L., Bonn, B., Wolff, S., Sa, M., Yamasoe, M., Williams, J., Andreae, M. O., and Kesselmeier, J.: Monoterpene chemical speciation in a tropical rainforest:variation with season, height, and time of dayat the Amazon Tall Tower Observatory (ATTO), Atmos. Chem. Phys., 18, 3403–3418, https://doi.org/10.5194/acp-18-3403-2018, 2018.
Zhao, Y., Kreisberg, N. M., Worton, D. R., Teng, A. P., Hering, S. V., and Goldstein, A. H.: Development of an In Situ Thermal Desorption Gas Chromatography Instrument for Quantifying Atmospheric Semi-Volatile Organic Compounds, Aerosol Sci. Tech., 47, 258–266, https://doi.org/10.1080/02786826.2012.747673, 2013.