the Creative Commons Attribution 4.0 License.
the Creative Commons Attribution 4.0 License.
 | 17 Jun 2019
Simultaneous measurement of NO and NO2 by a dual-channel cavity ring-down spectroscopy technique
Zhiyan Li
Renzhi Hu
Pinhua Xie
Hao Chen
Xiaoyan Liu
Shuaixi Liang
Dan Wang
Fengyang Wang
Yihui Wang
Chuan Lin
Jianguo Liu
Wenqing Liu
Nitric oxide (NO) and nitrogen dioxide (NO2) are relevant to air quality due to their roles in tropospheric ozone (O3) production. In China, NOx emissions are very high and NOx emissions exhausted from on-road vehicles make up 20 % of total NOx emissions. In order to detect the NO and NO2 emissions on road, a dual-channel cavity ring-down spectroscopy (CRDS) system for NO2 and NO detection has been developed. In the system, NO is converted to NO2 by its reaction with excess O3 in the NOx channel, such that NO can be determined through the difference between two channels. The detection limits of NO2 and NOx for the system are estimated to be about 0.030 (1σ, 1 s) and 0.040 ppb (1σ, 1 s), respectively. Considering the error sources of NO2 absorption cross section and RL determination, the total uncertainty of NO2 measurements is about 5%. The performance of the system was validated against a chemiluminescence (CL) analyser (42i, Thermo Scientific, Inc.) by measuring the NO2 standard mixtures. The measurement results of NO2 showed a linear correction factor (R2) of 0.99 in a slope of 1.031±0.006, with an offset of () ppb. An intercomparison between the system and a cavity-enhanced absorption spectroscopy (CEAS) instrument was also conducted separately for NO2 measurement in an ambient environment. Least-squares analysis showed that the slope and intercept of the regression line are 1.042±0.002 and () ppb, respectively, with a linear correlation factor of R2=0.99. Another intercomparison conducted between the system and the CL analyser for NO detection also showed a good agreement within their uncertainties, with an absolute shift of (0.352±0.013) ppb, a slope of 0.957±0.007 and a correlation coefficient of R2=0.99. The system was deployed on the measurements of on-road vehicle emission plumes in Hefei, and the different emission characteristics were observed in the different areas of the city. The successful deployment of the system has demonstrated that the instrument can provide a new method for retrieving fast variations in NO and NO2 plumes.


In recent years, with the improvement of people's living standards, more and more attention is given to the improvement of the living environment. Thus the management of environmental pollution has gradually become one of the focus issues, and it is believed that the detection of pollutants is prerequisite for environmental governance. As one of the main air pollutants, NOx () is well known as one by-product of organic decay, the emission from natural forest fires, and the main anthropogenic emission from both stationary sources (electric power generation using fossil fuels) (Jaramillo and Muller, 2016) and mobile sources (motor vehicles and catalytic converters of most cars) (Carslaw, 2005). NOx can determine the tropospheric O3 levels and lead to the formation of photochemical “smog”. Furthermore, NOx is also known as the precursor of nitric acid (Brown et al., 2004). In addition, NOx can do harm to the human body and animals by damaging the respiratory system and leading to pulmonary edema (Yang and Omaye, 2009). Moreover, it is believed that accurate NO2 measurement plays a key role in accurate measurement of other species, such as organic nitrate (Thieser et al., 2016; Paul et al., 2009; Day et al., 2002) and RO2 radicals (Chen et al., 2016).
During the last few years, many direct and indirect techniques for monitoring NO2 have been established, such as chemiluminescence (CL) detection (Yuba et al., 2010; Sadanaga et al., 2008; Fahey et al., 1985), differential optical absorption spectroscopy (DOAS) (Platt et al., 1984; McLaren et al., 2010), tunable diode laser absorption spectroscopy (TDLAS) (Li et al., 2004), cavity ring-down spectroscopy (CRDS) (Castellanos et al., 2009; Fuchs et al., 2009, 2010; Osthoff et al., 2006; Brent et al., 2013; Hu et al., 2016), cavity-enhanced absorption spectroscopy (CEAS) (Wu et al., 2009; Gherman et al., 2008; Kasyutich et al., 2006; Wada and Orr-Ewing, 2005), cavity-attenuated phase shift spectroscopy (CAPS) (Kebabian et al., 2008), laser-induced fluorescence (LIF) (Taketani et al., 2007; Matsumi et al., 2010; Sadanaga et al., 2014; Matsumoto et al., 2001), long-path absorption photometry (LOPAP) (Villena et al., 2011) and gas-based sensing (Novikov et al., 2016), with CL being the most widely used for in situ ambient sampling. CL can achieve direct measurement of NO and indirect measurement of NO2. The method is based on the reaction between NO and O3, which can form an electronically excited molecule of NO2*. When NO2* reaches the ground state, it emits fluorescence, which is proportional to the initial NO concentration. NO2 is measured indirectly by conversion to NO firstly through heated (300 to 350 ∘C) molybdenum (Mo) surfaces (Ridley and Howlett, 1974) or photolytic NO2 converters like Xenon lamps or UV-emitting diodes at specific wavelengths (320–400 nm). The CL instruments have typical NO2 detection limits of 50 ppt min−1 (1σ) (Wang et al., 2001). By contrast, CRDS, CEAS, CAPS and TDLAS, generally relying on scanning a light source through a range of frequencies of interest, are all direct absorption techniques. It has been demonstrated that these optical methods can achieve a high detection sensitivity and the detection limit is several parts per trillion with a time resolution of several seconds (Li et al., 2004; Wild et al., 2014; Gherman et al., 2008; Kebabian et al., 2008). Among these techniques, CRDS has become a promising technique for ambient NO2 detection due to its advantages of high time resolution, low detection limit and portability, in which pulsed (Fuchs et al., 2009) or continuous-wave (cw) lasers (Wada and Orr-Ewing, 2005) were utilised. Wada and Orr-Ewing (2005) demonstrated a cw diode CRDS system operating at 410 nm for the retrieval of NO2 mixing ratios in ambient air with a detection limit of 0.1 ppb in 50 s at atmospheric pressure. Osthoff et al. (2006) constructed a pulsed cavity ring-down spectrometer where a pulsed (20–100 Hz, up to 25 mJ) frequency-doubled Nd:YAG laser was used for the simultaneous measurements of NO2, nitrate radical (NO3), and dinitrogen pentoxide (N2O5) in the atmosphere, and the detection limit of 40 ppt (1σ) for 1 s data was achieved for NO2 with an uncertainty within ±4 % under laboratory conditions. Fuchs et al. (2009) used a simple, lightweight, low-power, and commercially available Fabry–Pérot (FP) diode laser with a centre wavelength of 403.96 nm as a light source to detect NO and NO2 in two separate channels. The limit of detection is 22 ppt (2σ precision) for NO2 at 1 s time resolution. Karpf et al. (2016) used a high-power, multimode Fabry–Pérot (FP) diode laser with a broad wavelength range (Δλlaser∼0.6 nm) to excite a large number of cavity modes, thereby reducing the susceptibility of the detector to vibration and making it well suited for field deployment. A sensitivity of 38 ppt was achieved using an integration time of 128 ms for single-shot detection in their work. To evaluate the uncertainty and the accuracy of the aforementioned individual instruments, a number of intercomparison studies have been carried out (Xu et al., 2013; Dunlea et al., 2007; Villena et al., 2012). The comparison results show that the method based on Mo converters can be affected by significant interferences such as N2O5, HONO, HNO3, PAN, etc., whereas the method based on optical absorption is relatively immune to interferences. Therefore, direct techniques are considered to be more reliable methods than the CL method for the measurement of NO2 and have been adopted gradually in field experiments (Ayres et al., 2015; Wagner et al., 2013; Sobanski et al., 2016).
In addition to the direct measurement of NO with the CL method, NO concentrations can also be measured directly based on their absorption feature at 1585.282 cm−1. For example, a tunable infrared laser differential absorption spectroscopy (TILDAS) instrument based on an infrared distributed feedback (DFB) laser emitting sequentially at 1600 and 1900 cm−1 has been used by Jagerska et al. for the measurement of NO and NO2 (Jagerska et al., 2015), where an astigmatic multi-pass Herriott cell (Herndon et al., 2004) and a dual-wavelength spectrometer are utilised. The 1 s precision for NO measurement of the TILDAS instrument was 550 ppt, whereas that for the field experiments was 1.5 ppb. Compared with the CL method, it seems that this technique may suffer from low detection sensitivity. Given the rapid changes of nighttime oxidation, i.e. NO3 radical, the rapid changes of its precursors NO and NO2 are thus a prerequisite for developing a nighttime atmospheric chemistry model. To achieve high sensitivity and high resolution, conversion to NO2 by adding excess O3 may be one of the best methods for NO detection (Fuchs et al., 2009; Wild et al., 2014).
The developments of different technologies provide the potential for NOx measurements on different platforms such as ground sites, vehicles and aircraft (Yamamoto et al., 2011; Wagner et al., 2011; Castellanos et al., 2009). Due to the rapid economic growth in 2000–2010, China has become the second largest economy in the world. With the rapid growth of energy consumption, NOx emissions are increasing. Motor vehicles are one of the major sources for NOx, especially in urban areas (Westerdahl, 2008). Exhaust from on-road vehicles makes up 20 % of total NOx emissions in China (Shi et al., 2014). So various methods have been used to measure the vehicle emissions to assess exposure to air pollutant and specifical impacts due to traffic-related emissions (Vogt et al., 2003; Carslaw and Beevers, 2004; Herndon et al., 2005; Lal et al., 2005; Burgard et al., 2006a, b; Hueglin et al., 2006; Wild et al., 2017). However, the measurements were usually carried out at several fixed locations in large cities, which is not adequate to show the large scale patterns of the cities. Hence, a direct on-road mobile instrument is needed to obtain the spatial and temporal variations in NOx pollutants.
In this work, a dual-channel CRDS system has been developed based on the chemical conversion of NO to NO2, which realises the simultaneous measurement of NO2 and NOx. In one channel, only ambient NO2 is measured. In another channel, the sum of ambient NO2 and the converted NO2 from ambient NO is determined to provide a direct measurement of NOx. Then the difference of the two channels provides a direct measurement of NO. To assess the accuracy of the dual-channel CRDS instrument, contrast measurements and comparison were conducted between the dual-channel CRDS instrument and other instruments. In addition, the instrument was deployed in the measurement of on-road vehicle emission plumes in the city of Hefei, China, on 17 December 2018 and 25 February 2019. The main advantages of this instrument compared with CL instruments are its low detection limit and high sensitivity as well as its potential ability for trace measurements without calibration and interferences.
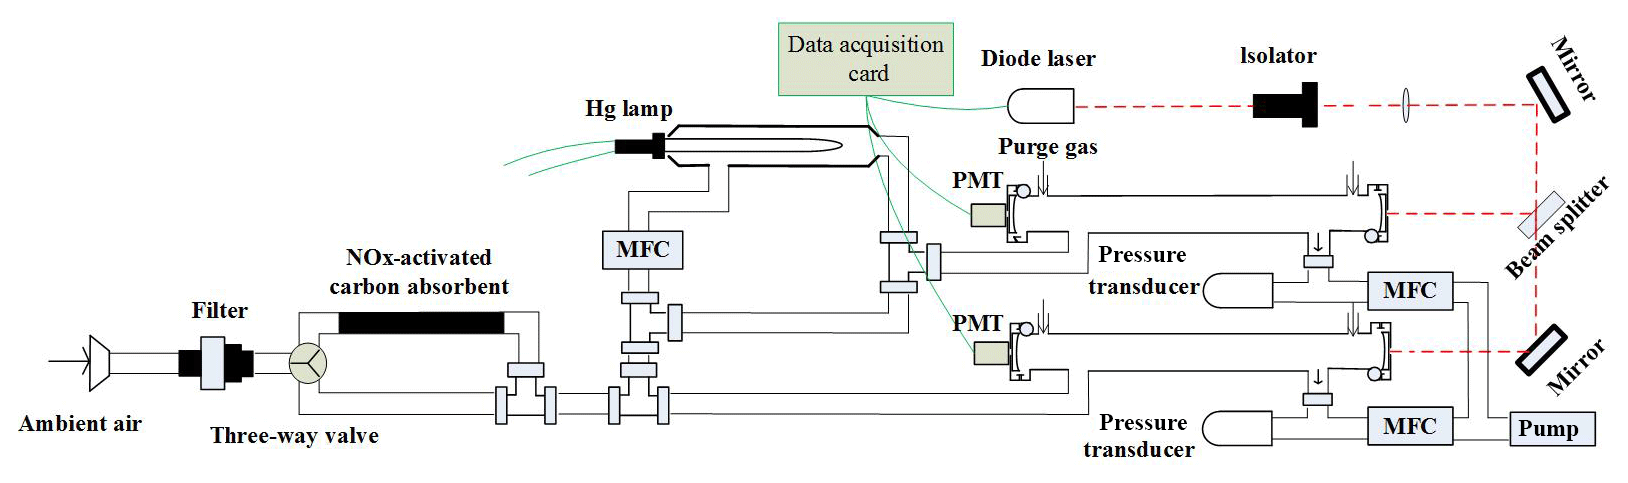
Due to its high detection sensitivity, cavity ring-down spectroscopy has been applied to measurement NO3 radical and N2O5 in our group (Wang et al., 2015; Li et al., 2018a, b). In this work, the technique was applied to measure NO2 and NO simultaneously. A schematic diagram of the dual-channel CRDS system developed in the present work is shown in Fig. 1. The instrument mainly consists of two identical cavities for NO2 and NOx detection, a gas handling system, a NO convertor and an activated carbon device for NOx removal.
2.1 CRDS systems
A blue diode laser is used as the light source and the wavelength of the laser is monitored in real time by a spectrometer. The output of the diode laser, with a centre wavelength at 403.64 nm and a line width of 0.5 nm, is directly modulated by a square wave signal (on/off) at a repetition of 2 kHz with a duty cycle of 50 %. And generally the output power is about 60 mW. The laser beam first passes through an isolator to prevent the reflected light back into the laser cavity, is then divided into two approximately equal beams after a 50∕50 beam splitter and enters into two identical cavities separately. Each optical cavity is made of an aluminum tube with an inner diameter of 9.4 cm, which is fixed rigidly by a separate frame. Two high-reflectivity mirrors are held in stable, adjustable mounts. The distance between the two highly reflective mirrors (LGR, 1 in diameter, 1 m radius of curvature) in each channel is 75 cm, which corresponds to the ring-down time constants of 22.90 and 24.12 µs for NOx and NO2 cavities in zero air. The light emitted through the back mirror of the cavity passes through a narrowband filter to filter stray light, and then is directed into a photomultiplier tube (PMT). The signal is amplified firstly, then acquired with a digital acquisition card (NI USB-6361, 16-bit, 2.0 Ms s−1). The sampling frequency for each digital acquisition card is 1 MHz. During a continuous 1.0 s data acquisition period, 2000 decay traces are transferred to the PC using a single transfer command and averaged to get a fitted decay trace at a laser modulation rate of 2 KHz. NO2 concentrations can be calculated according to Eq. (1) from the ring-down times, τ and τ0, the ring-down times when the NO2 is in the presence and absence of the cavity, respectively; the NO2 absorption cross section, RL, is the ratio of the total cavity length to the length over which the absorber is present in the cavity, and c is the speed of the light.
2.2 NO convertor
NO is measured by its conversion to NO2 in the presence of excess O3. The principle is based on the following chemical equation (Sander et al., 2006).
where cm3 molec.−1 s−1. Ozone is produced from O2 photolysis at 185 nm by flowing 100 sccm (standard cubic centimetres per minute) of sampling air over a low-pressure discharge mercury lamp. The mercury lamp is inset into a quartz glass tube with a length of 50 mm and an inner diameter of 10 mm. The flow rate passing through the mercury lamp was controlled by a mass flowmeter controller (MFC) and the resulting mixing ratio of O3 was detected by an O3 analyser (49i, Thermo Scientific). The O3 concentration is approximately 11.2 ppm after mixing with the sampled air. A Teflon tubing (length 1 m, i.d. 3.8 mm) serves as a reactor for the NO conversion.
2.3 Activated carbon device
Accurate measurement of the ring-down time, τ0, when there is not any absorber in the cavity, is pivotal for accurately retrieving the absorber concentration in a practical measurement as well as for checking the cleanliness of the cavity mirrors. Usually zero air or chemical scrubber is used to acquire zeros (Wada and Orr-Ewing, 2005). In our system, zeros are obtained by passing sampled air through an activated carbon-filled tube with a length of 26.0 cm and an outer diameter of 6.0 cm. The τ0 is measured for 60 s every 10–16 min. It is found that this frequency of zero measurements is sufficient to track drifts in zero ring-down time constant measurements, i.e. the fluctuation of τ0 is less than 0.1 % for 15 min intervals.
2.4 Gas handling system
The gas handling system of the instrument consists of a sampling module and a purge flow. The sampled air initially flows through a filter device, where a filtering membrane (1 µm pore size) is loaded to prevent light-scattering aerosols from entering the cavity. And subsequently it will pass through the activated carbon device to provide the background measurement or enter the PFA tube directly just depending on whether the three-way solenoid valve is open or closed. After the PFA tube, the air flow is divided into three lines. The first flow (100 sccm) is introduced into a quartz flow tube equipped with a mercury pen-ray lamp (Oriel 6035) to generate O3 by air photolysis as mentioned, then it will be merged with the second sampling flow (900 sccm) and pulled into the NOx cavity. The third one with a flow rate of 1 slm (standard litres per minute) is directed into the NO2 cavity. The whole system is pumped by a rotary pump (K86KNE) and the flow rates of the different lines are controlled by mass flow controllers separately. To prevent the degradation of the mirror reflectivity, each mirror is continuously flushed with high-purity nitrogen at a rate of 25 mL min−1 to avoid the potential pollution from the sample flow.
3.1 Determination of absorption cross sections
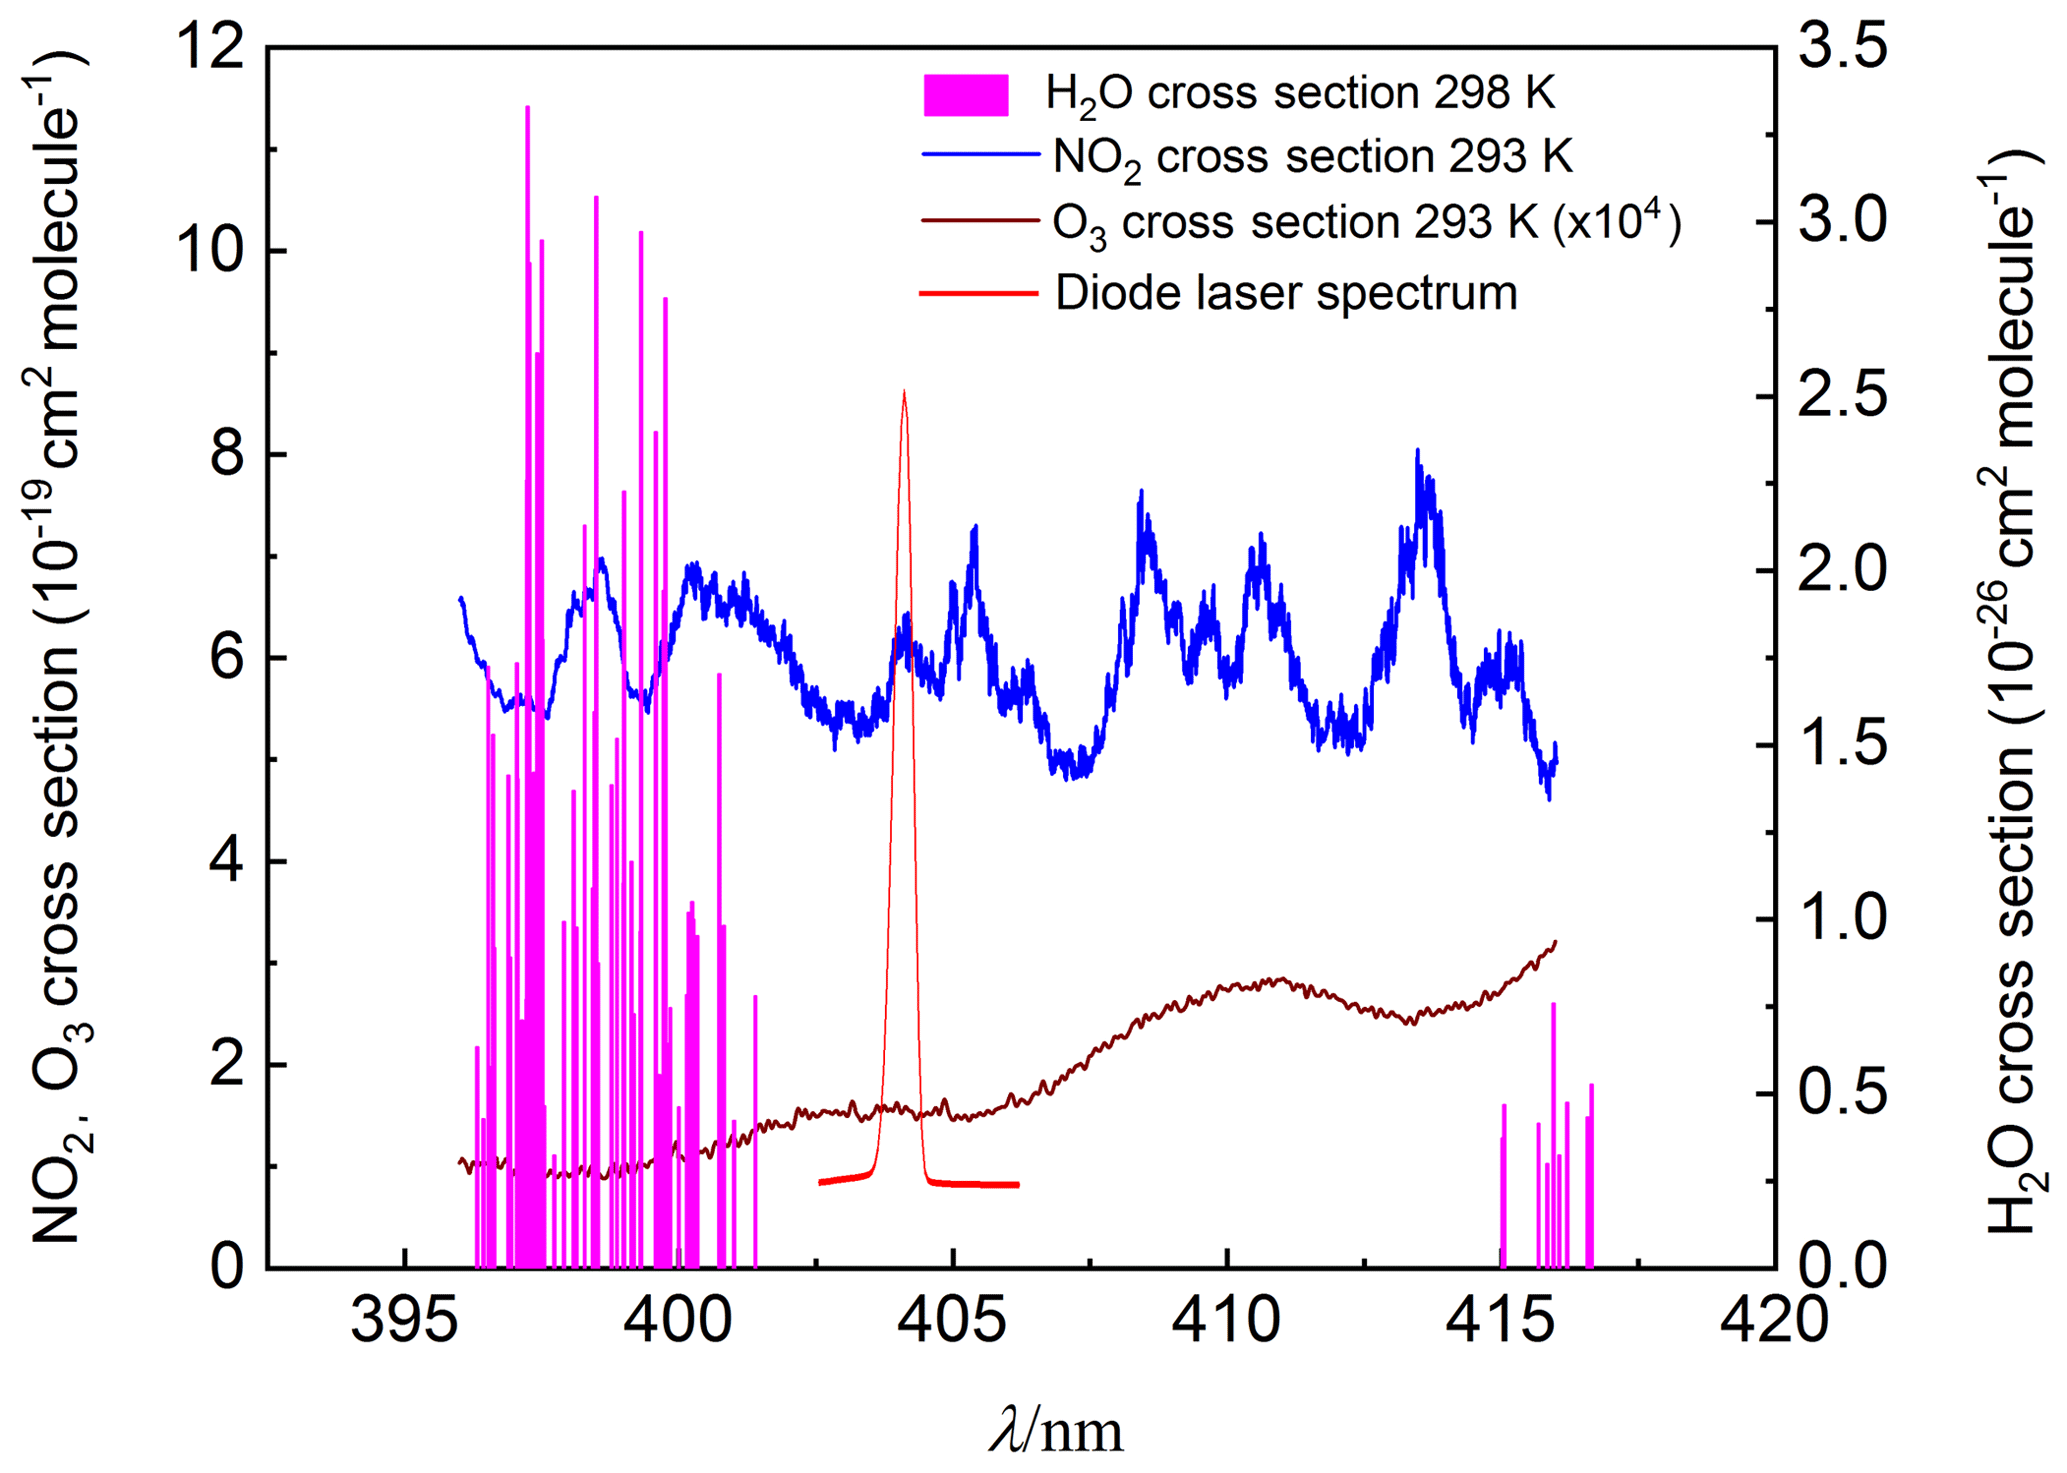
To retrieve the gas concentration, it is prerequisite to determine the effective absorption cross section at peak absorption of the laser. The output waveforms of the laser, with a centre wavelength of 403.64 nm and full width at half maximum of 0.5 nm, was monitored by a spectrometer (QEPB0828) (red line shown in Fig. 2). The centre wavelength selected can cover the strong absorption of NO2 and avoid the interference from other species, such as H2O (pink line in Fig. 2). The effective absorption cross section was determined to be cm2 molecule−1 by convoluting the NO2 absorption cross section with the laser spectrum (blue line in Fig. 2) using Voigt profile (Voigt et al., 2002). It is well known that a shift in the laser centre wavelength would result in a change in the effective NO2 cross section, so the laser output was monitored as the index of the day-to-day variability of the laser centre wavelength. It was shown that the variability is less than 1 % during the few experiment days. The largest uncertainty of the absorption cross section is about 3 % according to Voigt (Voigt et al., 2002).

Figure 3Different cavity ring-down signals and fitting results in the absence and presence of NO2. The small figure in the upper right corner is the fitting residual.
3.2 The retrieval of RL
Due to the purge gas to the mirrors, the RL value cannot be simply determined by the ratio of the distance between two mirrors to that between the inlet and outlet. The RL value of the system was determined from the absorption measurement of various concentrations of NO2 ranging from 20 to 70 ppb with or without purge flow. The ratio of the two extinction measurements yielded a RL value, which is independent of the cross section and the concentration of NO2. The RL value is determined to be 1.10±0.03 for both the NOx and NO2 channels.
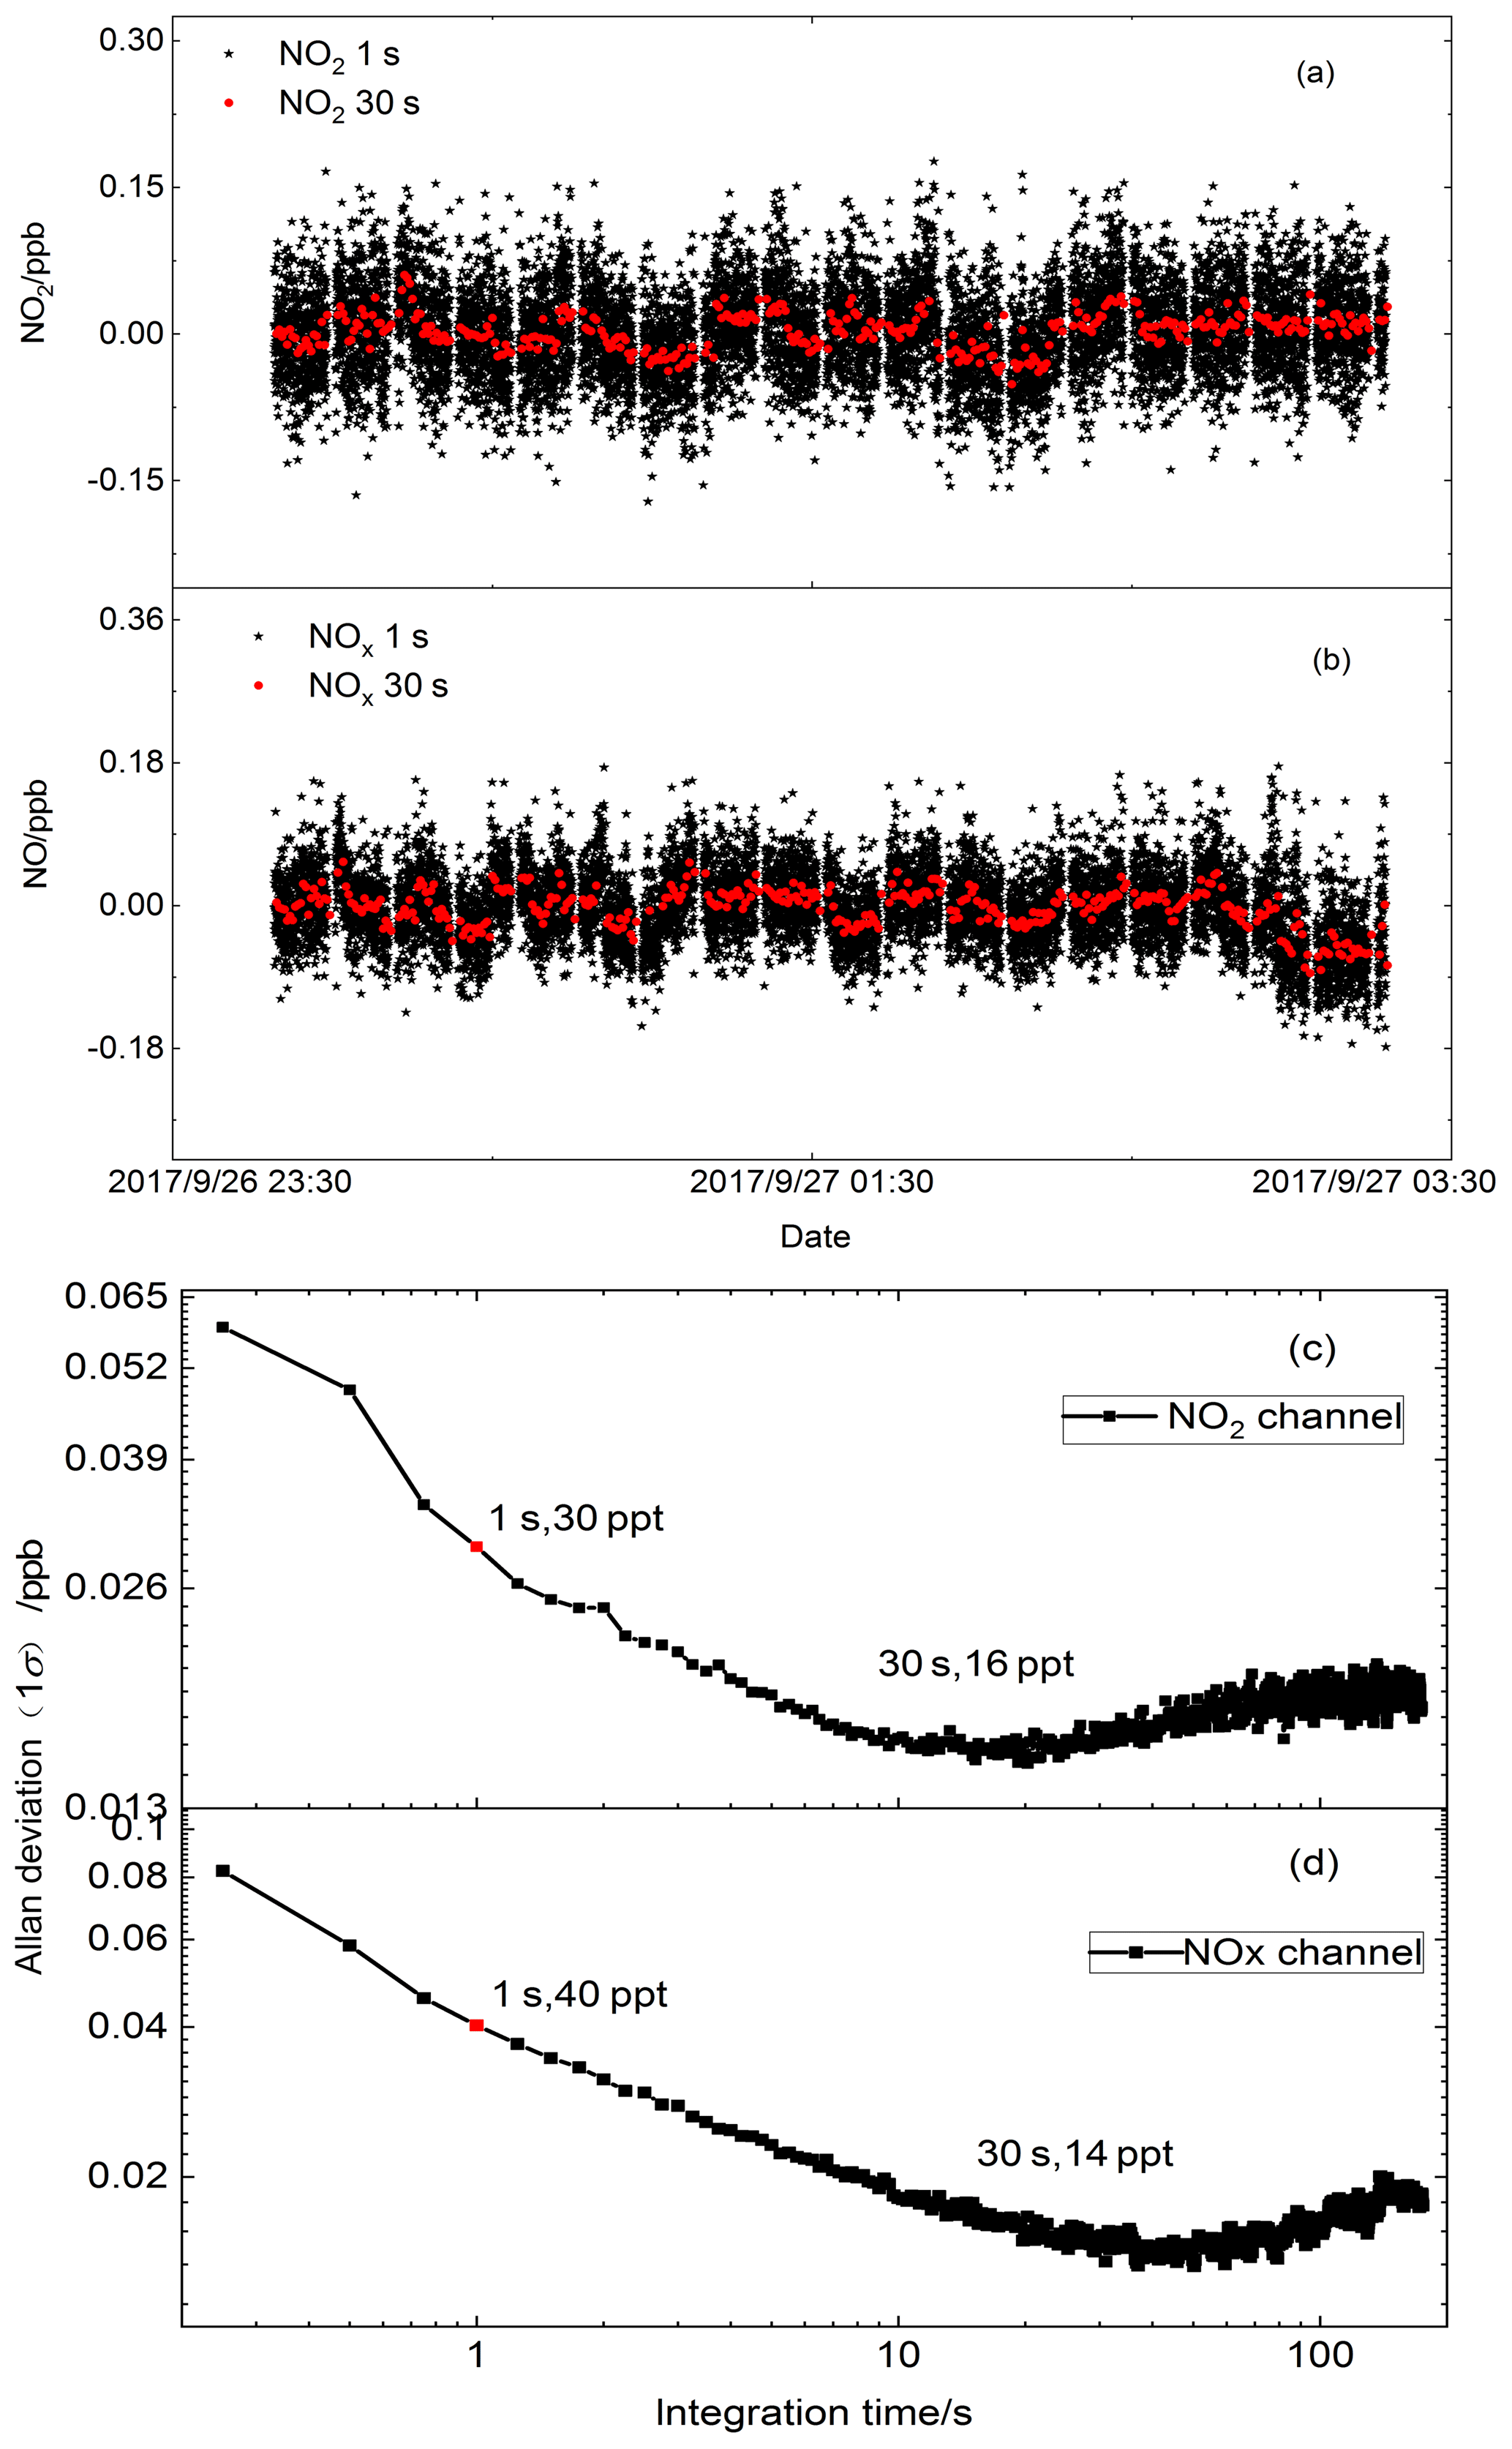
Figure 4(a, b) Continuous time series measurement when the instrument sampled only zero air, averaged to 1 s for NO2 and NOx channels (black dots); the red dots show the data averaged to 30 s. (c, d) Allan deviation plots for NO2 concentration in two channels. The minimum value equals the optimum integration time.
3.3 The retrieval of τ0
In order to accurately determine the concentrations of trace gases by CRDS, it is very important to confirm background cavity loss measurements of τ0 when the target gases are not inside the cavity. Several alternative background measurement methods have been reported, where various kinds of air were used as background gas, such as zero air, a mixture of oxygen and nitrogen, chemically scrubbed laboratory air (using hydroxyapatite), and laboratory air sampled through the stainless-steel tubing coil (Wada and Orr-Ewing, 2005). In our instrument, an activated carbon device was used for background measurement. The ring-down times when the sampled air pass through the activated carbon device were determined to be 24.12±0.01 and 22.90±0.01 µs in two cavities, respectively. These values are close to those of measurements of zero air at the same sample rate for a 15 min period.
Two representative ring-down signals corresponding to with and without NO2 in the cavity for the CRDS system are shown in Fig. 3. And the fitted ring-down times were 24.12 and 20.30 µs, so that the NO2 concentration is determined as 20.28 ppb using the constants determined above.
3.4 Detection limit and measurement accuracy of two cavities
The measurement precision of the dual-channel CRDS instrument for NO2 and NOx detection was investigated with time series measurement of zero air (Fig. 4). The acquisition time for the spectral data was 1.0 s with an average of 2000 spectra. In order to analyse the stability of the instrument, the Allan variance had been calculated for the intensity measurements. For the two channels, the 1σ detection limits were 30 and 40 ppt (1 s) for the NO2 and NOx channels, respectively. The minima in the Allan plots indicated that the optimum average times for optimum detection performance (Fig. 4c, d) is about 30 s. With 30 s integration time, the 1σ detection limits were 16 and 14 ppt for the NO2 and NOx channels, respectively.
The minimum detection can be written as follows:
For continuous zero NO2 measurements, the Δτ0 was 0.008 µs in both NOx and NO2 channels and τ0 was 22.90 and 24.12 µs in NOx and NO2 channels, respectively, for 1 s averaging. Given the RL value to be 1.10 and σ to be molec. cm−2, the 1σ minimum detection limits for the NOx and NO2 channels were determined as 39 and 35 ppt, respectively, at an integration time of 1 s, which are close to the Allan variance analysis described above.
The total uncertainty of NO2 measurement by CRDS is expected to be from the uncertainties on the measurement of the RL and NO2 absorption cross section. The uncertainty in RL was determined to be less than 3 %, and the uncertainty in the NO2 absorption cross section was about 4 %, so the total uncertainty of NO2 measurement was estimated to be 5 % for the system in this work.
Compared with the existing field measurement techniques for NO2 measurements, it seems that the minimum detection and uncertainty of this instrument are superior to the other methods (see Table 1).
3.5 NO conversion efficiency
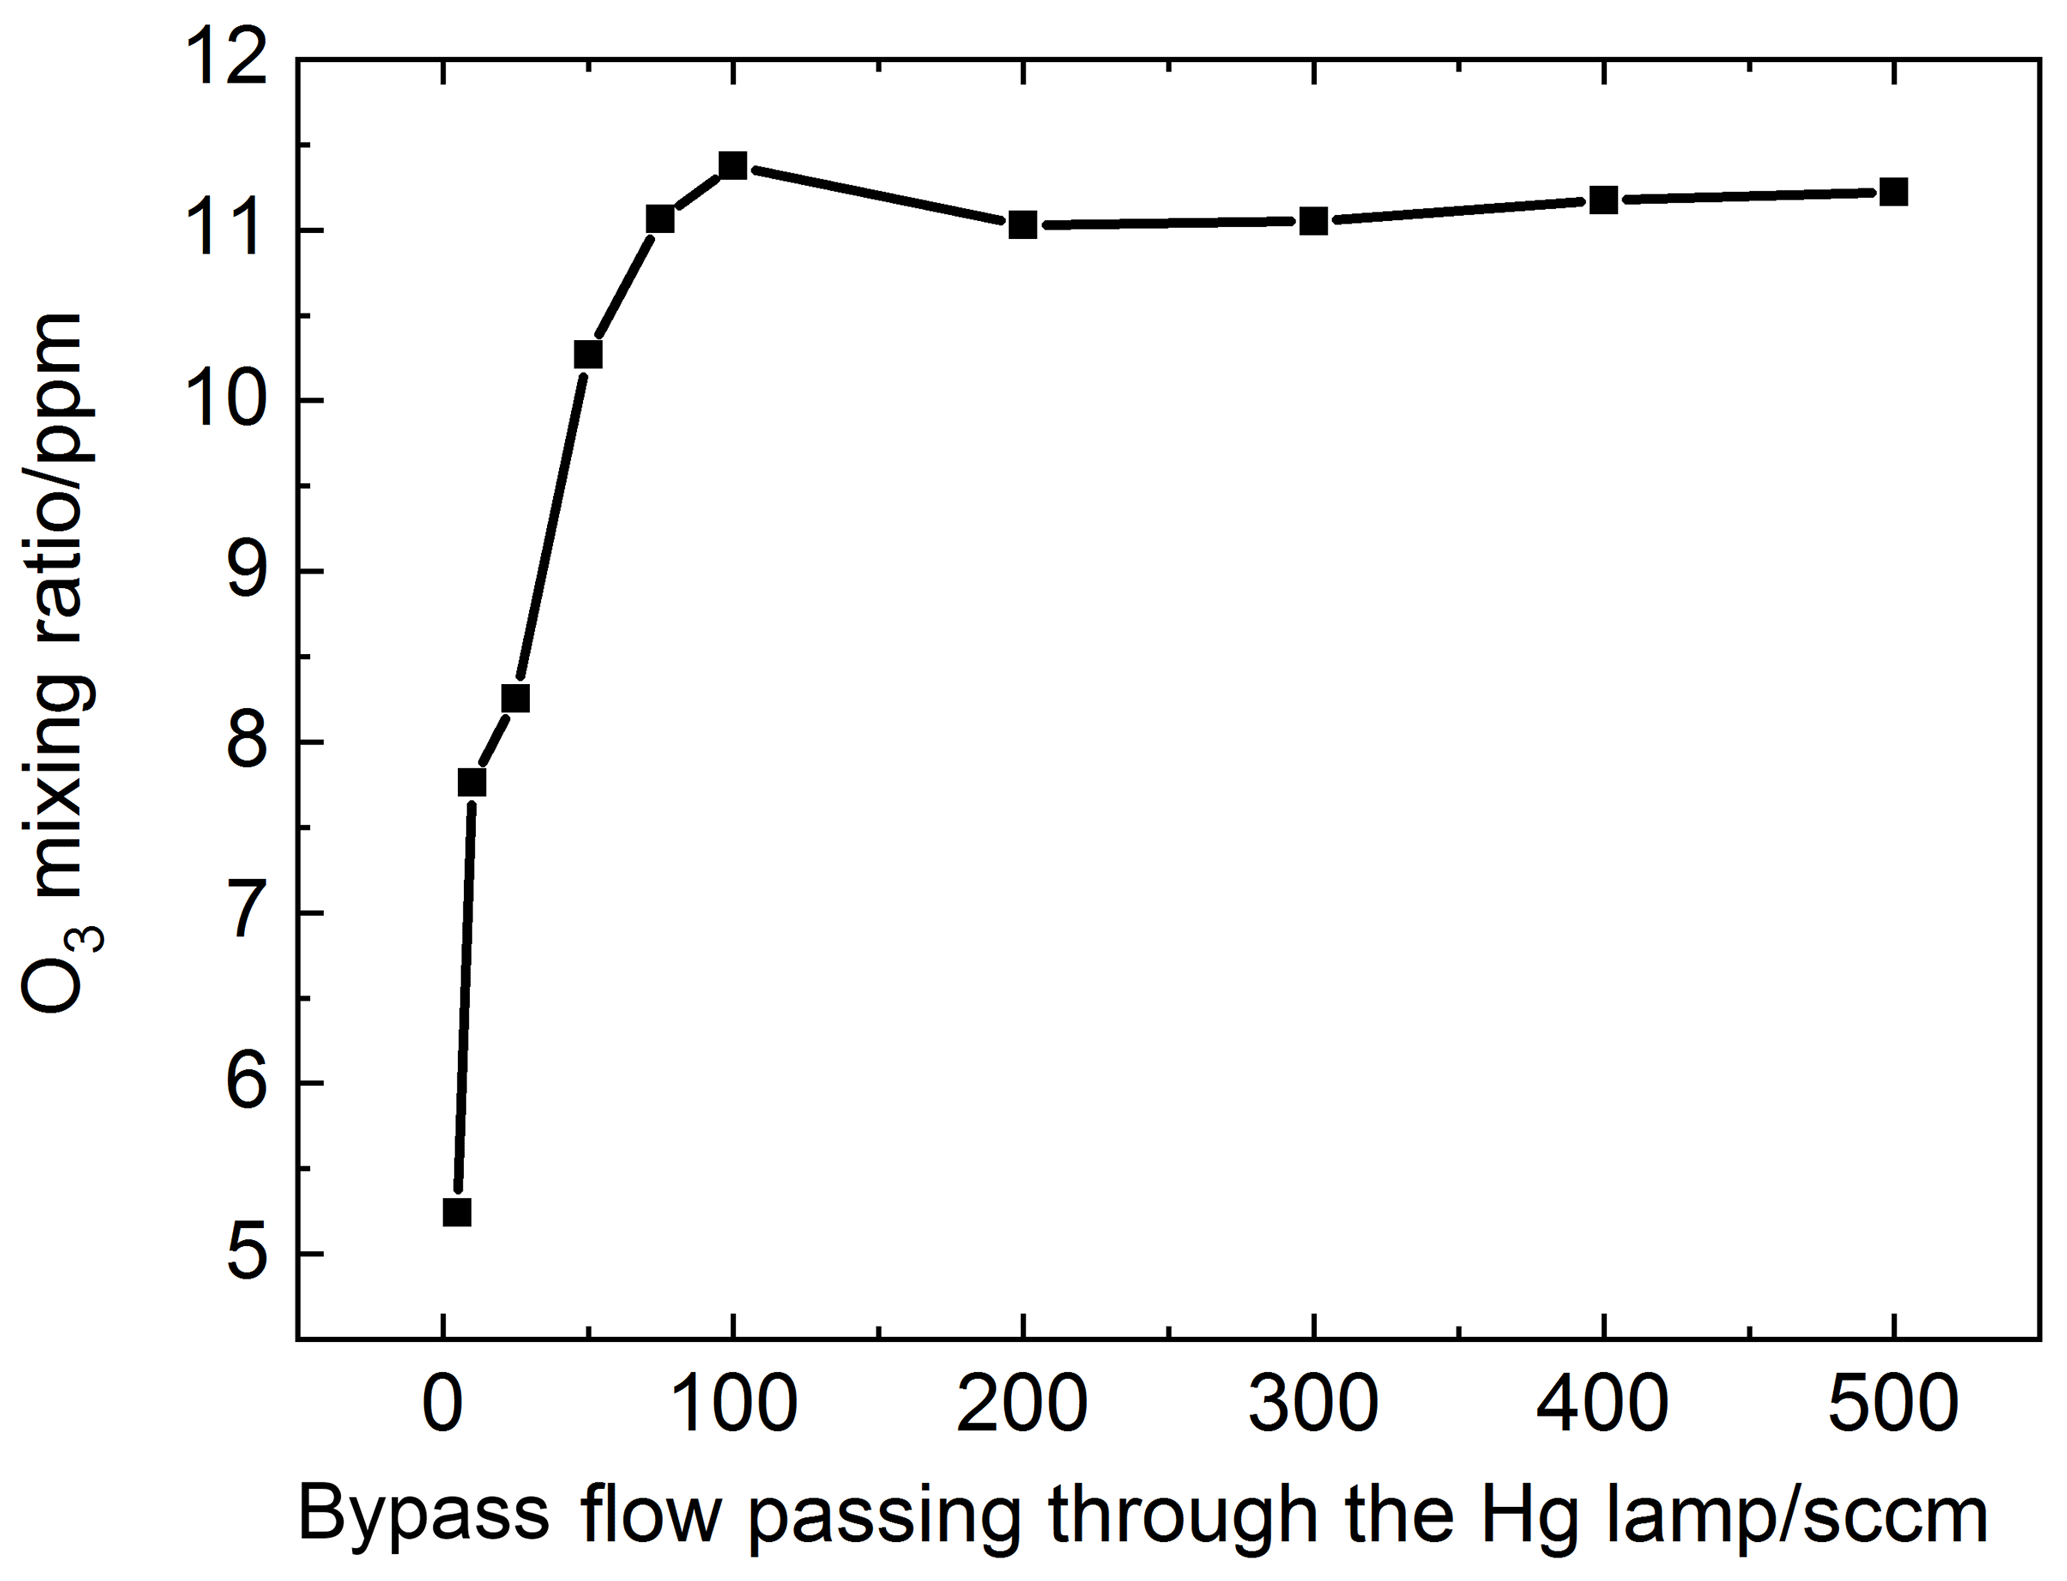
The main influence factor on the NO conversion efficiency is the flow rate passing through the mercury pen-ray lamp as it can determine the generated O3 concentration. The mixing ratio of O3 in the NOx channel line was investigated, which changes with the flow rate that passes through the mercury pen-ray lamp. The result is shown in Fig. 5. As a result, the bypass flow passing through the Hg lamp was determined to be 100 sccm. Under this flow rate, when the residence time of O3 in the cavity is 1 s and the ambient NO2 concentration is 50 ppb, NO conversion efficiency with different NO concentrations (10–1000 ppb) was simulated and NO conversion efficiency in the range of experimental concentrations is larger than 98 %.
Table 1Comparison of NO2 detection limits based on optical methods.
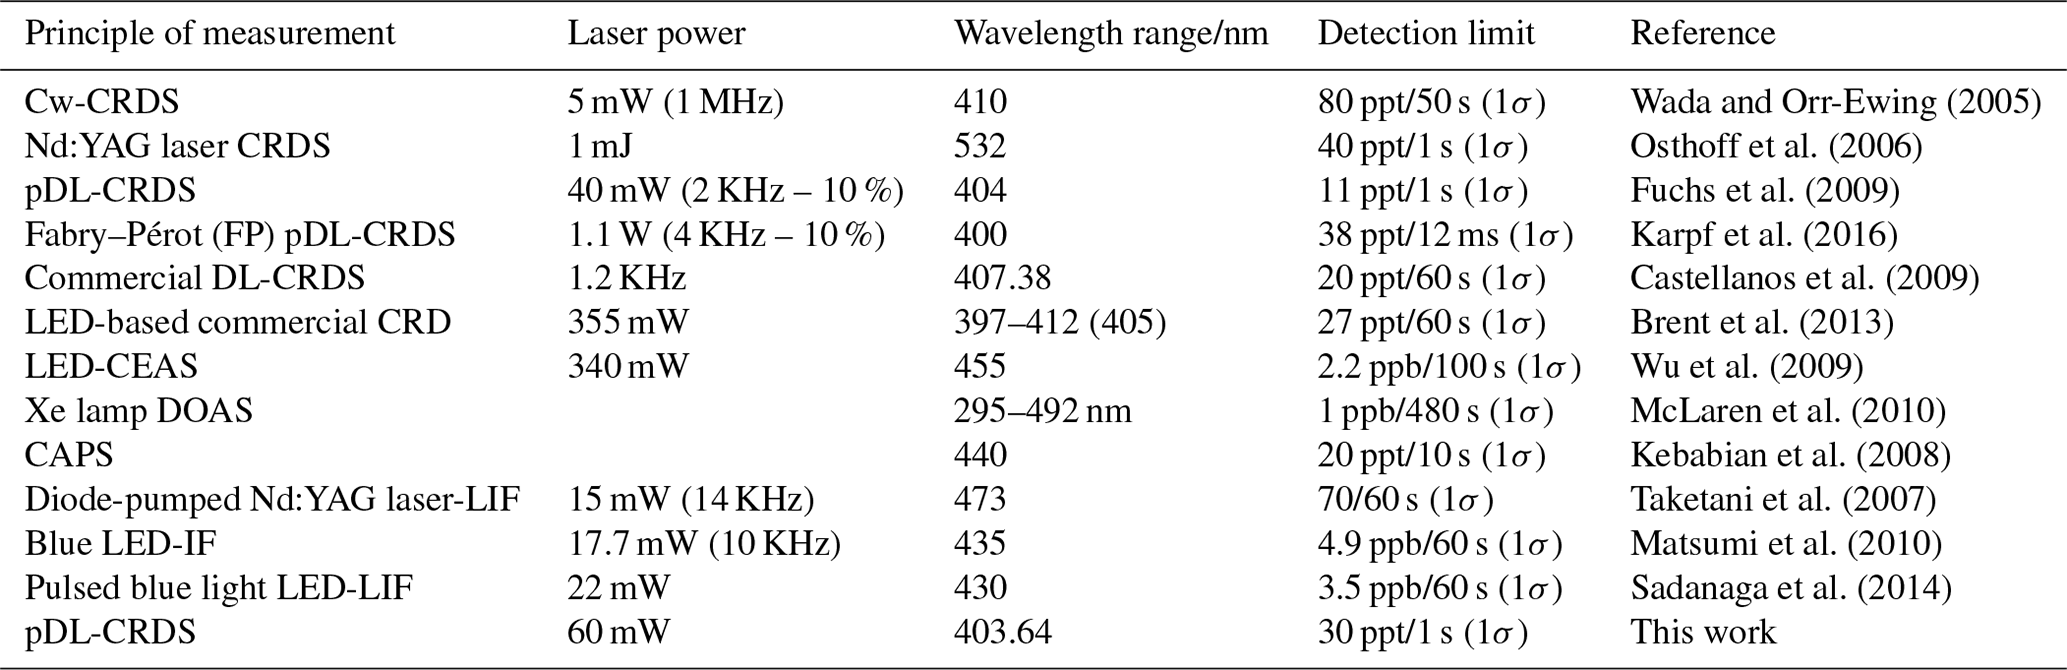
CRDS: cavity ring-down spectroscopy; CEAS: cavity-enhanced absorption spectroscopy; BB: broadband; DOAS: differential optical absorption spectroscopy; cw: continuous-wave diode laser; LIF: laser-induced fluorescence; CAPS: cavity-attenuated phase shift spectroscopy; pDL: pulsed diode laser.
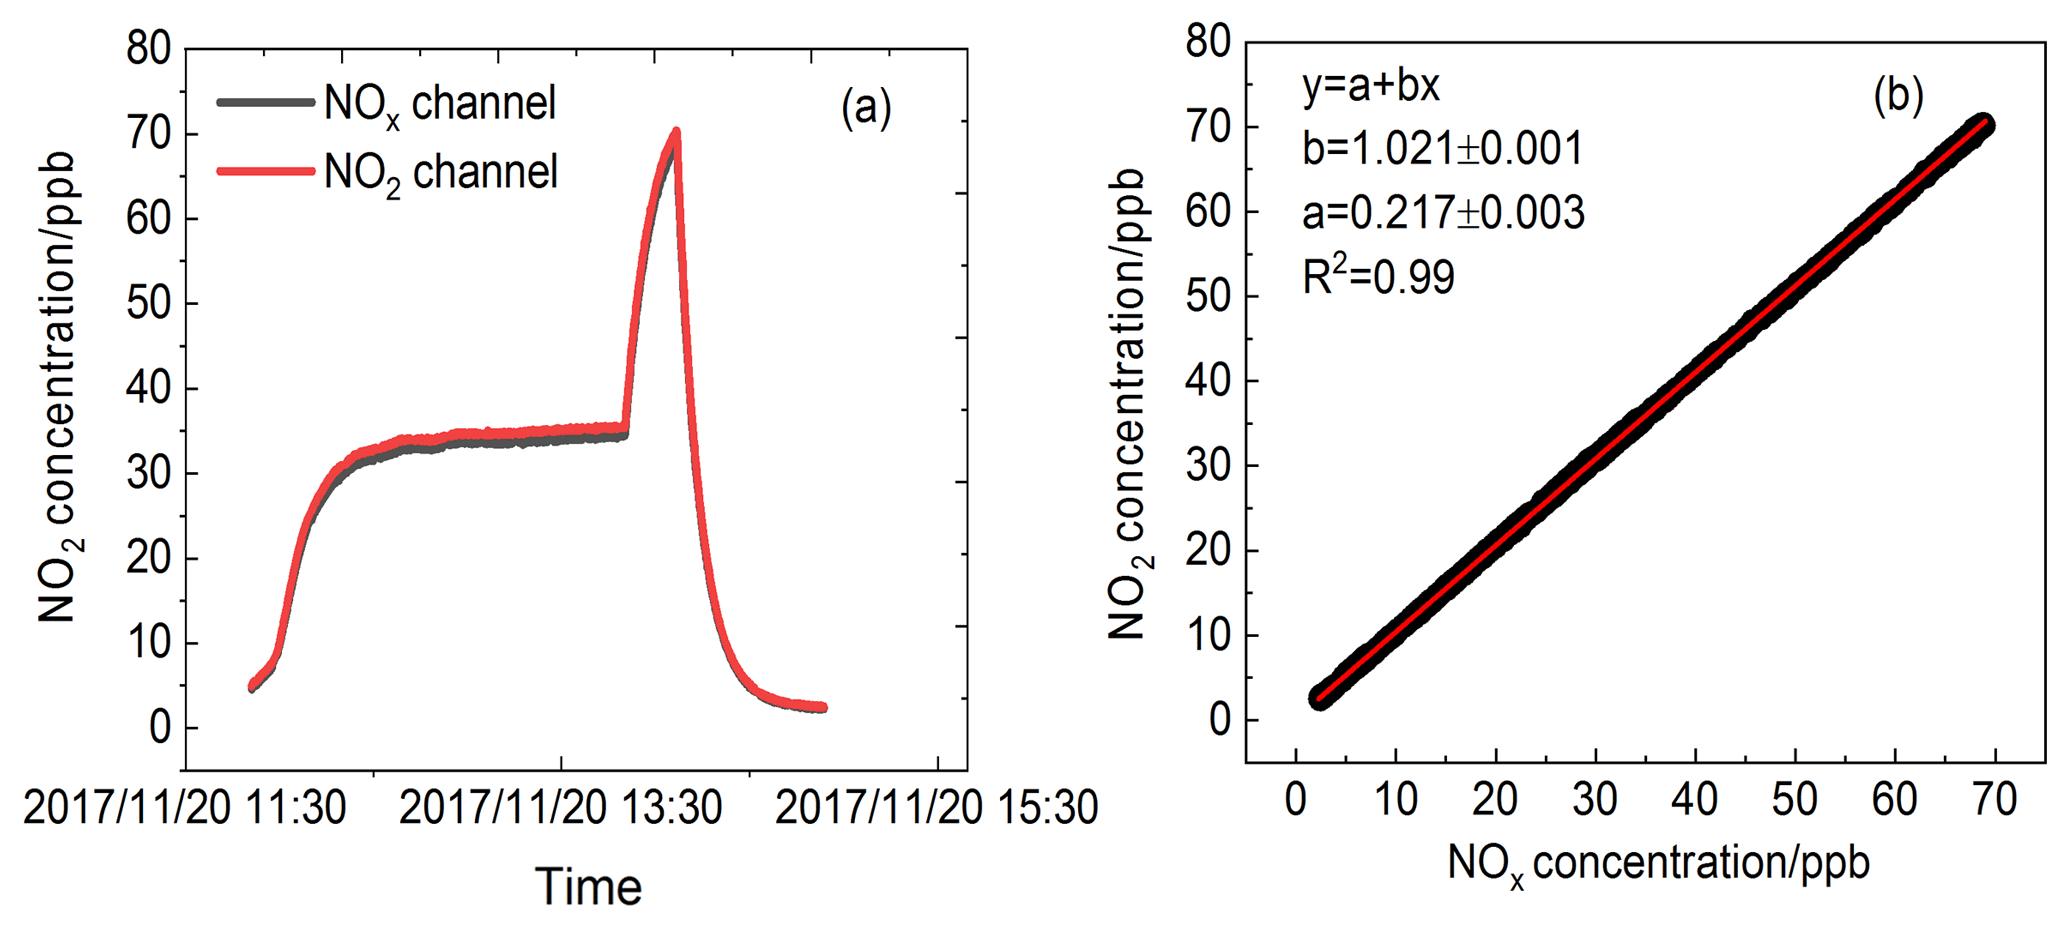
Figure 6(a) Time series of NO2 concentration standard mixtures sampled by the CRDS instrument in two channels with mercury pen-ray lamp switched on. (b) A correlation plot between the data from two channels.
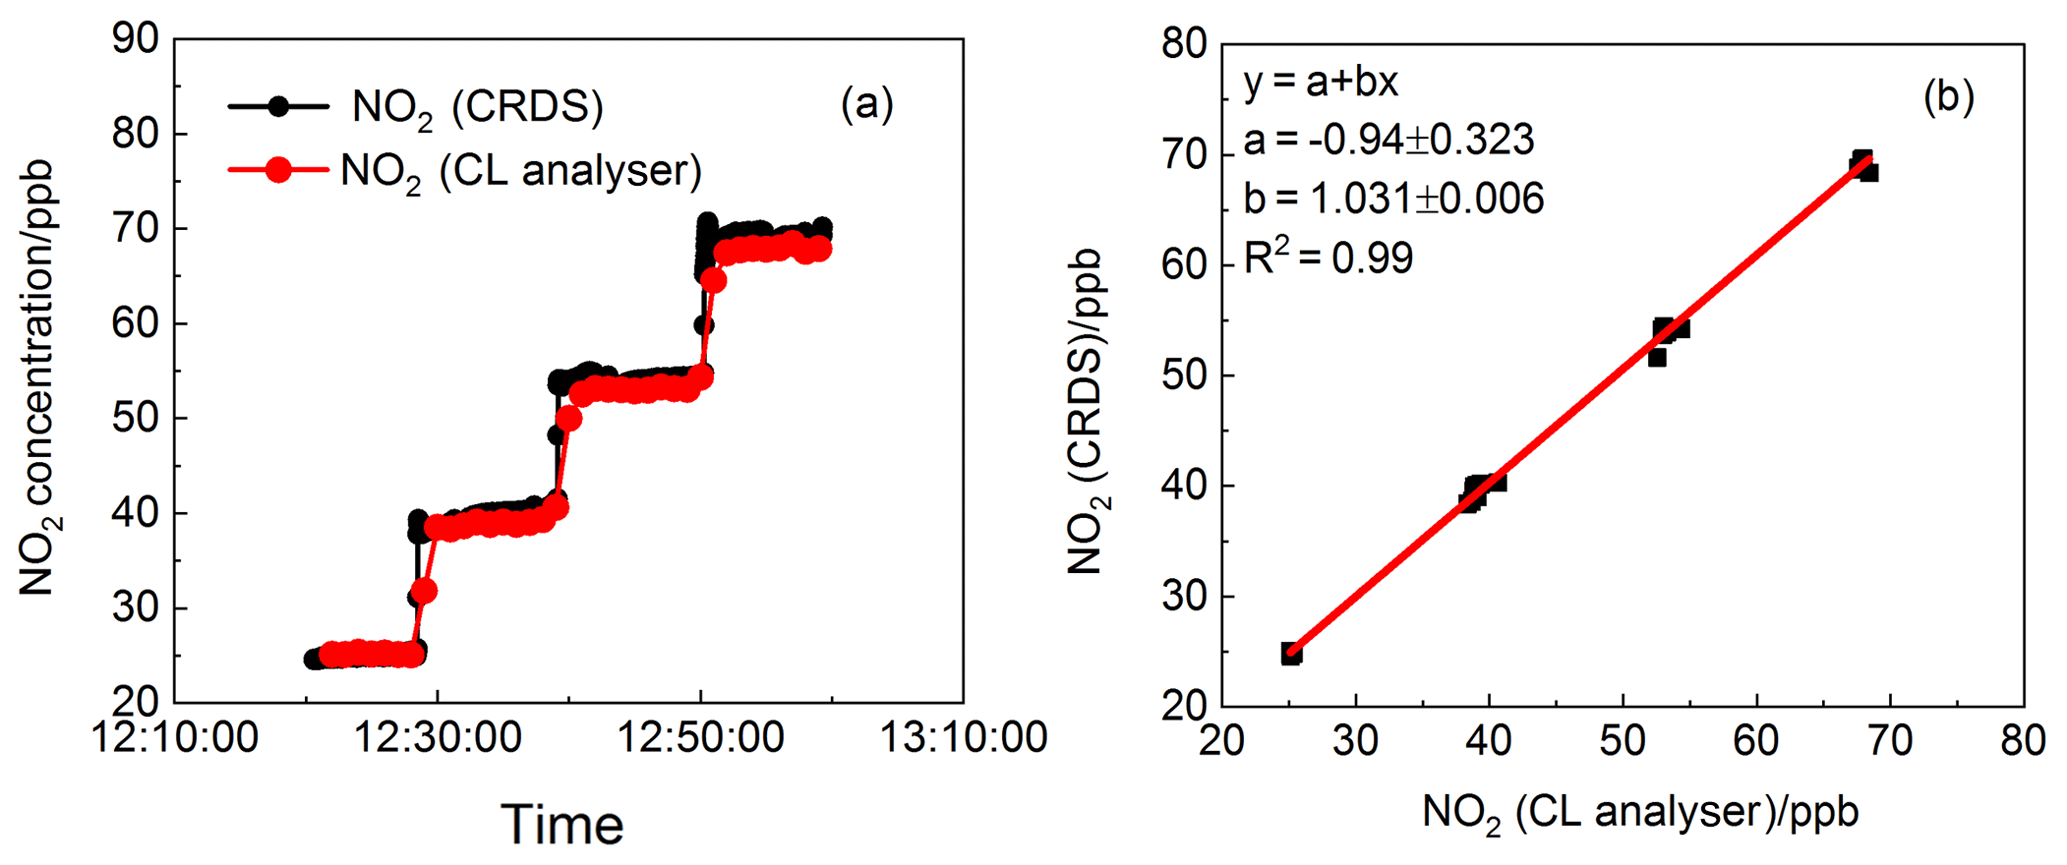
Figure 7(a) Time series of NO2 concentration standard mixtures sampled by the CRDS instrument and CL analyser. The time resolution for the CRDS instrument and CL analyser are 1s and 1min, respectively. (b) A correlation plot between the data from the CRDS instrument and the CL analyser (data averaged to 1 min). The fitting result gave a gradient of 1.031 and an intercept of −0.940 ppb, with a linear correlation factor of 0.99.
Because the cross section of O3 is about 4 orders of magnitude smaller than that of NO2 at the centre wavelength of the laser, the absorption of O3 generated by mercury photolysis is negligible. According to Fuchs et al. (2009), under conditions when NO is rich, further oxidation of NO2 to NO3 and N2O5 has only a slight effect on NOx measurement, which means that the correction of the NOx measurement can be neglected. However, under conditions when NO is absent, the loss of NO2 due to oxidation by high concentration of ozone is indeed one of the main factors that is attributed to the errors in the NOx channel. The reaction equation is expressed as follows:
where cm3 molecule−1 s−1 (T=298 K, cm3 molecule−1 s−1) (Sander et al., 2006) and exp (10871∕T) cm3 molecule−1 (T=298 K, keq=3.5 cm3 molecule−1) (Osthoff et al., 2007). The loss rate will increase with the increase in the NO2+O3 reaction rate constant when temperature in the cavity increases. Moreover, the loss rate is also sensitive to the NO2 mixing ratio. Diluted NO2 standard mixture was introduced into the two channels to characterise the effect of high ozone on NO2 measurement. The NO2 concentrations in the two channels and their correlation are shown in Fig. 6. The interference of O3 in the NOx channel when NO is absent can be neglected. The discrepancy between two different channels may be the result of the systematic errors in two different channels and can be corrected with the coefficient obtained from Fig. 6b.
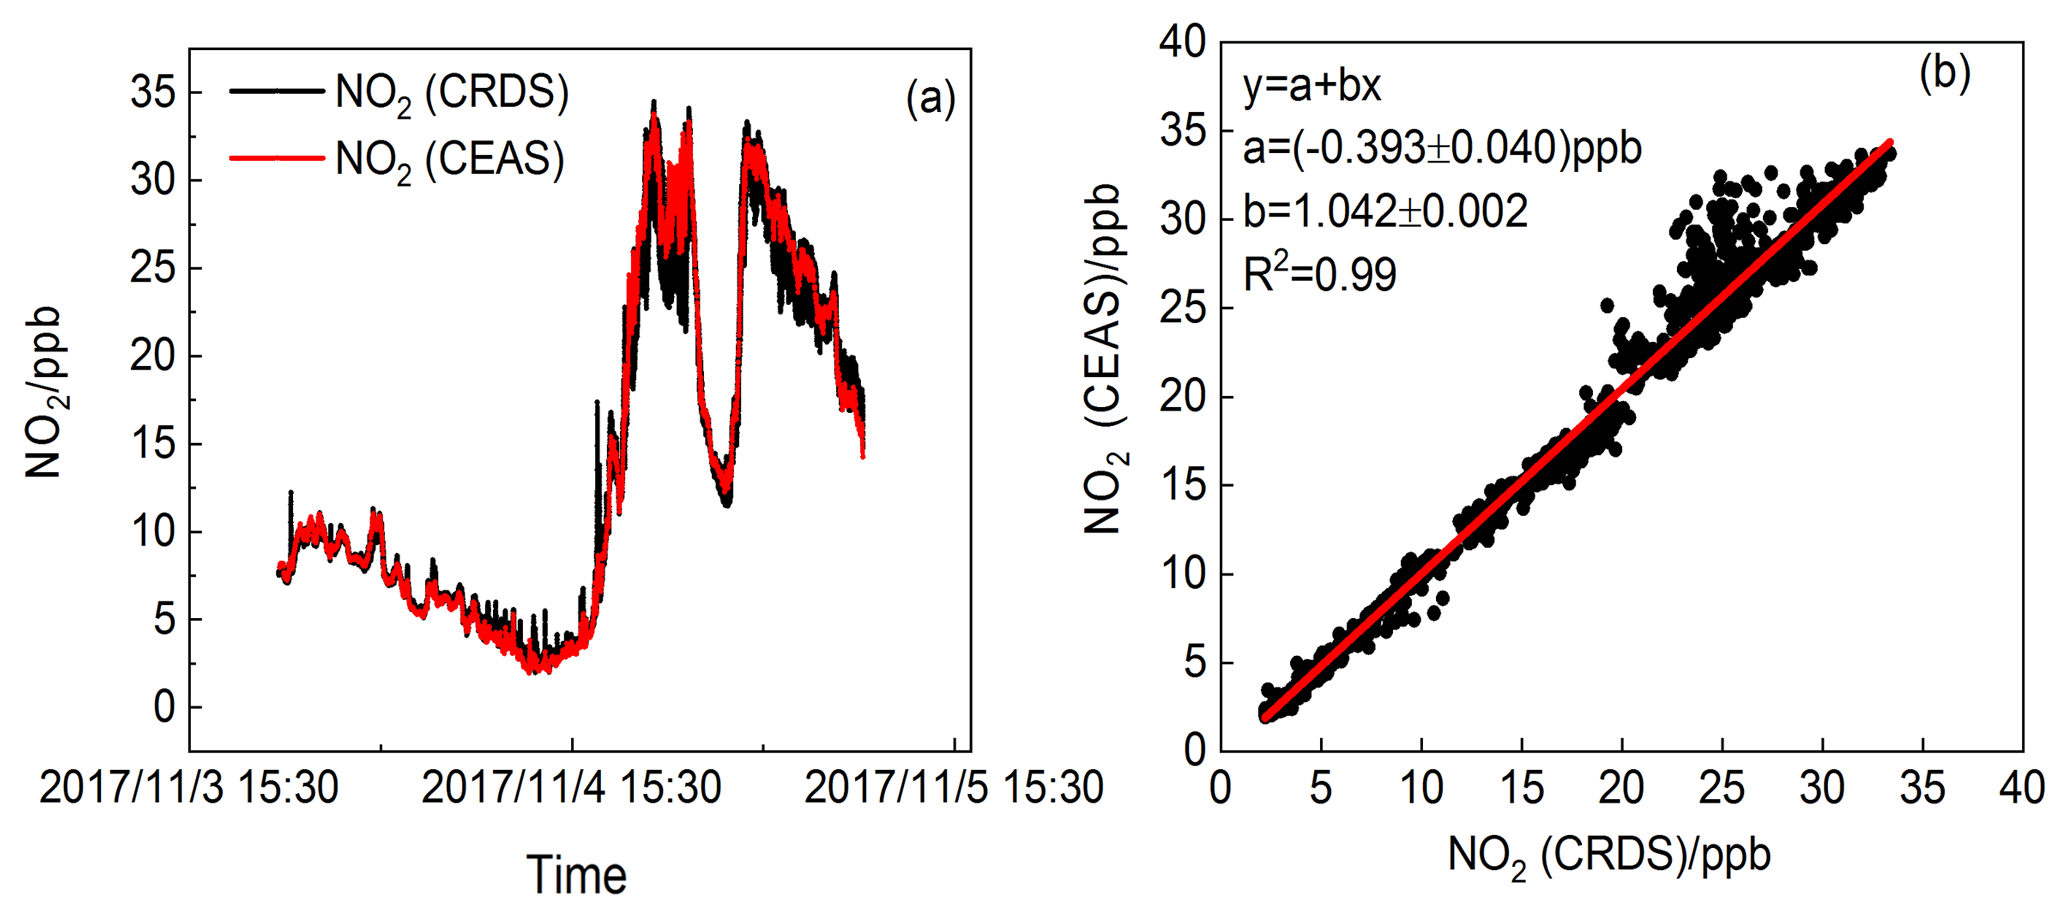
Figure 8(a) NO2 mixing ratios by CEAS (1 min average) and CRDS (1 s average) instruments. (b) Scatter plots for the NO2 dataset from CRDS and CEAS instrument. The red lines illustrate the linear regression (data averaged to 1 min base).
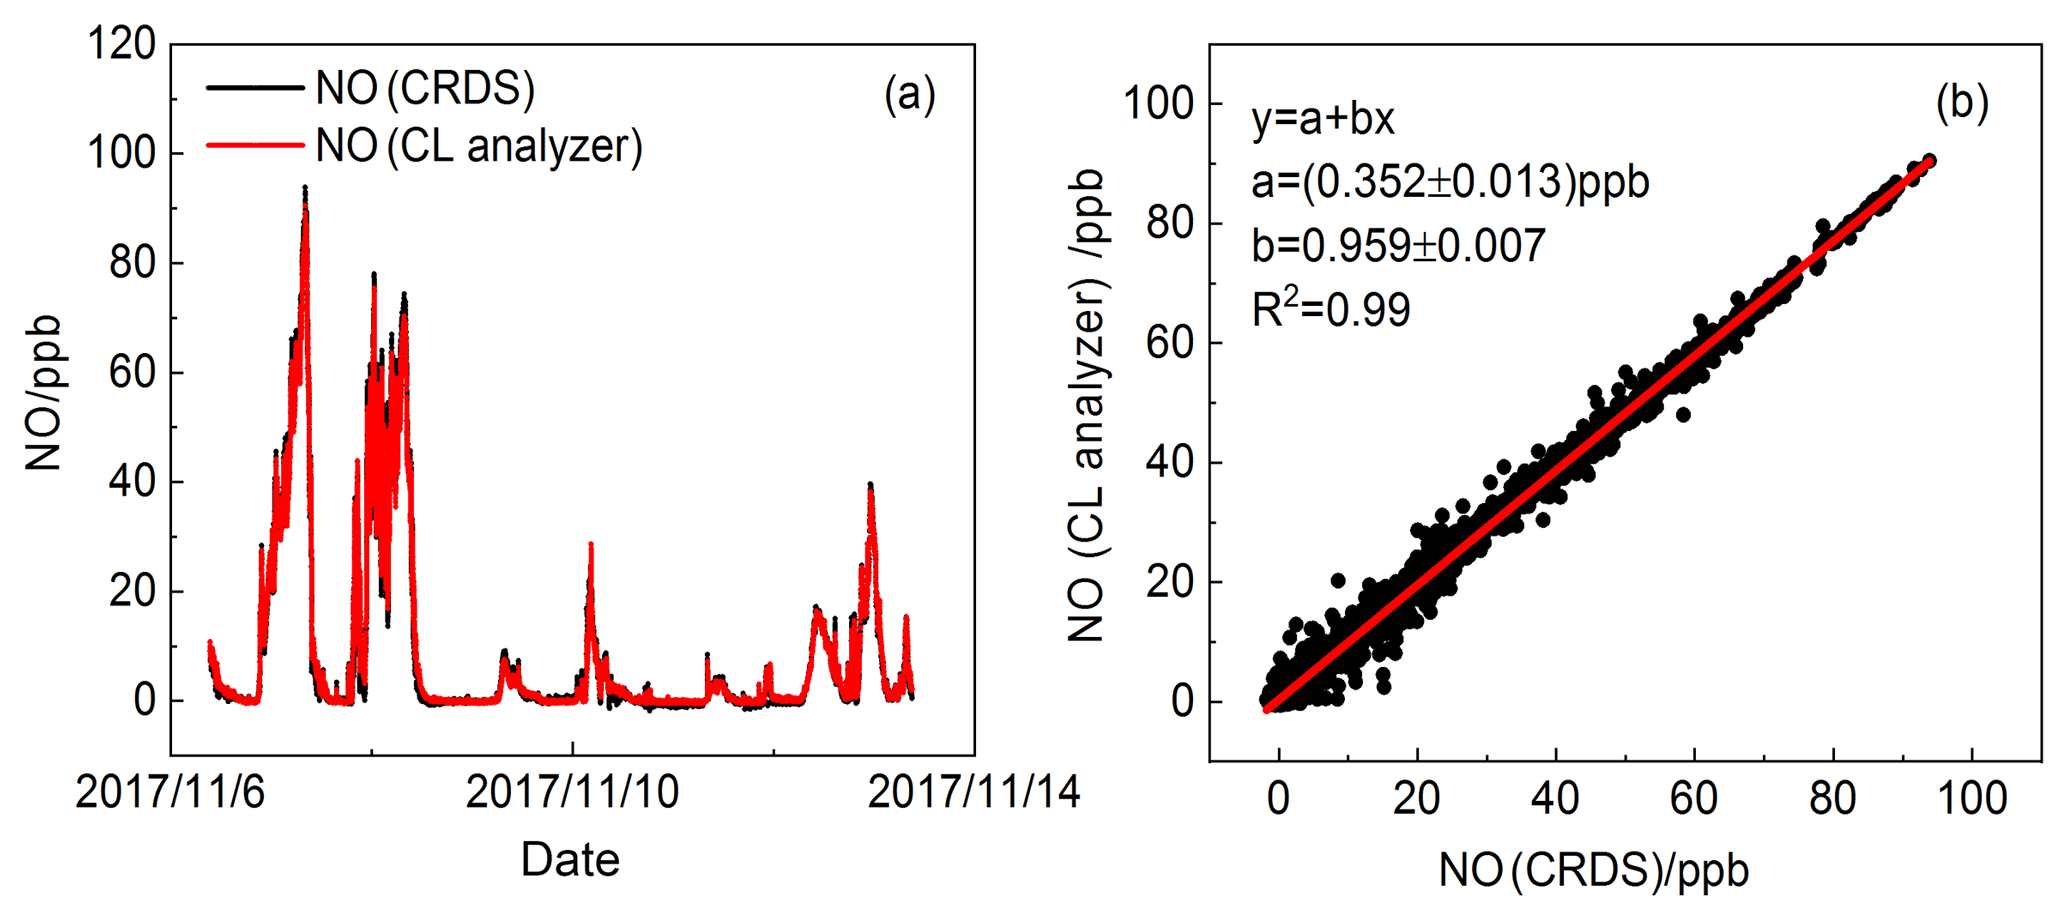
Figure 9(a) Time series of NO by dual-CRDS instrument and CL analyser. (b) A correlation between two instruments is shown and data for correlation analysis are averaged in 1 min.
4.1 Contrast measurement of standard mixtures of NO and NO2
The comparisons of NO2 measurements between CRDS and the NOx analyser have been carried out on NO2 standard mixtures. Different mixing ratios of NO2 were obtained by gas-phase titration of NO with excess O3 generated by an ozone generator (OC500). The 10.3 ppm NO standard mixture was initially diluted by N2 and subsequently oxidised by O3. The amount of NO2 generated from excess ozone can be calculated from the known initial concentration of NO. The generated pure NO2 standards in clean air were in the concentration range of 20–70 ppb. The CL analyser used for comparison in this laboratory experiment was separately calibrated and the linearity of this instrument was checked using a mixture containing NO. Figure 7a shows the concentrations of the standard NO2 in the laboratory measured by CRDS and a commercial CL analyser (42i, Thermo Scientific, Inc., 0.4 ppb (1σ) detection limit) simultaneously. A correlation analysis between the data from the two instruments was carried out. The fitting results shown in Fig. 7b indicate that , with a linear correlation factor (R2) of 0.99. The results in Fig. 7a also indicate that the CRDS instrument can capture the NO2 variations more rapidly than CL analyser.
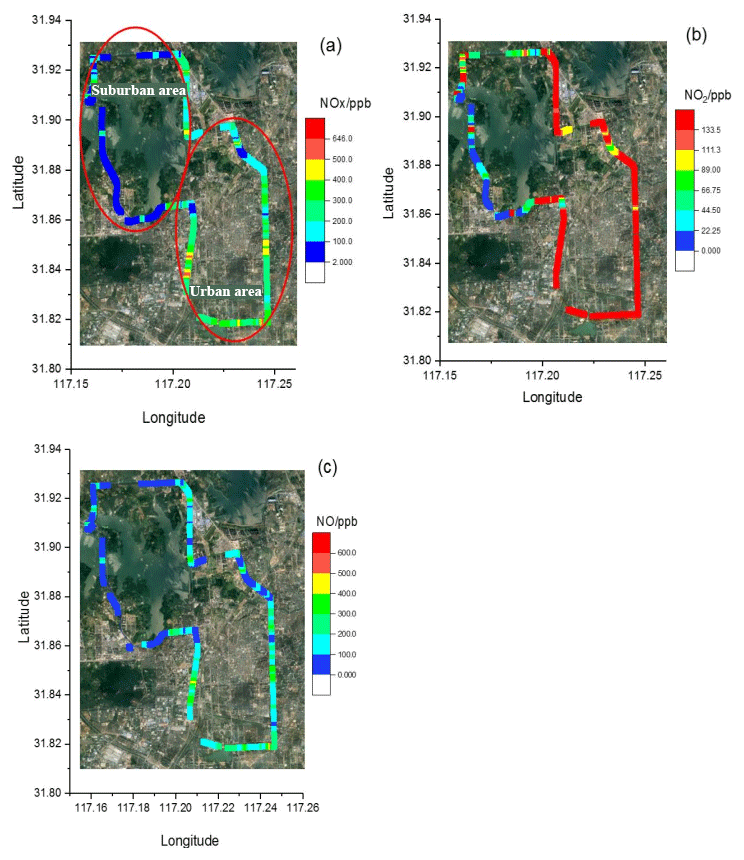
Figure 11Results of the NOx (a), NO2 (b) and NO (c) concentrations around Hefei, China (data are averaged to 5 s).
4.2 Ground-based measurements of NO2 and NO
To verify its performance and applicability, the dual-channel CRDS instrument was further compared with a CEAS instrument (Duan et al., 2018) on ground-based measurement of NO2 during the period from 3 to 5 November 2017 in the western suburb area of Hefei, Anhui, China. The reason why the CEAS instrument not the CL analyser was selected for NO2 intercomparison is that for CL analyser, NO2 must be converted to NO first and then can be detected, which exposes the analyser to chemical interferences, while for the CEAS instrument, NO2 can be detected directly. Measurement precision (1σ) for NO2 is about 170 ppt in 30 s. The time resolutions of the CRDS and CEAS instruments are 1 s and 1 min, respectively. The CRDS and CEAS instruments were set up on the sixth floor of the building in the Anhui Institute of Optic and Fine Mechanics. The area lies to the northeast of the Dongpu reservoir and is about 1.5 km from the reservoir. The northwest of the area is surrounded by a forest. The significant NO2 pollution during the measurement was found to be the emission of the cars along the road (100 m radius). The air originating from the sector between the south and east (5 km) may bring anthropogenic emissions to the site. Ambient air was introduced into the instruments through a 6 mm outer diameter Teflon tube. The data for comparison were averaged to 1 min. Figure 8a shows the temporal variations in NO2 concentrations measured by the CEAS and the CRDS instruments. It was found that the nighttime NO2 was in the range of 3 to 35 ppb. Generally, the NO2 concentrations and variations measured by the CRDS instrument show good consistency with those measured by the CEAS instrument, and the slope and intercept of the regression line from the least-squares analysis are 1.042±0.002 and () ppb, respectively, as shown in Fig. 8b. However, the results revealed a discrepancy when rapid NO2 variations appeared. We attribute this discrepancy to the slight difference between the two inlets of the instruments when large NO2 was rapidly emitted into the atmosphere. In general, the CRDS instrument has substantive advantages for retrieving rapid variations in NO2 plums due to its high time resolution and high sensitivity.
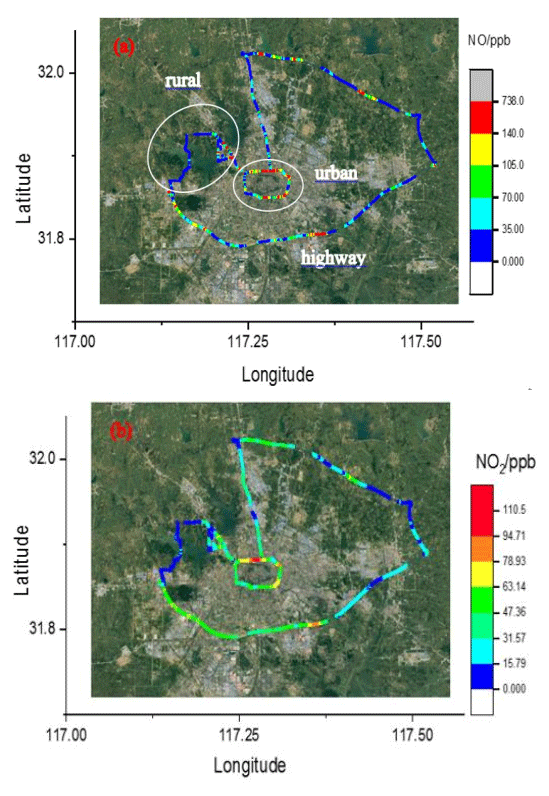
Figure 12The 4 h drive around Hefei, China, coloured by the measured NO (a) and NO2 (b) concentrations, respectively.
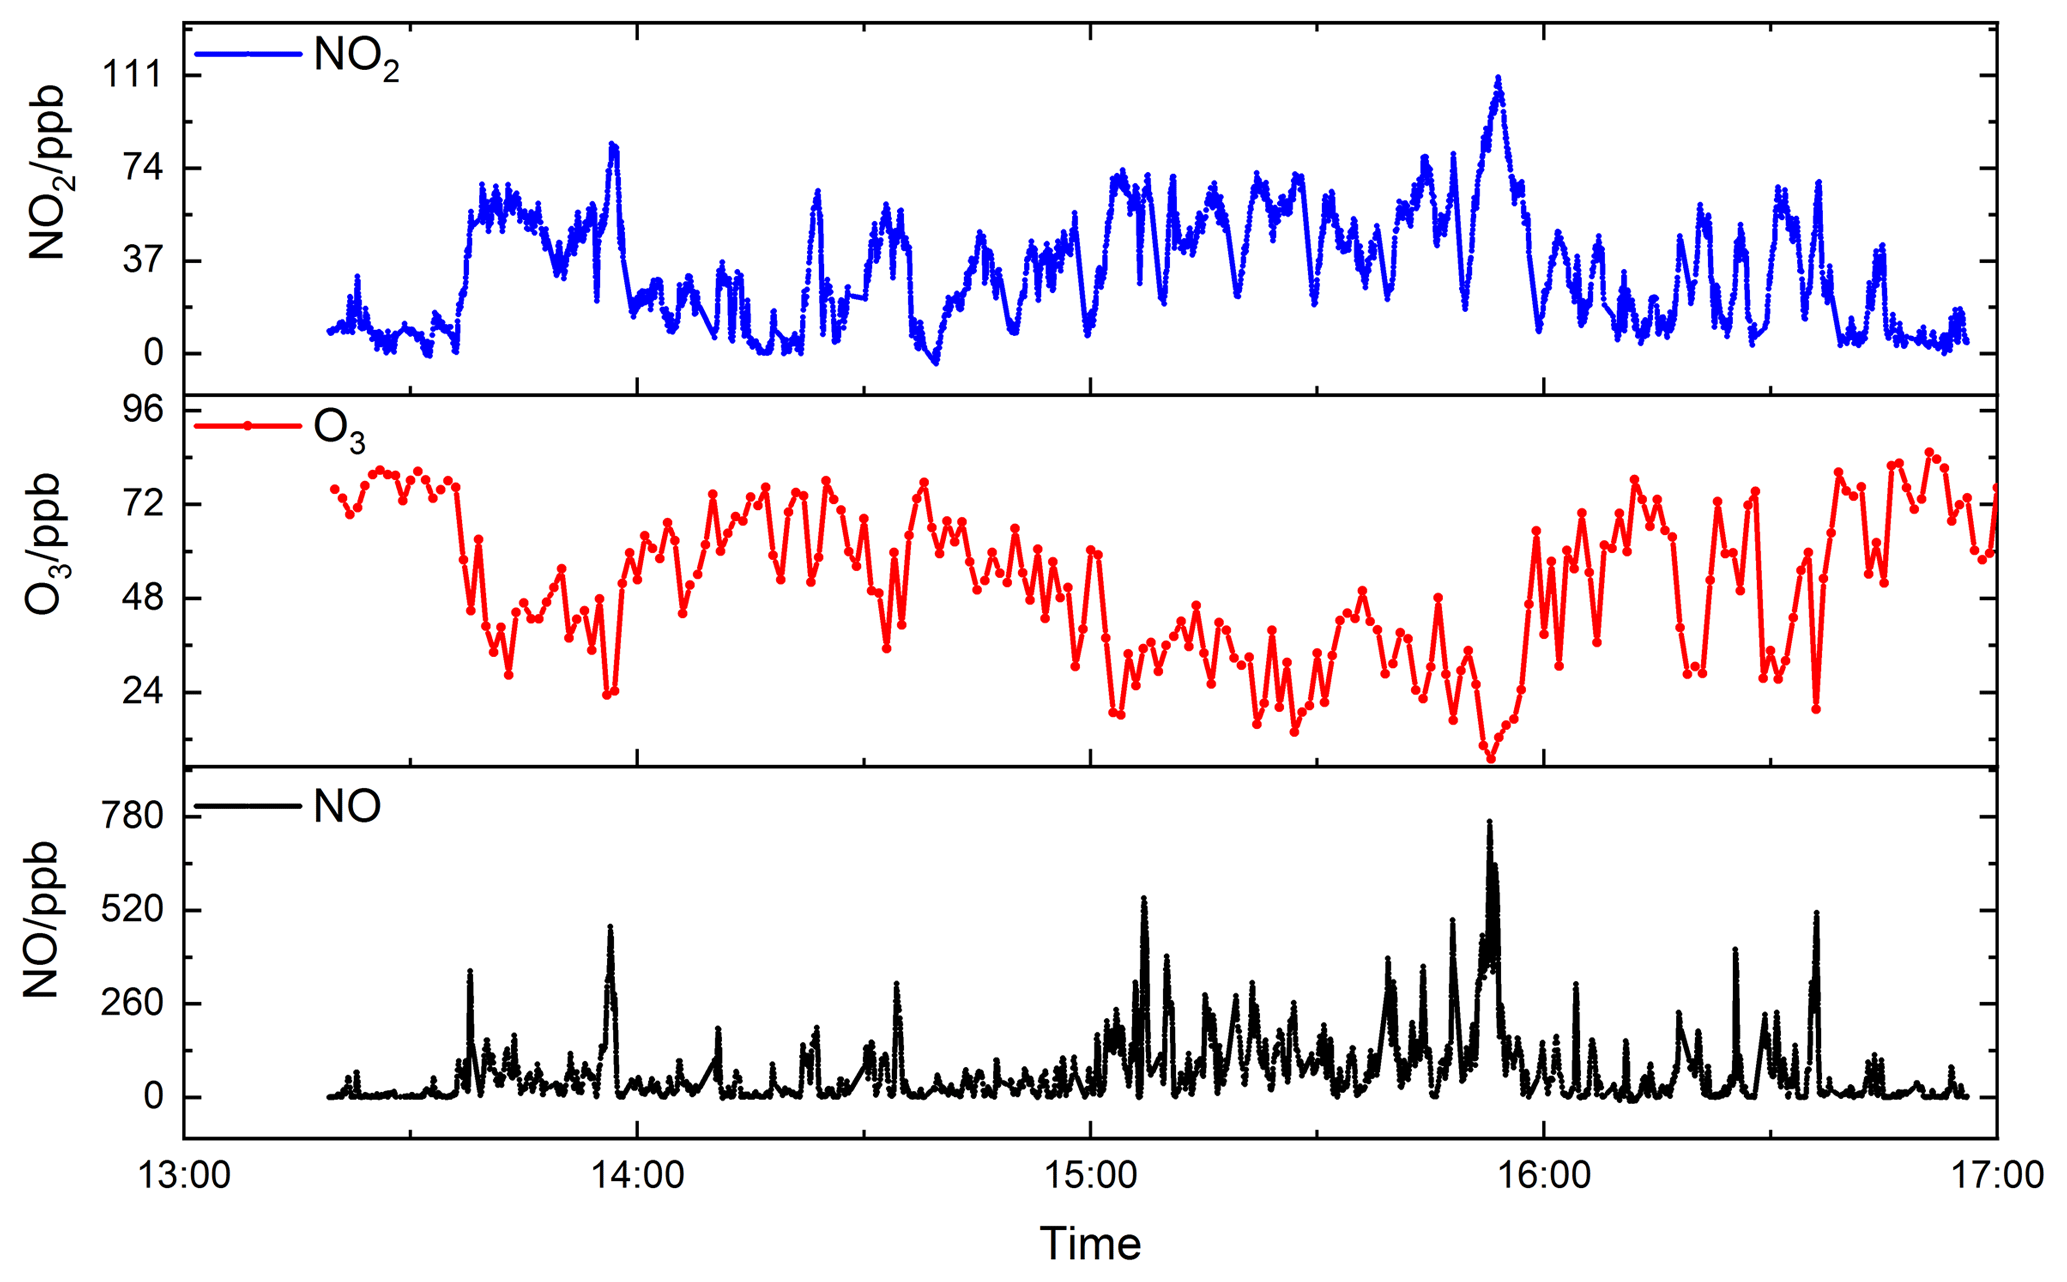
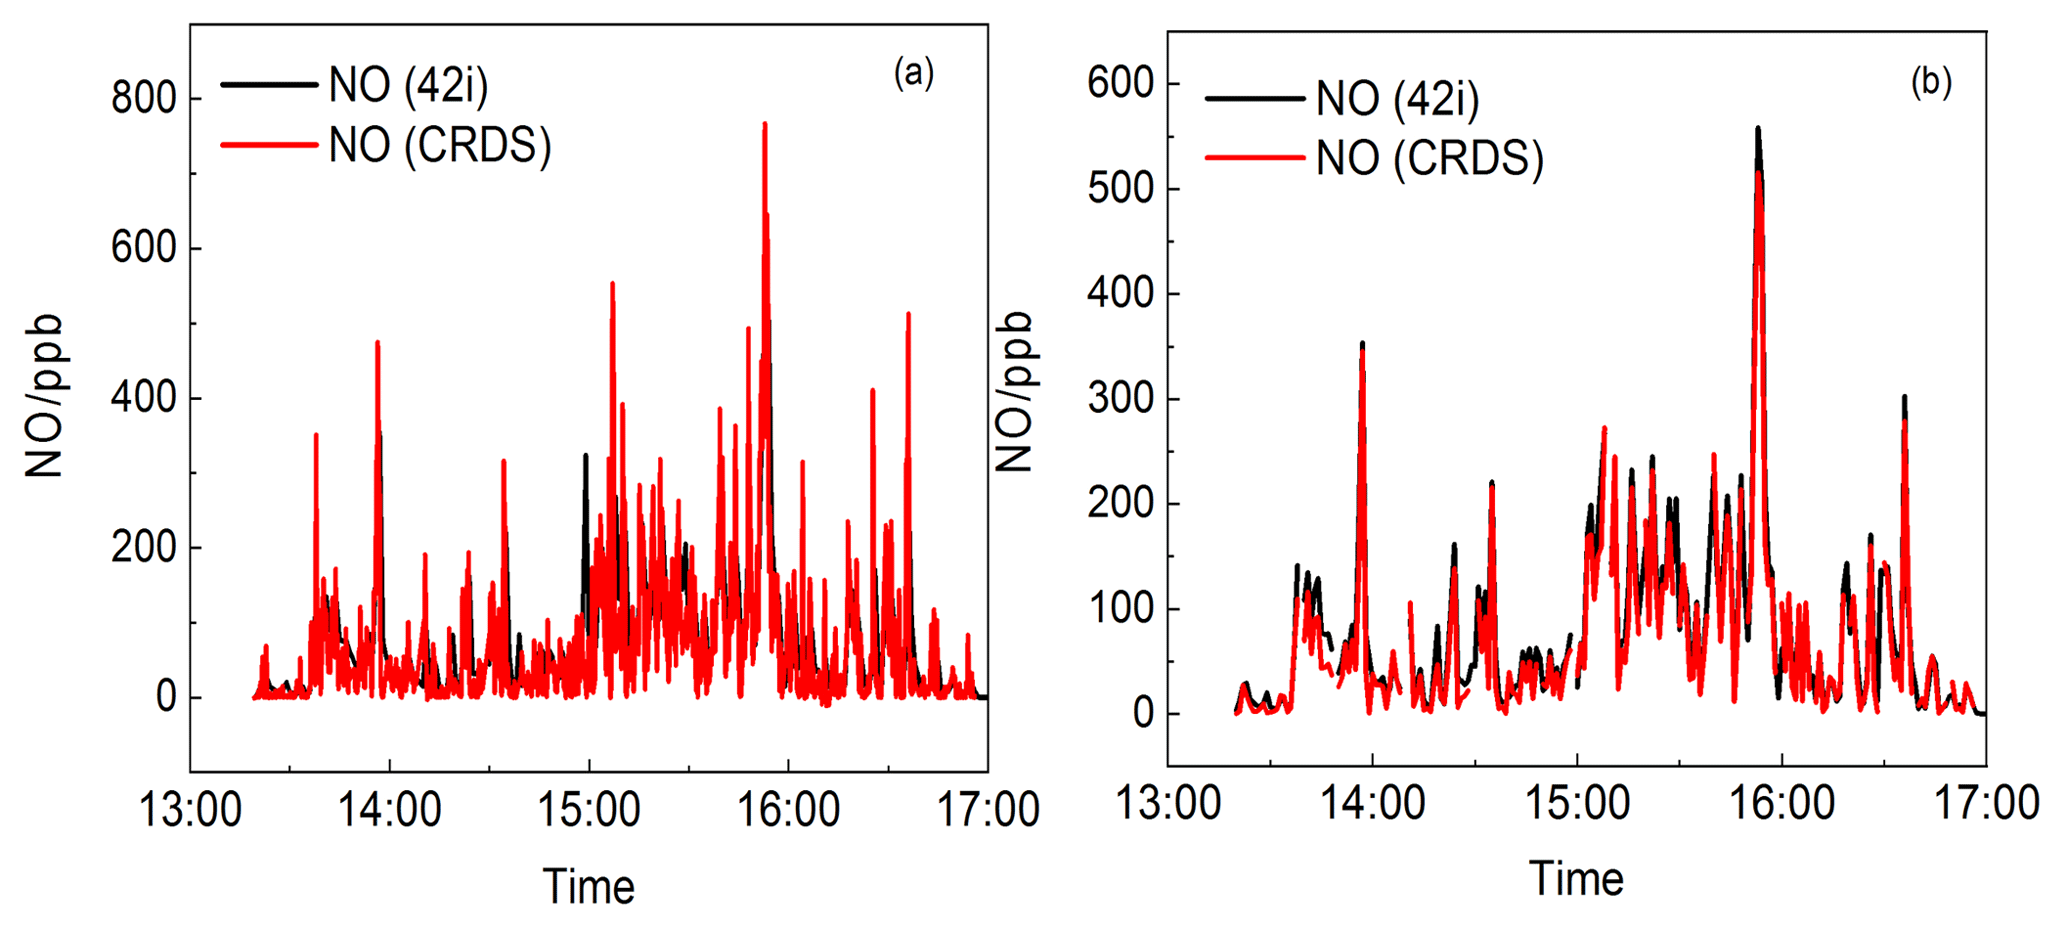
Figure 14Time series of NO from the CRDS instrument and CL analyser (42i). (a) Data averaged to 5 s for the CRDS instrument and (b) the data averaged to 1 min.
The comparison of NO concentrations measured by the dual-channel CRDS instrument and CL analyser was conducted under a variety of sampling conditions for a total of 7 d at the site described previously. Both instruments were attached to the same air sample inlet. The datasets from the CRDS instrument and CL analyser were highly correlated over wide concentration ranges of NO (see Fig. 9a). Figure 9b shows the relationship between NO concentrations observed by the CRDS and CL methods. The slope and intercept of the regression line were 0.959±0.007 and 0.352±0.013 ppb. The correlation coefficient is R2=0.99. As the CL method is believed to be reliable for NO measurement, the reliability of the dual-channel CRDS instrument was validated for the measurement of NO.
4.3 On-road measurements of vehicle NO2∕NOx emission
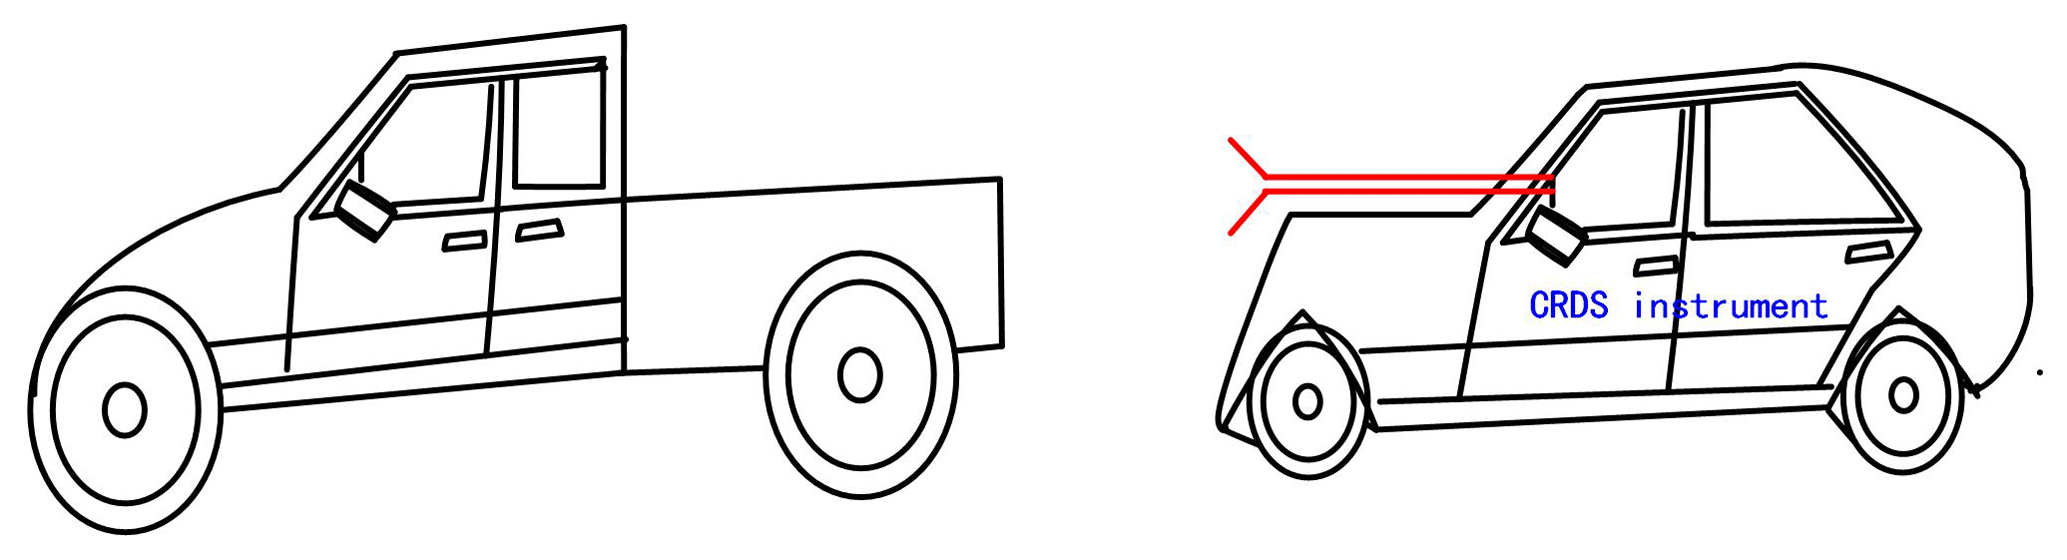
In order to retrieve the vehicle emissions on road, field measurements were performed in Hefei from 15:00 to 16:00 CST on 17 December 2018. The CRDS instrument was powered by a lithium battery, and ambient air was pumped into the system though an inlet fixed on the roof of the car. The vehicle speed is about 50 km h−1. In order to obtain the discrepancy of vehicle emissions in urban and suburban areas, the car travels around the whole area. Figure 10 shows a picture of the movable van loaded with the CRDS instrument, and the position of the sampling inlet is about 1.5 m above the ground. Figure 11 illustrates the route in Hefei and the drive track is coloured logarithmically with respect to measured NOx, NO2 and NO. The NO2 concentration ranged from 1.5 to 133.3 ppb and NO ranged from the detection limit to 554.7 ppb. The mean concentrations of NO and NO2 were 140 and 54.9 ppb, respectively. On the whole, the NO and NO2 concentrations in the urban area were higher than those in the suburban area. Large plumes of NO were found at the crossroads with heavy traffic or the sites converged with heavy-duty diesel vehicles. The [NO2]∕[NOx] ratio was about 19 %, which is larger than the results observed in the USA (Wild et al., 2017).
In 25 February 2019 another measurement of vehicle emissions was performed on the road to further verify the instrument performance. A NO analyser (42i), an O3 analyser (49i) and the CRDS instruments were all placed in the same car. Ambient air was pumped through an inlet fixed on the roof of the car and then divided into three lines to the three instruments. Figure 12 illustrates the 4 h drive track involving highway, urban and suburban area around Hefei, which is coloured with respect to the measured NO and NO2. Vehicle speeds varied greatly on three different road types and were around 100 km h−1 on the highway. Influenced by the vehicle emissions, the NOx plumes on urban roads are higher than those on suburban roads and highway.
Figure 13 shows the time series of NO2, O3 and NO. NO2 concentrations ranged from the detection limit to 110.2 ppb and O3 concentrations ranged from 6.9 to 85.3 ppb. Several NO plumes were observed and the maximum value was up to 767.1 ppb. O3 and NO showed a significant negative correlation, which is attributed to the quick titration of O3 by NO. Figure 14 shows the NO data measured by CRDS and the CL analyser (42i, 1 min), Fig. 14a shows the data averaged to 5s for the CRDS instrument and Fig. 14b shows the data averaged to 1min for the CRDS instrument. The good agreement between the measurement results from the two instruments proves that the CRDS instrument can be applied for fast vehicle NOx emissions.
Because the NO2-to-NOx emissions ratio affects ozone production and spatial distribution, more efforts should be made to provide a constraint on emissions inventories used in air quality modelling. The mobile CRDS instrument provides a good method to retrieve the direct vehicle NOx emissions and NO2-to-NOx ratio of plumes due to its easy deployment and high temporal resolution.
A compact, sensitive and accurate instrument based on diode-laser cavity ring-down spectroscopy with the centre wavelength of 403.64 nm has been demonstrated for detection of trace amounts of NO2 and NOx in ambient air. Minimum detection limits of NO2 and NOx were estimated to be 0.030 and 0.040 ppb at an integration time of 1 s when zero air is sampled with a measurement accuracy of ±5 %. Contrast measurements between the dual-channel CRDS instrument and a CL analyser on NO2 standard mixtures were performed, which showed a good correlation between the two different techniques. In order to confirm the reliability of the dual-channel CRDS instrument in the field atmosphere, continuous measurement was conducted and the stability of the instrument was investigated. During the intercomparison measurements of NO2 and NO in the field, the dual-channel CRDS instrument showed a good correlation with the CEAS instrument for NO2 measurement, and with the CL analyser for NO measurement.
The CRDS instrument was further deployed in a movable car to monitor NO and NO2 emissions on the road. The advantage of the high time resolution of the instrument has been demonstrated, which means the instrument provides a new direct method for on-road vehicle plume measurement. Meanwhile, the high detection sensitivity of the instrument was also shown in this work, which indicates it can act as a new detection technique for chemistry model verification. It is expected that the instruments developed will lead to the wider application for ambient air quality monitoring and will be useful to investigate photochemistry in the atmosphere more precisely.
The data used in this study are available from the corresponding author upon request (rzhu@aiofm.ac.cn).
RH and ZL contributed equally to this work. RH, PX, JL and WL contributed to the conception of the study. ZL and HC built the CRDS instrument. ZL, HC, XL, SL, FW, YW and CL performed the experiments. DW developed the data processing software. ZL performed the data analyses and wrote the paper. RH edited and developed the paper.
The authors declare that they have no conflict of interest.
This article is part of the special issue “Advances in cavity-based techniques for measurements of atmospheric aerosol and trace gases”. It is not associated with a conference.
This research has been supported by the National Natural Science Foundation of China (grant nos. 91644107, 61575206, 41571130023 and 61805257) and the National Key Research and Development Program of China (grant nos. 2017YFC0209401, 2017YFC0209403).
This paper was edited by Weidong Chen and reviewed by Hongbing Chen and one anonymous referee.
Ayres, B. R., Allen, H. M., Draper, D. C., Brown, S. S., Wild, R. J., Jimenez, J. L., Day, D. A., Campuzano-Jost, P., Hu, W., de Gouw, J., Koss, A., Cohen, R. C., Duffey, K. C., Romer, P., Baumann, K., Edgerton, E., Takahama, S., Thornton, J. A., Lee, B. H., Lopez-Hilfiker, F. D., Mohr, C., Wennberg, P. O., Nguyen, T. B., Teng, A., Goldstein, A. H., Olson, K., and Fry, J. L.: Organic nitrate aerosol formation via NO3 + biogenic volatile organic compounds in the southeastern United States, Atmos. Chem. Phys., 15, 13377–13392, https://doi.org/10.5194/acp-15-13377-2015, 2015.
Brent, L. C., Thorn, W. J., Gupta, M., Leen, B., Stehr, J. W., He, H., Arkinson, H. L., Weinheimer, A., Garland, C., Pusede, S. E., Wooldridge, P. J., Cohen, R. C., and Dickerson, R. R.: Evaluation of the use of a commercially available cavity ringdown absorption spectrometer for measuring NO2 in flight, and observations over the Mid-Atlantic States, during DISCOVER-AQ, J. Atmos. Chem., 72, 503–521, https://doi.org/10.1007/s10874-013-9265-6, 2013.
Brown, S. S., Dibb, J. E., Stark, H., Aldener, M., Vozella, M., Whitlow, S., Williams, E. J., Lerner, B. M., Jakoubek, R., Middlebrook, A. M., DeGouw, J. A., Warneke, C., Goldan, P. D., Kuster, W. C., Angevine, W. M., Sueper, D. T., Quinn, P. K., Bates, T. S., Meagher, J. F., Fehsenfeld, F. C., and Ravishankara, A. R.: Nighttime removal of NOx in the summer marine boundary layer, Geophys. Res. Lett., 31, 1–5, https://doi.org/10.1029/2004gl019412, 2004.
Burgard, D. A., Bishop, G. A., Stadtmuller, R. S., Dalton, T. R., and Stedman, D. H.: Spectroscopy applied to on-road mobile source emissions, Appl. Spectrosc., 60, 135a–148a, https://doi.org/10.1366/000370206777412185, 2006a.
Burgard, D. A., Bishop, G. A., Stedman, D. H., Gessner, V. H., and Daeschlein, C.: Remote sensing of in-use heavy-duty diesel trucks, Environ. Sci. Technol., 40, 6938–6942, https://doi.org/10.1021/es060989a, 2006b.
Carslaw, D. C. and Beevers, S. D.: Investigating the potential importance of primary NO2 emissions in a street canyon, Atmos. Environ., 38, 3585–3594, https://doi.org/10.1016/j.atmosenv.2004.03.041, 2004.
Carslaw, D. C.: Evidence of an increasing NO2∕NOx emissions ratio from road traffic emissions, Atmos. Environ., 39, 4793–4802, https://doi.org/10.1016/j.atmosenv.2005.06.023, 2005.
Castellanos, P., Luke, W. T., Kelley, P., Stehr, J. W., Ehrman, S. H., and Dickerson, R. R.: Modification of a commercial cavity ring-down spectroscopy NO2 detector for enhanced sensitivity, Rev. Sci. Instrum., 80, 113107, https://doi.org/10.1063/1.3244090, 2009.
Chen, Y., Yang, C. Q., Zhao, W. X., Fang, B., Xu, X. Z., Gai, Y. B., Lin, X. X., Chen, W. D., and Zhang, W. J.: Ultra-sensitive measurement of peroxy radicals by chemical amplification broadband cavity-enhanced spectroscopy, Analyst, 141, 5870–5878, https://doi.org/10.1039/c6an01038e, 2016.
Day, D. A., Wooldridge, P. J., Dillon, M. B., Thornton, J. A., and Cohen, R. C.: A thermal dissociation laser-induced fluorescence instrument for in situ detection of NO2, peroxy nitrates, alkyl nitrates, and HNO3, J. Geophys. Res.-Atmos., 107, 4046, https://doi.org/10.1029/2001jd000779, 2002.
Duan, J., Qin, M., Ouyang, B., Fang, W., Li, X., Lu, K., Tang, K., Liang, S., Meng, F., Hu, Z., Xie, P., Liu, W., and Häsler, R.: Development of an incoherent broadband cavity-enhanced absorption spectrometer for in situ measurements of HONO and NO2, Atmos. Meas. Tech., 11, 4531–4543, https://doi.org/10.5194/amt-11-4531-2018, 2018.
Dunlea, E. J., Herndon, S. C., Nelson, D. D., Volkamer, R. M., San Martini, F., Sheehy, P. M., Zahniser, M. S., Shorter, J. H., Wormhoudt, J. C., Lamb, B. K., Allwine, E. J., Gaffney, J. S., Marley, N. A., Grutter, M., Marquez, C., Blanco, S., Cardenas, B., Retama, A., Ramos Villegas, C. R., Kolb, C. E., Molina, L. T., and Molina, M. J.: Evaluation of nitrogen dioxide chemiluminescence monitors in a polluted urban environment, Atmos. Chem. Phys., 7, 2691–2704, https://doi.org/10.5194/acp-7-2691-2007, 2007.
Fahey, D. W., Eubank, C. S., Hubler, G., and Fehsenfeld, F. C.: Evaluation of a Catalytic Reduction Technique for the Measurement of Total Reactive Odd-Nitrogen NOy in the Atmosphere, J. Atmos. Chem., 3, 435–468, https://doi.org/10.1007/bf00053871, 1985.
Fuchs, H., Dube, W. P., Lerner, B. M., Wagner, N. L., Williams, E. J., and Brown, S. S.: A Sensitive and Versatile Detector for Atmospheric NO2 and NOx Based on Blue Diode Laser Cavity Ring-Down Spectroscopy, Environ. Sci. Technol., 43, 7831–7836, https://doi.org/10.1021/es902067h, 2009.
Fuchs, H., Ball, S. M., Bohn, B., Brauers, T., Cohen, R. C., Dorn, H.-P., Dubé, W. P., Fry, J. L., Häseler, R., Heitmann, U., Jones, R. L., Kleffmann, J., Mentel, T. F., Müsgen, P., Rohrer, F., Rollins, A. W., Ruth, A. A., Kiendler-Scharr, A., Schlosser, E., Shillings, A. J. L., Tillmann, R., Varma, R. M., Venables, D. S., Villena Tapia, G., Wahner, A., Wegener, R., Wooldridge, P. J., and Brown, S. S.: Intercomparison of measurements of NO2 concentrations in the atmosphere simulation chamber SAPHIR during the NO3Comp campaign, Atmos. Meas. Tech., 3, 21–37, https://doi.org/10.5194/amt-3-21-2010, 2010.
Gherman, T., Venables, D. S., Vaughan, S., Orphal, J., and Ruth, A. A.: Incoherent broadband cavity-enhanced absorption spectroscopy in the near-ultraviolet: Application to HONO and NO2, Environ. Sci. Technol., 42, 890–895, https://doi.org/10.1021/es0716913, 2008.
Herndon, S. C., Shorter, J. H., Zahniser, M. S., Nelson, D. D., Jayne, J., Brown, R. C., Miake-Lye, R. C., Waitz, I., Silva, P., Lanni, T., Demerjian, K., and Kolb, C. E.: NO and NO2 emission ratios measured from in-use commercial aircraft during taxi and takeoff, Environ. Sci. Technol., 38, 6078–6084, https://doi.org/10.1021/es049701c, 2004.
Herndon, S. C., Shorter, J. H., Zahniser, M. S., Wormhoudt, J., Nelson, D. D., Demerjian, K. L., and Kolb, C. E.: Real-time measurements of SO2, H2CO, and CH4 emissions from in-use curbside passenger buses in New York City using a chase vehicle, Environ. Sci. Technol., 39, 7984–7990, https://doi.org/10.1021/es0482942, 2005.
Hueglin, C., Buchmann, B., and Weber, R. O.: Long-term observation of real-world road traffic emission factors on a motorway in Switzerland, Atmos. Environ., 40, 3696–3709, https://doi.org/10.1016/j.atmosenv.2006.03.020, 2006.
Hu, R. Z., Wang, D., Xie, P. H., Chen, H., and Ling, L.: Diode Laser Cavity Ring-Down Spectroscopy for Atmospheric NO2 Measurement, Acta. Optica. Sinica, 36, 0230006, https://doi.org/10.3788/AOS201636.0230006, 2016.
Jagerska, J., Jouy, P., Tuzson, B., Looser, H., Mangold, M., Soltic, P., Hugi, A., Bronnimann, R., Faist, J., and Emmenegger, L.: Simultaneous measurement of NO and NO2 by dual-wavelength quantum cascade laser spectroscopy, Opt. Express, 23, 1512–1522, https://doi.org/10.1364/oe.23.001512, 2015.
Jaramillo, P. and Muller, N. Z.: Air pollution emissions and damages from energy production in the US: 2002–2011, Energy Policy, 90, 202–211, https://doi.org/10.1016/j.enpol.2015.12.035, 2016.
Karpf, A., Qiao, Y. H., and Rao, G. N.: Ultrasensitive, real-time trace gas detection using a high-power, multimode diode laser and cavity ringdown spectroscopy, Appl. Optics, 55, 4497–4504, https://doi.org/10.1364/ao.55.004497, 2016.
Kasyutich, V. L., Martin, P. A., and Holdsworth, R. J.: Phase-shift off-axis cavity-enhanced absorption detector of nitrogen dioxide, Meas. Sci. Technol., 17, 923–931, https://doi.org/10.1088/0957-0233/17/4/044, 2006.
Kebabian, P. L., Wood, E. C., Herndon, S. C., and Freedman, A.: A practical alternative to chemiluminescence-based detection of nitrogen dioxide: Cavity attenuated phase shift spectroscopy, Environ. Sci. Technol., 42, 6040–6045, https://doi.org/10.1021/es703204j, 2008.
Lal, D. R., Clark, I., Shalkow, J., Downey, R. J., Shorter, N. A., Klimstra, D. S., and La Quaglia, M. P.: Primary epithelial lung malignancies in the pediatric population, Pediatr. Blood Cancer, 45, 683–686, https://doi.org/10.1002/pbc.20279, 2005.
Li, Y. Q., Demerjian, K. L., Zahniser, M. S., Nelson, D. D., McManus, J. B., and Herndon, S. C.: Measurement of formaldehyde, nitrogen dioxide, and sulfur dioxide at Whiteface Mountain using a dual tunable diode laser system, J. Geophys. Res.-Atmos., 109, D16S08, https://doi.org/10.1029/2003jd004091, 2004.
Li, Z. Y., Hu, R. Z., Xie, P. H., Wang, H. C., Lu, K. D., and Wang, D.: Intercomparison of in situ CRDS and CEAS for measurements of atmospheric N2O5 in Beijing, China, Sci. Total Environ., 613–614, 131–139, https://doi.org/10.1016/j.scitotenv.2017.08.302, 2018a.
Li, Z. Y., Hu, R. Z., Xie, P. H., Chen, H., Wu S. Y., Wang, F. Y., Wang, Y. H., Ling, L. Y., Liu, J. G., and Liu, W. Q.: Development of a portable cavity ring down spectroscopy instrument for simultaneous, in situ measurement of NO3 and N2O5, Opt. Express, 26, A433–A449, https://doi.org/10.1364/OE.26.00A433, 2018b.
Matsumi, Y., Taketani, F., Takahashi, K., Nakayama, T., Kawai, M., and Miyao, Y.: Fluorescence detection of atmospheric nitrogen dioxide using a blue light-emitting diode as an excitation source, Appl. Optics, 49, 3762–3767, https://doi.org/10.1364/ao.49.003762, 2010.
Matsumoto, J., Hirokawa, J., Akimoto, H., and Kajii, Y.: Direct measurement of NO2 in the marine atmosphere by laser-induced fluorescence technique, Atmos. Environ., 35, 2803–2814, https://doi.org/10.1016/s1352-2310(01)00078-4, 2001.
McLaren, R., Wojtal, P., Majonis, D., McCourt, J., Halla, J. D., and Brook, J.: NO3 radical measurements in a polluted marine environment: links to ozone formation, Atmos. Chem. Phys., 10, 4187–4206, https://doi.org/10.5194/acp-10-4187-2010, 2010.
Novikov, S., Lebedeva, N., Satrapinski, A., Walden, J., Davydov, V., and Lebedev, A.: Graphene based sensor for environmental monitoring of NO2, Sens. Actuator B-Chem., 236, 1054–1060, https://doi.org/10.1016/j.snb.2016.05.114, 2016.
Osthoff, H. D., Brown, S. S., Ryerson, T. B., Fortin, T. J., Lerner, B. M., Williams, E. J., Pettersson, A., Baynard, T., Dube, W. P., Ciciora, S. J., and Ravishankara, A. R.: Measurement of atmospheric NO2 by pulsed cavity ring-down spectroscopy, J. Geophys. Res.-Atmos., 111, D12305, https://doi.org/10.1029/2005jd006942, 2006.
Osthoff, H. D., Pilling, M. J., Ravishankara, A. R., and Brown, S. S.: Temperature dependence of the NO3 absorption cross-section above 298 K and determination of the equilibrium constant for NO3 + NO2 < - > N2O5 at atmospherically relevant conditions, Phys. Chem. Chem. Phys., 9, 5785–5793, https://doi.org/10.1039/b709193a, 2007.
Paul, D., Furgeson, A., and Osthoff, H. D.: Measurements of total peroxy and alkyl nitrate abundances in laboratory-generated gas samples by thermal dissociation cavity ring-down spectroscopy, Rev. Sci. Instrum., 80, 114101, https://doi.org/10.1063/1.3258204, 2009.
Platt, U. F., Winer, A. M., Biermann, H. W., Atkinson, R., and Pitts, J. N.: Measurement of nitrate radical concentrations in continental air, Environ. Sci. Technol., 18, 365–369, https://doi.org/10.1021/es00123a015, 1984.
Ridley, B. A. and Howlett, L. C.: An instrument for nitric oxide measurements in the stratosphere, Rev. Sci. Instrum., 45, 742–746, https://doi.org/10.1063/1.1686726, 1974.
Sadanaga, Y., Yuba, A., Kawakami, J., Takenaka, N., Yamamoto, M., and Bandow, H.: A gaseous nitric acid analyzer for the remote atmosphere based on the scrubber difference/NO-ozone chemiluminescence method, Anal. Sci., 24, 967–971, https://doi.org/10.2116/analsci.24.967, 2008.
Sadanaga, Y., Suzuki, K., Yoshimoto, T., and Bandow, H.: Direct measurement system of nitrogen dioxide in the atmosphere using a blue light-emitting diode induced fluorescence technique, Rev. Sci. Instrum., 85, 064101, https://doi.org/10.1063/1.4879821, 2014.
Sander, S. P., Friendl, R. R., Golden-Kreutz, D. M., Kurylo, M. J., Moorgat, G. K., Wine, P. H., Ravishankara, A. R., Kolb, C. E., Molina-Cimadevila, M. J., Pitts, B., Huie, R. E., Orkin, V. L., Finlayson, B. J., and Huie, J. R.: Chemical Kinetics and Photochemical Data for Use in Atmospheric Studies Evaluation Number 15 Jet Propulsion Laboratory, National Aeronautics and Space Administration/Jet Propulsion Laboratory/ California Institute of Technology, Pasadena, CA, 2006.
Shi, Y. L., Cui, S. H., and Xu, S.: Factor decomposition of nitrogen oxide emission of China industrial energy consumption, Environ. Sci. Technol., 37, 355–362, 2014.
Sobanski, N., Tang, M. J., Thieser, J., Schuster, G., Pöhler, D., Fischer, H., Song, W., Sauvage, C., Williams, J., Fachinger, J., Berkes, F., Hoor, P., Platt, U., Lelieveld, J., and Crowley, J. N.: Chemical and meteorological influences on the lifetime of NO3 at a semi-rural mountain site during PARADE, Atmos. Chem. Phys., 16, 4867–4883, https://doi.org/10.5194/acp-16-4867-2016, 2016.
Taketani, F., Kawai, M., Takahashi, K., and Matsumi, Y.: Trace detection of atmospheric NO2 by laser-induced fluorescence using a GaN diode laser and a diode-pumped YAG laser, Appl. Optics, 46, 907–915, https://doi.org/10.1364/ao.46.000907, 2007.
Thieser, J., Schuster, G., Schuladen, J., Phillips, G. J., Reiffs, A., Parchatka, U., Pöhler, D., Lelieveld, J., and Crowley, J. N.: A two-channel thermal dissociation cavity ring-down spectrometer for the detection of ambient NO2, RO2NO2 and RONO2, Atmos. Meas. Tech., 9, 553–576, https://doi.org/10.5194/amt-9-553-2016, 2016.
Villena, G., Bejan, I., Kurtenbach, R., Wiesen, P., and Kleffmann, J.: Development of a new Long Path Absorption Photometer (LOPAP) instrument for the sensitive detection of NO2 in the atmosphere, Atmos. Meas. Tech., 4, 1663–1676, https://doi.org/10.5194/amt-4-1663-2011, 2011.
Villena, G., Bejan, I., Kurtenbach, R., Wiesen, P., and Kleffmann, J.: Interferences of commercial NO2 instruments in the urban atmosphere and in a smog chamber, Atmos. Meas. Tech., 5, 149–159, https://doi.org/10.5194/amt-5-149-2012, 2012.
Vogt, R., Scheer, V., Casati, R., and Benter, T.: On-road measurement of particle emission in the exhaust plume of a diesel passenger car, Environ. Sci. Technol., 37, 4070–4076, https://doi.org/10.1021/es0300315, 2003.
Voigt, S., Orphal, J., and Burrows, J. P.: The temperature and pressure dependence of the absorption cross-sections of NO2 in the 250–800 nm region measured by Fourier-transform spectroscopy, J. Photochem. Photobiol. A, 149, 1–7, https://doi.org/10.1016/s1010-6030(01)00650-5, 2002.
Wada, R. and Orr-Ewing, A. J.: Continuous wave cavity ring-down spectroscopy measurement of NO2 mixing ratios in ambient air, Analyst, 130, 1595–1600, https://doi.org/10.1039/b511115c, 2005.
Wagner, N. L., Dubé, W. P., Washenfelder, R. A., Young, C. J., Pollack, I. B., Ryerson, T. B., and Brown, S. S.: Diode laser-based cavity ring-down instrument for NO3, N2O5, NO, NO2 and O3 from aircraft, Atmos. Meas. Tech., 4, 1227–1240, https://doi.org/10.5194/amt-4-1227-2011, 2011.
Wagner, N. L., Riedel, T. P., Young, C. J., Bahreini, R., Brock, C. A., Dube, W. P., Kim, S., Middlebrook, A. M., Ozturk, F., Roberts, J. M., Russo, R., Sive, B., Swarthout, R., Thornton, J. A., VandenBoer, T. C., Zhou, Y., and Brown, S. S.: N2O5 uptake coefficients and nocturnal NO2 removal rates determined from ambient wintertime measurements, J. Geophys. Res.-Atmos., 118, 9331–9350, https://doi.org/10.1002/jgrd.50653, 2013.
Wang, D., Hu, R. Z., Xie, P. H., Liu, J. G., Liu, W. Q., Qin, M., Ling, L.Y., Zeng, Y., Chen, H., Xing, X.B., Zhu, G. L., Wu, J., Duan, J., Lu, X., and Shen, L. L.: Diode laser cavity ring-down spectroscopy for in situ measurement of NO3 radical in ambient air, J. Quant. Spectrosc. Ra., 166, 23–29, https://doi.org/10.1016/j.jqsrt.2015.07.005, 2015.
Wang, T., Cheung, V. T. F., Anson, M., and Li, Y. S.: Ozone and related gaseous pollutants in the boundary layer of eastern China: Overview of the recent measurements at a rural site, Geophys. Res. Lett., 28, 2373–2376, https://doi.org/10.1029/2000gl012378, 2001.
Westerdahl, D.: Avoiding Measurement Errors When Monitoring Fine and Ultrafine PM for Exposure and Epidemiology Studies, Epidemiology, 19, S360–S360, 2008.
Wild, R. J., Edwards, P. M., Dube, W. P., Baumann, K., Edgerton, E. S., Quinn, P. K., Roberts, J. M., Rollins, A. W., Veres, P. R., Warneke, C., Williams, E. J., Yuan, B., and Brown, S. S.: A measurement of total reactive nitrogen, NOy, together with NO2, NO, and O3 via cavity ring-down spectroscopy, Environ. Sci. Technol., 48, 9609–9615, https://doi.org/10.1021/es501896w, 2014.
Wild, R. J., Dube, W. P., Aikin, K. C., Eilerman, S. J., Neuman, J. A., Peischl, J., Ryerson, T. B., and Brown, S. S.: On-road measurements of vehicle NO2∕NOx emission ratios in Denver, Colorado, USA, Atmos. Environ., 148, 182–189, https://doi.org/10.1016/j.atmosenv.2016.10.039, 2017.
Wu, T., Zhao, W., Chen, W., Zhang, W., and Gao, X.: Incoherent broadband cavity enhanced absorption spectroscopy for in situ measurements of NO2 with a blue light emitting diode, Appl. Phys., 94, 85–94, https://doi.org/10.1007/s00340-008-3308-8, 2009.
Xu, Z., Wang, T., Xue, L. K., Louie, P. K. K., Luk, C. W. Y., Gao, J., Wang, S. L., Chai, F. H., and Wang, W. X.: Evaluating the uncertainties of thermal catalytic conversion in measuring atmospheric nitrogen dioxide at four differently polluted sites in China, Atmos. Environ., 76, 221–226, https://doi.org/10.1016/j.atmosenv.2012.09.043, 2013.
Yamamoto, Y., Sumizawa, H., Yamada, H., and Tonokura, K.: Real-time measurement of nitrogen dioxide in vehicle exhaust gas by mid-infrared cavity ring-down spectroscopy, Appl. Phys. B, 105, 923–931, https://doi.org/10.1007/s00340-011-4647-4, 2011.
Yang, W. and Omaye, S. T.: Air pollutants, oxidative stress and human health, Mutat. Res. Genet. Toxicol. Environ. Mutagen., 674, 45–54, https://doi.org/10.1016/j.mrgentox.2008.10.005, 2009.
Yuba, A., Sadanaga, Y., Takami, A., Hatakeyama, S., Takenaka, N., and Bandow, H.: Measurement System for Particulate Nitrate Based on the Scrubber Difference NO-O3 Chemiluminescence Method in Remote Areas, Anal. Chem., 82, 8916–8921, https://doi.org/10.1021/ac101704w, 2010.