the Creative Commons Attribution 4.0 License.
the Creative Commons Attribution 4.0 License.
 | 18 Jan 2019
The effect of instrumental stray light on Brewer and Dobson total ozone measurements
Omid Moeini
Zahra Vaziri Zanjani
C. Thomas McElroy
David W. Tarasick
Robert D. Evans
Irina Petropavlovskikh
Keh-Harng Feng
Dobson and Brewer spectrophotometers are the primary, standard instruments for ground-based ozone measurements under the World Meteorological Organization's (WMO) Global Atmosphere Watch program. The accuracy of the data retrieval for both instruments depends on a knowledge of the ozone absorption coefficients and some assumptions underlying the data analysis. Instrumental stray light causes nonlinearity in the response of both the Brewer and Dobson to ozone at large ozone slant paths. In addition, it affects the effective ozone absorption coefficients and extraterrestrial constants that are both instrument-dependent. This effect has not been taken into account in the calculation of ozone absorption coefficients that are currently recommended by WMO for the Dobson network. The ozone absorption coefficients are calculated for each Brewer instrument individually, but in the current procedure the effect of stray light is not considered. This study documents the error caused by the effect of stray light in the Brewer and Dobson total ozone measurements using a physical model for each instrument. For the first time, new ozone absorption coefficients are calculated for the Brewer and Dobson instruments, taking into account the stray light effect. The analyses show that the differences detected between the total ozone amounts deduced from Dobson AD and CD pair wavelengths are related to the level of stray light within the instrument. The discrepancy introduced by the assumption of a fixed height for the ozone layer for ozone measurements at high latitude sites is also evaluated. The ozone data collected by two Dobson instruments during the period of December 2008 to December 2014 are compared with ozone data from a collocated double monochromator Brewer spectrophotometer (Mark III). The results illustrate the dependence of Dobson AD and CD pair measurements on stray light.


Routine atmospheric total column ozone measurements started in the mid-1920s with a Féry spectrophotometer (Dobson, 1931). Following the International Geophysical Year (1958) a worldwide network was developed with a number of Dobson instruments that were installed around the world to monitor total ozone variations. In the early 1980s the automated Brewer became commercially available (Kerr et al., 1981). A network was also introduced for the Brewer as observing organizations started to use these instruments alongside the Dobson for long-term measurements. Although the principle behind the measurements of the Brewer and Dobson instruments is generally the same, seasonal and systematic differences in respective TOC (total ozone column) products became evident after long-term co-incident measurements had accumulated (Staehelin et al., 1998; Vanicek, 2006). The adoption of the Bass and Paur (1985) ozone cross sections (BP) for the Dobson instrument in 1992 put both instruments on the same reference scales (the Brewer uses BP) and reduced the difference to 4 % (Kerr et al., 1988) but it did not resolve the seasonal and nonseasonal differences (Vanicek, 2006).
Temperature corrections to the ozone absorption cross sections may reduce the systematic errors of Dobson ozone data by up to 4 % (Bernhard et al., 2005). The seasonal differences between the measurements by the two instrument types are related to the ozone effective temperature, which affects the ozone absorption measured by the Brewer and Dobson instruments differently (Bernhard et al., 2005; Kerr et al., 1988; Scarnato et al., 2009; Van Roozendael et al., 1998; Vanicek, 2006) because of the different wavelengths employed for the measurements. The impact of different laboratory-determined ozone cross sections has also been investigated and showed up to a 3 % change for the Brewer and 1 % for Dobson data (Redondas et al., 2014).
To facilitate the replacement of Dobson instruments with Brewers, statistical methods have been developed to derive transfer functions for converting Dobson measurements to the Brewer scale (Staehelin et al., 2003). These methods have been partly successful, but they cannot entirely explain the differences between the measurements of the two instruments (Scarnato et al., 2010). Scarnato et al. (2010) found an unexplained 3 % drift over a 10-year period (1988–1997) between Arosa's Dobson and Brewer total ozone series.
Analysis of the data obtained by the Dobson at the South Pole showed that the assumption of the ozone layer being at a fixed height leads to an error in the air mass calculation. The errors caused by this assumption may exceed 4 % in ozone measurements when the ozone distribution is distorted by the ozone hole (Bernhard et al., 2005).
Stray light has been demonstrated to affect measurements by both instrument types (Bais et al., 1996). Basher (1982) used a mathematical model to estimate stray light levels present in the measurements of a particular Dobson instrument. According to Basher (1982), errors of 1 %, 3 %, and 10 % may be present at air mass values of 2.5, 3.2, and 3.8, respectively, for direct sun AD measurements. Christodoulakis et al. (2015) employed Basher's model to estimate the stray light level of Dobson no. 118 at the Athens Dobson station using direct sun AD wavelength pair measurements collected over a large range of solar zenith angles (SZAs). The result showed that the mean underestimation of ozone was 3.5 DU (or about 1 % of the station's mean total ozone column value) for measurements with air mass values of up to 2.5. However, a single-pair parameter was not found for Basher's model that succeeded in calculating the stray light correction for all experimental days. Christodoulakis et al. (2015) concluded that Basher's model cannot quantify the effect of stray light on TOC measurements made by the Dobson instrument under all conditions and that further study was needed. This was also noted by Basher (1982) and Evans et al. (2009).
Karppinen et al. (2014) employed the method suggested by Kiedron et al. (2008) to correct the data collected by a single monochromator Brewer during the Intercomparison/Calibration campaign for Nordic Brewers and Dobsons held at Sodankylä from 8 to 24 March 2011 and a follow-up campaign at Izaña Observatory, Tenerife, between 28 October and 18 November 2011. The method suggested relies heavily on the dispersion information for the instrument which is not available for all instruments, especially in the historical record.
The errors caused by stray light are particularly significant at high latitudes in the late winter and early spring when measurements are made at large SZA and large TOC. Such errors are of considerable importance if those data are to be used for trend analysis or satellite data validation. In particular, if such data are used in cases where Dobsons or single monochromator Brewers are replaced by instruments with a significantly lower level of stray light, such as double monochromator Brewers (Mark III), a significant false positive trend in ozone may result.
The main goal of this study is to investigate and document these sources of error in total ozone as measured by the Dobson and Brewer instruments at high latitudes.
2.1 Retrieval algorithm
According to the Beer–Lambert law, the spectral irradiance I(λ) from a direct solar spectrum at the Earth's surface can be expressed as
where τ(λ) is the optical thickness of the incident path and I0(λ) is the extraterrestrial irradiance at wavelength λ
and α(λ) is the monochromatic ozone absorption coefficient at wavelength λ, X the total ozone column (TOC), μ the relative optical air mass corresponding to ozone absorption, β(λ) the Rayleigh optical depth for a one-atmosphere path, Ps the station pressure, P0 the mean sea level pressure (101.325 kPa), mR the relative optical air mass corresponding to Rayleigh scattering (extinction), δ(λ) the aerosol optical depth, and ma the relative optical air mass corresponding to aerosol scattering (extinction).
The Dobson spectrophotometer does not measure the intensity of sunlight at a single wavelength but instead determines the ratio between the irradiance at two wavelengths, one strongly absorbed and the other more weakly affected by ozone. Several wavelength pairs are used by the Dobson algorithm for calculating total column ozone. In order to minimize the effect of aerosol and other absorbers, two wavelength pairs are used such as AD, AC or CD where the A pair is 305.5–325.4 nm, C is 311.5–332.4 nm and D is 317.6–339.8 nm (Evans and Komhyr, 2008; Komhyr et al., 1993). For example, the total ozone using AD wavelength pair observations is retrieved using the following expression:
where is the effective differential ozone absorption coefficient at −46.3 ∘C and K is the instrument constant. Other double wavelength pairs such as CD can be used for the ozone calculation by modifying Eq. (3) accordingly (Komhyr et al., 1993).
The basic measurement principle for the Brewer instrument is the same as the Dobson. However, the Brewer measures the intensity of four operational wavelengths quasi-simultaneously. The total ozone is calculated using the following equation:
where and ETC are the effective differential ozone absorption coefficient at −45 ∘C and extraterrestrial constant (ETC), respectively. Both are obtained from a linear weighted combination of the logarithms of their individual values at the four wavelengths used for the total ozone retrieval (Kerr, 2002). MS9 is calculated from a linear combination of the logarithms of the intensities (I(λi)) measured at the four wavelengths λi = (310.0, 313.5, 316.8, 320.0), multiplied by weighting coefficients wi.
The weighting coefficients, wi = (1.0, −0.5, −2.2 and 1.7), have been selected to minimize the absorption of SO2 and suppress any variations that change linearly with wavelength. Hence, the aerosol scattering effect, which is approximately linear with wavelength over a narrow wavelength range, is suppressed in the calculation. The wi sum to zero, the requirement for the absorption function to be independent of absolute intensity. The ETC of a primary standard instrument is determined using observations made at Mauna Loa Observatory (MLO) and are calculated using zero air mass factor extrapolation (Langley plot method). It can be transferred to other instruments by comparisons with a traveling standard instrument (Fioletov et al., 2005).
2.2 Effective ozone absorption coefficients
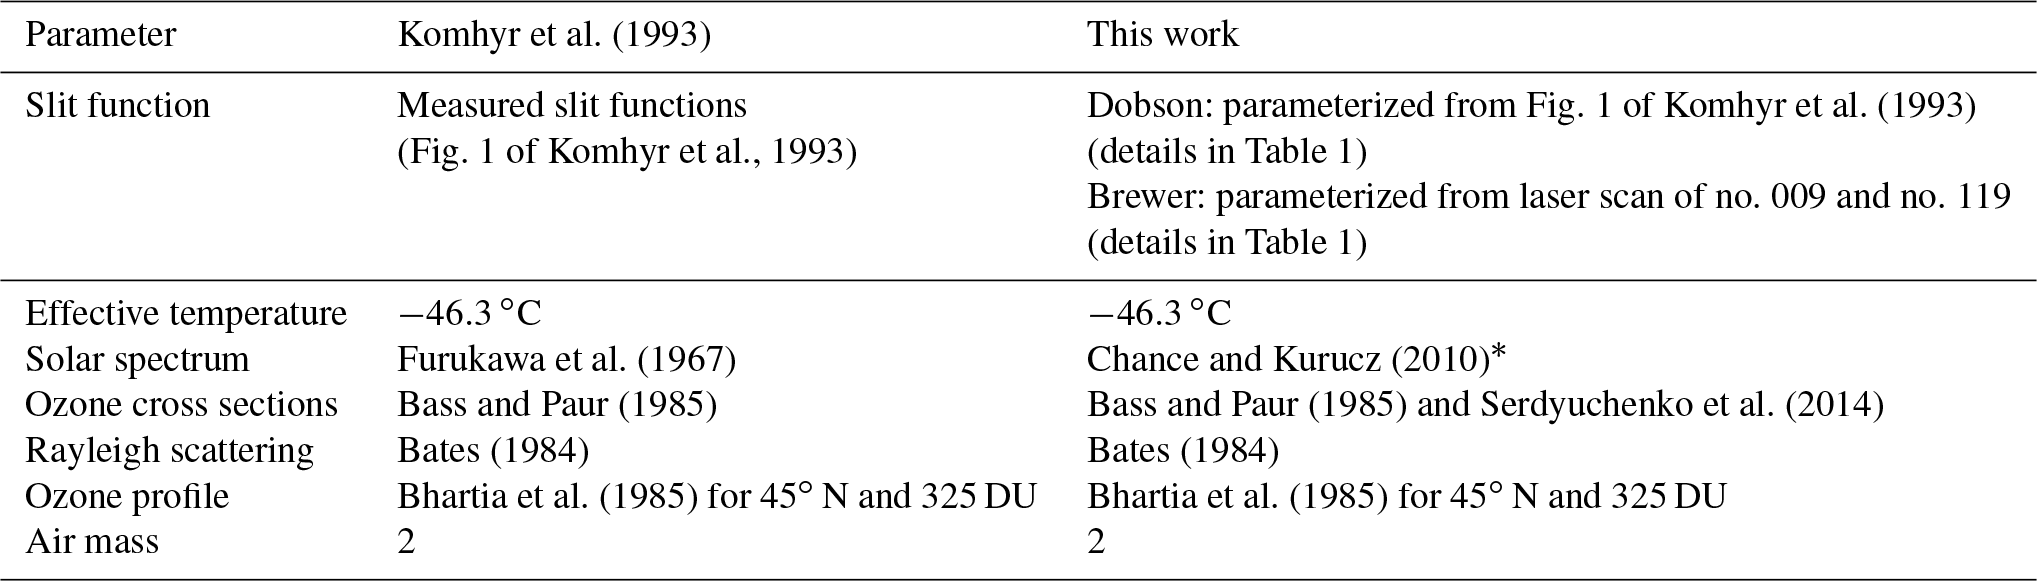
To calculate the effective ozone absorption coefficients, the laboratory-determined ozone cross sections at an effective atmospheric ozone layer temperature must be convolved with the instrument slit function, weighted by the solar flux. The BP ozone cross sections were recommended by the International Ozone Commission (IO3C) in 1992 (http://www.esrl.noaa.gov/gmd/ozwv/dobson/papers/coeffs.html, last access: 10 June 2017) for the Brewer and Dobson networks. The calculation of the absorption coefficients, which are currently recommended by the World Meteorological Organization (WMO) for Dobson instruments, is described by Komhyr et al. (1993) (K93 hereinafter) and the reevaluation is described by Bernhard et al. (2005) (B05 hereinafter). Recently the IO3C has recommended the ozone cross sections measured by Serdyuchenko et al. (2014) (SC hereinafter), as they reduce the Dobson temperature sensitivity. In this study, for consistency with previous work and to be relevant and comparable to modern work, both the BP and SC cross sections are used. A correction factor
based on the results of Barnes and Mauersberger (1987), as suggested by K93, is used to adjust the BP cross sections. T is the temperature in kelvin and T0 is 273.15 K. For this study all BP cross sections are multiplied by this factor and calculated at −46.3 for both instruments to be consistent. This correction has been implemented in the Dobson network. For wavelengths longer than 340 nm, where BP data are not available, the Brion et al. (1993), Daumont et al. (1992), and Malicet et al. (1995) (BDM) data are used. These data sets are available at individual temperatures and also with the associated quadratic coefficients of temperature dependence on the IGACO (Integrated Global Atmospheric Chemistry Observations) web page. For this study the quadratic coefficients in the file “Bp.par” are used for BP cross sections and the Liu et al. (2007) quadratic approximation which excludes −273 ∘K data from the quadratic temperature dependence fitting is used for BDM cross sections. For SC cross sections the quadratic temperature dependence fitting is also used. The temperature dependence of the cross sections is expressed as
where σ(λ,T) is the ozone absorption cross sections at wavelength λ and temperature T, and C0, C1, and C2 are the quadratic coefficients at wavelength λ. The absorption coefficients are calculated from the ozone cross sections σ(λ,T) and the ozone number density ρ(z):
where z0 is the altitude of the station and T is the temperature in kelvins. The total ozone column, X (in Dobson units equal to 2.69×10¹⁶ ozone molecules per square centimeter), is defined as
where T0 is 273.15 K and k is the Boltzman constant. (It should be noted that X is used in the equations, whereas TOC is used in the text.) In order to account for the finite bandwidth of the Brewer and Dobson slit functions, the effective ozone absorption coefficient is used instead of α(λ) in the Brewer and Dobson retrieval algorithms (Basher, 1982; Vanier and Wardle, 1969):
where S(λ,λi) is the slit function for a nominal wavelength λi.
The Brewer operational method employs a simpler approximation, which is identical to the approximation method of B05 and the simplest approach of K93, and also used by Redondas et al. (2014), Van Roozendael et al. (1998), Scarnato et al. (2009), and Fragkos et al. (2015):
2.3 Ozone air mass calculations
Both Brewer and Dobson retrievals assume a fixed height for a thin layer of ozone to calculate the ozone air mass. The following expression is used by both instruments to calculate relative optical air mass at a solar zenith angle of θ:
where Re is the radius of the Earth, r is the altitude of the station, and h is the height of the ozone layer. Using the mean Earth radius for Re instead of the actual Earth radius at the station does not introduce a significant error in μ. However, it is important that the correct values for the station altitude and the height of the ozone layer are used in Eq. (19). The Dobson community has adopted a variable ozone layer height with latitude which, to some extent, is in agreement with ozone climatology, while a fixed height of 22 km is used in the Brewer network.
2.4 Slit function and stray light effect
Stray light is unwanted radiation from other wavelengths that arrives at the detector during measurements at a selected wavelength. Scattering by instrument optical elements and inefficient out-of-band (OOB) rejection of the light by dispersive elements, e.g., the grating, are the main sources of stray light in the spectrometers. Particulate scattering within the instrument and radiation scattered from the atmosphere within the field of view of the instrument can also contribute a stray light effect (Josefsson, 1992). Generally, holographic gratings with higher line densities generate lower stray light. The Mark II and IV versions of the Brewer demonstrate higher levels of stray light compared to the Mark III as the Mark III instruments utilize a double monochromator with higher line density gratings that leads to significantly better rejection of the OOB light.
Since the gradient of ozone absorption is large in the ultraviolet spectral region, the stray light contribution from longer wavelengths can make up a significant fraction of the signal measured at shorter wavelengths where the intensity is reduced by ozone absorption. As the light path (air mass and ozone path) increases, stray light effects in the measurements also increase. Stray light results in an underestimated ozone column at larger ozone slant column amounts.

Figure 1Slit functions measured with a He-Cd laser for single no. 009 and double no. 119 Brewers at Mauna Loa as well as fitted models; the ideal slit function is also shown inside the main graph.
To characterize the stray light in an instrument it is necessary to measure the instrument slit function. The Brewer Mark III and IV can measure the wavelength range of 286.5 to 363 nm with 0.5 nm resolution. The Brewer slit function is characterized as using a narrow band line source such as a laser as input source and scanning through all wavelengths. Measurements at 350 nm (not reported) have shown the slit function to be similar at all wavelengths in the Brewer measurement range. The slit function is reversed in wavelength space to account for the reciprocal nature of scanning the instrument versus scanning the wavelength of the line source. A He-Cd laser is commonly used to measure the slit function of the Brewer (Karppinen et al., 2014; Kiedron et al., 2008; Pulli et al., 2018). For this study a He-Cd laser (single line at 325.029 nm) was used as well to measure the slit functions of Brewers no. 009 and no. 119. Figure 1 shows the measured slit functions of Brewer Mark IV no. 009 (single monochromator) and Mark III no. 119 (double monochromator) located at Mauna Loa Observatory. Several Brewer Mark IV, Mark II, and Mark III slit functions have been measured during intercomparison campaigns (e.g., the Fourth North American Interagency Intercomparisons of Ultraviolet Monitoring near Boulder, Colorado, in 1997 and published by Lantz et al., 2002, and Intercomparison Campaigns of the Regional Brewer Calibration Center for Europe, RBCC-E). The slit function consists of a core (band-pass), the shoulders, and the extended wings (Fig. 1). The stray light measured from nearby wavelengths (the wings of the slit function) is typically below 10−6 times that of the primary wavelength in the Mark III double Brewers as compared to 10−4 in the Mark II and Mark IV single Brewers. To reduce the effect of stray light, the Brewer Mark II uses a cutoff filter which strongly attenuates wavelengths longer than 345 nm. A solar blind filter (SBF) made of nickel sulfate hexahydrate (NiSO4.6H2O) crystal sandwiched between two UV colored glass filters (similar to Schott UG5 or UG11) is also used in the Mark IV. Figure 2 shows the transmission of a typical UG11-NiSO4 filter measured by a Cary 5E spectrophotometer. The stray light level depends on the optical and mechanical configuration which is unique for each instrument, and thus two identically configured instruments can have somewhat different OOB light rejection.

Figure 2The transmission of a typical combined UG11-NiSO4 filter utilized by Brewer Mark IV to reduce the stray light measured with a Cary 5E spectrophotometer for Brewer no. 154 filters.
In the Brewer operational wavelength calibration, the individual slit functions are characterized separately through dispersion analysis (Gröbner et al., 1998). For this study, a symmetrical trapezoid is fitted to the measured slit functions of Brewer no. 009 (single – Mark IV) and Brewer no. 119 (double – Mark III) (Fig. 1). The model slit function fit to the data (red line) includes three parts: a trapezoid with a nominal full width half maximum (FWHM; Table 1) at the core band-pass, the shoulders which are modeled by fitting a Lorentzian function (Table 1) to the measured data, and two horizontal straight lines for the outer parts (wings). To investigate the effect of stray light, an ideal slit function, which is a trapezoid shape with a flat top at 0.87 of the full height and two straight lines to zeros with a nominal FWHM, has been used (Fig. 1, top left).
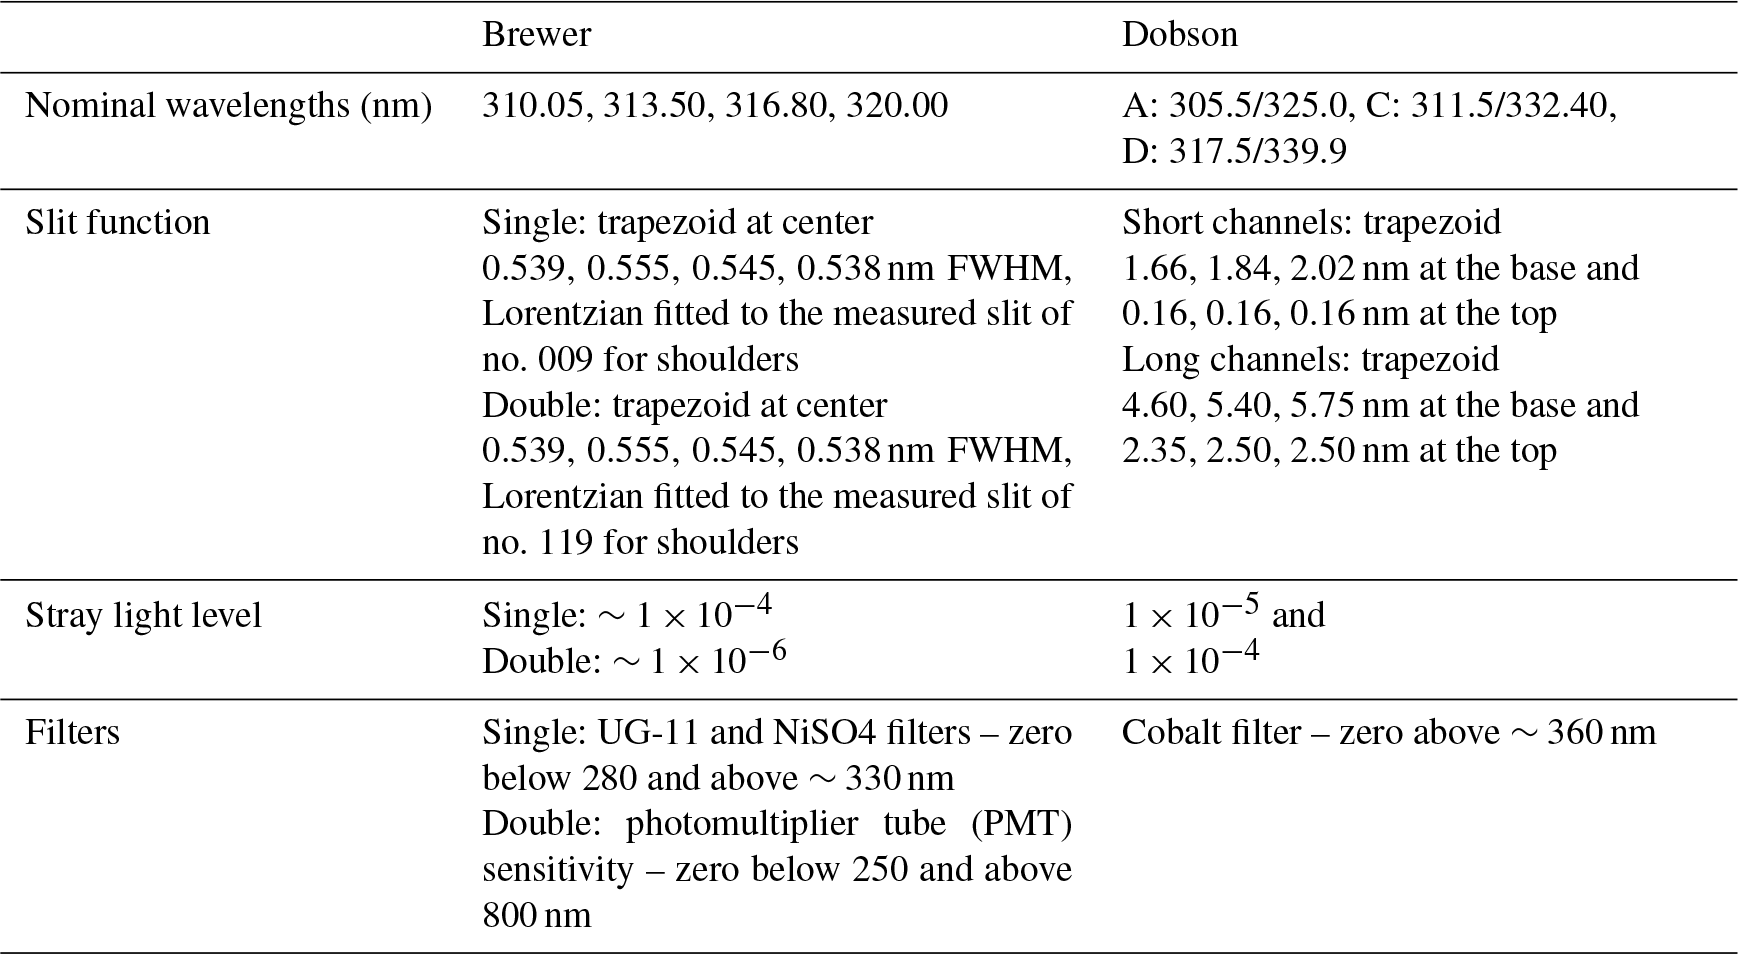
The slit functions of the world standard Dobson no. 83 were experimentally measured by Komhyr et al. (1993) and recently verified by Köhler et al. (2018) using a tuneable light source. However, the published slit functions are restricted to the core band-passes. It has been assumed that the Dobson instrument restricts OOB light from entering the slit. The extended wings have not been measured for the Dobson instrument. Basher (1982) attempted to estimate the level of stray light within the Dobson instrument by fitting a mathematical model to the AD pair direct sun measurements and analyzing the total column ozone changes with solar zenith angle. His analysis suggested that for most Dobson instruments the level of stray light is 10−4 based on the nonlinearity of the AD direct sun measurements beyond an air mass factor of 3.
Another approach has been used by Evans et al. (2009) to measure the stray light entering the Dobson instrument. They used a filter that is opaque to the C-pair nominal short wavelength band-pass, and transparent outside of this range (Fig. 6 in Evans et al., 2009). The idea is that the filter would remove the desired band-pass from the signal and any current remaining is from OOB light. This method was used to estimate the contribution of stray light in zenith sky measurements of Dobson no. 65 in Boulder, Colorado. They also used a model approach for the stray light contribution in zenith sky measurements and concluded that the level of stray light in Dobson no. 65 is likely 2.
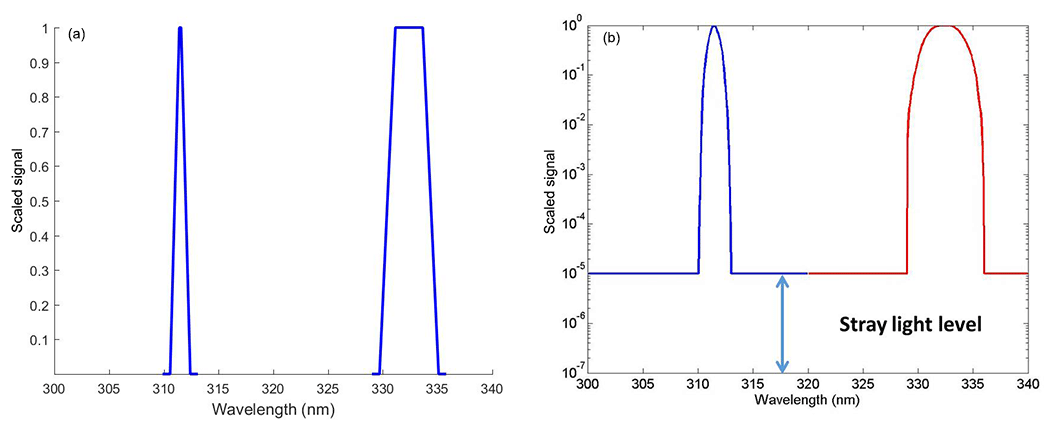
Figure 3Dobson C-pair ideal slit functions (a) parameterized from Fig. 1 of Komhyr. (1993). Dobson modeled slit functions (b). Two straight lines have been added to the core slit functions in order to account for stray light.
The Dobson slit functions for short and long wavelengths are approximately a triangle with a FWHM of 1.06 nm and a trapezoid with a FWHM of 3.71 nm, respectively (Fig. 3). For this study, symmetrical trapezoids centered at the nominal Dobson wavelengths were fitted to the experimentally determined slit functions of Dobson no. 83 and used as ideal slit functions. The characteristics of these trapezoids are given in Table 1. In order to account for stray light, for this study two horizontal straight lines were added to the outer parts of the ideal slit functions.
3.1 Effect of stray light on ozone absorption coefficients
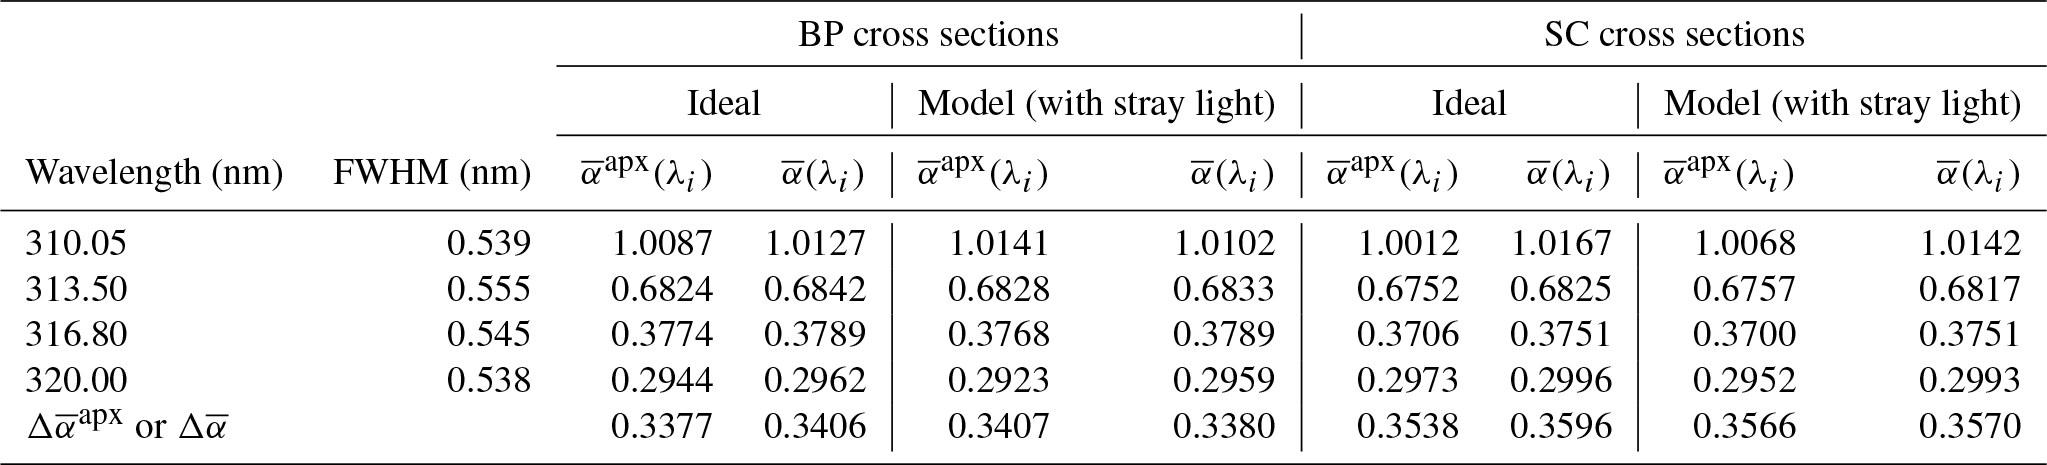
To calculate the ozone absorption coefficients, the standard values defined in Tables 1 and 2 are employed. To validate the calculations, the is calculated for the double Brewer using an ideal trapezoid slit function and BP cross sections at −45 ∘C without the Barnes and Mauersberger (1987) correction. Redondas et al. (2014) have calculated the ozone absorption coefficients for the nominal Brewer which is identical in terms of slit functions, nominal wavelengths, and slit FWHMs with the double Brewer of this work using ideal trapezoid slit functions. The IGQ4 cross sections used in Redondas et al. (2014) are the same as the BP cross sections employed in this work. The value 0.3367 calculated using IGQ4 cross sections at −45 ∘C (Redondas et al., 2014, Table 6) has a difference of 0.06 % to the value 0.3365 calculated here with the same cross sections at the same temperature (−45 ∘C) (Table 3).
Table 2Parameters for calculation of ozone absorption coefficients.
* For this study the wavelength range of 285–363 nm is used for calculations.
Table 3Ozone absorption coefficients calculated here and the value calculated by Redondas et al. (2014).

3.1.1 Brewer
To be consistent with Dobson calculations, the Barnes and Mauersberger (1987) correction is applied to BP cross sections. Both BP and SC cross sections at −46.3 ∘C are used for the calculation of and presented in Tables 4 and 5 for the single and double Brewers.
Table 4Single Brewer ozone absorption coefficients.
BP cross sections with Barnes (1987) correction; both BP and SC cross sections at −46.3.
Table 5Double Brewer ozone absorption coefficients.
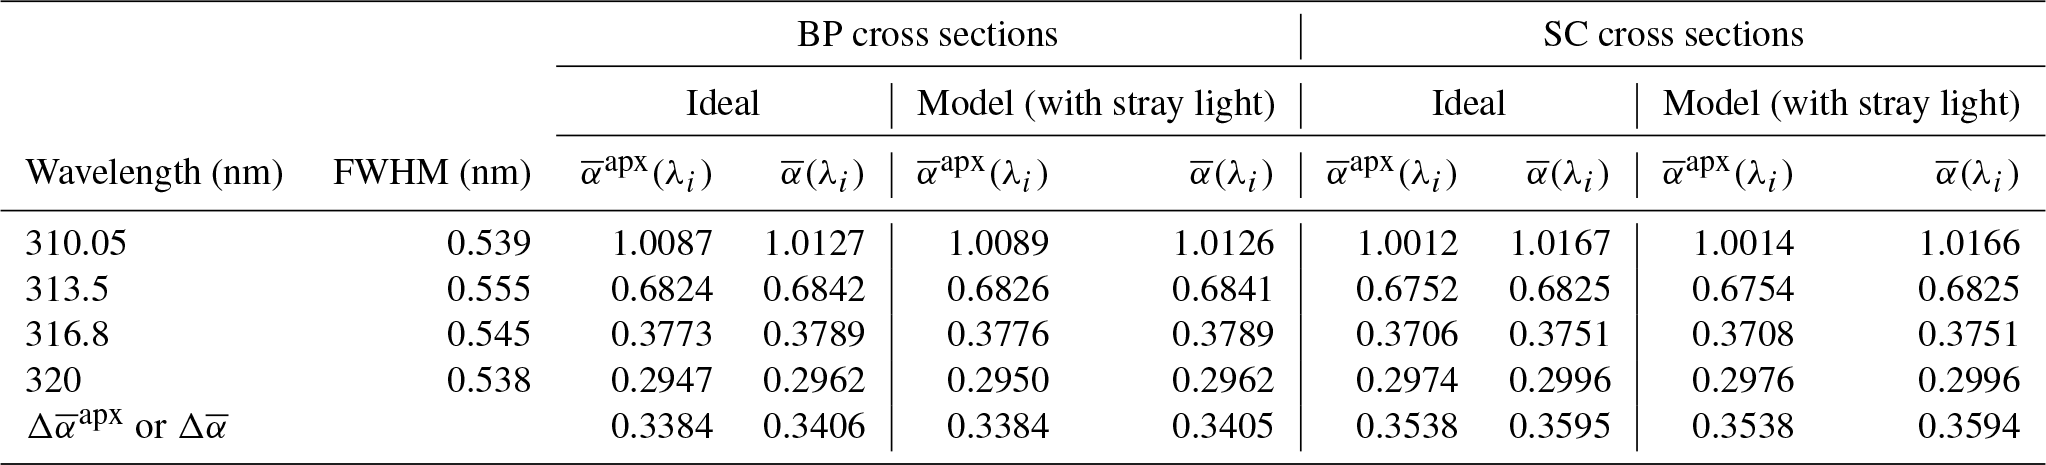
BP cross sections with Barnes (1987) correction; both BP and SC cross sections at −46.3.
The contribution of stray light in determining the ozone absorption coefficients can be seen from comparing the calculated using ideal slit functions (without stray light) with the values ( calculated using modeled slit functions (including stray light). For the single Brewer the results show a difference of 0.7 % (modeled slit functions including stray light are less than that of the ideal slit functions) using both BP and SC cross sections, while for the double Brewer the difference is less than 0.01 %.
3.1.2 Dobson
The values of and calculated for the Dobson instrument using the modeled slit functions are provided in Table 6. is the adjusted set of coefficients which are recommended by WMO to be used for the Dobson network. After applying the K93 data set to the observations made by the World Standard Dobson instrument no. 083 at Mauna Loa Observatory, 0.8 % for AD pair differences and 2.2 % for CD pair differences in the calculated total ozone values were detected. K93 realized that increasing by 2 % would decrease the discrepancies to below 0.5 %. Thus, the adjusted values were recommended by WMO to be used for the Dobson instruments.
Table 6Dobson wavelengths and ozone absorption coefficients.
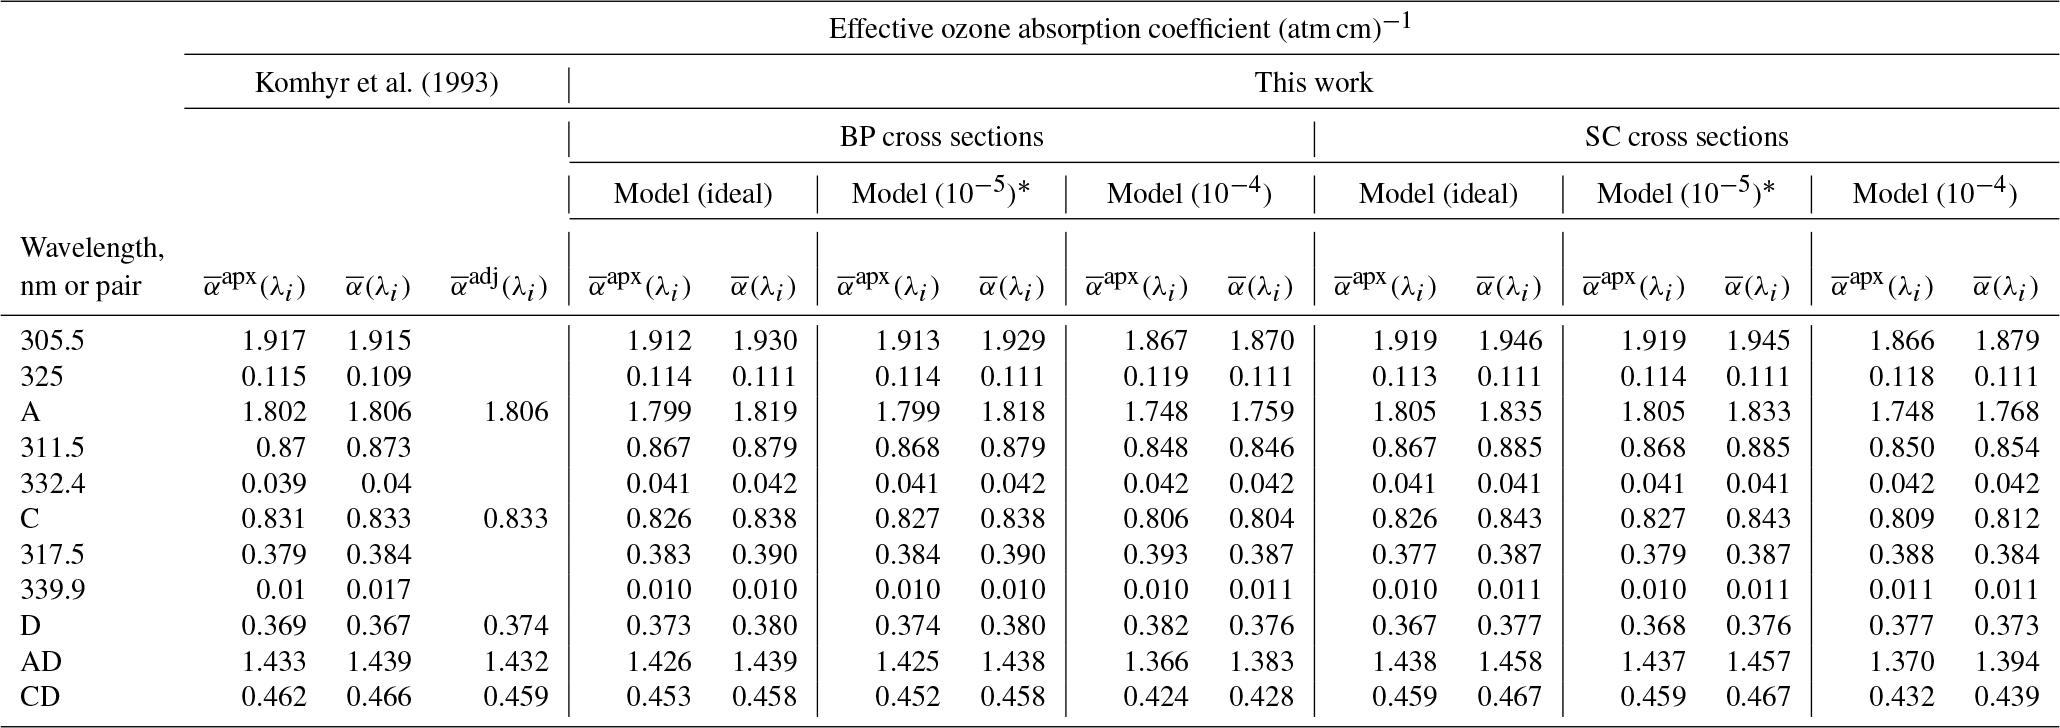
* The numbers inside the braces show the levels of stray light.
The values of calculated using ideal slit functions and BP cross sections agree with the corresponding values of K93 to within ±2.0 %. In the case of , the comparison indicates agreement to within ±3.4 % except for where the difference is about 67 %. Approximately the same difference was reported by B05 for the same wavelength compared to K93. B05 have investigated this discrepancy by using Molina and Molina (1986) cross sections to extend the BP data sets for Dobson calculations and concluded that the K93 value for is unreasonably high. As in B05, the calculated value, , presented in this study agrees better with the empirically adjusted value, . The comparison shows agreement to within ±1.6 % between the values calculated for this work and the K93 adjusted values.
Generally, the differences between values presented here and those from K93 are slightly higher than the difference between B05 and K93. However, it should be noted that the slit functions and the parameters used in the calculations presented here are slightly different from those used by K93 and B05 (Tables 1 and 2).
Clearly, the stray light level within each instrument has an effect on the ozone absorption coefficient calculations. This effect is negligible for instruments with a stray light level on the order of 10−5. But the difference could be up to 4.0 % for AD pair coefficients ( ) and 6.9 % for CD pair coefficients using BP cross sections, and up to 4.6 % and 6.4 % using SC cross sections, for instruments with levels of stray light on the order of 10−4 when compared with the values calculated using ideal slits. These differences translate to an underestimation of ozone values through Eq. (3). However, by scaling the data using the Dobson calibration procedure, the difference between the AD measurements of the standard instrument and a calibrated one is reduced to less than 0.7 % (Evans and Komhyr, 2008). In the Dobson AD pair calibration, scale factors are calculated for different ranges of air masses. The data from the instrument being calibrated are scaled to the data from the reference instrument. Then, using the quasi-simultaneous measurements of AD and CD pairs of the calibrated instrument, a scaling factor is also calculated to reduce the CD measurements to the AD level.
3.2 Stray light influence on low-sun measurements
To illustrate the effect of stray light on low-sun measurements, the percentage difference between ozone derived using Brewer and Dobson retrievals with assumed constant ozone in the atmosphere is depicted as a function of ozone slant path (OSP, total ozone times air mass) in Fig. 4. As the selection of the cross sections has an insignificant effect on the results shown and discussed in this section, only BP cross sections are plotted. Equation (1) along with parameters indicated in Table 2 are used to model the atmosphere and calculate the solar spectrum at the surface. To retrieve the ozone values, the BP absorption coefficients calculated in Sect. 3.1 are used. To calculate the ETC values, the instrument absorption function is calculated and plotted as a function of ozone slant path, using the solar spectrum (Chance and Kurucz, 2010), Eqs. (1) and (2), and retrieval algorithm of the Brewer (or Dobson) for an assumed constant amount ozone (325 DU in this study). The best fit to the data with air mass less than 2 (less than 3 for the Dobson instruments) is found and extrapolated to zero air mass. Figure 5 shows the best fit to data from a single Brewer. For the single Brewer the ETC is calculated as 1945.4 for a modeled trapezoid slit function with stray light, which is close to the value of 2020 calculated by Kiedron et al. (2008), noting the slight differences in slit functions and solar spectrum. Karppinen et al. (2015) have reported 3218 for an ETC value for slit functions with stray light. However, they used the LibRadtran 1.6-beta radiative transfer model to scale their modeled data to be matched with real data. For Dobsons, the ETC values calculated using ideal slits are used for other models (i.e., with 10−4 and 10−5 levels of stray light). Two versions of the Brewer are compared with the Dobson instrument measurements with two levels of stray light. AD measurements with 10−4 order of stray light show approximately 25 % discrepancy at 2000 DU OSP (air mass 6.2 in this case). The difference is about 5 % for a typical single Brewer at the same OSP. The underestimation of total ozone as measured by the AD pair of a Dobson instrument with 10−5 level of stray light could be up to 6 % at 2000 DU OSP. It has to be noted here that AD pair measurements are conducted for air mass factors less than 2.5 and thus, during the ozone hole period (total column ozone is less than 300 DU), Dobson data will only be reported for OSP less than 750 DU (Evans and Komhyr, 2008).
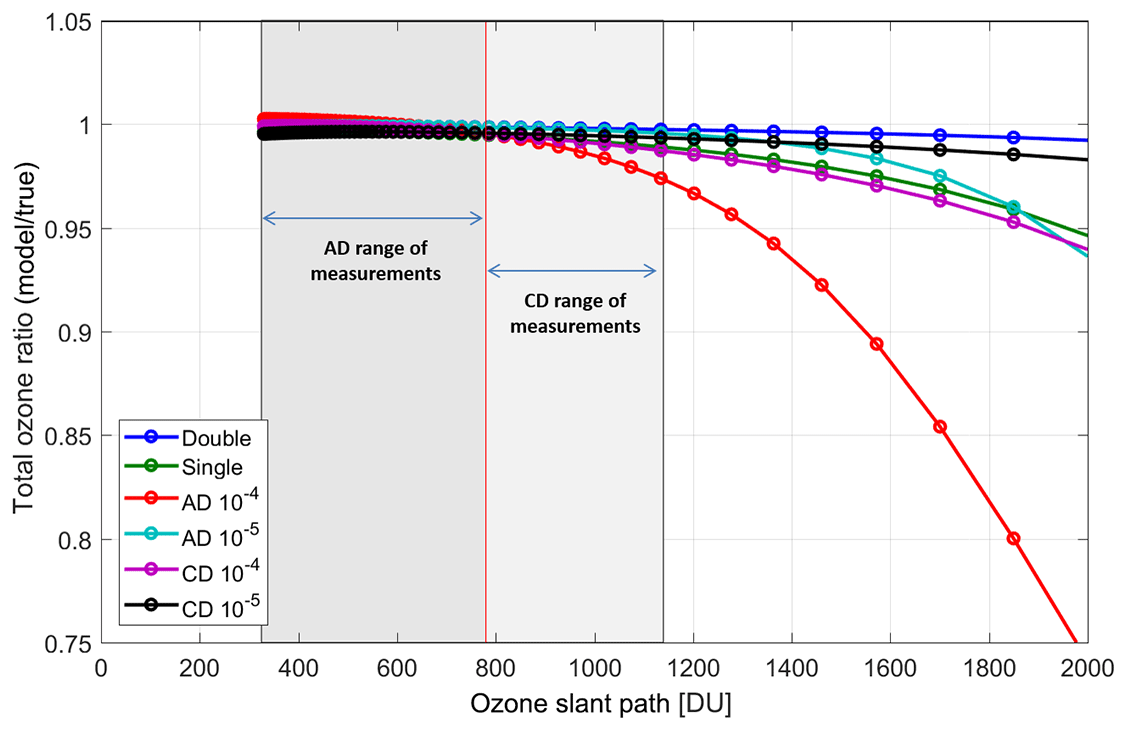
Figure 4Ratio of the values retrieved from modeled single and double Brewers as well as a Dobson instrument with different levels of stray light (the numbers in front of the pairs show the levels of stray light) to assumed 325 DU ozone in the atmosphere (see text for details). The calculations reported in this study for the BP absorption coefficients have been used to retrieve total ozone. It should be noted that the air mass factor range recommended for AD measurements is 1.015 to 2.5 or less than 800 DU OSP and for CD measurements is 2.4 to 3.5 or less than 1200 DU OSP (Evans and Komhyr, 2008).

Figure 5Example of Langley plot fitted to a modeled single Brewer data (see text for the details).
Evidently, the CD pair is less influenced by scattered light than the AD pair because of the smaller ozone cross sections at the CD wavelengths and the consequent smaller gradient with respect to wavelength in the spectrum measured. For a Dobson instrument with a minimum level of stray light (10−5) the difference for the CD pair could be up to 1.8 % at 2000 DU OSP, while it is less than 0.8 % for a typical double Brewer at the same OSP. Dobson CD total ozone is reported for air mass values between 2.4 and 3.5; thus for the total ozone (TCO) of 300 DU or less, the maximum reported OSP would be 1100 DU (Evans and Komhyr, 2008).
3.3 Total ozone values retrieved from Dobson AD and CD pairs
For decades the Dobson community has faced a discrepancy between the ozone values deduced from quasi-simultaneous AD and CD pair measurements. As indicated by the Dobson operational handbook, AD observations are the standard for the Dobson instrument and all other observations must, therefore, be scaled to the AD level by determining a multiplying factor. For example, the ozone values deduced from measurements on CD wavelengths should be multiplied by the factor of XAD∕XCD (where XAD and XCD are the average ozone measurements retrieved from AD and CD pairs derived from a large number of quasi-simultaneous observations covering a broad range of μ values greater than 2.0) to be scaled to those deduced from AD measurements.
Figure 6(a) The ratio of total ozone retrieved from modeled Dobson AD and CD pairs using BP and SC cross sections with different levels of stray light (10−4 and 10−5) to true ozone as a function of OSP. (b) The ratio of total ozone retrieved from AD to CD wavelength pairs. The adjusted coefficients recommended by WMO are used to derive the total ozone amounts for these models. The ETC values calculated using the Langley method for ideal instruments are used here as well.
Figure 6 illustrates the discrepancy in total ozone reduced from AD and CD pairs for two modeled Dobson instruments with different levels of stray light using two different ozone cross sections (BP and SC) as a function of OSP. The ratio of the AD to the CD pair is also shown. The adjusted coefficients calculated by K93 and recommended by WMO are used to derive the total ozone amounts for this model. The ETC values that were calculated using the Langley method for an ideal instrument are used here as well. It can be seen that, as the level of stray light increases, the difference between the AD and CD values increases, indicating the role of stray light in the observed discrepancy between AD and CD values. The results suggest that the difference between the AD and CD values also depends on the selected cross sections. It is apparent that the increase of the AD–CD difference as a result of increasing the level of stray light is larger for BP cross sections than for SC cross sections. This is consistent with Redondas et al. (2014) analysis, indicating the role of ozone cross sections in the difference detected between AD and CD measurements.
Clearly, the difference varies between Dobson instruments as it depends on the level of stray light, which is unique for each individual instrument. Moreover, as discussed in Sect. 3.1, these discrepancies are reduced during calibration using simultaneous measurements with a well-maintained, standard instrument.
3.4 Discrepancy caused by air mass calculation
To retrieve total ozone from direct sun measurements, it is required that the ozone air mass value be calculated. For measurements at the South Pole, the following values are used by the Dobson community in Eq. (19): Re=6356.912, r=2.81 km, and h=17 km. Figure 7 shows the ratio of total ozone retrieved using air mass values calculated with four different sets of assumptions for Re, r, and h to ozone values retrieved using the air mass factor calculated for the South Pole employing the Dobson community's values for Re, r, and h as a reference. Any discrepancy in the air mass is directly reflected in the Dobson and Brewer retrieved ozone via Eqs. (3) and (9), respectively. It is obvious that the fixed ozone layer height of 22 km, as used by Brewer retrieval, can cause up to a 2.2 % difference at an air mass of 5.4. In addition, the altitude of the site can introduce a significant difference at high solar zenith angles.
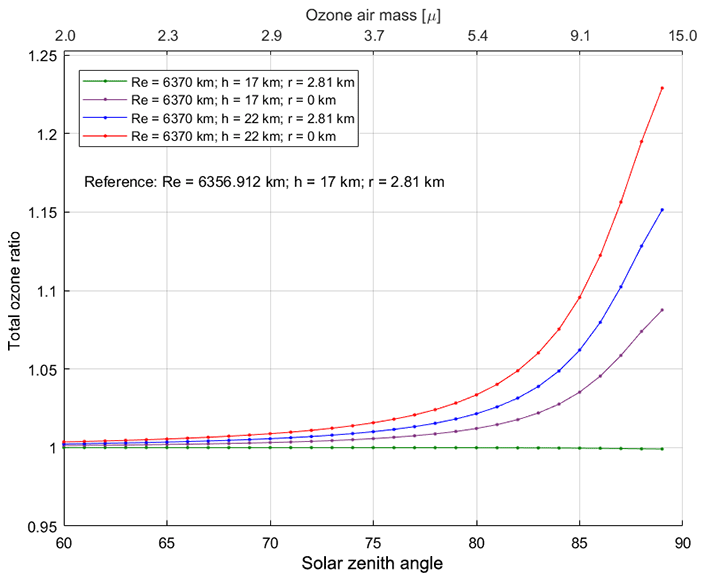
Figure 7The ratio of total ozone retrieved from modeled Dobson using air mass factors calculated with a mean value for the radius of the Earth, Re=6370 km as used in the Brewer retrieval, and different values for the altitude of site, r, and the height of ozone layer, h, to the ozone values retrieved using air mass factors calculated for the South Pole employing Re=6356.912 km, r=2.81 km, and h=17 km as a reference. Any discrepancy in the air mass is directly reflected in the Dobson and Brewer retrieved total ozone via Eqs. (3) and (9), respectively.
Total ozone measurements collected by two Dobson instruments (no. 82 and no. 42) and one double Brewer Mark III, no. 085, collocated and operated simultaneously at the Amundsen-Scott site (24.80∘ W, 89.99∘ S; altitude 2810 m), are used for this comparison. Double Brewer no. 085 was installed at the South Pole station in 2008 and since then it has been in routine operation. The Brewer data for the South Pole site are available on the World Ozone and Ultraviolet Data Centre (WOUDC) website. Due to logistic difficulties, Brewer no. 085 was not replaced or calibrated until 2016.
The Dobson data used for this study are freely available at ftp://aftp.cmdl.noaa.gov/user/evans/York_Omid/ (last access: 10 January 2019). For this study all direct sun Dobson measurements are used, while only one measurement representative of the day is reported to the NDACC or WOUDC. A complete description of the South Pole data set is provided by Evans et al. (2017). The reprocessed data using WinDobson software as described in Evans et al. (2017) are used for the analysis here. Generally, the Dobson instrument at the South Pole site is replaced with a calibrated instrument every 4 years. The instrument replaced is calibrated against the reference Dobson no. 83 and the calibration results are used to adjust and post-process the last 4 years of data collected at the South Pole. The calibration procedure can be found in Evans and Komhyr (2008) and the major calibration or instrument changes regarding the South Pole data set can be seen in Fig. 5 of Evans et al. (2017).
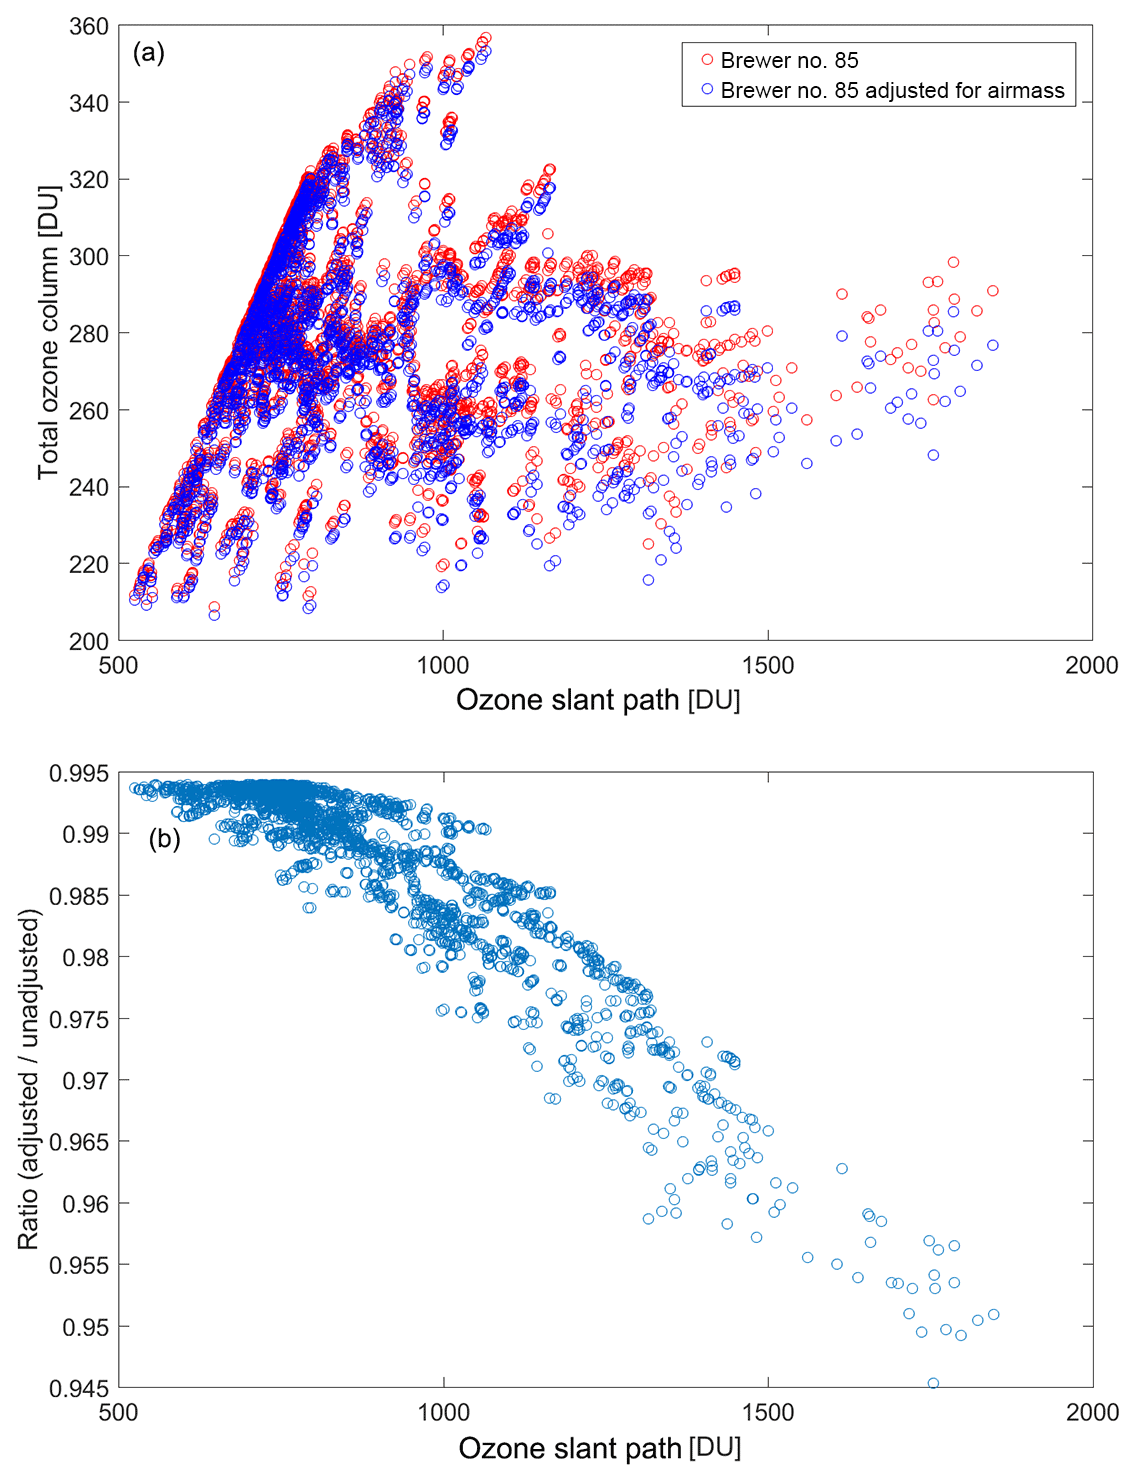
Figure 8(a) Total ozone column values larger than 220 DU measured by double Brewer no. 085 versus total ozone slant path. Total ozone columns calculated using adjusted air masses are also shown (see the details in the text). (b) Ratio of total ozone column retrieved using adjusted air mass to total ozone retrieved using unadjusted air mass.
To avoid the impact of ozone hole on the analyses presented here, only the data with total ozone values larger than 220 DU are used for this study. Quasi-simultaneous direct sun measurements performed within 5 min during the period of December 2008 to December 2014 were used in the present analysis. The air masses calculated by the Brewer retrieval were adjusted using Eq. (19) by applying the values used by Dobson instruments (Re=6356.912 km, r=2.81 km, and h=17 km) to be consistent with the Dobson air masses. Figure 8 shows the total ozone column measured by double Brewer no. 085 and the total ozone retrieved using the adjusted air masses. The ratio of total ozone columns retrieved using adjusted air masses to the total ozone columns retrieved using unadjusted air masses are also shown in the same figure.
The ozone absorption coefficients calculated by Komhyr et al. (1993) and recommended by WMO have been used to retrieve ozone values for the AD and CD pairs. It is necessary to mention that only the data collected with air mass factors less than 2.5 or OSP less than 800 DU would be reported for AD pair measurements to the WOUDC or other institutes for regular research purposes. The range of air mass factor for CD measurements is 2.4 to 3.5 and that means in the case of the South Pole station, the maximum OSP would be about 1100 DU.
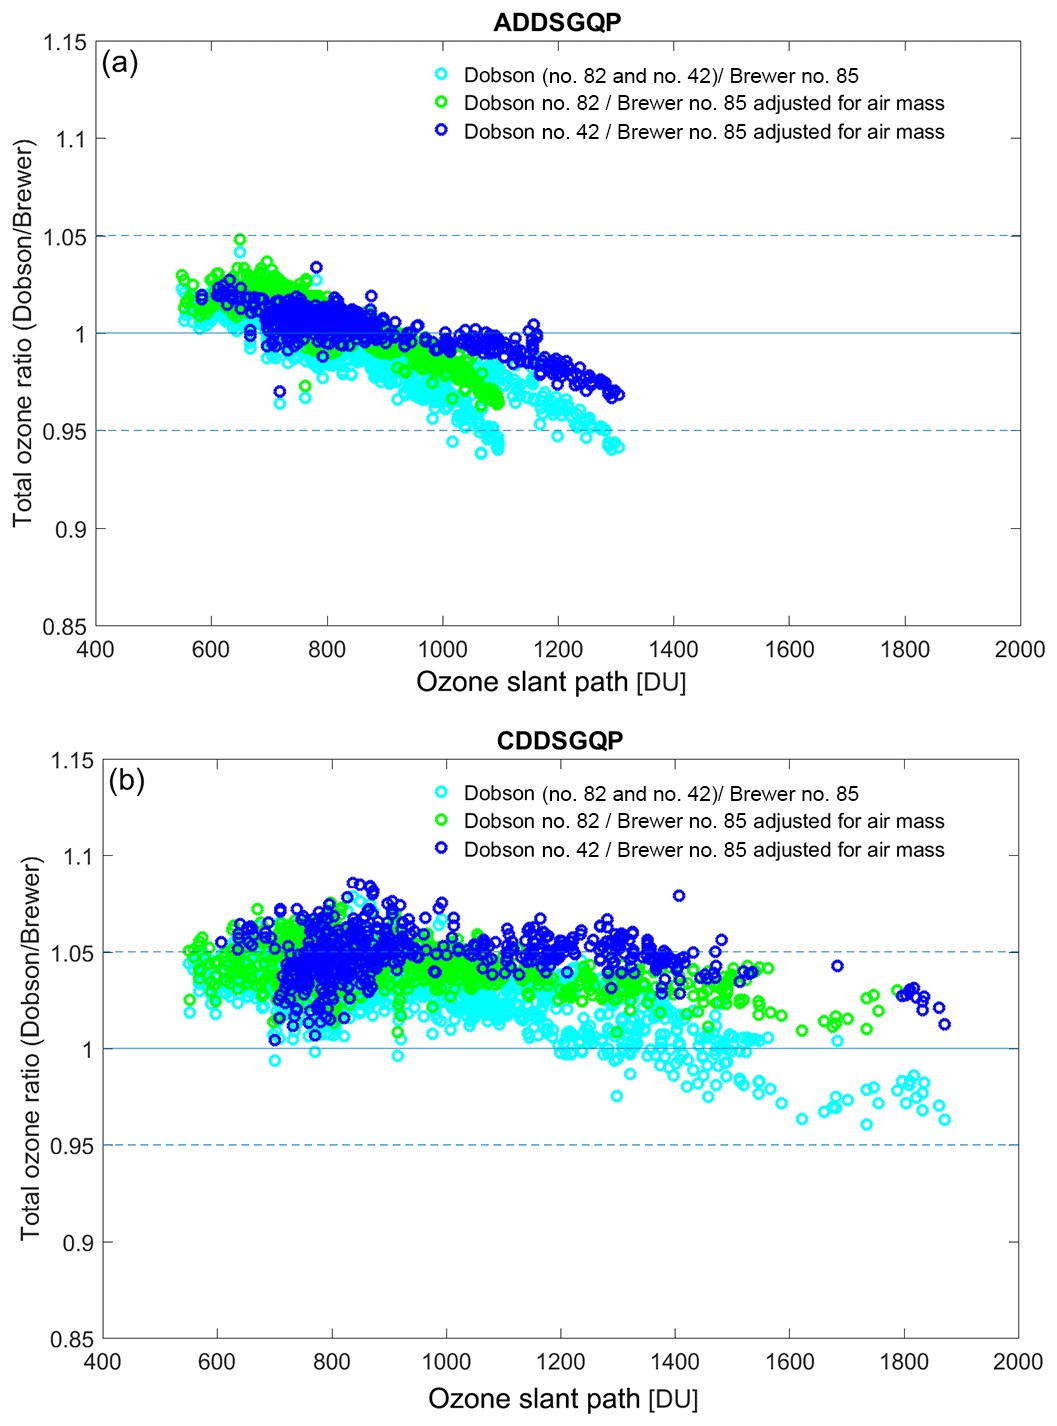
Figure 9(a) The ratio of quasi-simultaneous observations (within 5 min) using Dobson (no. 82 and no. 42) AD wavelengths to double Brewer no. 085 data at the South Pole for total ozone values larger than 220 DU. (b) Same as (a) using Dobson CD pairs. Brewer air masses have been corrected using the values used for the Dobson measurements for the radius of the Earth, ozone layer height, and the altitude of the site. The ratios of all data from three Dobson instruments and Brewer data before adjustment for ozone layer height and station altitude are also depicted. ADDSGQP: AD direct sun measurement using a ground quartz plate, and CDDSGQP: CD direct sun measurement using a ground quartz plate.
Figure 9 presents a comparison of the Brewer total ozone measurements with Dobson ozone observations reduced from the direct sun AD pair as a function of OSP. The ratios between the unadjusted Brewer data and Dobson measurements are also shown in the same plot. The ratio between the Brewer adjusted data and the Dobson values shows some dependence on OSP: the Dobson no. 82 and no. 42 are on average 1 % and 0.46 % higher, respectively, for OSPs below 800 DU. When the OSP is above 800 DU, Dobson measurements gradually become lower by up to 4 % for OSPs up to 1400 DU for Dobson no. 42 and up to 5 % for OSPs up to 1200 DU for Dobson number no. 82 (Fig. 9).
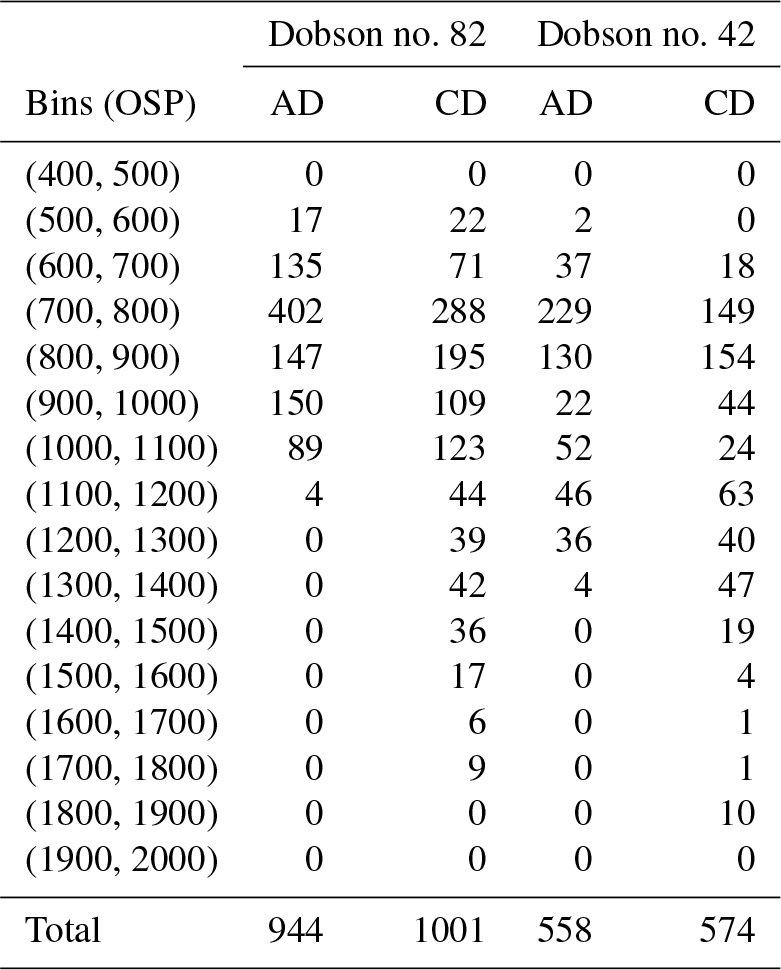
Table 7The number of quasi-simultaneous measurements (within 5 min) of Brewer no. 085 and Dobson no. 82 and no. 42, collocated at the South Pole station, divided into bins of OSP (see text and Fig. 11 for details).
The ratio between Dobson CD pair measurements and the Brewer data also shows a dependence on OSP (Fig. 9). However, CD pair ozone values are on average 3.4 % and 4.5 %, higher for almost the entire measurement set for Dobson no. 82 and no. 42, respectively. It should be noted that the CD pair values are scaled to the AD pair for each individual Dobson instrument. The scaling factors 1.043 and 1.025 were calculated during calibration procedure in 2015 and used for adjusting total column ozone values derived from Dobson no. 82 and no. 42 CD pair measurements, respectively (Robert Evans, personal communication, 2015. Note to the user: the subset of the South Pole station Dobson record used in this paper was reprocessed in June of 2015 using the WinDobson software as described in Evans et al. (2017). The NOAA archived data referenced in Evans et al. (2017) (ftp://aftp.cmdl.noaa.gov/ozwv/Dobson/dobson_toSPO.txt, last access: 20 November 2018) were finalized in 2017. The data contain the same AD TOC, while CD TOC was reprocessed to adjust for AD–CD differences and updates in the air mass factor calculation. The scaling factors were changed to 1.018 and 0.998, respectively, and data were resubmitted to the NDACC archive (ftp://ftp.cpc.ncep.noaa.gov/ndacc/station/spole/ames/dobson/, last access: 20 November 2018) in October 2017 – Glen McConville and Koji Miyagawa, NOAA, personal communication, 2018). The calibration procedures and the method for calculating the scaling factor are described and published by WMO in GAW report no. 183 (Evans and Komhyr, 2008). As illustrated by B05 (Fig. 4 of Bernhard et al., 2005) the temperature dependence of the ozone absorption cross sections may also cause discrepancy in Dobson total ozone measurements. As illustrated by B05 (Fig. 4 of Bernhard et al., 2005) the temperature dependence of the ozone absorption cross sections may also cause deviations in Dobson total ozone column measurements. B05 assessed variability in the effective temperature using ozone profiles measured by the Global Monitoring Division of NOAA (former Climate Monitoring and Diagnostics Laboratory, CMDL) at the South Pole between 1991 and 2003. They found that the temperature-adjusted AD and CD ozone absorption coefficients deviated from nominal values (K93) by up to ±4 %, leading to underestimation or overestimation of the total ozone column through Eq. (3). B05 also found that the 1991–2003 collection of temperature-adjusted CD ozone absorption coefficients exhibited a SZA dependence. The ozone absorption coefficient adjustment is likely magnified at low-sun (large SZA) conditions (preferential for CD over AD measurements) when extreme changes in ozone and temperature profiles are observed during the ozone hole period.
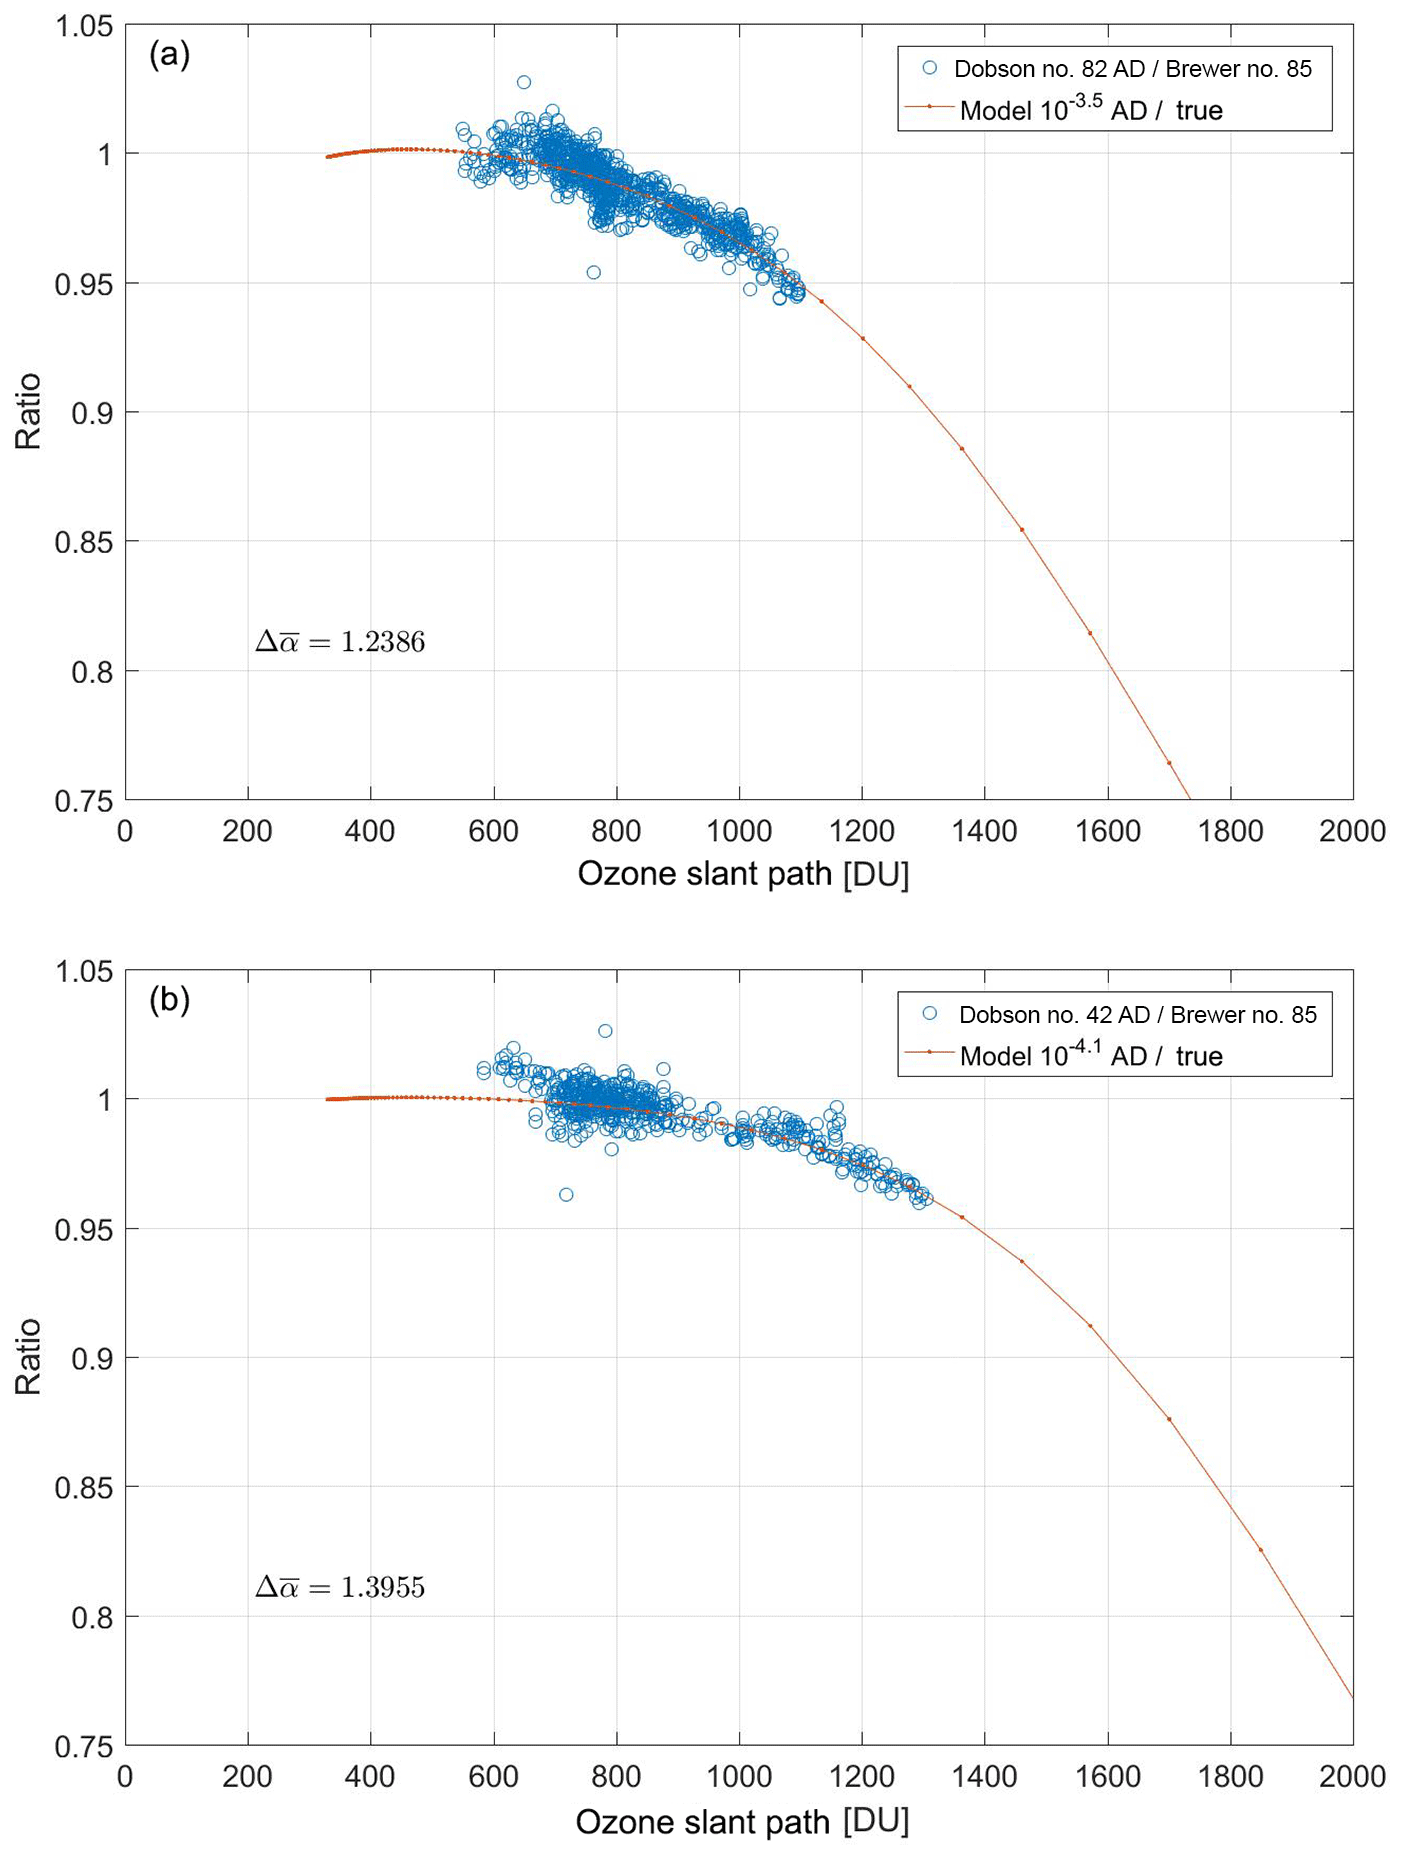
Figure 10The ratio of quasi-simultaneous observations of (a) Dobson no. 82 and (b) no. 42 AD wavelengths to double Brewer no. 085 data at the South Pole for total ozone values larger than 220 DU as well as the ratio of the values retrieved from the physical model developed in this study with certain amounts of stray light to the true value assumed in the atmosphere suggesting the level of stray light in each individual Dobson instrument. The ETC values and ozone absorption coefficients are calculated for each model separately using the Langley method. Note that the average difference between the Brewer and Dobson data with OSPs less than 800 DU was used to scale the Dobson data first. Then the model with a stray light level that better matches the Dobson data was found. The scaling factors used for Dobson no. 82 and no. 42 are 1.02 and 1.0076, respectively.

Figure 11The ratio of quasi-simultaneous direct sun observations (within 5 min) by (a, b) Dobsons no. 82 and (c, d) no. 42, AD and CD wavelengths to data from double Brewer no. 085 at the South Pole for total ozone values larger than 220 DU. For each box, the central red line is the median, the edges of the box are the 25th and 75th percentiles, the whiskers extend to the most extreme data points not considered outliers, and outliers are plotted individually. In each bin the values with differences larger than 3 standard deviations from the mean of the bin have been removed from the calculation. Note that only bins with more than six simultaneous measurements are depicted. The title of plots shows the type of measurements. ADDSGQP: AD direct sun measurement using a ground quartz plate, and CDDSGQP: CD direct sun measurement using a ground quartz plate.
It can be seen from this analysis that Dobson no. 42 TOC values show less dependence on OSP. Based on the physical model developed in this work, it appears that this instrument has a significantly lower level of stray light than Dobson instrument no. 82. As shown in Fig. 10, the physical model developed in this study suggests a 10−3.5 and 10−4.1 level of stray light for Dobson no. 82 and 42, respectively.
Figure 11 shows a box plot of the difference between double Brewer ozone measurements and Dobson values retrieved from AD and CD pairs. The data are binned for 100 DU from 400 to 2000 DU. For each box, the central red line is the median, the edges of the box are the 25th and 75th percentiles, the whiskers extend to the most extreme data points not considered outliers, and outliers are plotted individually. In each bin the values with differences larger than 3 standard deviations from the mean of the bin have been removed from the calculation. The number of simultaneous measurements in each bin is summarized in Table 7.
Physical models of the Dobson instrument and two types of Brewer spectrophotometer were developed to help better understand the effects of stray light on ozone measurements and indicate a way forward for correcting current and past data for the resulting error in the calculated ozone column. The influence of assuming a fixed ozone layer height on air mass calculations and the difference caused by this assumption to the ozone retrieval were also examined. The target accuracy for ground-based ozone measurements is 1 %, while physical models show that the stray light effect can cause a discrepancy for a typical single Brewer and Dobson AD pair at large ozone slant paths of up to 5 % and 25 %, respectively. At 2000 DU OSP the difference for a double Brewer and a Dobson CD pair with minimum level of stray light (10−5) is up to 0.8 % and 1.8 %, respectively. This effect restricts measurements at high latitudes, such as polar stations, particularly in the late winter and early spring when the ozone slant column is particularly large. It is considerably important if those data are to be used for trend analysis. In particular, if such data are used in the case where Dobsons or single Brewers are replaced by double Brewers, a significant false positive trend in ozone may result.
Stray light also can affect the calculation of ozone absorption coefficients. Currently, an approximation method is used to calculate the absorption coefficients for Brewer instruments. The analysis shows that using a modeled trapezoid slit function with stray light (instead of an idealized trapezoidal one) and taking into account the solar spectrum leads to a difference of 0.7 % and less than 0.01 % in calculated coefficients for a typical single and double Brewer, respectively.
Absorption coefficients for the Dobson spectrophotometers, taking into account the effect of stray light, have been calculated and compared with the results of similar calculations by K93, which are the coefficients recommended by WMO. The slit functions of Dobson no. 83 have been measured using a tunable light source (K93). Recently, the measured slit functions and calculated coefficients were verified by measuring the slit functions of three Dobsons (no. 74, no. 64, and no. 83) at the Physikalisch-Technische Bundesanstalt (PTB) in Braunschweig in 2015 and at the Czech Metrology Institute (CMI) in Prague in 2016 within the EMRP ENV 059 project “Traceability for atmospheric total column ozone” (Köhler et al., 2018). Köhler et al. (2018) showed that the optical properties of these three Dobsons deviate from the specification described by G. M. B. Dobson. However, the AD pair ozone absorption coefficients derived from new slit functions lead to less than 1 % deviation in total ozone column values. It is generally assumed that the slit functions of other Dobson spectrophotometers are similar to the standard one (no. 83).
For the study presented here, the slit functions were modeled to examine the effect of stray light on the calculation of ozone absorption coefficients. The results show that a 10−5 level of stray light has a negligible effect on absorption coefficient calculations, while the difference could be up to 4.0 % and 4.6 % for AD coefficients and up to 6.9 % and 6.4 % for CD coefficients for an instrument with a 10−4 level of stray light using BP and SC cross sections, respectively.
When quasi-simultaneous measurements are made using Dobson AD and CD wavelengths, the results may not agree. For decades the Dobson community has faced such differences. The AD pair is the standard for Dobson measurements, and the observations using other pairs' data should be scaled to the AD pair before release. Our analysis indicates that the difference between quasi-simultaneous measurements using AD and CD pairs is related to the level of stray light inside each Dobson instrument. Higher levels of stray light lead to larger differences between the values deduced from AD and CD wavelengths. However, this increase in difference between AD and CD values is slightly smaller when the SC cross sections are used than when the BP cross sections are used.
Both Brewer and Dobson retrievals assume a fixed height for the ozone layer to calculate the ozone air mass. A fixed height of 22 km is used by the Brewer network for all sites, while a variable ozone layer height changing with latitude is employed by the Dobson community. The assumption of a 22 km height for the ozone layer at the South Pole, compared to the 17 km height used in the Dobson analysis, leads to a 2.2 % difference in the ozone column at an air mass of 5.4.
Comparisons with total ozone data larger than 220 DU from a double Mark III Brewer spectrophotometer located at the South Pole indicate some dependence on OSP for the Dobson measurements. For the OSPs below 800 DU the AD values are generally 1 % higher. However, for OSPs between 800 and 1400 DU the Dobson AD measurements are lower by up to 4 %. Using the physical model developed in this study the stray light levels of Dobson no. 82 and no. 42 are estimated as 10−3.5 and 10−4.1, respectively.
Observations made at the CD wavelengths also show some dependence on OSP. Compared to Brewer data, the CD values are, on average, 4 % higher for almost the entire range of measurements. However, as is the case for the AD pair, the CD pair values also decrease at larger OSPs. It should be noted that the Dobson AD and CD pair measurements are not reported for air mass factors above 2.5 and 3.5, respectively, due to the effect of stray light.
The Brewer data can be obtained from the WOUDC Data Centre at http://www.woudc.org (last access: 2 August 2017). The Dobson data used for this study are available at ftp://aftp.cmdl.noaa.gov/user/evans/York_Omid/ (NOAA/ESRL, 2015).
OM developed the Brewer and Dobson models and wrote the paper with the support and input of other co-authors. ZV was involved in the model development and analysis of the results. TM, DV, IP, and RE assisted in the writing of the paper and provided valuable discussions about the Brewer and Dobson retrievals and measurements. KF was involved in the analysis and comparison of the South Pole data.
The authors declare that they have no conflict of interest.
The authors thank the many NOAA/ESRL technical staff members and officers for
their invaluable efforts to operate the facility year-round at the South Pole
and obtain the data used in this report. The U.S. National Science Foundation
provides the infrastructure and logistics support for the facility at the
South Pole. The Brewer data were obtained from the World Ozone and
Ultraviolet Radiation Data Centre (WOUDC; http://www.woudc.org, last access: 20 August 2017) operated by
Environment and Climate Change Canada, Toronto, Ontario, Canada, under the
auspices of the World Meteorological Organization. The first author is
grateful for support from Environment and Climate Change Canada and the
Natural Sciences and Engineering Research Council of Canada
(NSERC).
Edited by: Mark Weber
Reviewed by: Alberto Redondas and one anonymous referee
Bais, A. F., Zerefos, C. S., and McElroy, C. T.: Solar UVB measurements with the double- and single-monochromator Brewer ozone spectrophotometers, Geophys. Res. Lett., 23, 833–836, https://doi.org/10.1029/96GL00842, 1996.
Barnes, J. and Mauersberger, K.: Temperature Dependence of the Ozone Absorption Cross Section at the 253.7-nm Mercury Line, J. Geophys. Res., 92, 14861–14864, 1987.
Basher, R. E.: Review of the Dobson Spectrophotometer and its Accuracy, WMO Global Ozone Research and Monitoring Project, Report No. 13, World Meteorological Organization, Geneva, Switzerland, 1982.
Bass, A. M. and Paur, R. J.: The Ultraviolet Cross-Sections of Ozone: I. The Measurements, in: Atmospheric Ozone, 606–610, https://doi.org/10.1007/978-94-009-5313-0_120, Springer, Netherlands, 1985.
Bates, D. R.: Rayleigh-scattering by air, Planet. Space Sci., 32, 785–790, https://doi.org/10.1016/0032-0633(84)90102-8, 1984.
Bernhard, G., Evans, R. D., Labow, G. J., and Oltmans, S. J.: Bias in Dobson total ozone measurements at high latitudes due to approximations in calculations of ozone absorption coefficients and air mass, J. Geophys. Res., 110, D10305, https://doi.org/10.1029/2004JD005559, 2005.
Bhartia, P. K., Silberstein, D., Monosmith, B., and Fleig, A. J.: Standard profiles of ozone from ground to 60 km obtained by combining satellite and ground based measurements, in: Atmospheric Ozone, 243–247, Springer, Netherlands, 1985.
Brion, J., Chakir, A., Daumont, D., Malicet, J., and Parisse, C.: High-resolution laboratory absorption cross section of O3, Temperature effect, Chem. Phys. Lett., 213, 610–612, https://doi.org/10.1016/0009-2614(93)89169-I, 1993.
Chance, K. and Kurucz, R. L.: An improved high-resolution solar reference spectrum for earth's atmosphere measurements in the ultraviolet, visible, and near infrared, J. Quant. Spectrosc. Ra., 111, 1289–1295, https://doi.org/10.1016/j.jqsrt.2010.01.036, 2010.
Christodoulakis, J., Varotsos, C., Cracknell, A. P., Tzanis, C., and Neofytos, A.: An assessment of the stray light in 25 years of Dobson total ozone data at Athens, Greece, Atmos. Meas. Tech., 8, 3037–3046, https://doi.org/10.5194/amt-8-3037-2015, 2015.
Daumont, D., Brion, J., Charbonnier, J., and Malicet, J.: Ozone UV spectroscopy I: Absorption cross-sections at room temperature, J. Atmos. Chem., 15, 145–155, https://doi.org/10.1007/BF00053756, 1992.
Dobson, G. M. B.: A Photoelectric spectrophotometer for measuring the amount of atmospheric ozone, in: Proceedings of the Physical Society, 43, 324–339, https://doi.org/10.1088/0959-5309/43/3/308, 1931.
Evans, R. and Komhyr, W.: Operations Handbook – Ozone Observations with a Dobson Spectrophotometer, WMO/GAW Report No. 183, World Meteorological Organization, Geneva, Switzerland, 2008.
Evans, R., McConville, G., Oltmans, S., Petropavlovskikh, I., and Quincy, D.: Measurement of internal stray light within Dobson ozone spectrophotometers, Int. J. Remote Sens., 30, 4247–4258, https://doi.org/10.1080/01431160902825057, 2009.
Evans, R. D., Petropavlovskikh, I., McClure-Begley, A., McConville, G., Quincy, D., and Miyagawa, K.: Technical note: The US Dobson station network data record prior to 2015, re-evaluation of NDACC and WOUDC archived records with WinDobson processing software, Atmos. Chem. Phys., 17, 12051–12070, https://doi.org/10.5194/acp-17-12051-2017, 2017.
Fioletov, V. E., Kerr, J. B., McElroy, C. T., Wardle, D. I., Savastiouk, V., and Grajnar, T. S.: The Brewer reference triad, Geophys. Res. Lett., 32, L20805, https://doi.org/10.1029/2005GL024244, 2005.
Fragkos, K., Bais, A. F., Balis, D., Meleti, C., and Koukouli, M. E.: The Effect of Three Different Absorption Cross-Sections and their Temperature Dependence on Total Ozone Measured by a Mid-Latitude Brewer Spectrophotometer, Atmos. Ocean, 53, 19–28, https://doi.org/10.1080/07055900.2013.847816, 2015.
Furukawa, P. M., Haagenson, P. L., and Scharberg, M. J.: A Composite, High-Resolution Solar Spectrum from 2080 to 3600 A, NCAR TN-26, National Center for Atmospheric Research, Boulder, Colorado, 1967.
Gröbner, J., Wardle, D. I., McElroy, C. T., and Kerr, J. B.: Investigation of the wavelength accuracy of brewer spectrophotometers., Appl. Opt., 37, 8352–60, https://doi.org/10.1364/AO.37.008352, 1998.
Josefsson, A. P.: Focused Sun Observation Using a Brewer Ozone Spectrophotometer, J. Geophys. Res., 97, 15813–15817, 1992.
Karppinen, T., Redondas, A., García, R. D., Lakkala, K., McElroy, C. T., and Kyrö, E.: Compensating for the Effects of Stray Light in Single-Monochromator Brewer Spectrophotometer Ozone Retrieval, Atmos. Ocean, 53, 66–73, https://doi.org/10.1080/07055900.2013.871499, 2015.
Kerr, J. B.: New methodology for deriving total ozone and other atmospheric variables from Brewer spectrophotometer direct sun spectra, J. Geophys. Res., 107, 1–17, https://doi.org/10.1029/2001JD001227, 2002.
Kerr, J. B., McElroy, C. T., and Olafson, R. A.: Measurements of ozone with the Brewer ozone spectrophotometer, In Quadrennial Ozone Symposium, National Center for Atmospheric Research, Boulder, Colorado, 74–79, 1981.
Kerr, J. B., Asbridge, I. A., and Evans, W. F. J.: Intercomparison of total ozone measured by the Brewer and Dobson spectrophotometers at Toronto, J. Geophys. Res., 93, 11129–11140, https://doi.org/10.1029/JD093iD09p11129, 1988.
Kiedron, P., Disterhoft, P., and Lantz, K.: NOAA-EPA Brewer network Stray Light Correction, NOAA Earth System Research Laboratory, 2008.
Köhler, U., Nevas, S., McConville, G., Evans, R., Smid, M., Stanek, M., Redondas, A., and Schönenborn, F.: Optical characterisation of three reference Dobsons in the ATMOZ Project – verification of G. M. B. Dobson's original specifications, Atmos. Meas. Tech., 11, 1989–1999, https://doi.org/10.5194/amt-11-1989-2018, 2018.
Komhyr, W. D., Mateer, C. L., and Hudson, R. D.: Effective Bass-Paur 1985 Ozone Absorption Coefficients for Use With Dobson Ozone Spectrophotometers, J. Geophys. Res., 98, 20451–20456, https://doi.org/10.1029/93JD00602, 1993.
Lantz, K., Disterhoft, P., Early, E., Thompson, A., Deluisi, J., Berndt, J., Harrison, L., Kiedron, P., Ehramjian, J., Bernhard, G., Cabasug, L., Robertson, J., Mou, W., Taylor, T., Slusser, J., Bigelow, D., Durham, B., Janson, G., Hayes, D., Beaubien, M., and Beaubien, A.: The 1997 North American Interagency Intercomparison of Ultraviolet Spectroradiometers Including Narrowband Filter Radiometers, J. Res. Natl. Institue Stand. Technol., 107, 19–62, 2002.
Liu, X., Chance, K., Sioris, C. E., and Kurosu, T. P.: Impact of using different ozone cross sections on ozone profile retrievals from Global Ozone Monitoring Experiment (GOME) ultraviolet measurements, Atmos. Chem. Phys., 7, 3571–3578, https://doi.org/10.5194/acp-7-3571-2007, 2007.
Malicet, J., Daumont, D., Charbonnier, J., Parisse, C., Chakir, A., and Brion, J.: Ozone UV spectroscopy, II, Absorption cross-sections and temperature dependence, J. Atmos. Chem., 21, 263–273, https://doi.org/10.1007/BF00696758, 1995.
Molina, L. T. and Molina, M. J.: Absolute absorption cross sections of ozone in the 185-to 350-nm wavelength range, J. Geophys. Res.-Atmos., 91, 14501–14508, 1986.
NOAA/ESRL: South Pole station Dobson record, ftp://aftp.cmdl.noaa.gov/user/evans/York_Omid/ (last access: 10 January 2019), 2015.
Pulli, T., Karppinen, T., Nevas, S., Kärhä, P., Lakkala, K., Karhu, J. M., Sildoja, M., Vaskuri, A., Shpak, M., Manoocheri, F., Doppler, L., Gross, S., Mes, J., and Ikonen, E.: Out-of-Range Stray Light Characterization of Single-Monochromator Brewer Spectrophotometers, Atmos. Ocean, 56, 1–11, https://doi.org/10.1080/07055900.2017.1419335, 2018.
Redondas, A., Evans, R., Stuebi, R., Köhler, U., and Weber, M.: Evaluation of the use of five laboratory-determined ozone absorption cross sections in Brewer and Dobson retrieval algorithms, Atmos. Chem. Phys., 14, 1635–1648, https://doi.org/10.5194/acp-14-1635-2014, 2014.
Scarnato, B., Staehelin, J., Peter, T., Gröbner, J., and Stübi, R.: Temperature and slant path effects in Dobson and Brewer total ozone measurements, J. Geophys. Res., 114, D24303, https://doi.org/10.1029/2009JD012349, 2009.
Scarnato, B., Staehelin, J., Stübi, R., and Schill, H.: Long-term total ozone observations at Arosa (Switzerland) with Dobson and Brewer instruments (1988–2007), J. Geophys. Res., 115, D13306, https://doi.org/10.1029/2009JD011908, 2010.
Serdyuchenko, A., Gorshelev, V., Weber, M., Chehade, W., and Burrows, J. P.: High spectral resolution ozone absorption cross-sections – Part 2: Temperature dependence, Atmos. Meas. Tech., 7, 625–636, https://doi.org/10.5194/amt-7-625-2014, 2014.
Staehelin, J., Kegel, R., and Harris, N.: Trend analysis of the homogenized total ozone series of Arosa (Switzerland), 1926–1996, J. Geophys. Res., 103, 8400–8389, https://doi.org/10.1029/97JD03650, 1998.
Staehelin, J., Kerr, J. B., Evans, R., and Vanicek, K.: Comparison of total Ozone measurements of Dobson and Brewer spectrophotometers and recommended transfer functions, WMO/GAW Report No. 149, World Meteorological Organization, Geneva, Switzerland, 2003.
Vanicek, K.: Differences between ground Dobson, Brewer and satellite TOMS-8, GOME-WFDOAS total ozone observations at Hradec Kralove, Czech, Atmos. Chem. Phys., 6, 5163–5171, https://doi.org/10.5194/acp-6-5163-2006, 2006.
Vanier, J. and Wardle, D. I.: The effects of spectral resolution on total ozone measurements, Q. J. Roy. Meteor. Soc., 95, 395–399, https://doi.org/10.1002/qj.49709540411, 1969.
Van Roozendael, M., Peeters, P., Roscoe, H. K., De Backer, H., Jones, A. E., Bartlett, L., Vaughan, G., Goutail, F., Pommereau, J. P., Kyro, E., Wahlstrom, C., Braathen, G., and Simon, P. C.: Validation of ground-based visible measurements of total ozone by comparison with Dobson and Brewer spectrophotometers, J. Atmos. Chem., 29, 55–83, https://doi.org/10.1023/A:1005815902581, 1998.