the Creative Commons Attribution 4.0 License.
the Creative Commons Attribution 4.0 License.
 | 03 Jan 2019
Using a speed-dependent Voigt line shape to retrieve O2 from Total Carbon Column Observing Network solar spectra to improve measurements of XCO2
Joseph Mendonca
Kimberly Strong
Debra Wunch
Geoffrey C. Toon
David A. Long
Joseph T. Hodges
Vincent T. Sironneau
Jonathan E. Franklin
High-resolution, laboratory, absorption spectra of the oxygen (O2) band measured using cavity ring-down spectroscopy were fitted using the Voigt and speed-dependent Voigt line shapes. We found that the speed-dependent Voigt line shape was better able to model the measured absorption coefficients than the Voigt line shape. We used these line shape models to calculate absorption coefficients to retrieve atmospheric total columns abundances of O2 from ground-based spectra from four Fourier transform spectrometers that are a part of the Total Carbon Column Observing Network (TCCON). Lower O2 total columns were retrieved with the speed-dependent Voigt line shape, and the difference between the total columns retrieved using the Voigt and speed-dependent Voigt line shapes increased as a function of solar zenith angle. Previous work has shown that carbon dioxide (CO2) total columns are better retrieved using a speed-dependent Voigt line shape with line mixing. The column-averaged dry-air mole fraction of CO2 (XCO2) was calculated using the ratio between the columns of CO2 and O2 retrieved (from the same spectra) with both line shapes from measurements taken over a 1-year period at the four sites. The inclusion of speed dependence in the O2 retrievals significantly reduces the air mass dependence of XCO2, and the bias between the TCCON measurements and calibrated integrated aircraft profile measurements was reduced from 1 % to 0.4 %. These results suggest that speed dependence should be included in the forward model when fitting near-infrared CO2 and O2 spectra to improve the accuracy of XCO2 measurements.
- Article
(6615 KB) -
Supplement
(55 KB) - BibTeX
- EndNote


Accurate remote sensing of greenhouse gases (GHGs) such as CO2, in the Earth's atmosphere is important for studying the carbon cycle to better understand and predict climate change. The absorption of solar radiation by O2 in the Earth's atmosphere is important because it can be used to study the properties of clouds and aerosols and to determine vertical profiles of temperature and surface pressure. Wallace and Livingston (1990) were the first to retrieve total columns of O2 from some of the discrete lines of the band of O2 centred at 1.27 µm (which will be referred to bellow as the 1.27 µm band) using atmospheric solar absorption spectra from Kitt Peak National Observatory. Mlawer et al. (1998) recorded solar absorption spectra in the near-infrared (NIR) region to study collision-induced absorption (CIA) in the band as well as two other O2 bands. The spectra were compared to a line-by-line radiative transfer model and the differences between the measured and calculated spectra showed the need for better absorption coefficients in order to accurately model the 1.27 µm band (Mlawer et al., 1998). Subsequently, spectroscopic parameters needed to calculate the absorption coefficients from discrete transitions of the 1.27 µm band were measured in multiple studies (Cheah et al., 2000; Newman et al., 1999, 2000; Smith and Newnham, 2000), as was collision-induced absorption (CIA) (Maté et al., 1999; Smith and Newnham, 2000), while Smith et al. (2001) validated the work done in Smith and Newnham (2000) using solar absorption spectra.
The 1.27 µm band is of particular importance to the Total Carbon Column Observing Network (TCCON) (Wunch et al., 2011). TCCON is a ground-based remote sensing network that makes accurate and precise measurements of GHGs for satellite validation and carbon cycle studies. Using the O2 column retrieved from solar absorption spectra, the column-averaged dry-air mole fraction of CO2 (XCO2) has been shown to provide better precision than when using the surface pressure to calculate XCO2 (Yang et al., 2002). The O2 column is retrieved from the 1.27 µm band because of its close proximity to the spectral lines used to retrieve CO2, thereby reducing the impact of solar tracker mispointing and an imperfect instrument line shape (ILS) (Washenfelder et al., 2006a). To improve the retrievals of O2 from the 1.27 µm band, Washenfelder et al. (2006a) found that adjusting the spectroscopic parameters in HITRAN 2004 (Rothman et al., 2005) decreased the air mass and temperature dependence of the O2 column. These revised spectroscopic parameters were included in HITRAN 2008 (Rothman et al., 2009). Atmospheric solar absorption measurements from this band taken at the Park Falls TCCON site by Washenfelder et al. (2006a) were the first measurements to observe the electric-quadrupole transitions (Gordon et al., 2010). Leshchishina et al. (2011, 2010) subsequently used cavity ring-down spectra to retrieve spectroscopic parameters for the 1.27 µm band using a Voigt spectral line shape and these parameters were included in HITRAN 2012 (Rothman et al., 2013a). Spectroscopic parameters for the discrete spectral lines of the O2 1.27 µm band from HITRAN 2016 (Gordon et al., 2017) are very similar to HITRAN 2012 except that HITRAN2016 includes improved line positions reported by Yu et al. (2014).
Extensive spectral line shape studies have been performed for the O2 A-band, which is centred at 762 nm and used by the Greenhouse Gases Observing Satellite (GOSAT) (Yokota et al., 2009) and the Orbiting Carbon Observatory-2 (OCO-2) satellite (Crisp et al., 2004) to determine surface pressure. Studies have shown that the Voigt line shape is inadequate to describe the spectral line shape of the discrete O2 lines in the A-band. Dicke narrowing occurs when the motion of the molecule is diffusive due to collisions changing the velocity and direction of the molecule during the time that it is excited. This diffusive motion is taken into account by averaging over many different Doppler states, resulting in a line width that is narrower than the Doppler width (Dicke, 1953). Long et al. (2010) and Predoi-Cross et al. (2008) found it necessary to use a spectral line shape model that accounted for Dicke narrowing when fitting the discrete lines of the O2 A-band. Line mixing, which occurs when collisions transfer intensity from one part of the spectral band to another (Lévy et al., 1992), was shown to be prevalent in multiple studies (Predoi-Cross et al., 2008; Tran et al., 2006; Tran and Hartmann, 2008). Tran and Hartmann (2008) showed that including line mixing when calculating the O2 A-band absorption coefficients reduced the air mass dependence of the O2 column retrieved from TCCON spectra. When fitting cavity ring-down spectra of the O2 A-band, Drouin et al. (2017) found it necessary to use a speed-dependence Voigt line shape, which takes into account different speeds at the time of collision (Shannon et al., 1986), with line mixing to properly fit the discrete spectral lines of the O2 A-band.
The need to include non-Voigt effects when calculating absorption coefficients for the O2 1.27 µm band was first shown in Hartmann et al. (2013) and Lamouroux et al. (2014). In Hartmann et al. (2013) and Lamouroux et al. (2014), Lorentzian widths were calculated using the requantised classical molecular dynamics simulations (rCMDSs) and used to fit cavity ring-down spectra with a Voigt line shape for some isolated transitions in the O2 1.27 µm band. The studies concluded that a Voigt line shape is insufficient for modelling the spectral lines of the O2 1.27 µm band and that effects such as speed dependence and Dicke narrowing should be included in the line shape calculation.
In this study, air-broadened laboratory cavity ring-down spectra of the O2 1.27 µm band were fitted using a spectral line shape that takes into account speed dependence. The derived spectroscopic parameters for the speed-dependent Voigt line shape were used to calculate absorption coefficients when fitting high-resolution solar absorption spectra. XCO2 was calculated from O2 total columns retrieved using the new absorption coefficients and CO2 total columns retrieved with the line shape model described in Mendonca et al. (2016). These new XCO2 values were compared to the XCO2 retrieved using the Voigt line shape. Section 2 details the formulas used to calculate absorption coefficients using different spectral line shapes. In Sect. 3, we describe the retrieval of spectroscopic parameters from three air-broadened cavity ring-down spectra fitted with a speed-dependent Voigt line shape. For Sect. 4, the speed-dependent line shape along with the retrieved spectroscopic parameters is used to fit solar absorption spectra from four TCCON sites and retrieve total columns of O2, which is compared to O2 retrieved using a Voigt line shape. In Sect. 5, we investigate the change in the air mass dependence of XCO2 with the new O2 retrievals. In Sect. 6, we discuss our results and their implications for remote sensing of greenhouse gases.
2.1 Voigt line shape
The Voigt line shape is the convolution of the Lorentz and the Gaussian profiles, which model pressure and Doppler broadening of the spectral line respectively. The corresponding absorption coefficient, k, at a given wave number v becomes
where N is the number density, Sj is the line intensity of spectral line j, is the Doppler half-width (HWHM), c is the complex error function, and
Here, is the position of the spectral line j, P is the pressure, and is the pressure-shift coefficient. The Lorentz half-width, , is calculated using the following:
where is the air-broadened Lorentz half-width coefficient (at reference temperature 296 K) and n is the exponent of temperature dependence. The Voigt line shape assumes that pressure broadening is accurately represented by a Lorentz profile calculated for the statistical average velocity at the time of collision.
2.2 Speed-dependent Voigt line shape
The speed-dependent Voigt line shape refines the pressure-broadening component of the Voigt by calculating multiple Lorentz profiles for different speeds at the time of collision. The final contribution from pressure broadening to the speed-dependent Voigt is the weighted sum of Lorentz profiles (weighted by the Maxwell–Boltzmann speed distribution) calculated for different speeds at the time of collision. The speed-dependent Voigt line shape (Ciuryło, 1998) with the quadratic representation of the Lorentz width and pressure shift (Rohart et al., 1994) is as follows:
where is the speed-dependent Lorentz width parameter (unitless) for line j, is the speed-dependent pressure-shift parameter (unitless), B is , V is the ratio of the absorbing molecule's speed to the most probable speed of the absorbing molecule, and all other variables were defined before.
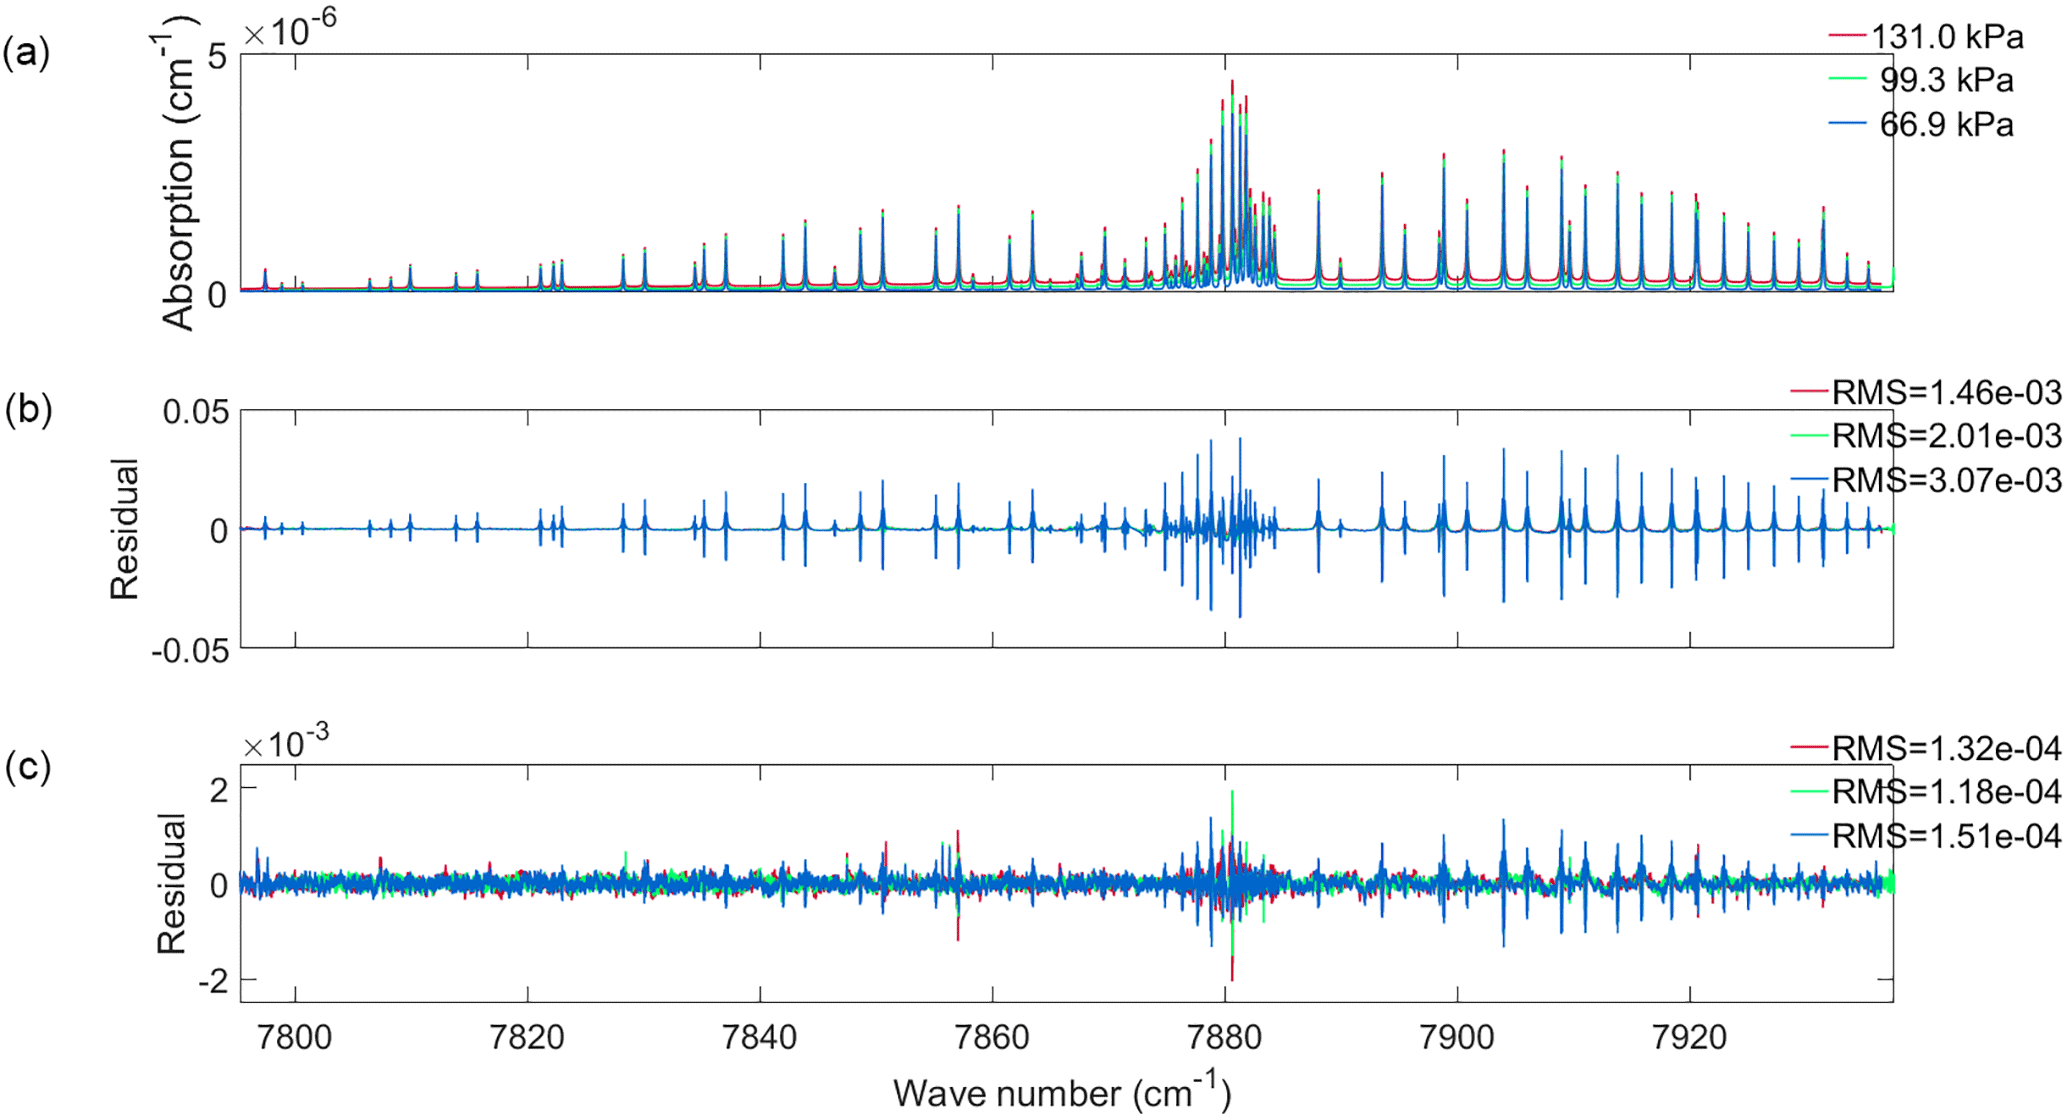
Figure 1(a) Cavity ring-down absorption coefficients for O2 measured at the three pressures indicated in the legend at approximately room temperature and a volume mixing ratio of 0.20720 (43). The difference between measured absorption coefficients and those calculated using (b) a Voigt line shape and (c) the speed-dependent Voigt line shape. Note the difference in scale between panels (b) and (c).
O2, unlike CO2 and CH4, cannot produce an electric dipole moment and therefore should not be infrared active. However, O2 has two unpaired electrons in the ground state that produce a magnetic dipole moment. Due to the unpaired electrons in the ground state () the rotational state (N) is split into three components which are given by , J=N and 1, while in the upper state (a1Δg), J=N. When labelling a transition, the following nomenclature is used: (Leshchishina et al., 2010), where ΔNis the difference between N′ in the upper state and in the lower state; ΔJ is the difference between J′ in the upper state and in the lower state. The magnetic transitions of allow for ΔJ=0, ±1. This leads to nine observed branches: , and for ΔJ=0; , , and for ; and , and for ΔJ=1.
Absorption coefficients for three room temperature air-broadened (NIST Standard reference materal® 2659a containing 79.28 % N2, 20.720 (43) % O2, 0.0029 % Ar, 0.00015 % H2O and 0.001 % other compounds) spectra were measured at the National Institute of Standards and Technology (NIST) using the frequency-stabilised cavity ring-down spectroscopy (FS-CRDS) technique (Hodges et al., 2004; Hodges, 2005). The absorption spectra were acquired at pressures of 131, 99.3 and 66.9 kPa, at temperatures of 296.28, 296.34 and 296.30 K respectively. Figure 1a shows the three measured absorption spectra. A more detailed discussion of the present FS-CRDS spectrometer can be found in Lin et al. (2015).
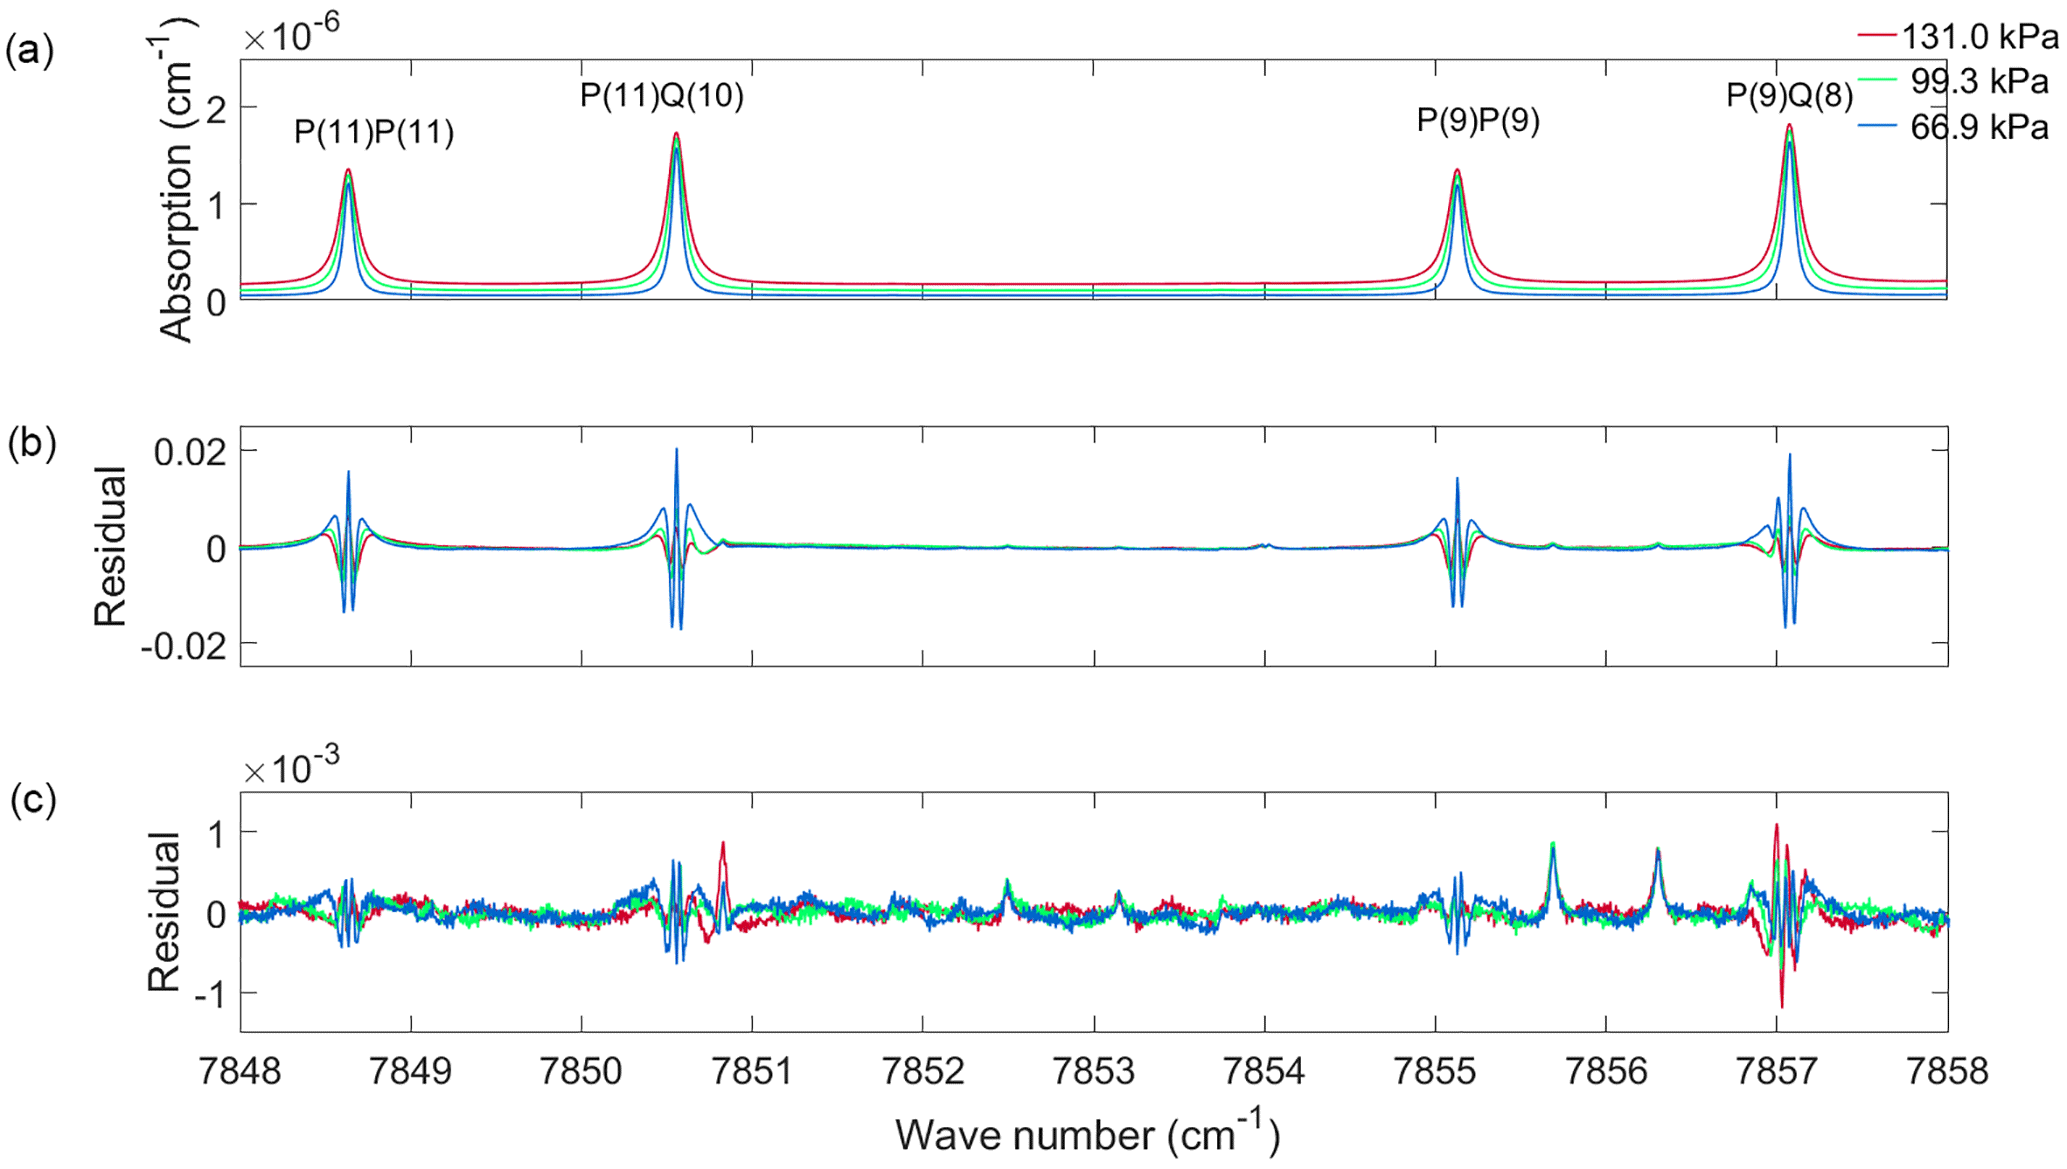
Figure 2The same as Fig. 1 but expanded to show four spectral lines in the P branch of the O2 1.27 µm band.
The spectra were fitted individually using a Voigt line shape (Eq. 1), with Sj, and for the main isotope of the magnetic dipole lines of the O2 1.27 µm band for lines with an intensity greater than cm−1 (molecule cm−2)−1. The spectroscopic parameters measured in Leshchishina et al. (2011) for the spectral lines of interest were used as the a priori for the retrieved spectroscopic parameters. The line positions were left fixed to the values measured in Leshchishina et al. (2011), and all other O2 spectral lines (intensity less cm−1 (molecule cm−2)−1) were calculated using a Voigt line shape with spectroscopic parameters from HITRAN 2012 (Rothman et al., 2013a). Spectral fits were done using the lsqnonlin function in Matlab, with a user-defined Jacobian matrix. The Jacobian was constructed by taking the derivative of the absorption coefficients with respect to the parameters of interest. Using an analytical Jacobian instead of the finite difference method is both computationally faster and more accurate. The Voigt line shape was calculated using the Matlab code created by Abrarov and Quine (2011) to calculate the complex error function and its derivatives. To take collision-induced absorption (CIA) into account, a set of 50 Legendre polynomials were added together by retrieving the weighting coefficients needed to add the polynomials to fit the CIA for each spectrum. Figure 1b shows the residual (measured minus calculated absorption coefficients) when using a Voigt line shape with the retrieved spectroscopic parameters. The plot shows that residual structure still remains for all three spectra. The root mean square (rms) residual values for the spectra are given by the legend at the side of the plot.
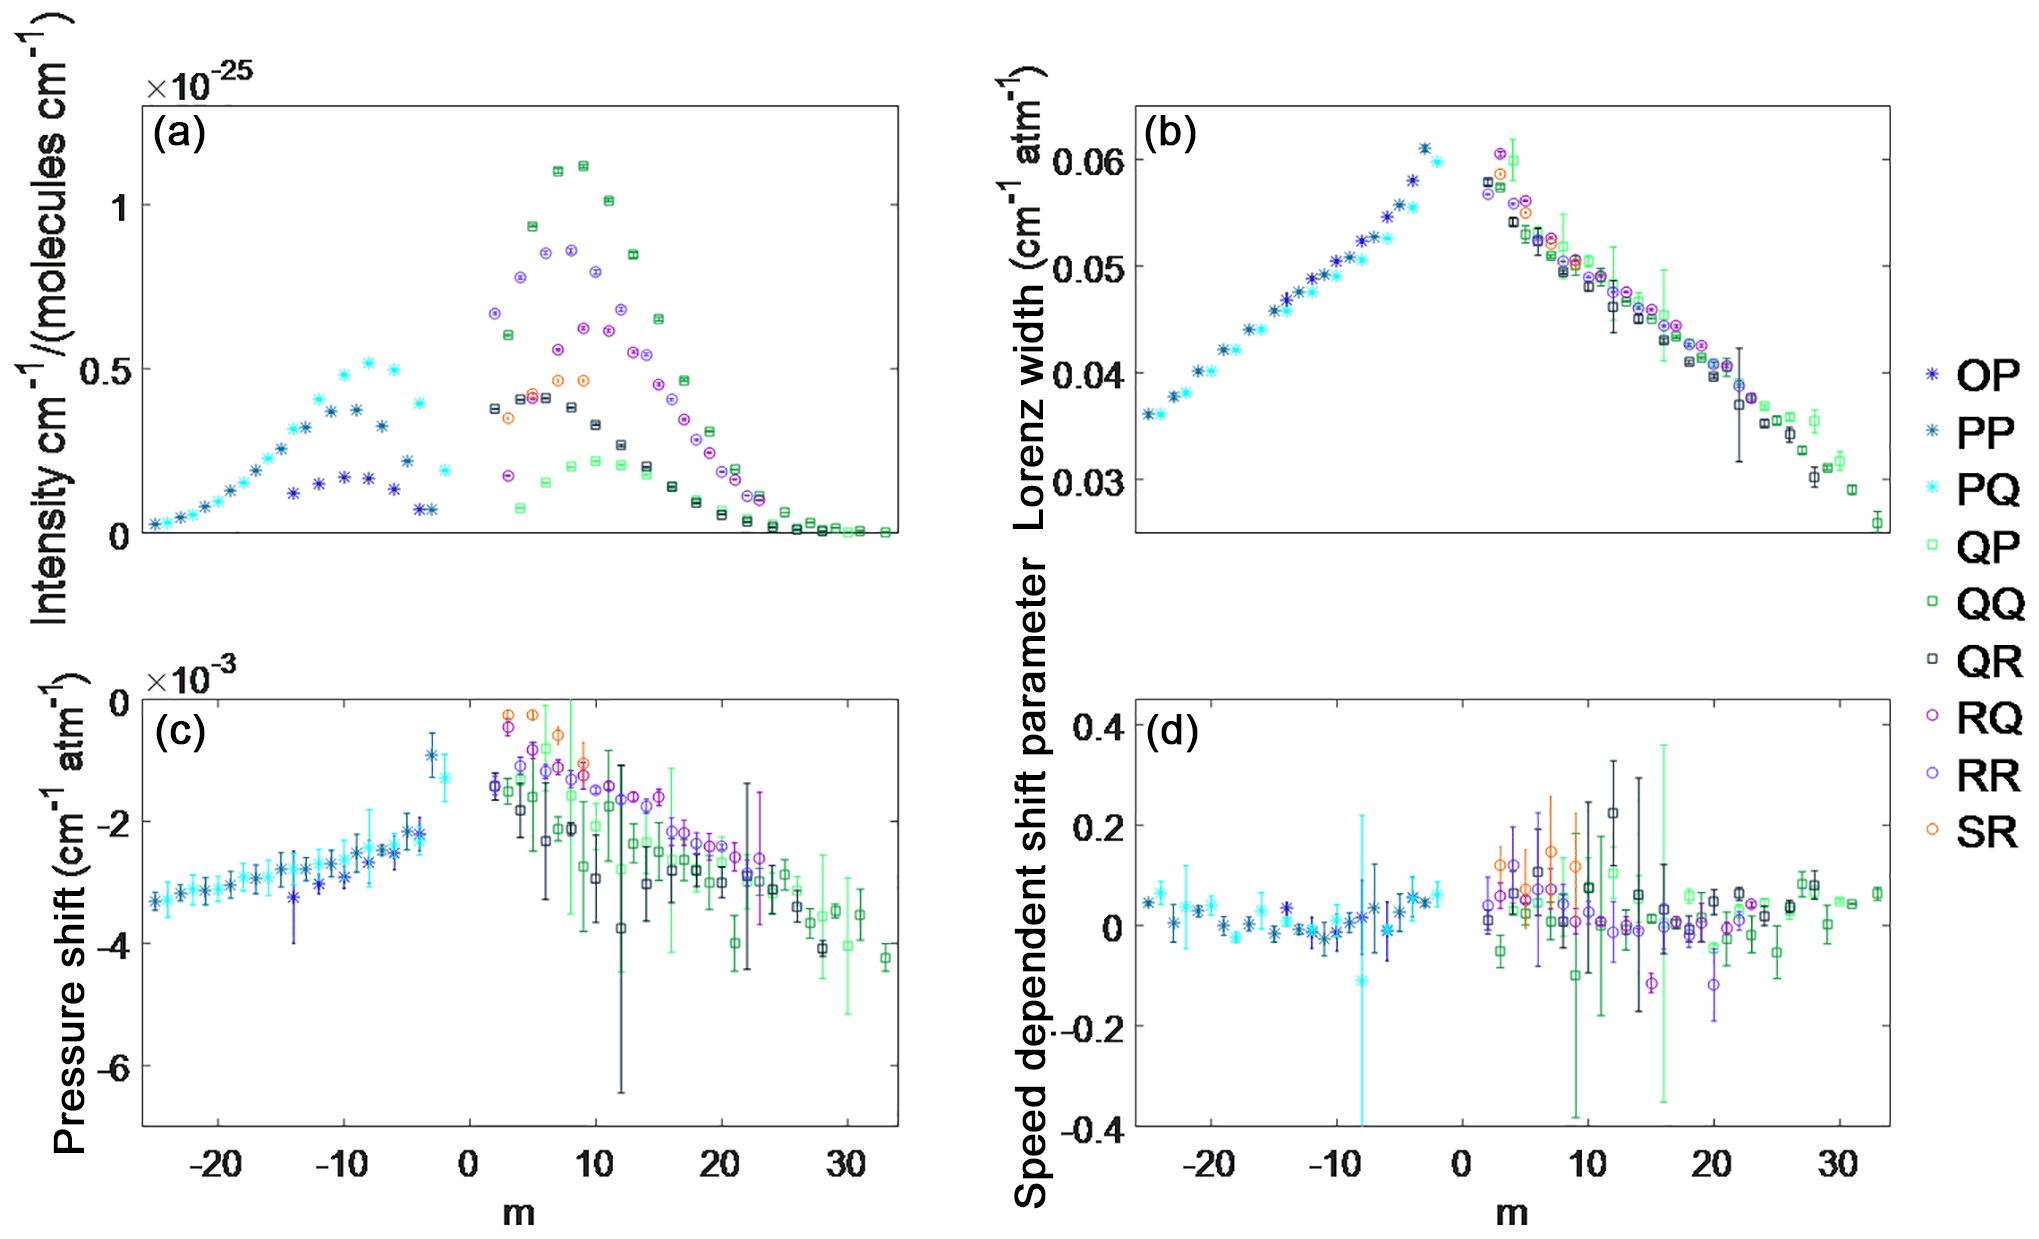
Figure 3The averaged measured (a) intensity, (b) Lorentz line width, (c) pressure shift and (d) speed-dependent pressure shift retrieved from the three cavity ring-down spectra of the 1.27 µm band of O2. All data are plotted as a function of m, which is for the P-branch lines, m=J for the Q branch and for the R branch (where J is the lower state rotational quantum number) and the uncertainties shown are 2σ.
Figure 2 is the same plot as Fig. 1 but for the P(11)P(11), P(11)Q(10), P(9)P(9) and P(9)Q(8) spectral lines only. Figure 2b shows that for all four spectral lines there is a W-shaped residual at the line centre. The P(11)P(11) line was also measured by Hartmann et al. (2013) at pressures ranging from 6.7 to 107 kPa. Figure 5 of Hartmann et al. (2013) shows the P(11)P(11) line at a pressure of 66.7 kPa, which is approximately the pressure of the 66.9 kPa spectrum (blue spectrum in Figs. 1 and 2). When one compares the blue residual of the P(11)P(11) line in Fig. 2b to that of the residual of the left panel of Fig. 5 of Hartmann et al. (2013), one can see that the residuals are the same. Figure 6 of Hartmann et al. (2013) show that the amplitude of the residual increases with decreasing pressure, which is also seen in Fig. 2b. Figure 3 of Lamouroux et al. (2014) shows the same W residual for the P(9)P(9) lines and that the amplitude of the residual increases with decreasing pressure (although for lower pressures), consistent with the results for the P(9)P(9) line in Fig. 2b.
Figure 1c shows the residual when using the speed-dependent Voigt (Eq. 4) to fit each spectrum individually. Using Eq. (4) requires integration over all possible speeds, which is not computationally practical, so we employ the simple numerical integration scheme as was done by Wehr (2005). When fitting the spectra, parameters Sj, , , and were retrieved for lines of intensity greater than cm−1 (molecule cm−2)−1, while all other O2 lines were calculated using a Voigt line shape and spectroscopic parameters from HITRAN 2012 (Rothman et al., 2013b). The retrieved spectroscopic parameters are available in the Supplement. The Jacobian matrix was created by taking the derivative with respect to each parameter of interest, as was done with the Voigt fits. By taking speed-dependent effects into account, the residuals were reduced to 25 times smaller than those for the Voigt fit and the rms residuals (given in the legend of Fig. 1c) are 10 times smaller. However, some residual structure still remains, which is more evident in the in the Q and R branches than the P branch. Figure 2c shows the four lines in the P branch, as discussed when analysing the Voigt fits. A small residual W remains at the line centre as well as residuals from weak O2 lines.
Figure 3 shows the averaged intensity Lorentz width coefficient, pressure shift coefficient and speed-dependent shift coefficient of the 1.27 µm O2 band, retrieved from the three spectra, plotted as a function of quantum number m, which is (where J is the lower state rotational quantum number) for the P-branch lines, m=J for the Q-branch lines and for the R-branch lines. The intensity, Lorentz widths and pressure shifts show a m dependence for these parameters for the P and R sub-branches. The measured Lorentz widths and pressure shifts for the Q sub-branches show a m dependence but are not as strong as the P and R sub-branches. This is because the Q branch lines are broadened enough to blend with each other, since they are spaced closer together than the P or R branch lines. Figure 1c shows that some of the residual structure in the Q branch increases with pressure and is partly due to the blending of these transitions as the pressure increases. The weak O2 absorption lines also blend in with the Q branch, contributing to the residual structure in Fig. 1c. We tried retrieving the spectroscopic parameters for the weak O2 absorption lines, but since they were overlapping with the strong O2 lines, it was not possible. Figure 4a shows the retrieved speed-dependent width parameter averaged over the three spectra, plotted as a function of m, showing that it increases with m. Error bars correspond to the 2σ standard deviation and are large regardless of sub-branch. Figure 4b shows the retrieved speed-dependent width for the PQ sub-branch for the different pressures. The speed-dependent width shows the same m dependence regardless of pressure, but also increases with decreasing pressure as is the case for sub-branches. It should be noted that the speed-dependent width parameter should be independent of pressure.

Figure 4(a) The averaged measured speed-dependent width parameter of the 1.27 µm band of O2 plotted as a function of m. (b) The measured speed-dependent width parameter for spectral lines that belong to the PQ sub-branch plotted as a function of m.
High-resolution solar absorption spectra were measured at four TCCON sites using a Bruker IFS 125HR FTIR spectrometer with a room temperature InGaAs detector at a spectral resolution of 0.02 cm−1 (45 cm maximum optical path difference). The raw interferograms recorded by the instrument were processed into spectra using the I2S software package (Wunch et al., 2015) that corrects solar intensity variations (Keppel-Aleks et al., 2007), phase errors (Mertz, 1967) and laser sampling errors (Wunch et al., 2015), and then performs a fast Fourier transform to convert the interferograms into spectra (Bergland, 1969). The GGG software package (Wunch et al., 2015) is used to retrieve total columns of atmospheric trace gases. GFIT is the main code that contains the forward model, which calculates a solar absorption spectrum using a line-by-line radiative transfer model and an iterative non-linear least square fitting algorithm that scales an a priori gas profile to obtain the best fit to the measured spectrum. A priori profiles for GHGs are created by an empirical model in GGG that is based on measurements from the balloon-borne JPL MkIV Fourier transform spectrometer (FTS) (Toon, 1991), the Atmospheric Chemistry Experiment (ACE) FTS instrument aboard the SCISAT satellite (Bernath et al., 2005) and in situ GLOBALVIEW data (Wunch et al., 2011). Temperature and pressure profiles, as well as H2O a priori profiles are generated from the National Centers for Environmental Prediction (NCEP) data. The calculations are performed for 71 atmospheric layers (0 to 70 km), so all a priori profiles are generated on a vertical grid of 1 km.
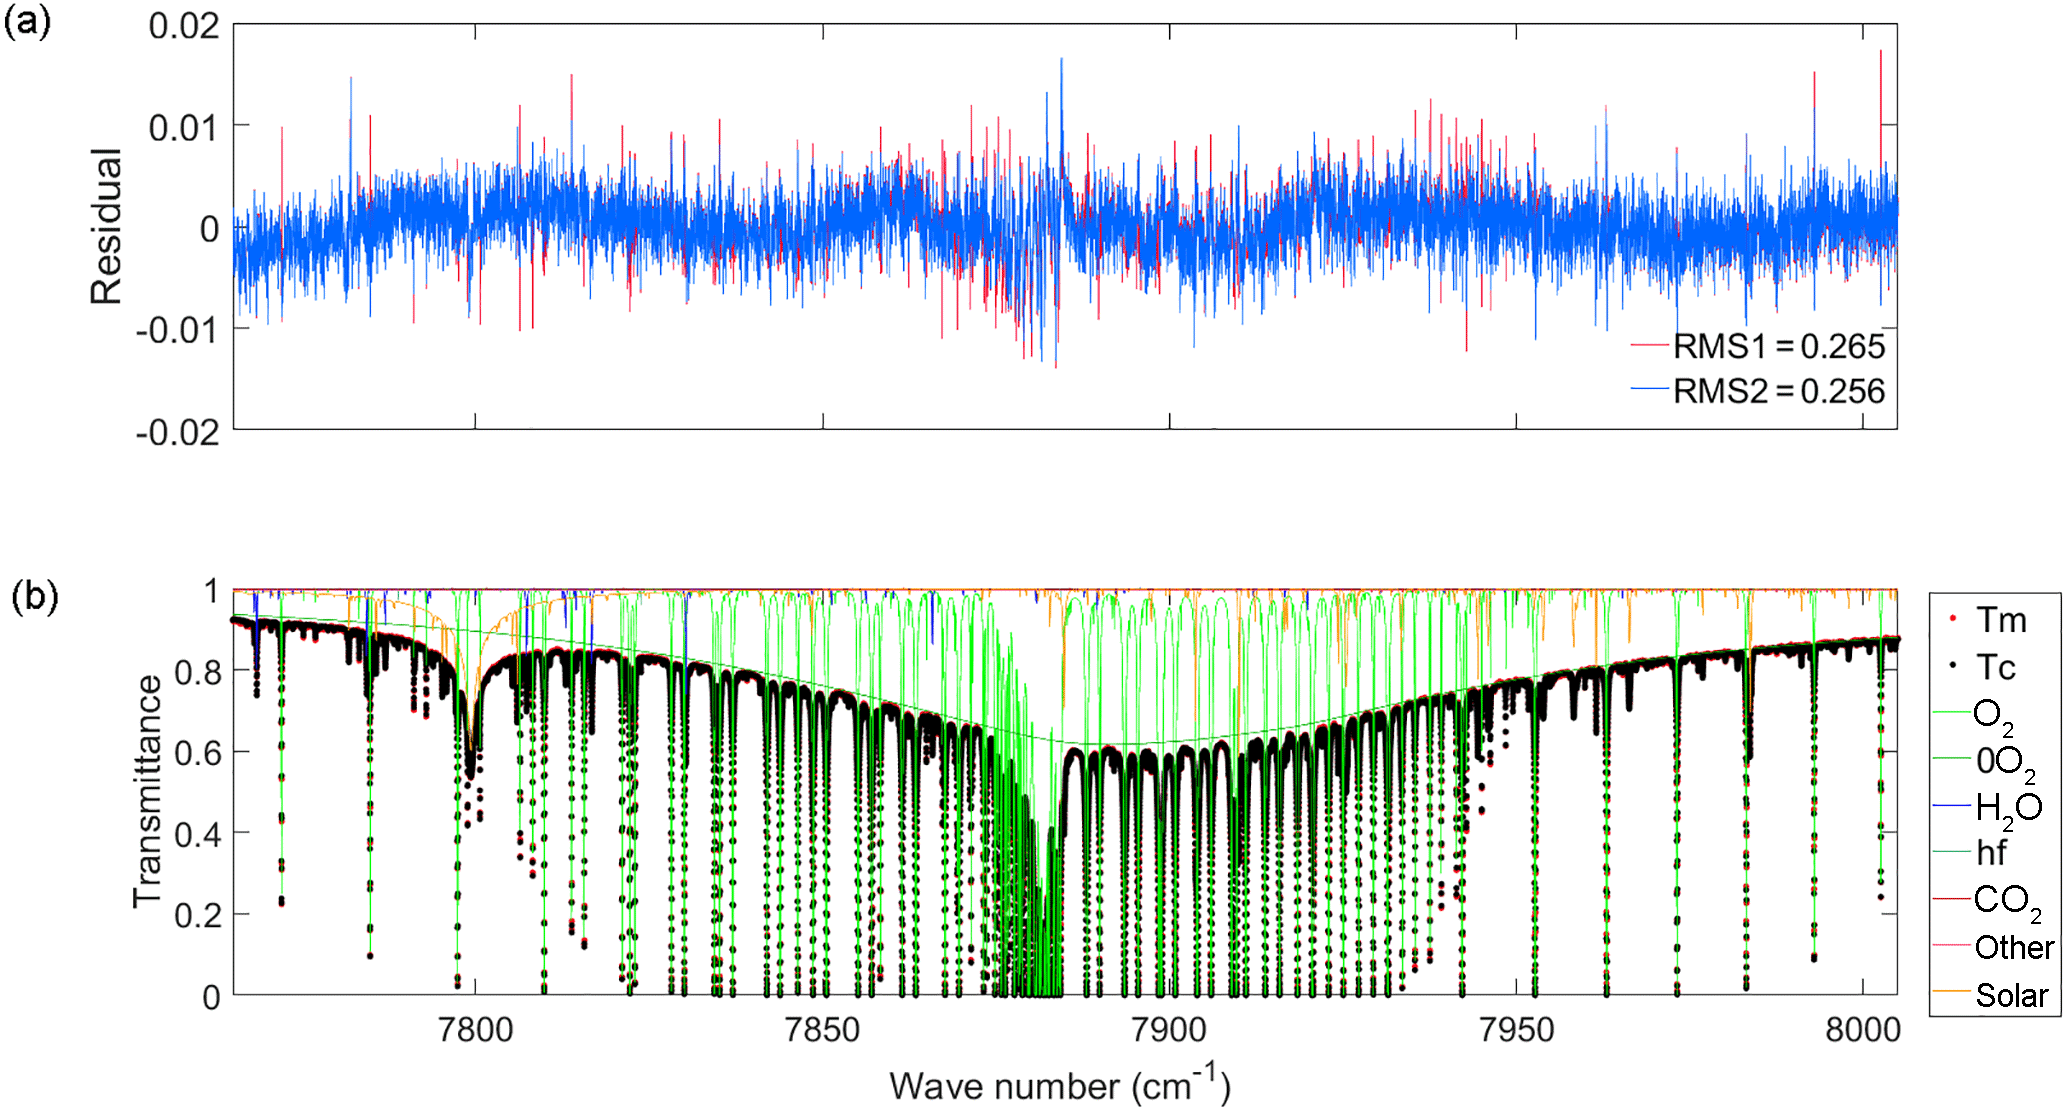
Figure 5(a) The residuals (measured minus calculated) for a spectrum measured at Eureka on 27 March 2015 at a SZA of 81.32∘. The red residual is the result of using the Voigt line shape and the blue is from using the qSDV. (b) The measured (red dots) and calculated values (black dots), with the qSDV spectrum, along with the gases included in the fit (refer to the legend to the right) in the spectral window.
In the current GGG software package (Wunch et al., 2015), the forward model of GFIT calculates absorption coefficients for the discrete lines of the O2 1.27 µm band using a Voigt line shape and spectroscopic parameters from Washenfelder et al. (2006a) and Gordon et al. (2010). To take CIA into account, absorption coefficients are calculated using a Voigt line shape and spectroscopic parameters from the foreign-collision-induced absorption (FCIA) and self-collision-induced absorption (SCIA) spectral line lists provided with the GGG software package (Wunch et al., 2015). Spectroscopic parameters in the FCIA and SCIA line lists were retrieved by Geoff C. Toon by fitting the laboratory spectra of Smith and Newnham (2000). This was done by retrieving the integrated absorption at every 1 cm−1 of the spectrum and using a Voigt line shape, with fixed Lorentz width and no pressure shift. In GFIT, a volume scale factor is retrieved for the CIA and discrete lines separately so that the O2 column is derived from the discrete lines of the 1.27 µm band only. Airglow is not considered when fitting the 1.27 µm band, since the spectrometer views the sun directly and airglow is overwhelmed by this a bright source. The continuum level and tilt of the 100 % transmission level is fitted using a weighted combination of the first two Legendre polynomials. Absorption coefficient for all other trace gases are calculated using a Voigt line shape and spectroscopic parameters from the atm.101 line list (Toon, 2014a) and solar lines are fitted using the solar line list (Toon, 2014b).
Figure 5 shows the spectral fit to a solar absorption spectrum recorded at Eureka on 27 March 2015, at a solar zenith angle (SZA) of 81.32∘ (air mass of 6.3). This spectrum is an average of five Eureka scans. The TCCON standard is single scan but five scans were averaged to decrease the noise. The measured spectrum (red circles), calculated spectrum (black circles) and transitions from all gases in the window (coloured lines, refer to the legend for different gases) are shown in Fig. 5b. The residual obtained using a Voigt line shape to calculate the discrete lines of the O2 1.27 µm band is shown in red in Fig. 5a. The blue residual is the result of using a speed-dependent Voigt line shape with the spectroscopic parameters retrieved from fitting the absorption coefficients in Section 3. To decrease the amount of time it takes to calculate the absorption coefficients, the quadratic speed-dependent Voigt (qSDV) computational approach of Ngo et al. (2013) and Tran et al. (2013) was used instead of Eq. (4) since it requires the Voigt calculation only twice, while Eq. (4) requires numerical integration scheme with 33 iterations. The temperature-dependent parameter of the Lorentz width of the discrete lines of the O2 1.27 µm band reported in HITRAN 2012 was used to take temperature dependence into account for . There was only a slight improvement in the fit residuals with the new absorption coefficients (using the qSDV), as seen in Fig. 5a. Absorption coefficients calculated with the qSDV were used to retrieve total columns of O2 from solar spectra recorded over a 1-year period at TCCON sites in Eureka (eu) (Nunavut, Canada) (Batchelor et al., 2009; Strong et al., 2017), Park Falls (pa) (Wisconsin, USA) (Washenfelder et al., 2006a; Wennberg et al., 2017a) , Lamont (oc) (Oklahoma, USA) (Wennberg et al., 2017b) and Darwin (db) (Australia) (Deutscher et al., 2010; Griffith et al., 2017). In total 131 124 spectra were fitted using the qSDV and the average root mean square (rms) residual of the fit only decreased by 0.5 %.
The O2 column retrieved from the 1.27 µm band with a Voigt line shape and spectroscopic parameters from the atm.101 line list (Toon, 2014a) has an air mass dependence such that the O2 column retrieved increases as a function of the solar zenith angle (or air mass). Using spectra recorded from Eureka, Park Falls, Lamont and Darwin over 1-year periods, total columns of O2 were retrieved using (1) a Voigt spectral line shape with spectroscopic parameters from the atm.101 line list and (2) the qSDV with the spectroscopic parameters determined in Sect. 3. Figure 6 shows the percent difference calculated as the column from the qSDV retrieval minus the column from the Voigt retrieval, which was then divided by the latter and multiplied by 100, plotted as a function of solar zenith angle (SZA). At the smallest SZA, the qSDV retrieves 0.75 % less O2 than the Voigt, with the difference increasing to approximately 1.8 % as the SZA approaches 90∘. Figure 7 shows XAIR for the entire data set plotted as a function of SZA. XAIR is the column of air (determined using surface pressure recorded at the site) divided by the column of O2 retrieved from the spectra and multiplied by 0.2095, which is the dry-air mole fraction of O2 in the Earth's atmosphere. Ideally XAIR should be 1 but when using O2 retrieved with a Voigt line shape (Fig. 7a) to calculate XAIR the average XAIR value for the entire data set is 0.977. Using O2 retrieved with the qSDV to calculate XAIR, the average value is 0.986, which is closer to the expected value of 1. However, XAIR has a dependence on SZA regardless of line shape used. Figure 7a shows that XAIR decreases as a function of SZA (evident at SZA >75∘), which means that the retrieved column of O2 increases as a function of SZA. Figure 7b shows that XAIR increases as a function of SZA (evident at SZA >70∘), which means that the retrieved column of O2 decreases as a function of SZA. Therefore retrieving total columns of O2 with the qSDV changes the air mass dependence of the O2 column, which in turn will impact the air mass dependence of XCO2.
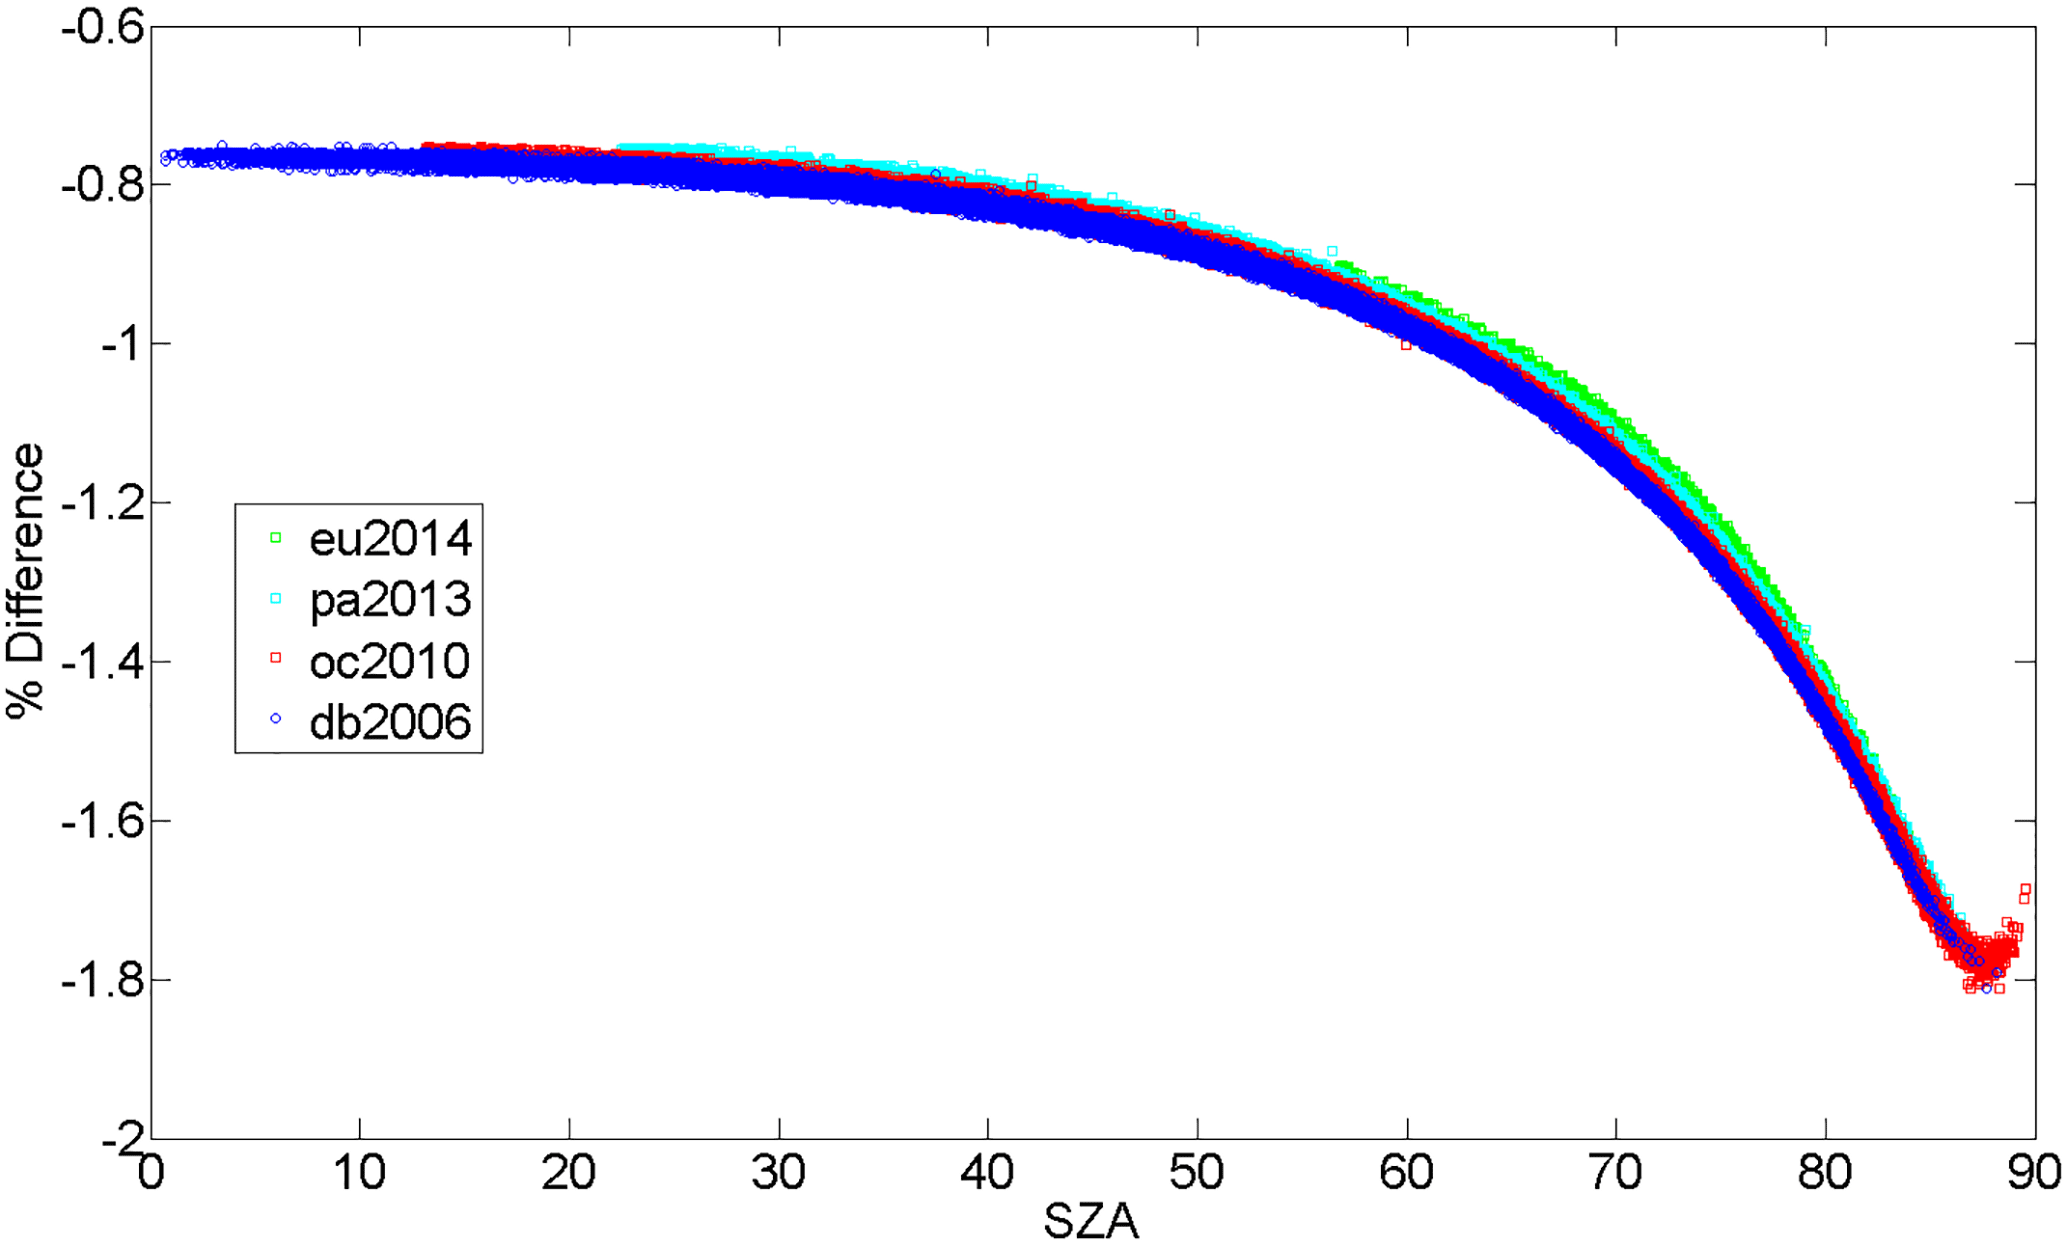
Figure 6The percent difference between the O2 column retrieved with the Voigt and qSDV line shapes for a year of measurements from Eureka (eu), Park Falls (pa), Lamont (oc) and Darwin (db).
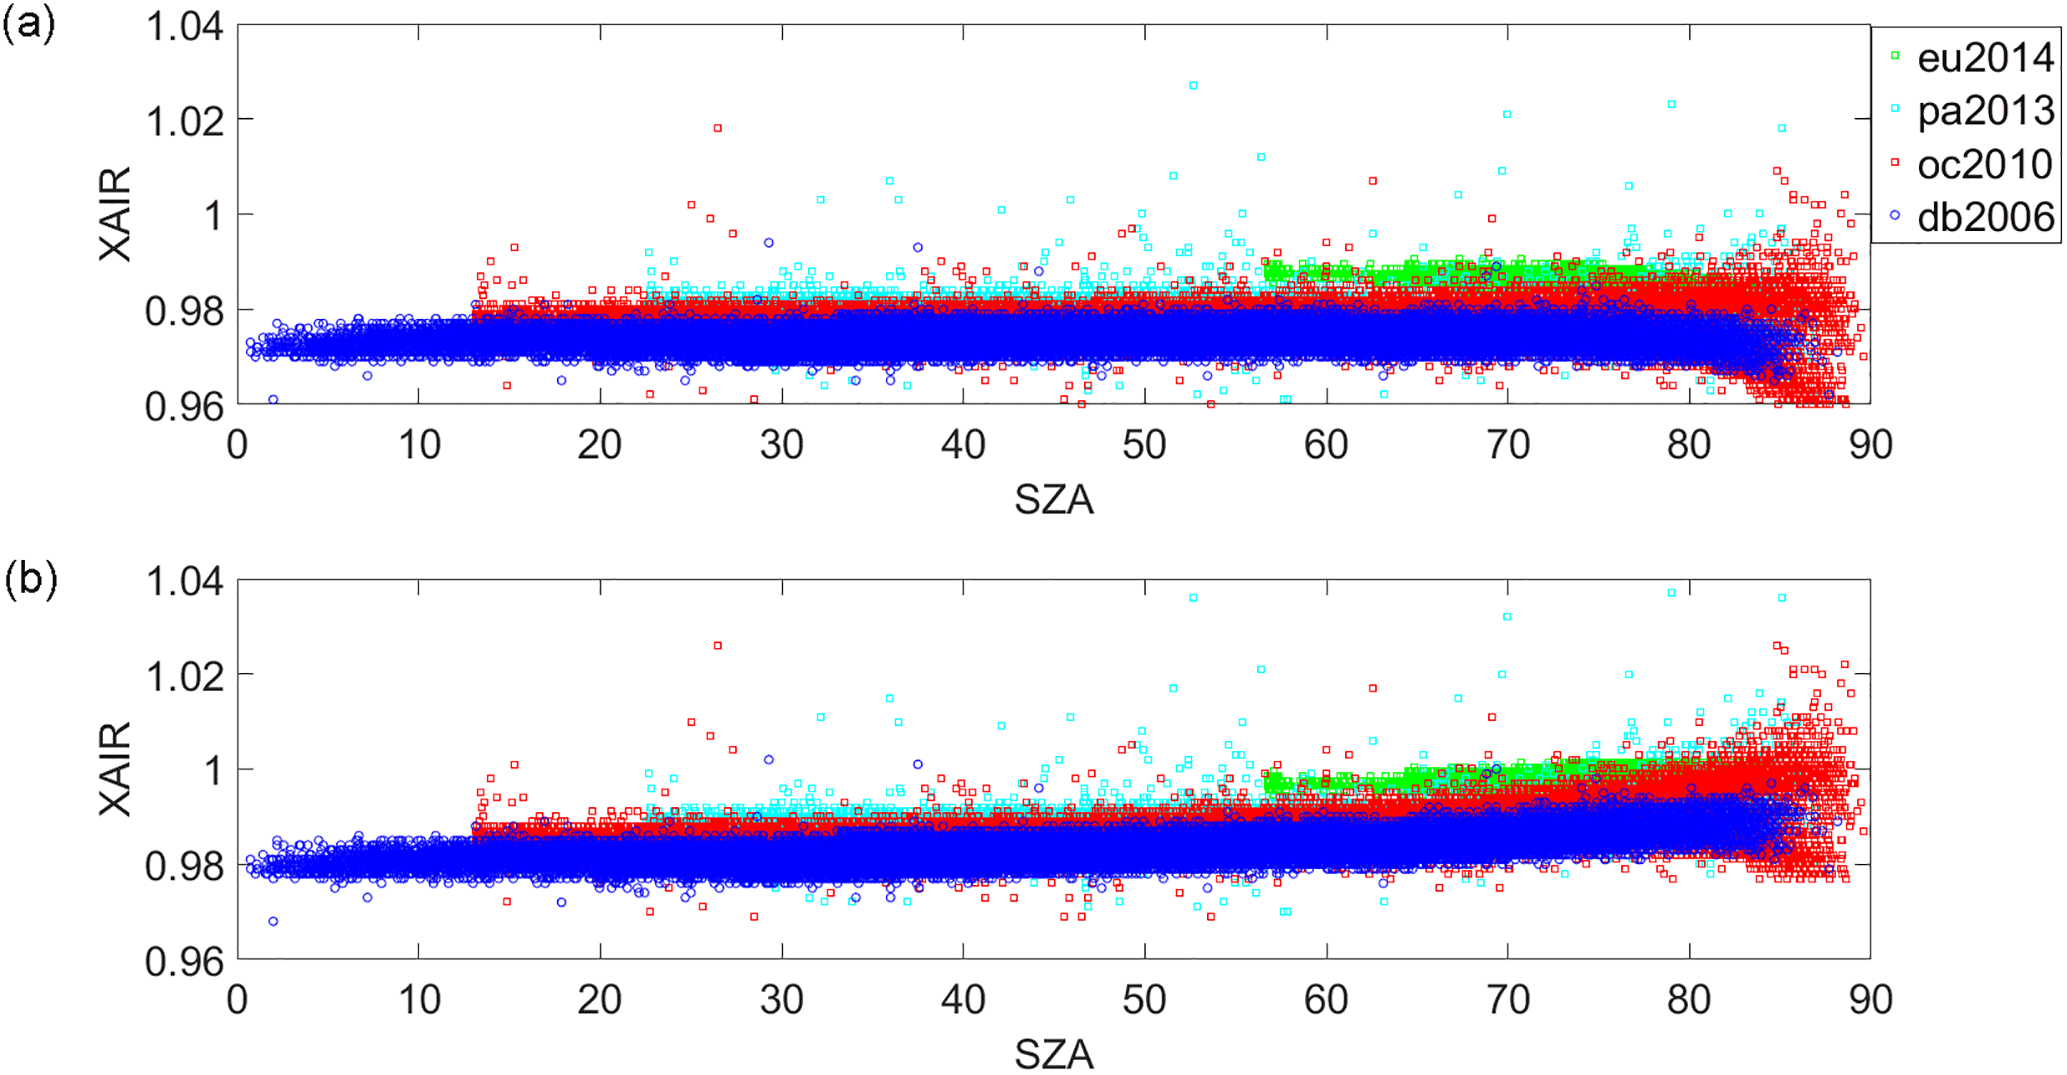
Figure 7(a) XAIR as a function of SZA calculated using the total column of O2 retrieved using the Voigt line shape. Panel (b) is the same as panel (a) except the total column of O2 was retrieved with the qSDV.
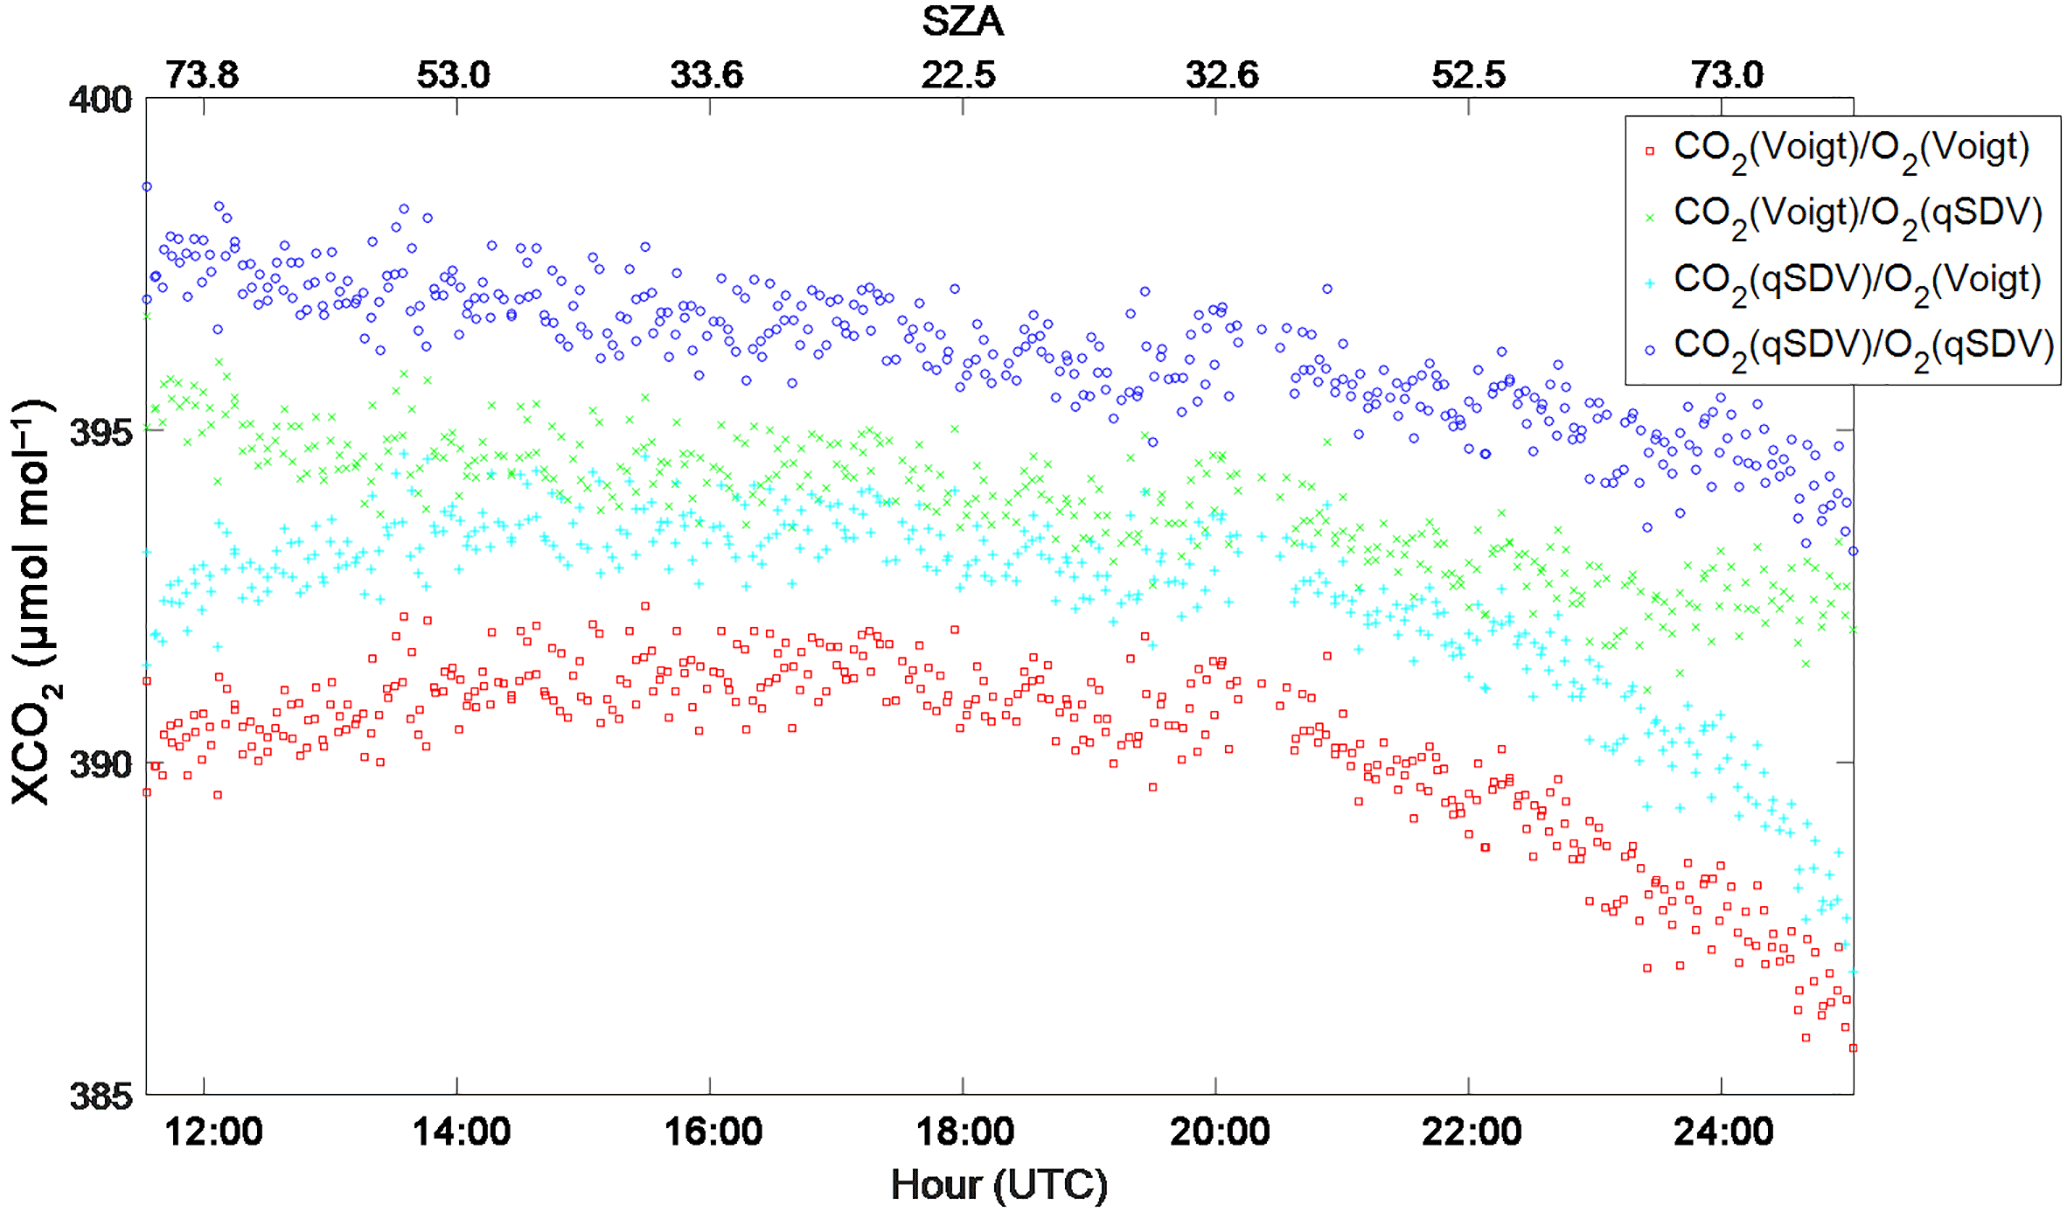
Figure 8XCO2 calculated from the CO2 and O2 columns retrieved from Park Falls spectra recorded on 18 June 2013. The CO2 columns were retrieved using either the Voigt line shape or the qSDV with line mixing, while the O2 columns were retrieved using either the Voigt or qSDV line shapes. XCO2 was calculated in four ways: (1) both CO2 and O2 columns retrieved using the Voigt line shape (red), (2) CO2 columns retrieved with the Voigt and O2 columns retrieved with the qSDV (green), (3) CO2 columns retrieved with the qSDV and line mixing and O2 columns retrieved with the Voigt (cyan) and (4) CO2 columns retrieved with the qSDV and line mixing and O2 columns retrieved with the qSDV (blue). The top x axis is the SZA that corresponds to the hour on the bottom x axis.
5.1 Air mass dependence of XCO2
Since the standard TCCON XCO2 (and all other XGas) is calculated using the column of O2 instead of the surface pressure, errors associated with the retrieval of O2, such as the air mass dependence of the O2 column, will affect XCO2. Figure 8 is XCO2 calculated for four different combinations pertaining to the two CO2 column retrievals and the O2 column retrievals. The CO2 columns were retrieved with either a Voigt line shape (the standard GGG2014 approach) or the qSDV with line mixing as done in Mendonca et al. (2016), while the O2 columns were retrieved with either a Voigt (the standard GGG2014 approach) or the new qSDV approach developed here. Figure 8 shows a spurious symmetric component to XCO2 when the total column of O2 is retrieved with the Voigt line shape, regardless of line shape used to retrieve CO2. When the qSDV is used to retrieve total columns of O2, the symmetric component of XCO2 is dismissed regardless of line shape used to retrieve CO2. This is because the air mass dependence of the column of O2 retrieved using the qSDV is more consistent with the air mass dependence of the column of CO2 (for both line shapes used to retrieve CO2). Mendonca et al. (2016) showed that using the qSDV with line mixing results in better fits to the CO2 windows and impacts the air mass dependence of the retrieved column of CO2. When using a Voigt line shape the retrieved column amount of CO2 decreases as air mass increases until the air mass is large (SZA of about 82∘), at which point the retrieved column of CO2 increases as the air mass increases, changing the shape of the air mass dependence of the CO2 column. When the qSDV with line mixing is used, the retrieved column of CO2 decreases as a function of air mass (up until the sun is above the horizon).
To correct for this, an empirical correction is applied to all TCCON XCO2 (and XGas). The empirical correction determines the antisymmetrical component of the day's XCO2, which is assumed to be the true variation of XCO2 throughout the day, as well as the symmetrical component, which is caused by the air mass dependence of the retrieved column of the gas of interest and O2. We can, therefore, represent a measurement as (Wunch et al., 2011)
where is the mean value of XCO2 measured that day, β is the fitted coefficient of the antisymmetric function A(ti) and α is the fitted coefficient of the symmetric function S(θi). The antisymmetric function is calculated by (Wunch et al., 2011)
where ti is the time of the measurement and tnoon is the time at solar noon, both in units of days. The symmetric function is calculated by (Wunch et al., 2011)
where θi is the SZA in degrees. To determine α for the different line shapes, total columns of CO2 were retrieved using the Voigt line shape (Wunch et al., 2015) and the qSDV with line mixing (Mendonca et al., 2016). Henceforth, we will refer to XCO2 calculated from O2 and CO2 using the Voigt line shape as XCO2 Voigt and the qSDV line shape as XCO2 qSDV.
Figure 9 shows the average α calculated for each season at Darwin, Lamont and Park Falls. Eureka XCO2 cannot be used to determine α because Eureka measurements do not go through the same range of SZAs as the other three sites due to its geolocation. The average α values derived from XCO2 Voigt are represented by stars in Fig. 9, while the squares indicate XCO2 qSDV. At all three sites, α is closer to 0 when the qSDV line shape is used in the retrieval compared to the Voigt retrieval, regardless of the season. The average α for XCO2 Voigt calculated from a year of measurements from Darwin, Park Falls and Lamont is and that for XCO2 qSDV is .
For all four sites, is used to correct XCO2 Voigt measurements. Figure 10a shows the XCO2 Voigt anomalies plotted as a function of SZA. The data are expressed as the daily XCO2 anomaly, which is the difference between the XCO2 value and the daily median value, in order to remove the seasonal cycle. When XCO2 is left uncorrected for air mass dependencies, XCO2 decreases as a function of SZA up to approximately 82∘ and increases as a function of SZA at angles greater than 82∘. Figure 10b shows XCO2 Voigt corrected for the air mass dependence. This air mass correction works well only up to a SZA of approximately 82∘. Figure 10c is the same as Fig. 10a but for the uncorrected XCO2 qSDV measurements, while Fig. 10d is the same as Fig. 10b but for the corrected XCO2 qSDV measurements. When the air mass correction is applied to XCO2 qSDV, there is a small difference between the corrected and uncorrected XCO2 qSDV measurements, with the difference only noticeable for the Darwin measurements recorded at SZA >60∘. For XCO2 qSDV measurements taken at SZA >82∘, XCO2 does not increase with SZA as it does with the Voigt.
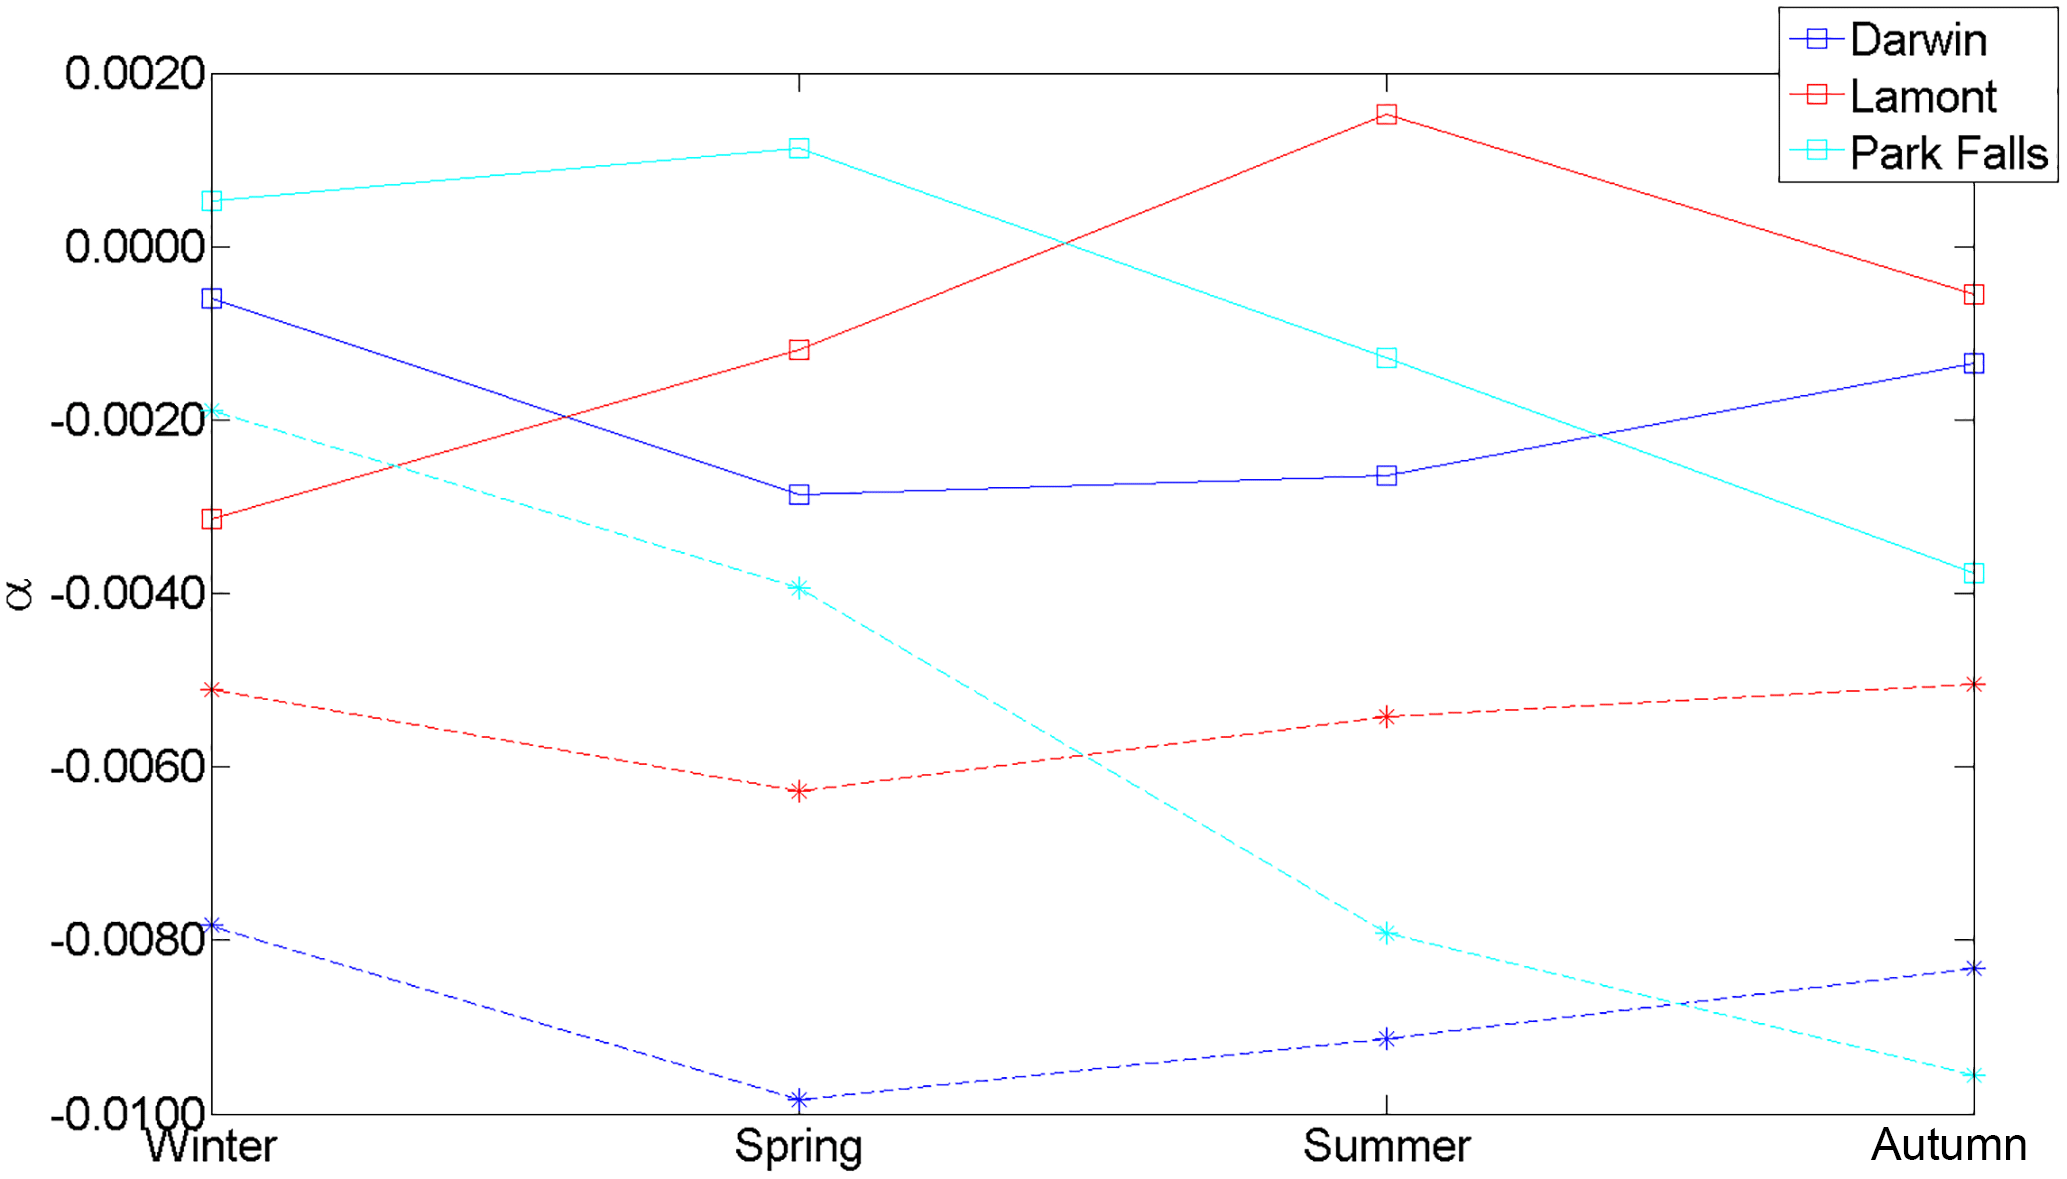
Figure 9The average air-mass-dependent correction factor for XCO2 derived from a year of spectra measured at Darwin, Lamont and Park Falls for different seasons. The dashed lines with stars are the α for XCO2 retrieved using a Voigt line shape for both CO2 and O2 columns. The solid lines with squares are from XCO2 retrieved using the qSDV for both CO2 and O2 columns.
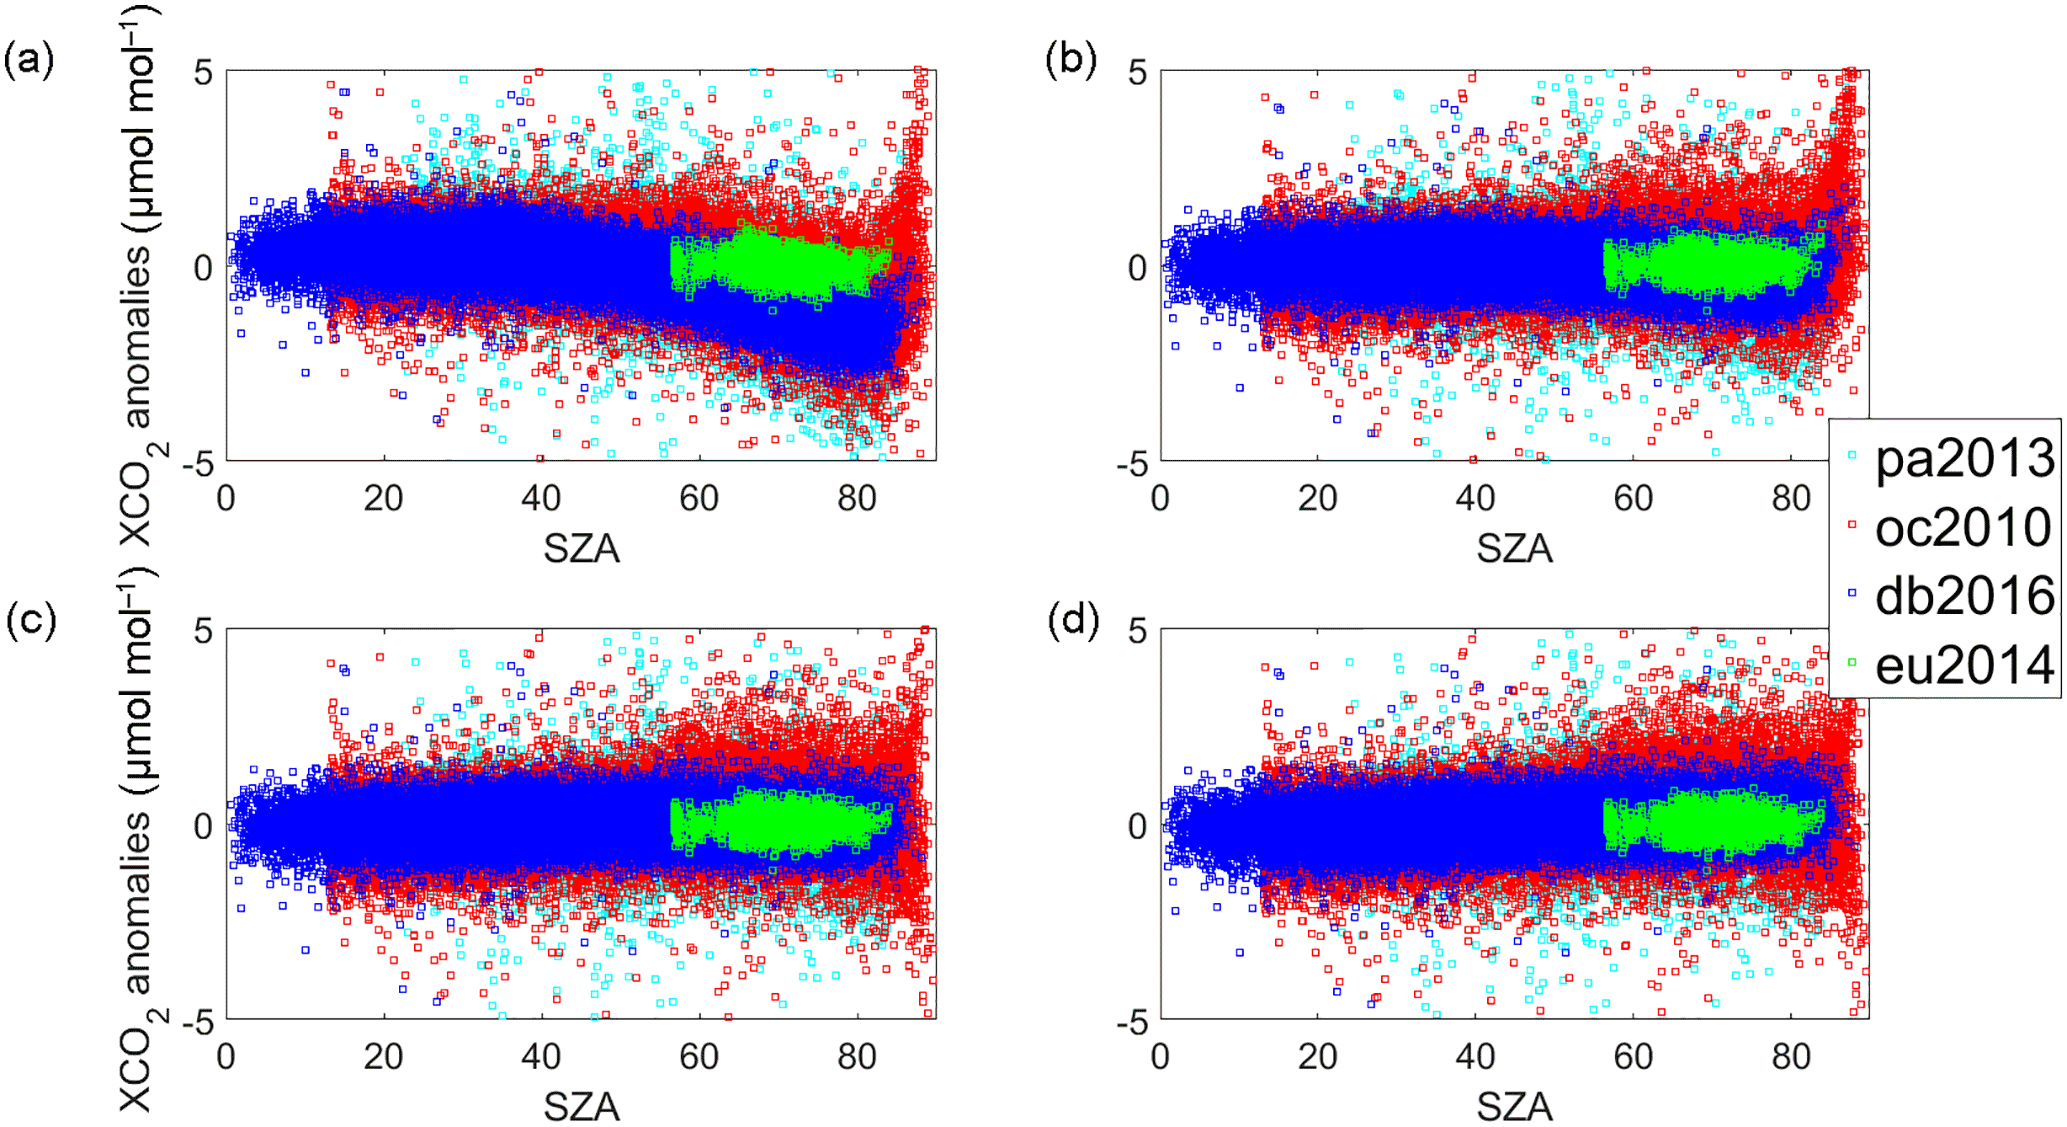
Figure 10(a) XCO2 Voigt anomaly for a year of measurements from the four TCCON sites. The XCO2 anomaly is the difference between each XCO2 value and the daily median XCO2. (b) The XCO2 Voigt anomaly after the air mass dependence correction is applied to the XCO2 Voigt data. (c) XCO2 qSDV anomaly. (d) XCO2 qSDV anomaly after correction for the air mass dependence.
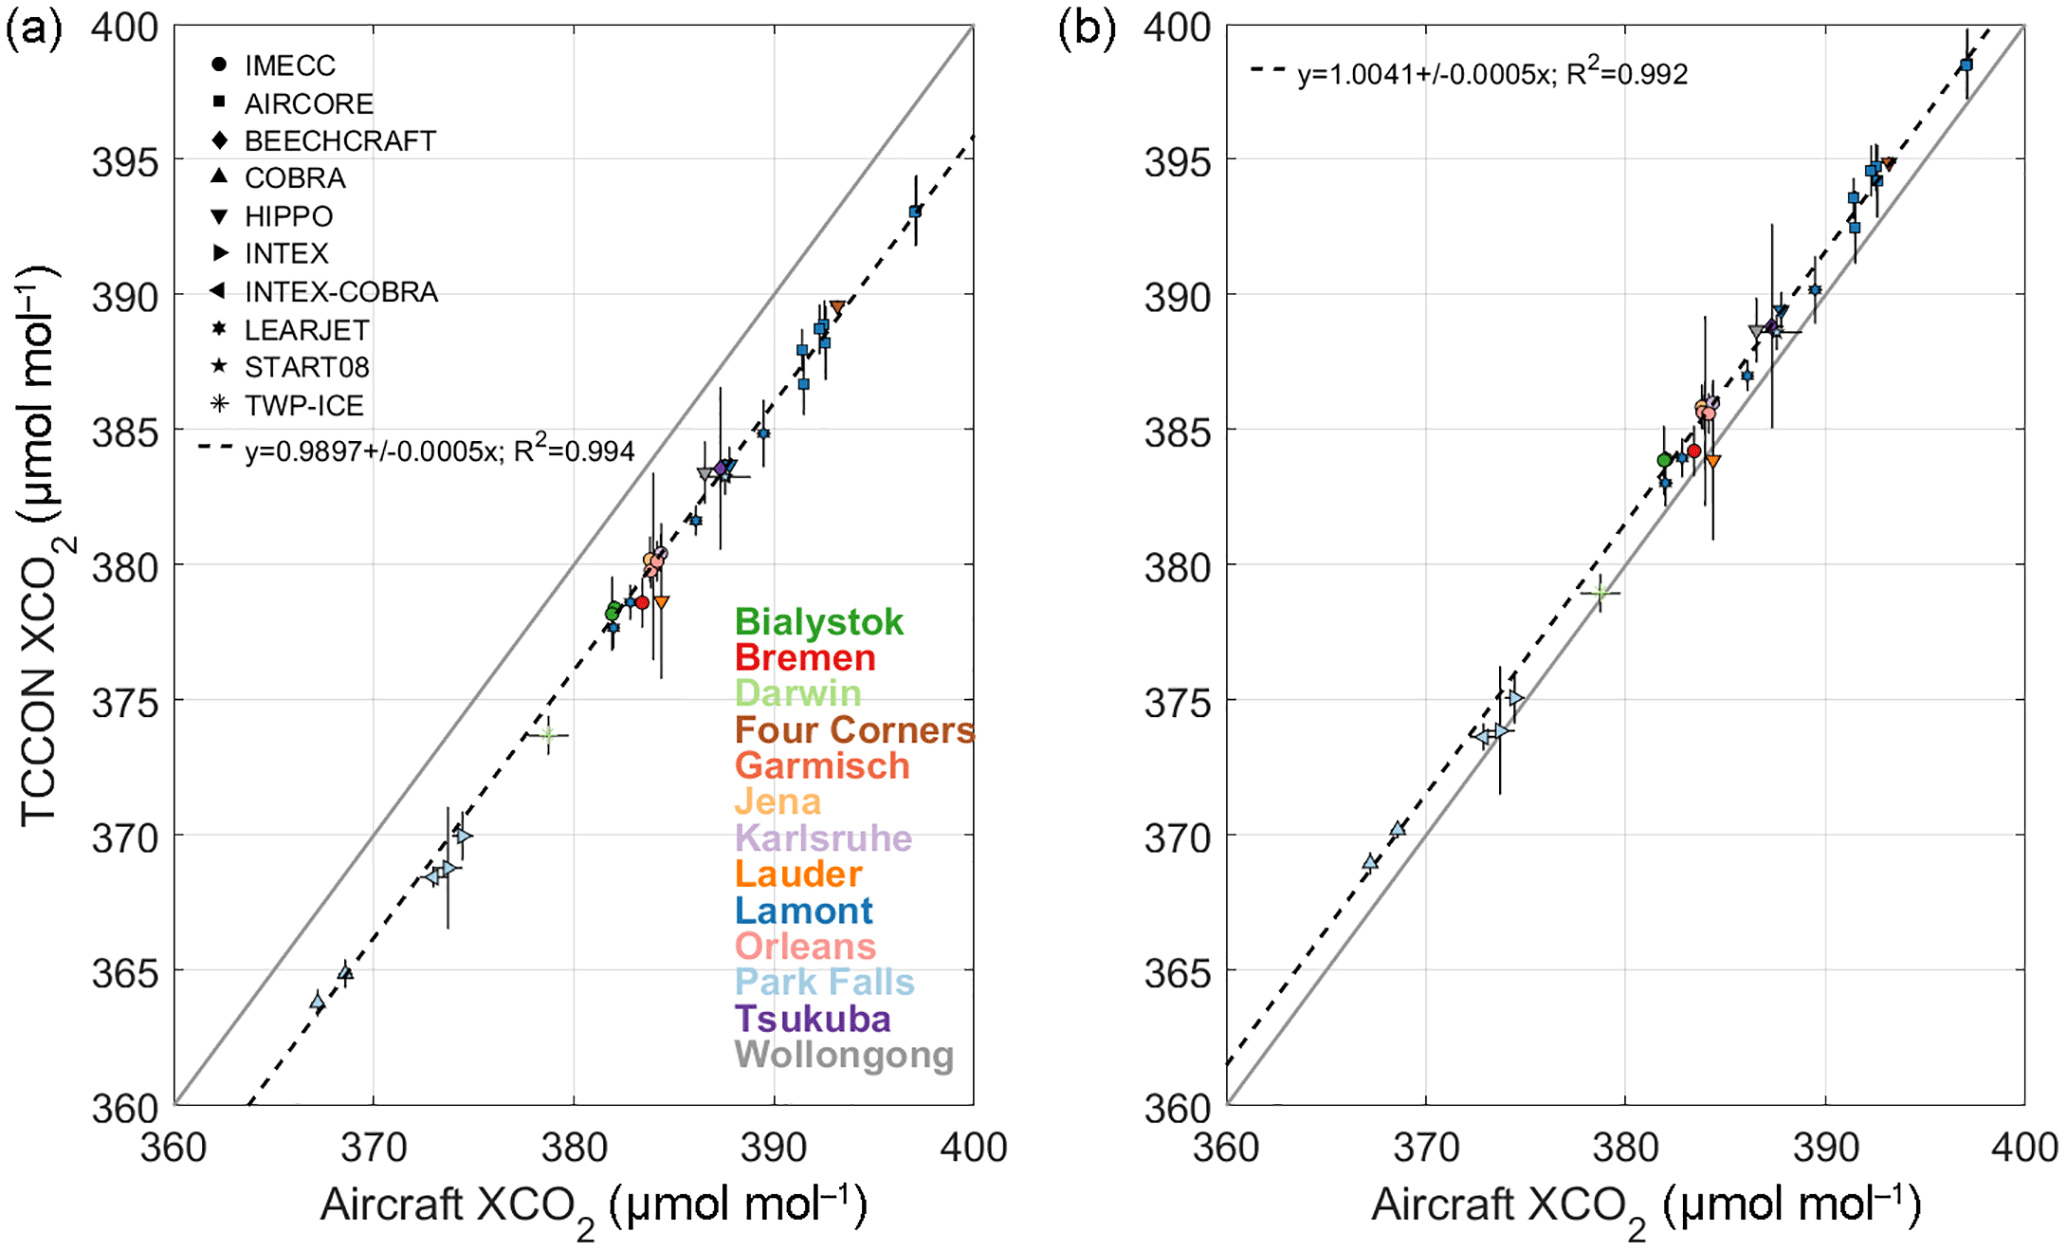
Figure 11(a) Correlation between TCCON and aircraft XCO2 Voigt measurements for 13 TCCON sites. Each aircraft type is indicated by a different symbol given by the legend in the top-left corner. Each site is represented by a different colour given by the legend in the bottom right corner. The grey line indicates the one-to-one line and the dashed line is the line of best fit for the data. The slope of the line of best fit as well as the error on the slope are given in the plot. (b) The same as panel (a) but for XCO2 qSDV.
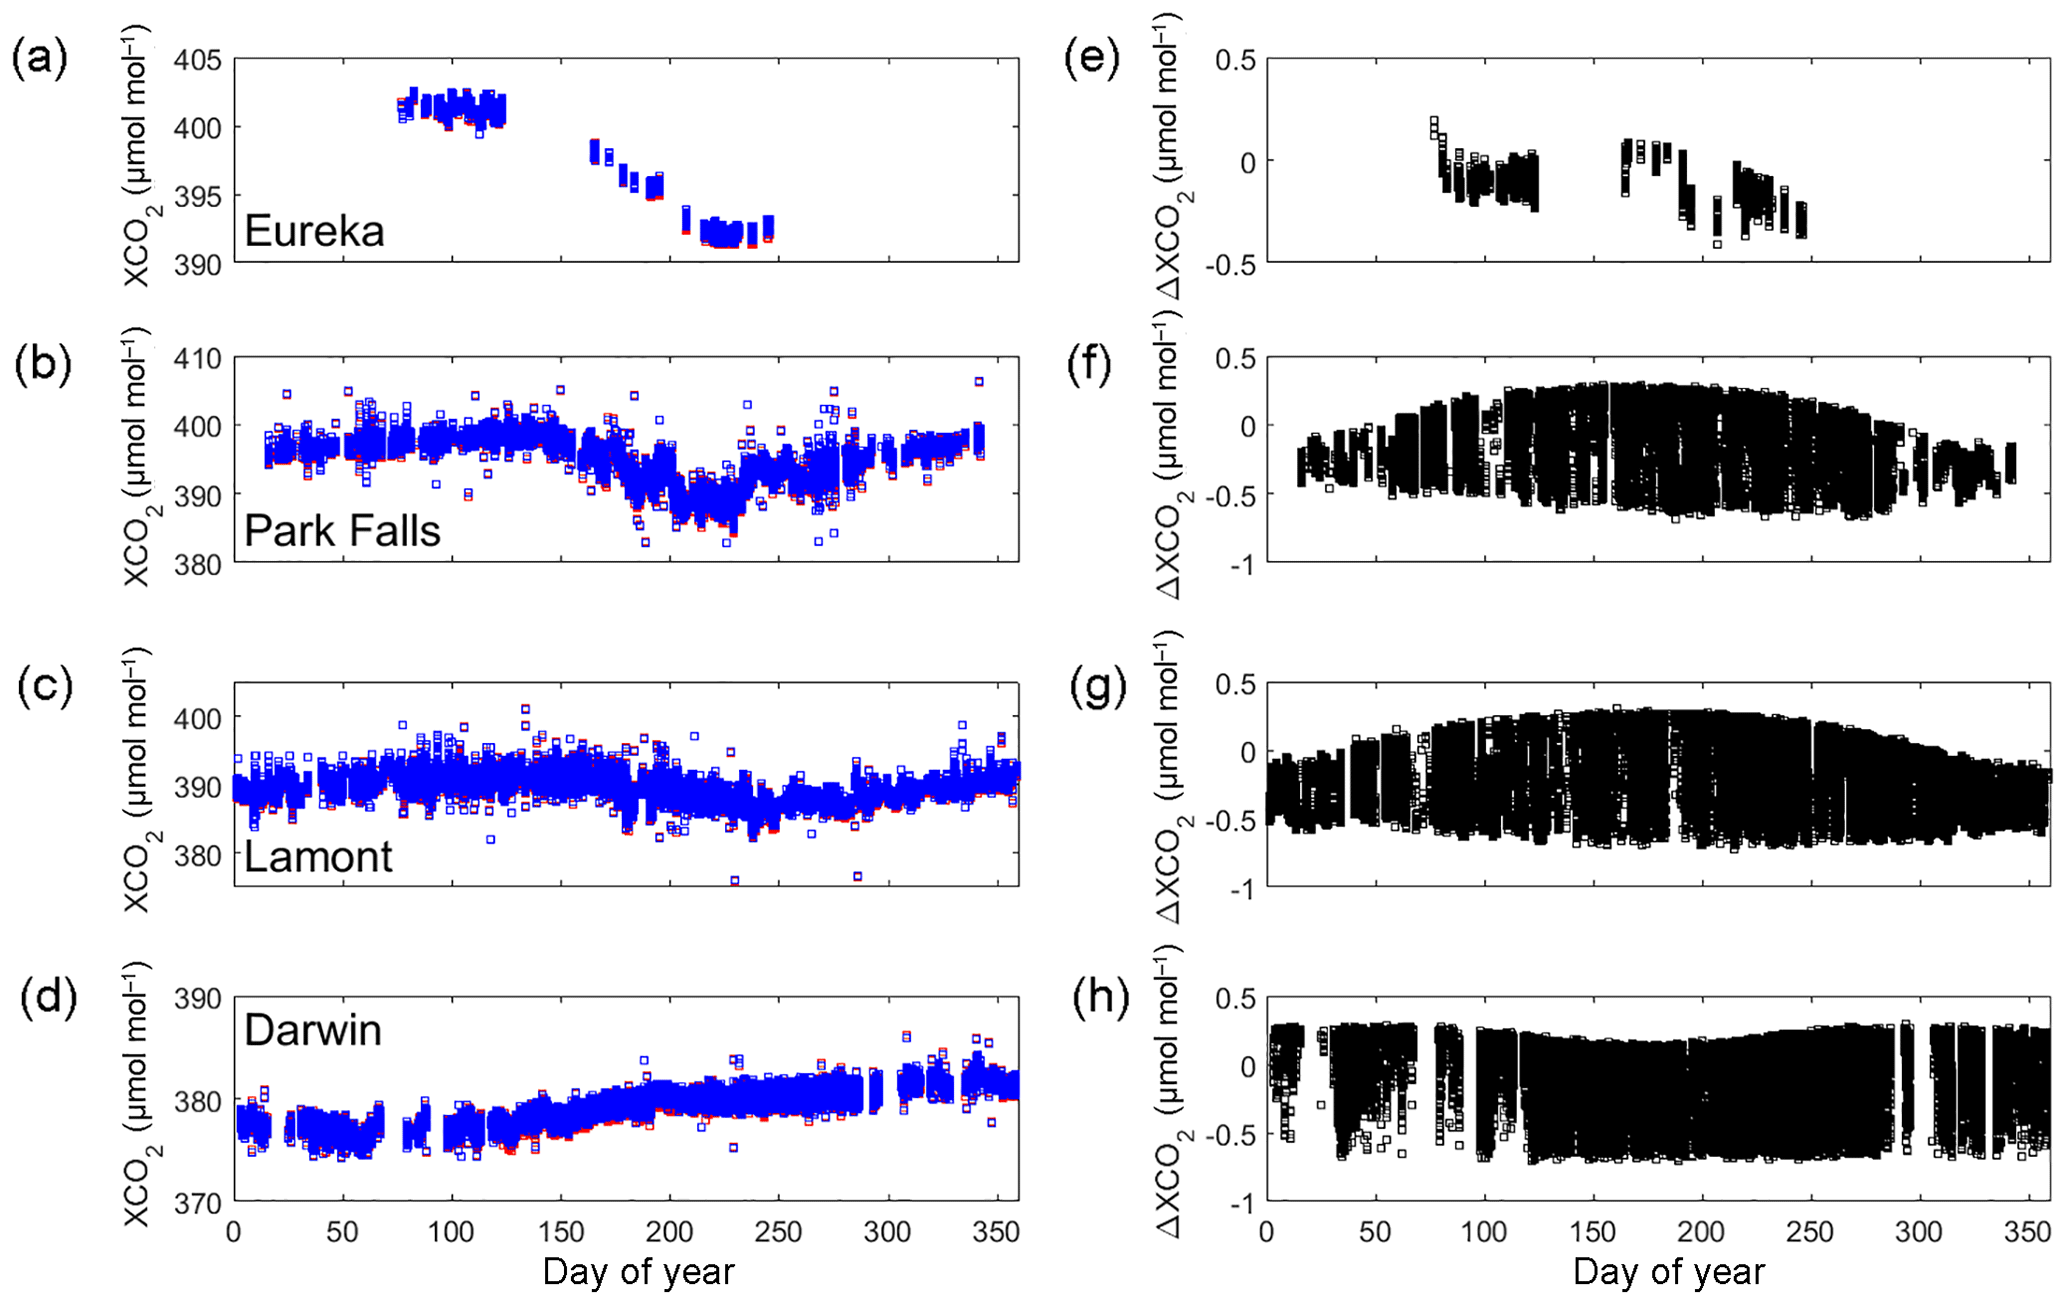
Figure 12(a–d) XCO2 plotted as a function of day of the year for Eureka (2014), Park Falls (2013), Lamont (2010) and Darwin (2006). The mostly hidden red boxes are XCO2 calculated from using a Voigt line shape in the retrieval and the blue boxes are from using the qSDV. (e–h) The difference between XCO2 Voigt and XCO2 qSDV.
5.2 Accuracy of XCO2
To assess the accuracy of TCCON XCO2 measurements, they are compared to aircraft XCO2 profile measurements using the method described in Wunch et al. (2010). Figure 11a shows the comparison between the aircraft XCO2 (Deutscher et al., 2010; Lin et al., 2006; Messerschmidt et al., 2010; Singh et al., 2006; Wofsy, 2011) measurements (legend at the top details the different aircraft) and TCCON XCO2 Voigt measurements for 13 TCCON sites (given by the colour-coded legend at the bottom right). The grey line indicates the one-to-one line and the dashed line is the line of best fit. There is a bias of 0.9897±0.0005 given by the slope of the line of best fit in Fig. 11a for the XCO2 Voigt measurements. Figure 11b is the same as Fig. 11a but for the XCO2 qSDV measurements. The bias between the aircraft XCO2 measurements and the XCO2 qSDV measurements is 1.0041±0.0005 as given by the slope of the line of best fit in Fig. 11b. This increase in the slope can be explained by an increase in the retrieved column of CO2 when using the qSDV with line mixing as shown in Mendonca et al. (2016) as well as combined with a decrease in the retrieved O2 column due to using the qSDV. As discussed previously (Sect. 5) the decrease in the retrieved O2 column is an improvement but the expected column of O2 is still approximately 1.2 % higher (at the smallest SZA) than it should be. Therefore, the retrieved column of CO2 is higher than it should be, and the slope would be greater if the retrieved column of O2 was 1.2 % lower. Nevertheless, using the qSDV to retrieve total columns of CO2 and O2 reduces the difference between TCCON XCO2 and aircraft XCO2 measurements by 0.62 %.
TCCON XCO2 measurements are divided by the scale factors (or bias determined in Fig. 11) to calibrate to the WMO scale. For all TCCON XCO2 measurements retrieved with a Voigt line shape, the air mass correction is first applied to the data and the result is divided by the determined bias factor, 0.9897. Figure 12a to d shows XCO2 Voigt (for Eureka, Park Falls, Lamont and Darwin) indicated by red square boxes in the plots. XCO2 Voigt measurements taken at SZA >82∘ have been filtered out because they cannot be corrected for the air mass dependence. The blue boxes are XCO2 qSDV corrected for air mass dependence and scaled by 1.0041. No filter was applied to the XCO2 qSDV measurements for SZA since the air mass dependence correction works at all SZA. Figure 12e–h shows the difference between XCO2 Voigt and XCO2 qSDV for Eureka, Park Falls, Lamont and Darwin. The mean differences for the data shown in Fig. 12e to h are 0.113±0.082, , and µmol mol−1 (ppm) for Eureka, Park Falls, Lamont and Darwin respectively. The difference throughout the day at Park Falls, Lamont and Darwin varies between −0.6 and 0.2 µmol mol−1 and is SZA dependent.
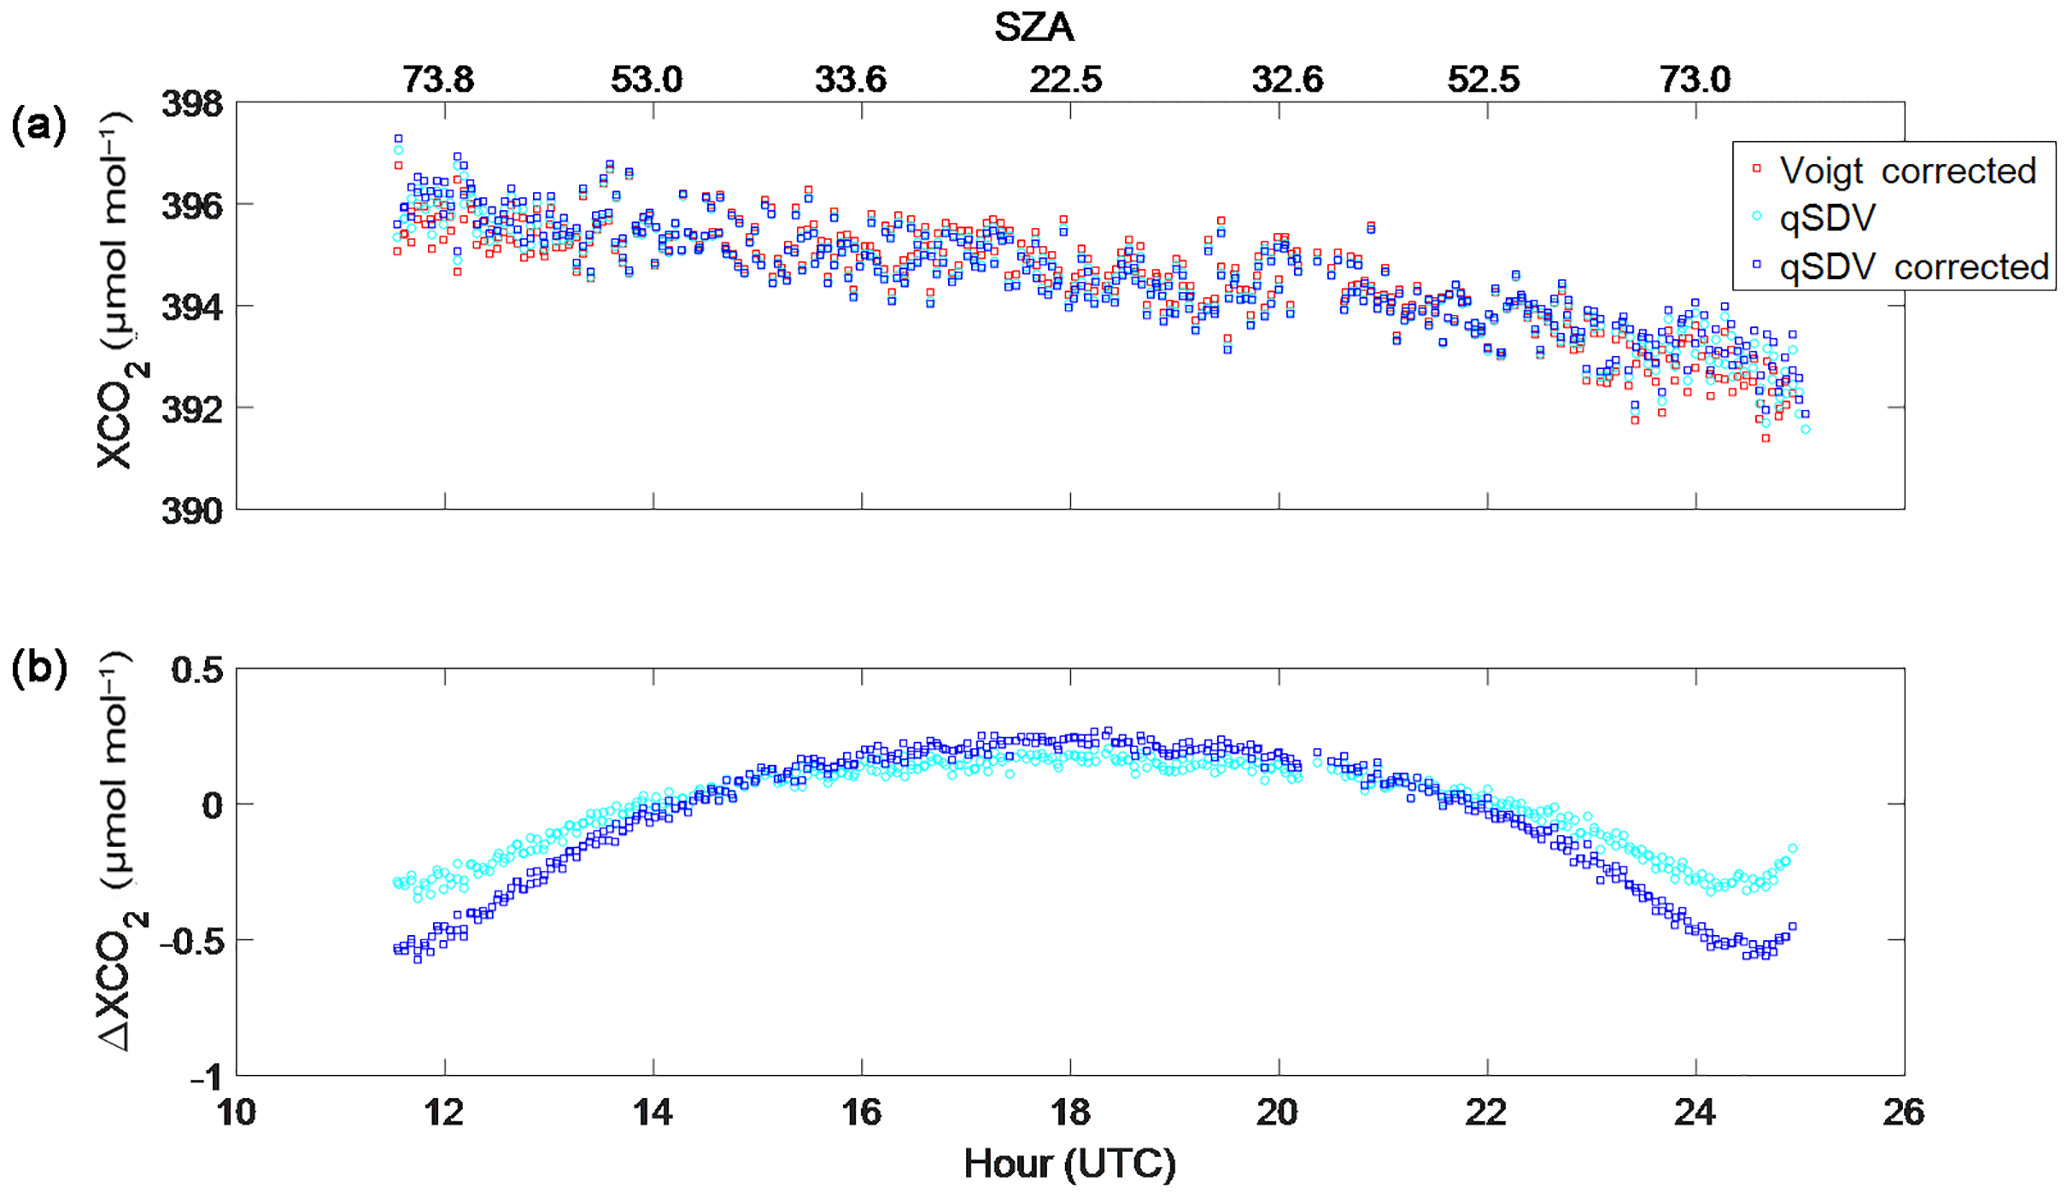
Figure 13(a) XCO2 from Park Falls retrieved from spectra recorded on 18 June 2013. Retrieved XCO2 is plotted (1) with a Voigt line shape and corrected for the air mass dependence (red squares), (2) with the qSDV (cyan circles) and (3) with the qSDV and corrected for the air mass dependence (blue squares). (b) The difference between the corrected Voigt XCO2 and the qSDV XCO2 (cyan circles) and the difference between the Voigt corrected XCO2 and the corrected qSDV XCO2 (blue squares). The top x axis is the SZA that corresponds to the hour on the bottom x axis.
Figure 13a shows XCO2 Voigt corrected for the air mass dependence, as well as XCO2 qSDV, uncorrected and corrected for the air mass dependence. These XCO2 measurements were retrieved from Park Falls spectra recorded on 18 June 2013. For all three XCO2 measurements, the amount of XCO2 decreases throughout the day. Figure 13b shows the difference between the corrected Voigt XCO2 and the uncorrected qSDV XCO2, as well as the difference between the corrected Voigt XCO2 and the corrected qSDV XCO2. The difference between the Voigt and the qSDV (corrected and uncorrected) shows that at the start and end of the day, more XCO2 is retrieved with the qSDV, while at midday less is retrieved with the qSDV. The range in the differences seen in Fig. 12e to h varies with SZA throughout the day as shown in Fig. 13b.
Using cavity ring-down spectra measured in the lab, we have shown that the Voigt line shape is insufficient to model the line shape of O2 for the 1.27 µm band, consistent with the results of Hartmann et al. (2013) and Lamouroux et al. (2014). By using the speed-dependent Voigt line shape when calculating the absorption coefficients, we were better able to reproduce the measured absorption coefficients than using the Voigt line shape. However, some residual structure remains as seen Figs. 1 and 2. This is partly due to the blending of spectral lines (i.e. line mixing) and the inability to retrieve the spectroscopic parameters for weak O2 transitions. Fitting low-pressure spectra would help with isolating spectral lines and decreasing the uncertainty on the retrieved spectroscopic parameters for the Q branch lines.
Accurate measurements of the pressure shifts in the 1.27 µm band have been hard to obtain as shown in Newman et al. (1999) and Hill et al. (2003). While the retrieved pressure shifts show a dependence on quantum number m (Fig. 3c) as one would expect, this dependence is not as strong as the m dependence of the Lorentz widths (Fig. 3b). This can be explained by the fact that line mixing, which is shown to be important for the O2 A-band, was not considered when fitting the cavity ring-down spectra. Neglecting line mixing usually produces an asymmetric residual in the discrete lines as well as a broad residual feature associated with the fact that collisions are transferring intensity from one part of the spectrum to another. By fitting a set of Legendre polynomials for CIA, we could be simultaneously fitting the broader-band feature associated with line mixing, while the retrieved pressure shifts and speed-dependent pressure shifts could be compensating for the asymmetric structure one would see in the discrete lines when neglecting line mixing. The remaining structure, as seen in Fig. 1c, could be due to neglecting line mixing, especially in the Q branch, where the spacing between spectral lines is small (in comparison to the P and R branches) and line mixing is most likely prevalent. The large error bars for the measured pressure shifts and speed-dependent pressure shifts as well as a deviation from a smooth m dependence of these parameters could be due to neglecting line mixing when fitting the lab spectra. Figure 3c and d show that the spectral lines that have large error bars and deviate from an expected m dependence belong mainly to the Q-branch spectral lines (which are mostly likely impacted by line mixing). To achieve the results obtained in this study it is best to use the parameters as they are instead of trying to apply an interpolation that depends on m or even omitting them, unless one tests these changes on atmospheric spectra that cover different range of conditions (i.e. seasons, dry/wet, SZA, geographical locations). It is evident that the parameters might be compensating for effects (such as line mixing) that were not included when fitting the lab spectra, and changing these parameters (or omitting them) could lead to degradation in the quality of the spectral fits of solar spectra and a change in the air mass dependence of the retrieved column of O2, which would impact the air mass dependence of XCO2.
The pressure dependence of the retrieved speed-dependent width parameter is an indication that Dicke narrowing needs to be taken into account, as shown by Bui et al. (2014) for CO2. When both speed dependence and Dicke narrowing are present, a multispectrum fit needs to be used due to the correlation between the parameters (Bui et al., 2014). Domysławska et al. (2016) recommend using the qSDV to model the line shape of O2 based on multiple line shape studies of the O2 B-band. In these studies, a multispectrum fit to low-pressure (0.27–5.87 kPa) cavity ring-down spectra was performed testing multiple line shapes that took speed dependence and Dicke narrowing into account both separately and simultaneously. They found that the line shapes that only used Dicke narrowing were not good enough to model the line shape of the O2 B-band lines, but a line shape that included either speed dependence or both speed dependence and Dicke narrowing produced similar quality fits, ultimately concluding that speed dependence has a larger effect than Dicke narrowing. It was noted in the study by Wójtewicz et al. (2014) that both Dicke narrowing and speed-dependent effects might simultaneously play an important role in modelling the line shape of the O2 B-band lines. However, the speed-dependent and Dicke narrowing parameters are highly correlated at low pressures. Reducing the correlation requires either a multispectrum fit of spectra at low pressures with a high enough signal-to-noise ratio or spectra that cover a wide range of pressures (Wójtewicz et al., 2014). So, by combining the high-pressure spectra used in this study with low-pressure spectra in a multispectral fit, both the speed dependence and Dicke narrowing parameters could be retrieved. The temperature dependence of the Lorentz width coefficients of this band has never been measured before, which could have an impact on the air mass dependence of O2. Combining high-pressure cavity ring-down absorption coefficient measurements with those for low pressures and different temperatures as done in Devi et al. (2015, 2016) for CH4 would lead to more accurate line shape parameters for O2.
By taking speed dependence into account for both CO2 (in the work of Mendonca et al., 2016) and O2 (the work presented here), we were able to significantly decrease the air mass dependence of TCCON XCO2 and the bias between TCCON and aircraft XCO2. XAIR calculated with the column of O2 retrieved with the qSDV is now closer to the expected value of 1, but XAIR still has an air mass dependence which is the result of the retrieved total column of O2 decreasing as a function of SZA at large SZA. This remaining air mass dependence could be due to neglecting effects such as Dicke narrowing and line mixing in the absorption coefficient calculations, as well as assuming a perfect instrument line shape in the retrieval algorithm. However, retrieving O2 with the qSDV significantly decreases the air mass dependence of XCO2. With the qSDV line shape, XCO2 measurements taken at SZA >82∘ no longer have to be discarded. We recommend using the full range of SZA, which would result in more XCO2 measurement available from all TCCON sites. This is particularly important for high-latitude TCCON sites such as Eureka because measurements taken from late February to late March and from late September to mid-October are taken at SZA >82∘. Filtering out these large SZA measurements thus limits the knowledge of the seasonal cycle of XCO2 at high latitudes. The air mass dependence of the O2 column not only affects XCO2 but all trace gases measured by TCCON and in the future the air mass dependence of all XGas will be determined with these new O2 columns.
All TCCON data are available from the TCCON data archive hosted by CaltechDATA and located at https://tccondata.org/ (last access: 19 December 2018). Site-specific data used in this work can be obtained from the links in the relevant cited references. Solar absorption spectra can be obtained by contacting the TCCON site PIs. Laboratory O2 cavity ring-down spectra can be obtained by contacting David Long at the National Institute of Standards and Technology.
The supplement related to this article is available online at: https://doi.org/10.5194/amt-12-35-2019-supplement.
The authors declare that they have no conflict of interest.
This work was primarily supported by the Canadian Space Agency (CSA) through
the GOSAT and CAFTON projects and the Natural Sciences and Engineering
Research Council of Canada (NSERC). The Eureka measurements were taken at the
Polar Environment Atmospheric Research Laboratory (PEARL) by the Canadian
Network for the Detection of Atmospheric Change (CANDAC), which has been
supported by the AIF/NSRIT, CFI, CFCAS, CSA, Environment Canada (EC),
Government of Canada IPY funding, NSERC, OIT, ORF, PCSP, and FQRNT. The
authors wish to thank the staff at EC's Eureka Weather Station and CANDAC
for the logistical and on-site support provided. Thanks to CANDAC Principal
Investigator James R. Drummond, PEARL Site Manager Pierre Fogal and
CANDAC/PEARL operators Mike Maurice and Peter McGovern for their invaluable
assistance in maintaining and operating the Bruker 125HR. The research at
the Jet Propulsion Laboratory (JPL), and California Institute of Technology
was performed under contracts and cooperative agreements with the National
Aeronautics and Space Administration (NASA). Geoffrey C. Toon and Debra Wunch
acknowledge support from NASA for the development of TCCON via grant number
NNX17AE15G. Darwin TCCON measurements are possible thanks to support from
NASA grants NAG5-12247 and NNG05-GD07G, the Australian Research Council
grants DP140101552, DP110103118, DP0879468 and LP0562346, and the DOE ARM
programme for technical support. The research at the National Institute of
Standards and Technology was performed with the support of the NIST
Greenhouse Gas Measurements and Climate Research Program. Certain commercial
equipment, instruments, or materials are identified in this paper in order
to specify the experimental procedure adequately. Such identification is not
intended to imply recommendation or endorsement by the National Institute of
Standards and Technology, nor is it intended to imply that the materials or
equipment identified are necessarily the best available for the purpose.
Edited by: Frank Hase
Reviewed by: two anonymous referees
Abrarov, S. M. and Quine, B. M.: Efficient algorithmic implementation of the Voigt/complex error function based on exponential series approximation, Appl. Math. Comput., 218, 1894–1902, https://doi.org/10.1016/j.amc.2011.06.072, 2011.
Batchelor, R. L., Strong, K., Lindenmaier, R., Mittermeier, R. L., Fast, H., Drummond, J. R., and Fogal, P. F.: A New Bruker IFS 125HR FTIR Spectrometer for the Polar Environment Atmospheric Research Laboratory at Eureka, Nunavut, Canada: Measurements and Comparison with the Existing Bomem DA8 Spectrometer, J. Atmos. Ocean. Tech., 26, 1328–1340, https://doi.org/10.1175/2009JTECHA1215.1, 2009.
Bergland, G.: A radix-eight fast Fourier transform subroutine for real-valued series, IEEE T. Acoust. Speech, 17, 138–144, https://doi.org/10.1109/TAU.1969.1162043, 1969.
Bernath, P. F., McElroy, C. T., Abrams, M. C., Boone, C. D., Butler, M., Camy-Peyret, C., Carleer, M., Clerbaux, C., Coheur, P.-F., Colin, R., DeCola, P., DeMazière, M., Drummond, J. R., Dufour, D., Evans, W. F. J., Fast, H., Fussen, D., Gilbert, K., Jennings, D. E., Llewellyn, E. J., Lowe, R. P., Mahieu, E., McConnell, J. C., McHugh, M., McLeod, S. D., Michaud, R., Midwinter, C., Nassar, R., Nichitiu, F., Nowlan, C., Rinsland, C. P., Rochon, Y. J., Rowlands, N., Semeniuk, K., Simon, P., Skelton, R., Sloan, J. J., Soucy, M.-A., Strong, K., Tremblay, P., Turnbull, D., Walker, K. A., Walkty, I., Wardle, D. A., Wehrle, V., Zander, R., and Zou, J.: Atmospheric Chemistry Experiment (ACE): Mission overview, Geophys. Res. Lett., 32, L15S01, https://doi.org/10.1029/2005GL022386, 2005.
Bui, T. Q., Long, D. A., Cygan, A., Sironneau, V. T., Hogan, D. W., Rupasinghe, P. M., Ciuryło, R., Lisak, D., and Okumura, M.: Observations of Dicke narrowing and speed dependence in air-broadened CO2 lineshapes near 2.06 µm, J. Chem. Phys., 141, 174301, https://doi.org/10.1063/1.4900502, 2014.
Cheah, S.-L., Lee, Y.-P., and Ogilvie, J. F.: Wavenumbers, strengths, widths and shifts with pressure of lines in four bands of gaseous 16O2 in the systems and , J. Quant. Spectrosc. Ra., 64, 467–482, https://doi.org/10.1016/S0022-4073(99)00126-0, 2000.
Ciuryło, R.: Shapes of pressure- and Doppler-broadened spectral lines in the core and near wings, Phys. Rev. A, 58, 1029–1039, https://doi.org/10.1103/PhysRevA.58.1029, 1998.
Crisp, D., Atlas, R. M., Breon, F.-M., Brown, L. R., Burrows, J. P., Ciais, P., Connor, B. J., Doney, S. C., Fung, I. Y., Jacob, D. J., Miller, C. E., O'Brien, D., Pawson, S., Randerson, J. T., Rayner, P., Salawitch, R. J., Sander, S. P., Sen, B., Stephens, G. L., Tans, P. P., Toon, G. C., Wennberg, P. O., Wofsy, S. C., Yung, Y. L., Kuang, Z., Chudasama, B., Sprague, G., Weiss, B., Pollock, R., Kenyon, D., and Schroll, S.: The Orbiting Carbon Observatory (OCO) mission, Adv. Space Res., 34, 700–709, https://doi.org/10.1016/j.asr.2003.08.062, 2004.
Deutscher, N. M., Griffith, D. W. T., Bryant, G. W., Wennberg, P. O., Toon, G. C., Washenfelder, R. A., Keppel-Aleks, G., Wunch, D., Yavin, Y., Allen, N. T., Blavier, J.-F., Jiménez, R., Daube, B. C., Bright, A. V., Matross, D. M., Wofsy, S. C., and Park, S.: Total column CO2 measurements at Darwin, Australia – site description and calibration against in situ aircraft profiles, Atmos. Meas. Tech., 3, 947–958, https://doi.org/10.5194/amt-3-947-2010, 2010.
Devi, V. M., Benner, D. C., Sung, K., Crawford, T. J., Yu, S., Brown, L. R., Smith, M. A. H., Mantz, A. W., Boudon, V., and Ismail, S.: Self- and air-broadened line shapes in the 2ν3 P and R branches of 12CH4, J. Mol. Spectrosc., 315, 114–136, https://doi.org/10.1016/j.jms.2015.05.003, 2015.
Devi, V. M., Benner, D. C., Sung, K., Brown, L. R., Crawford, T. J., Yu, S., Smith, M. A. H., Mantz, A. W., Boudon, V., and Ismail, S.: Spectral line parameters including line shapes in the 2ν3 Q branch of 12CH4, J. Quant. Spectrosc. Ra., 177, 152–169, https://doi.org/10.1016/j.jqsrt.2015.12.009, 2016.
Dicke, R. H.: The Effect of Collisions upon the Doppler Width of Spectral Lines, Phys. Rev., 89, 472–473, https://doi.org/10.1103/PhysRev.89.472, 1953.
Domysławska, J., Wójtewicz, S., Masłowski, P., Cygan, A., Bielska, K., Trawiński, R. S., Ciuryło, R., and Lisak, D.: A new approach to spectral line shapes of the weak oxygen transitions for atmospheric applications, J. Quant. Spectrosc. Ra., 169, 111–121, https://doi.org/10.1016/j.jqsrt.2015.10.019, 2016.
Drouin, B. J., Benner, D. C., Brown, L. R., Cich, M. J., Crawford, T. J., Devi, V. M., Guillaume, A., Hodges, J. T., Mlawer, E. J., Robichaud, D. J., Oyafuso, F., Payne, V. H., Sung, K., Wishnow, E. H., and Yu, S.: Multispectrum analysis of the oxygen A-band, J. Quant. Spectrosc. Ra., 186, 118–138, https://doi.org/10.1016/j.jqsrt.2016.03.037, 2017.
Gordon, I. E., Kassi, S., Campargue, A., and Toon, G. C.: First identification of the electric quadrupole transitions of oxygen in solar and laboratory spectra, J. Quant. Spectrosc. Ra., 111, 1174–1183, https://doi.org/10.1016/j.jqsrt.2010.01.008, 2010.
Gordon, I. E., Rothman, L. S., Hill, C., Kochanov, R. V., Tan, Y., Bernath, P. F., Birk, M., Boudon, V., Campargue, A., Chance, K. V., Drouin, B. J., Flaud, J.-M., Gamache, R. R., Hodges, J. T., Jacquemart, D., Perevalov, V. I., Perrin, A., Shine, K. P., Smith, M.-A. H., Tennyson, J., Toon, G. C., Tran, H., Tyuterev, V. G., Barbe, A., Császár, A. G., Devi, V. M., Furtenbacher, T., Harrison, J. J., Hartmann, J.-M., Jolly, A., Johnson, T. J., Karman, T., Kleiner, I., Kyuberis, A. A., Loos, J., Lyulin, O. M., Massie, S. T., Mikhailenko, S. N., Moazzen-Ahmadi, N., Müller, H. S. P., Naumenko, O. V., Nikitin, A. V., Polyansky, O. L., Rey, M., Rotger, M., Sharpe, S. W., Sung, K., Starikova, E., Tashkun, S. A., Auwera, J. V., Wagner, G., Wilzewski, J., Wcisło, P., Yu, S., and Zak, E. J.: The HITRAN2016 molecular spectroscopic database, J. Quant. Spectrosc. Ra., 203, 3–69, https://doi.org/10.1016/j.jqsrt.2017.06.038, 2017.
Griffith, D. W. T., Deutscher, N. M., Velazco, V. A., Wennberg, P. O., Yavin, Y., Keppel-Aleks, G., Washenfelder, R. A., Toon, G. C., Blavier, J.-F., Paton-Walsh, C., Jones, N. B., Kettlewell, G. C., Connor, B. J., Macatangay, R. C., Roehl, C., Ryczek, M., Glowacki, J., Culgan, T., and Bryant, G. W.: TCCON data from Darwin (AU), Release GGG2014.R0, https://doi.org/10.14291/tccon.ggg2014.darwin01.R0/1149290, 2017.
Hartmann, J.-M., Sironneau, V., Boulet, C., Svensson, T., Hodges, J. T., and Xu, C. T.: Collisional broadening and spectral shapes of absorption lines of free and nanopore-confined O2 gas, Phys. Rev. A, 87, 032510, https://doi.org/10.1103/PhysRevA.87.032510, 2013.
Hill, C., Brown, J. M., and Newnham, D. A.: An upper limit for the magnitude of pressure shifts in the O2 (0–0) band, J. Mol. Spectrosc., 221, 286–287, https://doi.org/10.1016/S0022-2852(03)00227-3, 2003.
Hodges, J. T.: Automated high-resolution frequency-stabilized cavity ring-down absorption spectrometer, Rev. Sci. Instrum., 76, 023112, https://doi.org/10.1063/1.1850633, 2005.
Hodges, J. T., Layer, H. P., Miller, W., and Scace, G. E.: Frequency-stabilized single-mode cavity ring-down apparatus for high-resolution absorption spectroscopy, Rev. Sci. Instrum., 75, 849–863, https://doi.org/10.1063/1.1666984, 2004.
Keppel-Aleks, G., Toon, G. C., Wennberg, P. O., and Deutscher, N. M.: Reducing the impact of source brightness fluctuations on spectra obtained by Fourier-transform spectrometry, Appl. Optics, 46, 4774, https://doi.org/10.1364/AO.46.004774, 2007.
Lamouroux, J., Sironneau, V., Hodges, J. T., and Hartmann, J.-M.: Isolated line shapes of molecular oxygen: Requantized classical molecular dynamics calculations versus measurements, Phys. Rev. A, 89, 042504, https://doi.org/10.1103/PhysRevA.89.042504, 2014.
Leshchishina, O., Kassi, S., Gordon, I. E., Rothman, L. S., Wang, L., and Campargue, A.: High sensitivity CRDS of the band of oxygen near 1.27 µm: Extended observations, quadrupole transitions, hot bands and minor isotopologues, J. Quant. Spectrosc. Ra., 111, 2236–2245, https://doi.org/10.1016/j.jqsrt.2010.05.014, 2010.
Leshchishina, O., Kassi, S., Gordon, I. E., Yu, S., and Campargue, A.: The band of 16O17O, 17O18O and 17O2 by high sensitivity CRDS near 1.27 µm, J. Quant. Spectrosc. Ra., 112, 1257–1265, https://doi.org/10.1016/j.jqsrt.2011.01.014, 2011.
Lévy, A., Lacome, N., and Chackerian Jr., C.: Collisional Line Mixing A2, in: Spectroscopy of the Earth's Atmosphere and Interstellar Medium, edited by: Weber, K. and RaoAlfons, N., Academic Press, San Diego, CA, 261–337, 1992.
Lin, H., Reed, Z. D., Sironneau, V. T., and Hodges, J. T. Cavity ring-down spectrometer for high-fidelity molecular absorption measurements, J. Quant. Spectrosc. Ra., 161, 11–20, https://doi.org/10.1016/j.jqsrt.2015.03.026, 2015.
Lin, J. C., Gerbig, C., Wofsy, S. C., Daube, B. C., Matross, D. M., Chow, V. Y., Gottlieb, E., Andrews, A. E., Pathmathevan, M., and Munger, J. W.: What have we learned from intensive atmospheric sampling field programmes of CO2?, Tellus B, 58, 331–343, https://doi.org/10.1111/j.1600-0889.2006.00202.x, 2006.
Long, D. A., Havey, D. K., Okumura, M., Miller, C. E., and Hodges, J. T.: O2 A-band line parameters to support atmospheric remote sensing, J. Quant. Spectrosc. Ra., 111, 2021–2036, https://doi.org/10.1016/j.jqsrt.2010.05.011, 2010.
Maté, B., Lugez, C., Fraser, G. T., and Lafferty, W. J.: Absolute intensities for the O2 1.27 µm continuum absorption, J. Geophys. Res.-Atmos., 104, 30585–30590, https://doi.org/10.1029/1999JD900824, 1999.
Mendonca, J., Strong, K., Toon, G. C., Wunch, D., Sung, K., Deutscher, N. M., Griffith, D. W. T., and Franklin, J. E.: Improving atmospheric CO2 retrievals using line mixing and speed-dependence when fitting high-resolution ground-based solar spectra, J. Mol. Spectrosc., 323, 15–27, https://doi.org/10.1016/j.jms.2016.01.007, 2016.
Mertz, L.: Auxiliary computation for Fourier spectrometry, Infrared Phys., 7, 17–23, https://doi.org/10.1016/0020-0891(67)90026-7, 1967.
Messerschmidt, J., Macatangay, R., Notholt, J., Petri, C., Warneke, T., and Weinzierl, C.: Side by side measurements of CO2 by ground-based Fourier transform spectrometry (FTS): Side By Side Measurements Of CO2 By FTS, Tellus B, 62, 749–758, https://doi.org/10.1111/j.1600-0889.2010.00491.x, 2010.
Mlawer, E. J., Clough, S. A., Brown, P. D., Stephen, T. M., Landry, J. C., Goldman, A., and Murcray, F. J.: Observed atmospheric collision-induced absorption in near-infrared oxygen bands, J. Geophys. Res.-Atmos., 103, 3859–3863, https://doi.org/10.1029/97JD03141, 1998.
Newman, S. M., Lane, I. C., Orr-Ewing, A. J., Newnham, D. A., and Ballard, J.: Integrated absorption intensity and Einstein coefficients for the O2 (0,0) transition: A comparison of cavity ringdown and high resolution Fourier transform spectroscopy with a long-path absorption cell, J. Chem. Phys., 110, 10749–10757, https://doi.org/10.1063/1.479018, 1999.
Newman, S. M., Orr-Ewing, A. J., Newnham, D. A., and Ballard, J.: Temperature and pressure dependence of line widths and integrated absorption intensities for the O2 (0,0) transition, J. Phys. Chem. A, 104, 9467–9480, 2000.
Ngo, N. H., Lisak, D., Tran, H., and Hartmann, J.-M.: An isolated line-shape model to go beyond the Voigt profile in spectroscopic databases and radiative transfer codes, J. Quant. Spectrosc. Ra., 129, 89–100, https://doi.org/10.1016/j.jqsrt.2013.05.034, 2013.
Predoi-Cross, A., Hambrook, K., Keller, R., Povey, C., Schofield, I., Hurtmans, D., Over, H., and Mellau, G. C.: Spectroscopic lineshape study of the self-perturbed oxygen A-band, J. Mol. Spectrosc., 248, 85–110, https://doi.org/10.1016/j.jms.2007.11.007, 2008.
Rohart, F., Mäder, H., and Nicolaisen, H.-W.: Speed dependence of rotational relaxation induced by foreign gas collisions: Studies on CH3F by millimeter wave coherent transients, J. Chem. Phys., 101, 6475–6486, https://doi.org/10.1063/1.468342, 1994.
Rothman, L. S., Jacquemart, D., Barbe, A., Chris Benner, D., Birk, M., Brown, L. R., Carleer, M. R., Chackerian Jr., C., Chance, K., Coudert, L. H., Dana, V., Devi, V. M., Flaud, J.-M., Gamache, R. R., Goldman, A., Hartmann, J.-M., Jucks, K. W., Maki, A. G., Mandin, J.-Y., Massie, S. T., Orphal, J., Perrin, A., Rinsland, C. P., Smith, M. A. H., Tennyson, J., Tolchenov, R. N., Toth, R. A., Vander Auwera, J., Varanasi, P., and Wagner, G.: The HITRAN 2004 molecular spectroscopic database, J. Quant. Spectrosc. Ra., 96, 139–204, https://doi.org/10.1016/j.jqsrt.2004.10.008, 2005.
Rothman, L. S., Gordon, I. E., Barbe, A., Benner, D. C., Bernath, P. F., Birk, M., Boudon, V., Brown, L. R., Campargue, A., Champion, J.-P., Chance, K., Coudert, L. H., Dana, V., Devi, V. M., Fally, S., Flaud, J.-M., Gamache, R. R., Goldman, A., Jacquemart, D., Kleiner, I., Lacome, N., Lafferty, W. J., Mandin, J.-Y., Massie, S. T., Mikhailenko, S. N., Miller, C. E., Moazzen-Ahmadi, N., Naumenko, O. V., Nikitin, A. V., Orphal, J., Perevalov, V. I., Perrin, A., Predoi-Cross, A., Rinsland, C. P., Rotger, M., Šimečková, M., Smith, M. A. H., Sung, K., Tashkun, S. A., Tennyson, J., Toth, R. A., Vandaele, A. C., and Vander Auwera, J.: The HITRAN 2008 molecular spectroscopic database, J. Quant. Spectrosc. Ra., 110, 533–572, https://doi.org/10.1016/j.jqsrt.2009.02.013, 2009.
Rothman, L. S., Gordon, I. E., Babikov, Y., Barbe, A., Chris Benner, D., Bernath, P. F., Birk, M., Bizzocchi, L., Boudon, V., Brown, L. R., Campargue, A., Chance, K., Cohen, E. A., Coudert, L. H., Devi, V. M., Drouin, B. J., Fayt, A., Flaud, J.-M., Gamache, R. R., Harrison, J. J., Hartmann, J.-M., Hill, C., Hodges, J. T., Jacquemart, D., Jolly, A., Lamouroux, J., Le Roy, R. J., Li, G., Long, D. A., Lyulin, O. M., Mackie, C. J., Massie, S. T., Mikhailenko, S., Müller, H. S. P., Naumenko, O. V., Nikitin, A. V., Orphal, J., Perevalov, V., Perrin, A., Polovtseva, E. R., Richard, C., Smith, M. A. H., Starikova, E., Sung, K., Tashkun, S., Tennyson, J., Toon, G. C., Tyuterev, V. G., and Wagner, G.: The HITRAN2012 molecular spectroscopic database, J. Quant. Spectrosc. Ra., 130, 4–50, https://doi.org/10.1016/j.jqsrt.2013.07.002, 2013a.
Shannon, I., Harris, M., McHugh, D. R., and Lewis, E. L.: Low-pressure spectral line profiles: an analysis in terms of symmetric speed-dependent Voigt profiles, J. Phys. B-At. Mol. Opt., 19, 1409, https://doi.org/10.1088/0022-3700/19/10/011, 1986.
Singh, H. B., Brune, W. H., Crawford, J. H., Jacob, D. J., and Russell, P. B.: Overview of the summer 2004 Intercontinental Chemical Transport Experiment-North America (INTEX-A), J. Geophys. Res.-Atmos., 111, D24S01, https://doi.org/10.1029/2006JD007905, 2006.
Smith, K. M. and Newnham, D. A.: Near-infrared absorption cross sections and integrated absorption intensities of molecular oxygen (O2, O2-O2, and O2-N2), J. Geophys. Res.-Atmos., 105, 7383–7396, https://doi.org/10.1029/1999JD901171, 2000.
Smith, K. M., Newnham, D. A., and Williams, R. G.: Collision-induced absorption of solar radiation in the atmosphere by molecular oxygen at 1.27 µm: Field observations and model calculations, J. Geophys. Res.-Atmos., 106, 7541–7552, https://doi.org/10.1029/2000JD900699, 2001.
Strong, K., Mendonca, J., Weaver, D., Fogal, P., Drummond, J. R., Batchelor, R., and Lindenmaier, R.: TCCON data from Eureka (CA), Release GGG2014.R1, https://doi.org/10.14291/tccon.ggg2014.eureka01.R1/1325515, 2017.
Toon, G. C.: The JPL MkIV interferometer, Opt. Photonics News, 2, 19–21, https://doi.org/10.1364/OPN.2.10.000019, 1991.
Toon, G. C.: Telluric line list for GGG2014, TCCON data archive. Carbon Dioxide Inf. Anal. Cent. Oak Ridge Natl. Lab., Oak Ridge, Tenn., USA, https://doi.org/10.14291/tccon.ggg2014.atm.R0/1221656, 2014a.
Toon, G. C.: Solar line list for GGG2014. TCCON Data Arch. Hosted Carbon Dioxide Inf. Anal. Cent. Oak Ridge Natl. Lab., Oak Ridge, Tenn., USA, https://doi.org/10.14291/TCCON.GGG2014.SOLAR.R0/1221658, 2014b.
Tran, H. and Hartmann, J.-M.: An improved O2 A band absorption model and its consequences for retrievals of photon paths and surface pressures, J. Geophys. Res.-Atmos., 113, D18104, https://doi.org/10.1029/2008JD010011, 2008.
Tran, H., Boulet, C., and Hartmann, J.-M.: Line mixing and collision-induced absorption by oxygen in the A band: Laboratory measurements, model, and tools for atmospheric spectra computations, J. Geophys. Res.-Atmos., 111, D15210, https://doi.org/10.1029/2005JD006869, 2006.
Tran, H., Ngo, N. H., and Hartmann, J.-M.: Efficient computation of some speed-dependent isolated line profiles, J. Quant. Spectrosc. Ra., 129, 199–203, https://doi.org/10.1016/j.jqsrt.2013.06.015, 2013.
Wallace, L. and Livingston, W.: Spectroscopic observations of atmospheric trace gases over Kitt Peak. I – Carbon dioxide and methane from 1979 to 1985, J. Geophys. Res., 95, 9823–9827, https://doi.org/10.1029/JD095iD07p09823, 1990.
Washenfelder, R. A., Toon, G. C., Blavier, J.-F., Yang, Z., Allen, N. T., Wennberg, P. O., Vay, S. A., Matross, D. M., and Daube, B. C.: Carbon dioxide column abundances at the Wisconsin Tall Tower site, J. Geophys. Res.-Atmos., 111, D22305, https://doi.org/10.1029/2006JD007154, 2006a.
Wehr, R. A.: Dicke-narrowed spectral lines in carbon monoxide buffered by argon, PhD thesis, University of Toronto, Canada, 2005.
Wennberg, P. O., Roehl, C. M., Wunch, D., Toon, G. C., Blavier, J.-F., Washenfelder, R., Keppel-Aleks, G., Allen, N. T., and Ayers, J.: TCCON data from Park Falls (US), Release GGG2014.R0, https://doi.org/10.14291/tccon.ggg2014.parkfalls01.R0/1149161, 2017a.
Wennberg, P. O., Wunch, D., Roehl, C. M., Blavier, J.-F., Toon, G. C., Allen, N. T., Dowell, P., Teske, K., Martin, C., and Martin, J.: TCCON data from Lamont (US), Release GGG2014.R0, https://doi.org/10.14291/tccon.ggg2014.lamont01.R0/1149159, 2017b.
Wofsy, S. C.: HIAPER Pole-to-Pole Observations (HIPPO): fine-grained, global-scale measurements of climatically important atmospheric gases and aerosols, Philos. T. Roy. Soc. A, 369, 2073–2086, https://doi.org/10.1098/rsta.2010.0313, 2011.
Wójtewicz, S., Cygan, A., Masłowski, P., Domysławska, J., Lisak, D., Trawiński, R. S., and Ciuryło, R.: Spectral line shapes of self-broadened P-branch transitions of oxygen B band, J. Quant. Spectrosc. Ra., 144, 36–48, https://doi.org/10.1016/j.jqsrt.2014.03.029, 2014.
Wunch, D., Toon, G. C., Wennberg, P. O., Wofsy, S. C., Stephens, B. B., Fischer, M. L., Uchino, O., Abshire, J. B., Bernath, P., Biraud, S. C., Blavier, J.-F. L., Boone, C., Bowman, K. P., Browell, E. V., Campos, T., Connor, B. J., Daube, B. C., Deutscher, N. M., Diao, M., Elkins, J. W., Gerbig, C., Gottlieb, E., Griffith, D. W. T., Hurst, D. F., Jiménez, R., Keppel-Aleks, G., Kort, E. A., Macatangay, R., Machida, T., Matsueda, H., Moore, F., Morino, I., Park, S., Robinson, J., Roehl, C. M., Sawa, Y., Sherlock, V., Sweeney, C., Tanaka, T., and Zondlo, M. A.: Calibration of the Total Carbon Column Observing Network using aircraft profile data, Atmos. Meas. Tech., 3, 1351–1362, https://doi.org/10.5194/amt-3-1351-2010, 2010.
Wunch, D., Toon, G. C., Blavier, J.-F. L., Washenfelder, R. A., Notholt, J., Connor, B. J., Griffith, D. W. T., Sherlock, V., and Wennberg, P. O.: The Total Carbon Column Observing Network, Philos. T. Roy. Soc. A, 369, 2087–2112, https://doi.org/10.1098/rsta.2010.0240, 2011.
Wunch, D., Toon, G. C., Sherlock, V., Deutscher, N. M., Liu, C., Feist, D. G., and Wennberg, P. O.: The Total Carbon Column Observing Network's GGG2014 Data Version, https://doi.org/10.14291/tccon.ggg2014.documentation.R0/1221662, 2015.
Yang, Z., Toon, G. C., Margolis, J. S., and Wennberg, P. O.: Atmospheric CO2 retrieved from ground-based near IR solar spectra, Geophys. Res. Lett., 29, 1339, https://doi.org/10.1029/2001GL014537, 2002.
Yokota, T., Yoshida, Y., Eguchi, N., Ota, Y., Tanaka, T., Watanabe, H., and Maksyutov, S.: Global Concentrations of CO2 and CH4 Retrieved from GOSAT: First Preliminary Results, Sola, 5, 160–163, https://doi.org/10.2151/sola.2009-041, 2009.
Yu, S., Drouin, B. J., and Miller, C. E.: High resolution spectral analysis of oxygen. IV. Energy levels, partition sums, band constants, RKR potentials, Franck-Condon factors involving the , a1Δg and states, J. Chem. Phys., 141, 174302, https://doi.org/10.1063/1.4900510, 2014.