the Creative Commons Attribution 4.0 License.
the Creative Commons Attribution 4.0 License.
 | 26 Jul 2019
Investigations into the development of a satellite-based aerosol climate data record using ATSR-2, AATSR and AVHRR data over north-eastern China from 1987 to 2012
Yahui Che
Jie Guang
Ling Sun
Huizheng Che
Satellites provide information on the temporal and spatial distributions of aerosols on regional and global scales. With the same method applied to a single sensor all over the world, a consistent data set is to be expected. However, the application of different retrieval algorithms to the same sensor and the use of a series of different sensors may lead to substantial differences, and no single sensor or algorithm is better than any other everywhere and at all times. For the production of long-term climate data records, the use of multiple sensors cannot be avoided. The Along Track Scanning Radiometer (ATSR-2) and the Advanced ATSR (AATSR) aerosol optical depth (AOD) data sets have been used to provide a global AOD data record over land and ocean of 17 years (1995–2012), which is planned to be extended with AOD retrieved from a similar sensor. To investigate the possibility of extending the ATSR data record to earlier years, the use of an AOD data set from the Advanced Very High Resolution Radiometer (AVHRR) is investigated. AOD data sets used in this study were retrieved from the ATSR sensors using the ATSR Dual View algorithm ADV version 2.31, developed by Finnish Meteorological Institute (FMI), and from the AVHRR sensors using the aerosol optical depth over land (ADL) algorithm developed by RADI/CAS. Together, these data sets cover a multi-decadal period (1987–2012). The study area includes two contrasting areas, both in regards to aerosol content and composition and surface properties, i.e. a region over north-eastern China, encompassing a highly populated urban/industrialized area (Beijing–Tianjin–Hebei) and a sparsely populated mountainous area.
Ground-based AOD observations available from ground-based sun photometer AOD data in AERONET and CARSNET are used as a reference, together with broadband extinction method (BEM) data at Beijing to cover the time before sun photometer observations became available in the early 2000s. In addition, MODIS-Terra C6.1 AOD data are used as a reference data set over the wide area where no ground-based data are available. All satellite data over the study area were validated against the reference data, showing the qualification of MODIS for comparison with ATSR and AVHRR. The comparison with MODIS shows that AVHRR performs better than ATSR in the north of the study area (40∘ N), whereas further south ATSR provides better results. The validation against sun photometer AOD shows that both AVHRR and ATSR underestimate the AOD, with ATSR failing to provide reliable results in the wintertime. This is likely due to the highly reflecting surface in the dry season, when AVHRR-retrieved AOD traces both MODIS and reference AOD data well. However, AVHRR does not provide AOD larger than about 0.6 and hence is not reliable when high AOD values have been observed over the last decade. In these cases, ATSR performs much better for AOD up to about 1.3. AVHRR-retrieved AOD compares favourably with BEM AOD, except for AOD higher than about 0.6. These comparisons lead to the conclusion that AVHRR and ATSR AOD data records each have their strengths and weaknesses that need to be accounted for when combining them in a single multi-decadal climate data record.


Aerosol particles are important atmospheric constituents that play significant roles in many processes, such as atmospheric chemistry, the absorption and scattering of solar radiation, and the lifetime of cloud and precipitation systems (Boucher et al., 2013; Koren et al., 2014; Guo et al., 2014, 2016a, 2018). Aerosol particles have an adverse effect on human health and are responsible for 7 million premature deaths annually across the whole world (WHO, 2018). Processes involving aerosols and their effects depend on the chemical and physical properties of the aerosol particles, which in turn are determined by sources of directly emitted particles, the formation of aerosols from precursor gases (and thus the sources of these gases), the transformation of these particles during chemical and physical processes in the atmosphere, and their removal by wet or dry deposition (see Seinfeld et al., 1998, for a comprehensive treatment of aerosol processes). Observations of the concentrations of trace gases and aerosols are publicly available, as several observational networks have been established, such as NASA's AERONET (AErosol RObotic NETwork; Holben et al., 1998), with observations mainly in the east of China, CARE-China (Xin et al., 2015), the Chinese Aerosol Remote Sensing Network (CARSNET; Che et al., 2009, 2015) and SONET (Sun-sky radiometer Observation NETwork; Li et al., 2018). However, most of these observations started in the last decade and very few, if any, historical data on a large scale are available for the construction of the long time series needed to show the evolution of pollutant concentrations over many years and analyse the effects of different contributions. Here, satellite data may offer a solution. The most common satellites used for the observation of trace gases and aerosols offer information since the beginning of the 21st century and, by combining the information from different instruments, time series encompassing 2 decades can be constructed (de Leeuw et al., 2018; Sogacheva et al., 2018b). Satellite information has been used together with model simulations to analyse the effects of natural and anthropogenic contributions on the concentrations of trace gases and aerosols (Kang et al., 2018). In another study combining satellite data with ground-based observations, the role of precursor gases (volatile organic compounds, VOCs, in particular) and photochemical reactions in the formation of aerosols (PM2.5) were revealed (Bai et al., 2018).
In the second half of the 20th century, the adverse effects of the precursor gases like SO2 and NO2 and aerosols on climate, air quality, and health were recognised and reduced by effective measures in developed countries. These led to the reduction of air pollution in developed countries, in particular in North America and Europe (Guerreiro et al., 2014), but in developing countries with increasing industrial activity and urbanisation the concentrations continued to increase (Hao et al., 2000). As an example, in China the concentrations of pollutants have increased over the years and are amongst the highest in the world. Recent publications show the effect of policy measures on the reduction of the most polluting trace gases SO2 and NO2 (van der A et al., 2017), which, as precursor gases, also affect the concentrations of aerosols. In particular, the emissions of SO2 were reduced as part of the 11th Five-Year Plan (2006–2010) (Zheng et al., 2018), but the emissions of NO2 continued to increase (e.g. van der A et al., 2017) until the 12th Five-Year Plan (2011–2015). Large emission reductions were achieved after 2013 when the Clean Air Action was enacted and implemented and the NO2 concentrations decreased (Zheng et al., 2018). Starting from 2011, aerosol concentrations decreased in China as shown, e.g. from satellite observations of the aerosol optical depth (AOD) (Zhang et al., 2017; Zhao et al., 2017; de Leeuw et al., 2018; Sogacheva et al., 2018b). However, early policies before 2005 for reducing pollution emissions were not effective, as shown from sparse ground-based observations (Jin et al., 2016). Long-term satellite retrievals may offer a solution on a large spatial scale to observe how air pollution control policies work and air pollution changes.
The Along Track Scanning Radiometer (ATSR-2), a dual-view instrument, was launched in 1995 on the European Space Agency (ESA) satellite ERS-2, provided data until 2003 and was one of the earliest satellite instruments used to retrieve AOD quantitatively (Flowerdew and Haigh, 1996; Veefkind et al., 1998). Its successor, the Advanced ATSR (AATSR) is a similar instrument launched in 2002 on the ESA platform ENVISAT, which was lost in April 2012. The AOD over China from ATSR-2 and AATSR is consistent (Sogacheva et al., 2018a), and hence, together these instruments provide a 17-year AOD time series from 1995 to 2012 (Popp et al., 2016; de Leeuw et al., 2018). Combining ATSR and MODIS, 22-year AOD measurements were constructed, showing how the AOD increased until about 2006 and then clearly decreased since 2011 over China (de Leeuw et al., 2018; Sogacheva et al., 2018b). However, this time series should be extended, especially to before the 1990s when great changes took place regarding aerosols in China with the increase in industrialisation. The Advanced Very High Resolution Radiometer (AVHRR) on board the NOAA satellite series could be a good choice for extending the ATSR time series as it has made observations continuously from 1978 to the present. Xue et al. (2017) developed an AOD data set encompassing two relatively small areas over Europe and China from 1983 to 2014 that covers the complete period, as opposed to the AVHRR global over-land AOD data set recently presented by Hsu et al. (2017) and Sayer et al. (2017), which encompasses several distinct time periods. Hence, in this study we focus here on the Xue et al. (2017) AVHRR AOD data set over China and compare that with ATSR-derived AOD data to determine its suitability for merging (as has been done for ATSR and MODIS by Sogacheva et al., 2018b). Then, the merged data set could extend ATSR data set before the ATSR-2 era and possibly after AATSR was lost in 2012, although other data sets may be more suitable for extending it to later years, as shown in Sogacheva et al. (2018b) for MODIS. So the focus of the current study is to investigate whether the ATSR AOD data set can be extended to earlier years by using the Xue et al. (2017) AVHRR AOD data over China. To make a comparison between the ATSR and AVHRR AOD data sets, we use both ground-based reference data from AERONET (Holben et al., 1998) and CARSNET (Che et al., 2009, 2015) and MODIS C6.1 AOD data. These reference data are not available for the period before 2000, and therefore we also use AOD data derived from broadband radiation measurements using the broadband extinction method (BEM) (Xu et al., 2015; Guo et al., 2016b), as described in Sect. 2.3.3. Data sets and methods used are presented in Sect. 2. An overview of the data and an evaluation of its quality are presented in Sect. 3, including a comparison of the various data sets. The results are discussed and conclusions are presented in Sect. 4.
2.1 Study area
The study area is located over north-eastern China, i.e. between 35 and 45 ∘ N and 110 and 120∘ E (Fig. 1), which is divided into two subregions by the Taihang Mountains, with the North China Plain (NCP) and large urban agglomerations like Beijing and Tianjin and Hebei province (BTH, which is among the highest-populated and fastest-developing regions in China) to the south-east and mountainous terrain to the north-west extending over the Loess Plateau in Shanxi Province and the Inner Mongolian plateau. The Taihang Mountains form a natural barrier for the transport of air pollution, resulting in the frequent accumulation of pollutants and the occurrence of haze over the BTH area and the NCP (e.g. Sundström et al., 2012; Wang et al., 2013). The satellite-derived AOD maps in Fig. 2 show that this line also roughly divides high AOD in the south-east of the study area and low AOD in the north-west. The background in Fig. 1 is a land cover map showing that the major land cover types in the study area are cropland in the south-east and grassland to the north-west, which are intersected by mixed forest and closed shrublands, as shown in the inset in Fig. 1.
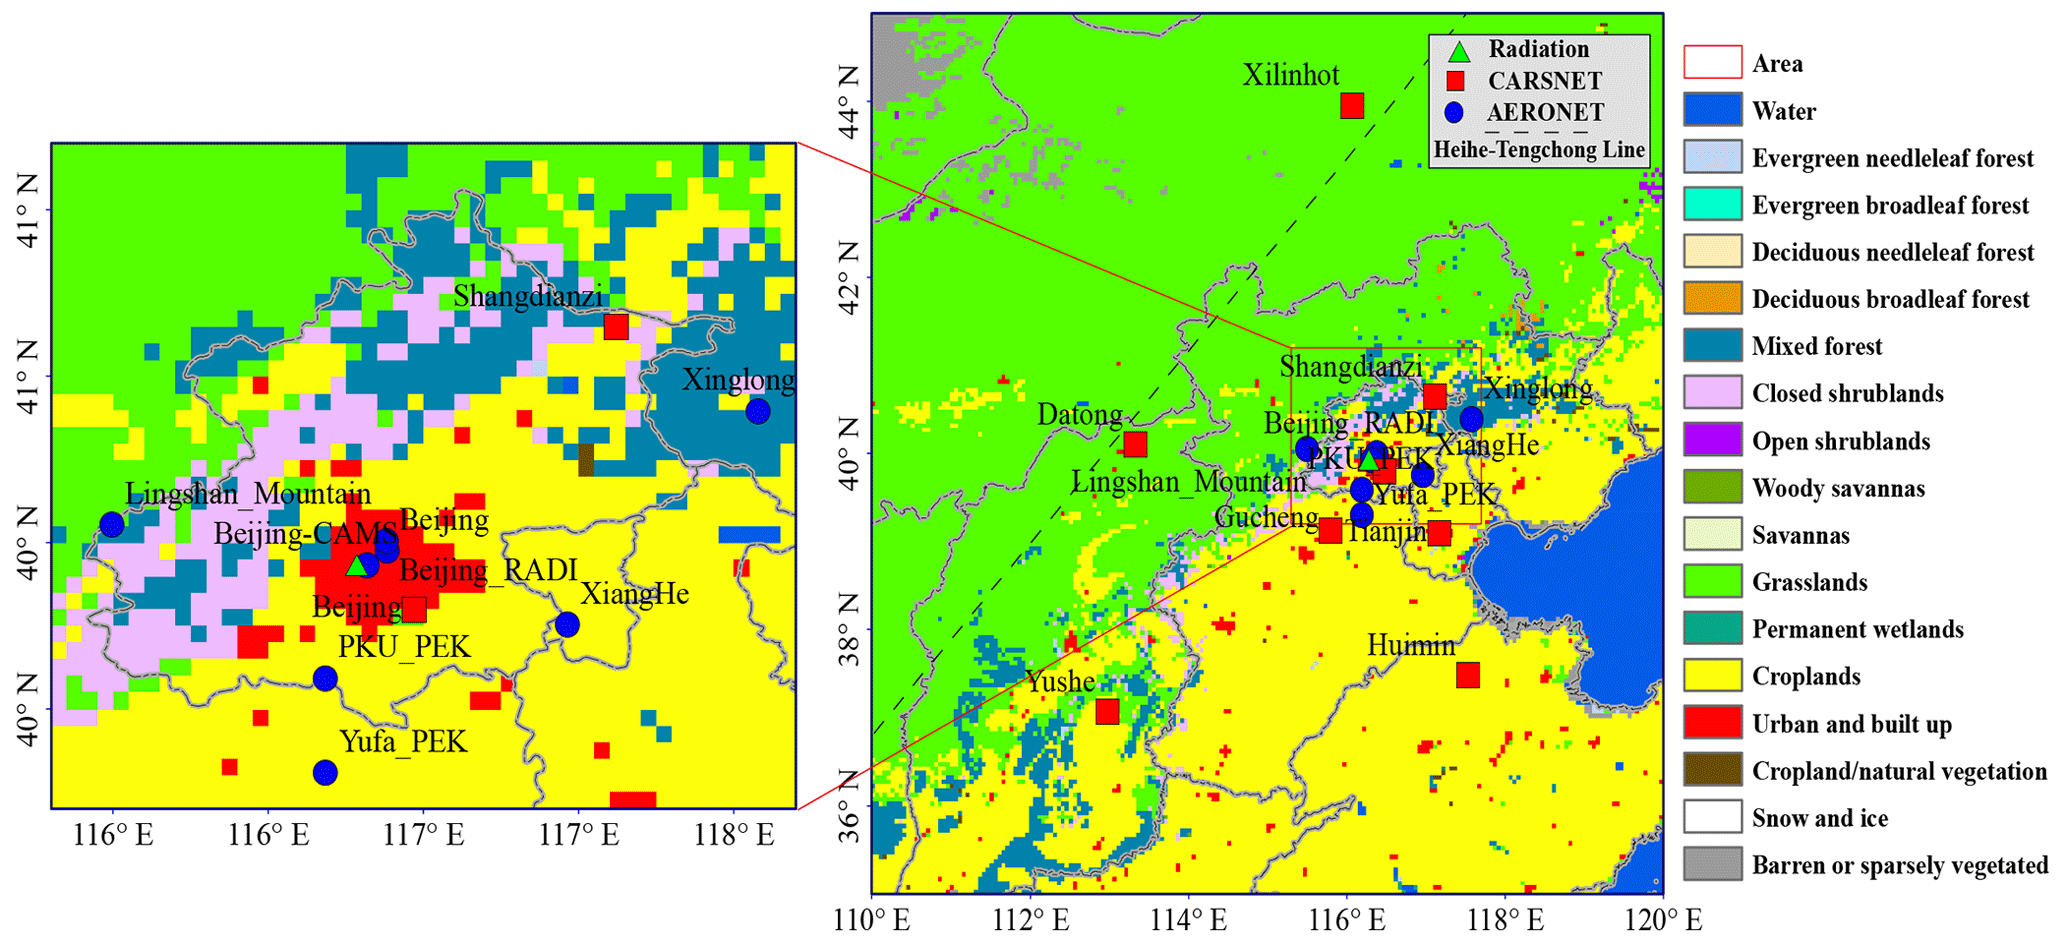
Figure 1Study area, with the locations of the ground-based reference sites discussed in Sect. 2.3 (CARSNET: red squares; AERONET: blue circles; solar radiation station: green triangle) overlaid on the IGBP land cover map.
2.2 Satellite data
The satellite-retrieved data sets used in this study are satellite-derived AOD data from six radiometers, i.e. AVHRR-1, AVHRR-2, AVHRR-3, ATSR-2, AATSR and MODIS. These data sets are briefly discussed below.
2.2.1 AVHRR
The AVHRR instruments flew on a series of satellites, most of them with an afternoon Equator crossing time at 13:40 LT (ascending) (see Xue et al., 2017, for an overview). AVHRR has a swath width of 2399 km at 833 km altitude (Robel and Graumann, 2014) and thus provides daily global coverage. The AVHRR sensor was designed for measuring cloud cover and surface temperature, but the observations are also used for the retrieval of AOD over ocean (e.g. Zhao et al., 2008), with only a few efforts to retrieve the AOD over land. Several AOD retrieval algorithms applied to AVHRR observations over land were published, including Hauser et al. (2005), Li et al. (2013), Mei et al. (2014), Xue et al. (2017), Sayer et al. (2017), Hsu et al. (2017), and Gao et al. (2018). Xue et al. (2017) used the algorithm for the retrieval of the aerosol optical depth over land (ADL), which was used to produce the continuous data set over China used in the current study. The use of AVHRR data for aerosol retrieval requires a recalibration of the radiances measured at the top of the atmosphere (TOA) because the sensors have no in-flight calibration. Xue et al. (2017) describe how this was achieved. Major problems in the retrieval of AOD from satellite observations are the effective decoupling of atmospheric and surface effects on the reflectance measured at the TOA, cloud detection, and the description of the aerosol properties. In the ADL algorithm a cloud mask is applied based on the clouds from AVHRR (CLAVR, Stowe et al., 1991, 1999), and in the retrieval six aerosol types are used as proposed by Govaerts (2010). For cloud-free pixels, and after application of gas absorption corrections as described in Xue et al. (2017), the land surface reflectance in the AVHRR channel 1 (0.64 µm) is parameterised in terms of the measured reflectance in channel 3 (3.75 µm), with coefficients which are functions of the NDVI and scattering angle. The aerosol extinction at 3.75 µm is assumed to be negligible (which may not be true in the presence of coarse aerosol particles such as desert dust). It is noted that the TOA reflectance at 3.75 µm is composed of solar radiation reflected by the land–atmosphere system and Earth radiation. The reflected part is estimated by using the method proposed by Allen et al. (1990). For each land cover type, as determined following the International Geosphere-Biosphere Programme (IGBP) land cover classification, a different parameterisation of the 0.64 µm reflectance was developed. The IGBP land cover information used is the MODIS Land Cover Climate Modeling Grid (CMG) (MCD12C1) Version 5 product obtained from https://lpdaac.usgs.gov/products/mcd12c1v006/ (last access: 13 July 2019), described in the MOD12 product Algorithm Theoretical Basis Documents (ATBD; https://modis.gsfc.nasa.gov/data/atbd/atbd_mod12.pdf, last access: 13 July 2019).
In the implementation of the ADL algorithm, the land surface reflectance is coupled to a radiative transfer model that includes individual parameterisations of the direct, single-scattered and multiple-scattered radiances. Thus, a model is developed for the TOA reflectance that is solved by optimal estimation. For more details, see Xue et al. (2017). AOD is retrieved at a wavelength of 0.64 µm at a spatial resolution of . In this study, AOD retrieved from NOAA-10 (1987–1991), NOAA-12 (1992–1998), NOAA-15 (1999–2002), NOAA-17 (2003–2009) and MetOp-A (2010–2014) is used. The AVHRR data from 1983 to 1986 are not used because only January to May in 1983, May to July in 1984, July to October in 1985, and November to December in 1986 are available, which is not consistent enough for this purpose.
2.2.2 ATSR (ATSR-2 and AATSR)
Two along-track scanning radiometers (together referred to as ATSR) are used in this study: the ATSR-2, which flew on ESA's ERS-2 from 1995 to 2003, and the Advanced ATSR (AATSR), which flew on ESA's environmental satellite ENVISAT and provided data from May 2002 until April 2012. Both satellites flew in a sun-synchronous descending orbit with a daytime Equator crossing time of 10:30 LT (ERS-2) and 10:00 LT (ENVISAT). Together these instruments provided 17 years of global aerosol data. The ATSR sensor has two views (near-nadir and 55∘ forward from nadir), which facilitate effective separation of the surface and atmospheric contributions to the reflectance at the TOA. Multiple wavelengths (seven) from the visible (VIS) to the thermal infrared (TIR) facilitate effective cloud screening and allow for multi-wavelength retrieval of aerosol properties. ATSR has a conical scan mechanism with a swath of 512 km, resulting in daily global coverage in 5 to 6 d.
The ATSR Dual View algorithm was first applied for AOD retrieval over land by Veefkind et al. (1998), based on the principles outlined by Flowerdew and Haigh (1995). Over ocean the two views are used separately to retrieve the AOD in both the nadir and forward directions. The ATSR Dual View algorithm (ADV) has been much improved during algorithm experiments (Holzer-Popp et al., 2013) as part of the ESA Climate Change Initiative (CCI) (Hollmann et al., 2013) project Aerosol_cci (de Leeuw et al., 2015; Popp et al., 2016). The most recent version of the ATSR Dual View algorithm ADV is described in Kolmonen et al. (2016). ATSR level 1.0 (L1) gridded brightness temperature data are provided with a nominal resolution of 1×1 km2 sub-nadir and aerosol data are provided at a default spatial resolution of 10×10 km2 on a sinusoidal grid (level 2.0, L2) and at (L3).
The ATSR product used in this paper is the AOD at a wavelength of 550 nm over the study area for the full ATSR mission. The data were produced using ADV version 2.31, which includes cloud post-processing, as described in Sogacheva et al. (2017). ATSR-2-retrieved AOD data are available for the period June 1995–December 2003, with some gaps in 1995 and 1996. AATSR data are available for the period May 2002–April 2012, but some data are missing in 2002 (see de Leeuw et al., 2018, for more details).
2.2.3 MODIS
The MODerate resolution Imaging Spectroradiometer (MODIS) is aboard the NASA Terra and Aqua satellites, which were launched in December 1999 and May 2002, respectively, in a near-polar sun-synchronous circular orbit with an Equator crossing time of 10:30 and 13:30 (LT), respectively (Salomonson et al., 1989). MODIS is a single-view instrument with a swath of 2330 km (cross track) and provides near-global coverage on a daily basis. One of the most successful products of MODIS, which has been used in numerous aerosol-related studies, is the AOD at 550 nm.
MODIS AOD is retrieved using two separate algorithms, Dark Target (DT) and Deep Blue (DB). In fact, two different DT algorithms are utilised, one for retrieval over land (vegetated and dark-soiled) surfaces (Kaufman et al., 1997; Remer et al., 2005; Levy et al., 2010, 2013) and one for retrieval over water surfaces (Tanré et al., 1997; Remer et al., 2005; Levy et al., 2013). The DB algorithm (Hsu et al., 2004, 2013) was traditionally used over bright surfaces where DT cannot be used (e.g. deserts, arid and semi-arid areas). However, the enhanced DB algorithm is capable of returning aerosol measurements over all land types (Sayer et al., 2013, 2014). The DT expected error (EE) is over land and , over sea relative to the AERONET optical thickness (τAERONET) (Levy et al., 2013). The DB expected error is relative to the MODIS AOD (τMODIS) (Hsu et al., 2013; Sayer et al., 2015). In this study the recently released (end of 2017) MODIS/Terra merged C6.1 L2 (10×10 km2) AOD data set is used because of the proximity of the MODIS/Terra and AVHRR overpasses. The merged (DT and DB) data set is described by Levy et al. (2013) and includes measurements from both algorithms, offers a better spatial coverage and can be used in quantitative scientific applications (Sayer et al., 2014). This merged data set was validated over China using AERONET data, showing the good performance for all retrieved AOD values up to 2.4, with a small overall bias of 0.06 (Sogacheva et al., 2018a).
2.3 Ground-based reference data
Ground-based reference data used in this study are sun photometers from AERONET (Holben et al., 1998) and CARSNET (Che et al., 2015) available in the study area (see Fig. 1), complemented with broadband extinction method (BEM) AOD data in Beijing for the period when no sun photometer data are available. The eight AERONET sites in the study area are all located in, or close to, Beijing. Three of them (Beijing, Beijing_RADI and PKU_PEK) are located in the city, the others are located in rural areas in the vicinity of Beijing. The eight CARSNET sites are distributed over a wider area extending beyond BTH, with two of them (Xilinhot and Datong) located to the north-west of the Heihe–Tengchong line: Huimin in the NCP and Yushe in a rural area surrounded by mountains. The other four (Lingshan_Mountain, XiangHe, Xinglong and Yufa_PEK) are in and around Beijing. The solar radiation station is located in Beijing, close to three AERONET sites (Beijing, Beijing_RADI and Beijing_CMA).
The AERONET, CARSNET and radiation-derived AOD data sets are briefly described below.
2.3.1 AERONET
The AERONET project is a federation of ground-based remote-sensing aerosol networks established by the National Aeronautics and Space Administration (NASA) in the USA and PHOtométrie pour le Traitement Opérationnel de Normalisation Satellitaire (PHOTONS) in France. AERONET was expanded with other networks and national efforts; see the AERONET website (https://aeronet.gsfc.nasa.gov/, last access: 13 July 2019) for a description of contributors, sites, operational procedures, data products and availability. AERONET serves as the primary network for global validation of satellite-retrieved aerosol products, including AOD, which is what is used in this study. AOD at all AERONET stations is measured using CIMEL sun photometers. Most common are the CIMEL CE-318 models with five wavelengths (440, 670, 870, 936 and 1020 nm) or polarised models with eight wavelengths, which measure direct sun at many angles as well, using different scan patterns that provide the data necessary to retrieve a multitude of aerosol properties. Data checking and processing is done centrally and the products are freely available from the AERONET website. Data are made available at three levels, i.e. level 1.0 (unscreened data), level 1.5 (cloud-screened data) and level 2.0 (cloud-screened and quality-assured data). The uncertainty of the CIMEL-derived AOD is 0.01–0.02 (wavelength-dependent AOD) (Eck et al., 1999). In this study we use AERONET L2 data from the most recent version 3.0 data set for validation and comparison (Giles et al., 2019). Satellite AOD data are commonly made available at 550 nm, and hence, for validation, the AERONET data are interpolated to this wavelength by using the Ångström Exponent (AE), which describes the AOD wavelength dependence (Ångström, 1924).
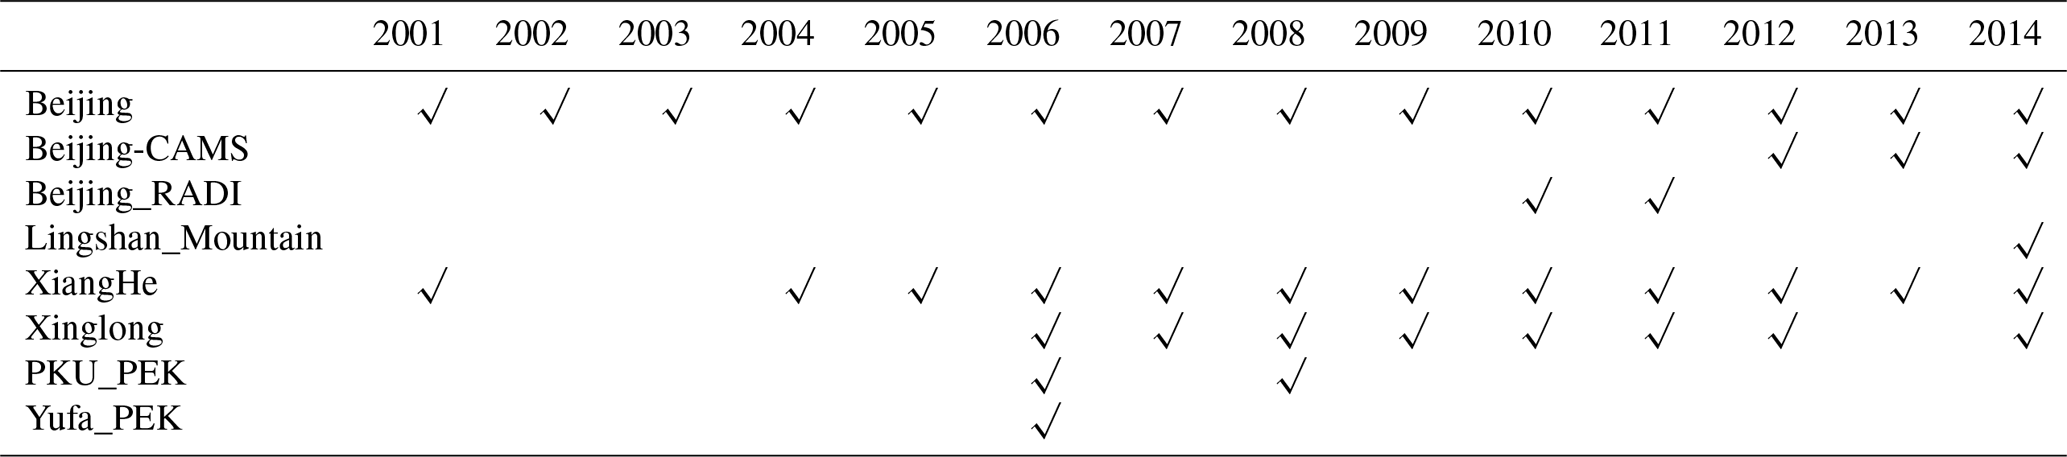
Almost all AERONET sites in the study area started observations after 2000, as shown in Table 1. Long-time and continuous measurements from 2001 to 2014 are only available from the Beijing and XiangHe stations. Therefore, we selected these stations for comparison with satellite time series, but for validation all available data are used.
Table 1Data availability from AERONET sites in the study area (35–45∘ N, 110–120∘ E).
2.3.2 CARSNET
AERONET sites in the study area are all located in or around Beijing (see Fig. 1). To expand the reference data set to other regions, AOD data from CARSNET (Che et al., 2015) were used, but only data for the years 2007, 2008 and 2010 were available for this study. The locations of the CARSNET sites in the study area are indicated in Fig. 1. CARSNET was established by the China Meteorological Administration (CMA) for the study of aerosol optical properties and validation of satellite retrievals, using the same instrumentation as AERONET (i.e. CIMEL CE-318) and similar procedures (Che et al., 2015). The difference is the way that the instrument is calibrated and the AOD is calculated, as described in Che et al. (2009). The CARSNET AOD uncertainties are 0.03, 0.01, 0.01 and 0.01 at the 1020, 870, 670 and 440 nm channels, respectively (Che et al., 2009).
2.3.3 Broadband extinction method (BEM) AOD data
Broadband solar radiation has been measured in China by the China Meteorological Administration (CMA) since the 1950s at 98 sites (Qiu, 1998), which evolved into the China national solar radiation network with 14 stations (Xu et al., 2015) providing continuous data since 1993 using pyrheliometers that are made in China. Methods were developed to retrieve monochromatic or equivalent AOD using hourly accumulated direct solar radiation, and the results of these BEM AOD are in good agreement with sun photometer data (see Xu et al., 2015 for an overview). In the current study we used BEM AOD at 550 nm retrieved from the pyrheliometer measurements at the Beijing station (Fig. 1) of the China national solar radiation network. These data are particularly useful for evaluation of the AVHRR-retrieved AOD for the period before 2000 when no sun photometer data were available. The AOD was retrieved using BEM described by Xu et al. (2015). Xu et al. (2015) evaluate the quality of the BEM AOD (at 750 nm) for the Beijing station from comparison with AERONET AOD. The results show that 59 % of the hourly AOD data fall within an error envelope of . For monthly averaged data this is 82 %. Guo et al. (2016b) used the hourly mean BEM AOD at 550 nm to evaluate the products from MODIS, OMI and MISR, obtaining consistent results with previous validations based on sun photometer measurements, which proved the effectiveness of the BEM AOD in satellite product validation.
3.1 Data overview
The aim of the present study is to determine the compatibility of AVHRR and ATSR AOD data sets and their suitability for combined to extend the ATSR time series to the 1980s. AVHRR AOD data are available over the study area from the ADL algorithm for the years 1983–2014 (Xue et al., 2017) and from ATSR-2 and AATSR using the ADV algorithm for the years 1995–2003 (ATSR-2) and 2002–2012 (AATSR), with some gaps as described in de Leeuw et al. (2018). The consistency between ATSR-2 and AATSR AOD is addressed in Sogacheva et al. (2018a), who show that no systematic differences occur over China. In the current work we also use MODIS/Terra C6.1 merged DBDT AOD for comparison. The validation of this data set over China by Sogacheva et al. (2018a), using all available AERONET stations, shows its good quality, with a positive bias (0.06) with respect to AERONET AOD. As an example, AOD maps over the study area are shown in Fig. 2, seasonally aggregated for the full years 2000–2011 when data from all three sensors and algorithms are available: AATSR (ADV version 2.31, L2, resolution 10×10 km2), AVHRR (ADL, resolution ) and MODIS C6.1 merged DBDT (L2, resolution 10×10 km2).
Figure 2 shows the similar AOD patterns derived from the three sensors and algorithms, with high AOD in the south-eastern part of the study area and lower elsewhere. As indicated above, these high and low AOD areas are roughly separated by the Heihe–Tengchong line, which separates the NCP from the Loess Plateau in Shanxi Province and the Inner Mongolian Plateau. In the south-west of the study area, in Shanxi Province, we see an area with elevated AOD stretching from the north-east to the south-west, i.e. in the Guanzhong basin, where pollution transported by north-easterly winds from the BTH area accumulates between the Qin Mountains and the Loess Plateau and mixes with locally produced pollution. Comparison of the spatial distribution shows the similarity of the AOD distributions for AVHRR and MODIS, while for AATSR the spatial distribution deviates with low AOD over Inner Mongolia, i.e. over the Gobi Desert, with high surface reflectance. ADV AOD retrieval is known to often be unsuccessful over bright areas, and hence aggregated AODs are also too low (de Leeuw et al., 2018; Sogacheva et al., 2108a). AVHRR ADL appears to produce more credible AOD values in such conditions, as suggested by the similarity of the AOD patterns to those from MODIS. Below, this statement will be put in perspective with the validation results from the ground-based reference data set.
Quantitatively, Fig. 2 shows that in the south of the study area, i.e. south of 41∘ N, the MODIS AOD is overall higher than that retrieved from AATSR, which in turn is overall somewhat higher than that from AVHRR. The smoother MODIS AOD, likely due to the larger number of data points because of the larger swath, together with the higher AOD and the scales chosen to plot the AOD maps, results in larger variability and patterns that are not as clearly revealed by ATSR and AVHRR. North of 41∘ N AATSR AOD retrievals are often not successful so a quantitative comparison cannot be made at these latitudes. As regards the comparison of the other two sensors north of 41∘ N, MODIS is overall higher than AVHRR, except, for instance, over an area in Inner Mongolia just north of 41∘ N where the MODIS AOD is close to zero while AVHRR provides AOD values between 0.1 and 0.2.
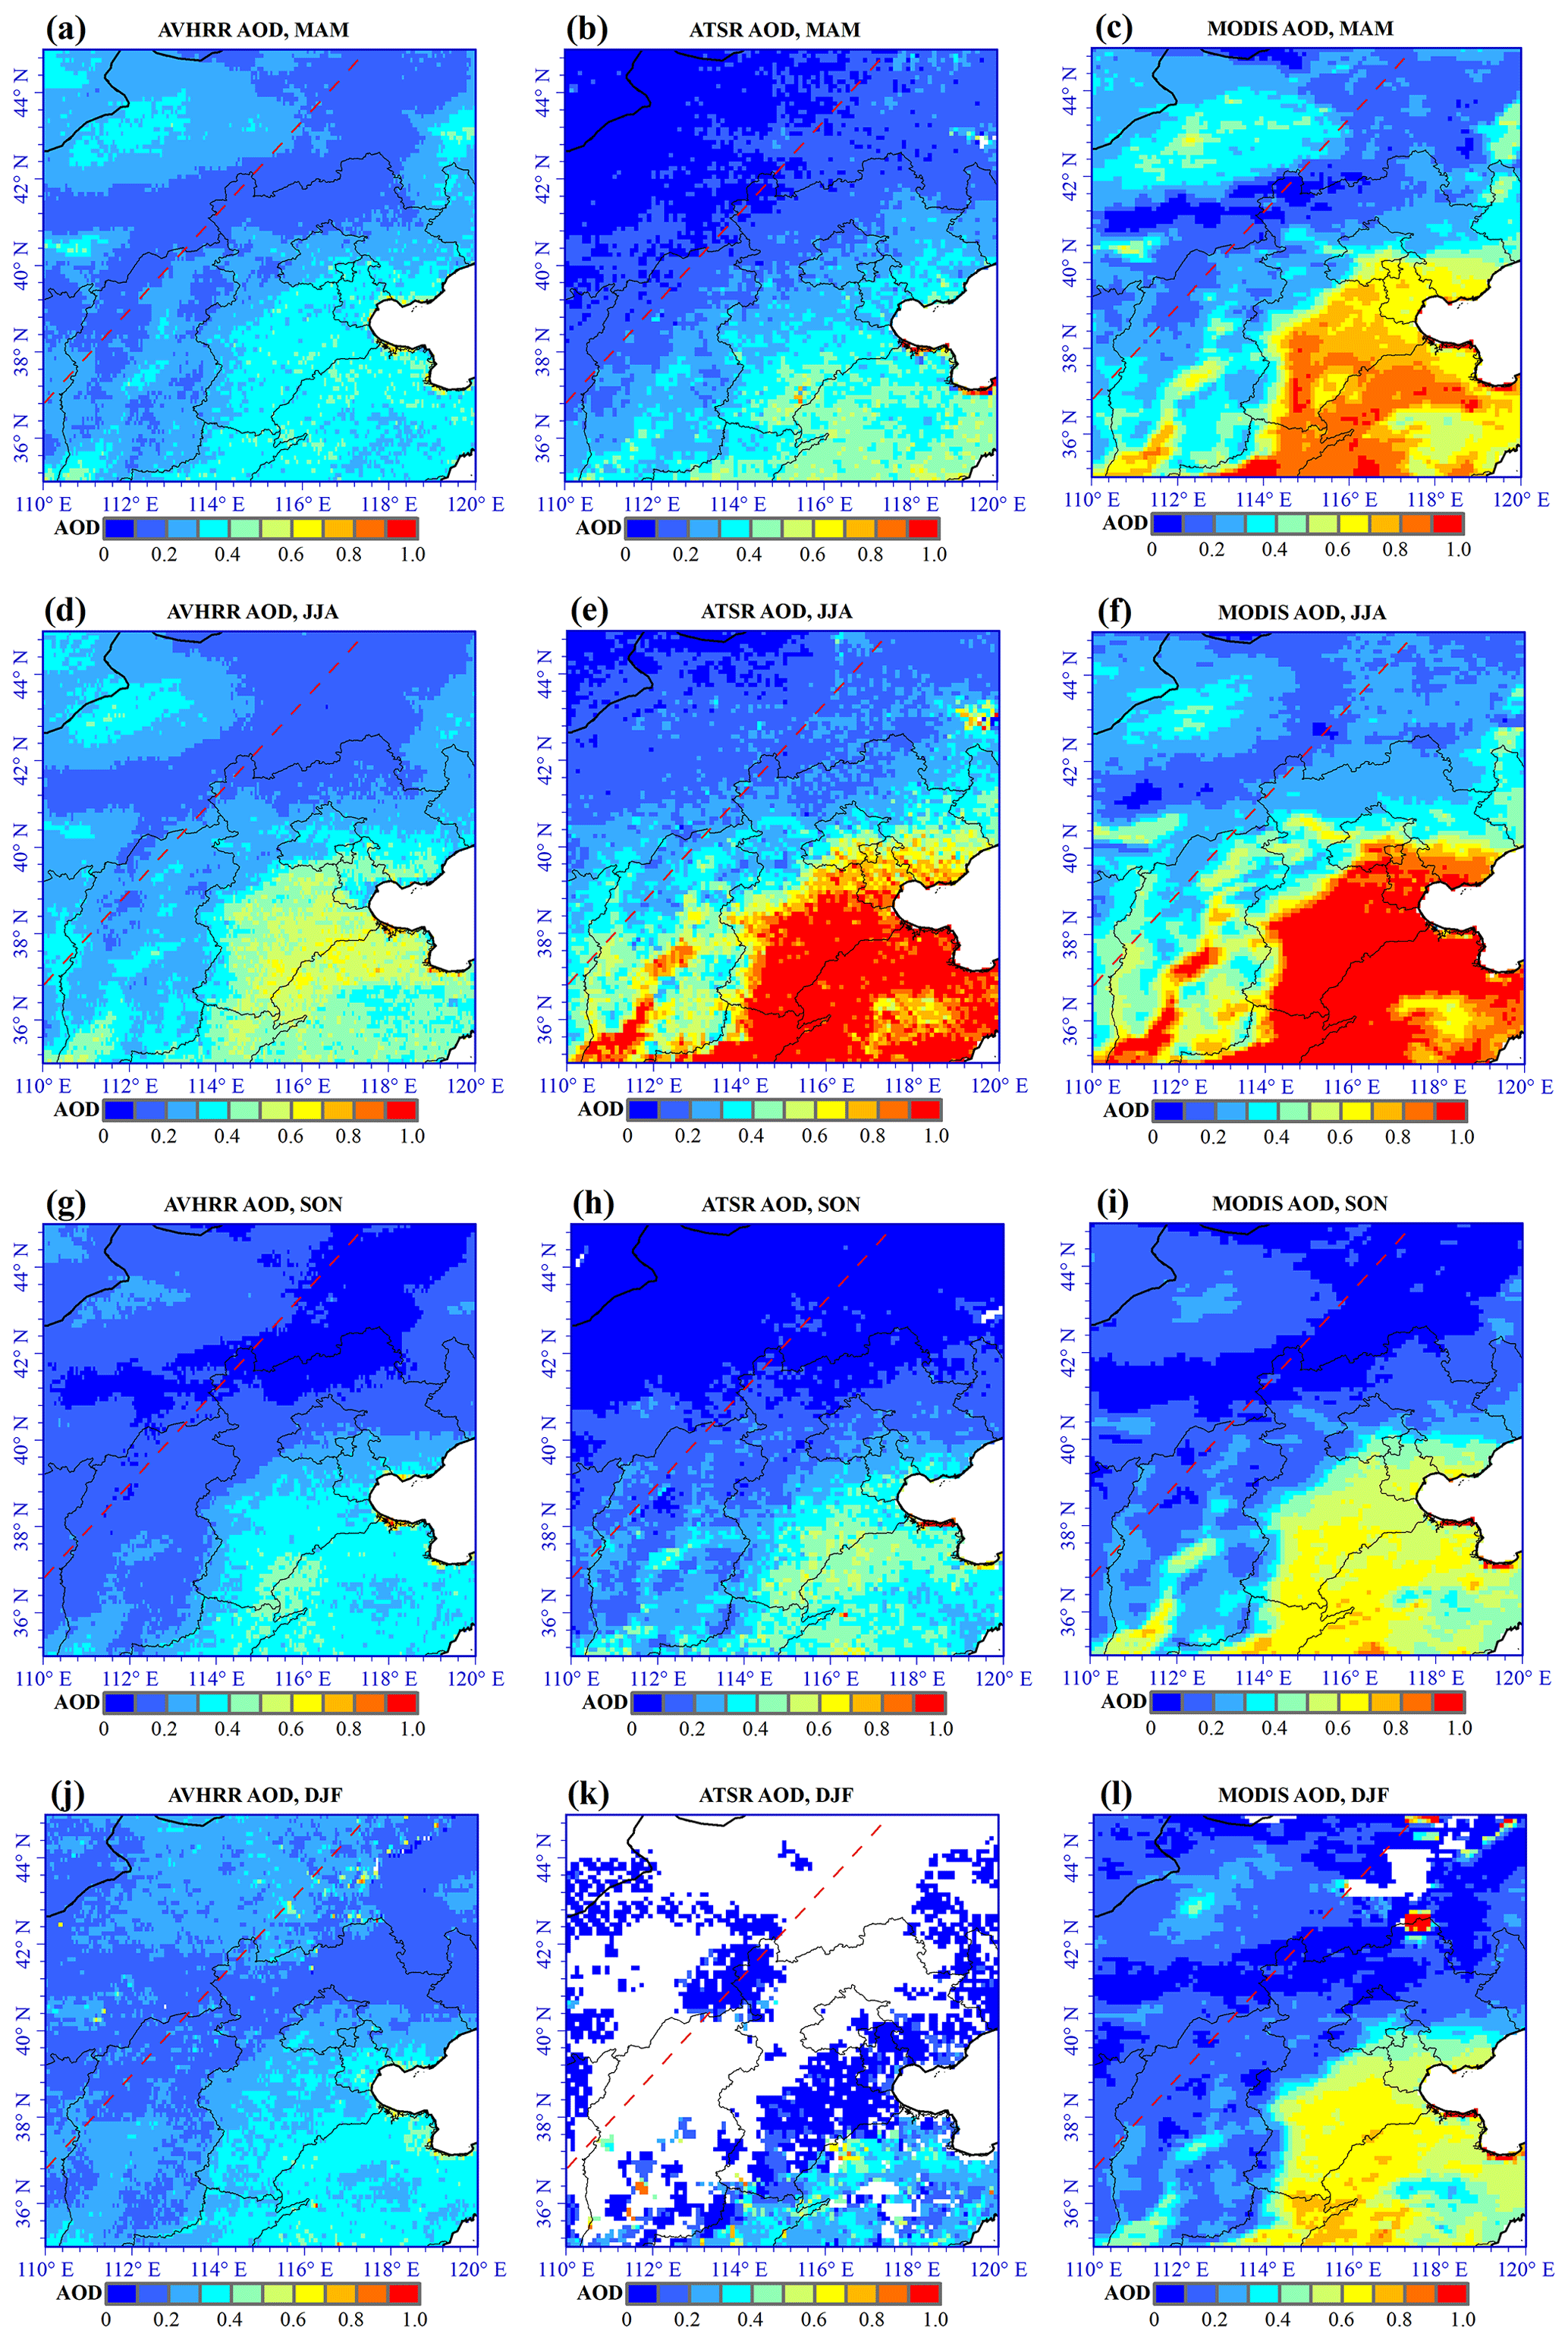
Figure 2AOD over the study area retrieved from AATSR (ADV version 2.31, L2, 10×10 km2), AVHRR (ADL, ) and MODIS C6.1 merged DBDT (MODIS C6.1, L2, 10×10 km2). All have data been seasonally aggregated over the years 2000–2011.
Below, the satellite AOD data will be validated against the ground-based reference data from AERONET and CARSNET for all stations available in the study area, as indicated above. The AVHRR data will also be compared with the BEM AOD data available from the Beijing station, which are especially useful for the earlier period when no other reference data are available. Next the satellite-derived AOD time series will be compared with the reference data to evaluate when each of the data sets is most useful. For AVHRR and MODIS, with wide swath, this will be done using monthly averaged AOD. For ATSR, with a much smaller swath, the data volume is too small for monthly averaging in a statistically meaningful sense, and therefore seasonal averages will be used. In the direct comparison of monthly time series from other sensors this may lead to an apparent shift in the AOD peak values.
3.2 Data quality: validation
3.2.1 Procedure
The MODIS and ATSR AOD data sets used in this study have been validated against sun photometer reference data on global and regional scales. With a focus on China, the ATSR version 2.31 and MODIS C6.1 have been validated using AERONET data for 10 regions across Mainland China and over different seasons (de Leeuw et al., 2018; Sogacheva et al., 2018a). However, as shown in de Leeuw et al. (2018) and Sogacheva et al. (2018a), strong regional differences occur in both the seasonal and long-term AOD variations. Therefore, to achieve an unbiased comparison between the different data sets over the current study area, the MODIS C6.1 and ATSR data used in this study are validated against the available reference data, together with the AVHRR data. The ADL data over the study area was validated earlier by Xue et al. (2017), but in that case only AERONET stations were used, while in the current study the complementary information (AOD) from CARSNET is also used.
Co-location of satellite and reference data is important for validation. Here we follow the spatio-temporal co-location method proposed by Ichoku et al. (2002), i.e. the satellite data were averaged over an area of 5 pixels ×5 pixels (ca. 50×50 km2 at nadir) around the sun photometer location, whereas the sun photometer data were averaged over ±30 min around satellite overpass time. This spatio-temporal co-location method has been widely used for the validation of satellite aerosol products, for instance for MODIS (Ichoku et al., 2002; Chu et al., 2002; Remer et al., 2005; Levy et al., 2010; Sayer et al., 2014), AATSR (Che et al., 2016) and AVHRR (Riffler et al., 2010; Xue et al., 2017).
In the data presentation and discussion, expected error (EE) envelopes are used that apply to MODIS DT over land, i.e. expected errors of (Levy et al., 2013). For comparison, this value is also used for ATSR and AVHRR, although the actual expected error envelopes for these sensors, which were not designed for aerosol retrieval, are expected to be higher than for MODIS. For ATSR a per-pixel uncertainty is provided rather than EE (Kolmonen et al., 2016), and for the AVHRR ADL (Xue et al., 2017) uncertainties have not been estimated.
The Beijing solar radiation station is located to the south-west of the Beijing AERONET site at a distance of approximately 20 km. AOD differences at these two sites are likely to occur due to emissions and secondary formation processes over this urban area, but these have not been accounted for in the current study, where co-locations include averages over areas larger than the separation between these sites. Therefore, BEM AOD is directly compared to the sun photometer AOD as was done by Xu et al. (2015).
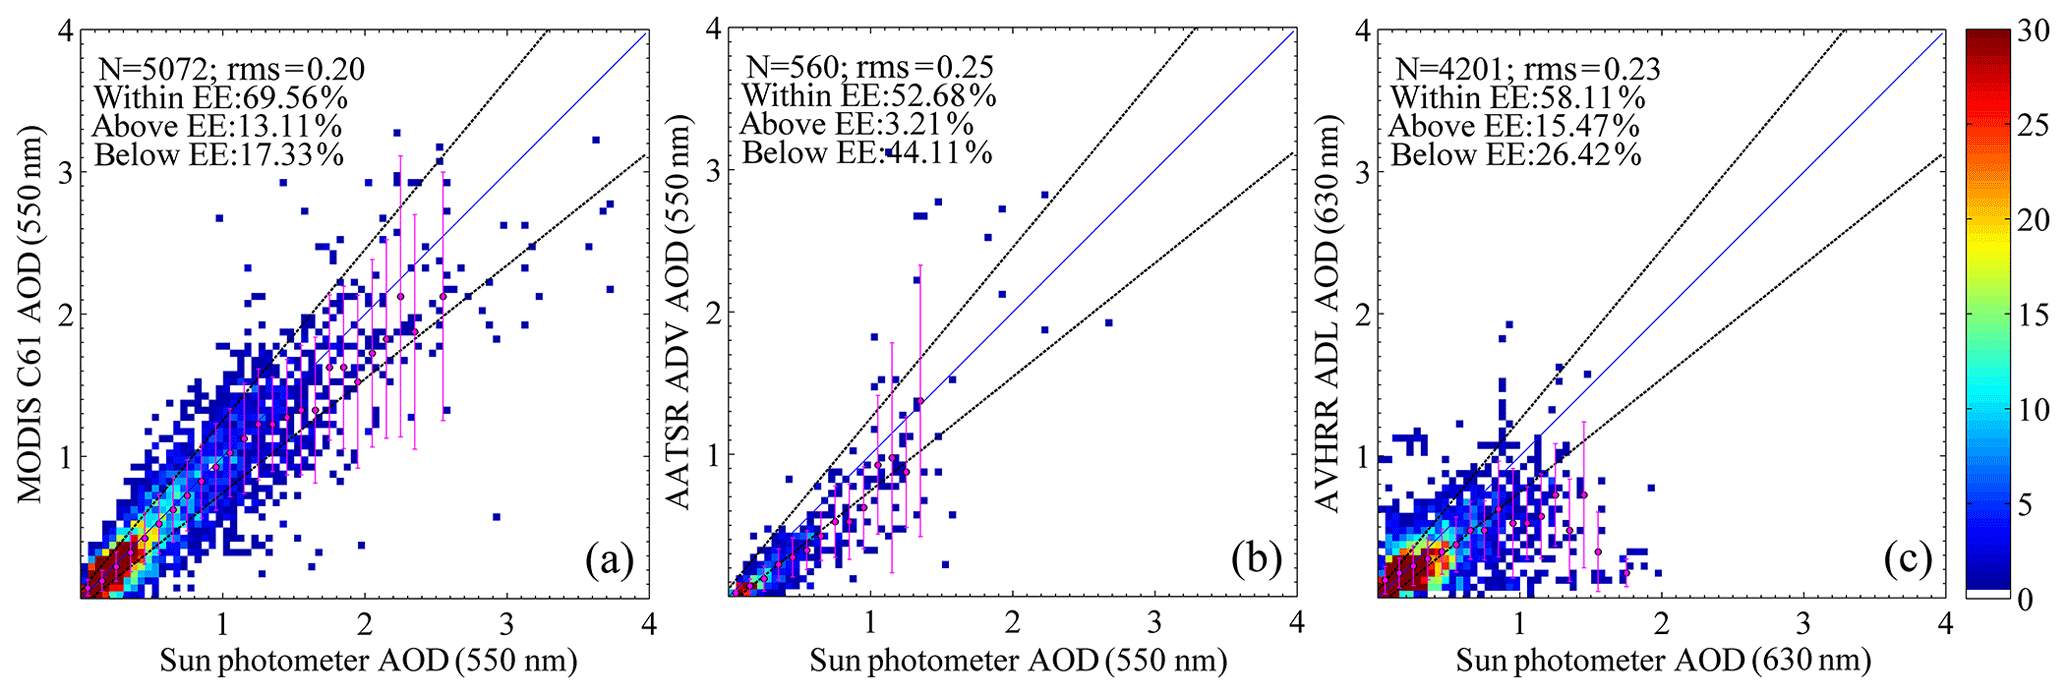
Figure 3Scatter density plots of satellite-retrieved AOD vs. sun-photometer-retrieved AOD data from AERONET (all available data) and CARSNET (3 years: 2007, 2008 and 2010) stations in the study area.
3.2.2 Results
Figure 3 shows scatterplots of AOD, with each of the three data sets being individually validated against the ground-based AOD reference data from all AERONET and CARSNET (3 years: 2007, 2008 and 2010) sites in the study area. The red symbols represent the averaged satellite-retrieved AOD binned in 0.1 sun photometer AOD intervals and the vertical lines on each circle represent the 1σ standard deviation of the fits. The colour bar on the right indicates the number of data points. Parameters are presented in the upper left corner, where N is the total number of co-located pairs and rms is the root mean square. The blue line represents the identity line and the dotted black lines represent the MODIS EE. Large differences occur between the three data sets. Starting with MODIS/Terra C6.1 merged DBDT, which has the largest number of co-locations, the scatterplot in Fig. 3a shows the excellent performance for AOD up to 1.3, with the bin-averaged AOD less than 0.05 below the identity line and 69.56 % of all data points within expected error of . For AOD of 1.3 and larger, the bin-averaged AOD values are much lower than the reference values, although they are still within one standard deviation. For AOD > 2.6, MODIS does provide values, but they are all well below the identity line. These results indicate that MODIS C6.1 AOD over the study area is reliable for AOD up to 1.3, but for higher AOD their use is not recommended.
ATSR with a swath width of 500 km provides far fewer co-locations than MODIS but the large difference in performance (see Fig. 3a and c) cannot be explained by the swath alone and is likely due to the failure of ADV to provide adequate retrievals over bright surfaces. Figure 3b shows that ADV provides AOD values up to 2.7 but for AOD > 1.3 the values are widely scattered around the identity line with large deviations from the sun photometer values. Also, for lower AOD a systematic underestimation is observed that increases with the AOD value up to 0.8, where the ADV-retrieved AOD is about 0.3 lower. For larger AOD of up to 1.3, ADV continues to underestimate the AOD by a similar amount. Although 52.68 % of the data points are within the EE, ADV clearly underestimates the AOD over this area and the bin-averaged AOD follows the lower EE limit rather than the identity line for AOD up to 1.0, leading to the conclusion that ADV AOD is about 0.15× AOD low.
AVHRR with a swath width of 2900 km is expected to provide the largest number of co-locations, but it is actually about 20 % lower than for MODIS, likely due to failure of ADL to provide a valid retrieval in all situations. ADL does not provide retrievals for AERONET AOD > 2 and the data in Fig. 3c show the large scatter around the identity line and the large underestimation for AOD > 0.6. For AOD larger than about 0.8, the binned ADL AOD data deviate from the identity line by more than the expected error. For AOD up to 0.6, the bin-averaged values are within the EE (58.11 % of the data) but systematically deviate from the identity line and underestimation increases with increasing AOD.
In conclusion, in the study area, MODIS provides reliable AOD for values up to 1.3 with a slight underestimation. This is in contrast with the findings of Sogacheva et al. (2018a), who observed a slight overestimation (bias 0.06) of the MODIS/Terra C6.1 merged DBDT AOD using all AERONET data available over China but not CARSNET. CARSNET could provide more reference data in regions where AERONET data are not available, i.e. outside the Beijing region. For ATSR ADV version 2.31 data, the validation presented in de Leeuw et al. (2018), also using only AERONET data similar to Sogacheva et al. (2018a), deviates from that presented here, with a slight underestimation resulting in a bias of 0.07. Clearly the selection of the smaller study area affects the validation results, with MODIS showing slightly better results (smaller bias) than it does over all of China, but for ATSR ADV the performance is not as good in this case. AVHRR AOD shows a large scatter and does not follow the identity line even for low values, underestimates for AOD larger than 0.5 and appears to fail for AOD larger than about 0.8.
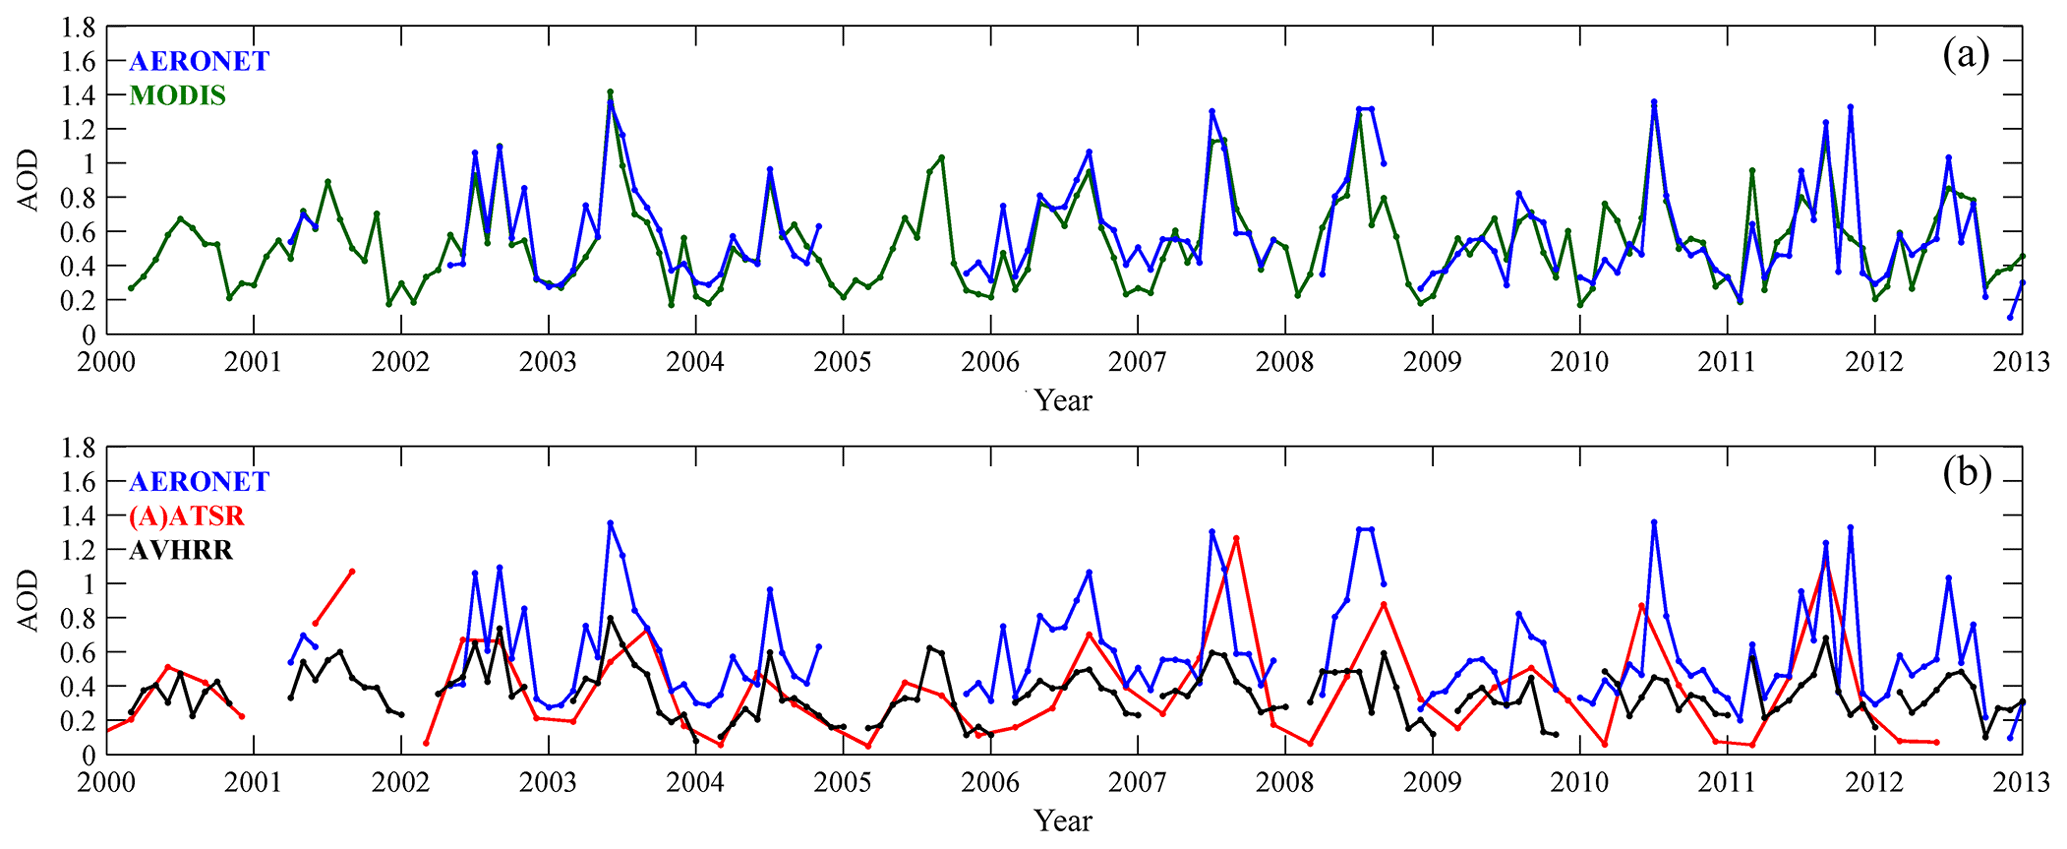
Figure 4AOD time series for MODIS (a) and (A)ATSR and AVHRR (b), with AERONET AOD (blue) as reference, over the Beijing site for the years 2000–2012. For (A)ATSR seasonally averaged AOD is plotted. For AVHRR and MODIS the AOD data are monthly averages.
Table 2Metrics obtained from the evaluation of three AOD products. N is the number of co-located data points, MSA is mean satellite-retrieved AOD, MAA is mean sun-photometer-retrieved (AERONET and CARSNET) AOD and RMB is the ratio of MAA to MSA. MBE is mean of AOD bias given by τsat−τaero. R is the Pearson correlation coefficient, and rms is the root mean square. EE is the expected error, EE_a is the fraction above the EE and EE_b is the fraction below the EE.

Seasonal scatterplots are presented in the Appendix and discussed in the context of the seasonal variations observed in the AOD time series presented below.
3.3 Comparison of satellite-derived AOD time series with reference data
In this section time series of satellite-retrieved AOD data will be compared with time series available from the AERONET sites in Beijing and XiangHe, for which the longest time series are available, and with AOD derived from broadband radiances measured at the Beijing radiation station.
3.3.1 AERONET AOD in Beijing
AOD time series for the period 1997–2012, retrieved from AVHRR, ATSR and MODIS data and spatially co-located with the Beijing AERONET site, are presented in Fig. 4 together with monthly averaged AERONET AOD for reference. The time series presented here start in 2000 because for the earlier years no AERONET and MODIS data are available. The data in Fig. 4 show that AVHRR is almost always lower than AERONET and that the high AOD values obtained from AERONET, usually in the summer, are not reproduced by AVHRR. This is not unexpected since the scatterplots in Fig. 3 show that AVHRR fails to retrieve high AOD. For these individual data points hardly any values larger than 1 were retrieved, and hence the monthly averages in Fig. 4 are lower than that. Figure 4 shows that the highest AVHRR AOD values of about 0.8 occur in 2002 and 2003 and thereafter do not exceed 0.6. The monthly averaged AERONET AOD peak values occur mostly in the summer and are about 1.4. However, in other seasons the differences are much smaller and the two time series seem to trace rather well with an offset of about 0.1. In the winter AVHRR AOD is particularly close to the reference value. These seasonal differences are confirmed by the scatterplots presented in the Appendix. The results lead to the conclusion that, for the Beijing site, for low AOD the ADL algorithm provides quite reasonable results, but for high AOD improvement is needed to provide reliable time series.
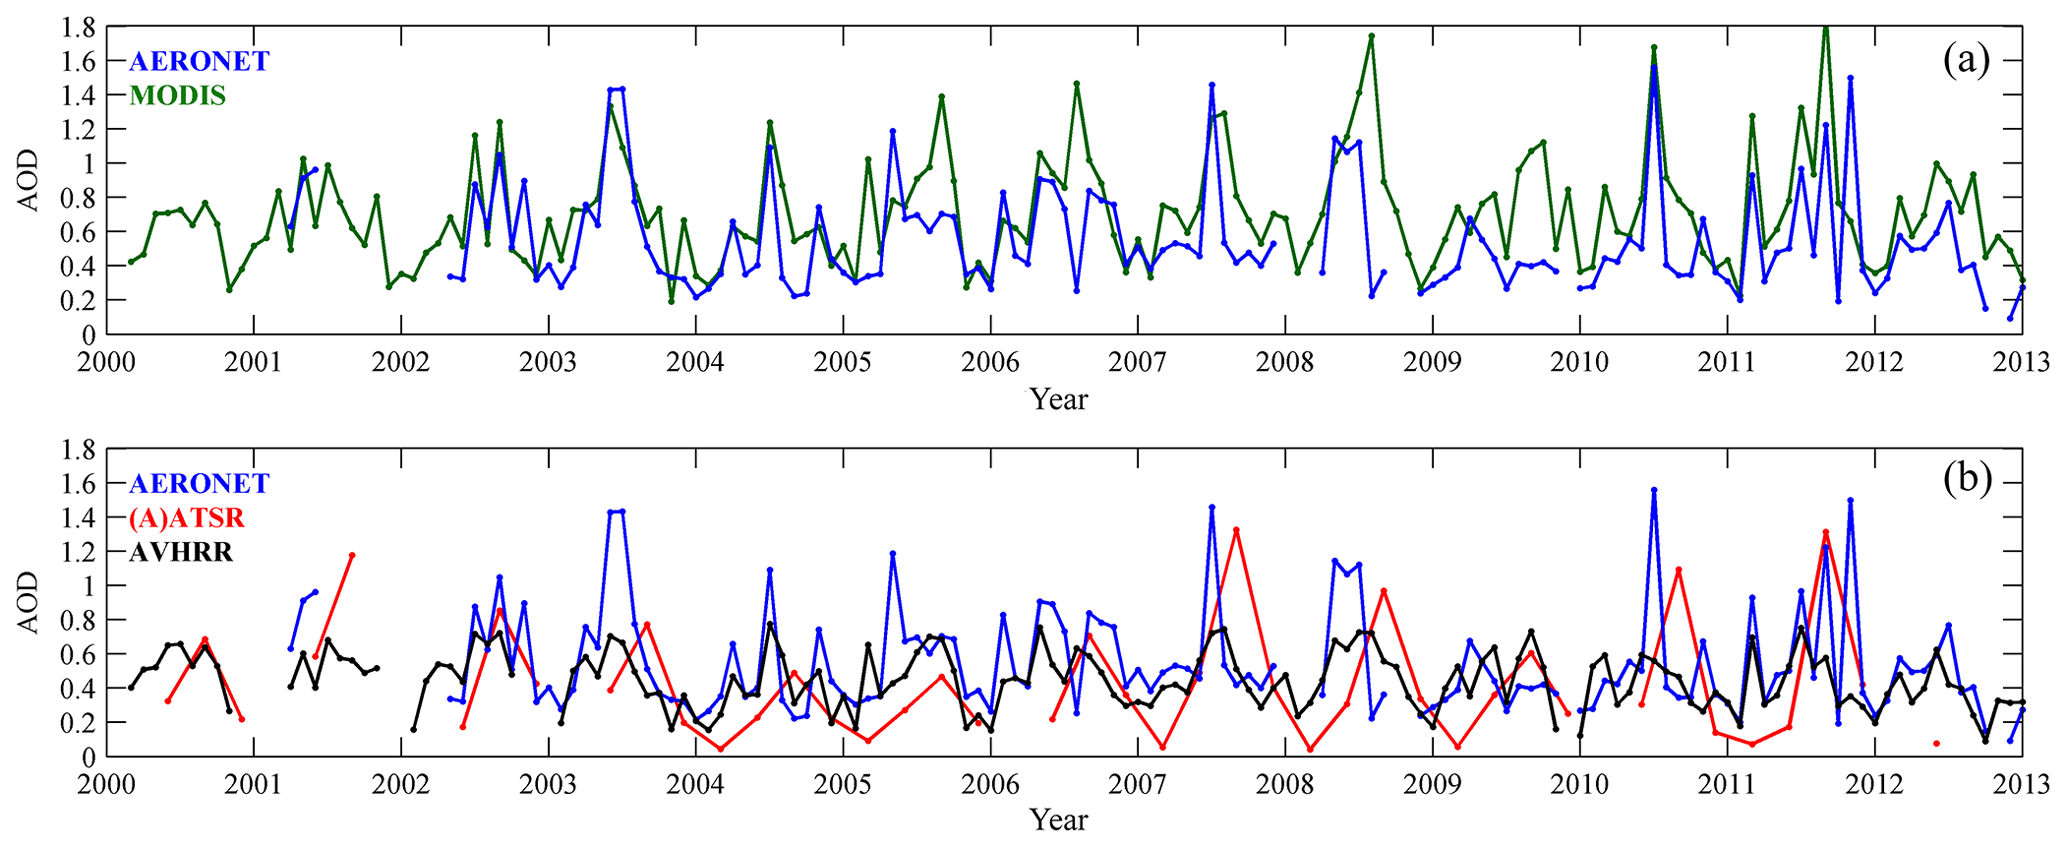
Figure 5AOD time series for MODIS (a) and (A)ATSR and AVHRR (b), with AERONET AOD (blue) as reference, over the XiangHe site for the years 2000–2012. For ATSR seasonally averaged AOD is plotted. For AVHRR and MODIS the AOD data are monthly averages.
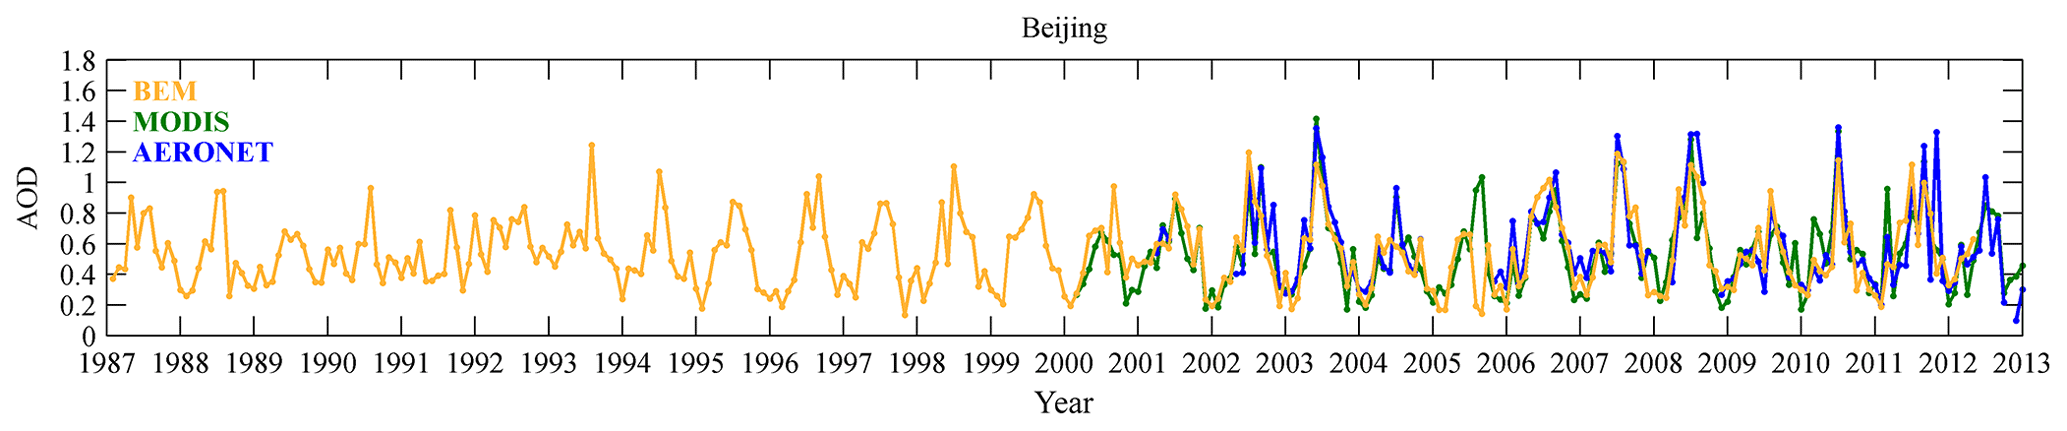
Figure 6AOD time series for BEM (orange), with MODIS (green) and AERONET AOD (blue) as reference, over the Beijing site for the years 1987–2012.
The MODIS data in Fig. 4a trace the AERONET AOD very well, both in the summer and in other seasons, with MODIS AOD often just a little smaller, as can also be observed from the scatterplots in the Appendix. This shows that MODIS serves as a good reference for the situation encountered at the Beijing site.
This does not apply to the ATSR AOD. Although ATSR AOD variations follow those from AERONET, and even reproduce the high summer values in some years (2007 and 2011), the ATSR values are most of the time smaller and the ATSR AOD is much too low, especially in the winter. As discussed before, this may be due to the failure of ADV to produce a valid retrieval over bright surfaces.
3.3.2 AERONET AOD in XiangHe
Figure 5 shows a comparison of the AOD time series over the XiangHe AERONET site, similar to that over Beijing in Fig. 4. It is noted that, for comparison, in both cases the time series are plotted for the years 2000–2012 but that the XiangHe time series start at the end of 2004 (except for a few data points in 2001), i.e. later than in Beijing. Comparison of the AERONET time series shows that over XiangHe the AOD in the summer is somewhat higher and peaks often in the same years as over Beijing, but there are also differences, such as when the AOD in XiangHe reached the maximum monthly averaged value of 1.5 in 2008. As in Beijing, the AVHRR retrieval did not reproduce these high values in the summer, but for the other months the AVHRR–AERONET comparison is better than in Beijing and, with some exceptions, the AOD data trace very well. The seasonal scatter density plots in Fig. A3 confirm that no high AOD is retrieved in the summer, as opposed to other seasons. These scatterplots also confirm the underestimation of ADL by about one EE in each of the seasons, except in the winter where ADL performance compares better to AERONET.
In contrast, the ATSR retrieval algorithm does reproduce the higher values, and in some years the seasonally averaged AOD compares favourably with the AERONET AOD (e.g. in 2007 and 2011), but in other years, such as 2008 and 2010, the maximum AOD is not observed by AATSR, which may be due in part to the seasonal averaging. Also, as is the case over Beijing, ATSR retrieval does not work well in the wintertime, possibly due to the high surface reflectance in the dry season, and the seasonal AOD is much lower than AERONET.
For MODIS the AOD compares well with AERONET but not as good as over Beijing. During some periods, e.g. in 2005 and during 2008–2011, MODIS is too high. This is also shown by the validation results in the Appendix. The reason for this difference between Beijing and XiangHe, which is located close to Beijing to the south-east (see Fig. 1), has not been further investigated. Possibly, the surface properties, urban and built-up for Beijing vs. cropland for XiangHe, may affect the retrieval results, as was also indicated in de Leeuw et al. (2018) but for MODIS C6.0.
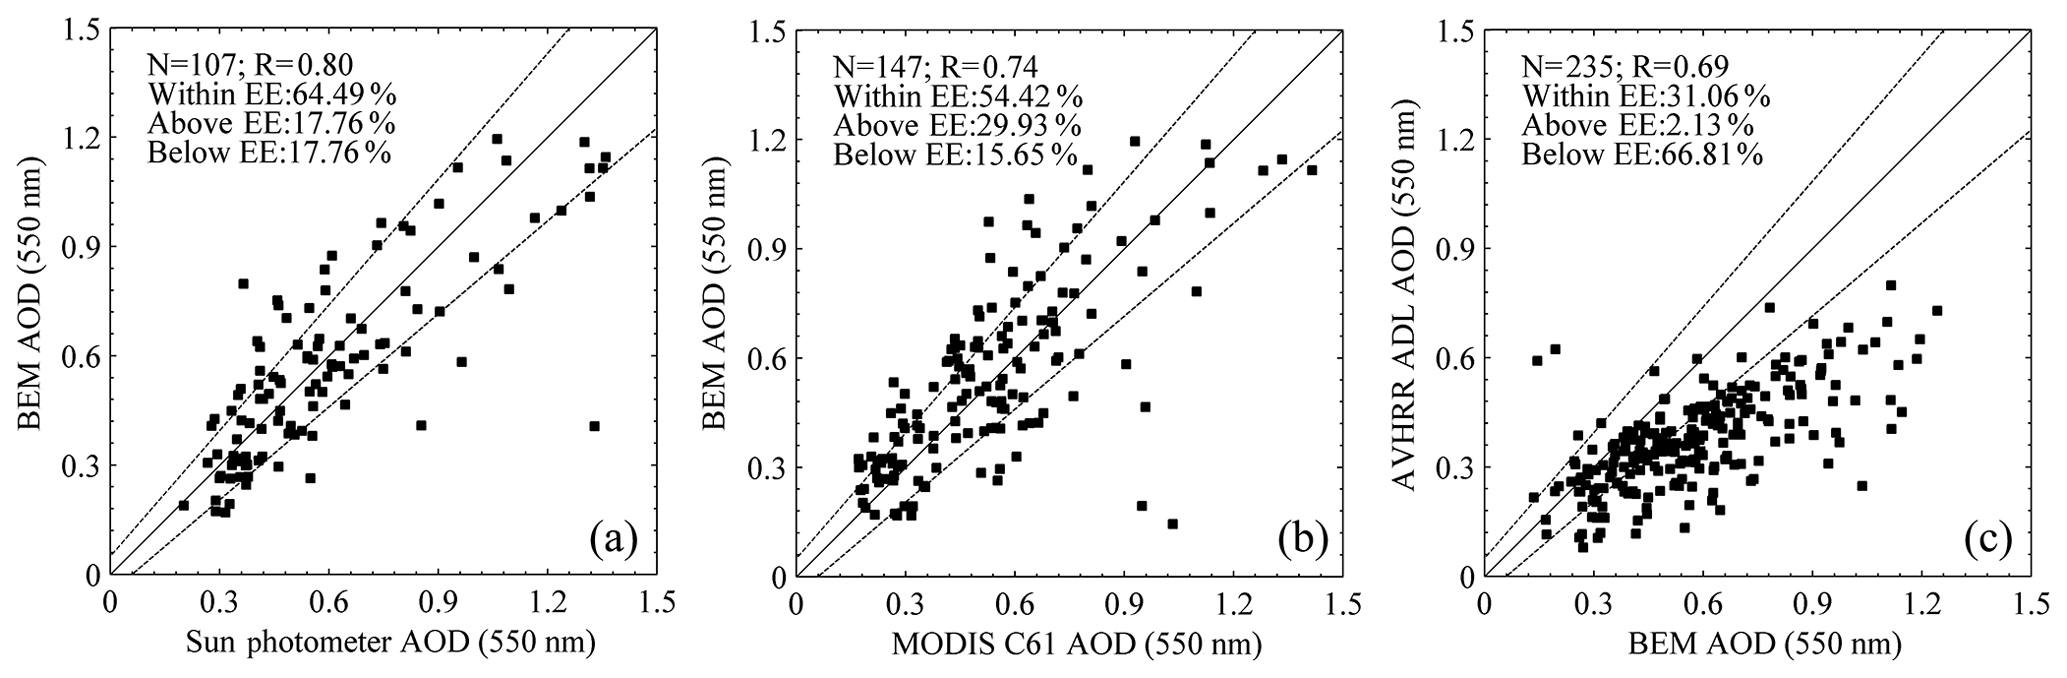
Figure 7Scatterplots of BEM AOD vs. sun-photometer-retrieved AOD (a), BEM AOD vs. MODIS AOD (b) and AVHRR AOD vs. BEM AOD(c). The dashed lines show the MODIS expected error of .
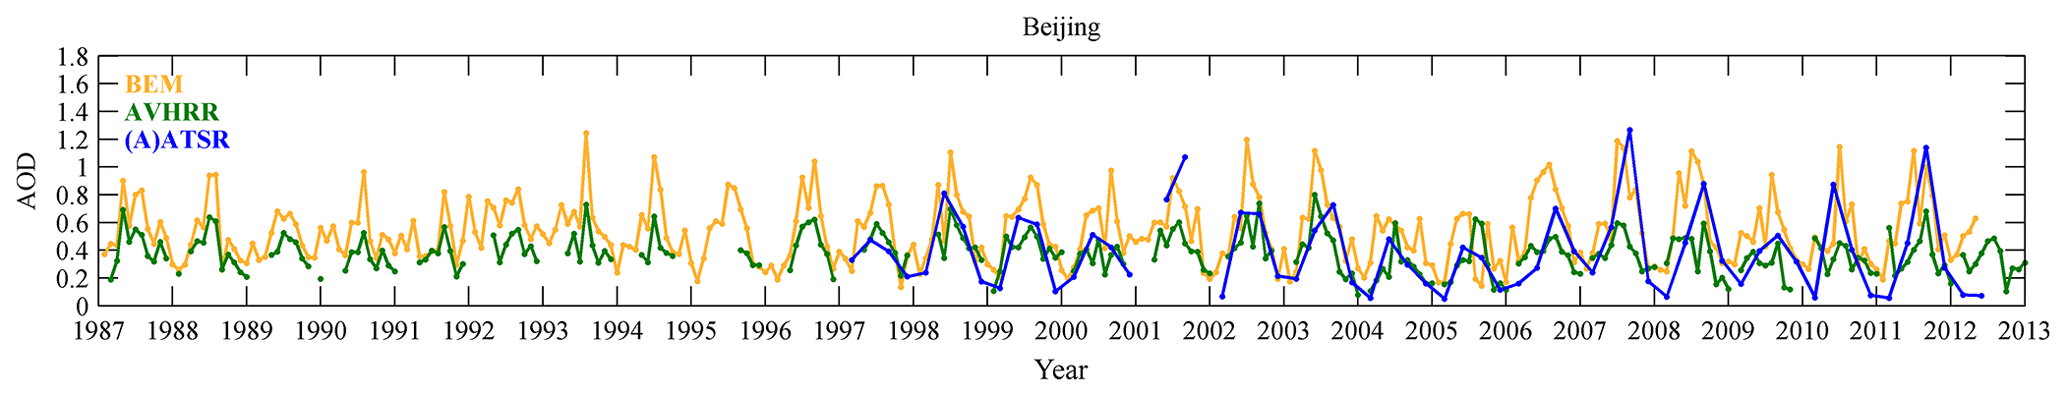
Figure 8AOD time series for BEM (orange), with AVHRR (green) and (A)ATSR AOD (blue), over the Beijing site for the years 1987–2012.
3.3.3 Broadband extinction method (BEM) AOD in Beijing
Figure 6 shows the comparison of the monthly averaged AOD time series from AVHRR with those derived from BEM data, as well as a comparison of the BEM AOD with AERONET and with MODIS as reference data. Monthly radiance data at the Beijing site have been validated by Xu et al. (2015) for the years 2002–2012 using both MODIS C5 L3 AOD and AERONET L2 data (version 2). In the current study, MODIS C6.1 and AERONET version 3 are used for the years 2000–2012, and the results from the comparison of the BEM AOD with these data sets (shown in Fig. 7a) are similar to those presented in Fig. 2 of Xu et al. (2015). Also, the time series in Fig. 6 show very good comparisons between the BEM and MODIS and AERONET AOD. Hence, the BEM AOD data provide another reference data set for the AVHRR-retrieved AOD that can be used for the period 1987–2012, as presented in Fig. 8. Figure 8 shows that in this earlier period (1987–2000) the AOD was generally lower and the monthly averaged AOD compares better with BEM AOD than for the later period 2000–2012, when AOD was higher (especially during the summer months). This is consistent with the data in the scatterplot in Fig. 7c, which shows that almost all of the scatters are below the identity line when AOD is larger than 0.6. However, the overall conclusion remains the same: that the AVHRR retrieval needs improvement for high AOD and only values lower than 0.6 can be used.
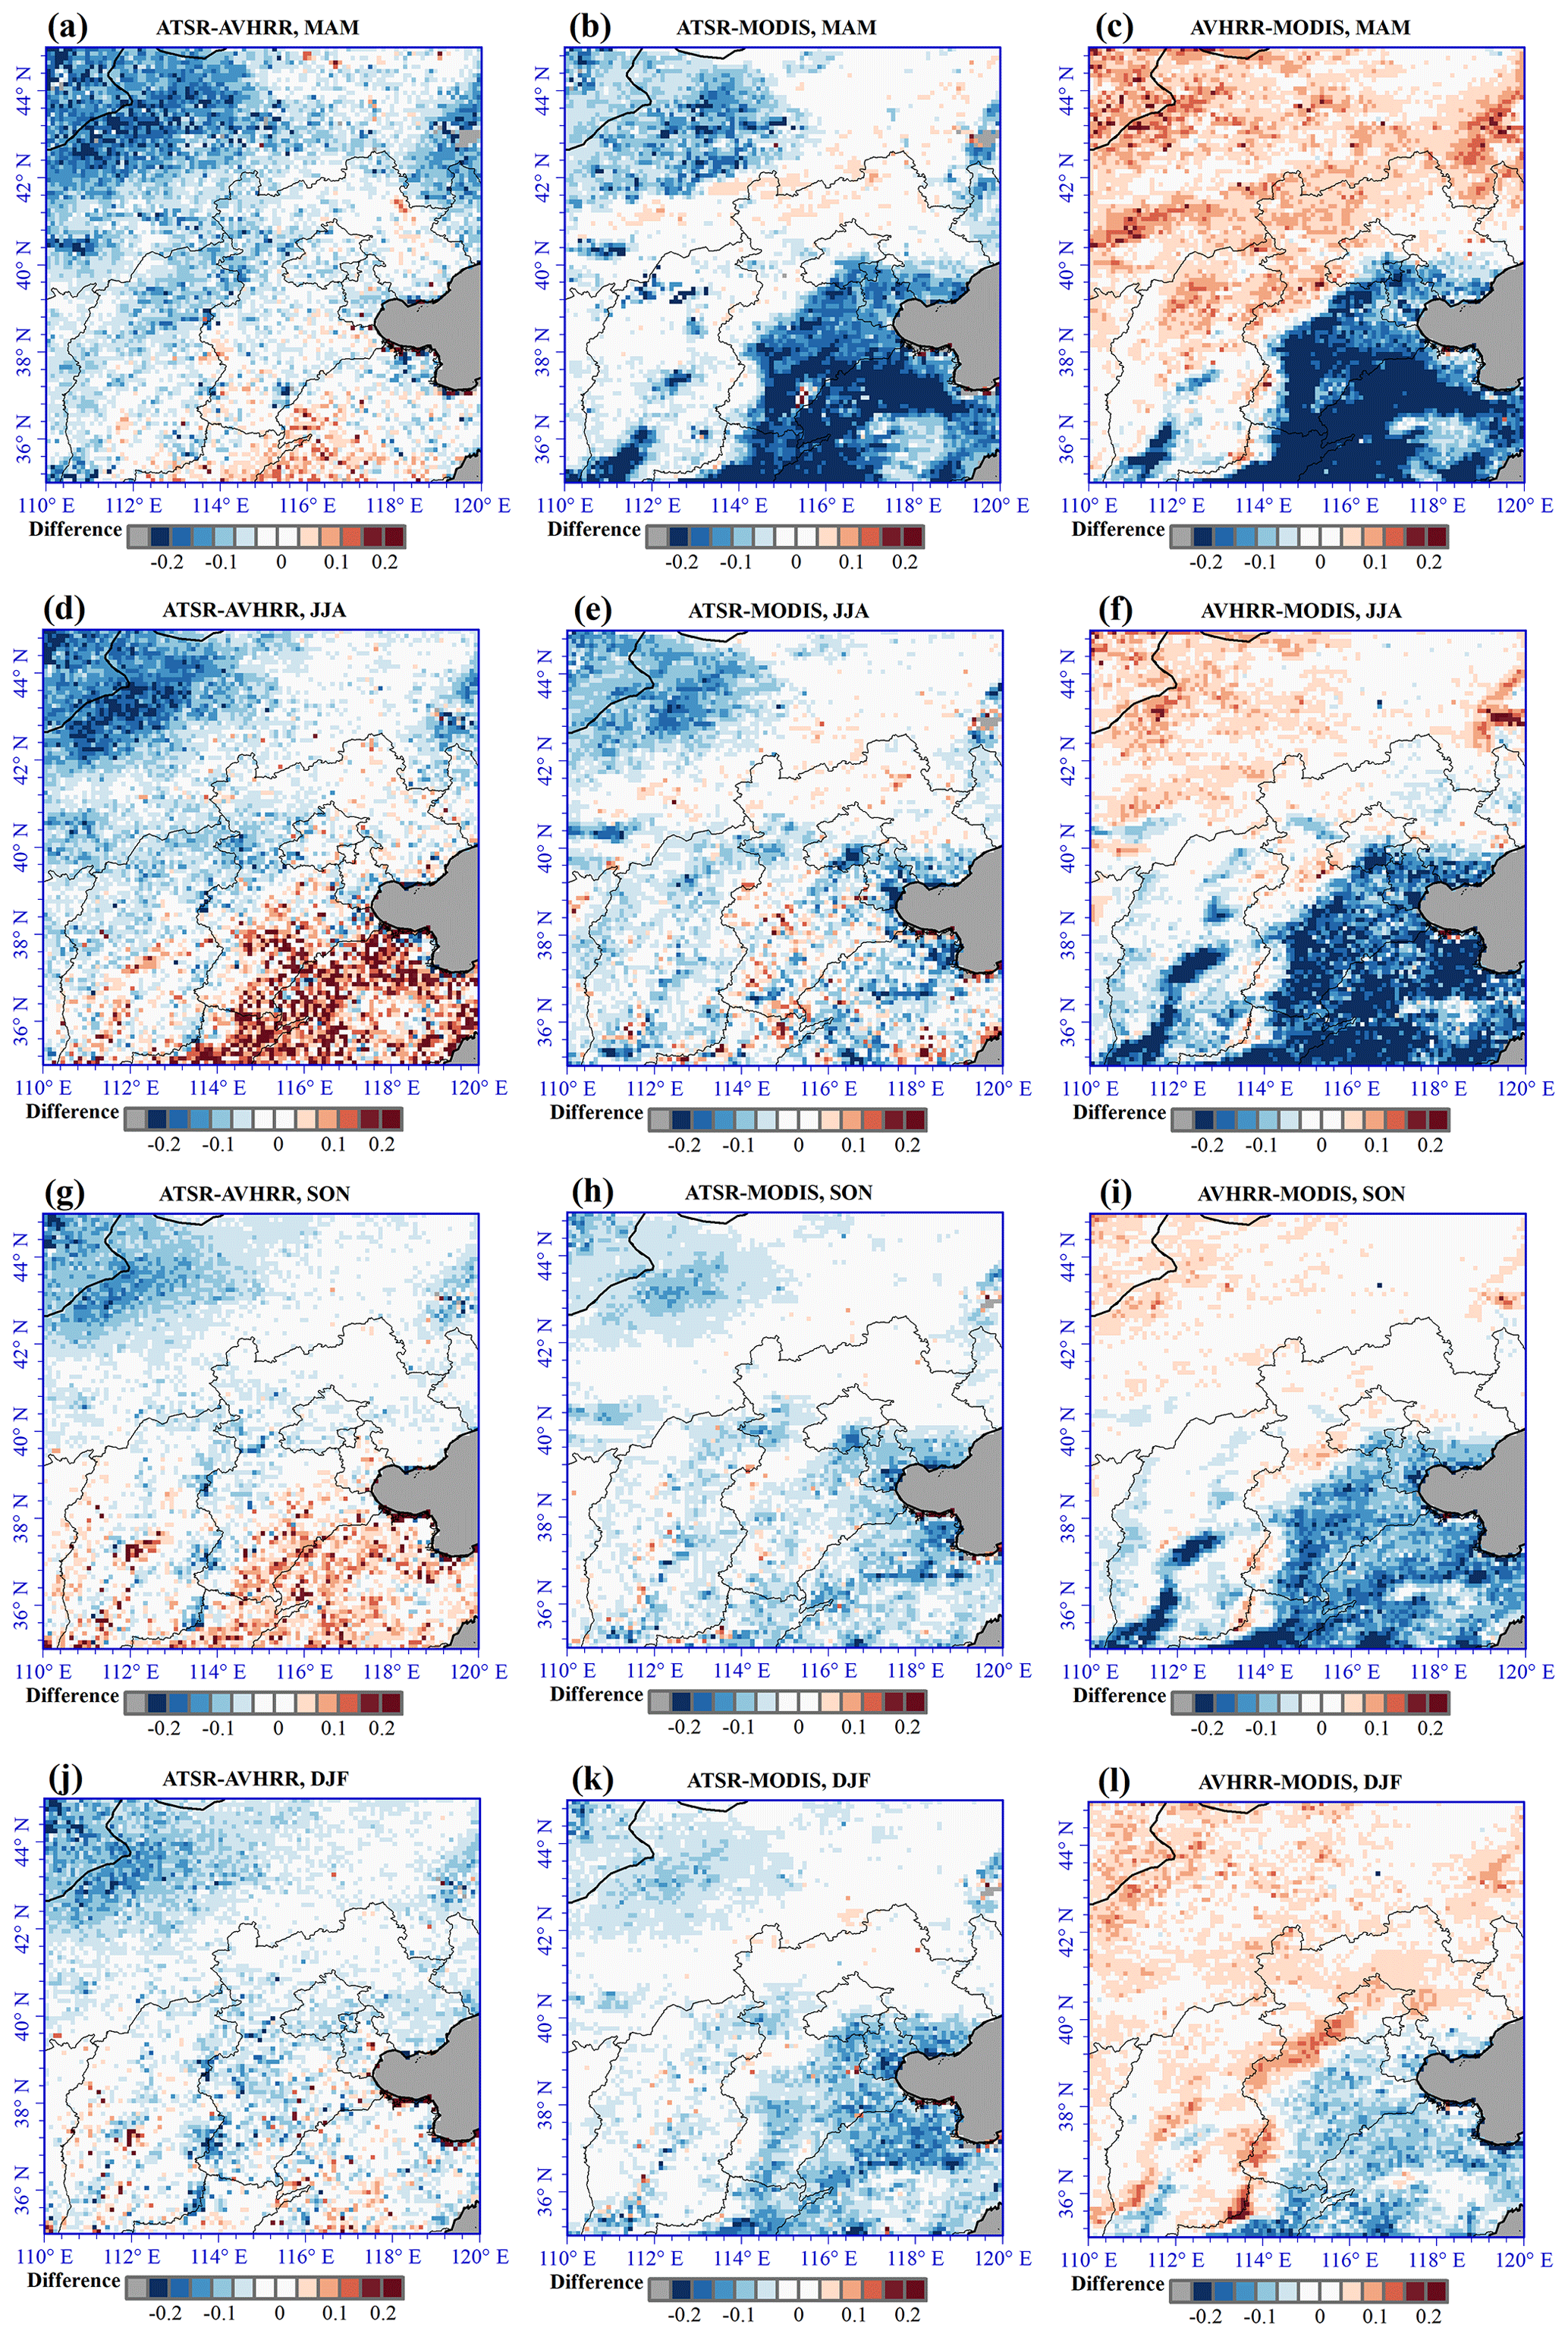
Figure 9AOD difference over the study area retrieved from AATSR (ADV version 2.31, L2, 10×10 km2), AVHRR (ADL, ) and MODIS C6.1 merged DBDT (MODIS C6.1, L2, 10×10 km2). All data seasonally aggregated over the years 2000–2011.

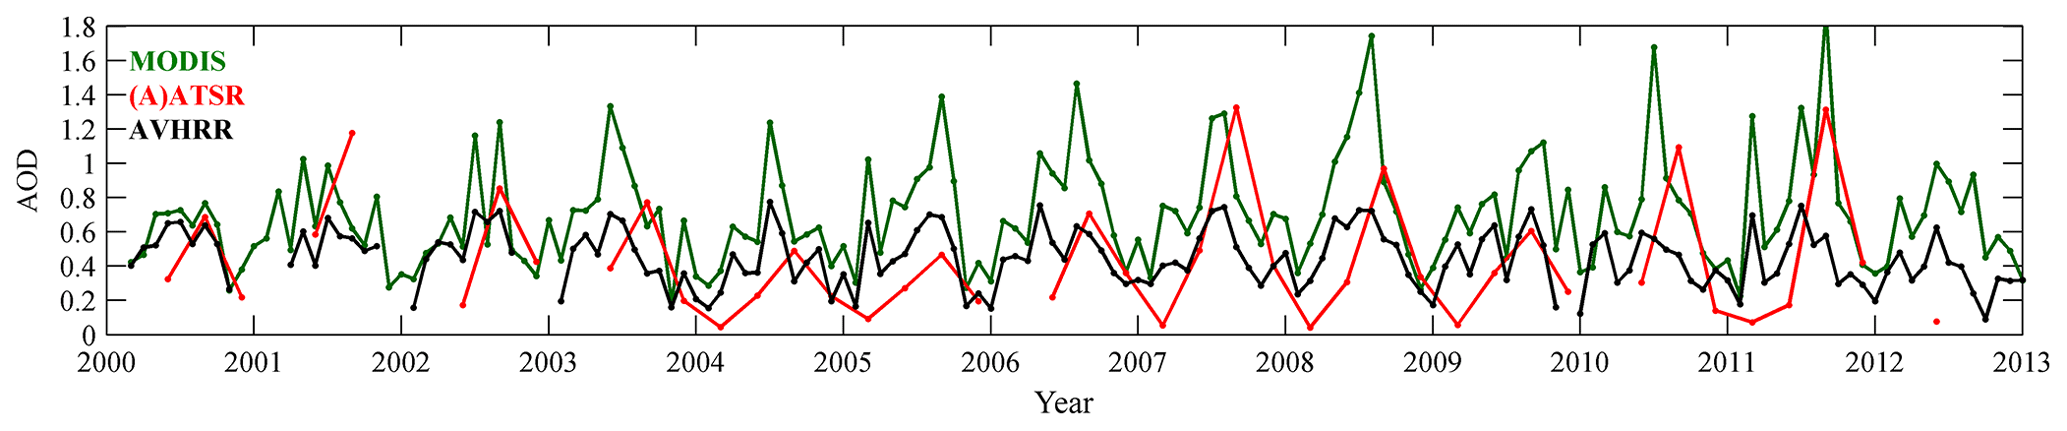
Figure 10Comparison of AOD time series over the Beijing AERONET site retrieved from the satellite sensors AVHRR, MODIS and (A)ATSR for the overlapping years 2000–2015. Note that for AVHRR and MODIS monthly mean AOD data are plotted, while for (A)ATSR they are seasonal means that may provide a shift in the extreme values.
3.4 Seasonal comparison of satellite-derived AOD
The above results and those from Sogacheva et al. (2018a) and de Leeuw et al. (2018) show the high quality of the MODIS data over China. Therefore, we select MODIS as reference data for comparison with both time series and spatial coverage. Time series of satellite- and ground-based AOD data were compared in the previous section; here we compare the spatial distributions of AVHRR, ATSR and MODIS AOD.
As Fig. 2 shows, in the south-east of the study area MODIS-retrieved AOD is often higher than 0.7, whereas the AOD retrieved from ATSR and AVHRR data is substantially lower due to failure of the algorithm to retrieve AOD larger than 0.6 (AVHRR) or unsuccessful retrieval and/or underestimation of the AOD by ADV (except in the summer). Hence, the AOD difference patterns between the three instruments, presented in Fig. 9b and c, show similar features in the south-east of the study area. However, in the spring the MODIS AOD is approximately 0.2 larger than that from ATSR and AVHRR. In the summer, when the MODIS AOD in the south-east of the study area is very high with values larger than 0.8, the ATSR-retrieved AOD is similar to that from MODIS, but the AVHRR-retrieved AOD is much lower (Fig. 9f). This indicates that the AVHRR ADL algorithm needs to be improved for these conditions. In the autumn, the situation in the south-east of the study area is similar to that in the summer; i.e. MODIS AOD is high with values exceeding 0.6 and ATSR AOD is close to that from MODIS, with a difference of less than 0.1, while AVHRR ADL is lower due to failure to retrieve elevated AOD. In the winter season, ADV fails to provide successful retrievals over approximately half of the study area (mainly over bright surfaces), but over other areas the ATSR-retrieved AOD is close to that from AVHRR and MODIS, as shown in Fig. 9j and k. It should be noted that, in addition to algorithm failure over bright surfaces, the number of ATSR samples is much smaller than that of AVHRR and MODIS, due to the much smaller swath width, and therefore the seasonally averaged AOD is less smooth than that from the other two sensors.
The validation exercises and time series comparisons presented in Sect. 3 show the stronger and weaker points of the ATSR- and AVHRR-retrieved AOD climate data records (CDRs), with AVHRR being better in the winter and ATSR better in the summer. These differences are also very clear in the direct comparison of the AVHRR and ATSR time series, shown in Fig. 10 for the Beijing site and in Fig. 11 for the XiangHe site. Figure 10 also shows that before 2007 these time series trace quite well and could be combined into a single time series, while taking into account the validation results for that period only. The use of the ATSR winter AOD data in particular will have to be considered carefully and may have to be given only little weight. However, after 2007 large differences are observed, with quite high ATSR AOD in the summer, while that retrieved from AVHRR has a maximum value of about 0.6. The comparison with MODIS shows that the ATSR AOD values are credible and follow those of MODIS (apart from the shift due the use of seasonal ATSR vs. monthly MODIS AOD averages), whereas the AVHRR AOD is much too low. In the winter the opposite is observed: ATSR is too low, with values close to zero, while AVHRR traces MODIS very well. The intercomparison of the ATSR and AVHRR time series for XiangHe in Fig. 11 shows a similar pattern as for Beijing, with a good comparison before 2007 and a larger summer–winter difference in the ATSR data thereafter, resulting in increased discrepancy between the ATSR and AVHRR data sets. However, the comparison with MODIS shows an offset between ATSR and MODIS in the years 2004–2007, which seems to be due to larger overestimation of the MODIS AOD at the XiangHe site than at the Beijing site. In some other years the ATSR–MODIS difference appears to be higher in XiangHe than in Beijing, due to higher MODIS AOD. The comparison between AERONET and MODIS AOD data in Figs. 4 and 5 show that the difference between the AOD measured at both sites is smaller for AERONET than that for MODIS, and hence this may be a MODIS retrieval issue.
As the statistics marked in Figs. A2 and A3 show, the data volume of co-located matchups with ground-based reference data may lead to biased validation results and time series comparisons. Therefore, pixel-by-pixel comparison with reference data is necessary. The seasonally averaged AOD and AOD difference maps provide information on not only a seasonal comparison but also a pixel-by-pixel comparison. The comparison with the ground-based reference data shows that MODIS provides good results for AOD up to 1.3 in all seasons (see Fig. A1). As discussed above, AVHRR failed to retrieve AOD larger than 0.6 for most cases, leading to big differences with ATSR and MODIS in the south-east of the study area in the summer. However, the AOD patterns of ATSR and AVHRR in other seasons are similar. ATSR has the ability to provide successful retrievals of high AOD, but its small swath limits the spatial coverage. Figure 9c shows that ATSR- and MODIS-retrieved AOD are very similar, whereas the difference between AVHRR and MODIS AOD is less than −0.2 for most of the south-east part of the study area.
The BEM AOD data set provides a multi-decadal AOD time series from the 1980s to the present with good quality, as evidenced by the comparison with AERONET and MODIS AOD in Fig. 8. The comparison of AVHRR- and ATSR-retrieved AOD with the BEM data presented above shows the good agreement of the satellite- and ground-based data. However, the AVHRR AOD missed most of the AOD values larger than 0.6, which occur mainly during the summer, but follows BEM AOD well in other seasons and has similar annual patterns. Thus, we conclude that the AOD retrieved from AVHRR can be used to extend the ATSR data set to before 1995, except in situations with high AOD (> 0.6). This conclusion is based on the comparison with only one BEM station. There are at least 10 BEM stations in China, as mentioned in Xu et al. (2015). Extension of the AVHRR AOD data set to all of China and the comparison with other BEM stations are planned as future work.
In conclusion, the possible combination of the AVHRR and ATSR CDRs, possibly also including MODIS, into a multi-decadal time series is not straightforward. The MODIS performance is better than that of ATSR and AVHRR, but the latter two sensors go back in time before MODIS and hence provide a unique source of information. In addition, none of the satellite sensors perform better than the others at any time and at any location, and their combination, taking into account the strengths and weaknesses of each of them, may result in a more significant CDR than any of them individually. As shown in this paper, the ADL algorithm does not successfully retrieve AOD for values larger than 0.6, whereas ATSR compares favourably with the reference data for AOD up to about 1.3. On the other hand, the ADV algorithm does not provide good results for latitudes north of 41∘ N, where ADL shows patterns similar to those from MODIS. Furthermore, the comparison shows that before 2007 the AVHRR and ATSR compare quite well and could be used for a meaningful extension of the AOD data records to the early 1980s. However, this conclusion does not apply to the northern subregion where the surface conditions seem unfavourable for AOD retrieval from ATSR using ADV.
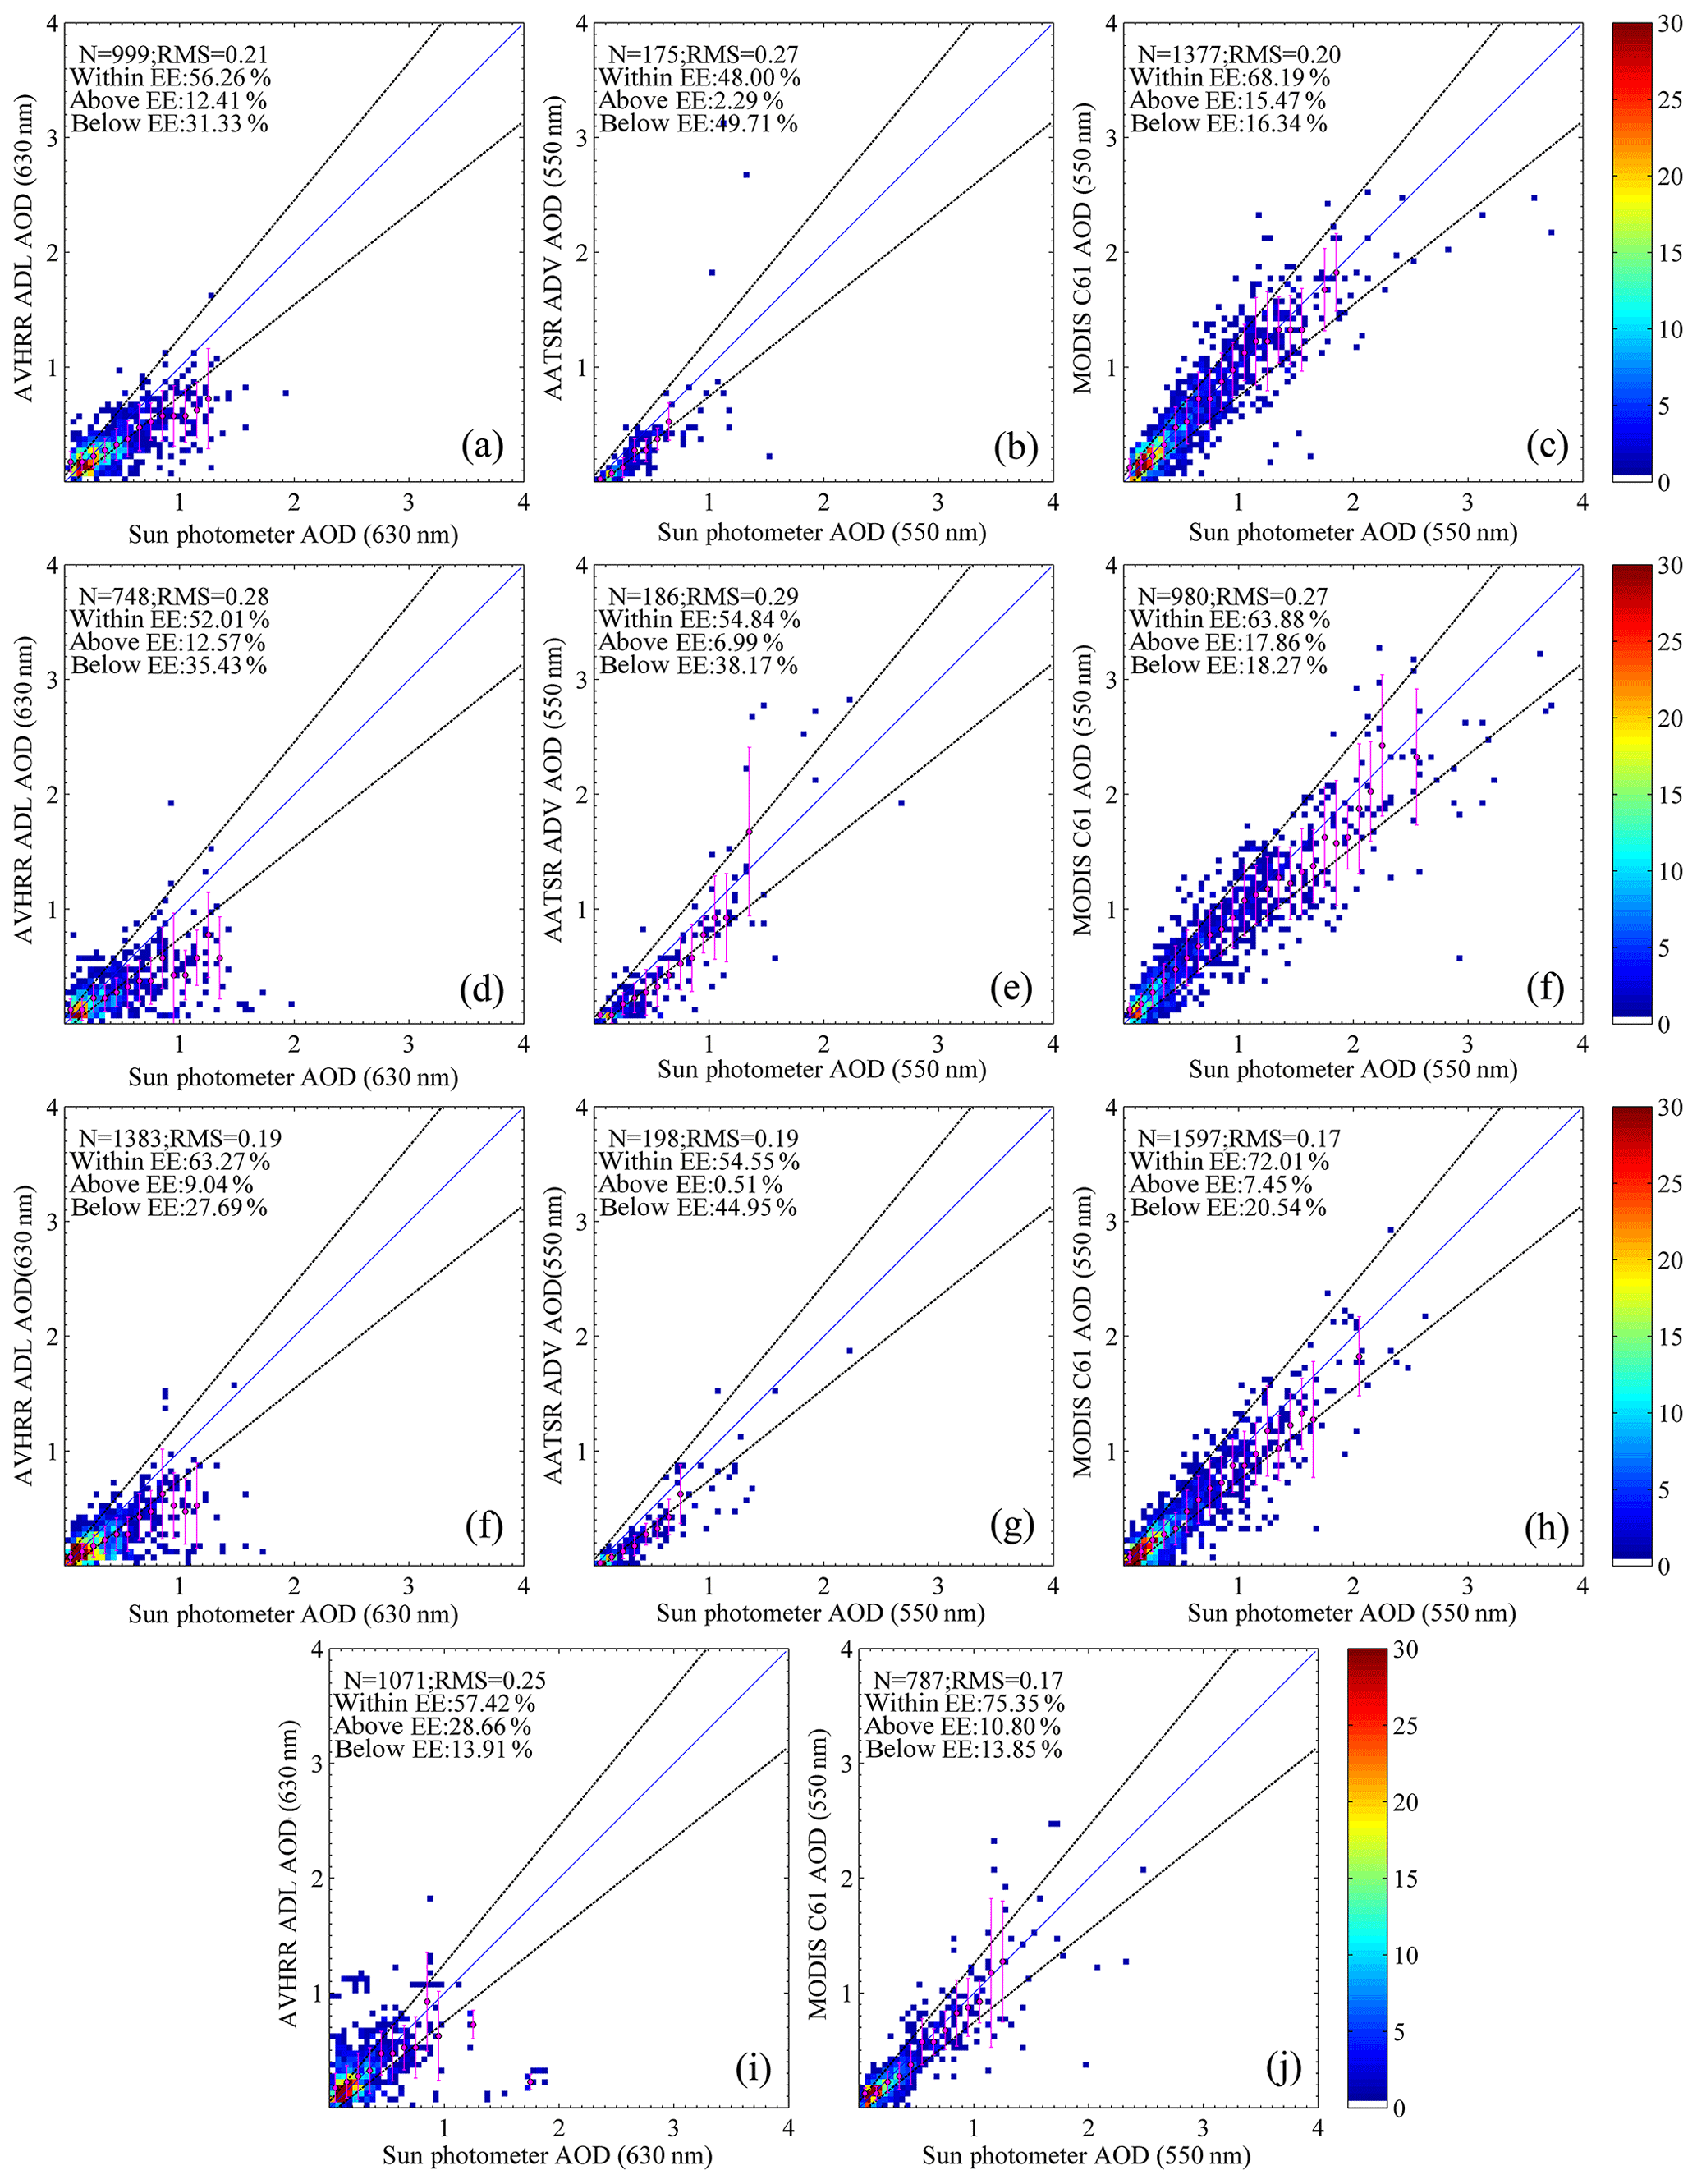
Figure A1Seasonal scatter density plots of satellite-retrieved AOD vs. sun-photometer-retrieved AOD. Panels (a), (d), (f) and (i) are AVHRR AOD vs. AERONET AOD in spring, summer, autumn and winter. Panels (b), (e) and (g) are ATSR AOD vs. AERONET AOD in spring, summer and autumn. Panels (c), (f), (h) and (j) are MODIS AOD vs. AERONET AOD in spring, summer, autumn and winter.

Figure A2Scatter density plots of satellite-retrieved AOD vs. sun-photometer-retrieved AOD data from Beijing station. The ADL of all data (a), only spring data (d), only summer data (g), only autumn data (j) and only winter data (m) vs. AERONET. The ADV of all data (b), only spring data (e), only summer data (h) and only autumn data (k) vs. AERONET. MODIS using all data (c), only spring data (f), only summer data (i), only autumn data (l) and only winter data (n) vs. AERONET.
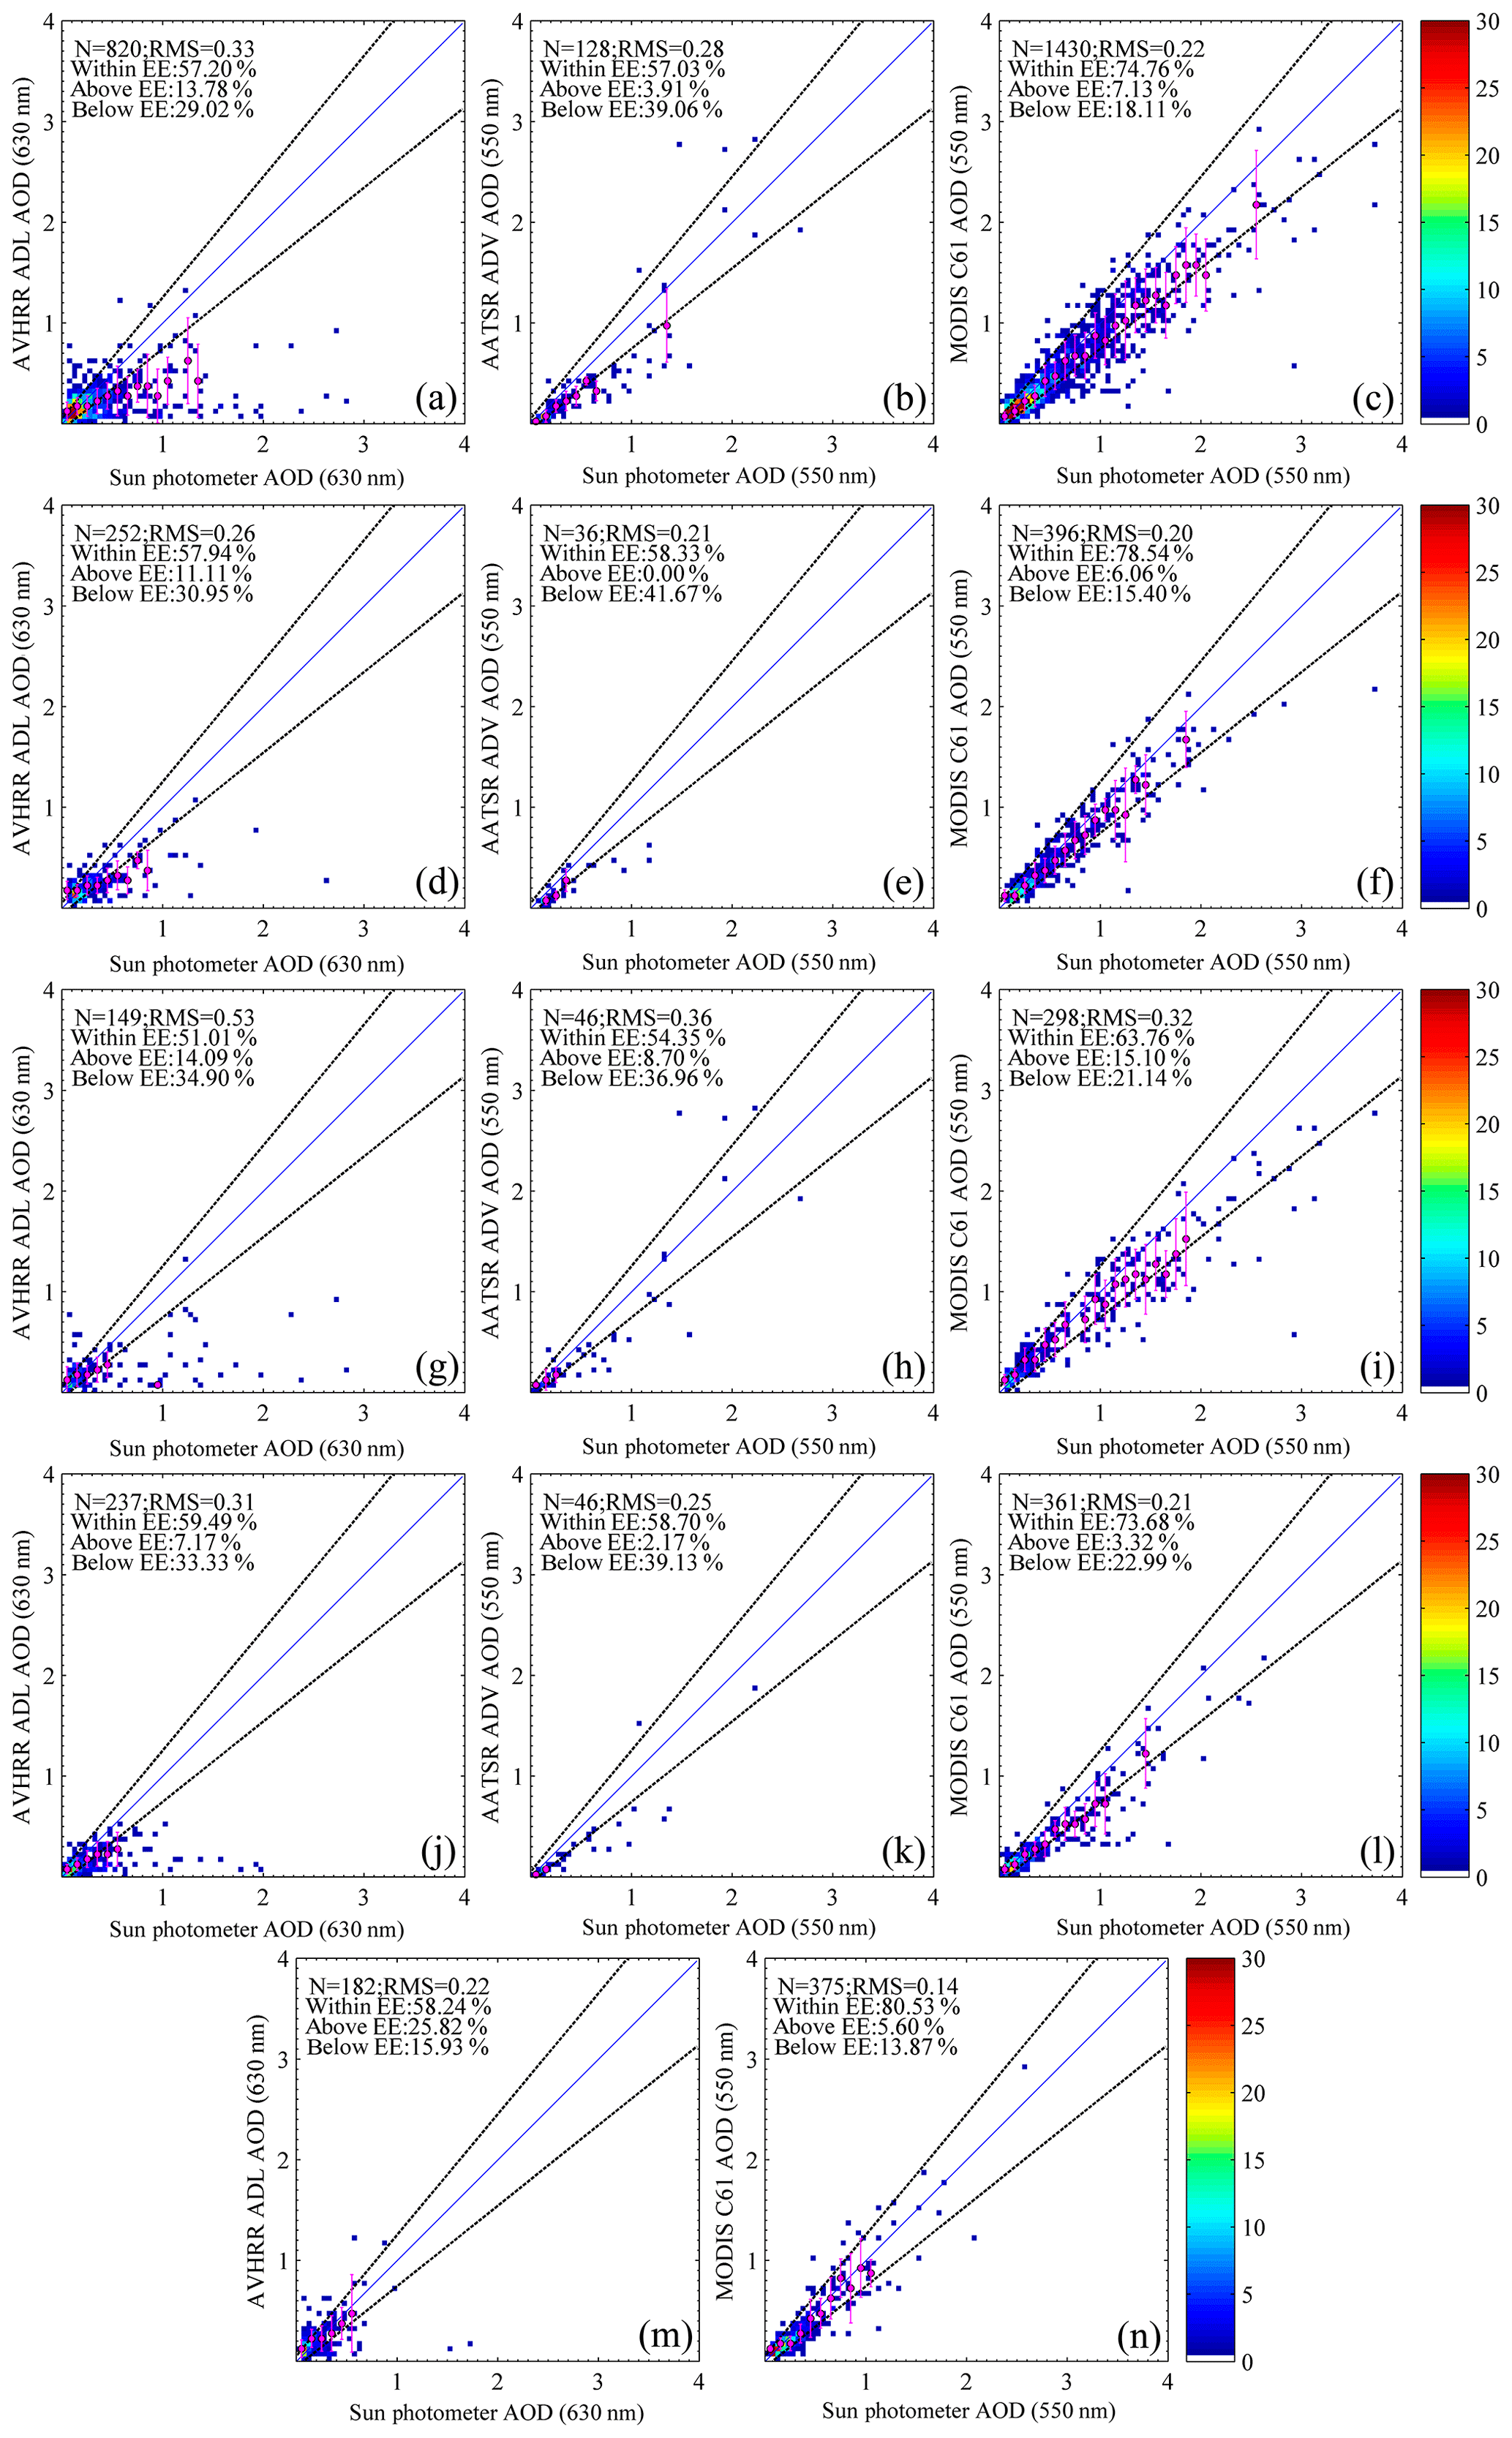
Figure A3Scatter density plots of satellite-retrieved AOD vs. sun-photometer-retrieved AOD data from XiangHe station. The ADL of all data (a), only spring data (d), only summer data (g), only autumn data (j) and only winter data (m) vs. AERONET. The ADV of all data (b), only spring data (e), only summer data (h) and only autumn data (k) vs. AERONET. MODIS using all data (c), only spring data (f), only summer data (i), only autumn data (l) and only winter data (n) vs. AERONET.
The MODIS data are publicly available from the LAADS DAAC website at https://ladsweb.modaps.eosdis.nasa.gov/ (LAADS DAAC, 2019). The ATSR data are released officially from the CCI website at http://www.icare.univ-lille1.fr/cci (ICARE Data and Services Center, 2019). The AERONET data can be downloaded freely from https://aeronet.gsfc.nasa.gov/ (AERONET, 2019).
YC and YX produced and analysed the AVHRR AOD data. GL produced and analysed the ATSR AOD data. YC and JG downloaded and analysed the MODIS and AERONET AOD data. LS performed the broadband solar radiation measurements and provide the BEM AOD data. HC performed the CIMEL sun photometers measurements and provide the CARSNET data. YC, JG and GL prepared the article with contributions from the other authors. All authors contributed to discussion and interpretation.
The authors declare that they have no conflict of interest.
We are thankful to the MODIS data centers for providing access to the data. ATSR AOD data were made available through ICARE. The radiance-derived AOD data were made available under the support of the National Basic Research Program of China (grant no. 2010CB950803). Many thanks are due to the principal investigators of the AERONET, CARSNET, and China National Solar Radiation sites, for maintaining their sites and making their data available, and to the AERONET, CARSNET coordination team for organizing and maintaining excellent and essential support for satellite retrieval development and validation. The authors would like to thank the reviewers and the editors for their constructive and helpful suggestions.
This research has been supported in part by the Strategic Priority Research Program of the Chinese Academy of Sciences (grant no. XDA19080303), the Ministry of Science and Technology (MOST) of China (grant nos. 2016YFC0200500 and 2010CB950803), and the National Natural Science Foundation of China (grant nos. 41471306, 41711530127, 41871260 and 41471303), as well as the Academy of Finland's Research Council for Natural Sciences and Engineering (project no. 308295).
This paper was edited by Thomas Eck and reviewed by Andrew Sayer and other two anonymous referees.
AERONET: available at: https://aeronet.gsfc.nasa.gov/, last access: 27 June 2019.
Allen, R. C., Durkee, P. A., and Wash, C .H.: Snow/Cloud Discrimination with Multispectral Satellite Measurements, J. Appl. Meteorol. Clim., 29, 994–1004, https://doi.org/10.1175/1520-0450(1990)029<0994:SDWMSM>2.0.CO;2, 1990.
Ångström, A.: Solar and terrestrial radiation. Report to the international commission for solar research on actinometric investigations of solar and atmospheric radiation, Q. J. Roy. Meteor. Soc., 50, 121–126, https://doi.org/10.1002/qj.49705021008, 1924.
Bai, J., de Leeuw, G., van der A, R., De Smedt, I., Theys, N., Van Roozendael, M., Sogacheva, L., and Chaia, W.: Variations and photochemical transformations of atmospheric constituents in North China, Atmos. Environ., 189, 213–226, https://doi.org/10.1016/j.atmosenv.2018.07.004, 2018.
Boucher, O., Randall, D., Artaxo, P., Bretherton, C., Feingold, G., Forster, P., Kerminen, V.-M., Kondo, Y., Liao, H., Lohmann, U., Rasch, P., Satheesh, S.K., Sherwood, S., Stevens, B., and Zhang, X.: Clouds and Aerosols, in: Climate Change 2013: The Physical Science Basis, Contribution of Working Group I to the Fifth Assessment Report of the Intergovernmental Panel on Climate Change, Cambridge University Press, Cambridge, United Kingdom and New York, NY, USA, 2013.
Che, H., Zhang, X. Y., Chen, H. B., Damiri, B., Goloub, P., Li, Z. Q., Zhang, X. C., Wei, Y., Zhou, H. G., Dong, F., Li, D. P., and Zhou, T. M.: Instrument calibration and aerosol optical depth validation of the China Aerosol Remote Sensing Network, J. Geophys. Res., 114, D03206, https://doi.org/10.1029/2008JD011030, 2009.
Che, H., Zhang, X.-Y., Xia, X., Goloub, P., Holben, B., Zhao, H., Wang, Y., Zhang, X.-C., Wang, H., Blarel, L., Damiri, B., Zhang, R., Deng, X., Ma, Y., Wang, T., Geng, F., Qi, B., Zhu, J., Yu, J., Chen, Q., and Shi, G.: Ground-based aerosol climatology of China: aerosol optical depths from the China Aerosol Remote Sensing Network (CARSNET) 2002–2013, Atmos. Chem. Phys., 15, 7619–7652, https://doi.org/10.5194/acp-15-7619-2015, 2015.
Che, Y., Xue, Y., Mei, L., Guang, J., She, L., Guo, J., Hu, Y., Xu, H., He, X., Di, A., and Fan, C.: Technical note: Intercomparison of three AATSR Level 2 (L2) AOD products over China, Atmos. Chem. Phys., 16, 9655–9674, https://doi.org/10.5194/acp-16-9655-2016, 2016.
Chu, D. A., Kaufman, Y. J., Ichoku, C., Remer, L. A., Tanré, D., and Holben, B. N.: Validation of MODIS aerosol optical depth retrieval over land, dust, Geophys. Res. Lett., 29, MOD2-1–MOD2-4, https://doi.org/10.1029/2001GL013205, 2002.
de Leeuw, G., Holzer-Popp, T., Bevan, S., Davies, W. H., Descloitres, J., Grainger, R. G., Griesfeller, J., Heckel, A., Kinne, S., Klüser, L., Kolmonen, P., Litvinov, P., Martynenko, D., North, P., Ovigneur, B., Pascal, N., Poulsen, C., Ramon, D., Schulz, M., Siddans, R., Sogacheva, L., Tanré, D., Thomas, G. E., Virtanen, T. H., von Hoyningen-Huene, W., Vountas, M., and Pinnock, S.: Evaluation of seven European aerosol optical depth retrieval algorithms for climate analysis, Remote Sens. Environ., 162, 295–315, https://doi.org/10.1016/j.rse.2013.04.023, 2015.
de Leeuw, G., Sogacheva, L., Rodriguez, E., Kourtidis, K., Georgoulias, A. K., Alexandri, G., Amiridis, V., Proestakis, E., Marinou, E., Xue, Y., and van der A, R.: Two decades of satellite observations of AOD over mainland China using ATSR-2, AATSR and MODIS/Terra: data set evaluation and large-scale patterns, Atmos. Chem. Phys., 18, 1573–1592, https://doi.org/10.5194/acp-18-1573-2018, 2018.
Eck, T. F., Holben, B. N., Reid, J. S., Dubovik, O., Smirnov, A., O'Neill, N. T., Slutsker, I., and Kinne, S.: Wavelength dependence of the optical depth of biomass burning, urban, and desert dust aerosols, J. Geophys. Res.-Atmos., 104, 31333–31349, https://doi.org/10.1029/1999JD900923, 1999.
Flowerdew, R. J. and Haigh, J. D.: An approximation to improve accuracy in the derivation of surface reflectance from multi-look satellite radiometers, Geophys. Res. Lett., 23, 1693–1696, https://doi.org/10.1029/95GL01662, 1995.
Gao, L., Chen, L., Li, J., Heidinger, A., Xu, X., and Qin, S.: A Long-Term Historical Aerosol Optical Depth Data Record (1982–2011) Over China From AVHRR, IEEE T. Geosci. Remote, 57, 2467–2480, https://doi.org/10.1109/TGRS.2018.2873944, 2018.
Giles, D. M., Sinyuk, A., Sorokin, M. G., Schafer, J. S., Smirnov, A., Slutsker, I., Eck, T. F., Holben, B. N., Lewis, J. R., Campbell, J. R., Welton, E. J., Korkin, S. V., and Lyapustin, A. I.: Advancements in the Aerosol Robotic Network (AERONET) Version 3 database – automated near-real-time quality control algorithm with improved cloud screening for Sun photometer aerosol optical depth (AOD) measurements, Atmos. Meas. Tech., 12, 169–209, https://doi.org/10.5194/amt-12-169-2019, 2019.
Govaerts, Y. M., Wagner, S., Lattanzio, A., and Watts, P.: Joint retrieval of surface reflectance and aerosol optical depth from MSG/SEVIRI observations with an optimal estimation approach: 1. Theory, J. Geophys. Res.-Atmos., 115, D02203, https://doi.org/10.1029/2009JD011779, 2010.
Guerreiro, C. B. B., Foltescu, V., and de Leeuw, F.: Air quality status and trends in Europe, Atmos. Environ., 98, 376–384, https://doi.org/10.1016/j.atmosenv.2014.09.017, 2014.
Guo, J. P., Zhai, P., Wu, L., Cribb, M., Li, Z., Ma, Z., Wang, F., Chu, D., Wang, P., and Zhang, J.: Precipitation and air pollution at mountain and plain stations in northern China: Insights gained from observations and modeling, J. Geophys. Res.-Atmos., 119, 4793–4807, https://doi.org/10.1002/2013jd021161 2014.
Guo, J., Deng, M., Lee, S. S., Wang, F., Li, Z., Zhai, P., Liu, H., Lv, W., Yao, W., and Li, X.: Delaying precipitation and lightning by air pollution over the Pearl River Delta. Part I: Observational analyses, J. Geophys. Res.-Atmos., 121, 6472–6488, https://doi.org/10.1002/2015JD023257, 2016a.
Guo, M., Sun, L., and Xu, X.: Inter-comparison of aerosol optical thickness from MODIS, MISR, and OMI using measurements from solar radiation stations in China, in: Proceedings of SPIE 9876, Remote Sensing of the Atmosphere, Clouds, and Precipitation VI, New Delhi, India, 6 September 2016, https://doi.org/10.1117/12.2228000, 2016b.
Guo, J., Liu, H., Li, Z., Rosenfeld, D., Jiang, M., Xu, W., Jiang, J. H., He, J., Chen, D., Min, M., and Zhai, P.: Aerosol-induced changes in the vertical structure of precipitation: a perspective of TRMM precipitation radar, Atmos. Chem. Phys., 18, 13329–13343, https://doi.org/10.5194/acp-18-13329-2018, 2018.
Hao, J., Wang, S., Liu, B., and He, K.: Designation of acid rain and SO2 control zones and control policies in China, J. Environ. Sci. Heal. A, 35, 1901–1914, https://doi.org/10.1080/10934520009377085, 2000.
Hauser, A., Oesch, D., Foppa, N., and Wunderle, S.: NOAA AVHRR derived aerosol optical depth over land, J. Geophys. Res., 110, D08204, https://doi.org/10.1029/2004JD005439, 2005.
Holben, B. N., Eck, T. F., Slutsker, I., Tanré, D., Buis, J. P., Setzer, K. A., Vermote, E., Reagan, J. A., Kaufman, Y. J., Nakajima, T., Lavenu, F., Jankowiak, I., and Smirnov, A.: AERONET—A Federated Instrument Network and Data Archive for Aerosol Characterization, Remote Sens. Environ., 66, 1–16, https://doi.org/10.1016/S0034-4257(98)00031-5, 1998.
Hollmann, R., Merchant, C. J., Saunders, R., Downy, C., Buchwitz, M., Cazenave, A., Chuvieco, E., Defourny, P., de Leeuw, G., Forsberg, R., Holzer-Popp, T., Paul, F., Sandven, S., Sathyendranath, S., van Roozendael, M., and Wagner, W.: The ESA climate change initiative: satellite data records for essential climate variables, B. Am. Meteorol. Soc., 94, 1541–1552, https://doi.org/10.1175/BAMS-D-11-00254.1, 2013.
Holzer-Popp, T., de Leeuw, G., Griesfeller, J., Martynenko, D., Klüser, L., Bevan, S., Davies, W., Ducos, F., Deuzé, J. L., Graigner, R. G., Heckel, A., von Hoyningen-Hüne, W., Kolmonen, P., Litvinov, P., North, P., Poulsen, C. A., Ramon, D., Siddans, R., Sogacheva, L., Tanre, D., Thomas, G. E., Vountas, M., Descloitres, J., Griesfeller, J., Kinne, S., Schulz, M., and Pinnock, S.: Aerosol retrieval experiments in the ESA Aerosol_cci project, Atmos. Meas. Tech., 6, 1919–1957, https://doi.org/10.5194/amt-6-1919-2013, 2013.
Hsu, N. C., Tsay, S. -C., King, M. D., and Herman, J. R.: Aerosol properties over bright-reflecting source regions, IEEE T. Geosci. Remote, 42, 557–569, https://doi.org/10.1109/TGRS.2004.824067, 2004.
Hsu, N. C., Jeong, M.-J., Bettenhausen, C., Sayer, A. M., Hansell, R., Seftor, C. S., Huang, J., and Tsay, S.-C.: Enhanced Deep Blue aerosol retrieval algorithm: The second generation, J. Geophys. Res.-Atmos., 118, 9296–9315, https://doi.org/10.1002/jgrd.50712, 2013.
Hsu, N. C., Lee, J., Sayer, A. M., Carletta, N., Chen, S.-H., Tucker, C. J., Holben, B. N., and Tsay, S.-C.: Retrieving Near-Global Aerosol Loading over Land and Ocean from AVHRR, J. Geophys. Res.-Atmos., 122, 9968–9989, https://doi.org/10.1002/2017JD026932, 2017.
ICARE Data and Services Center: available at: http://www.icare.univ-lille1.fr/, last access: 27 June 2019.
Ichoku, C, Chu, D. A., Mattoo, S., Kaufman, Y. J., Remer, L. A., Tanré, D., Slutsker, I., and Holben, B. N.: A spatio-temporal approach for global validation and analysis of MODIS aerosol products, Geophys. Res. Lett., 29, MOD1-1–MOD1-4, https://doi.org/10.1029/2001GL013206, 2002.
Jin, Y., Andersson, H., and Zhang, S.: Air Pollution Control Policies in China: A Retrospective and Prospects, Int. J. Env. Res. Pub. He., 13, 1219, https://doi.org/10.3390/ijerph13121219, 2016.
Kang, H., Zhu, B., van der A. R., Zhu, C., de Leeuw, G., Hou, X., and Gao, J.: Natural and anthropogenic contributions to long-term variations of SO2, NO2, CO, and AOD over East China, Atmos. Environ., 215, 284–293, https://doi.org/10.1016/j.atmosres.2018.09.012, 2018.
Kaufman, Y. J., Wald, A. E., Remer, L. A., Gao, B. C., Li, R. R., and Flynn, L.: The MODIS 2.1-mu m channel – Correlation with visible reflectance for use in remote sensing of aerosol, IEEE T. Geosci. Remote, 35, 1286–1298, https://doi.org/10.1109/36.628795, 1997.
Koren, I., Dagan, G., and Altaratz, O.: From aerosol-limited to invigoration of warm convective clouds, Science, 344, 1143–1146, 2014.
Kolmonen, P., Sogacheva, L., Virtanen, T.H., de Leeuw, G., and Kulmala, M.: The ADV/ASV AATSR aerosol retrieval algorithm: current status and presentation of a full-mission AOD data set, Int. J. Digit. Earth, 9, 545–561, https://doi.org/10.1080/17538947.2015.1111450, 2016.
LAADS DAAC: available at: https://ladsweb.modaps.eosdis.nasa.gov/, last access: 18 July 2019.
Levy, R. C., Remer, L. A., Kleidman, R. G., Mattoo, S., Ichoku, C., Kahn, R., and Eck, T. F.: Global evaluation of the Collection 5 MODIS dark-target aerosol products over land, Atmos. Chem. Phys., 10, 10399–10420, https://doi.org/10.5194/acp-10-10399-2010, 2010.
Levy, R. C., Mattoo, S., Munchak, L. A., Remer, L. A., Sayer, A. M., Patadia, F., and Hsu, N. C.: The Collection 6 MODIS aerosol products over land and ocean, Atmos. Meas. Tech., 6, 2989–3034, https://doi.org/10.5194/amt-6-2989-2013, 2013.
Li, Y., Xue, Y., de Leeuw, G., Li, C., Yang, L., Hou, T., and Marir, F.: Retrieval of aerosol optical depth and surface reflectance over land from NOAA AVHRR data, Remote Sens. Environ., 133, 1–20, 2013.
Li, Z., Xu, H., Li, K. T., Li, D. H., Xie, Y. S., Li, L., Zhang, Y., Gu, X. F., Zhao, W., Tian, Q. J., Deng, R. R., Su, X. L., Huang, B., Qiao, Y. L., Cui, W. Y, Hu, Y., Gong, C. L., Wang, Y. Q., Wang, X. F., Wang, J. P., Du, W. B., Pan, Z. Q., Li, Z. Z., and Bu, D.: Comprehensive study of optical, physical, chemical and radiative properties of total columnar atmospheric aerosols over China: An overview of Sun-sky radiometer Observation NETwork (SONET) measurements, B. Am. Meteorol. Soc., 99, 739–755, https://doi.org/10.1175/BAMS-D-17-0133.1, 2018.
Mei, L. L., Xue, Y., Kokhanovsky, A. A., von Hoyningen-Huene, W., de Leeuw, G., and Burrows, J. P.: Retrieval of aerosol optical depth over land surfaces from AVHRR data, Atmos. Meas. Tech., 7, 2411–2420, https://doi.org/10.5194/amt-7-2411-2014, 2014.
Popp, T., de Leeuw, G., Bingen, C., Brühl, C., Capelle, V., Chedin, A., Clarisse, L., Dubovik, O., Grainger, R., Griesfeller, J., Heckel, A., Kinne, S., Klüser, L., Kosmale, M., Kolmonen, P., Lelli, L., Litvinov, P., Mei, L., North, P., Pinnock, S., Povey, A., Robert, C., Schulz, M., Sogacheva, L., Stebel, K., Stein Zweers, D., Thomas, G., Tilstra, L.G., Vandenbussche, S., Veefkind, P., Vountas, M., and Xue, Y.: Development, production and evaluation of aerosol Climate Data Records from European satellite observations (Aerosol_cci), Remote Sens., 8, 421, https://doi.org/10.3390/rs8050421, 2016.
Qiu, J.: A Method to Determine Atmospheric Aerosol Optical Depth Using Total Direct Solar Radiation, J. Atmos. Sci., 55, 744–757, https://doi.org/10.1175/1520-0469(1998)055<0744:AMTDAA>2.0.CO;2, 1998.
Remer, L. A., Kaufman, Y. J., Tanré, D., Mattoo, S., Chu, D. A., Martins, J. V., Li, R.-R., Ichoku, C., Levy, R. C., Kleidman, R. G., Eck, T. F., Vermote, E., and Holben, B. N.: The MODIS aerosol algorithm, products, and validation, J. Atmos. Sci., 62, 947–973, https://doi.org/10.1175/JAS3385.1, 2005.
Riffler, M., Popp, C., Hauser, A., Fontana, F., and Wunderle, S.: Validation of a modified AVHRR aerosol optical depth retrieval algorithm over Central Europe, Atmos. Meas. Tech., 3, 1255–1270, https://doi.org/10.5194/amt-3-1255-2010, 2010.
Robel, J., and Graumann, A.: NOAA KLM USER'S GUIDE with NOAA-N, N Prime, and MetOp SUPPLEMEN, available at: https://www.nasa.gov/pdf/111742main_noaa_n_booklet.pdf (last access: 13 July 2019), 2014.
Salomonson, V. V., Barnes, W. L., Maymon, P. W., Montgomery, H. E., Ostrow, H.: MODIS – Advanced facility instrument for studies of the earth as a system, IEEE T. Geosci. Remote, 27, 145–153, https://doi.org/10.1109/36.20292, 1989.
Sayer, A. M., Hsu, N. C., Bettenhausen, C., and Jeong, M.-J.: Validation and uncertainty estimates for MODIS Collection 6 “Deep Blue” aerosol data, J. Geophys. Res.-Atmos., 118, 7864–7872, https://doi.org/10.1002/jgrd.50600, 2013.
Sayer, A. M., Munchak, L. A., Hsu, N. C., Levy, R. C., Bettenhausen, C., and Jeong, M.-J.: MODIS Collection 6 aerosol products: Comparison between Aqua's e-Deep Blue, Dark Target, and “merged” data sets, and usage recommendations, J. Geophys. Res.-Atmos., 119, 13965–13989, https://doi.org/10.1002/2014JD022453, 2014.
Sayer, A. M., Hsu, N. C., Bettenhausen, C., Jeong, M.-J., and Meister, G.: Effect of MODIS Terra radiometric calibration improvements on Collection 6 Deep Blue aerosol products: Validation and Terra/Aqua consistency, J. Geophys. Res.-Atmos., 120, 12157–12174, https://doi.org/10.1002/2015JD023878, 2015.
Sayer, A. M., Hsu, N. C., Lee, J., Carletta, N., Chen, S.-H., and Smirnov, A.: Evaluation of NASA Deep Blue/SOAR aerosol retrieval algorithms applied to AVHRR measurements, J. Geophys. Res.-Atmos., 122, 9945–9967, https://doi.org/10.1002/2017JD026934, 2017.
Seinfeld, J. H., Pandis, S. N., and Noone, K.: Atmospheric Chemistry and Physics: From Air Pollution to Climate Change, Phys. Today, 51, 88, https://doi.org/10.1063/1.882420, 1998.
Sogacheva, L., Kolmonen, P., Virtanen, T. H., Rodriguez, E., Saponaro, G., and de Leeuw, G.: Post-processing to remove residual clouds from aerosol optical depth retrieved using the Advanced Along Track Scanning Radiometer, Atmos. Meas. Tech., 10, 491–505, https://doi.org/10.5194/amt-10-491-2017, 2017.
Sogacheva, L., de Leeuw, G., Rodriguez, E., Kolmonen, P., Georgoulias, A. K., Alexandri, G., Kourtidis, K., Proestakis, E., Marinou, E., Amiridis, V., Xue, Y., and van der A, R. J.: Spatial and seasonal variations of aerosols over China from two decades of multi-satellite observations – Part 1: ATSR (1995–2011) and MODIS C6.1 (2000–2017), Atmos. Chem. Phys., 18, 11389–11407, https://doi.org/10.5194/acp-18-11389-2018, 2018a.
Sogacheva, L., Rodriguez, E., Kolmonen, P., Virtanen, T. H., Saponaro, G., de Leeuw, G., Georgoulias, A. K., Alexandri, G., Kourtidis, K., and van der A, R. J.: Spatial and seasonal variations of aerosols over China from two decades of multi-satellite observations – Part 2: AOD time series for 1995–2017 combined from ATSR ADV and MODIS C6.1 and AOD tendency estimations, Atmos. Chem. Phys., 18, 16631–16652, https://doi.org/10.5194/acp-18-16631-2018, 2018b.
Stowe, L. L., McClain, E. P., Carey, R., Pellegrino, P., Gutman, G. G., Davis, P., Long, C., and Hart, S.: Global distribution of cloud cover derived from NOAA/AVHRR operational satellite data, Adv. Space Res., 11, 51–54, https://doi.org/10.1016/0273-1177(91)90402-6, 1991.
Stowe, L. L., Davis, P. A., and McClain, E. P.: Scientific basis and initial evaluation of the CLAVR-1 global clear cloud classification algorithm for the advanced very high resolution radiometer, J. Atmos. Ocean. Tech., 16, 656–681, https://doi.org/10.1175/1520-0426(1999)016<0656:SBAIEO>2.0.CO;2, 1999.
Sundström, A.-M., Kolmonen, P., Sogacheva L., and de Leeuw, G.: Aerosol retrievals over China with the AATSR Dual-View Algorithm, Remote Sens. Environ., 116, 189–198, https://doi.org/10.1016/j.rse.2011.04.041, 2012.
Tanré, D., Kaufman, Y. J., Herman, M., and Mattoo, S.: Remote sensing of aerosol properties over oceans using the MODIS/EOS spectral radiances, J. Geophys. Res.-Atmos., 102, 16971–16988, https://doi.org/10.1029/96JD03437, 1997.
van der A, R. J., Mijling, B., Ding, J., Koukouli, M. E., Liu, F., Li, Q., Mao, H., and Theys, N.: Cleaning up the air: effectiveness of air quality policy for SO2 and NOx emissions in China, Atmos. Chem. Phys., 17, 1775–1789, https://doi.org/10.5194/acp-17-1775-2017, 2017.
Veefkind, J.P., de Leeuw, G., and Durkee, P.A: Retrieval of aerosol optical depth over land using two-angle view satellite radiometry during TARFOX, Geophys. Res. Lett., 25, 3135–3138, https://doi.org/10.1029/98GL02264, 1998.
Wang, Y., Yao, L., Wang, L., Liu Z., Ji, D., Tang, G., Zhang, J., Sun, Y., Hu, B., and Xin, J.: Mechanism for the formation of the January 2013 heavy haze pollution episode over central and eastern China, Sci. China Earth Sci., 57, 12–25, https://doi.org/10.1007/s11430-013-4773-4, 2013.
WHO: World Health Organization, available at: http://www.who.int/phe/health_topics/outdoorair/databases/en/, last access: 16 July 2018.
Xin, J., Wang, Y., Pan. Y., Ji, D., Liu, Z., Wen, T., Wang, Y., Li, X., Sun, Y., Sun J., Wang P., Wang G., Wang X., Cong Z., Song T., Hu B., Wang L., Tang G., Gao W., Guo Y., Miao H., Tian S., and Wang L., The Campaign on Atmospheric Aerosol Research Network of China: CARE-China, B. Am. Meteorol. Soc., 96, 1137–1155, https://doi.org/10.1175/BAMS-D-14-00039.1, 2015.
Xu, X., Qiu, J., Xia, X., Sun, L., and Min M.: Characteristics of atmospheric aerosol optical depth variation in China during 1993–2012, Atmos. Environ., 119, 82–94, https://doi.org/10.1016/j.atmosenv.2015.08.042, 2015.
Xue, Y., He, X., de Leeuw, G., Mei, L., Che, Y., Rippin, W., Guang, J., and Hu, Y. : Long-time series aerosol optical depth retrieval from AVHRR data over land in North China and Central Europe, Remote Sens. Environ., 198, 471–489, https://doi.org/10.1016/j.rse.2017.06.036, 2017.
Zhang, J., Reid, J. S., Alfaro-Contreras, R., and Xian, P.: Has China been exporting less particulate air pollution over the past decade?, Geophys. Res. Lett., 44, 2941–2948, https://doi.org/10.1002/2017GL072617, 2017.
Zhao, B., Jiang, J. H., Gu, Y., Diner, D., Worden, J., Liou, K.-N., Su, H., Xing, J., Garay, M., and Huang, L.: Decadal-scale trends in regional aerosol particle properties and their linkage to emission changes, Environ. Res. Lett., 12, 054021, doi.org/10.1088/1748-9326/aa6cb2, 2017.
Zhao, T. X.-P., Laszlo, I., Guo, W., Heidinger, A., Cao, C., Jelenak, A., Tarpley, D., and Sullivan, J.: Study of long-term trend in aerosol optical thickness observed from operational AVHRR satellite instrument, J. Geophys. Res., 113, D07201, https://doi.org/10.1029/2007JD009061, 2008.
Zheng, B., Tong, D., Li, M., Liu, F., Hong, C., Geng, G., Li, H., Li, X., Peng, L., Qi, J., Yan, L., Zhang, Y., Zhao, H., Zheng, Y., He, K., and Zhang, Q.: Trends in China's anthropogenic emissions since 2010 as the consequence of clean air actions, Atmos. Chem. Phys., 18, 14095–14111, https://doi.org/10.5194/acp-18-14095-2018, 2018.