the Creative Commons Attribution 4.0 License.
the Creative Commons Attribution 4.0 License.
 | 01 Aug 2019
Recent improvements of long-path DOAS measurements: impact on accuracy and stability of short-term and automated long-term observations
Jan-Marcus Nasse
Philipp G. Eger
Denis Pöhler
Stefan Schmitt
Udo Frieß
Ulrich Platt
Over the last few decades, differential optical absorption spectroscopy (DOAS) has been used as a common technique to simultaneously measure abundances of a variety of atmospheric trace gases. Exploiting the unique differential absorption cross section of trace-gas molecules, mixing ratios can be derived by measuring the optical density along a defined light path and by applying the Beer–Lambert law. Active long-path (LP-DOAS) instruments can detect trace gases along a light path of a few hundred metres up to 20 km, with sensitivities for mixing ratios down to ppbv and pptv levels, depending on the trace-gas species. To achieve high measurement accuracy and low detection limits, it is crucial to reduce instrumental artefacts that lead to systematic structures in the residual spectra of the analysis. Spectral residual structures can be introduced by most components of a LP-DOAS measurement system, namely by the light source, in the transmission of the measurement signal between the system components or at the level of spectrometer and detector. This article focuses on recent improvements by the first application of a new type of light source and consequent changes to the optical setup to improve measurement accuracy.
Most state-of-the-art LP-DOAS instruments are based on fibre optics and use xenon arc lamps or light-emitting diodes (LEDs) as light sources. Here we present the application of a laser-driven light source (LDLS), which significantly improves the measurement quality compared to conventional light sources. In addition, the lifetime of LDLS is about an order of magnitude higher than of typical Xe arc lamps. The small and very stable plasma discharge spot of the LDLS allows the application of a modified fibre configuration. This enables a better light coupling with higher light throughput, higher transmission homogeneity, and a better suppression of light from disturbing wavelength regions. Furthermore, the mode-mixing properties of the optical fibre are enhanced by an improved mechanical treatment. The combined effects lead to spectral residual structures in the range of root mean square (rms; in units of optical density). This represents a reduction of detection limits of typical trace-gas species by a factor of 3–4 compared to previous setups. High temporal stability and reduced operational complexity of this new setup allow the operation of low-maintenance, automated LP-DOAS systems, as demonstrated here by more than 2 years of continuous observations in Antarctica.


Active long-path differential optical absorption spectroscopy (LP-DOAS) is a well-established remote-sensing technique based on the DOAS principle introduced by Perner et al. (1976) and Platt and Perner (1980, 1983). It can attain detection limits on the order of ppbv to pptv (nanomole per mole to picomole per mole) for absorbers in the ultraviolet to near-infrared spectral range (270–800 nm). Detectable species include NO2, NO3, HONO, O3, SO2, ClO, OClO, BrO, IO, OBrO, OIO, I2, OIO, formaldehyde, glyoxal, and the oxygen dimer O4. LP-DOAS setups have been used in various applications, such as studying urban pollution (Platt et al., 1980, 1981; Volkamer et al., 2005; Platt et al., 2009; Asaf et al., 2010; Chan et al., 2012; Lu et al., 2015) and its vertical distribution (Alicke et al., 2002; Veitel et al., 2002; Stutz et al., 2004; Wang et al., 2006); in remote sensing of volcanic emissions (Kern et al., 2009); investigation of atmospheric halogen chemistry in coastal (Peters et al., 2005; Pikelnaya et al., 2007; Keene et al., 2007; Commane et al., 2011), desert (Hebestreit, 1999; Holla et al., 2015), or polar regions (Hausmann and Platt, 1994; Hönninger et al., 2004; Frieß et al., 2011; Liao et al., 2011; Stutz et al., 2011); and ship-borne in the Arctic sea ice region (Pöhler et al., 2010).
The main advantage of DOAS in atmospheric remote sensing is that it allows the contact-free and simultaneous measurement of several trace gases. Exploiting that many molecules have unique differential absorption cross sections, mixing ratios can be derived by measuring the optical density of long light paths in the atmosphere using the DOAS principle (see, e.g. Platt and Stutz, 2008, for a detailed introduction).
In contrast to passive instruments (e.g. multi-axis DOAS, MAX-DOAS, or satellite instruments), which use scattered or reflected light and hence rely on natural light sources such as solar (or lunar; Wagner et al., 2000) radiation, active DOAS instruments use artificial light sources such as light-emitting diodes (LEDs) or arc lamps. The independence from natural light sources allows continuous observations of trace gases to study night-time chemistry, for example. It also enables investigations of trace gases absorbing in the deep UV where no natural light sources exist. Another advantage is the well-defined light path of up to 20 km. Along this light path, a mean mixing ratio is determined. In comparison to passive instruments, this reduces the analytical effort to obtain mixing ratios and usually leads to smaller uncertainties as no radiative transport models are needed for the interpretation of the data. Furthermore, compared to point measurements, long-path DOAS results are less sensitive to large spatial gradients yielding concentrations with a better representativeness for comparison with chemistry models or typical footprints of airborne platforms and satellites.
Most modern LP-DOAS setups use fibre optics for light transfer between light source, telescope, and spectrometer (Merten et al., 2011), and a mono-static telescope; i.e. one telescope is used for both sending and receiving the light reflected from a retro-reflector array. In the following, recent improvements to this setup will be presented which, in combination, can increase accuracy and precision and hence reduce detection limits of LP-DOAS measurements by a factor of 3 to 4 compared to previous setups. To achieve this, a novel light source type was applied and the light coupling from the light source to the telescope was optimized to reduce stray light. Furthermore, a new configuration of the optical fibres with an improved mode mixing was introduced. In addition to an enhanced measurement performance, these improvements have made the previously quite cumbersome setup of LP-DOAS instruments considerably easier and now allow the operation of low-maintenance, automated instruments for long-term observations.
In Sect. 2 the state of the art in LP-DOAS instrument design will be described. Improvements of measurement performance and operation procedure following the introduction of the novel light source and changes to the fibre configuration are presented in Sect. 3. In Sect. 4 the influence of residual structures due to fibre modes and a new method for mode mixing to reduce these structures is presented. In Sect. 5 the combined contribution to the improved instrument performance with respect to reduced stray light and reduction of total noise is quantified based both on lab measurements and field campaigns, and typical detection limits for setups that incorporate the improvements are presented.
LP-DOAS instruments couple light from an artificial light source into a telescope, which creates a light beam that is transmitted through the atmosphere across a distance ranging from a couple of hundred metres to several kilometres. At the end of this atmospheric path, the light is collected by a telescope and analysed for spectral absorption structures – typically with a grating spectrometer. This originally bi-static setup with separate telescopes for sending and receiving was replaced by a mono-static setup with a single telescope and a retro-reflector array introduced by Axelsson et al. (1990). After reflection at the retro-reflector, the light is received again by the same telescope, which reduces the complexity of the setup with regard to power supply and alignment. It also doubles the length of the light path. State-of-the-art LP-DOAS instruments mostly rely on fibre optics for light coupling between light source, telescope, and spectrometer (see Fig. 1). Compared to traditional systems that use a complex system of mirrors for the light coupling between light source, telescope, and spectrometer, this approach, first introduced by Merten et al. (2011), further reduces the complexity of alignment of the telescope itself and increases the transmittance compared to the coaxial Newton-type telescopes used with the mirror coupling.
2.1 State-of-the-art instrument setup
The crucial components in a modern fibre-based LP-DOAS setup are the light source and a Y-shaped optical fibre bundle, where one end serves as sending fibre bundle that guides the light from the light source to the telescope and the other end serves as a receiving fibre bundle, leading from the telescope to the spectrometer (see Fig. 1). According to Merten et al. (2011), the fibre bundle in such a “classical” setup (see upper row in Fig. 2 for a detailed schematic of the sections of the bundle) on the transmitting end typically consists of a mono fibre with a large diameter (typically 800 µm) to maximize light collection at the light source (at letter A in Fig. 1 and also the upper row of column a in Fig. 2). This fibre is then coupled to a ring of smaller diameter (200 µm) fibres (at letter B in Fig. 1 and column b in Fig. 2) leading to the combined end of the bundle. The monofibre (800 µm) is required to guarantee an equal illumination of all small diameter fibres of the ring. Then the end of the bundle (letter C in Fig. 1 and column c in Fig. 2) is placed close to the focal point of the telescope mirror to create a parallelized light beam. For a fibre at the focal point of a parabolic mirror and omitting beam widening effects, the light emitted by the sending fibre bundle would be imaged on itself, so that no light would reach the receiving fibre. However, there are a number of effects that blur the reflected image of the light source and lead to a coupling of light into the central receiving fibre: (a) comatic aberration when the incident beam is parallel but not paraxial, (b) diffraction at the apertures of telescope and retro-reflectors, (c) surface irregularities of mirror and retro-reflectors, (d) defocusing of the fibre bundle, (e) atmospheric turbulence, and (f) for spherical main mirrors the spherical aberration in combination with the lateral offset of the beam at the retro-reflectors (Rityn, 1967; Eckhardt, 1971; Merten et al., 2011). Merten et al. (2011) have determined (a)–(c) to have a negligible influence for components typically used in LP-DOAS systems. Considering (d) and (e) (and (f) if a spherical main mirror is used), the light throughput of a fibre-based system is optimized by setting the end of the fibre bundle to a slightly out of focus position in front of the main mirror.

To homogenize the illumination of the entrance slit of the spectrometer and hence the grating, different mode-mixing techniques (see, e.g. Stutz and Platt, 1997) can optionally be applied between telescope and spectrometer (at letter D in Fig. 1 and the upper row of column d in Fig. 2) before the light is coupled into the spectrometer passing an (optional) optical slit (at letter E in Fig. 1 and column E in Fig. 2) (see Sect. 4).
For the analysis of the atmospheric absorption, a reference spectrum without absorption of the gases is required. This is obtained by temporarily inserting a diffuse reflector, e.g. a sandblasted white surface, close (i.e. around 1–4 mm distance) to the end of the fibre at (C), thus creating an optical “shortcut” (SC) for the light (for a sketch of this mechanism, see Fig. A1 in the Appendix). In the following, spectra recorded this way will be referred to as reference. The reflector mechanism will be referred to as shortcut.
To account for scattered sunlight from the atmosphere in both atmospheric and reference spectra as well as to correct for the charge-coupled device's (CCD's)é dark current and offset signal, background spectra for both types of measurement spectra are recorded on a regular basis by shutting off the light source at (A). All four spectrum types are recorded in an interleaved fashion, typically with a couple of pairs of reference and atmospheric spectra followed by one atmospheric background and one reference background. Examples of such measurement routines are discussed in detail in Appendix C.
2.2 DOAS analysis and measurement accuracy
Obtaining average trace-gas mixing ratios on the light path L between telescope and reflector is based on the Beer–Lambert law. Extended by scattering processes, the attenuation of an initial radiance I0(λ) traversing the atmosphere yielding the measured spectrum I(λ) can be described by Eq. (1). The central idea of the DOAS approach is the separation of narrow band (differential) molecular absorption cross section of a suited absorber i from the broadband portion :
The optical density τ (Eq. 2) is calculated taking the logarithm of the ratio of atmospheric I(λ) and reference spectra I0(λ) after correcting with their respective backgrounds. Mixing ratios are determined by using the differential optical density modelled from differential literature absorption cross sections . To adapt the high-resolution literature cross section to the resolution of the spectrometer, prior to the analysis it is convoluted with the instrument response function, which usually is obtained by recording the shape of an emission line of a gas discharge lamp (e.g. mercury). For the detailed mathematical description of the analysis refer to Platt and Stutz (2008). Broadband absorption in τ is combined with (broadband) atmospheric scattering where ϵR(λ) denotes extinction due to Rayleigh-scattering and ϵM(λ) accounts for Mie scattering. The broadband contributions can either be modelled with a polynomial P(λ) or removed with a high-pass filter. The fitting process then minimizes the difference R(λ) between measured and modelled optical density using a least-squares approach yielding mixing ratios :
The measurement accuracy and precision, and hence the detection limit of the retrieved mixing ratios, is determined from this difference R(λ) called the residual of the DOAS fit. The magnitude of the residual determines the precision, while systematic structures limit the accuracy. The magnitude of the residual can be affected, e.g. by a low signal-to-noise ratio or noise generated in the CCD through thermal excitation or the read-out electronics. Systematic structures are caused, e.g. by spectral lamp structures, absorbers missing in the model, inaccurate literature cross sections used in the model, or inhomogeneous illumination of the spectrometer grating, where the angular response of the detector causes residual structures (Stutz and Platt, 1997). A fundamental limit is the photon shot noise, which decreases with the square root of the count number in spectra. Its relative contribution to the residual, however, can become very small (e.g. when several spectra are summed up). Residuals in this study generally were larger than pure photon shot noise, indicating that other sources of noise dominate. To reduce the contribution of systematic structures to the residual, and hence measurement errors and detection limits, in this study the influence of different components of the LP-DOAS instrumental setup was assessed and optimized.
2.3 LP-DOAS setups used in this study
We tested several improvements to the classic fibre-based DOAS setup (as described in Sect. 2.1), an overview of the three different setups is given in Table 1 and will be described in the following sections. The systematic comparison of improvements to the setup was done in the rooftop laboratory of the Institute of Environmental Physics at the University of Heidelberg (setup HD) with an Acton 500i spectrometer and a smaller laboratory telescope that allows quick changes of components but is not suited for outdoor deployment. For atmospheric measurements, a 1.55 km light path (one way) passing over a residential area of Heidelberg to another institute was used. Tests with atmospheric measurements were performed during 6 weeks from 11 March until 3 May 2014. In each configuration, measurements were performed for at least 24 h to ensure sufficient statistics and the comparability of different setups.
As for all measurements not performed under fully controlled laboratory conditions, the influence of environmental parameters has to be considered in such a comparison. An important factor in LP-DOAS measurements are variations in the telescope–reflector alignment which can be influenced by changes to the setup as well as environmental parameters such as air temperatures. To ensure an optimal alignment, as part of the measurement routine and in alternation with measurement periods, an optimization of the received signal is performed on a regular basis by systematically varying the telescope alignment around the current position and selecting the alignment with the highest signal. LP-DOAS telescopes thus adaptively counter sudden changes to the system transmissivity, e.g. through mechanical interaction with the telescope structure as well as long-term drifts.
In addition to the alignment, atmospheric visibility between telescope and reflectors can vary. Potentially very low visibilities were removed from the comparison data set by excluding days with rainfall. Other visibility conditions with a similar influence (e.g. fog or smog) did not occur during the comparison period.
We estimate the resulting variations in the absolute intensity of the measurement signal from both factors to be 20 %. This value has to be considered when comparing absolute atmospheric intensities achieved with the different setups, which determine the temporal resolution of LP-DOAS measurements. For accuracy and precision, here this is assessed through the comparison of the root mean square (rms) of fit residuals (Sect. 2.2); however, due to the use of differential absorption features in DOAS, variations in the recorded absolute intensity only influence photon statistics and hence photon shot noise (i.e. the precision). Therefore, in the comparisons of residuals from atmospheric measurements, the square root of intensity variations has to be considered and an uncertainty of 10 % has to be assumed. For the majority of setups tested here, this is much smaller than the systematic differences of residual rms values between the different configurations.
It should be noted that in contrast to passive DOAS instruments, changes in the global radiation do not affect LP-DOAS measurements since the atmospheric background signal is corrected with regularly recorded background spectra (see Sect. 2.2). Therefore, measurements under, e.g. overcast conditions, can be compared to observations under clear skies.
The combined changes to the LP-DOAS setup, which were found to be the best combination, were then tested with a campaign-grade telescope and a smaller Acton 300i spectrometer (setup “NR”) during a 6-week campaign in a rural area in the “Nördlinger Ries” in southern Germany. Findings from both campaigns were incorporated in a new, low-maintenance, automated LP-DOAS system (setup “NMIII”). It was operated on the German Antarctic station Neumayer III from January 2016 until May 2018 and allows the assessment of the long-term performance of the different components. All telescopes investigated here were equipped with spherical, aluminium-coated mirrors.
Table 1Overview of the different LP-DOAS setups used in this study.

a In this setup two different light paths were available and used in turn. b Grating and spectral properties for VIS I spectral window from 378–521 nm (see also Table D1).
The light source of a LP-DOAS instrument is a key component because it has a major influence on the achievable signal-to-noise ratio and temporal resolution. The measurement quality depends on both the temporal and (particularly for arc lamps) spatio-temporal stability of the light-emitting medium (i.e. the plasma) and its spectral characteristics, namely on its (spectral) radiance (see Platt and Stutz, 2008, for comparison of different light sources).
3.1 Comparison of light sources
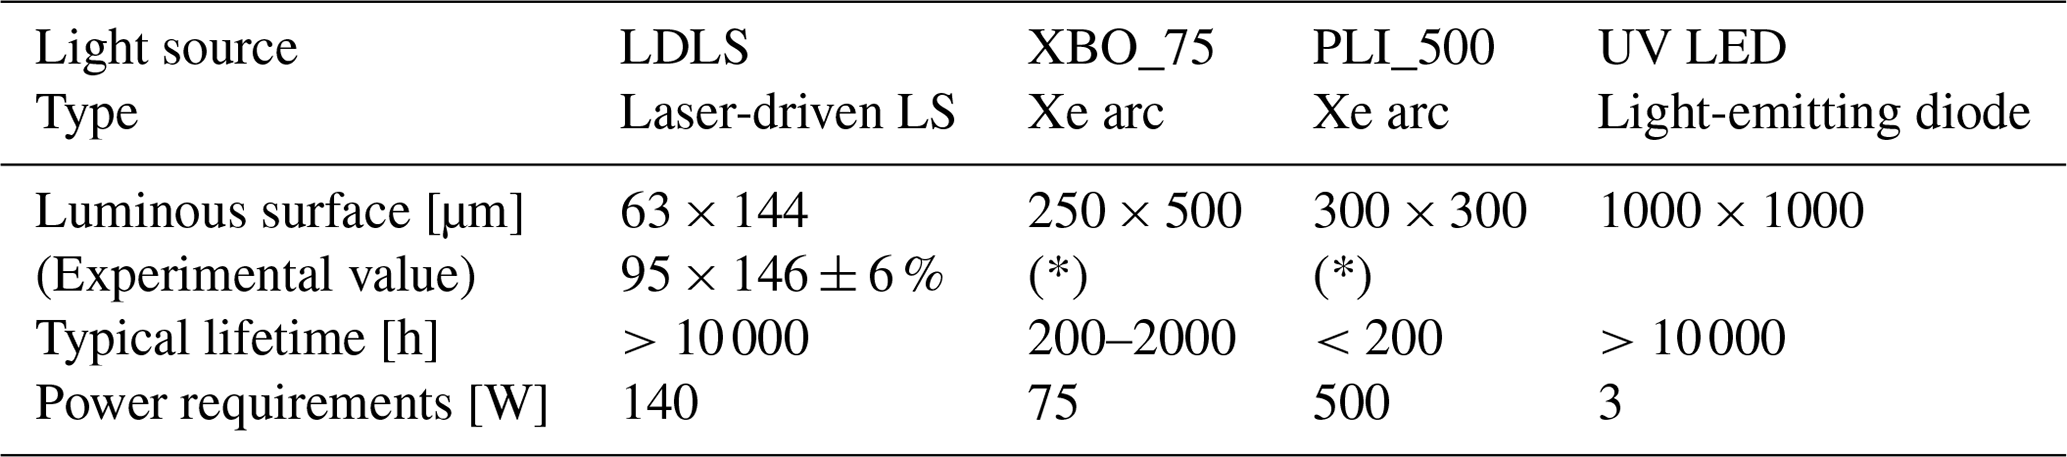
In the past, for most LP-DOAS applications xenon arc lamps have been used that often suffered from poor stability of the light arc, which affected the optical coupling into the fibre and hence the effective intensity and shape of the lamp's spectral structures. Furthermore, lifetimes of most models with high radiance were relatively short (200 to 2000 h when in constant use; Kern et al., 2006) and regular replacement during longer measurements required – in addition to the considerable expenses – a time-consuming realignment of the optics after each exchange. Depending on the lamp model used, power consumption was high (up to 500 W plus losses in the power supply), which limited the applicability of LP-DOAS instruments. Additionally, the high voltages necessary for ignition are a shock hazard and cause electromagnetic interference. Although LEDs are useful for compact applications due to their low power consumption and high spatial stability of the light-emitting area, up to now light output is not high enough to achieve sufficient signal-to-noise ratios in the ultraviolet regime below 350 nm. Their application has been so far limited to very compact “single housing” systems and to ensure sufficient spectral stability, often considerable efforts for temperature stabilization are necessary (Kern et al., 2006, 2009; Sihler et al., 2009).
In our new LP-DOAS setups presented here, a novel, commercially available laser-driven light source (Energetiq EQ-99 and the follow-up model Energetiq EQ-99X, in the following referred to as LDLS) was applied both for laboratory tests and different field measurements. Supplying energy to the xenon plasma with an infrared laser (rather than a high voltage), it combines the advantages of a high-power xenon lamp with the long lifetime and high spatio-temporal stability of LEDs at a modest power consumption (140 W). Similar to conventional xenon lamps, xenon emission lines, whose differential nature can limit sensitivity in DOAS applications (in particular around 450 nm, a spectral window in which, e.g. IO or glyoxal can be detected), are broadened by a high Xe pressure in the bulb. Details on the LDLS can be found in Zhu and Blackborow (2011b),Horne et al. (2010), and Islam et al. (2013)
We couple the light from the LDLS into a fibre with a lens, as described in Sect. 3.4 and depicted in Fig. 5. The light source offers the possibility to purge the lamp housing with a constant flow of nitrogen gas. This prevents ozone formation around the light bulb and hence increases output in spectral regions where ozone has absorption bands and reduces the intrusion of pollutants into the lamp housing (see manufacturers' technical notes for details; Zhu and Blackborow, 2011a). In a test we performed, the radiance at 255 nm increased by about 30 % compared to no purging when a high flow of nitrogen (about 1 L min−1) was used. Due to logistical reasons, most of the time the LDLS was purged with filtered and dried air during the measurements reported in this study. In the system used for long-term observations in Antarctica (see Sect. 5.2), the lamp housing was only purged 30 min d−1 with filtered and dried air attaining a lifetime of 22 500 h.
Table 2Specifications of several lamps used for LP-DOAS measurements.
(*) Only valid for new lamps – can increase drastically within days.
3.2 Adaptation of the optical setup to the light source
In addition to a long lifetime and high spatio-temporal stability, a further advantage of the LDLS is the very small and stable plasma spot, due to the very precise localization of the plasma inside the bulb in the focal point of the laser. Its dimension on the order of 100 µm (full width at half maximum) is about 3 times smaller than in conventional arc lamps (see Table 2). This can be exploited in several ways to further improve the design of LP-DOAS systems – first with respect to the configuration of the fibre bundle and overall system optical throughput.
For optical systems in which light propagates unobstructed in a clear and transparent medium, an invariant, the étendue G can be defined as follows (e.g. Welford and Winston, 1978; Markvart, 2007):
It is the product of the square of the refractive index n of the medium, the area A of the entrance pupil, and the solid angle Ω subtended at this pupil by an object. Since the exact assignment of these quantities depends on the components of an optical setup that are considered, its definition can vary. For the étendue of a light source for example, A could be the size of the emitting area and Ω the solid angle around the emitter that is covered by the light collecting optics.
The étendue allows us to link the spectral radiant flux Φ(λ) (in W) through an optical system with transmittance τ(λ) to the spectral radiance R(λ) (spectral radiant flux per solid angle and surface area in W sr−1 m−2) of the light source:
For a system that consists of several components with different étendues, the overall spectral radiant flux Φ(λ) is limited by the component with the smallest Glim, which makes it a very useful quantity for optical design considerations. For an optimal overall throughput, the étendues of all components should match as closely as possible.
Table 3Étendues for the coupling between the different components in the three setups used in this study (see Table 1). For setup HD, the spectrometer étendue for two fibre bundle configurations (classical and reversed) are indicated. See Fig. 2 and Sect. 3.3 for a description.
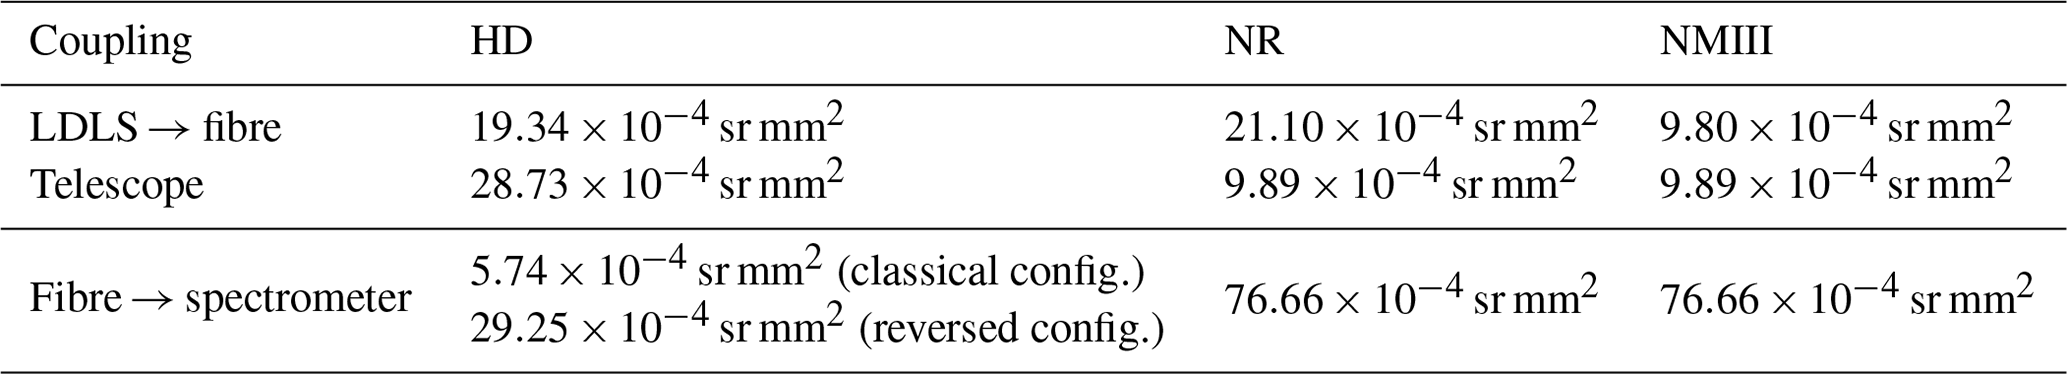
In fibre-based LP-DOAS setups, typically either the spectrometer (where G is the illuminated area of the entrance slit times the solid angle of acceptance of the spectrometer) or the telescope (where G is the entrance area of the fibre core times the solid angle of the light cone hitting the main mirror) have the limiting étendue (see Table 3).
For a given light collection solid angle, the LDLS has a small étendue compared to other light sources owing to its small plasma spot. The manufacturer indicates, for example, a maximum attainable numerical aperture of NA=0.447 (determined by the geometry of the lamp housing), corresponding to a solid angle Ω of 0.663. Assuming an emitting surface with 100 µm diameter, this yields an étendue sr mm2. This is about 4 times smaller than for a conventional XBO_75 xenon arc lamp with the same coupling optics (see Table 2). A small étendue is favourable for optimal utilization of the light source since, regardless of the coupling optics, the usable fraction of the emitted radiation cannot be increased beyond the radiant flux through the element of the system with the limiting étendue.
This is illustrated by an investigation of the coupling between different light sources and fibres with different diameters. For LP-DOAS systems, a light source that efficiently can be coupled into a fibre with a smaller diameter is advantageous because it allows us to use the fibre bundle in a reversed configuration (see Sect. 3.3 and in the lower row of Fig. 2).
Using setup HD (see Table 1) with a fixed exposure time and number of scans in reference mode, the intensity spectra of several light sources commonly used for LP-DOAS applications were recorded (shown in Fig. 3). Since angular information of the light is lost on the sandblasted surface of the reference plate, the spectrometer only samples the intensity of the scattered light. For the comparison between light sources and different fibres, therefore, only the coupling between the light sources and the fibre has to be considered.
First, a classical fibre setup described in Sect. 2.1 was used (Fig. 3a). The light from the different sources was coupled into a 1 m fibre with 800 µm diameter that was coupled to a 6×200 µm ring of a 3 m long Y-shaped fibre bundle (see the upper row of Fig. 2, i.e. “classical setup”). The receiving fibre was the single 200 µm core fibre of this bundle, which was coupled to a 10 m long 200 µm fibre that led to the spectrometer.
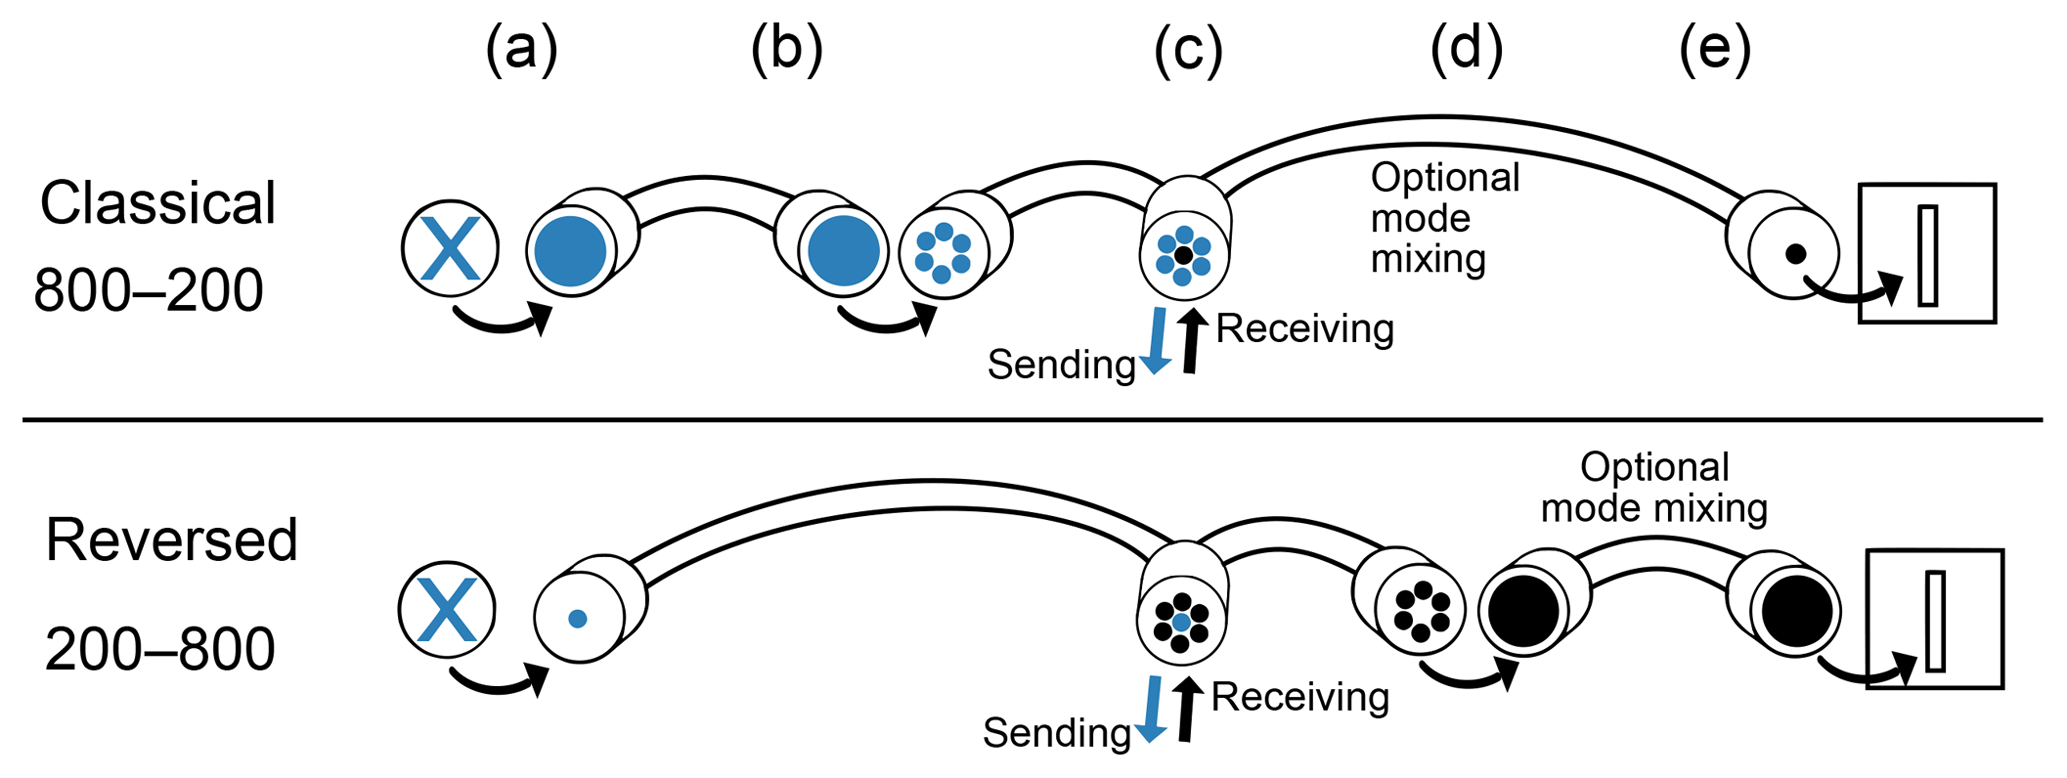
Figure 2Schematic diagrams of sections of the fibre setup and corresponding cross sections when a Y-shaped bundle is used in the classical (top row) or reversed (bottom row) way. Additional fibres or fibre bundles can be coupled to the end of the receiving fibre section to improve mode mixing or change the cross section (not sketched). The letters A through E correspond to positions marked in Fig. 1.
The recorded irradiance of the LDLS in this setup is about twice as high as the XBO_75, and differential xenon structures are weaker. The commercially no longer available Hanovia PLI_500W (in the following referred to as PLI_500) xenon arc lamp delivers considerably higher irradiances. However, due to poor spatial and temporal arc stability and the resulting introduction of systematic spectral structures as well as a very complicated handling and short lifetime (around 200 h), this light source was excluded from further investigations. Comparison of the LDLS and high-power LED light sources (for the UV a 3 W Engin LZ1 and a 3.5 W Cree XP-E Royal Blue for the blue spectral range) gives comparable (around 365 nm) or superior irradiances (around 450 nm) for the LEDs, however, only within the small spectral coverage inherent to the LED principle (Kern et al., 2006).
In a second measurement, a 1 m long 200 µm diameter single fibre with the same numerical aperture was added to the previous setup between the light source and the 800 µm diameter fibre (Fig. 3b). This reduces the étendue of the fibre setup by a factor of 16 (ratio of fibre cross sections). When comparing the effect, it has to be kept in mind that the additional 200 to 800 µm fibre interface introduces a coupling loss of about 20 %–25 % (empirical value).
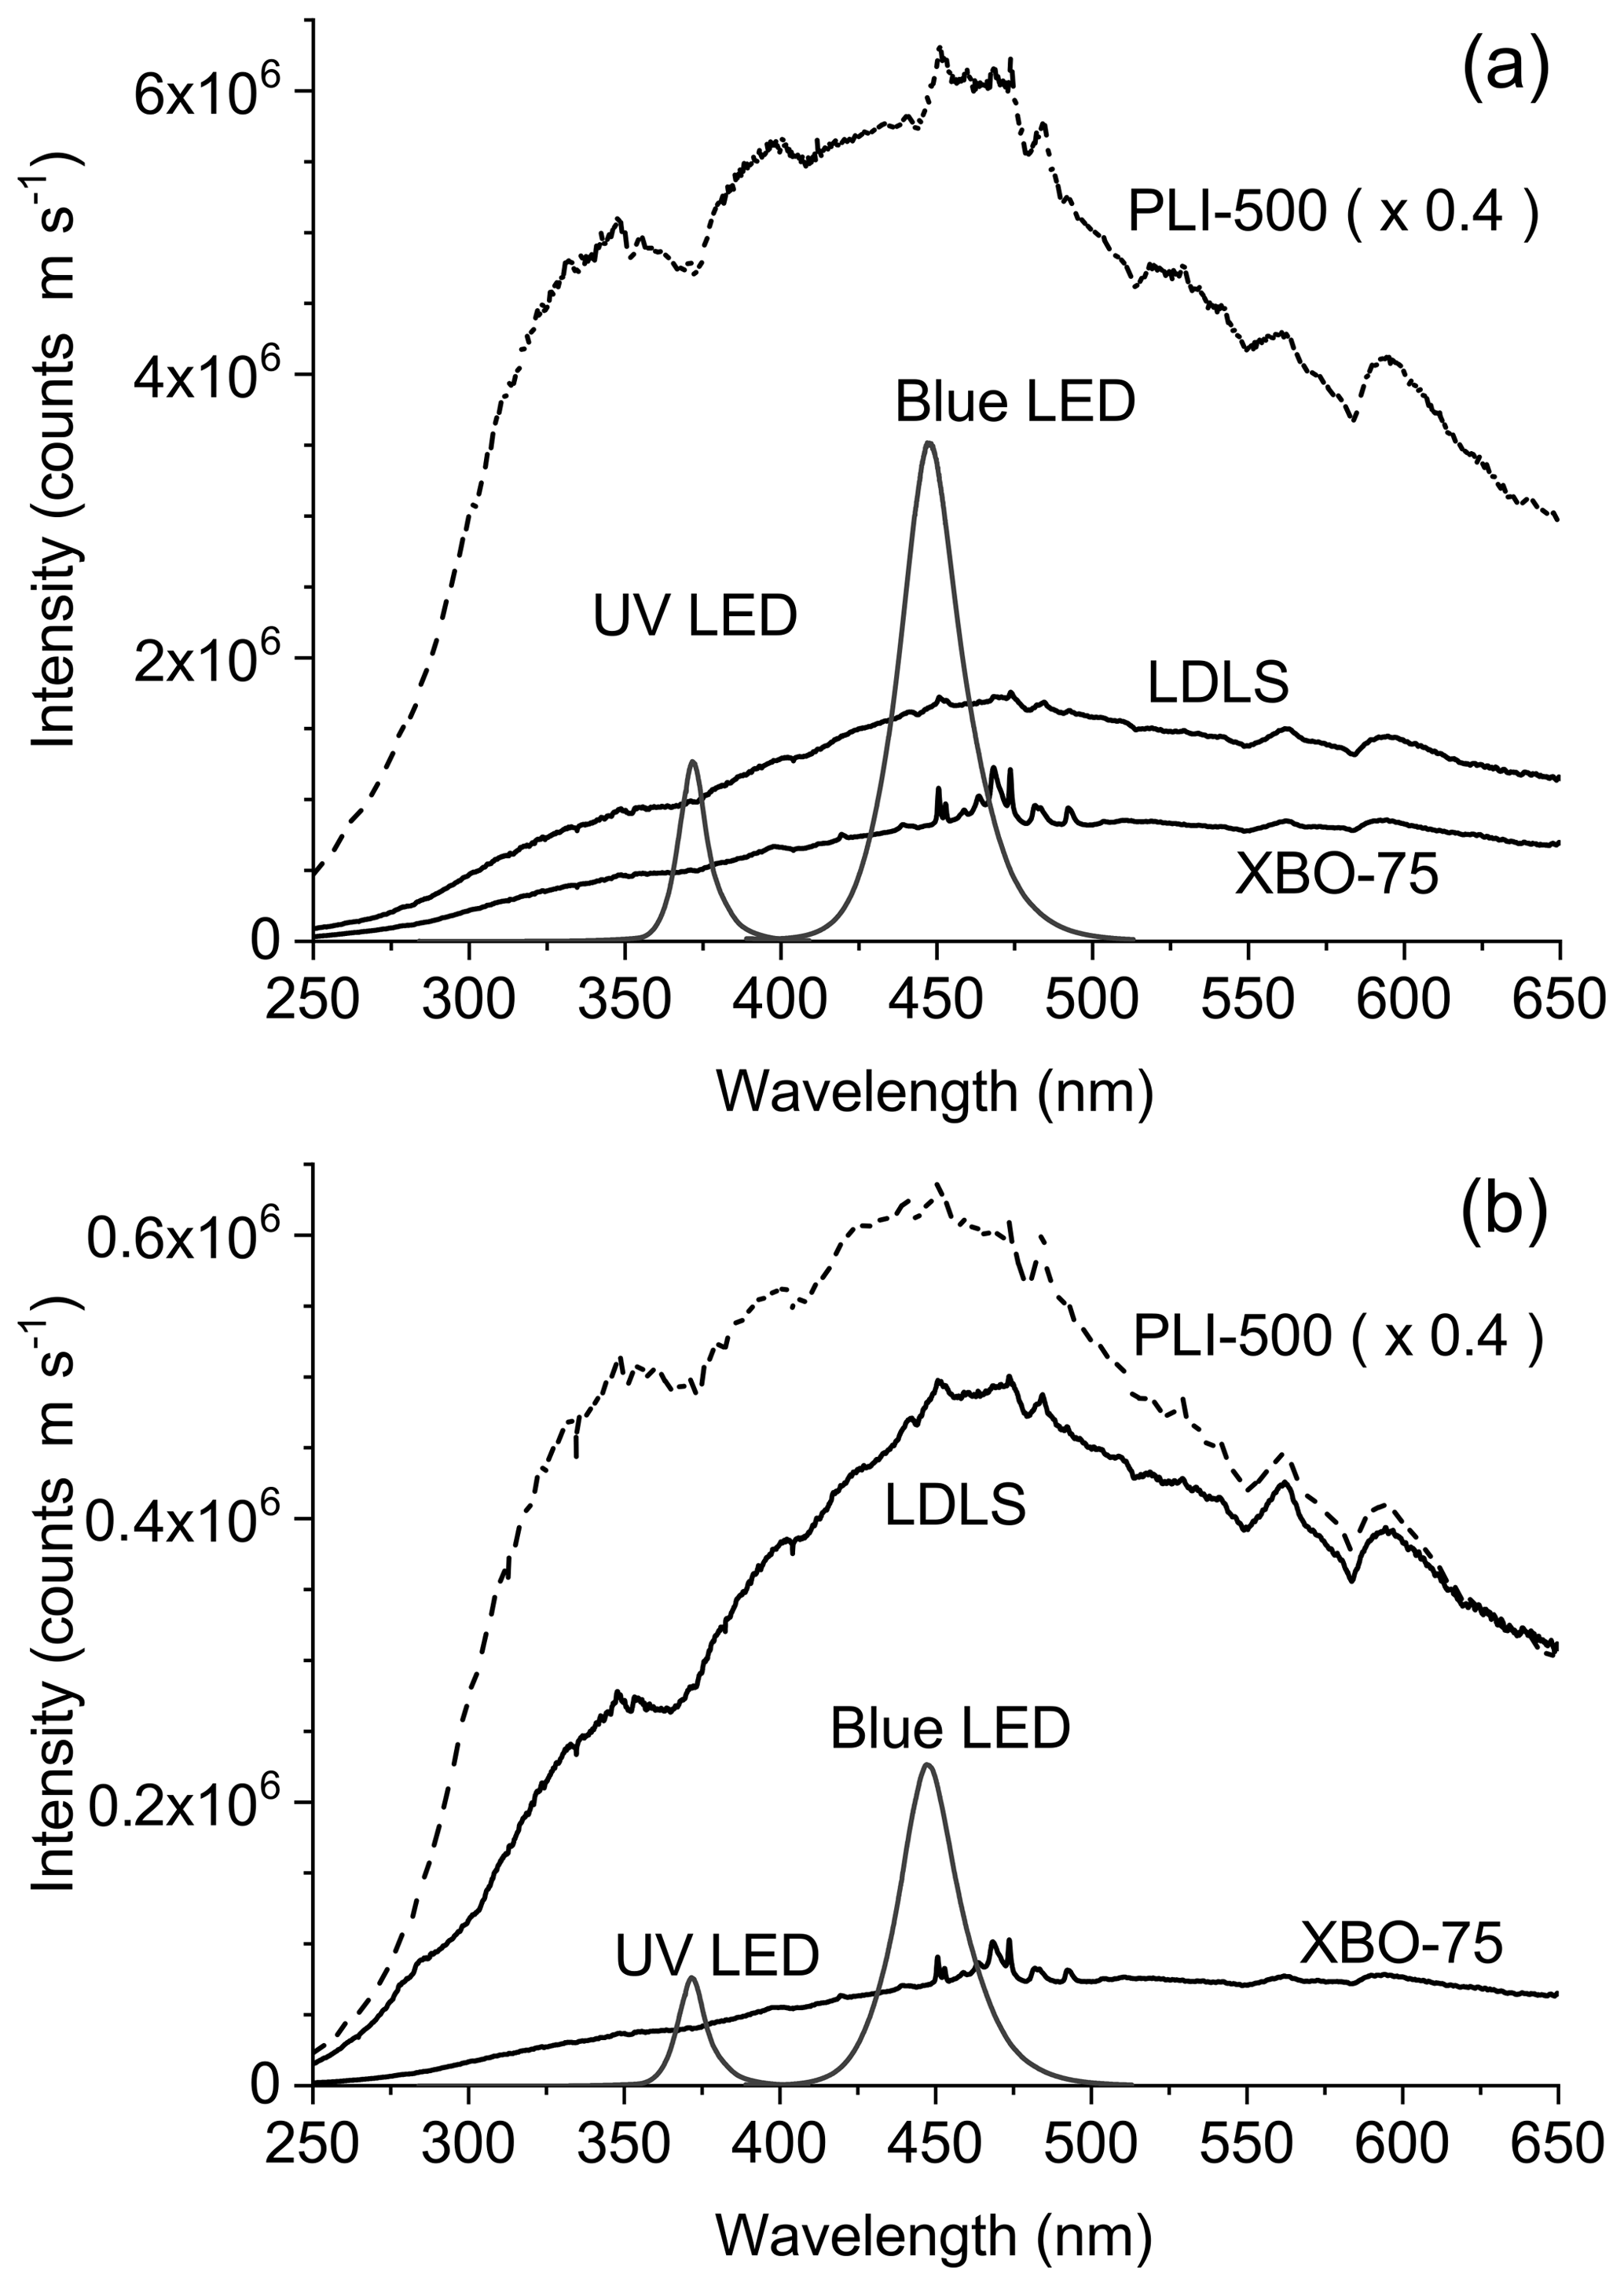
Figure 3Intensities of several light sources measured on the shortcut plate (no atmospheric light path). The position of the lens focussing the light sources onto the fibre was adapted to the respective spectral region.(a) Light coupled into a bundle in classical configuration (see Fig. 2) with 800 µm fibre diameter.(b) Light coupled into the same bundle with an additional 200 µm fibre added in front of the 800 µm fibre of the bundle (also in classical configuration; see Fig. 2). For better comparison, the PLI_500 has been downscaled. Please note that for comparisons between both setups and panels the loss by the additional coupling of the 200 µm fibre, which we estimate to be around 20 %–25 %, has to be taken into account.
In the setup with added 200 µm fibre (Fig. 3b), the smaller étendue of the fibre bundle favours the LDLS with its small, high-luminance plasma spot relative to the other light sources. The decrease in the transmitted radiant flux compared to the previous setup (about a factor of 2–3 when correcting for a coupling loss of 25 %) and relative to all other light sources, therefore, is the smallest for the LDLS. Both the XBO_75 xenon lamp (reduction by a factor of 9) and the LEDs (reduction by a factor of 11–13) clearly have lower radiant fluxes than the LDLS and even that of the PLI_500 (reduction of a factor of 10) is now only a factor of 2–3 brighter than the LDLS.
3.3 Fibre bundle configurations
The favourable properties of the LDLS when coupled into smaller diameter fibres allow to reverse the Y-shaped fibre bundle (see lower row of Fig. 2). The ring of fibres previously used for sending is now used for receiving and the central fibre that previously received the returning radiation now sends it out. Reversing the fibre bundle setup has no influence on the instrument transmissivity since the light path is reversible (see letter C in Fig. 1 and column c in Fig. 2) but offers several advantages. The larger 800 µm fibre is now coupled to the optical slit. If the limiting étendue of the system is that of the spectrometer (as in setup HD), a larger illuminated area of the slit increases it (e.g. by a factor of 3.8 when comparing a single 200 µm to the 800 µm fibre with a 150 µm optical slit). Furthermore, a larger diameter fibre has better mode-mixing properties, as will be discussed in detail in Sect. 4 below.
However, the ring of fibres generally has a larger field of view. When in the reversed bundle setup the fibre ring is used for receiving, the atmospheric background light signal (see Sect. 3.4 below) can be 6 times larger – in particular when the reflector array size is much smaller than the field of view of the ring (often the case in field campaigns due to logistical reasons). This trade-off between the favourable aspects of the reversed fibre bundle configuration like the potential increase in the measurement signal and an improvement of signal quality due to mode mixing (see Sect. 4) has to be weighed against the potentially increased atmospheric background light. If feasible, the latter should be reduced as much as possible by, e.g. shielding the area of the ring's field of view around the reflectors with a low-reflectance screen.
For applications where radiant fluxes are crucial, a cross section modulating fibre could be used instead of a large diameter single fibre assuming a detector with sufficient vertical extent. However, it would come at the expense of the favourable mode-mixing properties of larger fibre diameters and could add a potential complication to the determination of the spectrometer's instrument line function, which can vary along the optical slit for misaligned fibres in the cross section modulating fibre or when the different fibres due to atmospheric conditions are not illuminated homogeneously.
In the following sections, the performance of LP-DOAS systems with both classical and reversed fibre configurations will be compared and discussed (see the upper and lower rows of Fig. 2, respectively). For all classical configurations (upper row of Fig. 2), in the sending section a 800 µm diameter fibre is used to collect the light from the light source, which is then coupled to a ring of 6×200 µm fibres of Y-shaped bundles. The receiving section consists of a single 200 µm that is extended by another 200 µm single fibre if necessary. These classical configurations will be denoted “800→200”. In all reversed configurations (lower row of Fig. 2), the sending section consists of a single 200 µm fibre at the light source that is either the core of a Y-shaped bundle or (if required) an extension fibre then coupled to a core fibre of a Y-shaped bundle. The receiving section consists of the ring of 6×200 µm fibres then coupled to a 800 µm diameter single fibre. These reversed configurations will be denoted “200→800”.
As the influence of lamp performance and fibre configuration in atmospheric measurements cannot be assessed individually in our setup, the noise of the entire measurement system was investigated to quantify the improvement of measurement quality of this reversed setup and results are discussed in Sect. 5.
3.4 Comparison of instrumental stray light
When operating a LP-DOAS, different types of stray light occur that can cause residual structures and limit the measurement accuracy. Atmospheric background light is scattered into the instrument from outside sources (usually the Sun). It depends on the external light source's relative position and orientation, as well as atmospheric properties, e.g. the visibility. To correct for background light, background spectra for both atmospheric and reference spectra are recorded on a regular basis by blocking the light source (see Sect. 2.1 for details).
Internal or spectrometer stray light is caused by unintended deflections of light inside the spectrometer. In the UV spectral range in particular, where lamp intensities are low compared to the visible spectral range of the light source, this can lead to a systematic underestimation of optical densities since it represents an additive quantity with respect to the total received radiance.
We investigated the amount and origin of spectrometer stray light for different spectral regions using setups HD and NR with the telescope shortcut in place and a set of bandpass filters that block increasing portions of the UV-VIS from 280 to 665 nm (see Fig. B1 for the set of filters and their effect on a spectrum). Considering the UV spectral region and the spectrometer of setup HD (f=500 mm) with a 600 grooves mm−1 grating (blaze 300 nm), stray-light levels increase from less than 1% around 400 nm to about 15 % at 240 nm. For smaller wavelengths it quickly reaches 80 %–90 % due to the diminishing spectral radiance of the LDLS in this region. About 95 % of the stray light in this configuration originates from the visible spectral range between 400 and 650 nm. For a grating with 1200 grooves mm−1 in the same spectrometer, stray-light levels are between 3 and 7 times smaller than in the previous configuration reaching about 2 % at 240 nm. For this grating about 50 % of the stray light originates from the visible spectral range between 400 and 650 nm, with the other half being from the IR. The smaller spectrometer of setup NR (f=300 mm) with 1000 grooves mm−1 grating has stray-light levels of less than 1 % above 320 nm, which increases to about 10 % at 260 nm.
For evaluations in the spectral region around 330 nm and the 600 grooves mm−1 (a typical spectral window for the detection of SO2, BrO, formaldehyde, or ozone), an exemplary stray-light distribution determined with setup HD with the shortcut in place is illustrated by the histogram in Fig. 4. The relative importance of stray light for UV measurements is further increased when atmospheric spectra are considered. Since Rayleigh scattering is proportional to λ−4, loss of UV radiation is higher on the way through the atmosphere compared to the visible parts of the spectrum. This decreases the ratio between UV and VIS and thus increases the relative importance of stray light from VIS spectral regions on UV measurements. Below 300 nm this is further augmented by strong ozone absorption bands. For the NR setup stray light in atmospheric measurements increases from 1.5 % at 320 nm to 10 % at 290 nm, quickly reaching levels of more than 50 % for 280 nm and below.
There are different ways to suppress spectrometer stray light to reduce its influence on measurement accuracy. One is to add bandpass filters (usually coloured glass) between the light source and fibre to select only the part of the lamp spectrum needed for measurement. In Fig. 4 the effect of a UG5 bandpass filter (200–400 nm) on the lamp spectrum is shown. Over 95 % of the light between 400 and 650 nm and hence of the stray light originating from here can be removed while keeping light losses around 330 nm at about 40 %–50 %, yielding stray-light levels of less than 0.1 %.

Figure 4Stray-light reduction in the UV by using a UG-5 filter. The distribution of the relative contribution of different spectral areas to the total stray light as determined with a set of bandpass filters is shown in grey bars. The two curves show the lamp spectrum determined with setup HD and a classical 800→200 fibre configuration by a measurement on the SC plate with (dashed) and without (solid) a UG-5 bandpass filter between the light source and sending fibre.
The LDLS with its small and stable arc spot allows a second stray-light reduction before coupling the light into the fibre. By mounting the entrance of the fibre (A in Fig. 2) on a stepper motor that can translate around the focal point along the optical axis of the lens, which projects the plasma spot onto the fibre end, the chromatic aberration of the lens can be exploited to selectively optimize the input of different spectral ranges (see principle in Fig. 5; see Fig. B2 for a determination of the relative positions of foci for different spectral regions).
Due to the steep increase in the refractive index of quartz glass towards shorter wavelengths (Malitson, 1965), this chromatic filter is particularly selective for the UV spectral range. Figure 6 shows the spectral shapes of the radiation reaching the spectrometer when the position of the fibre is optimized for (a) measurements around 260 nm (dashed line in Fig. 6) and (b) for 400 nm (solid black line in Fig. 6). This can be compared against an artificial intensity distribution that represents the envelope of spectral distributions when the fibre position is tuned through several foci between 200 and 800 nm.
When this chromatic-aberration filter is optimized for 260 nm, stray light originating around 400, 540, and 680 nm is reduced by about 60 %, 75 %, and 80 %, respectively (details are given in Appendix B2).
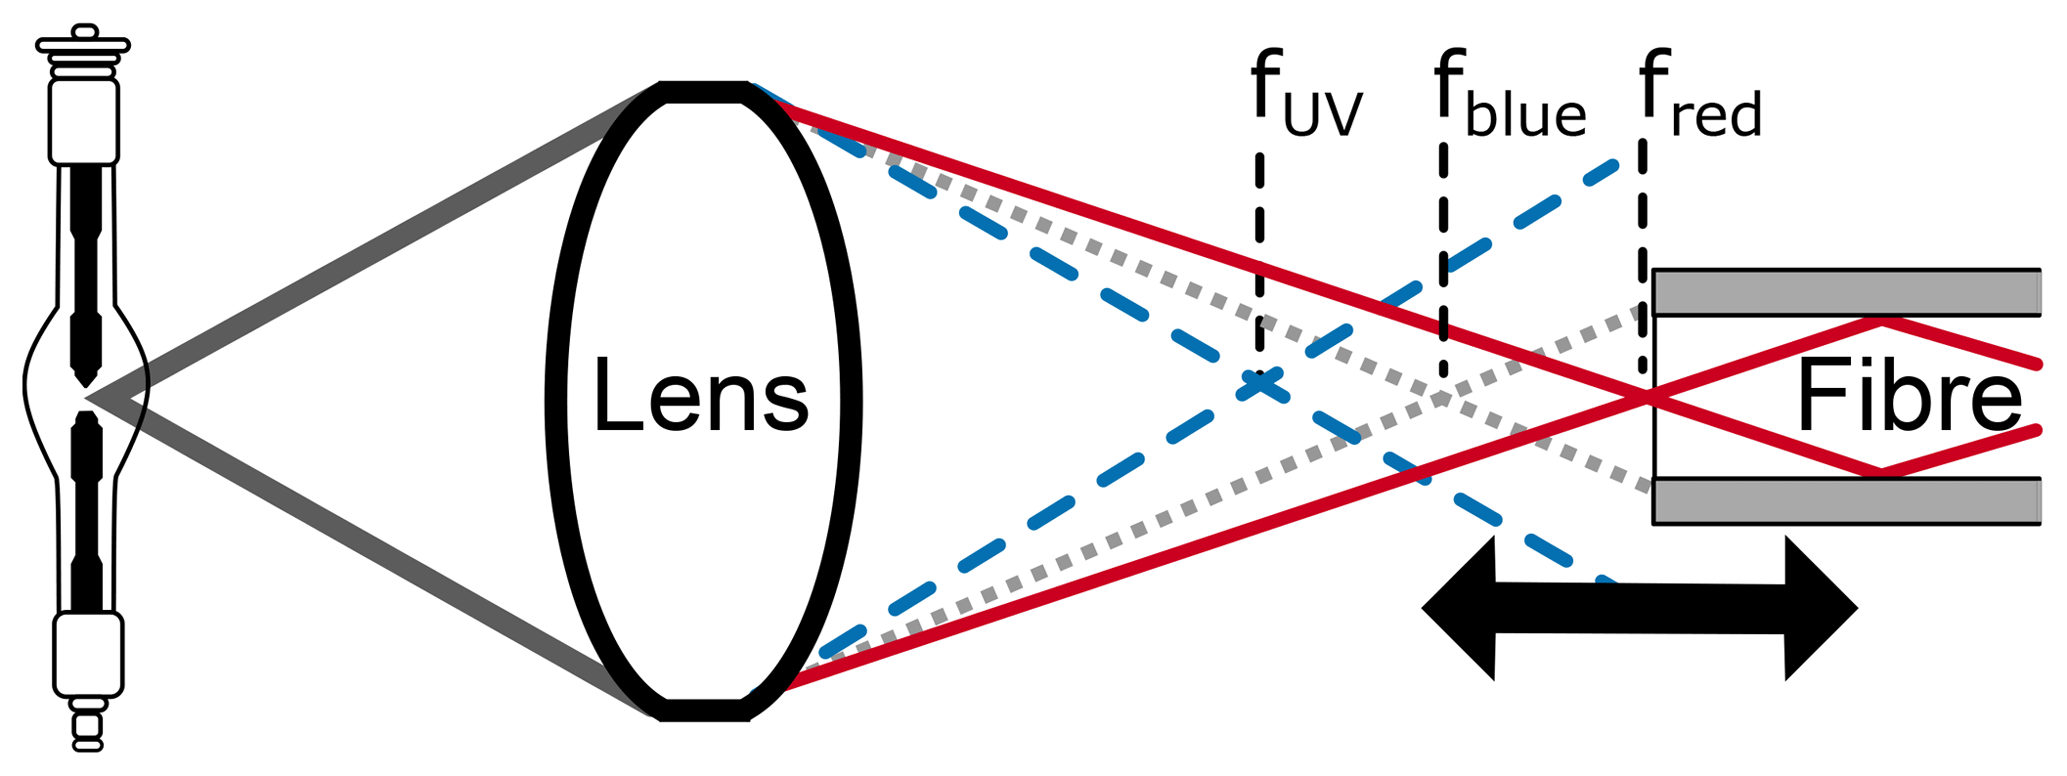
Figure 5Principle of selectively coupling light from a light source into a fibre for stray-light reduction using the chromatic aberration of the lens. The foci of different spectral regions can be attained by a translation of the fibre along the optical axis of the lens.
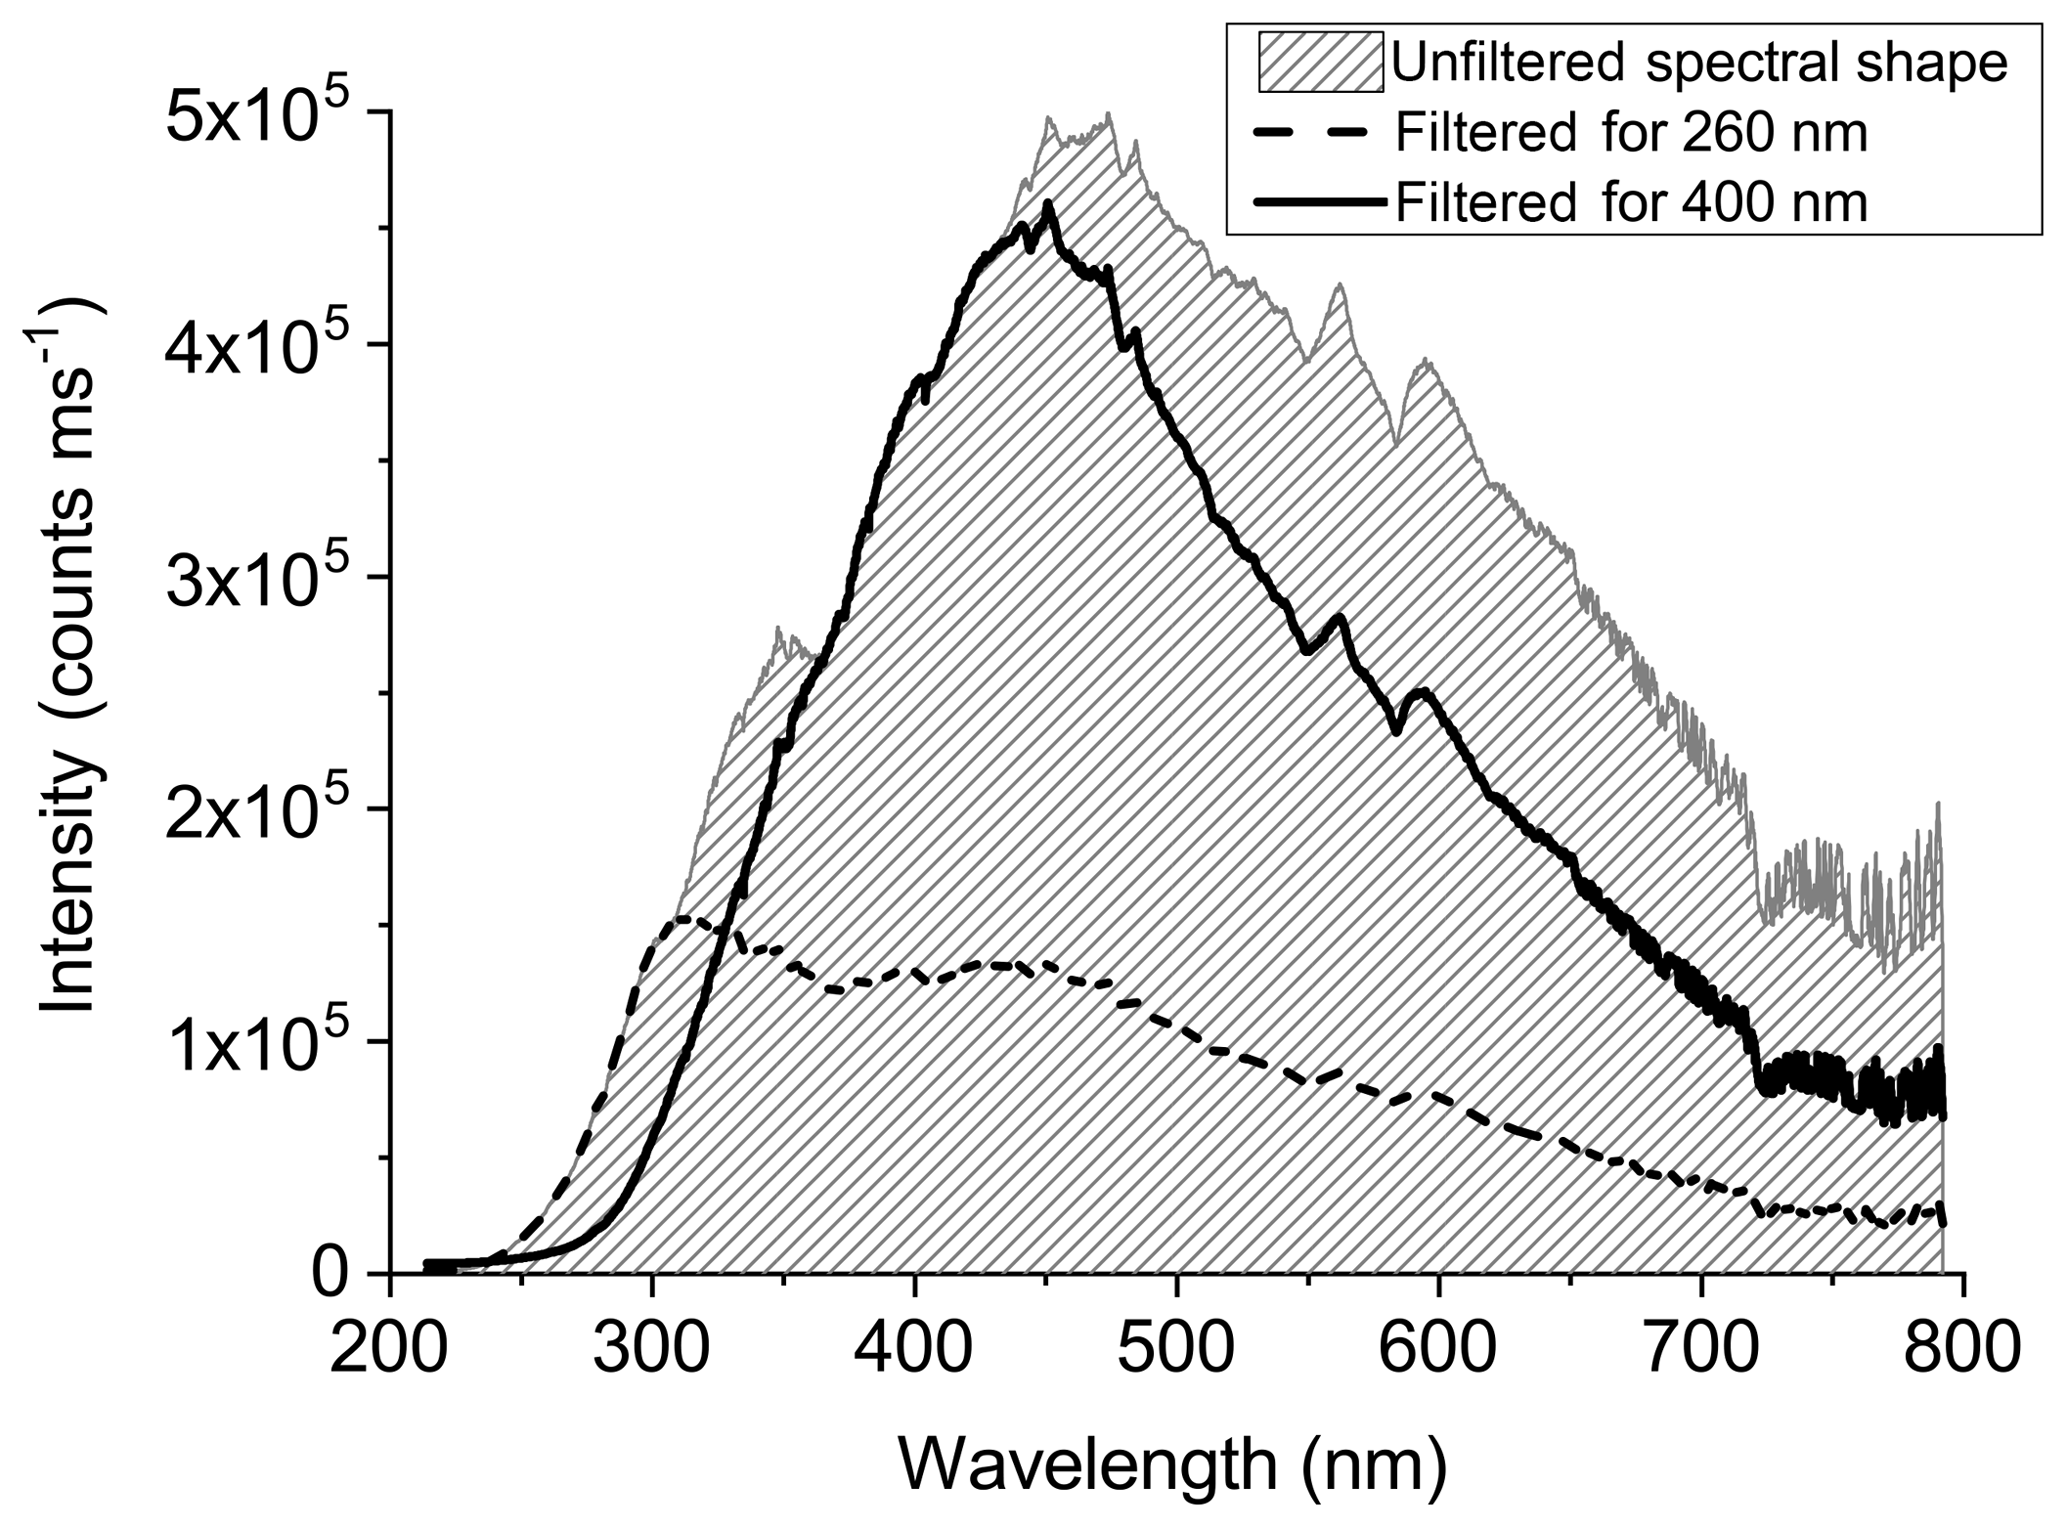
Figure 6Comparison of lamp spectra with the position of the fibre entrance optimized for 260 nm (dashed line) and 400 nm (drawn line). For comparison, a modelled spectral distribution of the light source unaltered by the chromatic aberration of the lens is also shown (shaded area). The latter was obtained by varying the fibre position through all foci from 200 to 800 nm and taking the envelope of the resulting spectra.
The modes of an optical fibre represent different distributions of the light travelling inside the core of the fibre. The solutions of the Helmholtz wave equation for the fibre core using Maxwell's equations and considering core geometry and boundary conditions yield the possible modes (Kaminow et al., 2013). For a given wavelength λ0 the number n of modes is proportional to both numeric aperture NA and fibre radius a:
When the light travels only in a few modes, the resulting light spot leaving the fibre can be inhomogeneous because of the intensity patterns of the individual modes. The intensity distribution between different modes can change along the fibre when energy is transferred from one mode to another, which is referred to as mode coupling. This can be caused, e.g. by impurities, temperature changes, or mechanical stress on the fibre (Stutz and Platt, 1997; Kaminow et al., 2013). In fibres with a smaller diameter in which fewer modes are possible, this inherent or “natural” mode coupling has a less homogenizing effect than for an otherwise identical fibre with a larger diameter. Therefore, placing a fibre with a larger diameter between telescope and spectrometer, as is the case in the “reversed fibre configuration” (see lower row of Fig. 2), improves the mode-mixing capacity of LP-DOAS setups.
4.1 Comparison of mode-mixing techniques
In applications with grating spectrometers, an irregular and temporally unstable illumination of the grating resulting from non-uniform illumination of the spectrometer field of view, e.g. due to fibre modes, can create systematic, temporally unstable residual structures in the DOAS analysis (see Stutz and Platt, 1997, for a detailed study) and thus degrade the measurement accuracy. To reduce these structures, “artificial”, i.e. intentional, mode coupling can be induced by different methods. This is referred to as mode mixing (some publications also use the term mode scrambling).
Suitable fibres containing more impurities inherently lead to more mode coupling. However, since impurities cause signal loss when fibres are used in communication applications, manufacturers have improved fibre purities, leading to a reduced inherent mode coupling in modern fibres (Kaminow et al., 2013). Since larger diameter fibres allow more modes (Eq. 5), adding such a fibre to the Y-shaped bundle in front of the spectrometer can have a homogenizing effect. The same is achieved by adding diffusing discs to the optical setup (at the expense of transmissivity). Furthermore, mode coupling by mechanical stress can be induced artificially by squeezing or bending the fibre (micro-bending, e.g. Blake et al., 1986; Stutz and Platt, 1997). However, this requires bare fibres to ensure the transmission of the pressure, which makes the handling quite delicate. The mode mixing is also difficult to reproduce and easily influenced by environmental factors such as temperature. Stutz and Platt (1997) solved this by mechanically vibrating a coiled section of the bare fibre in front of the mode mixer to temporally average over different mechanical conditions. When the intensity of the fibre vibration is increased, micro-bending and temporal averaging are effectively combined and can be applied to fibres with a protective coating. This was done in this investigation by attaching the fibre to a vibrating filter pump.
A new method we tested for this study is the intentional degrading of fibre ends to create a quasi-built-in diffusing disc. To achieve this, fibre ends were treated with polishing sheets – first with 5 µm and then 12 µm granulation. A homogeneous treatment of the surface was insured by visual inspection using a fibre microscope. Figure 7 shows microphotographs of a fibre end surface before and after the treatment.
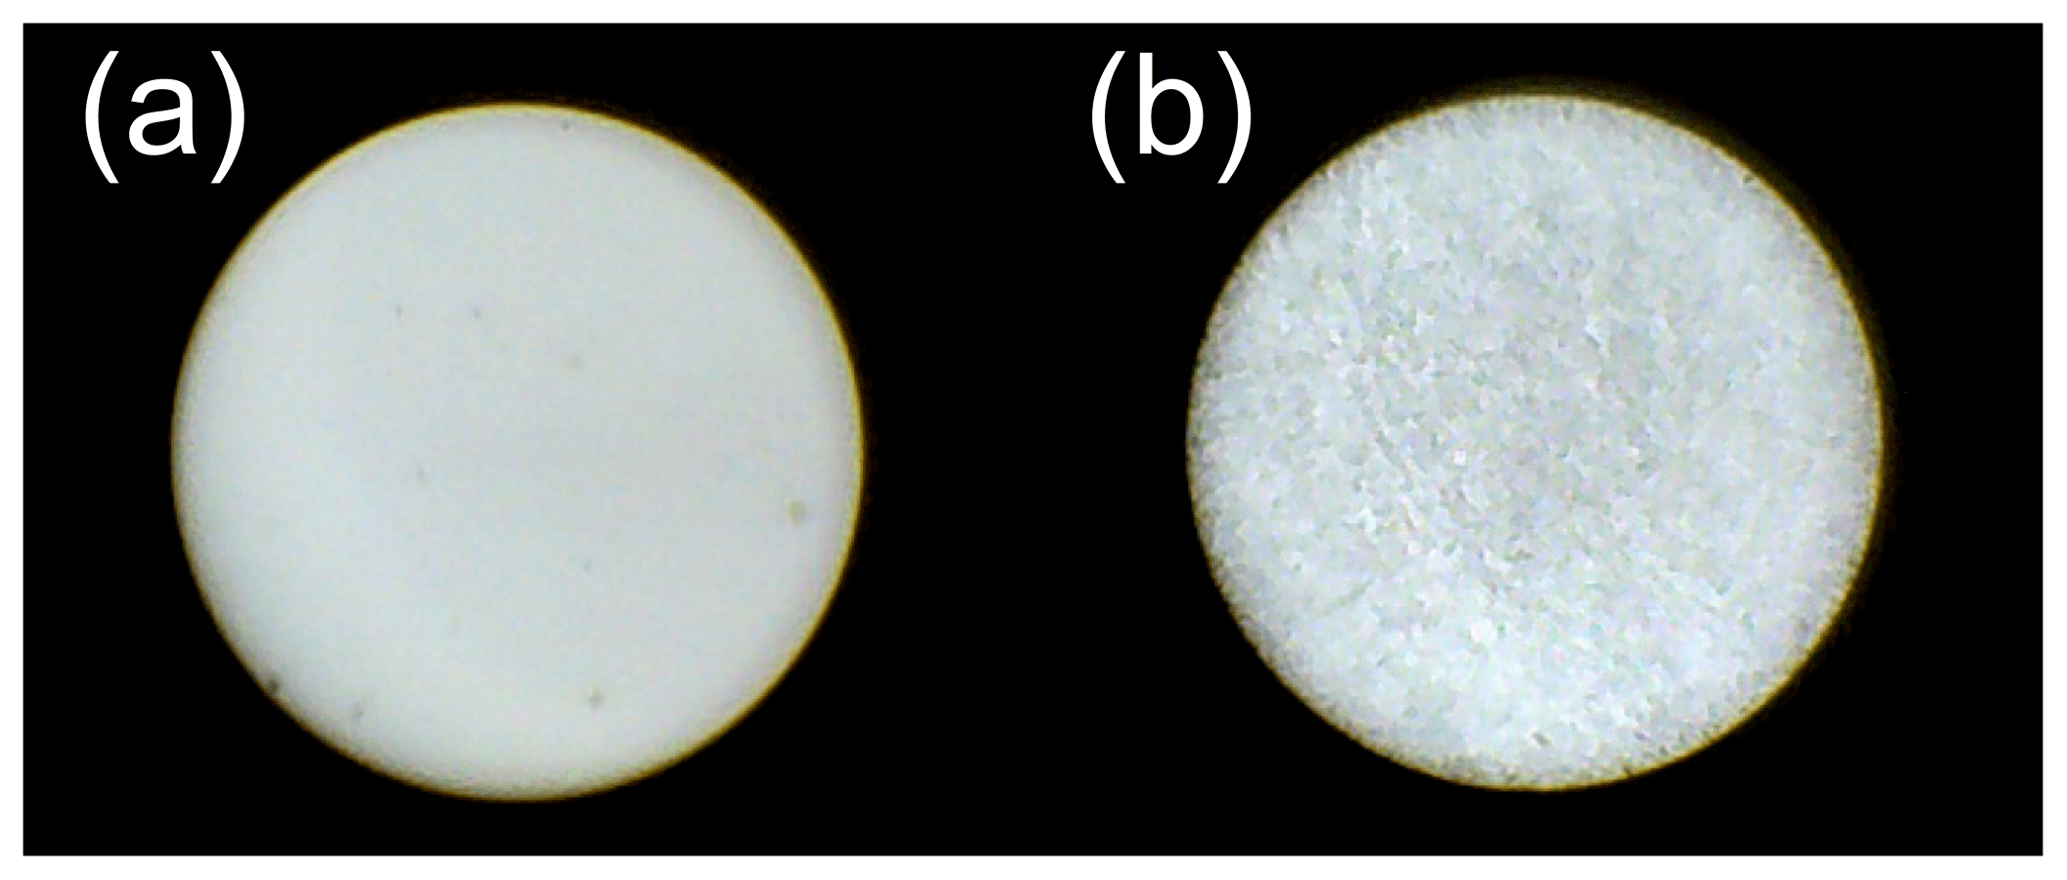
Figure 7800 µm fibre under the microscope with 30x magnification. (a) untreated (factory polished) (b) roughened (12 µm sheet).
This new mode-mixing approach was compared to the previously used techniques in a series of atmospheric measurements over a 1.55 km light path (one way) using setup HD (see Table 1) and the LDLS as light source. All methods were applied to the fibre bundle between light source (letter A in Fig. 1) and telescope (C) as well as between the telescope (C) and spectrometer (E). However, mode mixing between the light source and telescope had almost no effect which is probably due to the fact that homogenized light sent out into the atmosphere still can selectively induce modes in the fibre(s) leading to the spectrometer. One reason for this can be the inhomogeneous illumination of the telescope's field of view because the retro-reflector elements do not entirely cover the surface of the array or the light beam partly misses the array. Therefore, in the following, only mode mixing between telescope and spectrometer is considered. Light losses caused by the different methods were also quantified and both the classical and the reversed fibre configurations were tested (Sect. 3.3). In the former setup, a 200 µm fibre was added between the single 200 µm core fibre and the spectrometer. For the latter, a 800 µm fibre was used to couple the 6×200 µm fibre ring to the spectrometer. The residual was determined from a fit of 500 added scans between 313 and 325 nm considering the cross sections of O3 (Bogumil et al., 2003), NO2 (Bogumil et al., 2003), HCHO (Meller and Moortgat, 2000), and SO2 (Bogumil et al., 2003). Results for both setups are shown in Table 4.
Table 4Comparison of different mode-mixing methods with LDLS and classical (upper part) or reversed fibre configuration (lower part) and their effect on intensity and residual. The number combination in the legend indicates the fibre diameter on the light source end (first number) and spectrometer end (second number). The 800 µm fibre is always coupled to a ring of six 200 µm fibres. Errors in the atmospheric intensities reflect variations through alignment and atmospheric conditions.
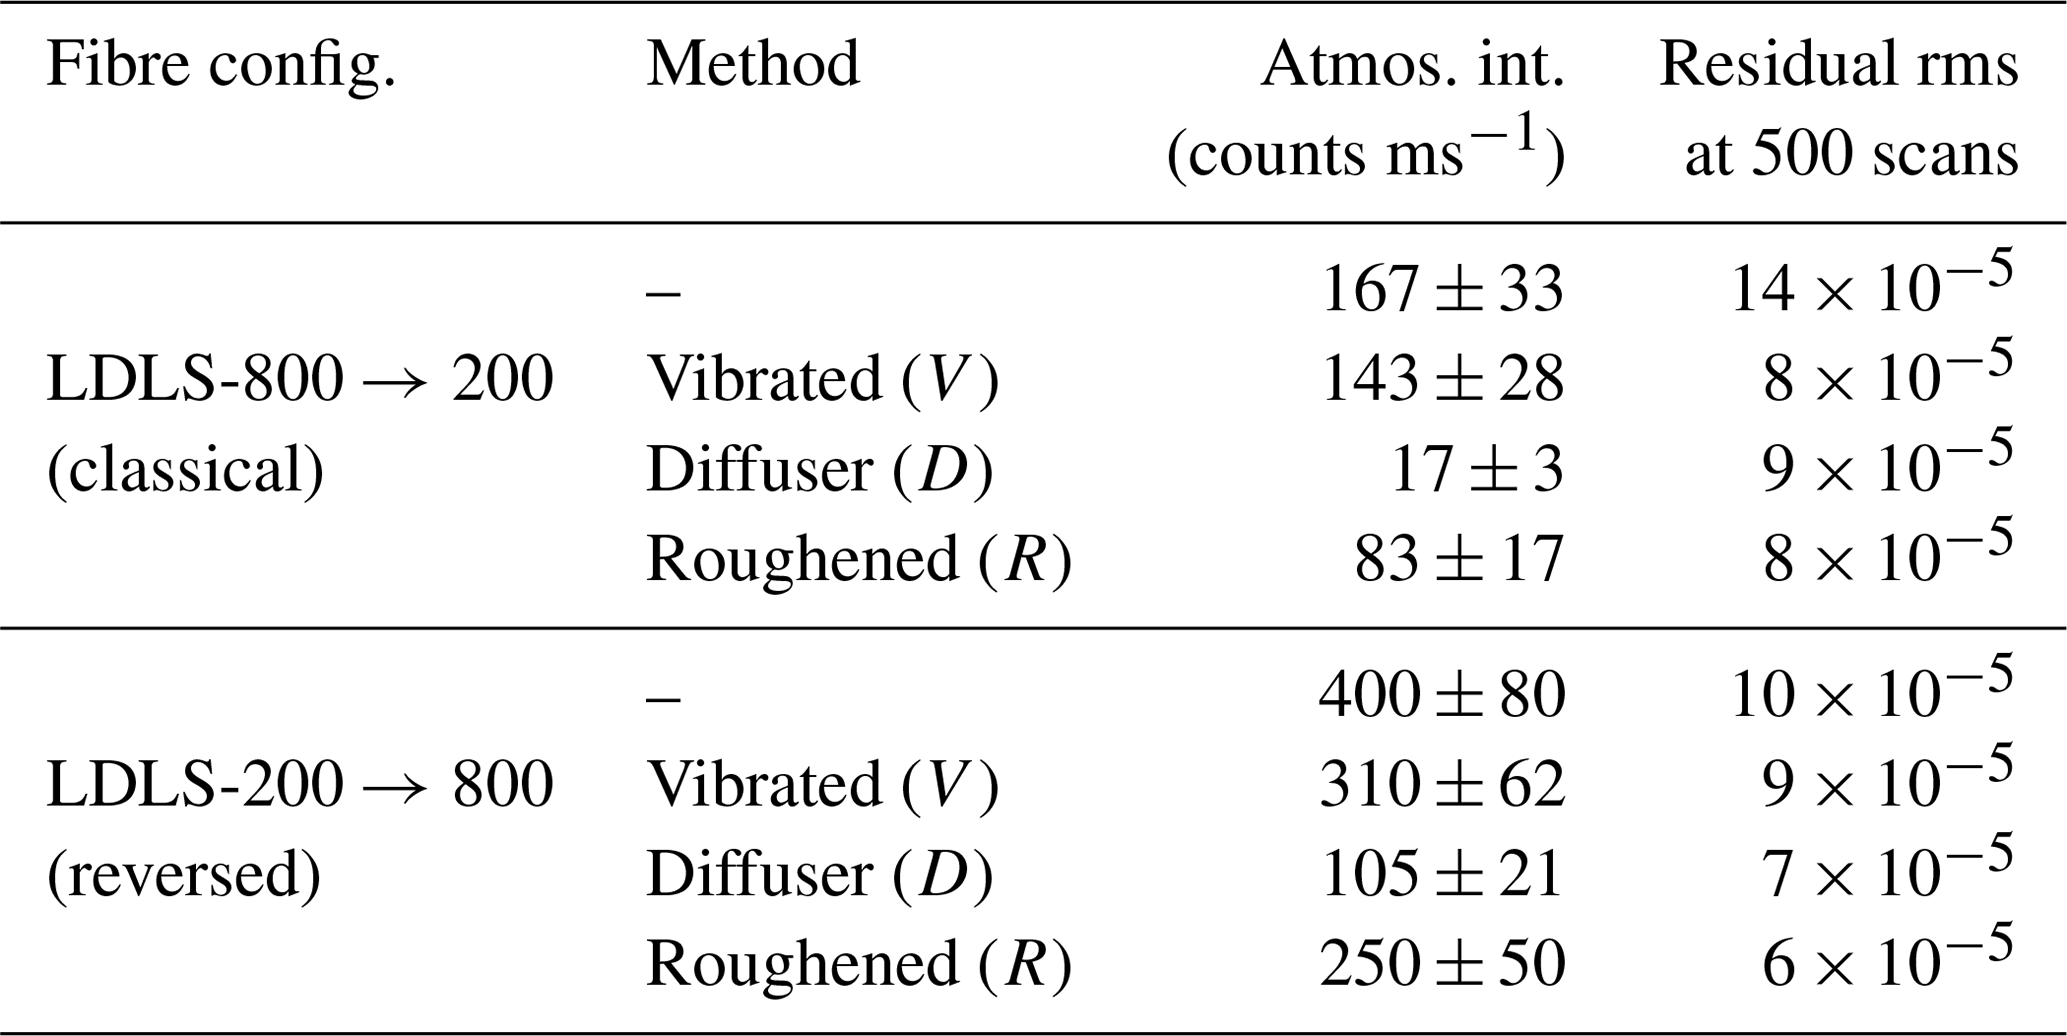
Taking the atmospheric intensity of the uninfluenced fibre as a fixed reference, vibrating the fibre (in the following indicated by “V”) causes the smallest light losses for both configurations followed by the novel “Roughened fibre end mode-mixing method” (in the following indicated by “R”, 12 µm grit). The diffuser (denoted by “D”) leads to light losses of 90 % (classical setup) and 75 % (reversed setup), respectively.
The roughened fibre end yields the lowest residual rms values for both fibre configurations. Vibrating the fibre in the classical configuration yields comparable residuals at almost twice the intensity of the roughened fibre end. However, when the fibre is reversed, the roughening yields the overall smallest residuals and only a modest loss of intensity (38 % compared to the uninfluenced fibre against 23 % vibrating against the uninfluenced fibre).
4.2 Temporal stability of mode-mixing methods
To reduce measurement errors and to lower detection limits, spectra in the LP-DOAS analysis can be added up before the DOAS fitting process. At the expense of temporal resolution, this reduces photon shot noise. It relies on the high temporal stability of the measurement system. A good mode-mixing method, therefore, should also be temporally stable and residuals should decrease when spectra are summed (with photon shot noise as fundamental limit). The potential for residual rms reductions by adding spectra for both the classical and the reversed fibre configuration was investigated summing spectra over up to 10 h (see Fig. 8a and b). For this, groups of single, consecutively recorded spectra from the tests with the different configurations were summed up after the measurements to correspond to periods of 1 to 600 min. Note that in Fig. 8 results for given measurement times are plotted, thus the effects of the higher photon shot noise due to signal reduction by the various mode-mixing techniques are included. Averaging measurement data are not necessary for typical applications but may be required if very weak signals need to be identified.
In the classical fibre configuration, the diffusing disc only attains residual rms values comparable to vibrated and roughened fibres when 10 h of observations are added up. Vibrating and roughening for all time spans yields lower results than without additional mode mixing, with lowest residuals for the roughening (Fig. 8a). In the reversed setup, the differences between the methods are generally smaller, which could be due to the favourable effect on mode mixing of the 800 µm fibre coupling into the spectrometer. Residuals for measurements with the diffuser after 60 min are even smaller than for a vibrating fibre. The best overall results for both fibre configurations and all tested mode-mixing methods are consistently attained by the reversed (200→800) configuration with roughened fibre end.
4.3 The optimal mode-mixing setup
Considering light losses (looking at counts per millisecond; see Table 4), vibrating the fibre leads to smaller losses compared to roughening the fibre end. In the reversed (200→800) fibre configuration, this disadvantage of the roughening is more than compensated for by the smaller residuals and also yields the best results when considering the summation of spectra over longer time periods. Compared with vibrating and especially bending the fibre (Stutz and Platt, 1997), it has the additional advantage of being very reproducible and limiting mechanical stress on the fibre.
For the laboratory comparison with setup HD and a 3 m 800 µm fibre coupled to a 3 m Y-shaped bundle with 200 µm fibres, a 12 µm grit gave the best results. For a long-term LP-DOAS instrument for operation in Antarctica with a 8.55 m fibre bundle in reversed configuration that includes a 1 m 800 µm fibre (setup NMIII), 5 and 12 µm roughening gave comparable results with a lower light loss for the 5 µm grit size. We conclude that the fibre bundle needs to be optimized for the particular measurement setup it is used with, considering the trade-off between homogenization of the field of view illumination and light loss for the intended application.
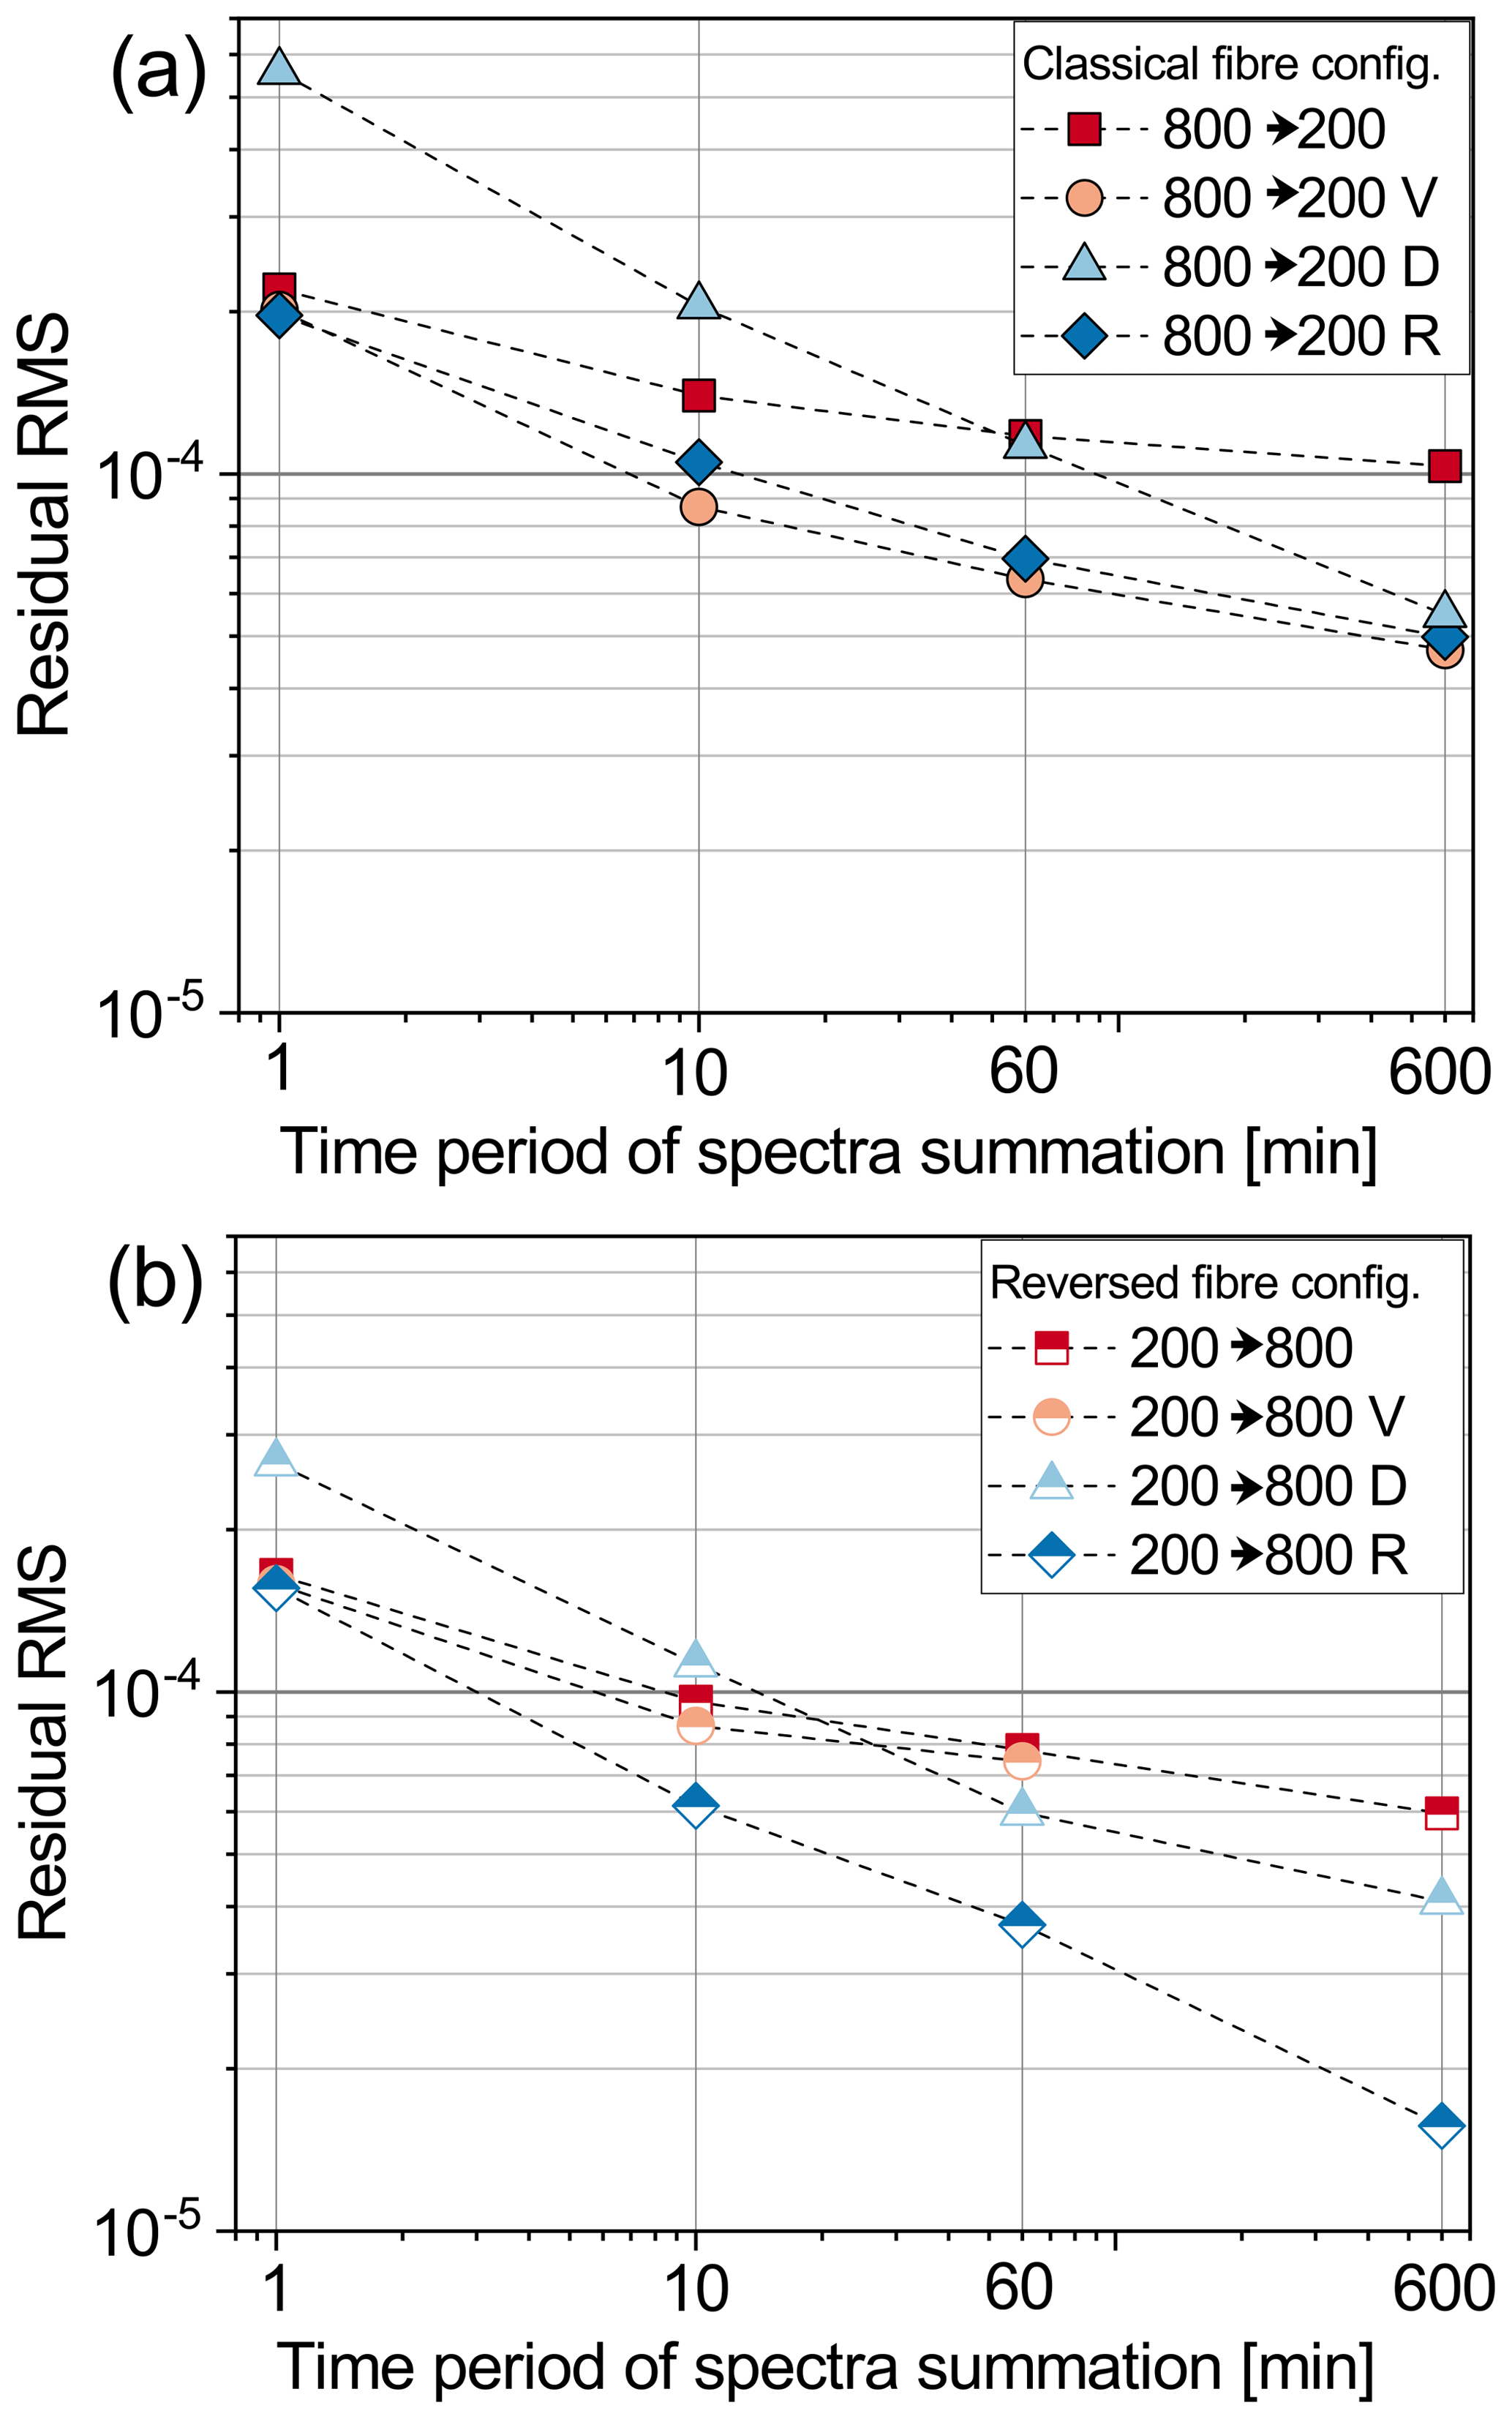
Figure 8Residual comparison for different mode-mixing methods and its temporal stability with LDLS and the reversed fibre configuration (a) and a classical fibre setup (b; for comparison the plot of “roughened fibre exit” for the reversed setup is also included). The mode-mixing methods are abbreviated as follows: V=vibration; D=diffuser; R=roughened fibre end.
5.1 Intercomparison measurements in Heidelberg
In order to quantify the combined effect of the changes to the fibre-based LP-DOAS setup discussed above, atmospheric measurements with different configurations were performed with setup HD over a residential area of Heidelberg for a period of 6 weeks from 11 March until 3 May 2014. During this time, the different configurations were each tested for at least 1 d. The influence of atmospheric conditions, as well as comparability and representativeness of these observations were discussed in Sect. 2.3.
The measurements were analysed in a UV spectral window between 300 and 350 nm (where trace gases such as SO2, BrO, formaldehyde, and ozone absorb). As a benchmark, the different improvements were compared against a setup with a XBO_75 xenon lamp in a classical 800→200 fibre configuration.
A fibre bundle with a 3 m 800 µm fibre coupled to a 3 m Y-shaped bundle with 200 µm fibres was used in the classical (setup XBO_75-800→200) and reversed (setup XBO_75-200→800) fibre configuration before and after the fibre roughening (R), which is the most efficient mode-mixing treatment identified above (Sect. 4.3) was applied. The measurement performance achieved with the benchmark setup during this comparison period agrees with results from previous measurement campaigns when comparable components were used. Results are summarized in Table 5.
Table 5Comparison of atmospheric measurements in Heidelberg utilizing the LDLS with different fibre configurations with and without roughening (marked with “R”) against the benchmark light source XBO_75 for the HD setup. The number combination in the setup indicates the fibre diameter on the light source end (first number) and spectrometer end (second number). The 800 µm fibre is always coupled to a ring of six 200 µm fibres. The 500 scans cover different averaging times due to different intensities for the configurations but thus contain a similar amount of recorded photons. Errors of the atmospheric intensities reflect variations through alignment and atmospheric conditions.
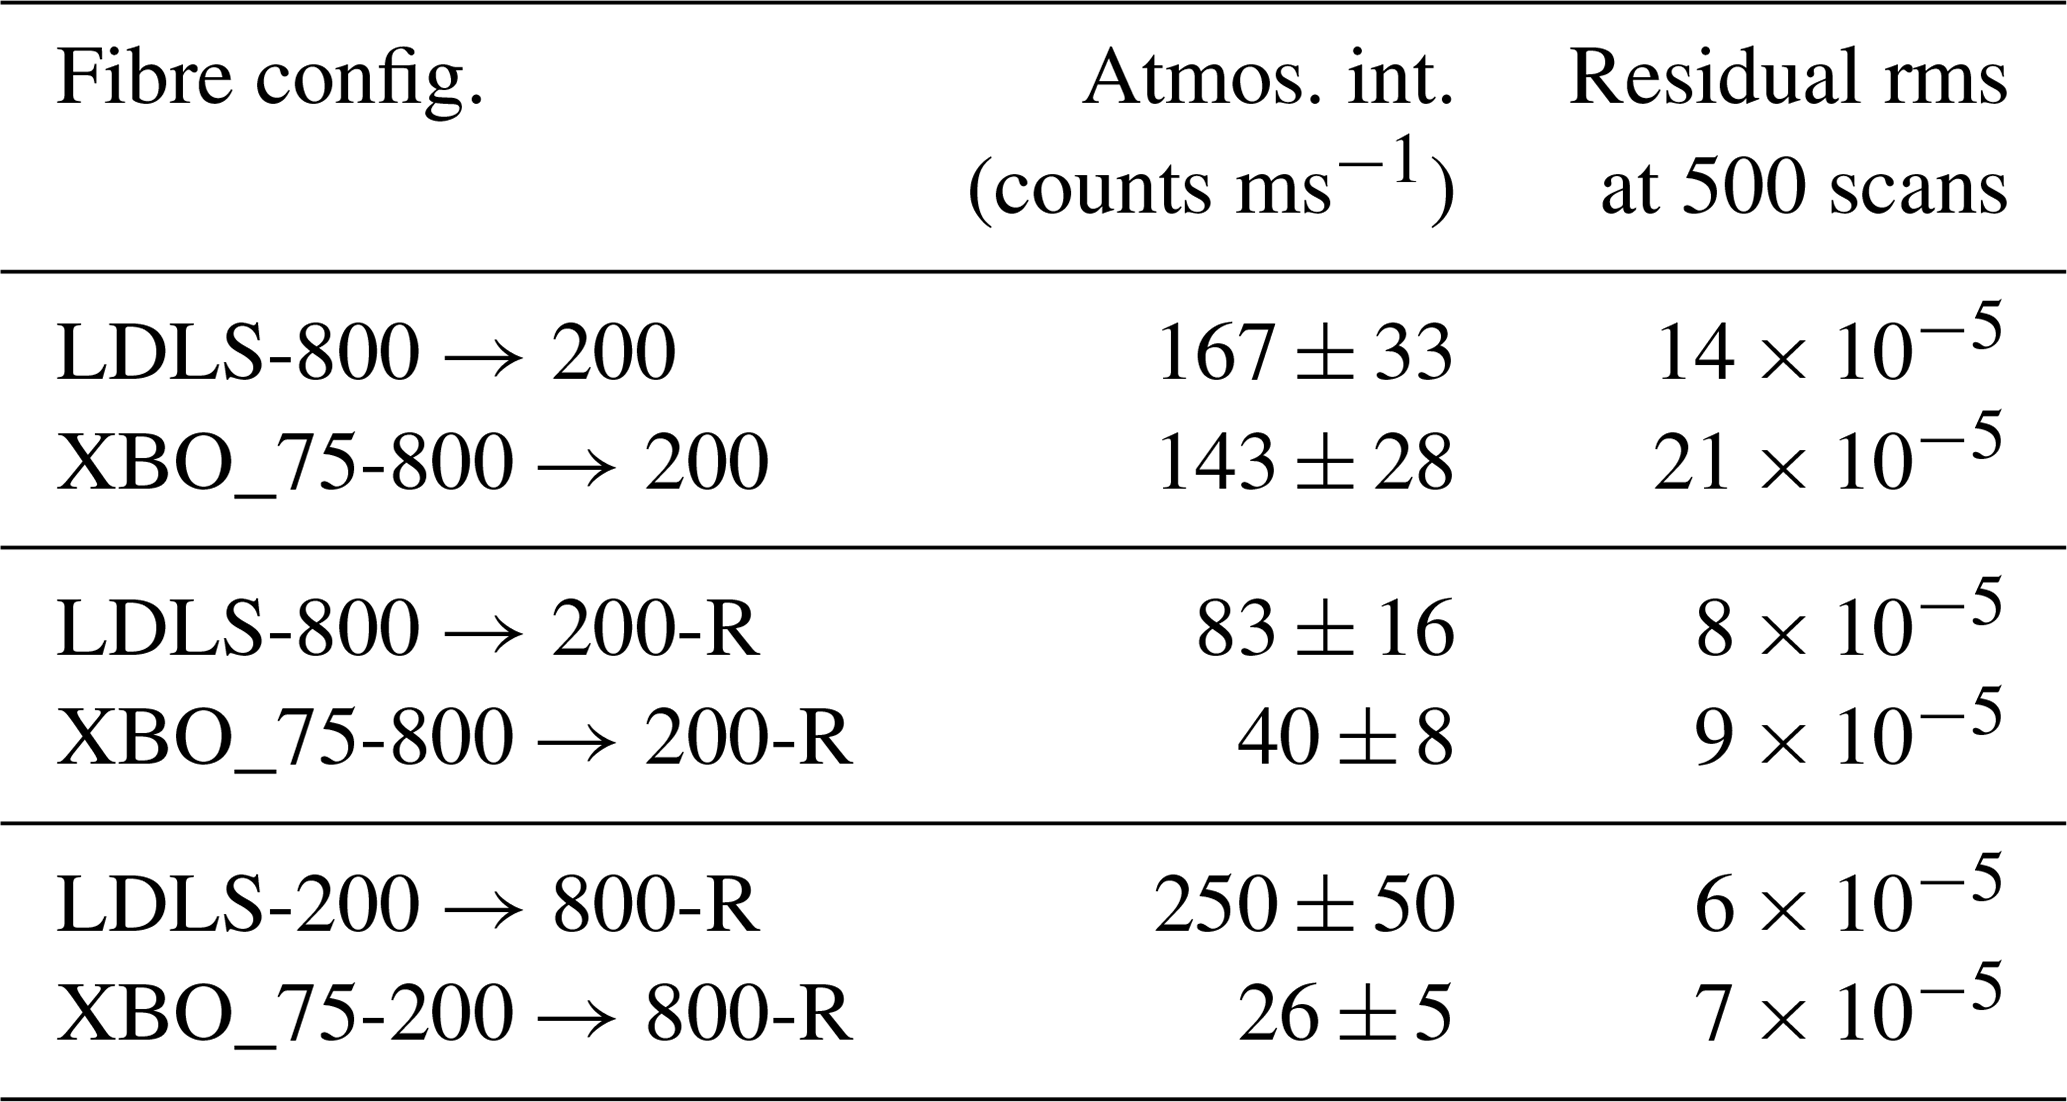
Comparing the two light sources with a classical fibre configuration (setups LDLS-800→200 and XBO_75-800→200 in Table 5), the higher intensity and better temporal stability of the LDLS discussed in Sect. 3 are apparent. The average residual rms for the LDLS is about 30 % smaller, while the received radiance is about 10 % larger. The mode mixing by roughening of the fibre end (“R”) reduces the residuals by approximately a factor of 2 for XBO_75 and LDLS (setups LDLS-800→200-R and XBO_75-800→200-R). In the reversed fibre configuration with roughened fibre end mode mixing (setups LDLS-200→800-R and XBO_75-200→800-R), average residual rms values are comparable. However, the received radiance (and hence temporal resolution for a given signal-to-noise level) of the XBO_75 is 1 order of magnitude smaller than for the LDLS, again illustrating the advantage of the smaller arc spot of the latter. Considering the overall improvements from the benchmark setup XBO_75-800→200 to setup LDLS-200→800-R, with reversed fibre configuration and roughened fibre end mode mixing, average residual rms could be reduced by a factor of 3.5 while detector signals increase by 70 %.
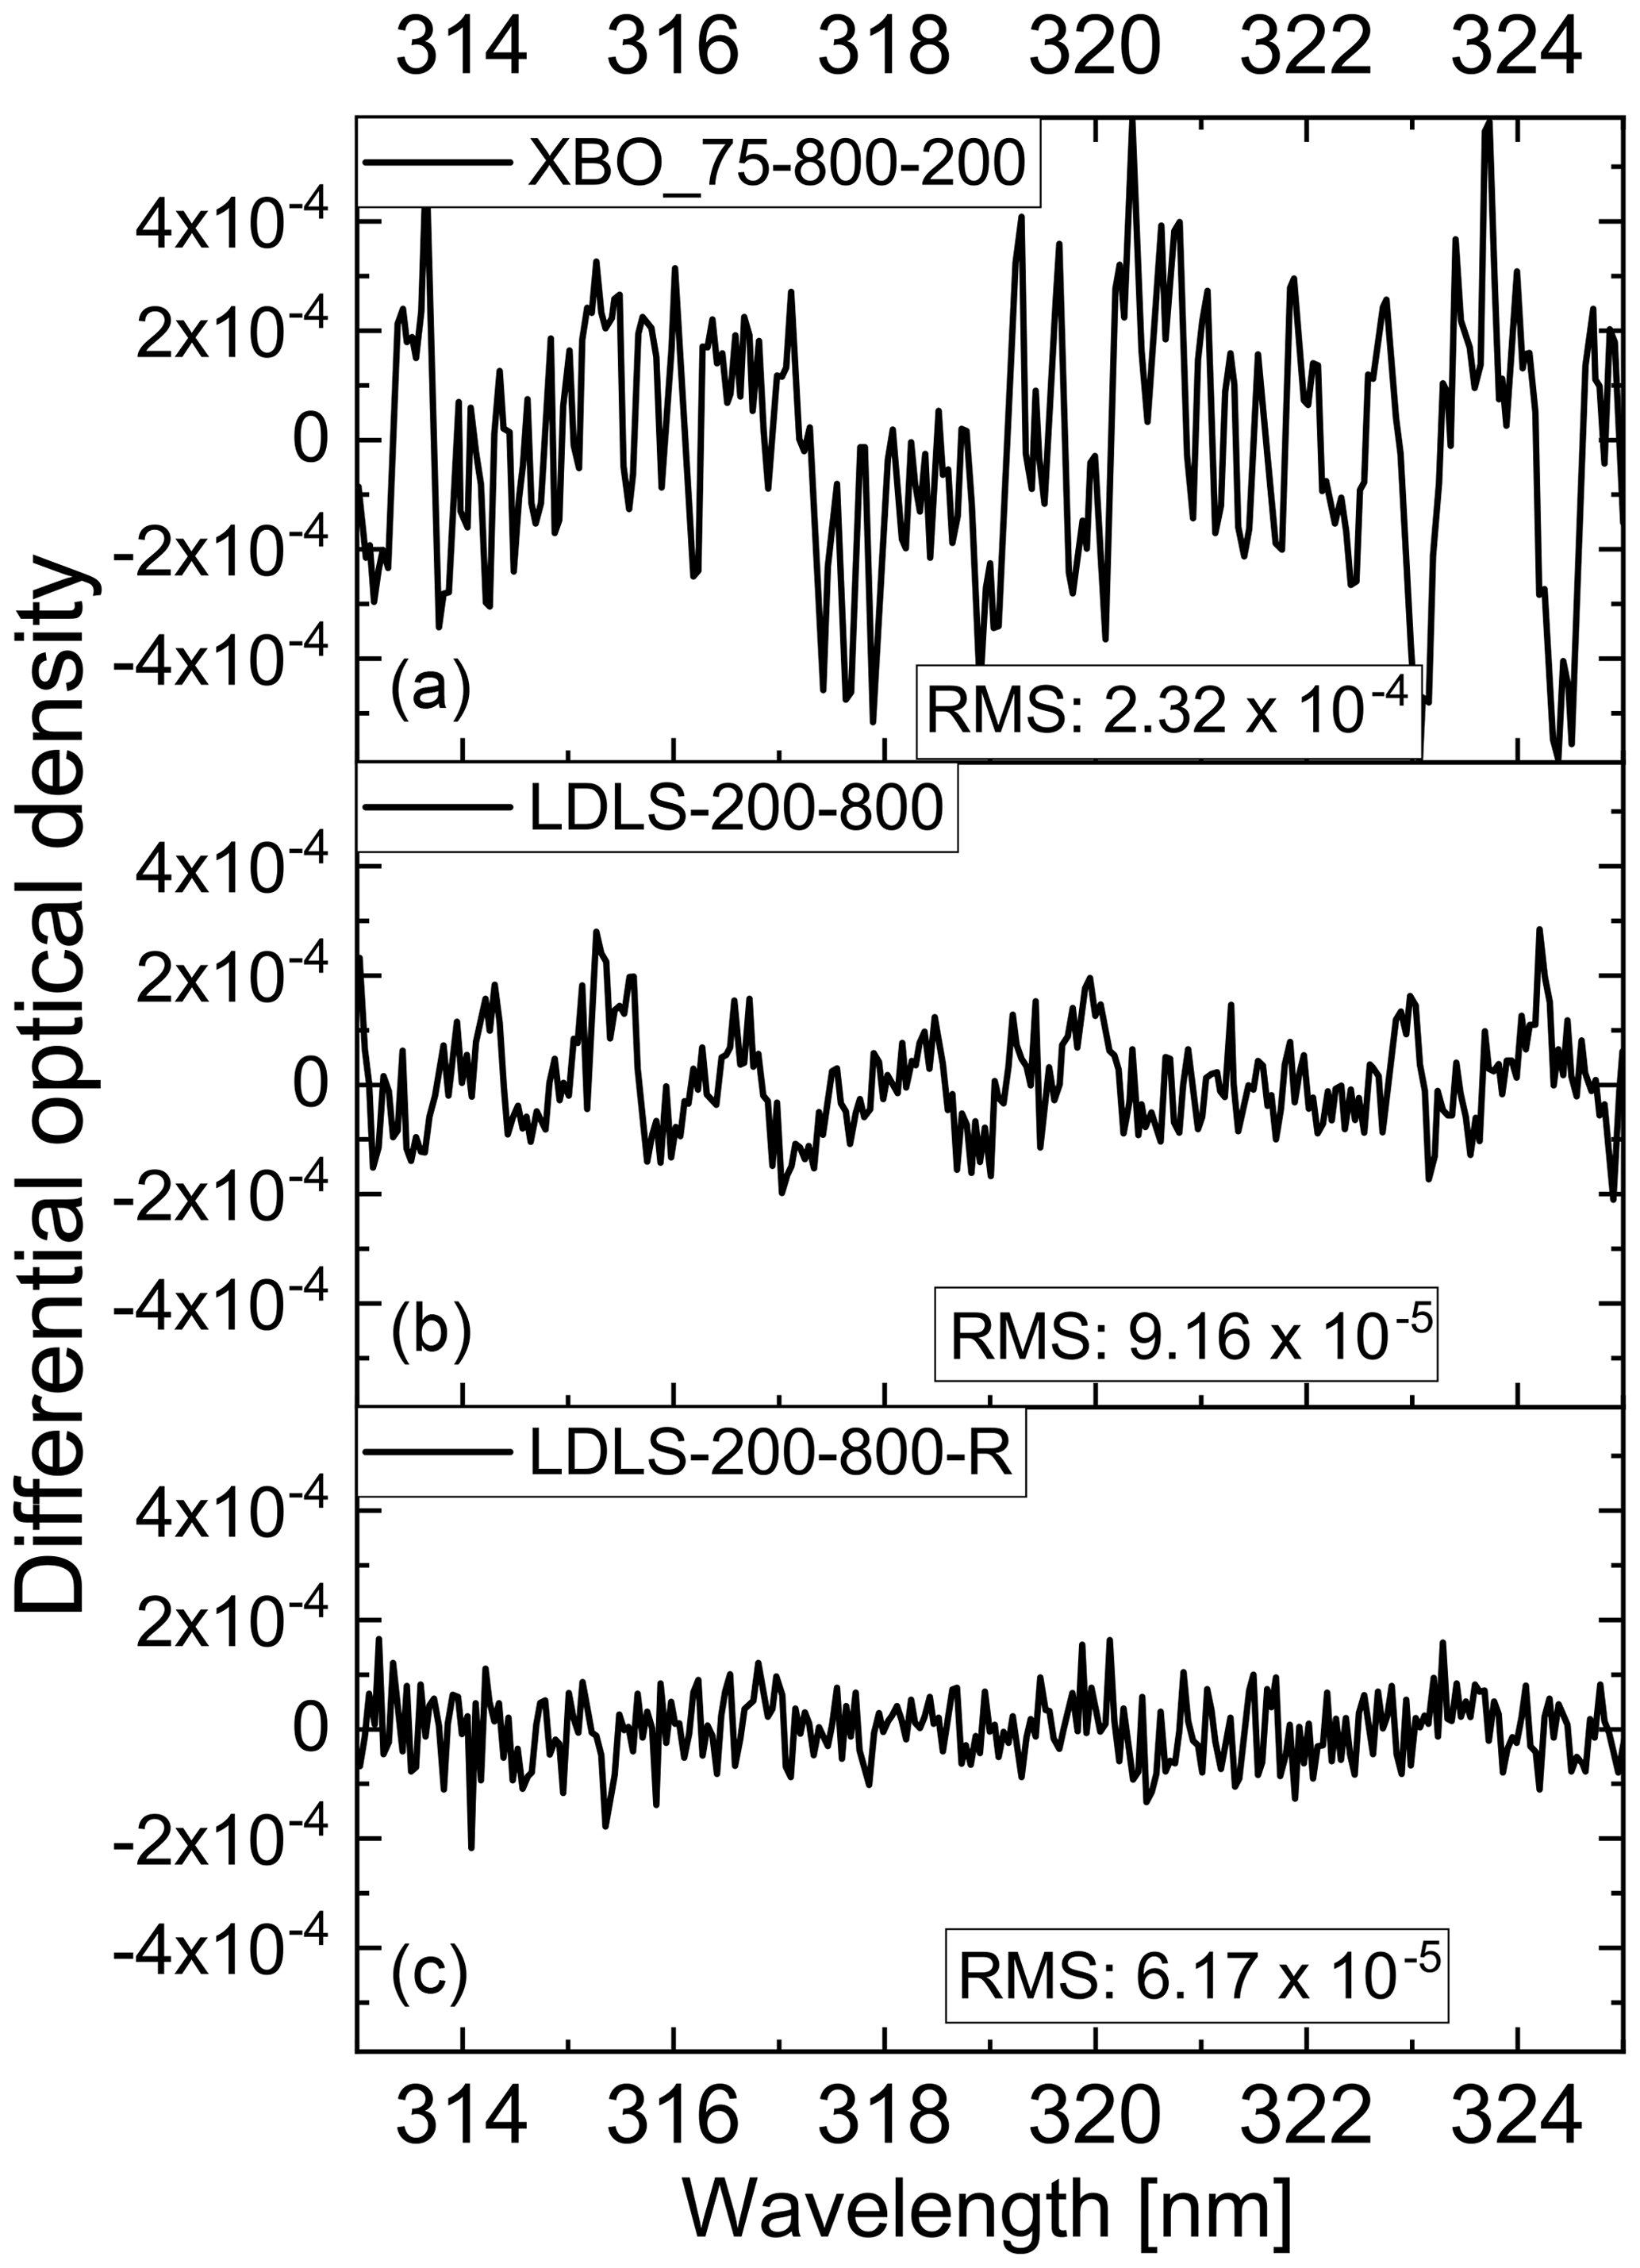
Figure 9Examples of residual spectra and corresponding root-mean-square (rms) values for the benchmark configuration with a XBO_75W arc lamp and a classical fibre configuration (a), the new LDLS light source and a reversed fibre bundle (b), and the new LDLS reversed fibre bundle and roughened fibre ends (c). The latter was found to give the best results.
Example residual spectra illustrating the improvement can be found in Fig. 9. Compared to the benchmark setup (Fig. 9a), the use of the LDLS and the reversed fibre configuration clearly decreases the residual improving both accuracy and precision. The additional roughening (compare Fig. 9b and c) further reduces systematic structures that are still visible in Fig. 9b, thus further improving the accuracy of the measurements.
As the systematic comparison of the different configurations with benchmark light source and the LDLS for several summation periods from 1 min to 10 h in Fig. 10 indicates, this advantage of the new LP-DOAS configuration even increases to a factor of 5 in residual rms when spectra are summed for 10 h (Fig. 8 and Sect. 5).
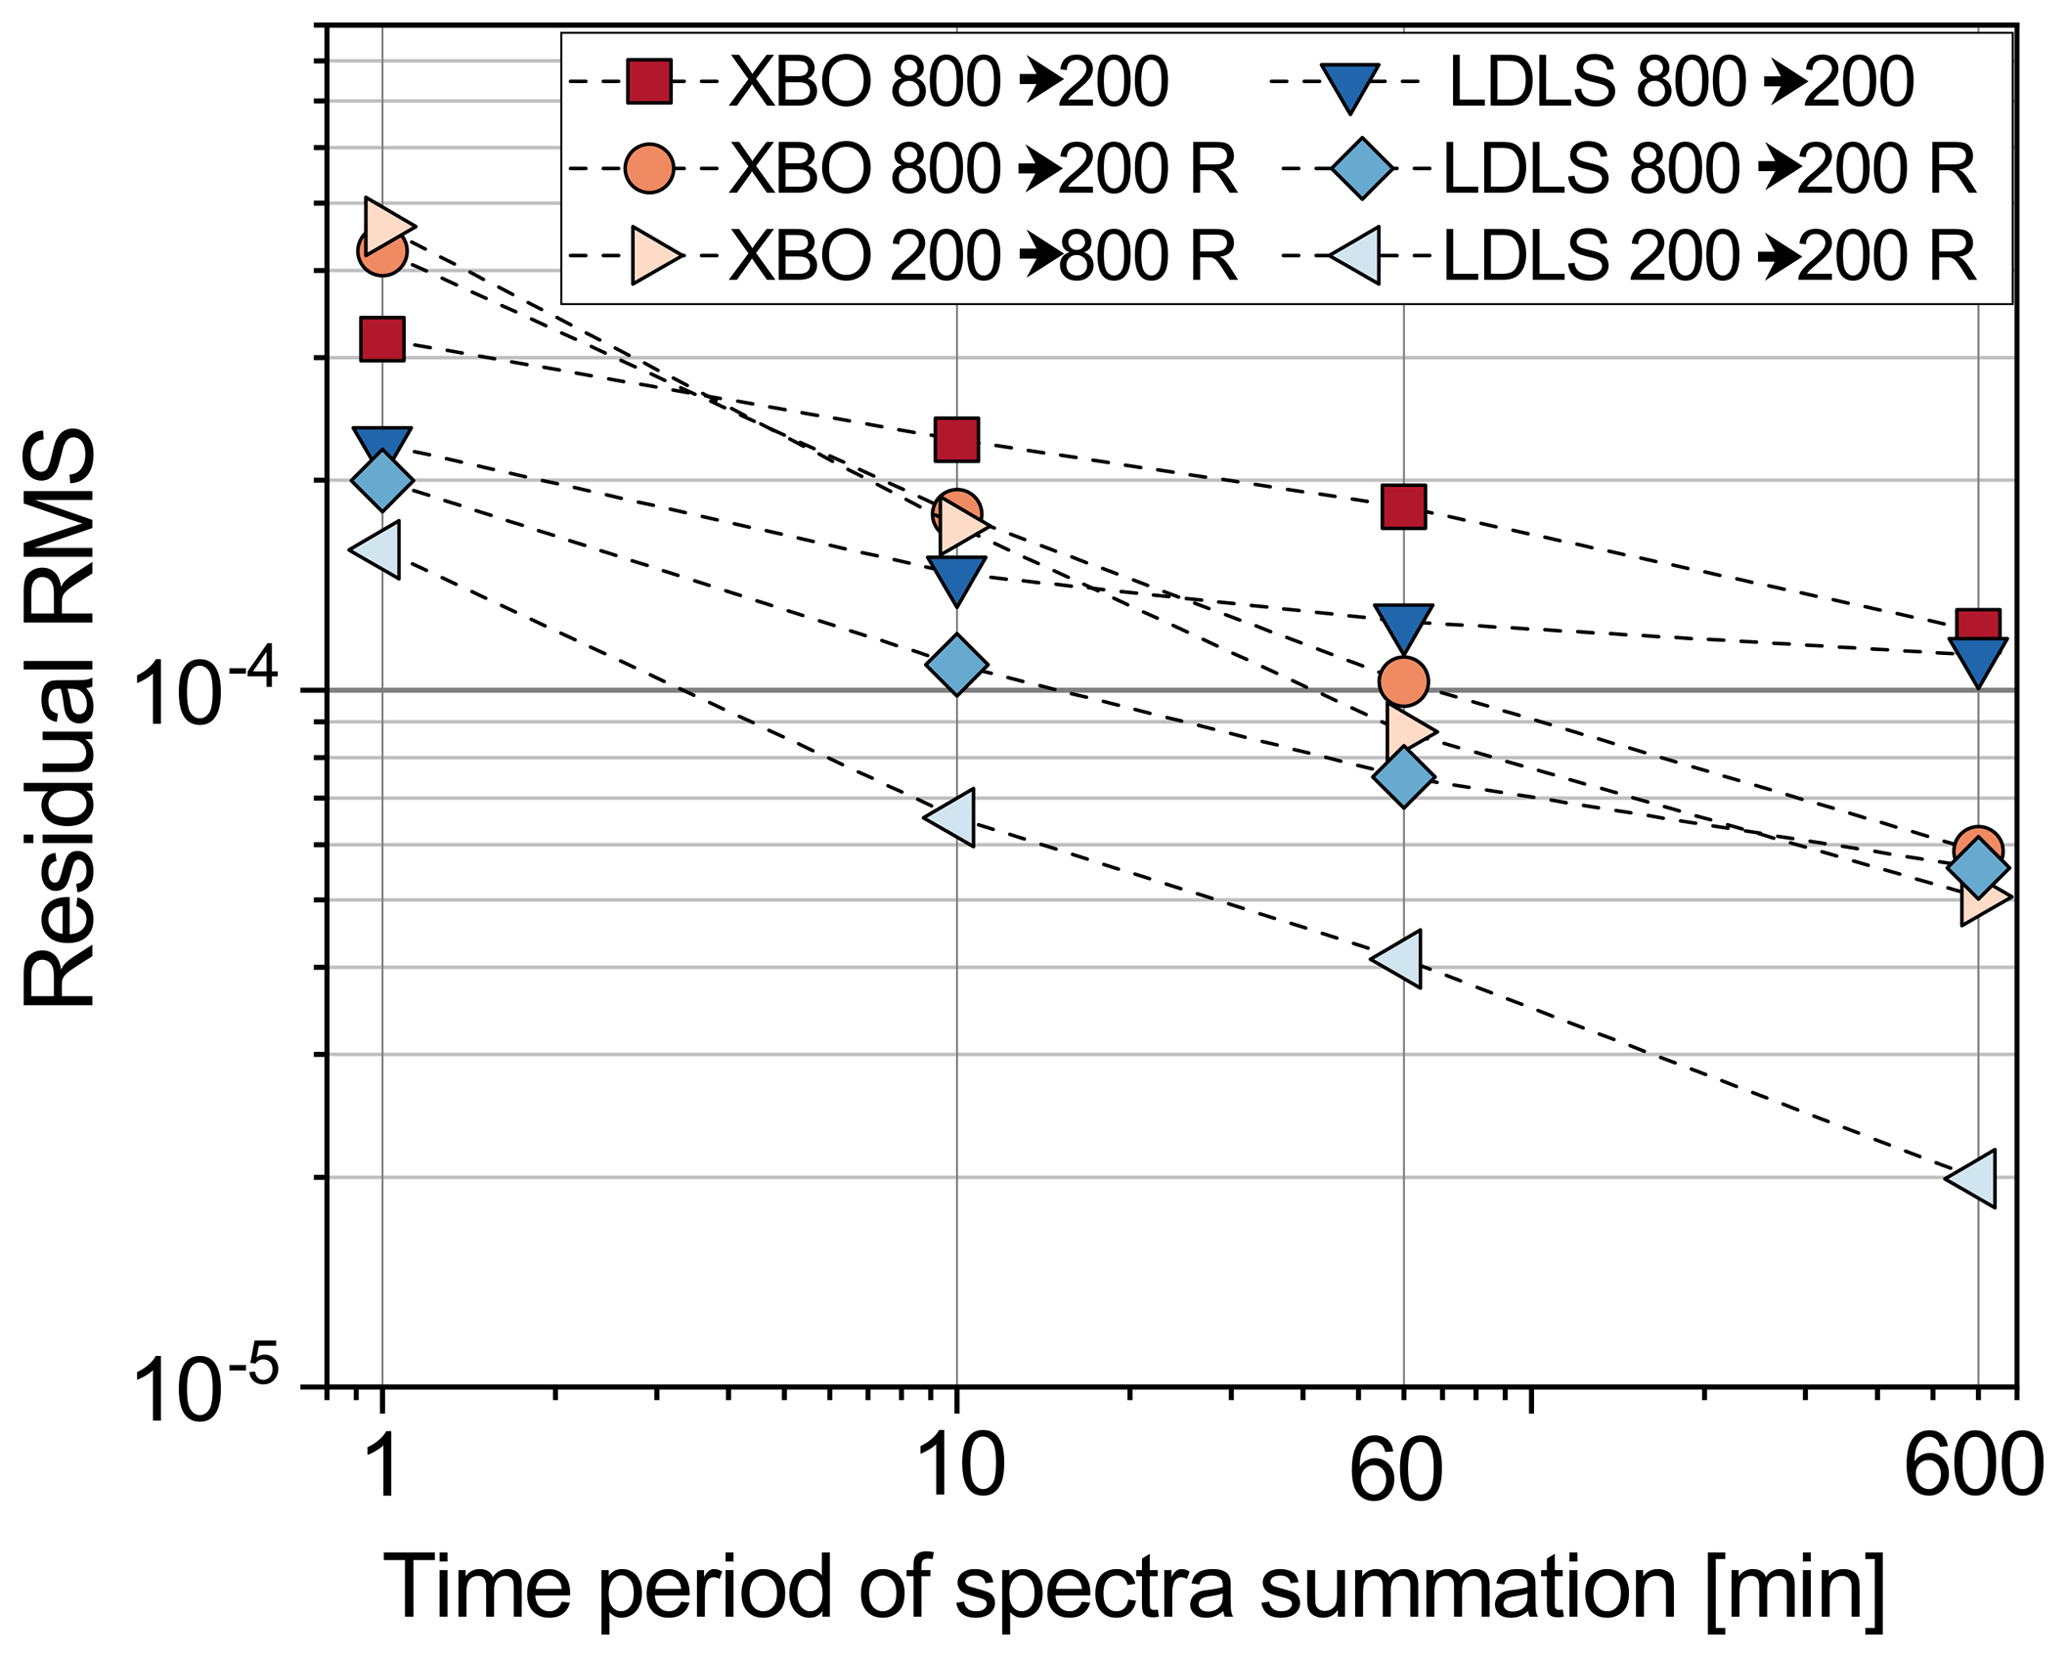
Figure 10Systematic comparison of LP-DOAS setups with classical fibre configuration, classical configuration with improved mode mixing, and the reversed fibre configuration with improved mode mixing for the benchmark light source XBO_75 and the LDLS. Attained residual rms values for different summation periods up to 10 h are plotted.
5.2 Performance in field campaigns and stability in long-term operation in Antarctica
Following the investigations in Heidelberg, the modified LP-DOAS setup with the overall best performance (LDLS-200→800-R, together with stray-light suppression by filters (see Table D1 for the models used for the different spectral regions) and using the chromatic-aberration approach for further stray-light suppression (see Sect. 3.4), was deployed with a campaign-grade telescope. A description of the measurement procedure for a first campaign in the Nördlinger Ries in Germany (“NR” in Tables 1 and 6) can be found in Appendix C.
Given sufficient temporal stability of the instrumental setup, spectra within sets, across sets, or even across subsequent recordings of a spectral window can be summed to improve the signal-to-noise ratio and to lower detection limits.
For the comparison of instrument performances in different measurement campaigns, no truly regular and universal temporal resolution exists. We, therefore, indicate typical residual rms values and detection limits for two temporal resolution regimes: high (2 to 10 min) and medium (30 min to 2 h). Typical fit ranges, average residual rms values and detection limits for selected absorbers are given in Table 6.
Table 6Attained measurement performance for the detection of different absorbers during the field campaign in the Nördlinger Ries, Germany (NR; total light path: 5.7 km), and during the long term observations on the German Antarctic Station Neumayer III (NMIII; total light paths: 3.1 and 5.9 km). Where two values are available, attainable residual rms and detection limits for two different summations, and hence temporal resolutions corresponding to 10 min (left value) and 30 min to 2 h (right value), are indicated.
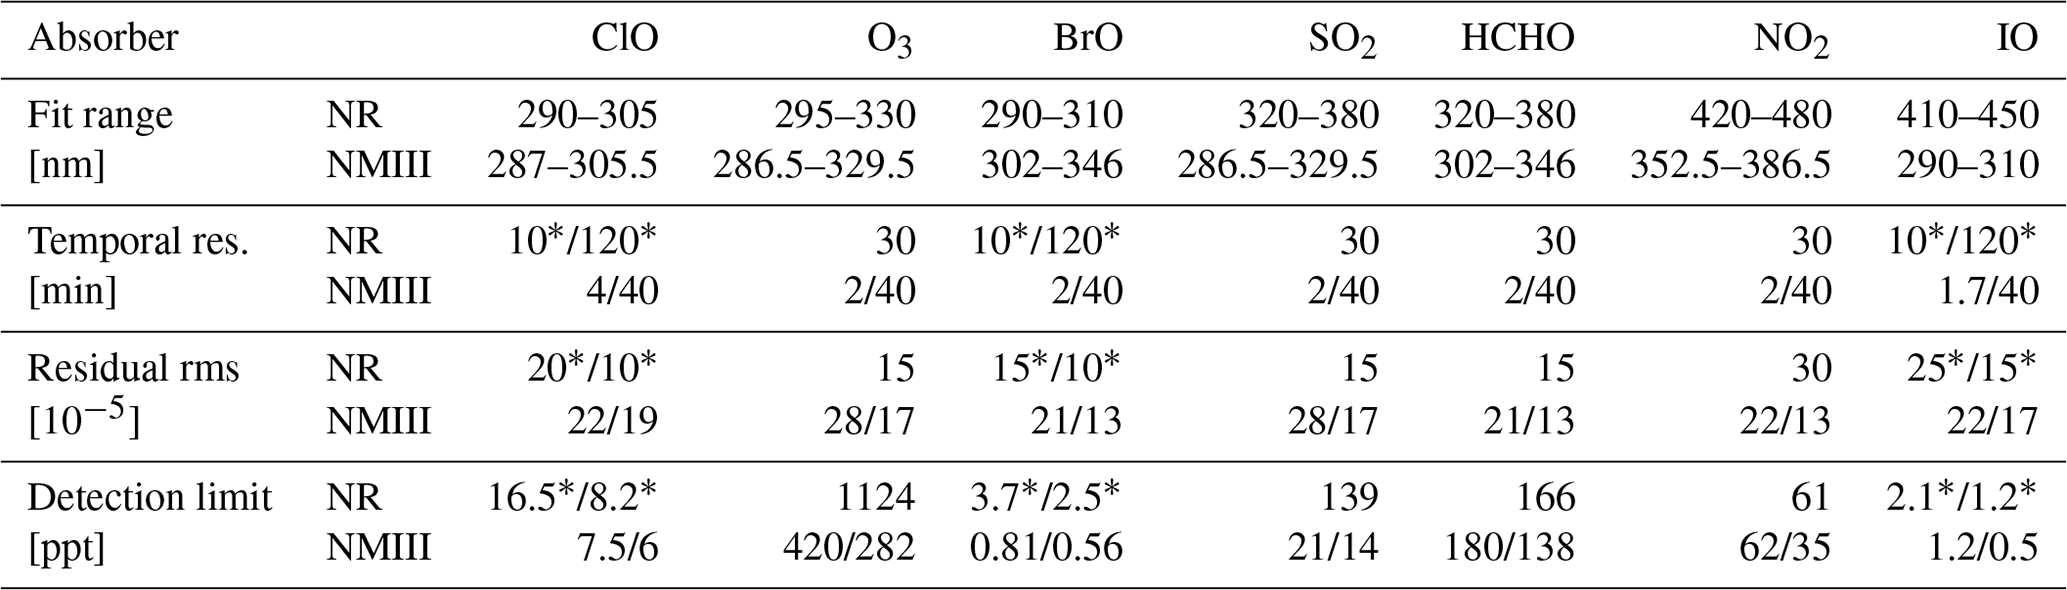
* The halogen-containing molecules were not fitted in the measurements from the Nördlinger Ries, as their presence was not expected. Instead, the respective spectral regions were summed up for 10 min and 2 h and the attained residual rms values were used to estimate upper limits for the detection limits of these trace gases. See Appendix E for details.
A second LP-DOAS setup (NMIII in Table 1) based on the presented improvements was purpose-built for long-term operation on the German Antarctic station Neumayer III (70.67∘ S, 8.27∘ W) and operated for 31 months from January 2016 to August 2018 (Nasse et al., 2019). It was set up with two light paths, 3.1 km (1.55 km one way) and 5.9 km (2.95 km one way), with nearly the same geographical orientation between which the instrument could switch autonomously depending on atmospheric conditions. This was achieved by moving the end of the fibre (letter C in Fig. 1 and column c in 2) via a motorized x–y translation stage in the focal plane of the telescope main mirror in order to point the light beam to the respective reflector array. Since visibility on the ice shelf at Neumayer III station is often reduced by blowing snow or atmospheric refractions due to strong vertical temperature inversions (optical scintillation and mirage effects), most of the time measurements were performed on the shorter light path. The measurement routine was similar to the one applied during the Nördlinger Ries campaign with five different spectral windows (see Table D1). Average residual rms values and detection limits for selected absorbers measured with this setup can be found in Table 6.
During this long period of continuous operation, maintenance requirements were mostly limited to a monthly cleaning of optical components of the setup, in particular the outside of the quartz front window (added to the Neumayer telescope to prevent snow from entering the telescope and allow the interior heating of the telescope), and regular wavelength calibrations. This routine maintenance and the repair of smaller mechanical malfunctions could be performed by the station's wintering crew. Regular major maintenance was only conducted on a yearly basis.
The long operation time allows us to draw conclusions about the long-term performance of the light source and potential ageing effects of the entire setup. Due to logistical reasons and also in view of the low abundances of organics in the air, the LDLS in this setup was only purged daily for 30 min with filtered air (rather than nitrogen gas). Ambient air was passed through a three-stage filtering system of silica gel to remove water vapour, active charcoal to remove gaseous pollutants and a particle filter. The light source reached a total operation time of about 22 500 h before a permanent failure occurred. During this time, no realignment of the light source-fibre coupling optics was required, which indicates an exceptional spatio-temporal stability of the plasma spot inside the bulb.
It is not possible in this setup to separate contamination and ageing phenomena of the optical components from changes in the radiance of the LDLS. However, an investigation of reference spectra corrected by their respective backgrounds for all spectral windows (Table D1) shows similar decreases in the average intensities for all spectral windows (see Fig. 11). The largest decreases of 17 % and 12 % until the first general maintenance of the instrument after the first year of operation are observed for the UV I and UV II spectral windows. A thorough cleaning of all optical components, which was not always possible in Antarctic winter, and an exchange of the bandpass filters in the light source could restore intensities to 93 % and 95.5 %, respectively. Throughout the 31-month measurement period, intensities were never lower than 80 % of the initial values (except for the days directly before the final lamp failure) even when components were probably dirty. The seemingly irreversible intensity decreases of 4.5 %–7 % for the two UV spectral windows over 2 years might be explained by a permanent reduction of the transmissivity of optical components, e.g. by solarization of fibres and lenses or a decreased output of the LDLS.
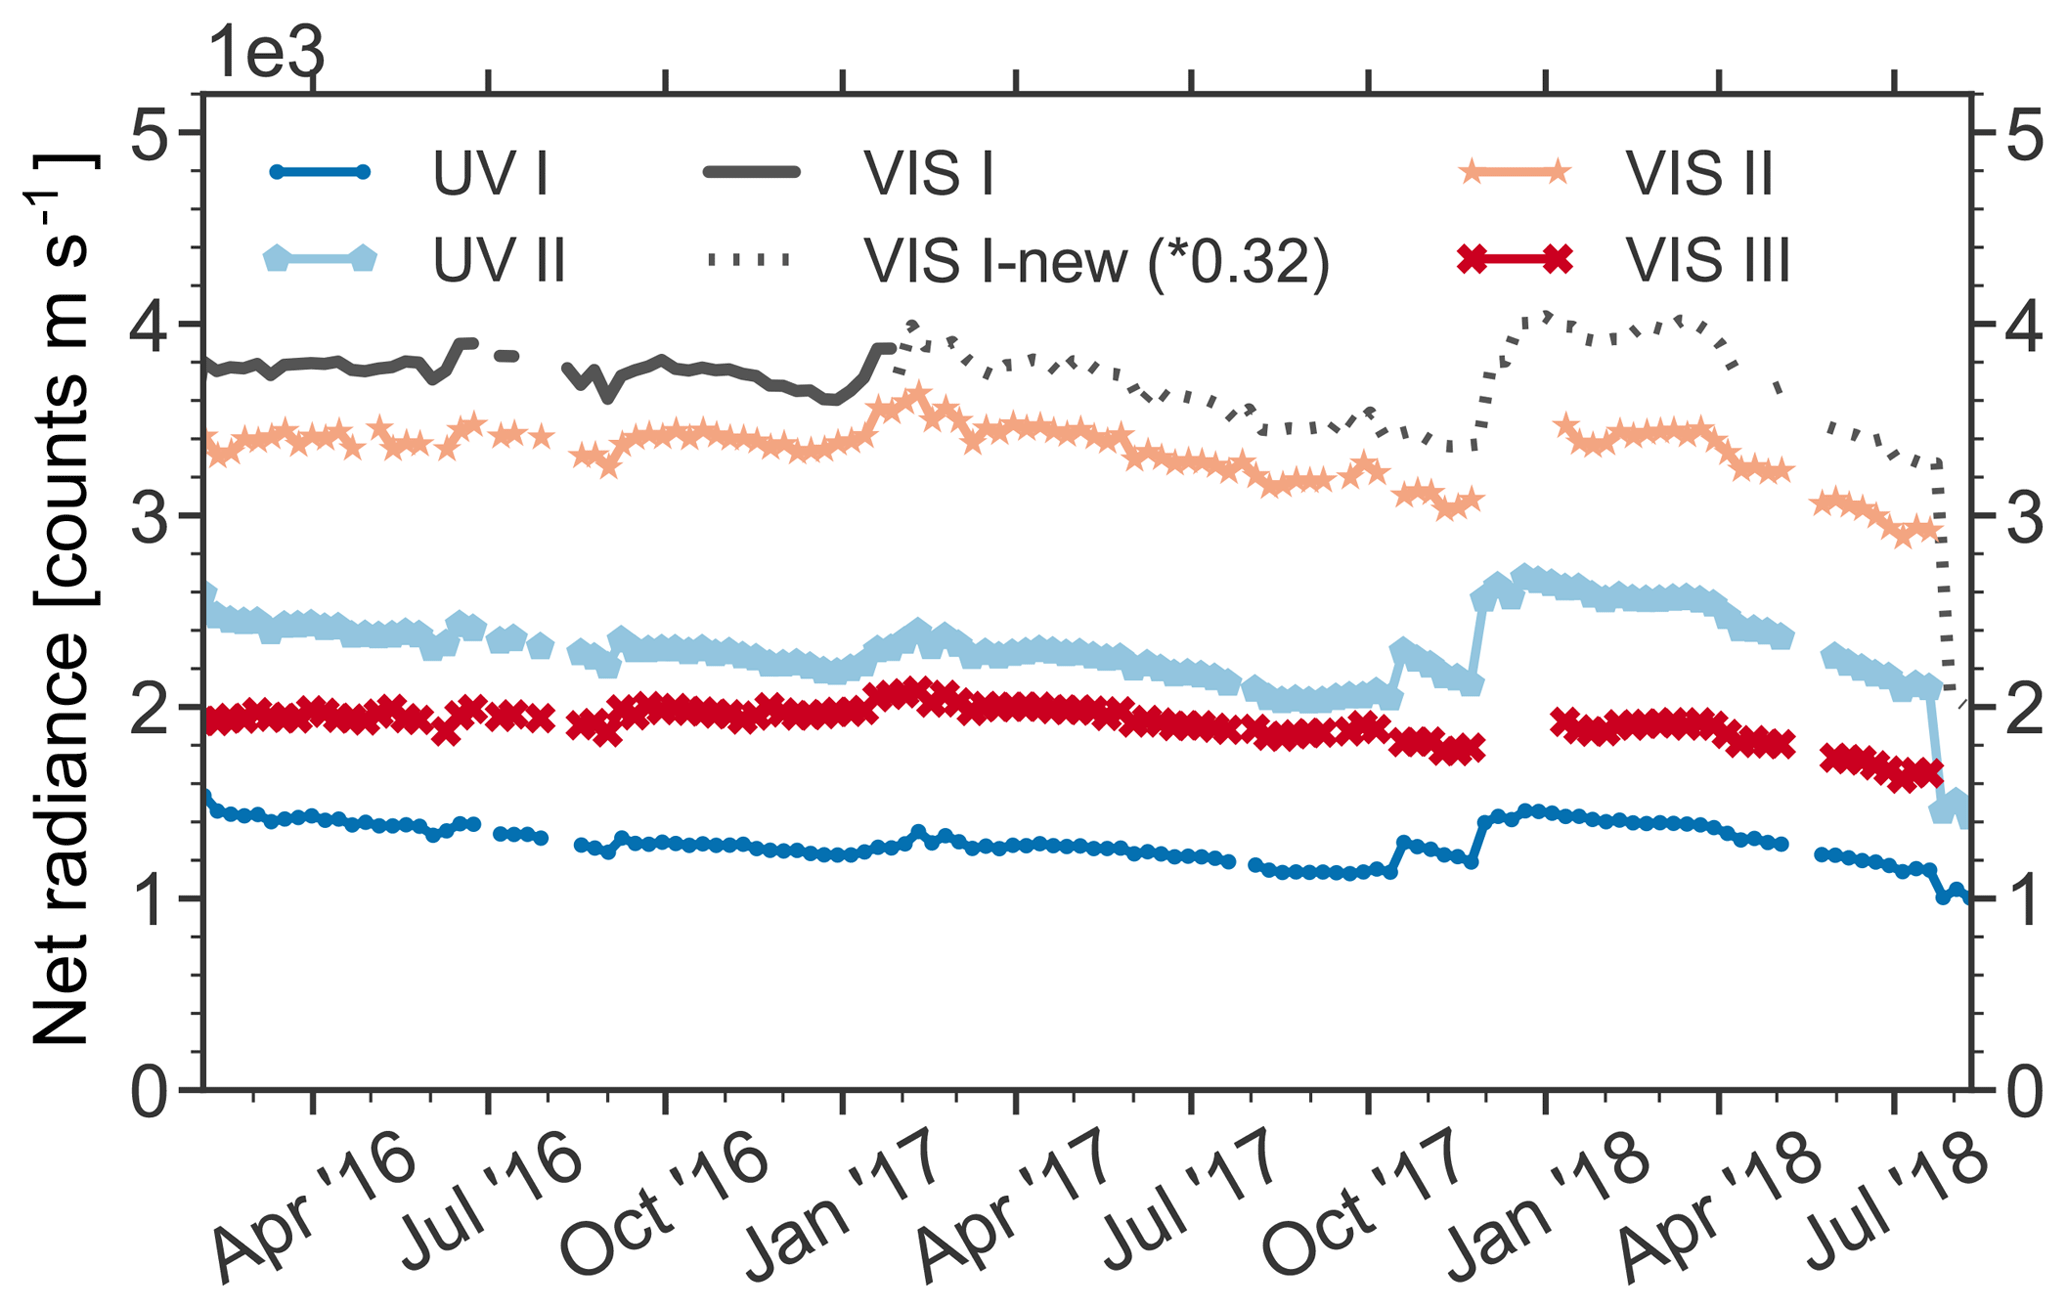
Figure 11Evolution of the net radiance of reference spectra in the NMIII setup over time for the five spectral ranges UV I through VIS II defined in Table D1. The average intensity value (in counts) of the reference spectra in the different measurement windows was corrected for background light by subtracting corresponding reference background spectra (light source blocked and shortcut in front of the fibre end in the telescope). Following this, weekly medians were calculated. Since the grating was changed in February 2017 in the VIS I window, the recorded radiances (which due to the lower dispersion of the new grating were about 3 times higher) were adjusted to that of the first grating (dotted line). Maintenance was performed on a monthly basis (as far as meteorological conditions allowed) and optical components (filters in the light source) were exchanged after roughly 1 year of operation. This resulted in temporarily enhanced intensities.
Here we present a series of improvements to fibre-based long-path differential optical absorption spectroscopy (LP-DOAS) systems and discuss their respective contributions to the overall improvement of the measurement accuracy and precision. The basis for this study was a mono-static LP-DOAS setup using optical fibre bundles for light coupling between the different instrumental components.
A laser-driven light source (LDLS) with a high-pressure xenon bulb was introduced as a new type of light source for LP-DOAS measurements that combines the broad spectral coverage of xenon arc lamps with the stability and simple handling of LEDs (see Sect. 3.2). Compared to a XBO_75W arc lamp, which was used as the benchmark in our analysis, employing the LDLS leads to 35 % smaller residuals, while the received signal and hence the temporal resolution of a setup is about 70 % higher.
The small plasma spot of the LDLS allows us to reverse the previously used fibre configuration of the LP-DOAS which significantly improves performance (see Sect. 3.3). The mixing of fibre modes that cause spectral structures and limit accuracy is improved by this reversal through the favourable properties of larger diameter fibres that now couple to the spectrometer (see Sect. 4). Furthermore, the overall light throughput can be increased if the spectrometer has the limiting étendue of the system (see Tables 1 and 3).
To decrease the influence of stray light on accuracy and precision, the spectral origins of which were found to mainly be a region between 450 and 650 nm (see Sect. 3.4), bandpass filters adapted to the respective measurement spectral window can be used at the expense of transmissivity (losses of 40 %–50 %), which was already done previously. The application of the LDLS allows a further suppression of stray light by exploiting the chromatic aberration of the quartz lens that couples the light from the light source into the fibre. Combined, these measures lead to an overall stray-light reduction of more than 95 % for measurements around 330 nm yielding stray-light levels of less than 0.1 %.
To reduce an inhomogeneous illumination of the spectrometer grating caused by fibre modes, mode mixing can be introduced. Here, we compared previously applied techniques like vibrating or micro-bending of the fibre, adding diffusers to the optical setup and a new fibre roughening method (see Sect. 4). In this approach, the highly polished end faces of the fibre bundle are artificially degraded with polishing sheets (5 to 12 µm grit size). Thus a quasi-built-in diffuser is added to the fibre. Compared to vibrating the fibre, in the reversed fibre configuration the attained residuals are about 30 % smaller (at slightly higher light losses of 20 % to 40 %; see Table 4). Compared to diffuser disks, light throughput is about 4 to 10 times larger with the roughened fibres at comparable rms values. It should be noted that this method is not limited to setups with LDLS but can be applied, e.g. with conventional xenon arc lamps. The residual with a “XBO_75W” and classical fibre bundle with a 800 µm mono- to 200 µm multi-fibre bundle is reduced by a factor of 2, however, at the cost of a 70 % reduction of the total light throughput (Table 5).
By combining the changes to the LP-DOAS setup, in intercomparison field measurements in Heidelberg, the residuals could be reduced by a factor of 3–4 compared to the benchmark setup and residual rms values on the order of in units of optical density could be achieved (see Fig. 10).
When the improvements described above were applied to two campaign-grade LP-DOAS setups using smaller spectrometers (see Table 1), residuals of the order of were achieved under optimal conditions and, on average, in a long-term measurement campaign in Antarctica. Measurements in the UV spectral region particularly benefit from these improvements. For instance, during the measurements in Antarctica, average detection limits of ClO were between 6 to 7.5 pptv at temporal resolution between 4 and 40 min. BrO could be detected at detection limits of 0.6 to 0.8 pptv at temporal resolutions of 2 to 30 min (see Table 6).
In conclusion, the application of the LDLS with its greatly reduced operational complexity and maintenance requirements, its high spatial and temporal stability and its long lifetime has enabled a number of technical improvements to the fibre-based LP-DOAS setup. These increase measurement accuracy, precision, and reliability of LP-DOAS systems and make this versatile remote-sensing technique much easier to deploy even in longer field campaigns or permanently operated applications.
The data in the figures are available upon request from the corresponding author (Jan-Marcus Nasse).
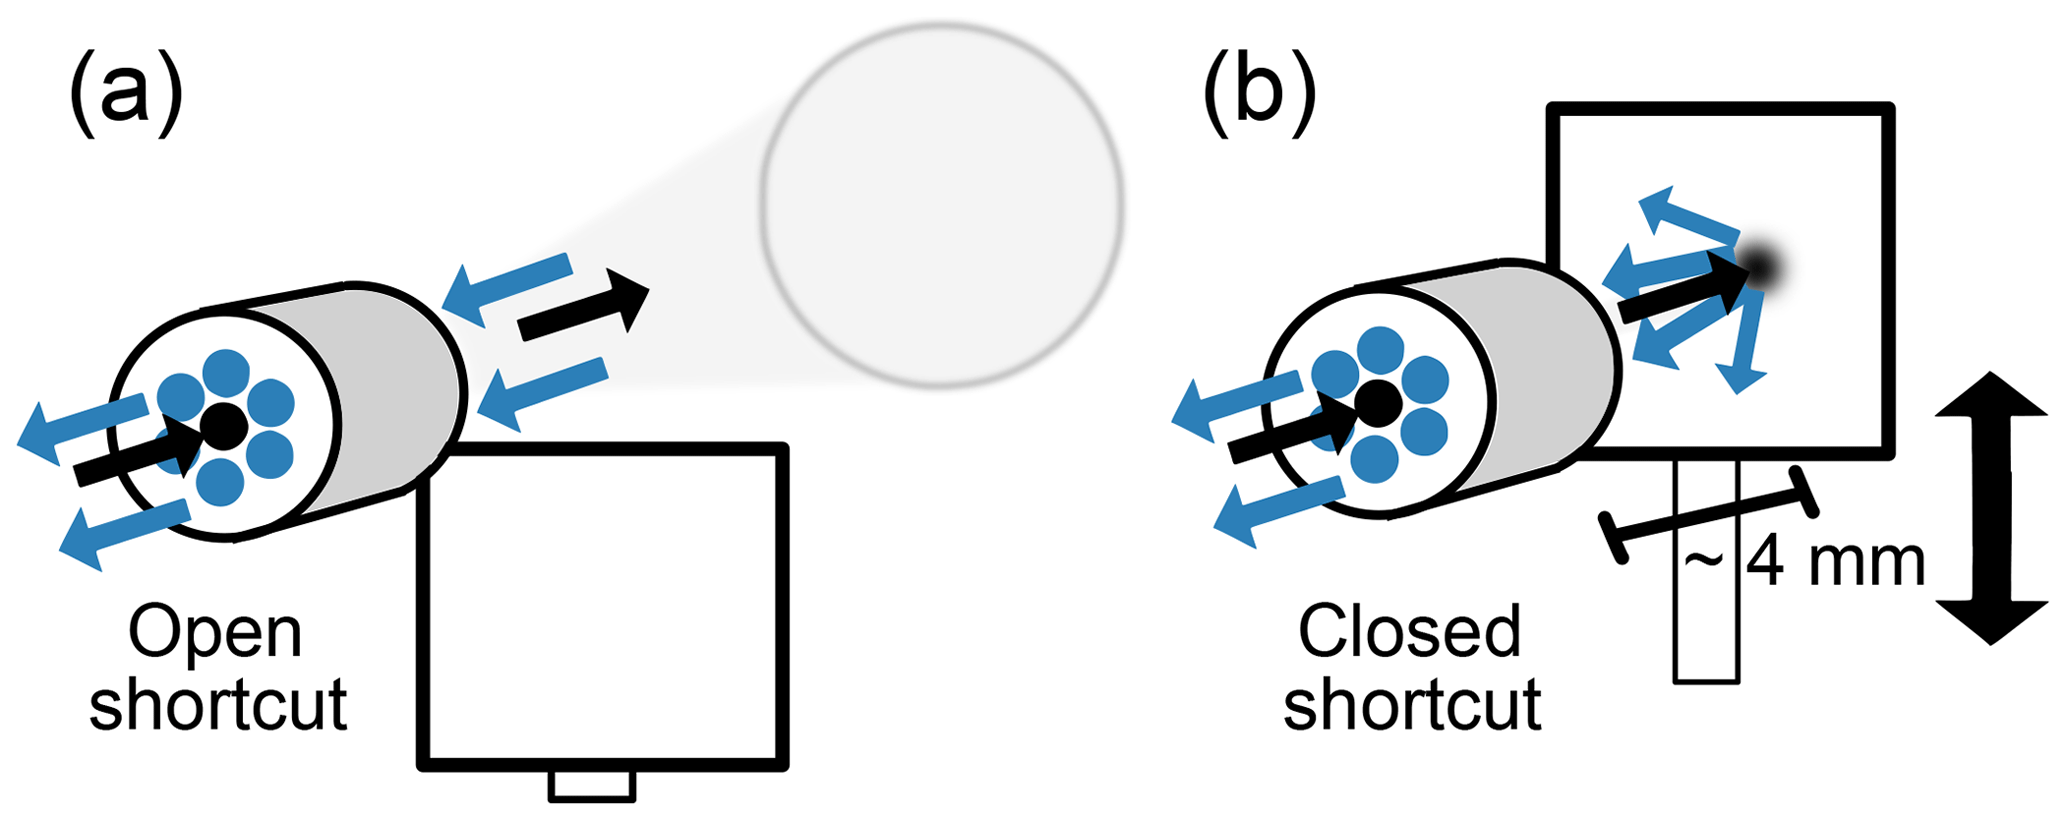
Figure A1Working principle of the shortcut system. When the shortcut is open, light can reach the main mirror, traverse the atmospheric light path, and be collected by the fibres (a). To record a reference spectrum, a diffuse reflector plate (here a sandblasted aluminium plate) is moved into the light path at a distance of 1 to 4 mm from the fibre end (b). The radiation is scattered from the surface of this plate back into the fibre bundle without traversing the atmosphere and is thus free of atmospheric absorption.
B1 Bandpass filters used in stray-light investigation
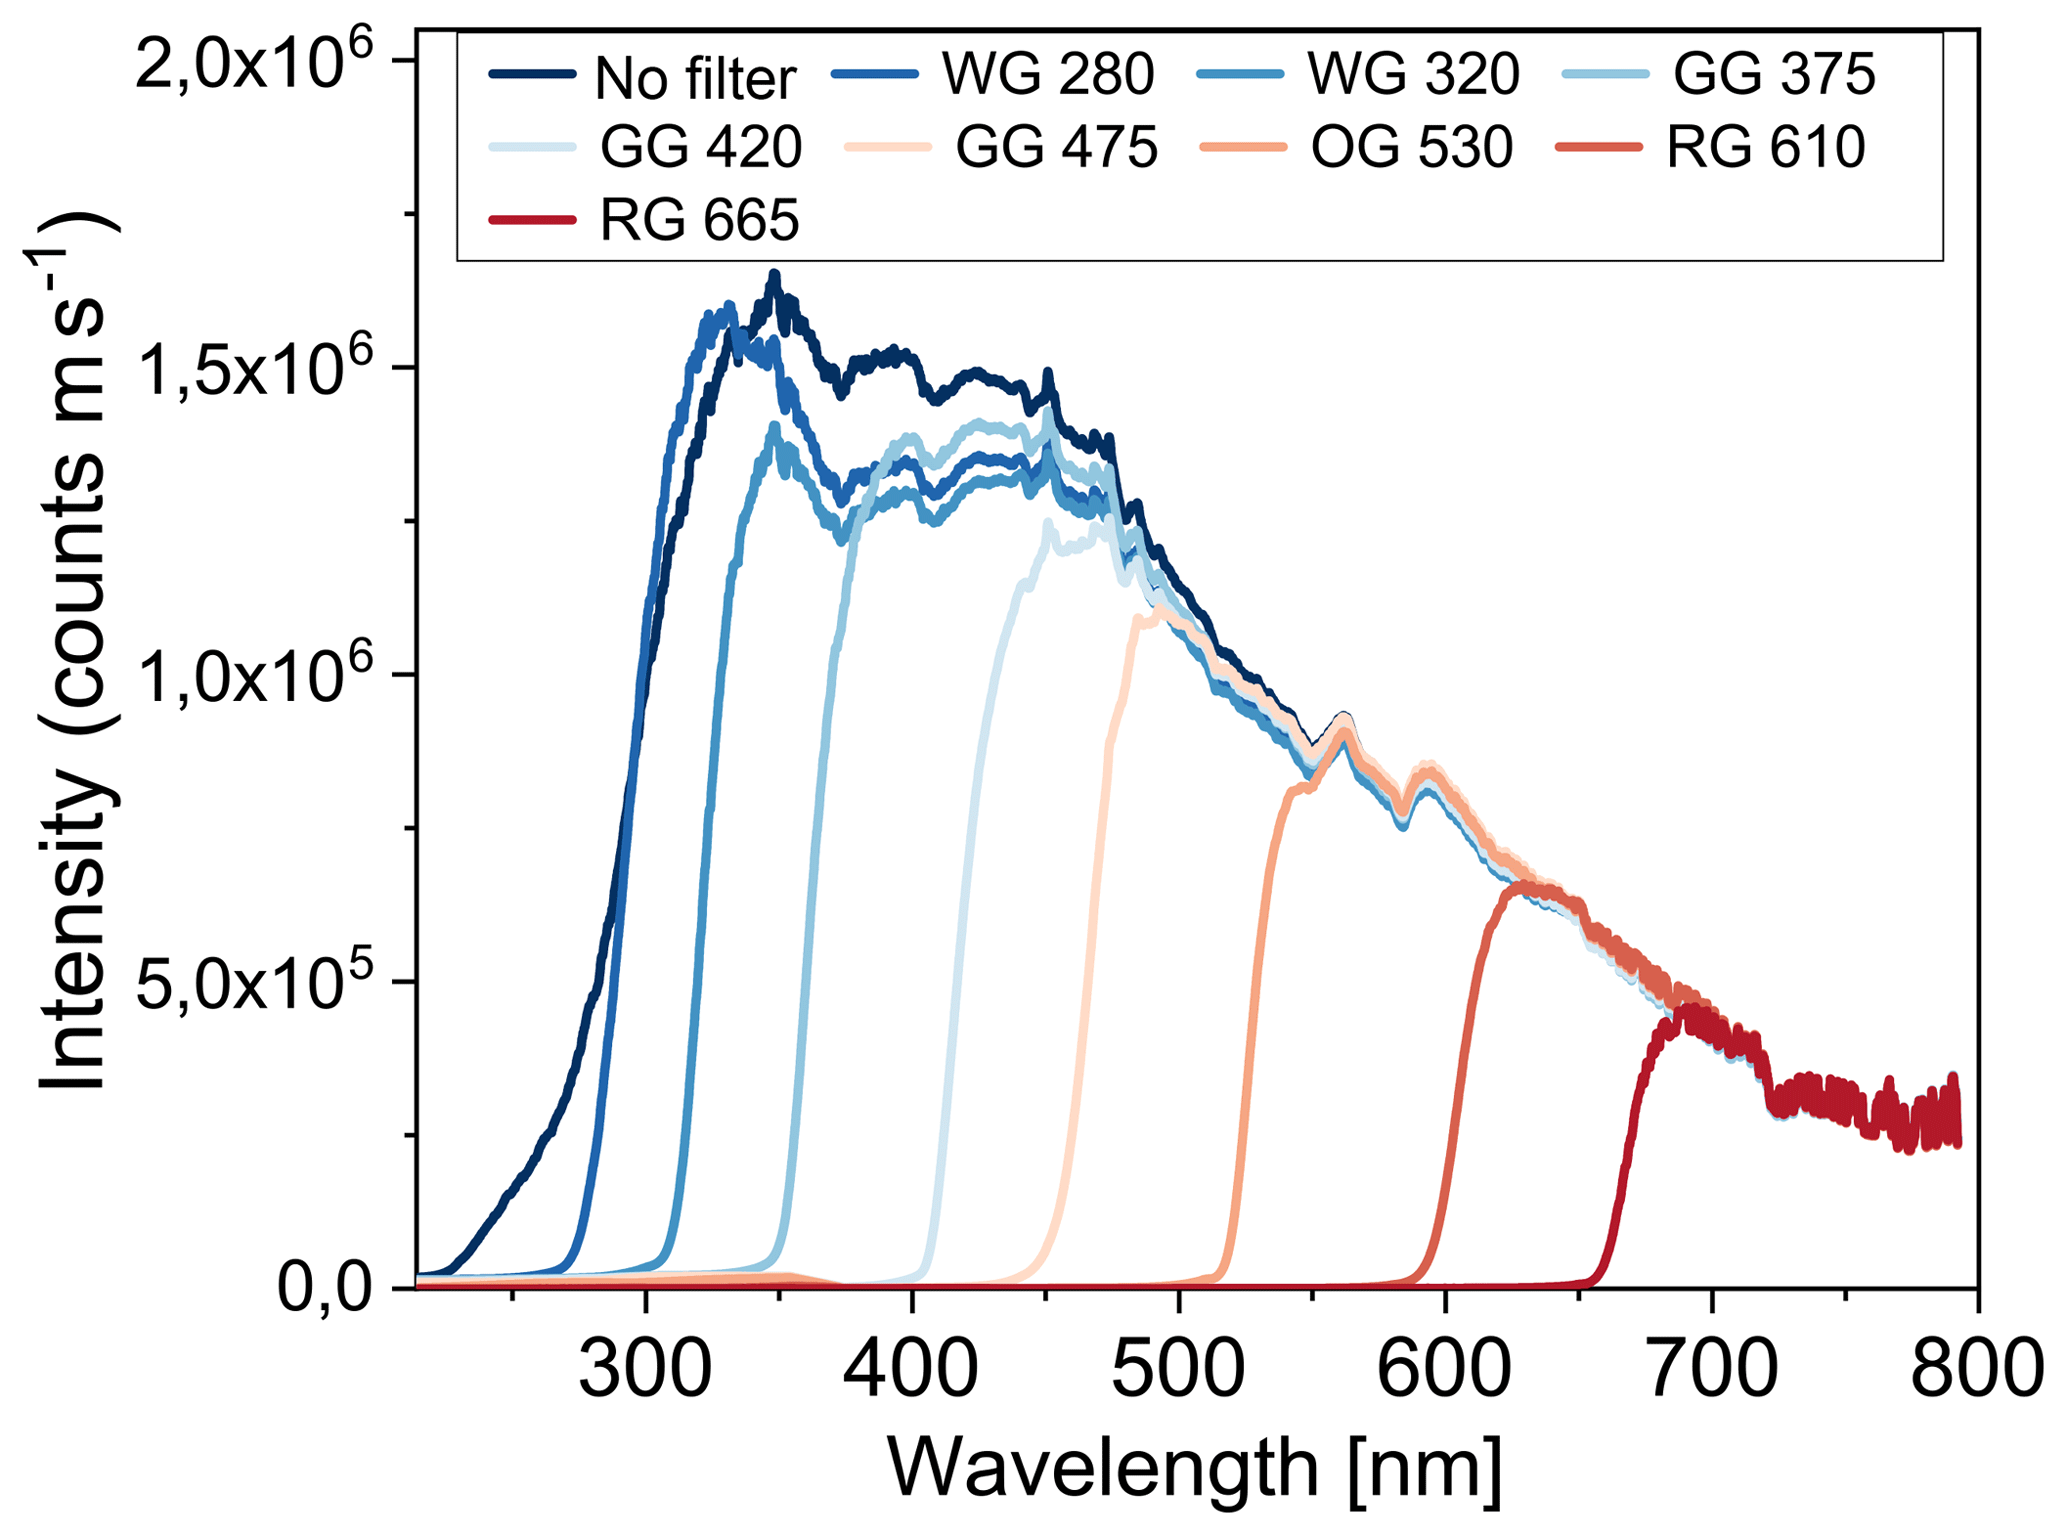
Figure B1Overview of the bandpass and long-pass glass filters used in the investigation of the spectral origin of spectrometer stray light and their influence on the spectrum of a LDLS. The spectra recorded with a filter were scaled to match the spectrum without a filter in the spectral region between 700 and 800 nm. This explains the higher intensities of the WG 280 spectrum compared to the one without a filter. The position of the fibre, with respect to the lens coupling of the radiation from the LDLS into the fibre, was optimized for filters in the light path. For the spectrum without a filter this leads to the slightly different spectral shape.
B2 Locations of foci for different spectral ranges

Figure B2Variation in the relative intensity of selected spectral regions as a result of the chromatic aberration as a function of the relative position of the fibre. Panel (a) shows results for a coupling into a 800 µm fibre, panel (b) is the same as (a) but for a 200 µm fibre. For both plots, the increasing selectivity towards the UV due to the non-linear increase in the refractive index is visible. For the smaller fibre diameter the chromatic-aberration filter becomes even more selective.
A LP-DOAS setup based on the improvements discussed above (setup “NR” in Table 1) was deployed in a 3.5-month measurement campaign from 12 August until 8 December 2014 in the Nördlinger Ries, a rural area in southern Germany. The campaign had a focus on investigating the link between precipitation and emission of NO2 and HCHO from soils. The LP-DOAS was operated in five spectral windows from the UV to the visible (see Table D1) on a 5.7 km light path (2.85 km one way). Since these spectral regions are not covered at the same time by the detector, the grating in the spectrometer was turned sequentially to attain the different spectral regions. The measures for stray-light reduction, i.e. the bandpass filters and the chromatic-aberration filter approach, and for further stray-light suppression in the light source (see Sect. 3.4) were changed and adjusted accordingly between spectral windows.
When set up for a particular spectral window, atmospheric and reference spectra were recorded alternately in sets (five reference spectra interleaved with four atmospheric spectra). At the end of each set, one atmospheric background and one reference background were recorded after blocking the light source. Especially when atmospheric conditions change quickly, short temporal offsets between measurement (atmospheric and reference) and background spectra are important. In each spectral window, several (3–5) of these sets were recorded before the grating was turned to the next spectral position.
To avoid or minimize the influence of detector non-linearity, exposure times for atmospheric and reference spectra in LP-DOAS measurements were adjusted to yield comparable saturations of the CCD. The exposure times of atmospheric spectra and hence the measurement time were, therefore, dependent on atmospheric visibility. The revisiting time of a spectral window (here about 20–30 min) in the whole measurement routine thus depended on the number and total recording durations of the other spectral windows and hence also on atmospheric visibility.
Table D1Measurement routines for field campaigns in the Nördlinger Ries (Germany; NR) and long-term observations on the German Antarctic station Neumayer III (NMIII).

a Due to instrumental stray-light problems, another grating was used for the VIS I
window in the Neumayer setup (see setup “NMIII” in Table 1). b For optimization of
the measurement time, these spectral windows were skipped during most of the daytime
(solar zenith angle, SZA < 85∘), since trace-gas molecules of interest here are expected
to only be present during the night because of their photochemical instability.
To estimate the expected detection limit of an absorber that is not present in the atmosphere and hence not included in the DOAS fit, the residual rms value in the spectral region where the absorber would be fitted can be used. A upper limit of a detectable concentration clim can be inferred by calculating the concentration of the absorber along the light path L for which the optical depth is as large as the root mean square (rms) of the residual optical density:
This estimate tends to be an upper limit for actually achievable detection limits.
JMN composed the manuscript and updated all figures based on drafts by PGE (except Figs. A1 and 11). Together with DP, SS, UF, and UP, JMN was involved in the planning, design, and setup of the LP-DOAS instrument in Antarctica and was responsible for its operation. Supported by DP, SS, UF, and UP, JMN analysed and interpreted the Neumayer III data set contributing results in Fig. 11 and Tables D1 and 6. PGE, DP, and SS devised the fibre-based optical setup including stray-light filtering and fibre treatment used in the lab studies. PE designed, performed, and evaluated all Heidelberg-based measurements supported by DP, SS, and UP. PGE, DP, and SS performed the measurement campaign in the Nördlinger Ries. UF coordinates the project activities at the German research station Neumayer III.
The authors declare that they have no conflict of interest.
For the measurements at the Neumayer III station we acknowledge the support from the Alfred Wegener Institute – Helmholtz Centre for Polar and Marine Research (AWI). We thank Rolf Weller from AWI for his advice and practical help during the entire campaign as well as the 36th, 37th, and 38th wintering crews of the station and their respective air chemists Thomas Schaefer, Zsófia Jurányi, and Helene Hoffmann for taking good care of the instrument. We thank three anonymous referees for their reviews.
The measurement campaign in the Nördlinger Ries (Germany) has been funded by the Max Planck Institute for Chemistry in Mainz. Measurements at Neumayer III have been supported by the Deutsche Forschungsgemeinschaft (DFG) in the framework of the project HALOPOLE III (grant no. FR 2497/3-2). Jan-Marcus Nasse was partially supported by the Evangelisches Studienwerk Villigst (PhD scholarship) and the Studienstiftung des Deutschen Volkes (PhD scholarship). The publication of this research has been funded by the DFG within the funding programme Open Access Publishing, the Baden-Württemberg Ministry of Science, Research and the Arts, and Ruprecht-Karls-Universität Heidelberg.
This paper was edited by Cheng Liu and reviewed by three anonymous referees.
Alicke, B., Platt, U., and Stutz, J.: Impact of nitrous acid photolysis on the total hydroxyl radical budget during the Limitation of Oxidant Production/Pianura Padana Produzione di Ozono study in Milan, J. Geophys. Res., 107, 8196, https://doi.org/10.1029/2000jd000075, 2002. a
Asaf, D., Tas, E., Pedersen, D., Peleg, M., and Luria, M.: Long-Term Measurements of NO3 Radical at a Semiarid Urban Site: 2. Seasonal Trends and Loss Mechanisms, Environ. Sci. Technol., 44, 5901–5907, https://doi.org/10.1021/es100967z, 2010. a
Axelsson, H., Galle, B., Gustavsson, K., Ragnarsson, P., and Rudi, M.: A transmitting/receiving telescope for DOAS measurements using retro-reflector technique, Optical Remote Sensing of the Atmosphere, OSA Technical Digest Series, 4, 641–644, 1990. a
Blake, J. N., Kim, B. Y., and Shaw, H. J.: Fiber-optic modal coupler using periodic microbending, Opt. Lett., 11, 177, https://doi.org/10.1364/ol.11.000177, 1986. a
Bogumil, K., Orphal, J., Homann, T., Voigt, S., Spietz, P., Fleischmann, O., Vogel, A., Hartmann, M., Kromminga, H., Bovensmann, H., Frerick, J., and Burrows, J.: Measurements of molecular absorption spectra with the SCIAMACHY pre-flight model: instrument characterization and reference data for atmospheric remote-sensing in the 230–2380 nm region, J. Photochem. Photobiol. A-Chem., 157, 167–184, https://doi.org/10.1016/s1010-6030(03)00062-5, 2003. a, b, c
Chan, K. L., Pöhler, D., Kuhlmann, G., Hartl, A., Platt, U., and Wenig, M. O.: NO2 measurements in Hong Kong using LED based long path differential optical absorption spectroscopy, Atmos. Meas. Tech., 5, 901–912, https://doi.org/10.5194/amt-5-901-2012, 2012. a
Commane, R., Seitz, K., Bale, C. S. E., Bloss, W. J., Buxmann, J., Ingham, T., Platt, U., Pöhler, D., and Heard, D. E.: Iodine monoxide at a clean marine coastal site: observations of high frequency variations and inhomogeneous distributions, Atmos. Chem. Phys., 11, 6721–6733, https://doi.org/10.5194/acp-11-6721-2011, 2011. a
Eckhardt, H. D.: Simple Model of Corner Reflector Phenomena, Appl. Opt., 10, 1559, https://doi.org/10.1364/ao.10.001559, 1971. a
Frieß, U., Sihler, H., Pöhler, D., Yilmaz, S., and Platt, U.: The vertical distribution of BrO and aerosols in the Arctic, J. Geophys. Res., 116, D00R04, https://doi.org/10.1029/2011JD015938, 2011. a
Hausmann, M. and Platt, U.: Spectroscopic measurement of bromine oxide and ozone in the high Arctic during Polar Sunrise Experiment 1992, J. Geophys. Res., 99, 25399, https://doi.org/10.1029/94jd01314, 1994. a
Hebestreit, K.: DOAS Measurements of Tropospheric Bromine Oxide in Mid-Latitudes, Science, 283, 55–57, https://doi.org/10.1126/science.283.5398.55, 1999. a
Holla, R., Schmitt, S., Frieß, U., Pöhler, D., and Platt, U.: Vertical distribution of BrO in the boundary layer at the Dead Sea, Environ. Chem., 12, 438–460, https://doi.org/10.1071/EN14224, 2015. a
Hönninger, G., Leser, H., Sebastián, O., and Platt, U.: Ground-based measurements of halogen oxides at the Hudson Bay by active longpath DOAS and passive MAX-DOAS, Geophys. Res. Lett., 31, L04111, https://doi.org/10.1029/2003GL018982, 2004. a
Horne, S., Smith, D., Besen, M., Partlow, M., Stolyarov, D., Zhu, H., and Holber, W.: A novel high-brightness broadband light-source technology from the VUV to the IR, in: Next-Generation Spectroscopic Technologies III, edited by: Druy, M. A., Brown, C. D., and Crocombe, R. A., SPIE, https://doi.org/10.1117/12.850269, 2010. a
Islam, M., Ciaffoni, L., Hancock, G., and Ritchie, G. A. D.: Demonstration of a novel laser-driven light source for broadband spectroscopy between 170 nm and 2.1 µm, Analyst, 138, 4741, https://doi.org/10.1039/c3an01020a, 2013. a
Kaminow, I. P., Li, T., and Willner, A. E.: Optical Fiber Telecommunications, 6th edn., vol. VIA, Elsevier Science, Oxford, UK, 2013. a, b, c
Keene, W. C., Stutz, J., Pszenny, A. A. P., Maben, J. R., Fischer, E. V., Smith, A. M., von Glasow, R., Pechtl, S., Sive, B. C., and Varner, R. K.: Inorganic chlorine and bromine in coastal New England air during summer, J. Geophys. Res.-Atmos., 112, D10S12, https://doi.org/10.1029/2006jd007689, 2007. a
Kern, C., Trick, S., Rippel, B., and Platt, U.: Applicability of light-emitting diodes as light sources for active differential optical absorption spectroscopy measurements, Appl. Opt., 45, 2077, https://doi.org/10.1364/ao.45.002077, 2006. a, b, c
Kern, C., Sihler, H., Vogel, L., Rivera, C., Herrera, M., and Platt, U.: Halogen oxide measurements at Masaya Volcano, Nicaragua using active long path differential optical absorption spectroscopy, Bull. Volcanol., 71, 659–670, 2009. a, b
Liao, J., Sihler, H., Huey, L. G., Neuman, J. A., Tanner, D. J., Friess, U., Platt, U., Flocke, F. M., Orlando, J. J., Shepson, P. B., Beine, H. J., Weinheimer, A. J., Sjostedt, S. J., Nowak, J. B., Knapp, D. J., Staebler, R. M., Zheng, W., Sander, R., Hall, S. R., and Ullmann, K.: A comparison of Arctic BrO measurements by chemical ionization mass spectrometry and long path-differential optical absorption spectroscopy, J. Geophys. Res., 116, D00R02, https://doi.org/10.1029/2010JD014788, 2011. a
Lu, X., Qin, M., Xie, P., Duan, J., Fang, W., Shen, L., Liu, J., and Liu, W.: Observation of NO3 radicals by LP-DOAS over Hefei, China, in: Light, Energy and the Environment 2015, OSA, https://doi.org/10.1364/pv.2015.jtu5a.29, 2015. a
Malitson, I. H.: Interspecimen Comparison of the Refractive Index of Fused Silica, J. Opt. Soc. Am., 55, 1205, https://doi.org/10.1364/josa.55.001205, 1965. a
Markvart, T.: The thermodynamics of optical étendue, J. Opt. A-Pure Appl. Op., 10, 015008, https://doi.org/10.1088/1464-4258/10/01/015008, 2007. a
Meller, R. and Moortgat, G. K.: Temperature dependence of the absorption cross sections of formaldehyde between 223 and 323 K in the wavelength range 225–375 nm, J. Geophys. Res.-Atmos., 105, 7089–7101, https://doi.org/10.1029/1999jd901074, 2000. a
Merten, A., Tschritter, J., and Platt, U.: Design of differential optical absorption spectroscopy long-path telescopes based on fiber optics, Appl. Opt., 50, 738–754, 2011. a, b, c, d, e
Nasse, J.-M., Frieß, U., Weller, R., Pöhler, D., Schmitt, S., Sihler, H., and Platt, U.: Reactive halogens in the boundary layer of coastal Antarctica – Results from two years of observations at Neumayer III, in preparation, 2019. a
Perner, D., Ehhalt, D. H., Pätz, H. W., Platt, U., Röth, E. P., and Volz, A.: OH – Radicals in the lower troposphere, Geophys. Res. Lett., 3, 466–468, https://doi.org/10.1029/gl003i008p00466, 1976. a
Peters, C., Pechtl, S., Stutz, J., Hebestreit, K., Hönninger, G., Heumann, K. G., Schwarz, A., Winterlik, J., and Platt, U.: Reactive and organic halogen species in three different European coastal environments, Atmos. Chem. Phys., 5, 3357–3375, https://doi.org/10.5194/acp-5-3357-2005, 2005. a
Pikelnaya, O., Hurlock, S. C., Trick, S., and Stutz, J.: Intercomparison of multiaxis and long-path differential optical absorption spectroscopy measurements in the marine boundary layer, J. Geophys. Res.-Atmos., 112, D10S01, https://doi.org/10.1029/2006jd007727, 2007. a
Platt, U. and Perner, D.: Direct measurements of atmospheric CH2O, HNO2, O3, NO2, and SO2 by differential optical absorption in the near UV, J. Geophys. Res.-Oceans, 85, 7453–7458, https://doi.org/10.1029/JC085iC12p07453, 1980. a
Platt, U. and Perner, D.: Measurements of Atmospheric Trace Gases by Long Path Differential UV/Visible Absorption Spectroscopy, in: Optical and Laser Remote Sensing, edited by: Schawlow, A. L., Killinger, D. K., and Mooradian, A., Springer Series in Optical Sciences, Springer, Berlin/Heidelberg, 1983. a
Platt, U. and Stutz, J.: Differential optical absorption spectroscopy, Physics of Earth and Space Environments, Springer, Berlin/Heidelberg, 2008. a, b, c
Platt, U., Perner, D., Harris, G. W., Winer, A. M., and Pitts, J. N.: Observations of nitrous acid in an urban atmosphere by differential optical absorption, Nature, 285, 312–314, https://doi.org/10.1038/285312a0, 1980. a
Platt, U., Perner, D., Schröder, J., Kessler, C., and Toennissen, A.: The diurnal variation of NO3, J. Geophys. Res., 86, 11965, https://doi.org/10.1029/jc086ic12p11965, 1981. a
Platt, U., Heue, K.-P., and Pöhler, D.: Atmospheric and Biological Environmental Monitoring, chap. Two- and Three Dimensional Observation of Trace Gas and Aerosol Distributions by DOAS Techniques, 3–11, Springer, the Netherlands, https://doi.org/10.1007/978-1-4020-9674-7, 2009. a
Pöhler, D., Vogel, L., Frieß, U., Platt, U., and Finlayson-Pitts, B. J.: Observation of halogen species in the Amundsen Gulf, Arctic, by active long-path differential optical absorption spectroscopy, P. Natl. Acad. Sci. USA, 107, 6582–6587, 2010. a
Rityn, N. E.: Optics of corner cube reflectors, Sov. J. Opt. Technol., 34, 198–201, 1967. a
Sihler, H.: Light-Emitting Diodes as Light Sources in Spectroscopic Measurements of Atmospheric Trace Gases, Diploma thesis, Friedrich-Schiller-Universität Jena – Physikalisch-Astronomische Fakultät, 2007. a
Sihler, H., Kern, C., Pöhler, D., and Platt, U.: Applying light-emitting diodes with narrowband emission features in differential spectroscopy, Opt. Lett., 34, 3716–3718, https://doi.org/10.1364/OL.34.003716, 2009. a
Stutz, J. and Platt, U.: Improving long-path differential optical absorption spectroscopy with a quartz-fiber mode mixer, Appl. Opt., 36, 1105–1115, 1997. a, b, c, d, e, f, g
Stutz, J., Alicke, B., Ackermann, R., Geyer, A., Wang, S., White, A. B., Williams, E. J., Spicer, C. W., and Fast, J. D.: Relative humidity dependence of HONO chemistry in urban areas, J. Geophys. Res.-Atmos., 109, D03307, https://doi.org/10.1029/2003jd004135, 2004. a
Stutz, J., Thomas, J. L., Hurlock, S. C., Schneider, M., von Glasow, R., Piot, M., Gorham, K., Burkhart, J. F., Ziemba, L., Dibb, J. E., and Lefer, B. L.: Longpath DOAS observations of surface BrO at Summit, Greenland, Atmos. Chem. Phys., 11, 9899–9910, https://doi.org/10.5194/acp-11-9899-2011, 2011. a
Veitel, H., Kromer, B., Mossner, M., and Platt, U.: New techniques for measurements of atmospheric vertical trace gas profiles using DOAS, Environ. Si. Pollut. Res., 4, 17–26, 2002. a
Volkamer, R., Molina, L. T., Molina, M. J., Shirley, T., and Brune, W. H.: DOAS measurement of glyoxal as an indicator for fast VOC chemistry in urban air, Geophys. Res. Lett., 32, L08806, https://doi.org/10.1029/2005gl022616, 2005. a
Wagner, T., Otten, C., Pfeilsticker, K., Pundt, I., and Platt, U.: DOAS moonlight observation of atmospheric NO3 in the Arctic winter, Geophys. Res. Lett., 27, 3441–3444, https://doi.org/10.1029/1999gl011153, 2000. a
Wang, S., Ackermann, R., and Stutz, J.: Vertical profiles of O3 and NOx chemistry in the polluted nocturnal boundary layer in Phoenix, AZ: I. Field observations by long-path DOAS, Atmos. Chem. Phys., 6, 2671–2693, https://doi.org/10.5194/acp-6-2671-2006, 2006. a
Welford, W. T. and Winston, R.: The optics of nonimaging concentrators: light and solar energy, Academic Press, New York, 1978. a
Zhu, H. and Blackborow, P.: Operation of Laser-Driven Light Sources below 300 nm: Ozone Mitigation, Technical report, Energetiq, 2011a. a
Zhu, H. and Blackborow, P.: LDLS sheds light on analytical-sciences applications, Laser Focus World, 47, 53–53, 2011b. a
- Abstract
- Introduction
- Long-path DOAS
- Light sources and fibre configurations
- Fibre modes
- Overall improvement of LP-DOAS measurement performance
- Conclusions
- Data availability
- Appendix A: Additional information on LP-DOAS instrumental setup
- Appendix B: Details of stray-light investigations
- Appendix C: Description of campaign in the Nördlinger Ries (Germany) and technical details of the measurement routine
- Appendix D: Measurement routine in field campaigns in the Nördlinger Ries (Germany) and Antarctica
- Appendix E: Estimate of detection limits
- Author contributions
- Competing interests
- Acknowledgements
- Financial support
- Review statement
- References