the Creative Commons Attribution 4.0 License.
the Creative Commons Attribution 4.0 License.
 | 02 Aug 2019
Full-azimuthal imaging-DOAS observations of NO2 and O4 during CINDI-2
Enno Peters
Mareike Ostendorf
Tim Bösch
André Seyler
Anja Schönhardt
Stefan F. Schreier
Jeroen Sebastiaan Henzing
Folkard Wittrock
Andreas Richter
Mihalis Vrekoussis
John P. Burrows
A novel imaging-DOAS (differential optical absorption spectroscopy) instrument IMPACT (Imaging MaPper for AtmospheriC observaTions) is presented combining full-azimuthal pointing (360∘) with a large vertical coverage (∼41∘). Complete panoramic scans are acquired at a temporal resolution of ∼15 min, enabling the retrieval of NO2 vertical profiles over the entire panorama around the measurement site.
IMPACT showed excellent agreement (correlation >99 %) with coincident multiaxis DOAS (MAX-DOAS) measurements during the Second Cabauw Intercomparison of Nitrogen Dioxide measuring Instruments (CINDI-2) campaign. The temporal variability of NO2 slant columns within a typical MAX-DOAS vertical scanning sequence could be resolved and was as large as 20 % in a case study under good viewing conditions. The variation of corresponding profiles and surface concentrations was even larger (40 %). This variability is missed when retrieving trace gas profiles based on standard MAX-DOAS measurements.
The azimuthal distribution of NO2 around the measurement site showed inhomogeneities (relative differences) up to 120 % (on average 35 %) on short timescales (individual panoramic scans). This is more than expected for the semirural location. We explain this behavior by the transport of pollution. Exploiting the instrument's advantages, the plume's trajectory during a prominent transport event could be reconstructed.
Finally, the potential for retrieving information about the aerosol phase function from O4 slant columns along multiple almucantar scans of IMPACT is demonstrated, with promising results for future studies.


Nitrogen dioxide (NO2) is a prominent pollutant in the atmosphere and harmful for human health, causing damage to the respiratory system (Kampa and Castanas, 2008). It originates primarily from NO that is produced in the equilibrium between N2 and O2 at high temperatures in combustion processes. The emitted NO reacts with ozone (O3) to form NO2. The sum of NO and NO2 is called NOx.
The UV photolysis of NO2 produces NO and O atoms, which react with O2 in air to form O3. Under certain conditions for NOx and O3 in the troposphere, the Leighton photostationary state is achieved:
where J(NO2) is the photolysis frequency for NO2 in an air mass and k(NO+O3) is the rate coefficient for the reaction of NO with O3. Deviation from the Leighton photostationary state occurs when significant amounts of NO2 are produced by reaction of hydroperoxyl radicals (HO2), or organic peroxy radicals (RO2), with NO (e.g., Shetter et al., 1983). The photolysis of this NO2 then results in the O3 formation, as found in photochemical smog. Thus, NOx plays a key role in the formation of tropospheric ozone.
Emission sources of NOx are both anthropogenic and biogenic and comprise, for example, the combustion of fossil fuels for domestic heating and cooking, power generation, traffic, and savanna and forest fires. NOx is also released from lightning events and soil microbial processes (Lee et al., 1997).
Overall, the lifetime of NO2 in the atmosphere is typically of the order of several hours due to photolysis or removal by OH, which leads to the formation of HNO3 and thus contributes to acidification of precipitation, soil and water. NO2 shows characteristic absorption bands in the UV and visible wavelength range, facilitating quantification by differential optical absorption spectroscopy (DOAS) measurements.
DOAS is a well-established remote sensing technique used for atmospheric trace gas observations, which arguably reaches back to Dobson and Harrison (1926), who detected stratospheric ozone using UV measurements at distinct wavelengths. Later, Brewer et al. (1973) and Noxon (1975) used zenith-sky pointing measurements of scattered sunlight to retrieve stratospheric NO2 abundances. Perner et al. (1976) and Platt et al. (1979), who first used the term DOAS, applied active DOAS for measurements of further trace gases in the troposphere using artificial light sources. The passive DOAS technique was continuously improved to so-called off-axis (1-D) and 2-D pointing instruments (Hönninger et al., 2004, provide a brief historic overview about passive DOAS systems), and recently even 3-D multiaxis DOAS (MAX-DOAS) analysis techniques have been reported (Ortega et al., 2015; Seyler et al., 2018). In addition to static platforms, passive DOAS was also adopted to movable platforms, e.g., cars, ships, airplanes (e.g., Sinreich et al., 2010; Shaiganfar et al., 2011; Peters et al., 2012) and satellites (e.g., Burrows et al., 1999; Richter et al., 2005; Lelieveld et al., 2015).
In this study, the DOAS method has been combined with imaging capabilities. Push-broom imaging-DOAS instruments consisting of a spectrometer equipped with a 2-D CCD (charge-coupled device) or CMOS (complementary metal oxide semiconductor) camera are often used for aircraft applications (Heue et al., 2008; Popp et al., 2012; Schönhardt et al., 2015). The spectrometer's slit and thus the spatial axis of the spectrometer–CCD system is aligned perpendicular to the flight direction while pixel size along track is determined by the integration time and aircraft speed. Imaging-DOAS instruments have been also used in ground-based applications. Lohberger et al. (2004) observed the NO2 plume emitted from a power plant stack by using an imaging spectrometer mapping different elevation angles on the vertical (spatial) axis of the CCD and a motorized mirror system for scanning in the azimuthal direction. The same instrumental setup was used by Bobrowski et al. (2006) to observe the SO2 emission from a volcano. A scanning mirror system was also used by Lee et al. (2009) to analyze the spatial and temporal variation of NO2 during 2 d in the urban environment of Beijing.
Another imaging-DOAS concept was recently described by Manago et al. (2018) consisting of a combination of horizontal slit, transmission grating and hyperspectral camera acting effectively as a line scanner to produce a 13∘ × 9∘ image with spectral information. A total of 87 hyperspectral images were combined during an acquisition time of ≈1 h to a full-azimuthal panoramic view in order to study the two-dimensional NO2 distribution around the measurement site.
In summary, all previously reported imaging-DOAS observations have in common that a very small angular resolution was applied resulting in a rather limited total field of view (FOV) for the entire image (e.g., 13∘ × 36∘). While this approach is valuable for example for the observation of the trace gas emitted from a power plant or volcano, the observed scene is limited in its spatial scale. In contrast, the aim of the instrument concept presented in our study is to provide full-azimuthal coverage (360∘) around the measurement site with, at the same time, a large vertical coverage (∼41∘). Aiming at high robustness and flexibility (predominantly for separating outdoor and indoor parts), no scanning mirror system but a telescope with a sorted quartz fiber bundle pointing in several elevations at the same time and a pan–tilt head for scanning in the azimuthal direction are used. This setup enables profile retrievals of the entire hemisphere around the instrument at sufficiently high temporal resolution and also enables studying the full two-dimensional distribution and variability. The short acquisition time (∼15 min) of a full-panoramic image ensures constant atmospheric conditions and thus minimizes the impact of temporal changes of trace gas distributions during the observation.
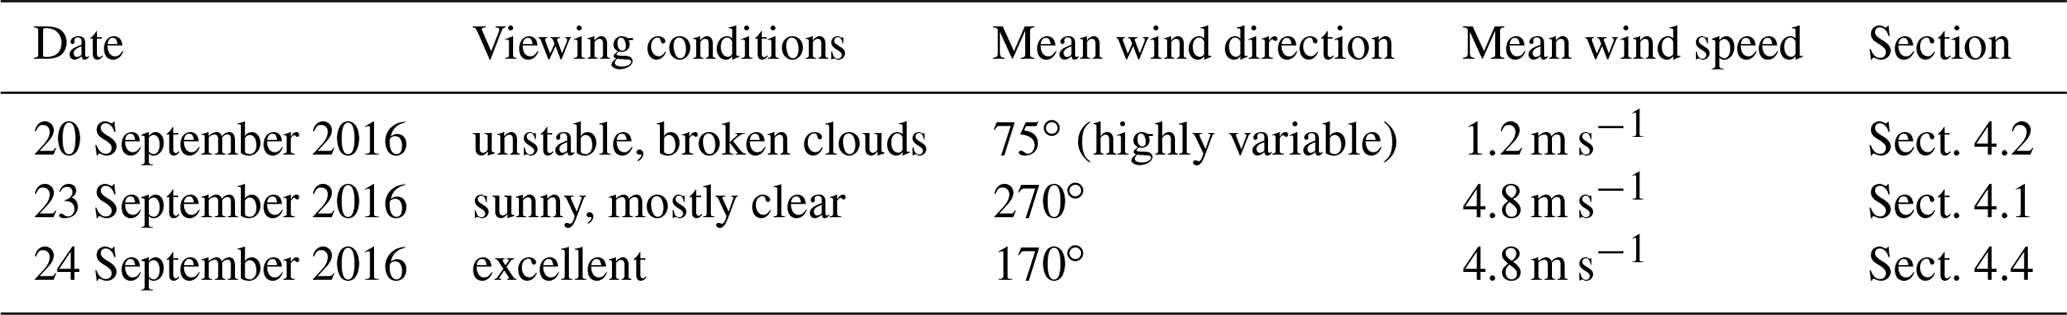
Table 1Meteorological conditions during the example days focused on in the respective sections.
The imaging-DOAS instrument IMPACT (novel Imaging MaPper for AtmospheriC observaTions) took part in the Second Cabauw Intercomparison of Nitrogen Dioxide measuring Instruments (CINDI-2) campaign in summer 2016, where it participated in the semiblind intercomparison of NO2. Results of the intercomparison are not a primary focus of this study and are presented in detail in Kreher et al. (2019).
The main objective of the present study is to assess the added value of full-panoramic imaging-DOAS measurements as compared to MAX-DOAS. In particular, the change in NO2 profiles and surface concentrations during a typical MAX-DOAS vertical scanning sequence could be resolved. Furthermore, assessment of the azimuthal distribution of NO2 is a prerequisite for satellite validation, as a point measurement (in situ) or measurements in one azimuth direction only is not representative for the entire measurement's surrounding (satellite pixel) if the azimuthal distribution is inhomogeneous. In the current study, large inhomogeneities occurred on short timescales and were caused by transport events rather than persistent inhomogeneities (e.g., due to local sources). Due to the full-panoramic coverage, an exemplary transport event could be observed by investigating the temporal evolution of NO2 profiles. The plume's trajectory could be reconstructed and its most likely emission source was identified. In addition, information with respect to the aerosol phase function was derived from the retrieved azimuthal distribution of the O2 collision complex O4, which was retrieved during the DOAS fitting process in the selected spectral window used for NO2. We note that IMPACT measures simultaneously multiple almucantars1.
The paper is structured as follows: Sect. 2 briefly describes the performed DOAS measurements, instruments and the CINDI-2 campaign. Calibration activities and the FOV definition of IMPACT are explained in detail in Sect. 3. Results from different studies on IMPACT measurements (for which different days during CINDI-2 have been selected) are then presented in Sect. 4. An overview over meteorological conditions during these example days is given in Table 1. A comparison with MAX-DOAS data focusing on 1 d of reasonable viewing conditions is presented in Sect. 4.1. The spatial and temporal NO2 variation observed during CINDI-2 is discussed in Sect. 4.2, including a detailed analysis of an observed transport event. NO2 profiles based on the full-panoramic measurement strategy are retrieved in Sect. 4.3. Finally, Sect. 4.4 discusses the potential of retrieving aerosol phase function information from IMPACT's observations at an example day having excellent viewing conditions. The study closes with a summary and conclusion.
2.1 DOAS technique
The passive DOAS technique uses measurements of scattered sunlight and the Lambert–Beer law to yield trace gas amounts and distributions in the atmosphere. While scattering causes smooth changes in the spectrum (e.g., λ−4 dependence for Rayleigh scattering), molecular absorption often has structured spectra. The total spectral attenuation is therefore split into a high-frequency part comprising the trace gas absorptions and a low-frequency part accounting for elastic scattering on molecules, aerosols, and clouds, as well as instrumental throughput. The latter part is described by a low-order polynomial. The effect of inelastic scattering known as the Ring effect (Shefov, 1959; Grainger and Ring, 1962), which is predominantly due to rotational Raman scattering leading to a filling in of Fraunhofer lines, is accounted for by a pseudo-cross-section σRing (e.g., Vountas et al., 1998). Similar spectral effects are caused by stray light inside the spectrometer when photons hit the detector at positions not corresponding to their wavelength. This is compensated for by applying another pseudo-cross-section σoff, for which often the inverse of the measured spectrum I is used. Further details about this so-called intensity offset correction and its similarity to spectral features produced by inelastic scattering can be found in Peters et al. (2014). Lambert–Beer's law can then be expressed by the DOAS equation:
where τ is the optical depth and the first sum is over all absorbers i having cross sections σi. The polynomial degree is p, and the residual term r contains the remaining (uncompensated for) optical depth, for example from measurement noise.
As measurements consist of spectra I and I0, Eq. (2) is defined at many wavelengths and solved in a linear least-squares fit returning the fit factors SCi and ap. While the polynomial coefficients ap are usually not used for further analysis, the so-called slant columns SC are the integrated concentration ρi of absorber i along the light path s.
Recorded spectra contain almost no information about the altitude in which the absorption occurred. Thus, the sensitivity to different altitudes depends predominantly on measurement geometry. The measurement is more sensitive to tropospheric absorbers if the spectrum I is taken at small elevation angles above the horizon. This is due to the rather long light path through atmospheric layers close to the surface. On the other hand, the reference spectrum I0 is usually a zenith spectrum either measured at a small solar zenith angle (SZA) or taken close in time to the measured spectrum I (sequential), as for the zenith viewing geometry the light path through the atmosphere is short. The obtained SCi are therefore not absolute but the difference between measurement (I) and reference measurement (I0) and thus called differential slant column density (DSCD). As only DSCDs are used within this study, both terms are used synonymously in the following for simplicity. Furthermore, sequential reference fits are used throughout this study.
More details of the DOAS method can be found for example in Hönninger et al. (2004) and Platt and Stutz (2008).
2.2 IMPACT
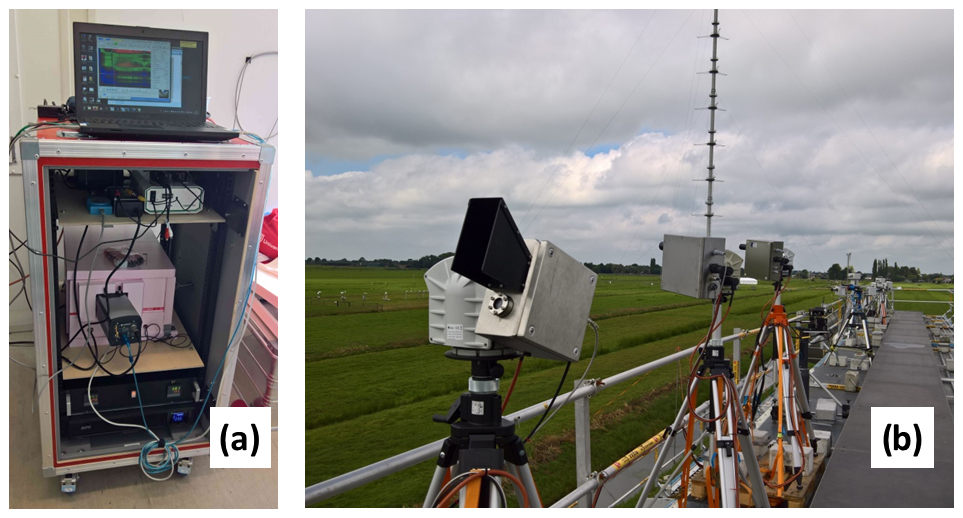
Figure 1The IMPACT instrument installed during CINDI-2. (a) Indoor parts integrated into a 19′′ rack. (b) Telescope unit on top of the container deck (foreground). Next to IMPACT is the IUP-Bremen 2-D MAX-DOAS instrument (background) used for comparison in Sect. 4.1.
The IMPACT instrument, as deployed during the CINDI-2 field campaign (Sect. 2.4), is shown in Fig. 1. It consists of a Czerny–Turner-type ANDOR Shamrock 303i imaging spectrometer equipped with a Newton DU940P-BU CCD camera with 2048 pixels×512 pixels covering a wavelength range from 394.5 to 536.4 nm. The CCD is cooled to −30 ∘C for reducing the dark signal (thermal electrons), while the spectrometer is actively temperature stabilized to +35 ∘C in order to avoid thermal (and therefore spectral) drifts. The spectrometer–CCD system is installed within a 19′′ rack that hosts at the same time all electronics and computers for instrumental control and operation. A 15 m long light fiber bundle consisting of 69 individual fibers (0.01 mm2 each) separates the indoor part (rack) from the telescope unit located outside. At both sides, the individual fibers are aligned vertically, i.e., stacked on top of each other (total height ∼9 mm), and sorted in a way that the uppermost fiber on the entrance side is also the uppermost fiber on the spectrometer side. However, as a result of the size of the CCD and the magnification characteristics of the spectrometer, light from the upper- and lowermost fibers does not hit the detector (these fibers are imaged outside the detector area), so that only 50 individual fibers fully mapped on the CCD are used. This is a nonoptimal setup as these fibers do not contribute to the used signal but enhance stray light inside the spectrometer. Although stray-light effects are compensated for by the intensity offset correction in the later DOAS fit (see Sect. 2.1), light from these noncontributing fibers should be blocked in future applications to reduce potential problems with stray light.
In the telescope unit, light is collected and focused on the light fiber bundle with a commercial objective (1:1.4, focal length 8 mm). The instantaneous FOV of an individual fiber is determined by its dimension (active area) and the focal length of the objective and is about 0.8∘, both in the horizontal (azimuth) as well as in the vertical (elevation) direction. As the single fibers are stacked in the vertical dimension, the resulting hypothetical vertical FOV of the entire fiber bundle is ∼58∘, i.e., all 69 stacked single fibers. The part of the measurements used for the analysis yields a vertical FOV of ∼41∘ (50 individual fibers mapped on the CCD). The use of an objective instead of a single lens is necessary for overcoming spherical aberration and thus keeping the FOV constant for each individual fiber as the entrance slit has a considerable height (9 mm). This is different to the usual MAX-DOAS instruments where the light is focused on a very small spot-sized fiber entrance located on the optical axis, and therefore using a single lens is usually sufficient.
The vertical alignment of the sorted light fibers in combination with an imaging spectrometer – each fiber is mapped onto different CCD lines – allows taking measurements in multiple elevation angles simultaneously (see Sect. 3 for the calibration procedure of the elevation angle). Furthermore, the telescope hosts a visual camera taking snapshots for scene documentation with each measurement. The telescope unit is installed on an ENEO VPT-501 pan–tilt head, which allows pointing in any direction. However, as a result of the sufficiently large instantaneous vertical FOV, movements are performed in azimuthal direction only while the vertical tilt is kept constant (covering the elevation angles from −5 to +36∘) with the exception of zenith pointing for taking reference measurements.
Figure 2 shows an example image of the CCD for a typical off-axis measurement. The image quality (separation of single fibers) is best in the center of the CCD and blurred towards the edges. This is because the horizontal (spectrometric axis) and vertical (spatial axis) foci do not coincide everywhere in the focal plane (coincidence is optimized for the center of the CCD). The CCD can be placed in different positions, resulting either in good imaging or good spectrometric quality. Here, an intermediate flange was used placing the CCD in a position that is a compromise between imaging and spectroscopic performance. As a result, the slit function changes vertically across the detector from ≈1 nm FWHM (full width at half maximum) in the center of the CCD to ≈1.5 nm FWHM towards bottom and top rows. This was compensated for in the DOAS analysis by measuring and applying separate slit functions for different vertical binning ranges on the CCD associated with individual light fibers as defined in Sect. 3.
Ideally, an imaging instrument should be operated with a shutter or a frame transfer CCD in order to minimize the impact of illumination of the detector during readout. As the Newton DU940P-BU is not a frame transfer CCD and long-term operation of a shutter is limited by shutter lifetime, IMPACT measurements are taken without a shutter. As a result, the detector continues to be illuminated during the sequential CCD readout, leading to larger signals in those rows which are read out later. As the vertical position on the CCD corresponds to different elevation angles, this leads to a smearing of the CCD image and the corresponding viewing directions.
If illumination is assumed to be constant during measurements, a simple correction can be applied to the measured data. Starting from the very first line for which there is no smear effect, the original signal can be computed for each line successively by subtracting the additional illumination occurring during readout:
where Ij is the signal of row j without smear, is the intensity with smear, and treadout and texposure are the length of the duration of the readout of one line and the exposure time, respectively. While this correction works well in most cases, it can fail in situations where illumination changes rapidly, for example during measurements with broken clouds and high wind speeds.
Problems regarding the smear effect generally decrease with the ratio of exposure time to readout time because the relative contribution of illumination during readout then decreases. In other words, Ij approaches for (see Eq. 3). To take advantage of this, an optical filter blocking parts of the sunlight was installed in the telescope unit. This allowed the increase of exposure times (typical IMPACT exposure times were then in the order of a few seconds) while avoiding saturation of the CCD. For every applied exposure time, dark images were recorded routinely and used to correct for dark current in the measurements prior to the DOAS analysis.
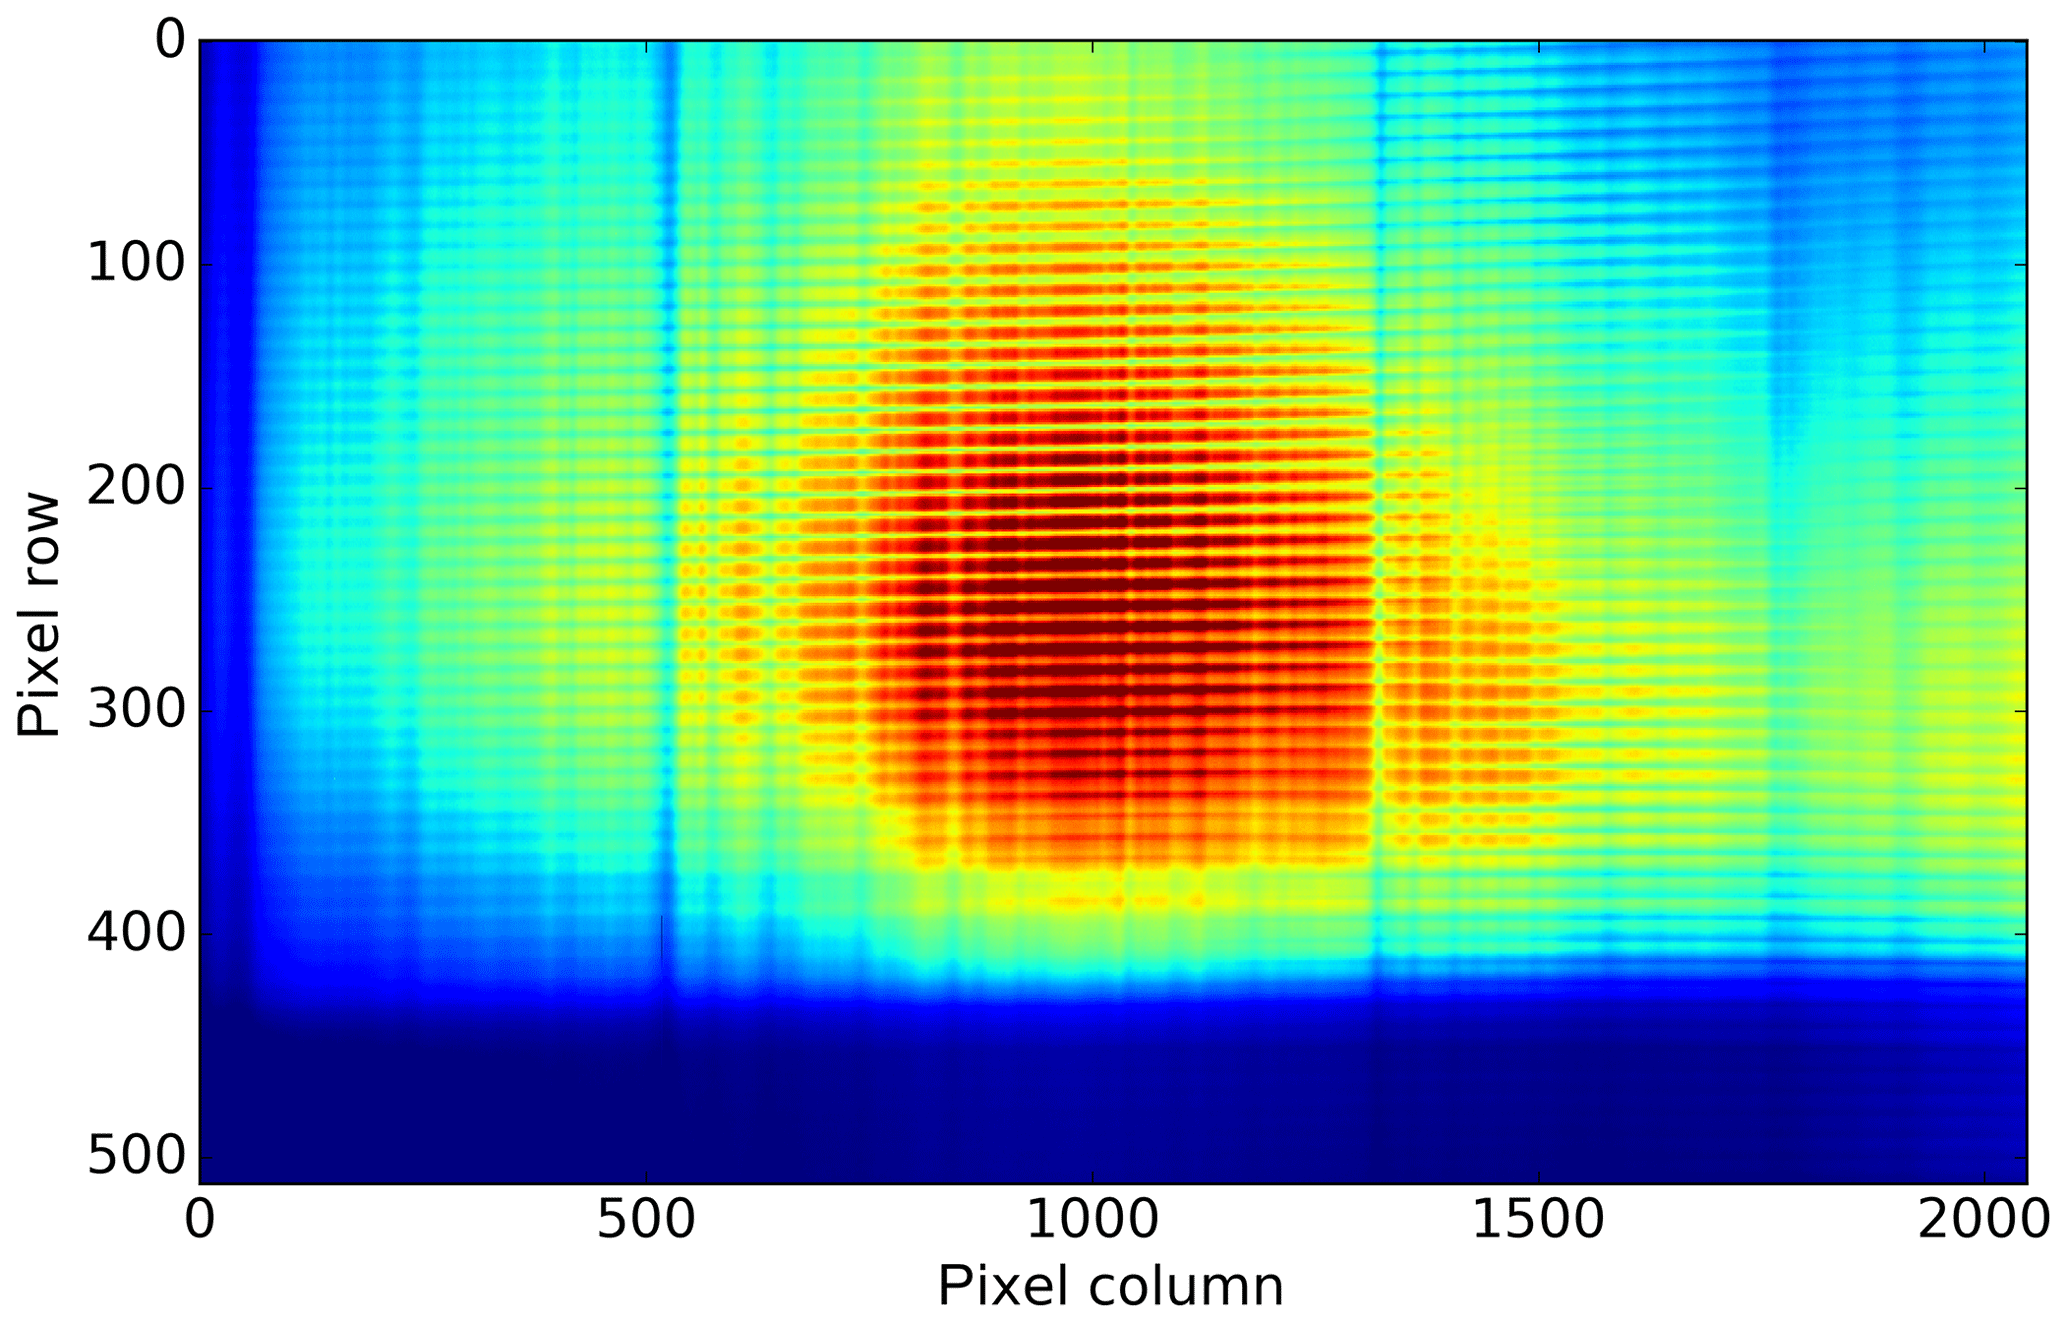
Figure 2Typical CCD image as recorded during CINDI-2. The x axis is the spectral direction while the y axis represents the viewing elevation. The illumination is color-coded (blue represents small illumination and red represents large illumination). The x axis covers 394.5–536.4 nm, i.e., for the DOAS fit of 425–490 nm only the inner part is used. On the y axis, single fibers observing different elevation angles are separated and distinguishable. Fraunhofer lines are visible in each fiber at the same spectral position. The horizon causes a sharp transition between illuminated and nonilluminated fibers in the lower part of the image.
2.3 MAX-DOAS instrument (IMPACT validation)
Serdyuchenko et al. (2014)Vandaele et al. (1996)Thalman and Volkamer (2013)Rothman et al. (2010)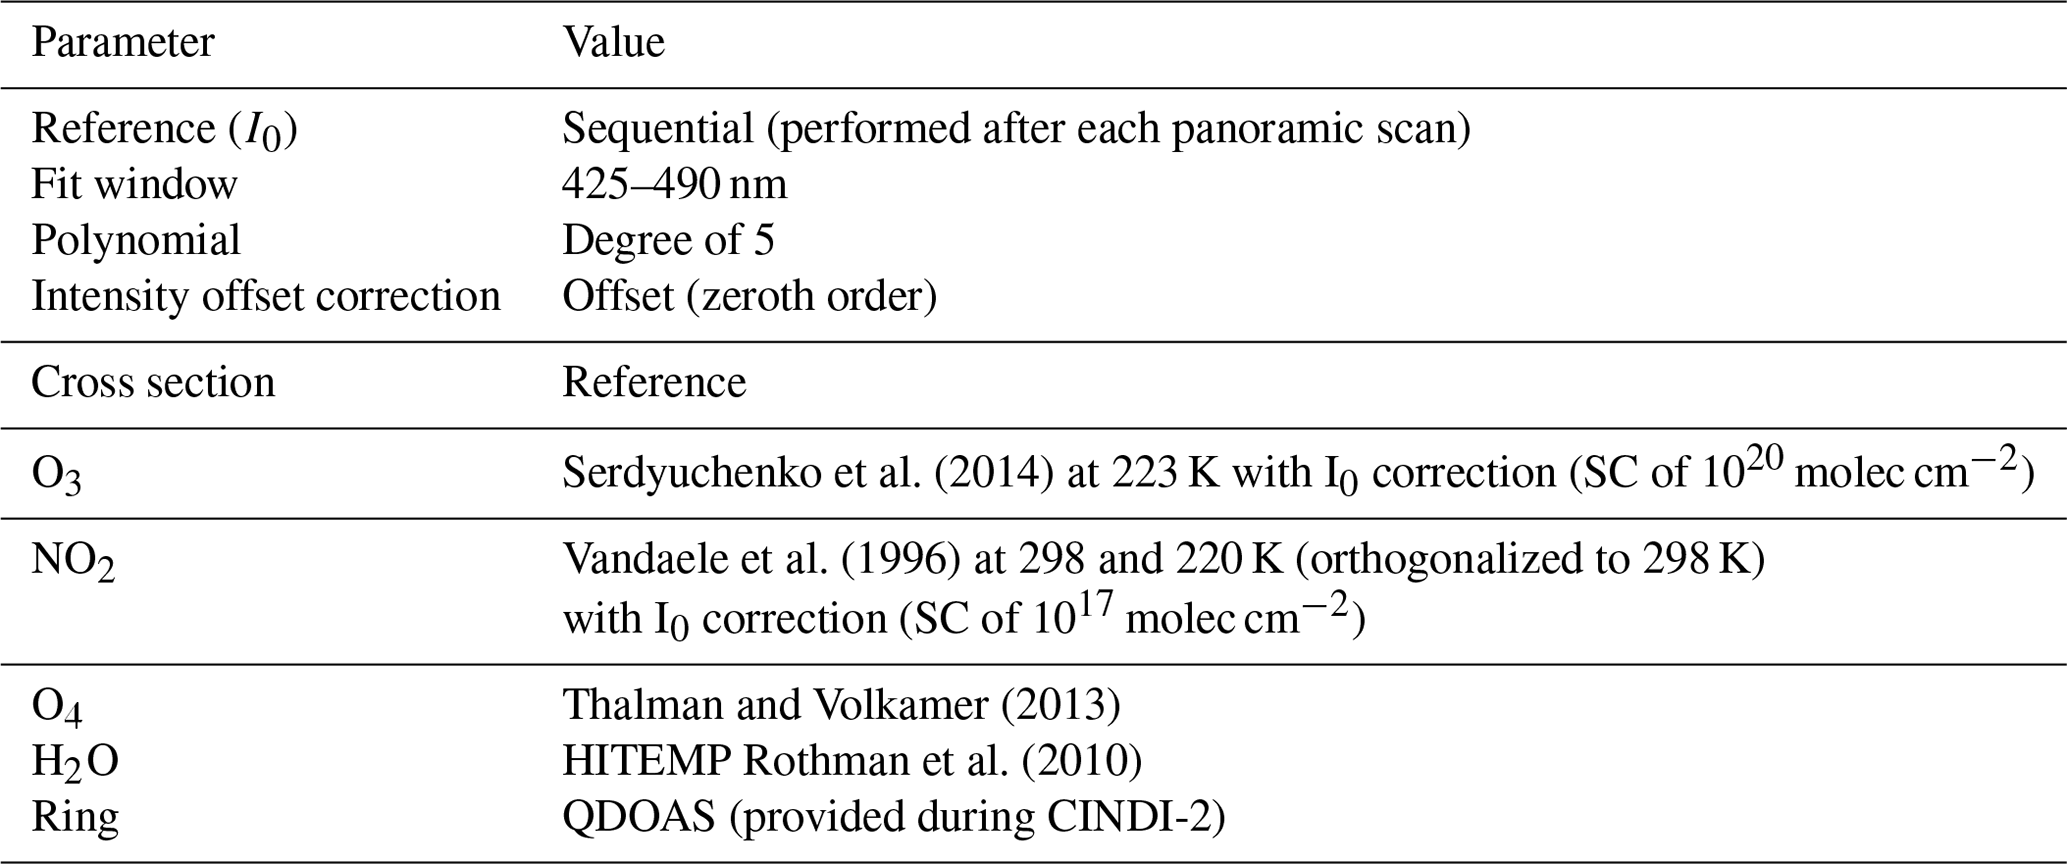
Data of the IUP-Bremen MAX-DOAS instrument is used to validate corresponding IMPACT measurements (see Sect. 4.1). Both instruments were set up side by side (∼2 m distance; see Fig. 1). The MAX-DOAS instrument consists of a telescope unit (located outdoors) and two CCD–spectrometer systems (located indoors) measuring in the UV and visible. For validation of IMPACT observations (measuring in the visible), only data collected by the visible spectrometer are used, which is an ACTON-500 covering a spectral range from 406 to 579 nm at a resolution of ≈0.85 nm. The spectrometer was actively temperature stabilized to +35 ∘C. A Princeton NTE/CCD 1340/100-EMB with 1340 pixels×100 pixels was used for recording spectra leading to a spectral sampling of 7–8 pixels nm−1. The CCD was cooled to −30 ∘C to reduce dark signal.
Light was collected by a telescope unit mounted (similar to IMPACT) on a commercial ENEO VPT-501 pan–tilt head allowing pointing in any viewing direction. The instrument's FOV (≈1.1∘) was determined by a lens focusing incoming light on an optical fiber bundle (length ≈20 m), which was Y-shaped and connected the telescope with both spectrometers. It consists of single fibers. An in-telescope shutter and HgCd line lamp allow dark and wavelength-calibration measurements, which were routinely performed. A very similar instrumental set up has been used in previous campaigns, e.g., CINDI and TransBrom (Roscoe et al., 2010; Peters et al., 2012).
2.4 The CINDI-2 field campaign
The Second Cabauw Intercomparison of Nitrogen Dioxide measuring Instruments (CINDI-2) field campaign was carried out at the Cabauw Experimental Site for Atmospheric Research (CESAR), close to the villages of Cabauw and Lopik, the Netherlands, from 25 August to 7 October 2016. It was a successor of the first CINDI campaign in 2009 (Roscoe et al., 2010; Piters et al., 2012). CINDI-2 aimed at characterizing the differences between measurement approaches and systems and to progress towards harmonization of settings and methods (Hendrick et al., 2016). One key activity was a semiblind intercomparison (Kreher et al., 2019) of participating DOAS-type instruments from different international research groups. This intensive phase was scheduled for the time period 12–25 September 2016.
The measurement test site is located in a semirural environment, i.e., without strong local sources (except for a regional traffic road in the south potentially causing enhanced NOx levels during rush hour) but within the polluted region between Amsterdam, Rotterdam, and Utrecht.
In total, 23 groups and 31 DOAS-type instruments participated in CINDI-2. The instruments were mainly deployed at two container decks. At the lower level, 1-D MAX-DOAS instruments were pointing permanently in a common azimuth direction of 287∘ (clockwise from north) and performed vertical scanning sequences in this azimuth. Two-dimensional MAX-DOAS systems installed at the upper container deck (see Fig. 1) providing a free view around the measurement site were following a rather complex measurement protocol prescribing the observation geometry on a 1 min time base. However, for comparison with 1-D instruments, a vertical scanning sequence was performed in the common azimuthal direction every hour.
The IMPACT instrument fulfilled two purposes during CINDI-2:
-
To participate in the semiblind intercomparison. For this reason, measurements were performed in the common azimuth direction of 287∘ every hour for 15 min, together with the 1-D and 2-D instruments.
-
To study the added value of full-panoramic imaging measurements at high repetition rate, in particular for estimating the spatial distribution and its temporal variability around the measurement site. Therefore, between hourly intercomparison measurements, full-azimuthal scans in 10∘ steps were taken. For each azimuth direction, a complete set of elevation angles was observed simultaneously due to the imaging capability of the system. As a result, a full-panoramic view was recorded every 15 min (in the azimuth: 36 consecutively performed measurements between −175 and 175∘ in 10∘ steps with an azimuthal FOV of ≈0.8∘ for each measurement; in the vertical: 50 simultaneous measurements of ≈0.8∘ vertical FOV each, covering in total to 36∘ elevation angle due to the vertical alignment of the single fibers as explained in Sect. 2.2). After each azimuthal scan, zenith reference spectra were recorded for every simultaneous measurement (elevation) to ensure that in the later DOAS analysis every region of the CCD (corresponding to different single fibers and thus different elevations, as explained in Sect. 3) can be evaluated with a corresponding zenith reference measurement (which is important to eliminate biases caused by instrumental effects).
In addition to the observation geometry, DOAS fit settings were also prescribed for the CINDI-2 semiblind intercomparison (Table 2). These fit parameters have been used as well for the analysis of NO2 and O4 distributions within this study.
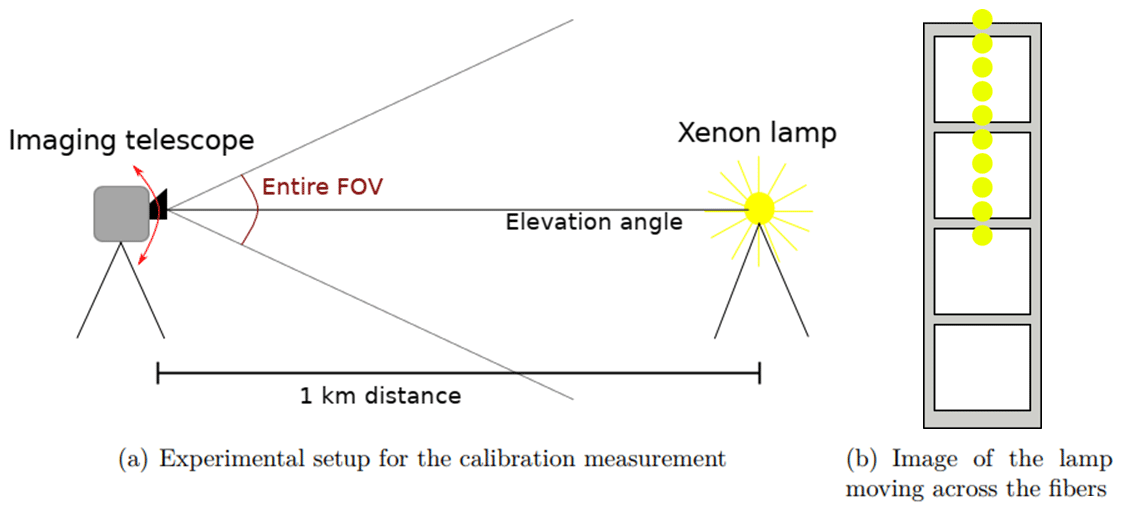
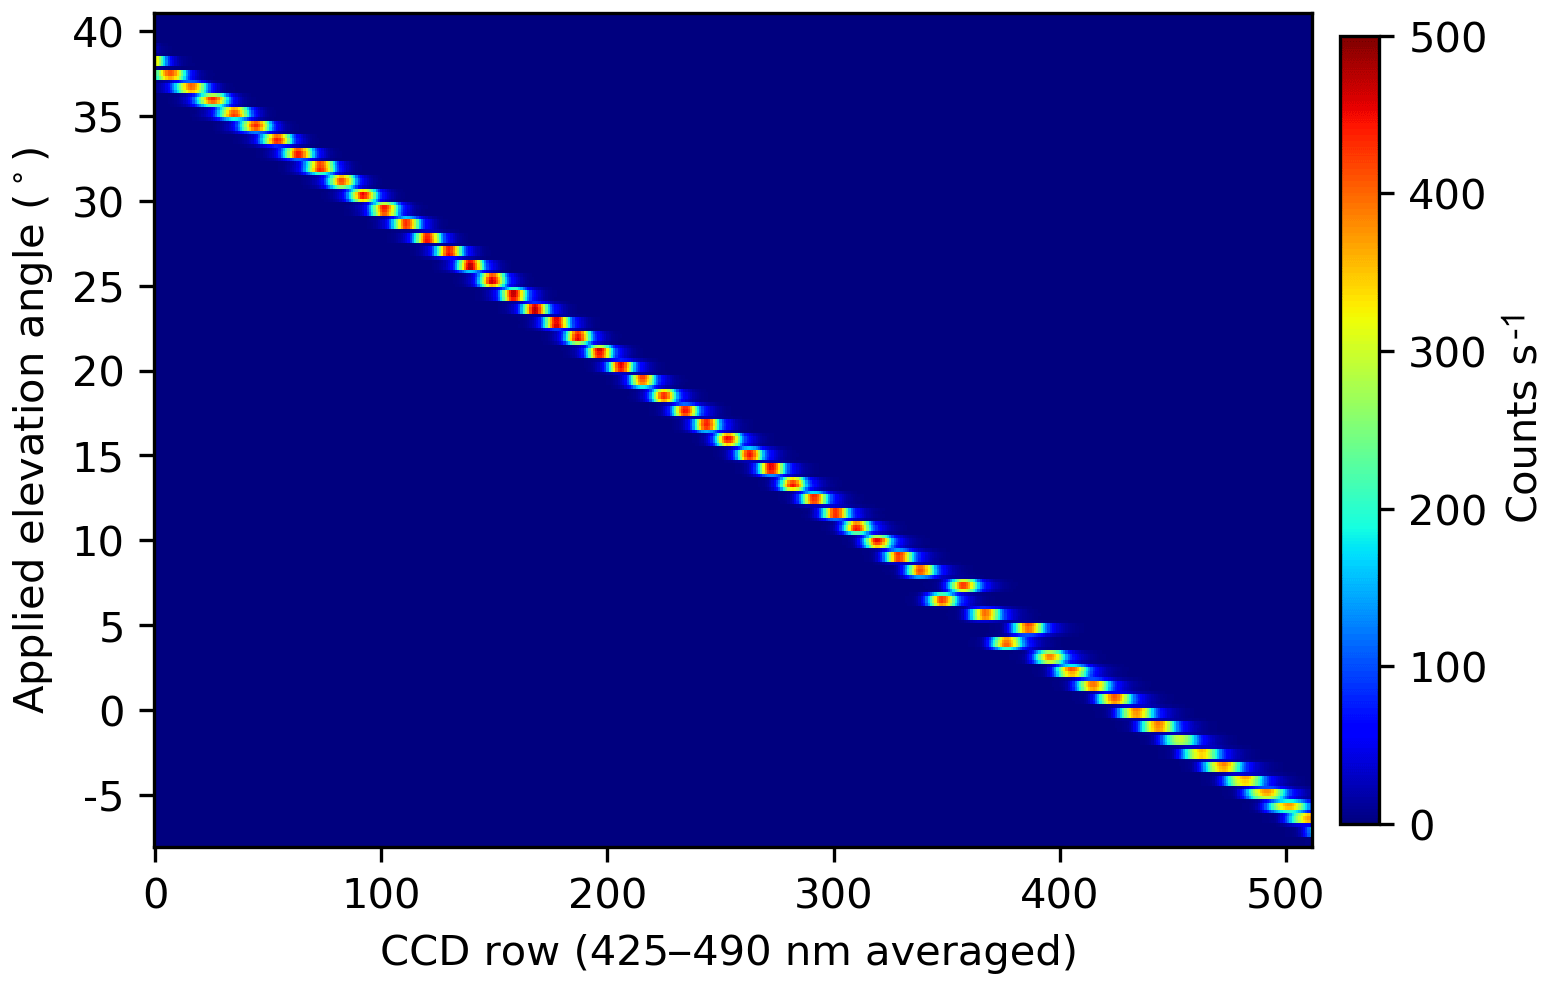
Figure 4Elevation angle calibration matrix: the intensity in the fitting range is displayed as function of the CCD row (x axis) and telescope elevation angle (y axis).
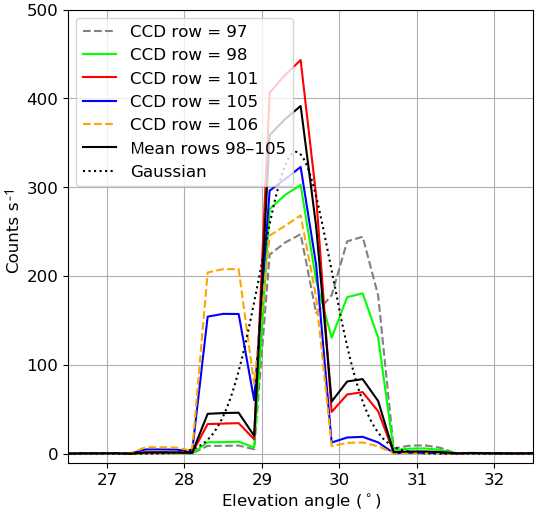
Figure 5Cross sections through the calibration matrix. The defined binning range comprises rows 98–105 which all show a clear maximum in the same fiber, most pronounced in row 101. CCD rows 97 and 106 are rejected as their intensity distribution cannot be clearly assigned to one fiber. The mean of the binning range is plotted in black together with the corresponding Gaussian curve (same standard deviation) in order to estimate the effective FOV.
The calibration of the elevation angles in which IMPACT is taking measurements simultaneously was performed on-site during CINDI-2 as part of a pointing calibration exercise that was organized by the Max Planck Institute for Chemistry (MPIC), Mainz, which operated a Xenon lamp positioned in a distance of ≈1 km from the measurement site. Details about the exercise can be found in Donner et al. (2019).
Figure 3 shows a sketch of the experimental setup. IMPACT's telescope was moved in elevation steps of 0.2∘ vertically across the Xenon lamp. It is important to note that changing the elevation angle moves the image of the lamp across the fiber entrances in the telescope while the imaging of individual fibers on the CCD is independent of the telescope elevation. For each measurement, only one individual fiber was illuminated, meaning that the spot of the Xenon lamp at the light fiber entrance was smaller than the diameter of a single fiber (Fig. 3b). Furthermore, each fiber was illuminated for approximately four steps before the signal was switching into the neighboring fiber in the following measurement. This indicates an instantaneous FOV of ≈0.8∘ for single fibers (in agreement with Sect. 2.2).
In Fig. 4, the intensity of each CCD row (averaged in the spectral fitting region between 425 and 490 nm) is shown as a function of telescope elevation angle. As can be seen from this calibration matrix, the (vertical) extent of a single fiber mapped onto the CCD is typically ≈19 CCD rows (x axis in Fig. 4), with the tendency of smaller extents in the center and larger extents towards the edges. This is caused by better imaging quality in the center of the CCD as mentioned before. However, the spacing between intensity maxima is only ≈9 CCD rows, meaning that images of different individual fibers overlap each other (due to the limited imaging quality of the spectrometer). The overlapping is larger towards the edges and smaller in the center.
The pointing calibration procedure consists of three steps:
-
CCD rows corresponding to the same fiber were identified and binned. For this, each vertical cross section of the calibration matrix (i.e., each CCD row) was analyzed as shown in Fig. 5. CCD rows having a distinct maximum in the same fiber were binned while CCD rows having no clear maximum were rejected (as a criterion for a distinct maximum, a ratio of at least 1.5 between the intensity in different fibers was used). However, the assignment between CCD row and elevation angle is still not unique due to the overlapping of fiber images on the CCD. This results in an effective FOV which is larger than 0.8∘ (see below).
-
An intensity-weighted elevation angle is calculated for each CCD row:
where i is varied over all applied elevation angles.
-
The weighted elevations are then averaged according to the binning intervals.
In this way, 50 binning ranges and corresponding elevation angles were defined in which measurements are performed simultaneously.
The effective FOV (per binning range) was estimated by the FWHM of Gaussians having the same standard deviation as the weighted elevation angles (calculated in step 2) within the respective binning range. For the example shown in Fig. 5, an effective elevation of 29.4∘ and a FOV of 1.1∘ is obtained.
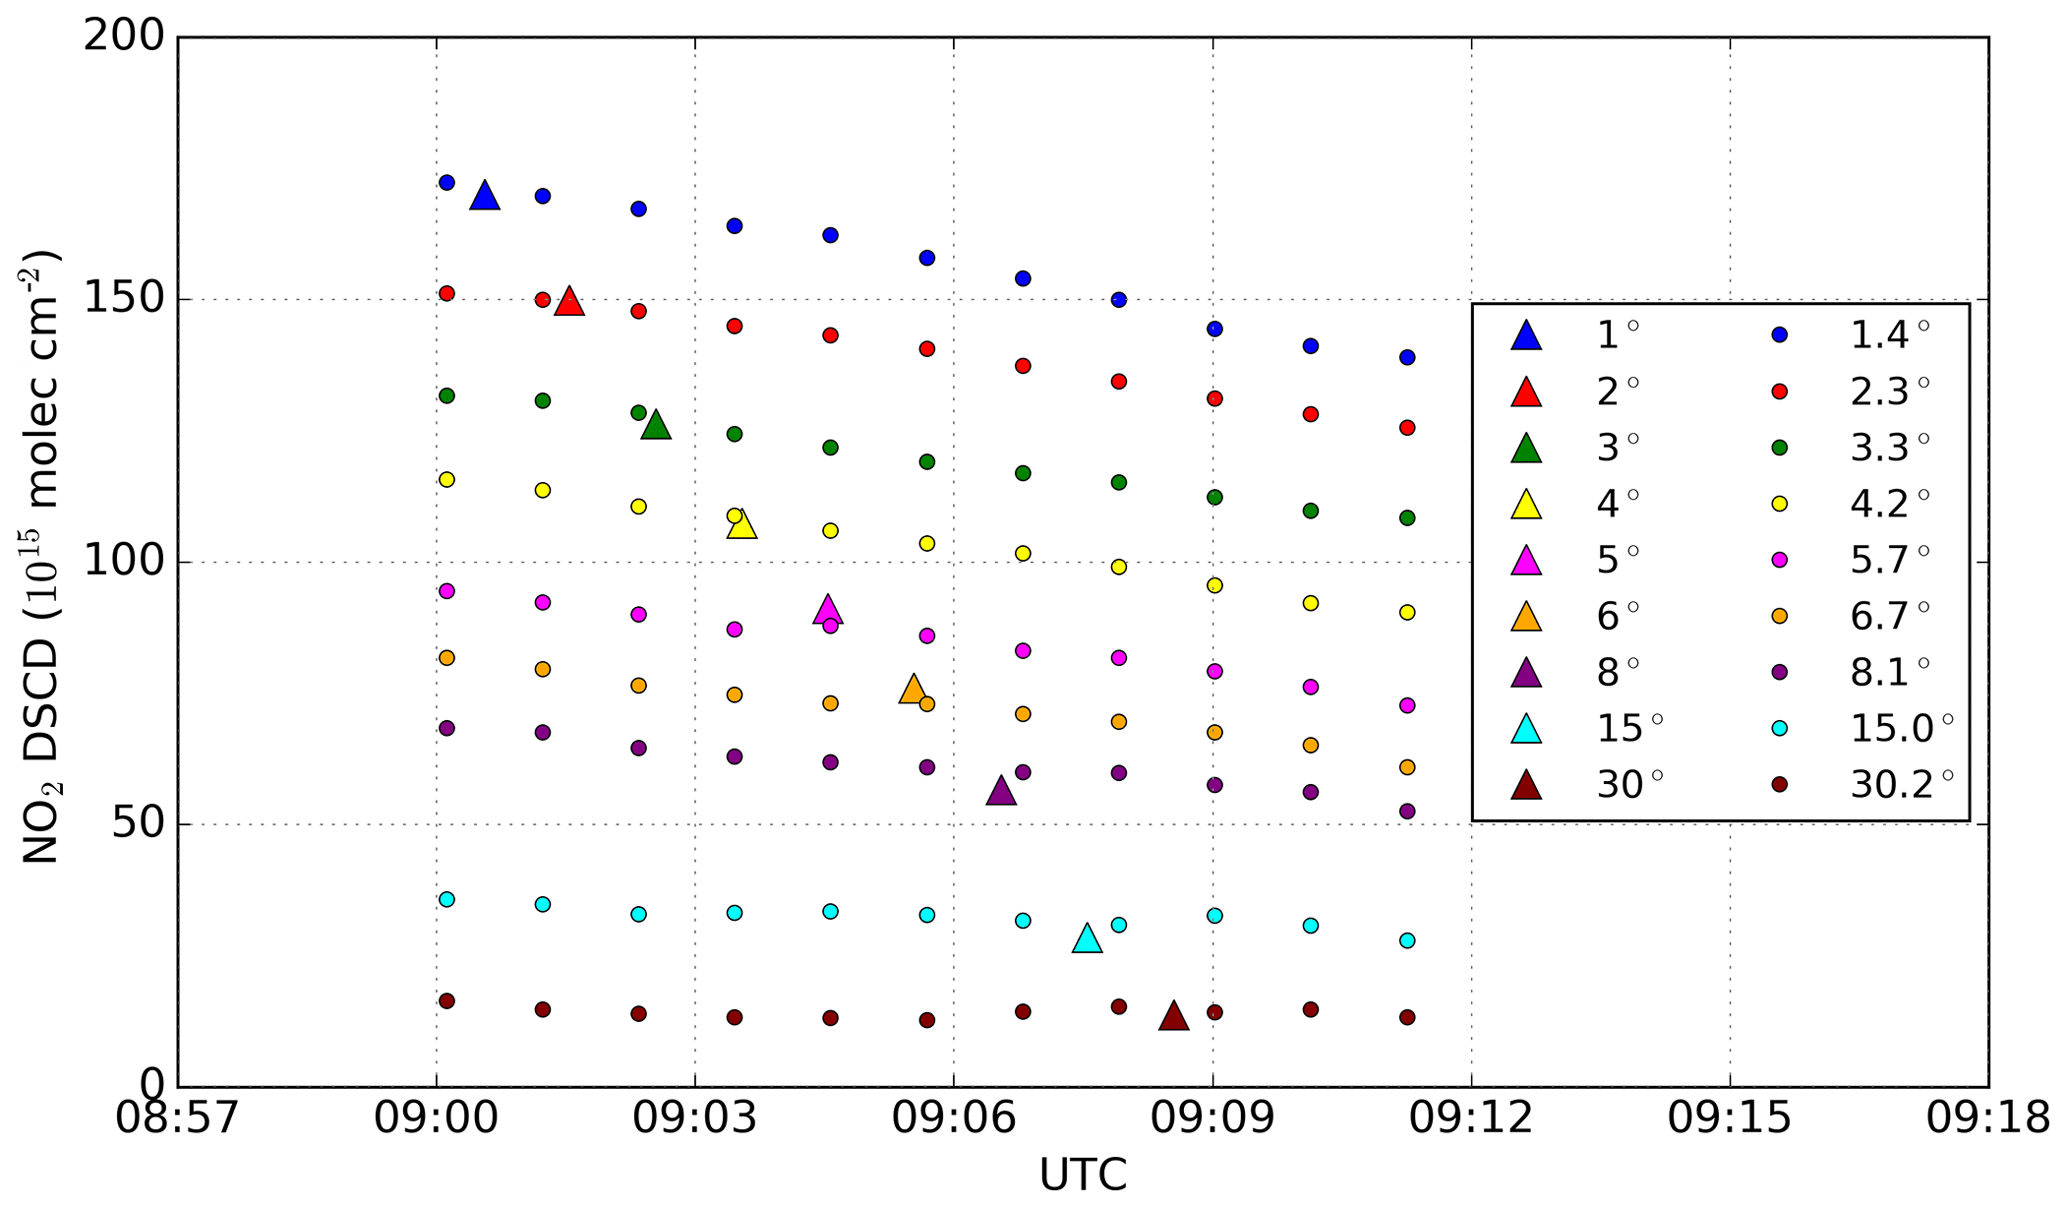
Figure 6NO2 DSCDs from an exemplary MAX-DOAS vertical scan (triangles) on 23 September 2016 compared to IMPACT (circles). For these intercomparison measurements, both instruments were pointing in the same fixed azimuth direction of 287∘ (from north) as explained in Sect. 2.4 (bullet point 1). While different prescribed elevation angles were applied consecutively by MAX-DOAS, IMPACT measures the complete vertical scanning sequence simultaneously as a result of its imaging capabilities. However, note that IMPACT's elevations deviate slightly from prescribed MAX-DOAS elevations.
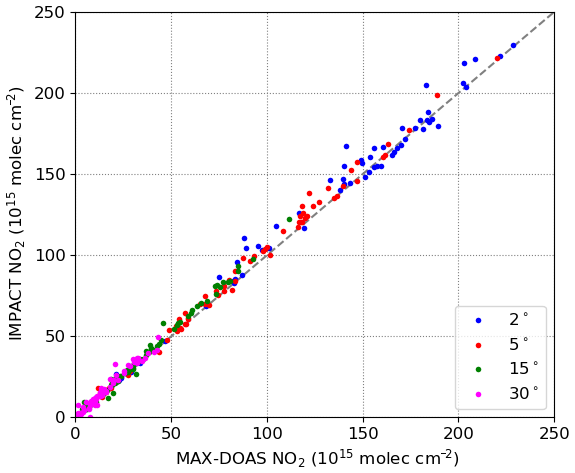
Figure 7Correlation plot of NO2 DSCDs from MAX-DOAS and IMPACT instrument for 17–23 September 2016 during CINDI-2. The elevation angle is color-coded; the 1:1 line is dashed.
A prominent feature in Fig. 4 is the two pairs of permuted individual fibers. This was discovered on-site only and is a defect of the fiber bundle used, which was corrected by the manufacturer after the campaign. However, as a result of the performed calibration procedure, the effective elevation assigned to the twisted fibers is correct. The effective FOV is approximately twice as large as for the other viewing directions because fibers which are next to each other at the spectrometer entrance and contribute due to the overlap are not properly ordered on the telescope side and therefore not pointing in adjacent elevation angles.
4.1 Intercomparison to MAX-DOAS measurements
Figure 6 shows NO2 DSCDs from an example MAX-DOAS vertical scanning sequence on 23 September 2016 under good weather and viewing conditions in comparison to IMPACT results. Note that, due to instrumental restrictions, the elevation angles of IMPACT deviate slightly from the angles prescribed for the semiblind intercomparison, while the MAX-DOAS instrument follows exactly the prescribed angles. As a result, the column for the 1∘ MAX-DOAS elevation (blue triangle) should be slightly larger than the IMPACT slant column (blue circles) taken at the same time because the effective elevation of IMPACT is 1.4∘. Interestingly, this is not seen here (the NO2 slant columns of both instruments agree quite well). The reason might be small misalignments between both instruments, either in elevation or azimuth, or the NO2 profile shape (potentially in combination with differences in the FOV of both instruments).
Figure 6 demonstrates a striking advantage of imaging DOAS as measured NO2 slant columns reveal a short-term temporal variation, which is resolved by IMPACT but not by the MAX-DOAS instrument. As mentioned, the 1∘ MAX-DOAS observation matches the IMPACT observation taken at the same time, but then MAX-DOAS continues with the next elevation (2∘) while IMPACT repeats measurements of the complete elevation angle range. In the case of 1∘ (1.4∘) elevation, the NO2 slant columns change from to molec cm−2, which is about 20 %. This temporal variation is not captured by the MAX-DOAS instrument, with clear consequences for any profile retrieval on these data which assumes that measurements at different elevation angles probe the same atmosphere. This is further investigated in Sect. 4.3.
Figure 7 shows a correlation plot between MAX-DOAS and IMPACT NO2 slant columns for several days within the semiblind intercomparison phase. For each MAX-DOAS elevation angle (color-coded) the closest IMPACT vertical scan (measured simultaneously) was selected. As a quality criterion, data were rejected if no IMPACT scan was found ±2 min around the MAX-DOAS measurement time (e.g., due to instrumental failures or saturated data). In addition, NO2 slant columns from IMPACT's simultaneous elevations were interpolated to the MAX-DOAS elevation angle.
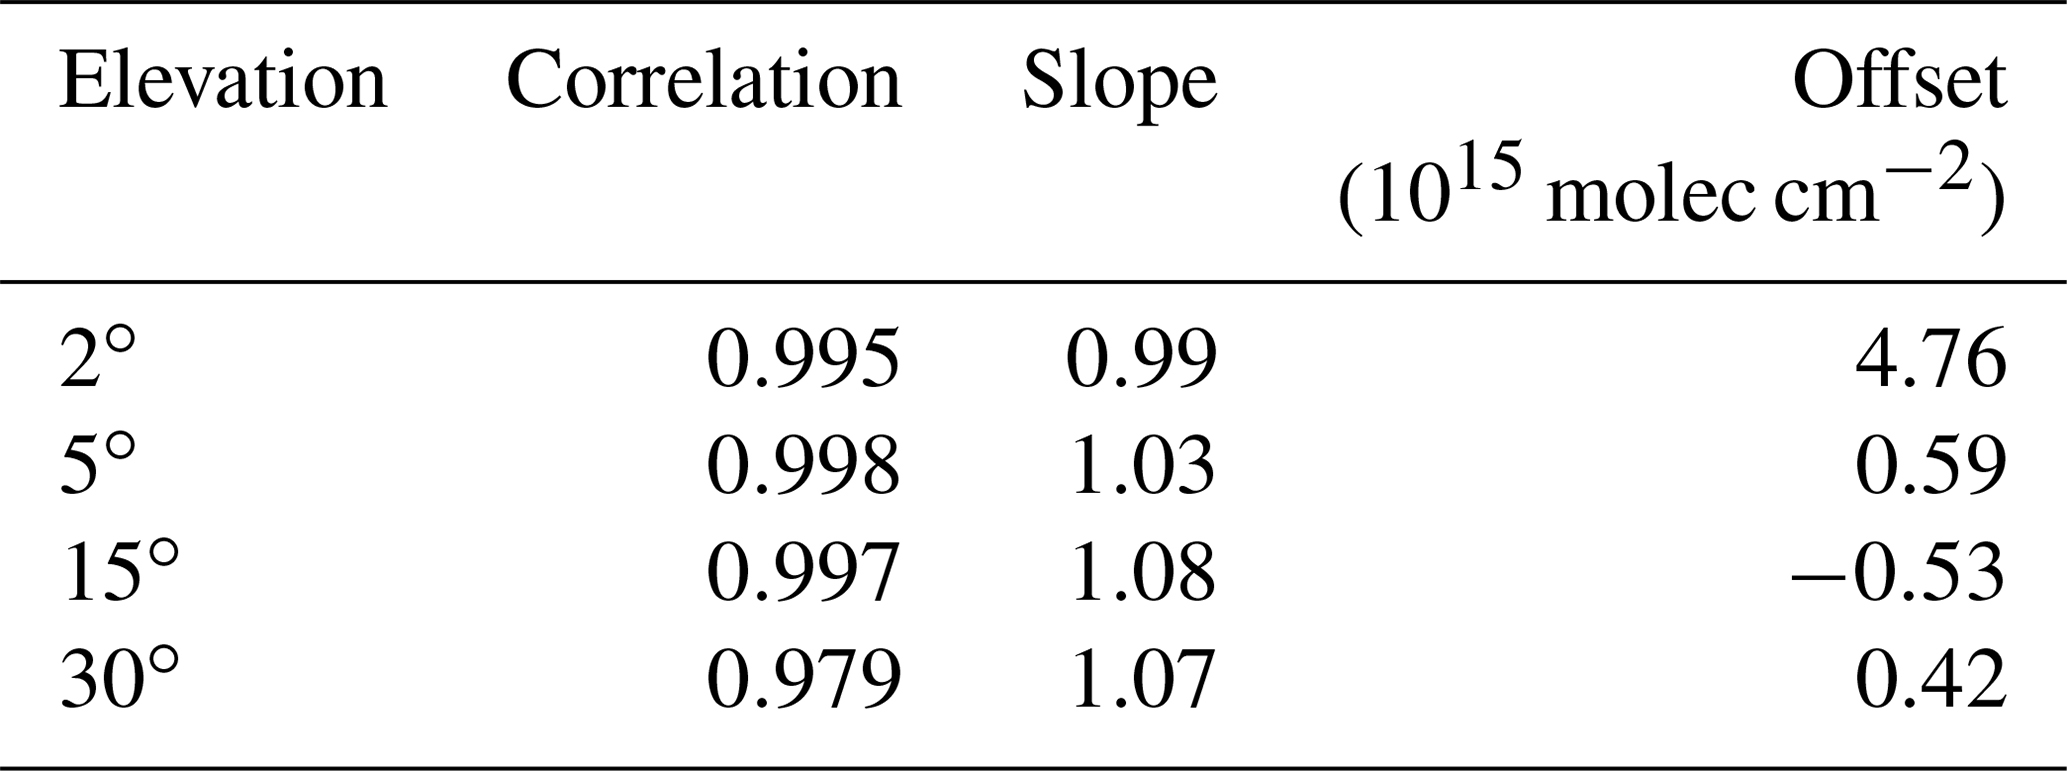
Statistical values for the correlation plot are summarized in Table 3. In general, an excellent agreement is found with correlation coefficients of ≈98 % for the 30∘ elevation angle and even >99 % for elevation angles ≤15∘. The slope is close to 1 (within 8 %) and the offset is molec cm−2 with the exception of the 2∘ elevation, for which it is slightly larger.
In general, these intercomparison results agree well with the much more detailed (and official) intercomparison study from Kreher et al. (2019) comprising all instruments participating at CINDI-2, although values are not identical. However, this is expected as the considered time periods are different. In addition, the comparison here is between IMPACT and a single MAX-DOAS instrument only, while in the official intercomparison exercise performed by Kreher et al. (2019) a reference data set consisting of several instruments is used.
Table 3Statistics (correlation coefficient, slope and offset) between IMPACT and MAX-DOAS NO2 slant columns from Fig. 7.
4.2 Azimuthal NO2 distribution and transport events

Figure 8Color-coded NO2 DSCDs (average of 16–24 September 2016) as a function of azimuth angle on the x axis (N = 0∘, E = 90∘, S = 180∘, or −180∘, W = −90∘) and elevation angle on the y axis.
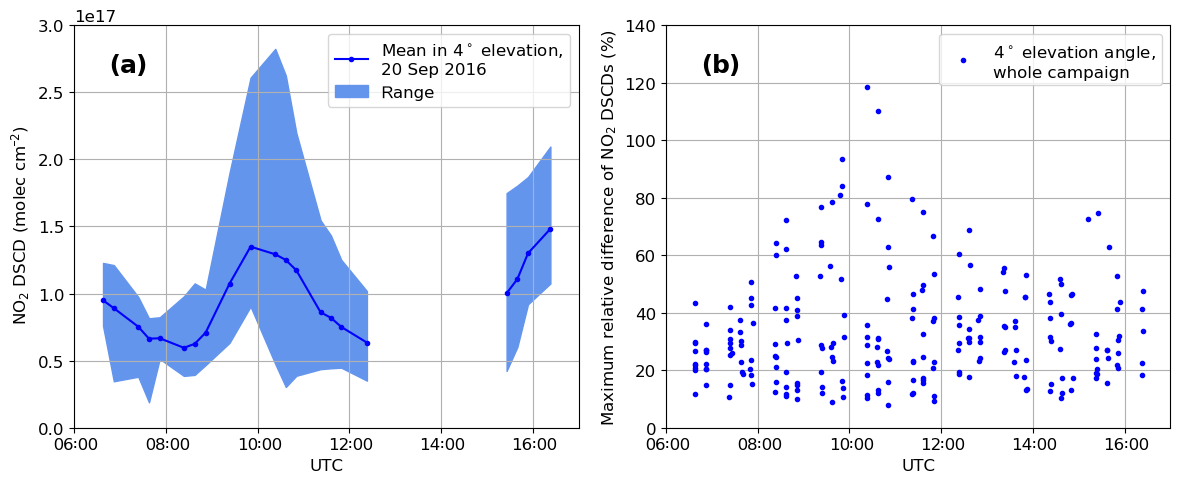
Figure 9(a) Range and mean of NO2 DSCDs in different azimuths and 4∘ elevation angle on 20 September 2016 during CINDI-2. (b) Maximum relative differences with respect to the mean (i.e., azimuthal inhomogeneities within individual scans) for the whole campaign, as a function of UTC.
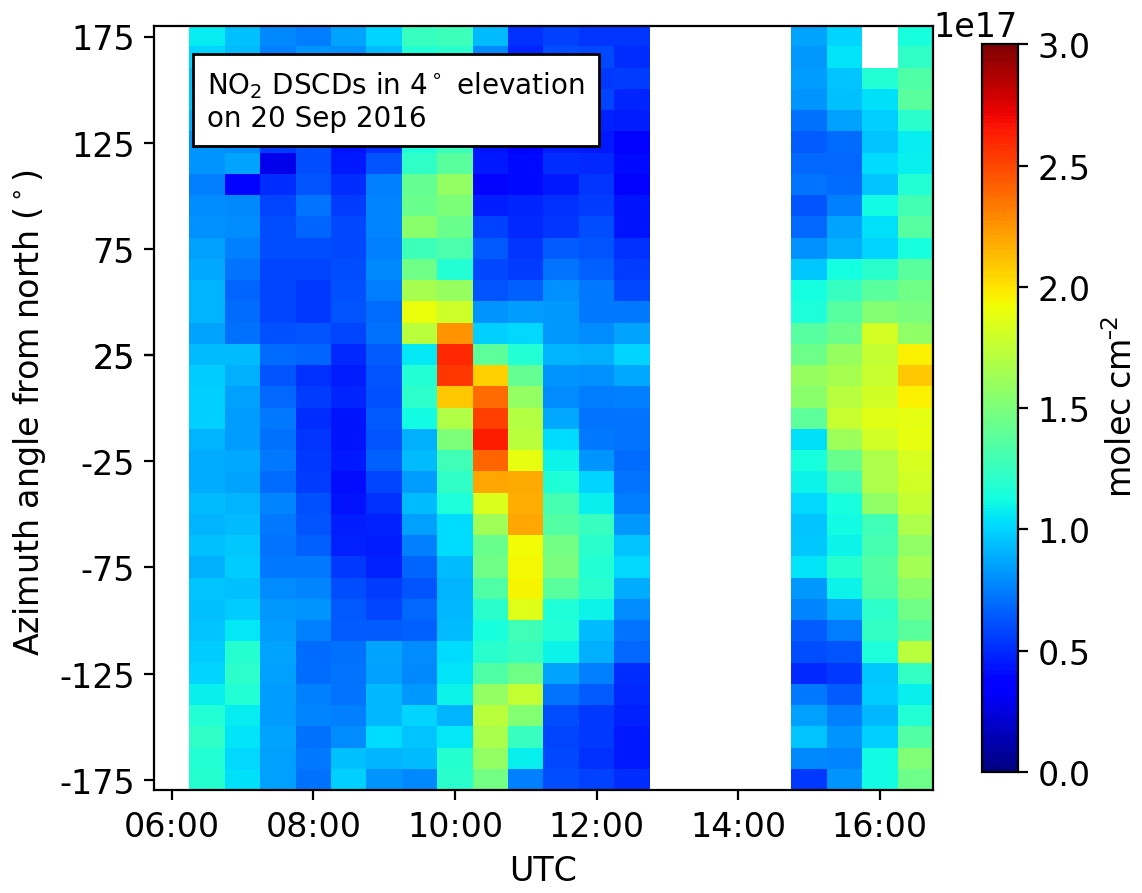
Figure 10NO2 DSCDs in 4∘ elevation angle (binned every 30 min) on 20 September 2016. A transport event occurred between 10:00 and 11:00 UTC.
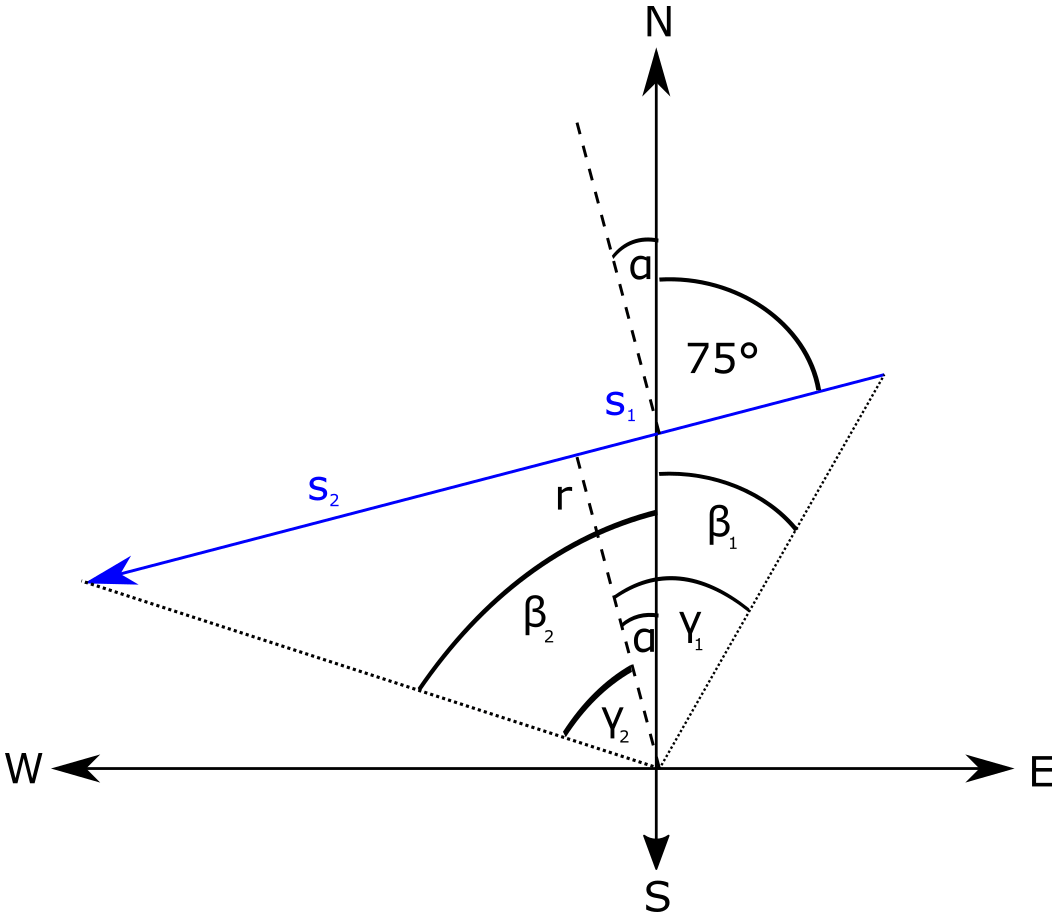
Figure 11Geometry of transport event. The blue arrow indicates the plume's trajectory s. The mean wind direction on 20 September 2016 is 75∘. The black dashed line is the closest distance r between the instrument (in the origin of the coordinate system) and the trajectory, which is perpendicular to the trajectory and divides it into s1 and s2. The plume appears at 10:00 UTC under the azimuth angle β1 and at 11:00 UTC under β2 (with respect to north). γ1 and γ2 are the respective angles relative to the direction of closest distance (r) instead of north.
Figure 8 shows the campaign average of NO2 slant columns observed from IMPACT in all azimuths and elevation angles around the measurement site (note that due to instrument problems the entire semiblind intercomparison period is not captured here, but instead only 16–24 September 2016 is captured). For better visibility, the five lowermost CCD bins (corresponding to single fibers) pointing towards the ground have been removed as well as two CCD bins pointing effectively in almost the same direction as a result of the twisted fibers discussed in Sect. 3. Consequently, the panoramic view in Fig. 8 consists of 43 elevation angles on the vertical axis and 36 azimuth directions (−175 to +175∘ in 10∘ steps) on the horizontal axis. In addition, the fractional IMPACT elevation angles on the vertical axis have been rounded for better readability. We note that this has been done in subsequent figures and in the following discussion as well.
Obviously, the campaign mean NO2 distribution around the measurement site is rather homogeneous with a slight tendency to larger values in the southwest (between −165 and −75∘), which is most likely linked to a close-by local traffic road (in this azimuthal regime, the light path is almost along the road, which can be seen in Fig. 12). Furthermore, the light path was obstructed by trees in ≈75 to 135∘ azimuth and elevation angles <5∘ which can be clearly seen by reduced NO2 slant columns in these directions – i.e., these small values are an effect of obstacles and the resulting short light path. In addition, obstruction by other instruments occurred in −25∘ and by a single tree in −115∘. In general, largest NO2 slant columns are found not in 0 or 1∘ but in ≈2∘ elevation, which is an effect of the instrument's FOV; i.e., surface effects are present in the 0∘ and (to a lesser extent) in 1∘ elevation angle as a result of the overlap of adjacent fibers mapped onto the CCD (see Sect. 3 and Fig. 5).
The homogeneous long-term-averaged NO2 distribution around the measurement site is supporting the assumption of the absence of persisting strong local pollutants. However, much more variability is present on shorter timescales. This is demonstrated by Fig. 9a where the range of NO2 slant columns recorded on 20 September 2016 (maximum and minimum values) as well as the average of all applied azimuths in 4∘ elevation angle is shown (one data point for each panoramic image). Maximum values differ from the azimuthal mean by up to a factor of 2. This is quantitatively analyzed for the whole campaign in Fig. 9b showing the maximum relative difference, i.e., the ratio between maximum NO2 observed in any azimuth to the NO2 averaged over all azimuths. The maximum relative differences range from 10 % to 120 % for individual panoramic views and are ≈35 % on average. This is an unexpectedly high value indicating large spatial inhomogeneity on short timescales even for semirural measurement sites like Cabauw with no large local sources and very homogeneous long-term trace gas distributions. As a result, care has to be taken if ground-based (MAX-DOAS) measurements are used for satellite validation as a single viewing direction does not necessarily provide a good estimate of the NO2 columns within a satellite pixel. In this case, observations in many azimuths should be taken and averaged to reduce the variability present in satellite ground pixels. This is often done when validating satellite observations in urban areas where spatial gradients are expected; e.g., a validation of Ozone Monitoring Instrument (OMI) satellite pixels in an urban, polluted area taking into account not only the azimuthal inhomogeneity around the measurement site but also changes in the NO2 concentration along the light path (using 3-D DOAS) was presented by Ortega et al. (2015). The findings derived from IMPACT measurements suggest that similar efforts are necessary when validating satellite results even in semirural locations like Cabauw.
One reason for the observed spatial inhomogeneity of NO2 is the transport and passing of polluted air masses. Figure 10 shows the temporal evolution of NO2 slant columns in all applied azimuth directions (vertical axis) and 4∘ elevation angle on 20 September 2016. The data gap around 14:00 UTC is due to an instrumental failure. Besides moderately enhanced NO2 towards the evening, a clear transport event occurred around 10:00 UTC. Between 09:00 and 10:00 UTC, increased NO2 slant columns appear in all azimuth directions between 25 and ∼175∘ (south). Between 10:00 and 11:00 UTC, the maximum of NO2 is then traveling from an azimuth angle of β1≈30∘ to ∘ (see geometrical considerations in Fig. 11).

Figure 12Map of the area around the measurement site. The transport event's trajectory on 20 September 2016 is indicated by a blue arrow (source: © Google maps).
The wind direction on 20 September 2016 was quite variable with low absolute wind speeds. However, the mean wind direction was ≈75∘ (see Table 1 for meteorological conditions). If the plume is transported by the wind, the direction of smallest distance r to the measurement site is ∘ (see Fig. 11). The assumption here is a straight trajectory s (blue arrow) of the plume and thus the smallest distance r (dashed line) to the measurement site is perpendicular to it. As can be seen in Fig. 10, this coincides roughly with the direction of the largest NO2, although slant columns are not necessarily largest at the smallest distance r as the magnitude depends also on the (unknown) plume's shape and relative contribution of the light path through it.
The spatial distance traveled in Δt=1 h (10:00 to 11:00 UTC) can be estimated from wind speed:
The angles between r and the trajectory's start/end points (i.e., plumes's positions at 10:00 and 11:00 UTC) are and (Fig. 11). The distances s1, s2 and s are then given by (omitting the sign of γ1 and γ2)
As a result, the smallest distance r to the measurement site is
Note that this calculation is in principle true for the 0∘ elevation angle only, whereas measurements in 4∘ were used here. However, this was neglected for simplicity as the effect is small and below the uncertainty introduced by the variety of assumptions made. For a mean wind speed of 1.2 m s−1 measured at the Cabauw meteorological tower, a smallest distance of r≈1.8 km is obtained (s≈4.3, s1≈1.8, s2≈2.5 km).
Figure 12 shows the measurement site's surrounding with the smallest distance r and plume's trajectory between 10:00 and 11:00 UTC indicated as blue arrow. Obviously, the origin of the transport event cannot be precisely identified, but it could be linked to a regional industrial park that is close to the starting point of the plume's trajectory. This speculation is supported by the fact that increased values of NO2 are already found slightly earlier (≈ 09:30 UTC) in northeastern directions (see Fig. 9). In addition, increased NO2 slant columns are seen in the zenith direction as well (not shown). This indicates that parts of the plume were overpassing the measurement site and thus a large spatial extent of the plume perpendicular to the direction of propagation, most likely as a result of the unstable wind direction. Finally, the fact that the 4∘ elevation angle is clearly enhanced although the plume was overpassing the instrument as well means that the plume is close to the ground, which is usually an indication for a close-by origin. This is supported by vertical NO2 profiles retrieved in Sect. 4.3.3.
4.3 NO2 profiling
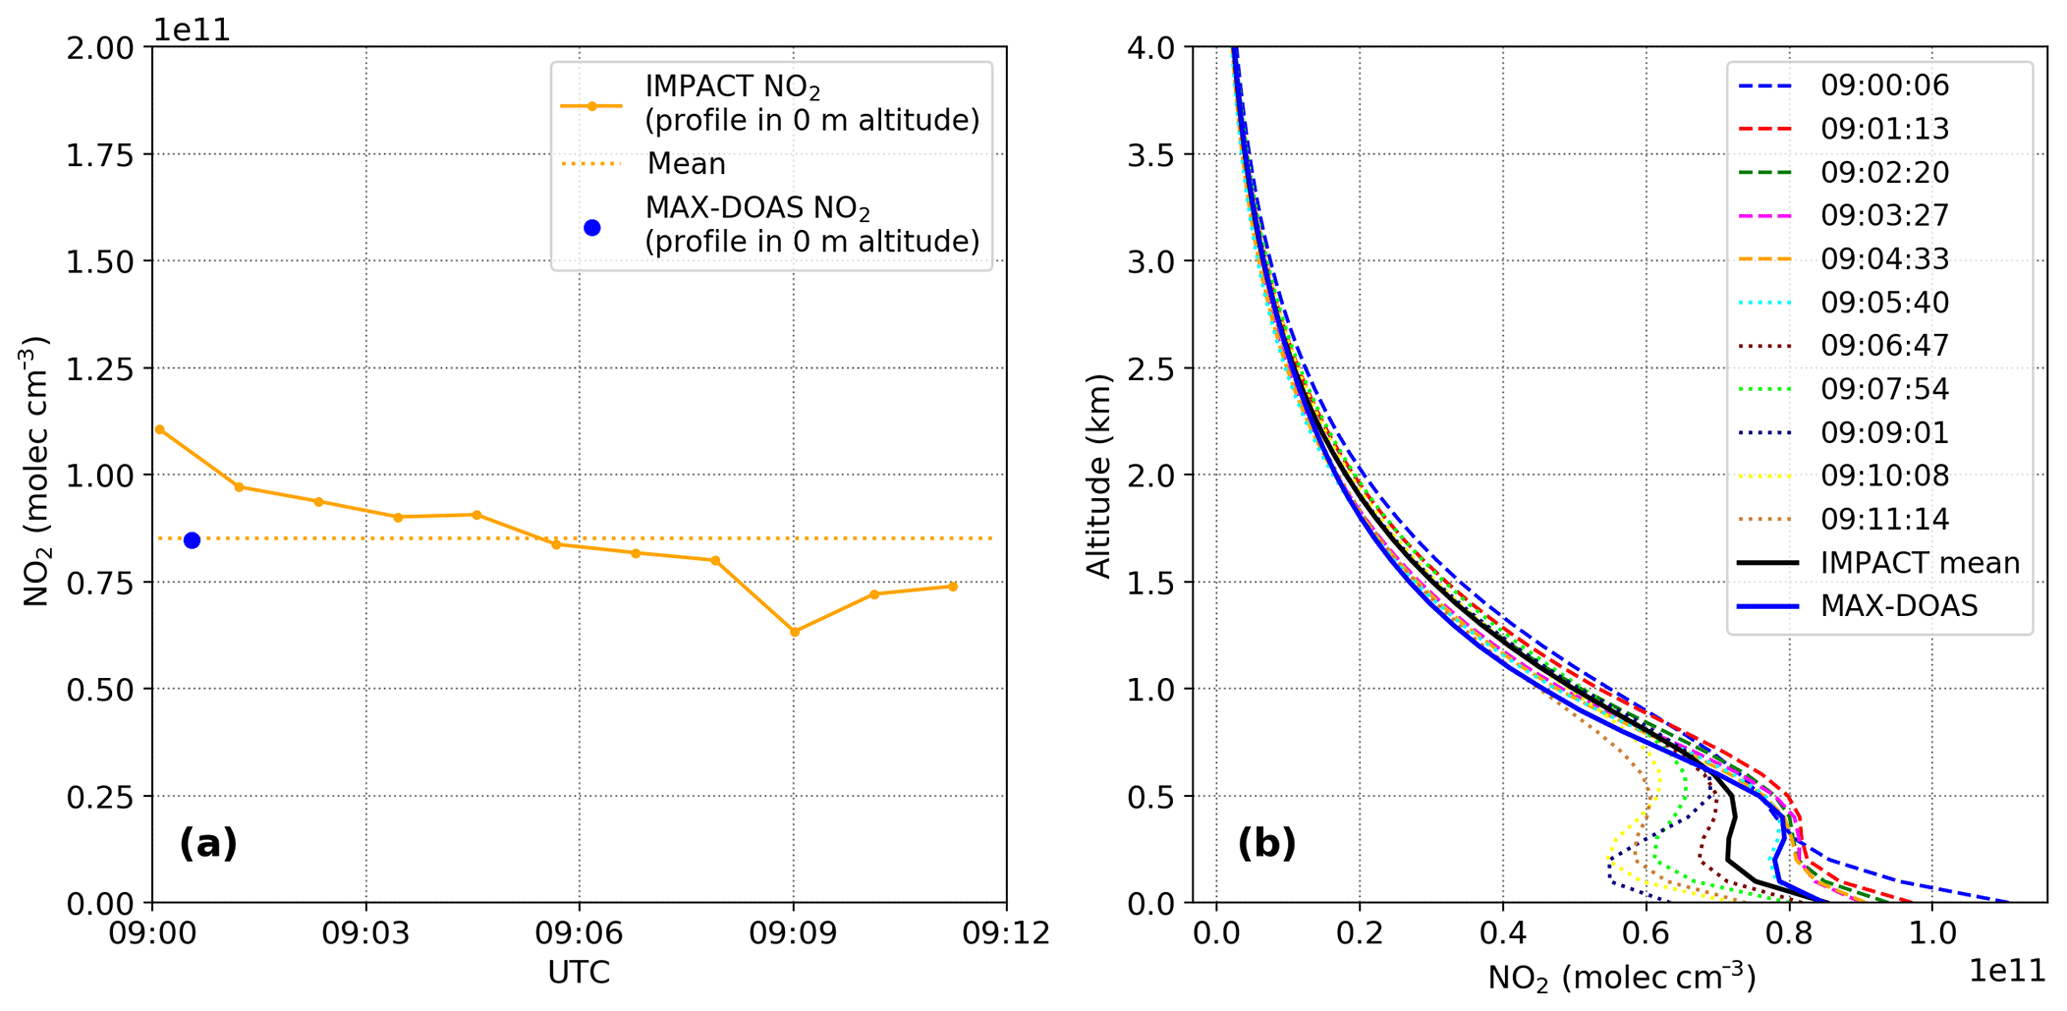
Figure 13NO2 surface concentrations (a) and profiles (b) retrieved from IMPACT's high-repetition measurements in the common azimuth direction of 287∘ during the acquisition of one MAX-DOAS vertical scan at 23 September 2016. Corresponding NO2 DSCDs used as input for the profile retrieval are shown in Fig. 6.
As already mentioned, one of IMPACT's objectives is to enable aerosol and trace gas profile retrievals rapidly in every direction around the measurement site.
4.3.1 BOREAS
The retrieval code BOREAS (Bösch et al., 2018) used here is an IUP-Bremen in-house algorithm. For the current study, profiles are retrieved on an altitude grid reaching from 0 to 4 km in 100 m steps. For MAX-DOAS profiles, NO2 slant columns in prescribed elevation angles were used as input to BOREAS. For IMPACT profiles, all elevations from 0.6 to 10 and 29 to 31∘ have been used (while other simultaneously measured elevations have been excluded in order to decrease computational time).
As additional input, vertical profiles of pressure and temperature were created by taking the mean of 16 different sonde measurements taken during the years 2013–2015 in De Bilt, the Netherlands. The retrieval is based on an optimal estimation method (OEM), for which an exponentially decreasing a priori profile having a surface concentration of 9.13×10¹⁰ molec cm−3 and a scaling height of 1 km has been used. For the aerosol profile retrieval, a surface extinction of 0.183 km−1 and again a scaling height of 1 km have been assumed. For the aerosol phase function and single-scattering albedo (SSA), always the closest-in-time values obtained from the nearby Cabauw Aerosol Robotic Network (AERONET) station were applied. Radiative transfer calculations were performed using SCIATRAN (Rozanov et al., 2014) in its version 4.0.1. The BOREAS inversion algorithm is explained in detail in Bösch et al. (2018).
4.3.2 Temporal resolution
NO2 slant columns were found to change during the acquisition time of a MAX-DOAS vertical scanning sequence (∼12 min) in a fixed azimuth direction in Sect. 4.1 (∼20 % variation was observed even under good weather and viewing conditions). If this MAX-DOAS scan is input to a profile retrieval, the change in NO2 is (1) not resolved and (2) possibly interfering with the results, predominantly as the retrieved profiles will not simply be a temporal average of the true profiles.
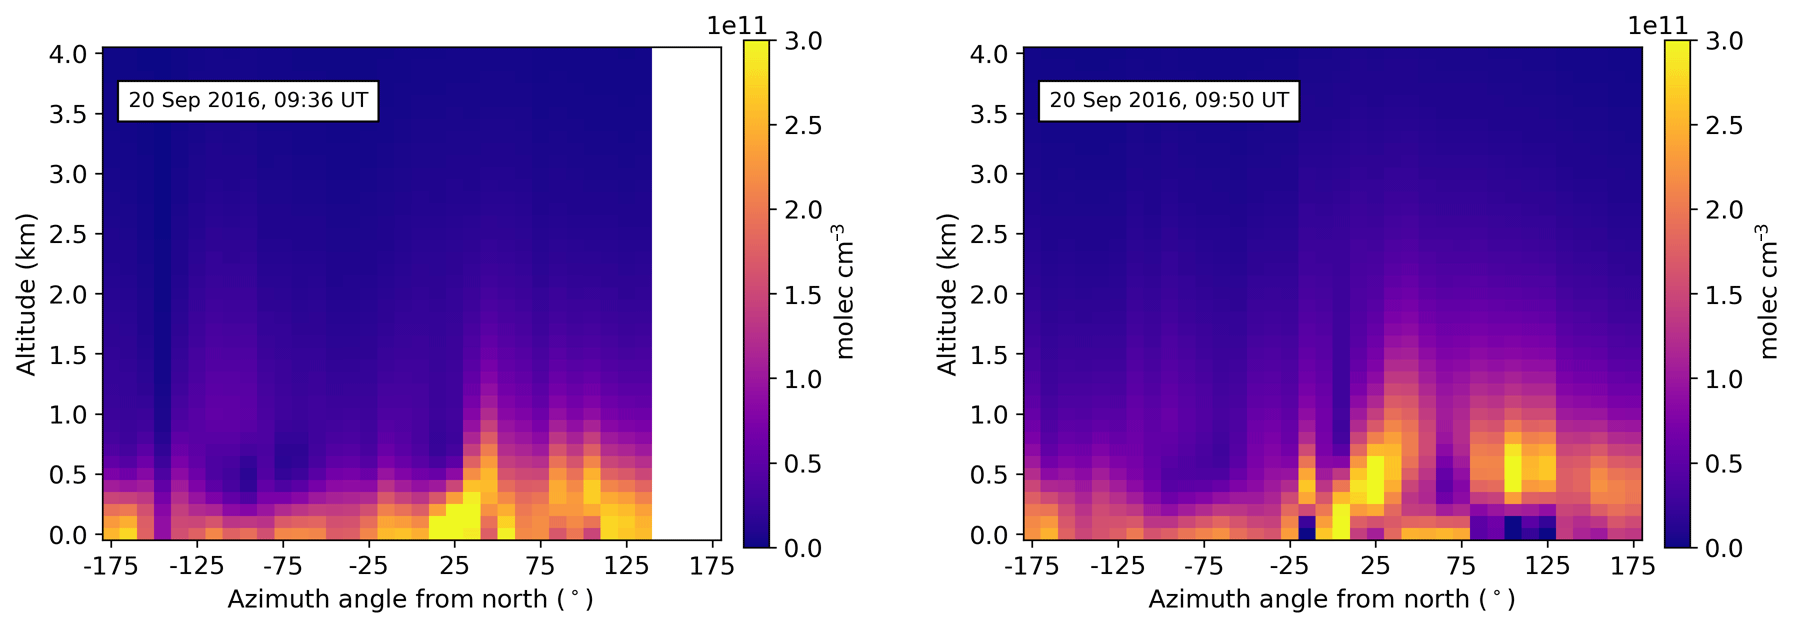
Figure 14Retrieved NO2 profiles around the measurement site during the observed transport event on 20 September 2016.
This is demonstrated in Fig. 13, showing IMPACT and MAX-DOAS surface concentrations and profiles for the case study presented above in Fig. 6. The temporal evolution of NO2 slant columns seen in Fig. 6 is reproduced by NO2 surface concentrations from IMPACT. Interestingly, the change in surface concentrations is even more pronounced and in the order of ≈40 % because aerosol concentrations were changing as well. In comparison, the NO2 surface concentration derived from the single MAX-DOAS profile is of course not reflecting the NO2 decrease but is (in this case) close to the temporal mean. This is also shown in Fig. 13b comparing single profiles from IMPACT and their mean (solid black line) to the MAX-DOAS profile. However, apart from the surface concentrations, the MAX-DOAS profile and the mean of the IMPACT profiles do not agree. Especially in lower altitudes, the MAX-DOAS profile is closer to the IMPACT profiles acquired first (between 09:00 and 09:05 UTC). This is reasonable because the MAX-DOAS vertical scanning sequence starts with small elevations, which agree with the lowest elevations of the first (simultaneous) IMPACT scans (see Fig. 6). These small elevations contain much information and have a large influence on the retrieved profile in lower altitudes. In higher altitudes, the information content is limited and the retrieved profile is predominantly determined by a priori information (as discussed in Bösch et al., 2018).
4.3.3 NO2 transport event
Full-panoramic NO2 profiles retrieved on 20 September 2016 during the observed transport event (Sect. 4.2) are plotted in Fig. 14 as a function of azimuth and elevation angle. Viewing conditions during that time were challenging (broken clouds, unstable cloud conditions), affecting the retrieval results. Nevertheless, in agreement with findings in Sect. 4.2, increased NO2 concentrations are observed between azimuths of 25 and 175∘ from north. As Fig. 14 (left) shows, these increasing concentrations are located close to the ground. The NO2 is then uplifted around 10:00 UTC (Fig. 14 right) to altitudes of 500–1000 m and in subsequent scans transported in westerly directions (profiles not shown due to poor viewing conditions). In general, this is in agreement with findings above and in particular the appearance of high NO2 concentrations close to the ground, and subsequent uplifting supports the conclusion derived in Sect. 4.2 of a local emission source in the vicinity of the measurement site (Lopik or the nearby industrial park).
4.4 Potential for aerosol retrievals
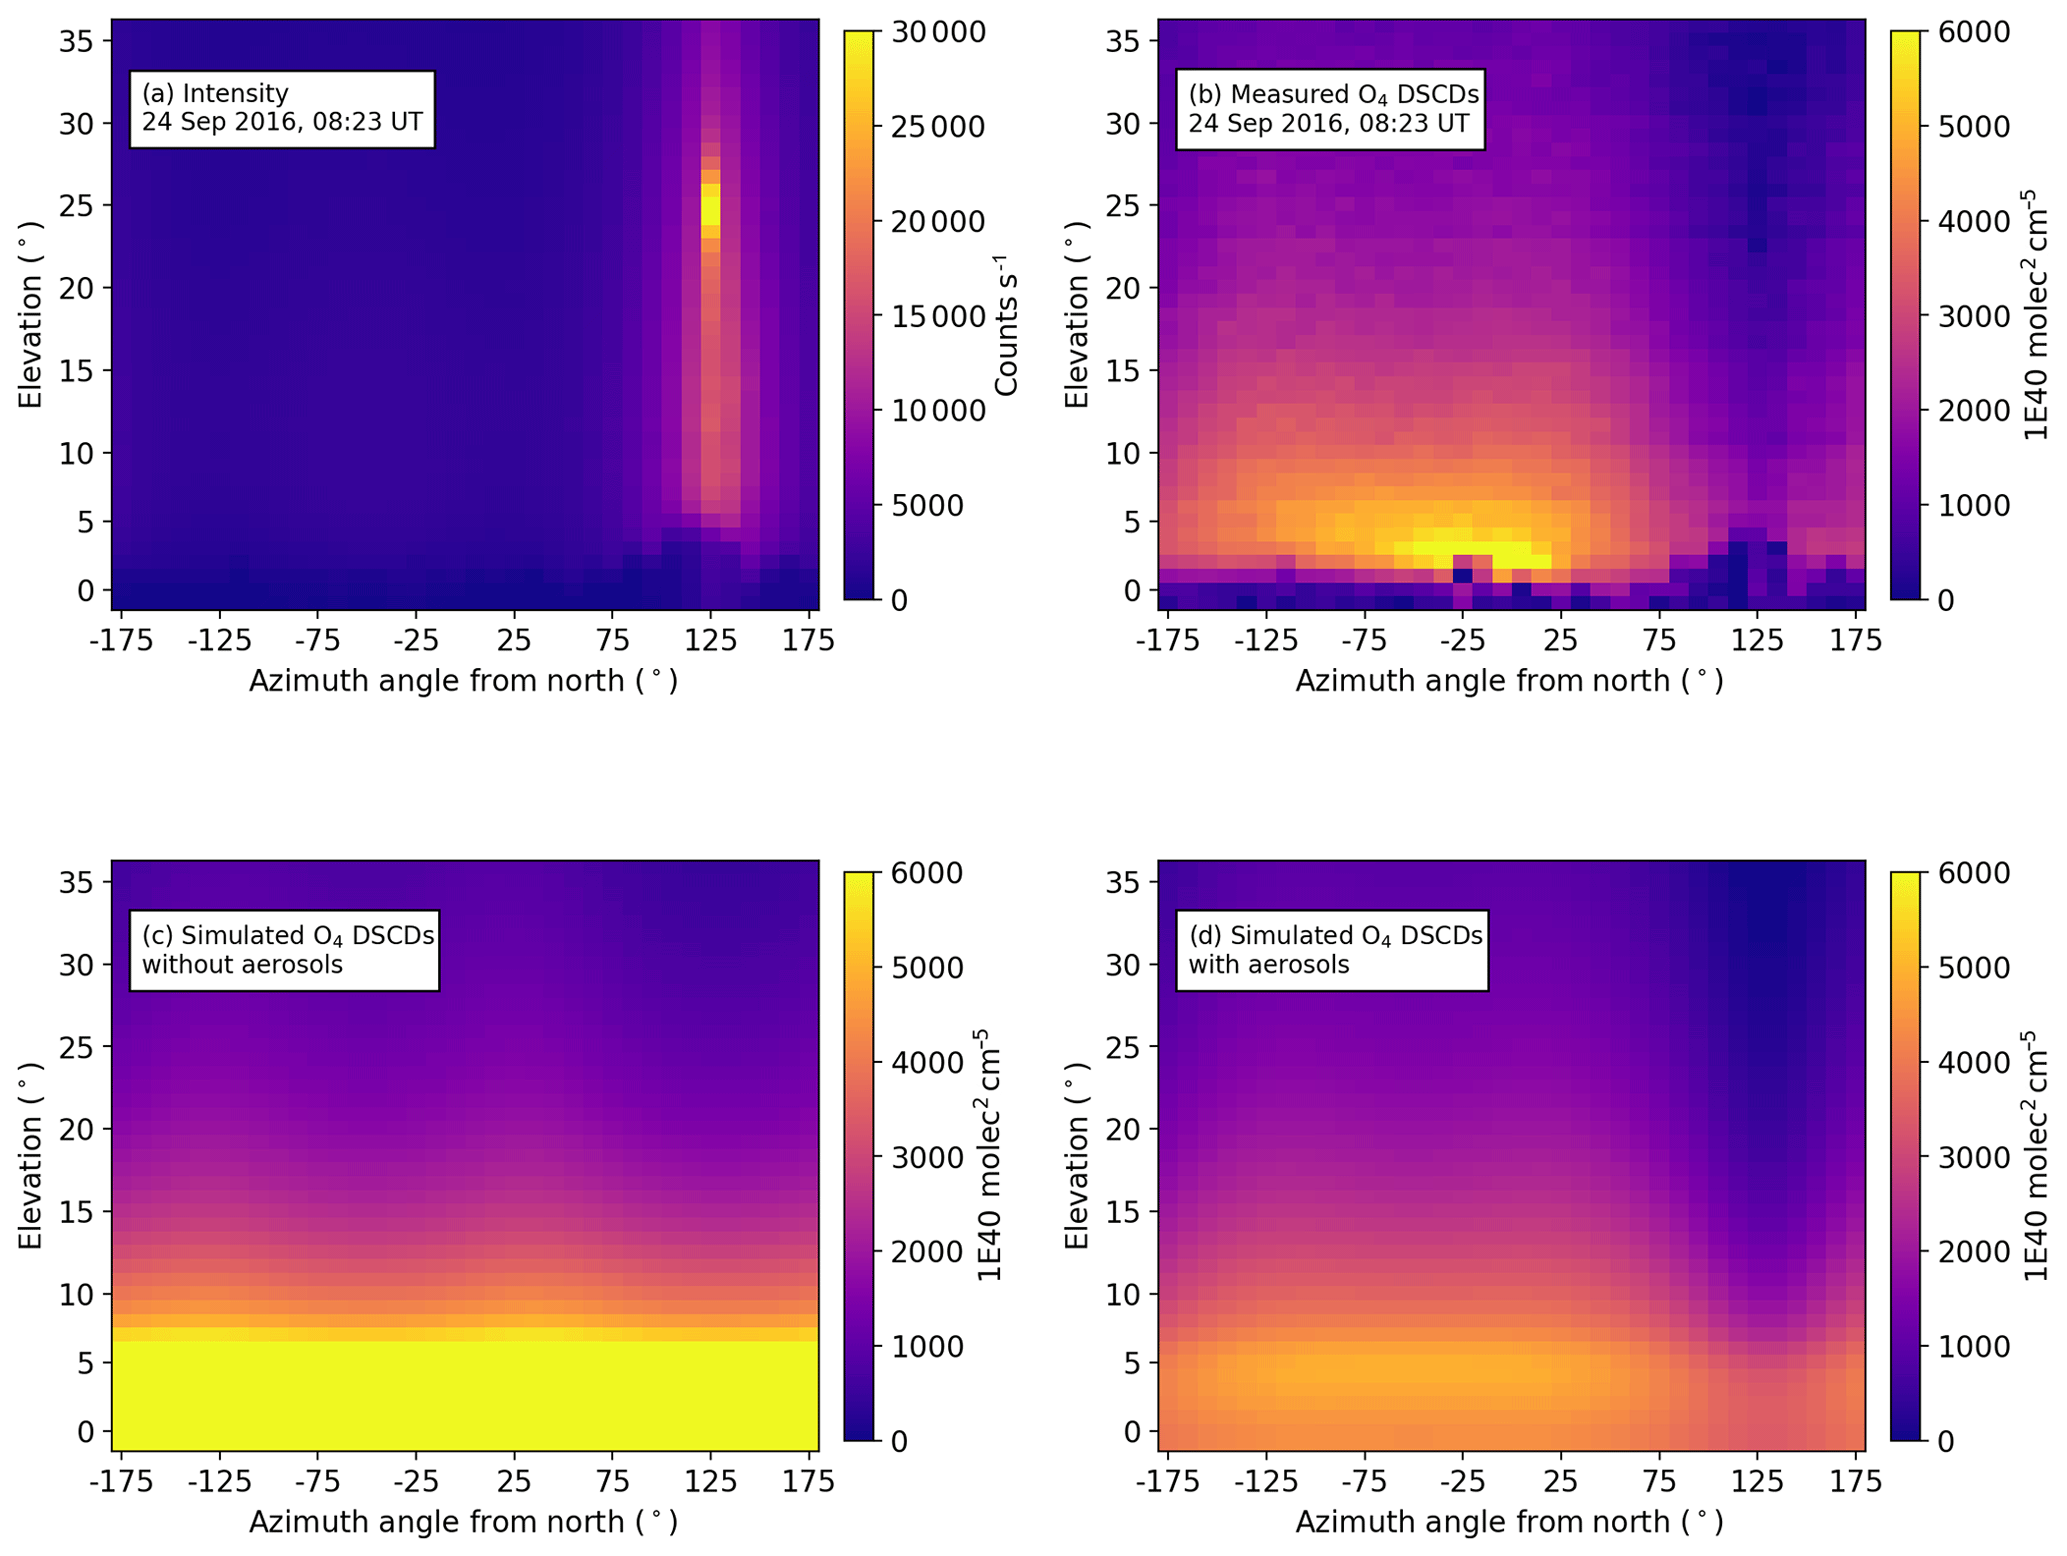
Figure 15Intensity (a) and measured O4 DSCDs (b) from one IMPACT panoramic scan on 24 September 2016, at 08:23 UTC mean acquisition time, in comparison to simulated O4 DSCDs without (c) and with aerosols (d). Ground effects (obstacles discussed in Sect. 4.2) are of course not present in the simulations.

Figure 16(a) Measured and simulated almucantar scans of O4 DSCDs on 24 September 2016 in two exemplary elevation angles (4∘ is close to the surface, and 25∘ is the solar almucantar), i.e., horizontal cross sections through Figs. 15b and d. (b) Same data plotted as a function of the (single) scattering angle shown in (c), which has been calculated for every viewing geometry of the hemispheric scan in Fig. 15. (d) Correlation coefficients between measured and simulated almucantar O4 DSCDs for all elevation angles (i.e., all data from Fig. 15). Different input parameters (asymmetry factor g and single-scattering albedo, SSA) have been used for the simulation of O4 DSCDs (for simulated data in subplots a and b, g=0.75 and SSA = 0.95 have been used).
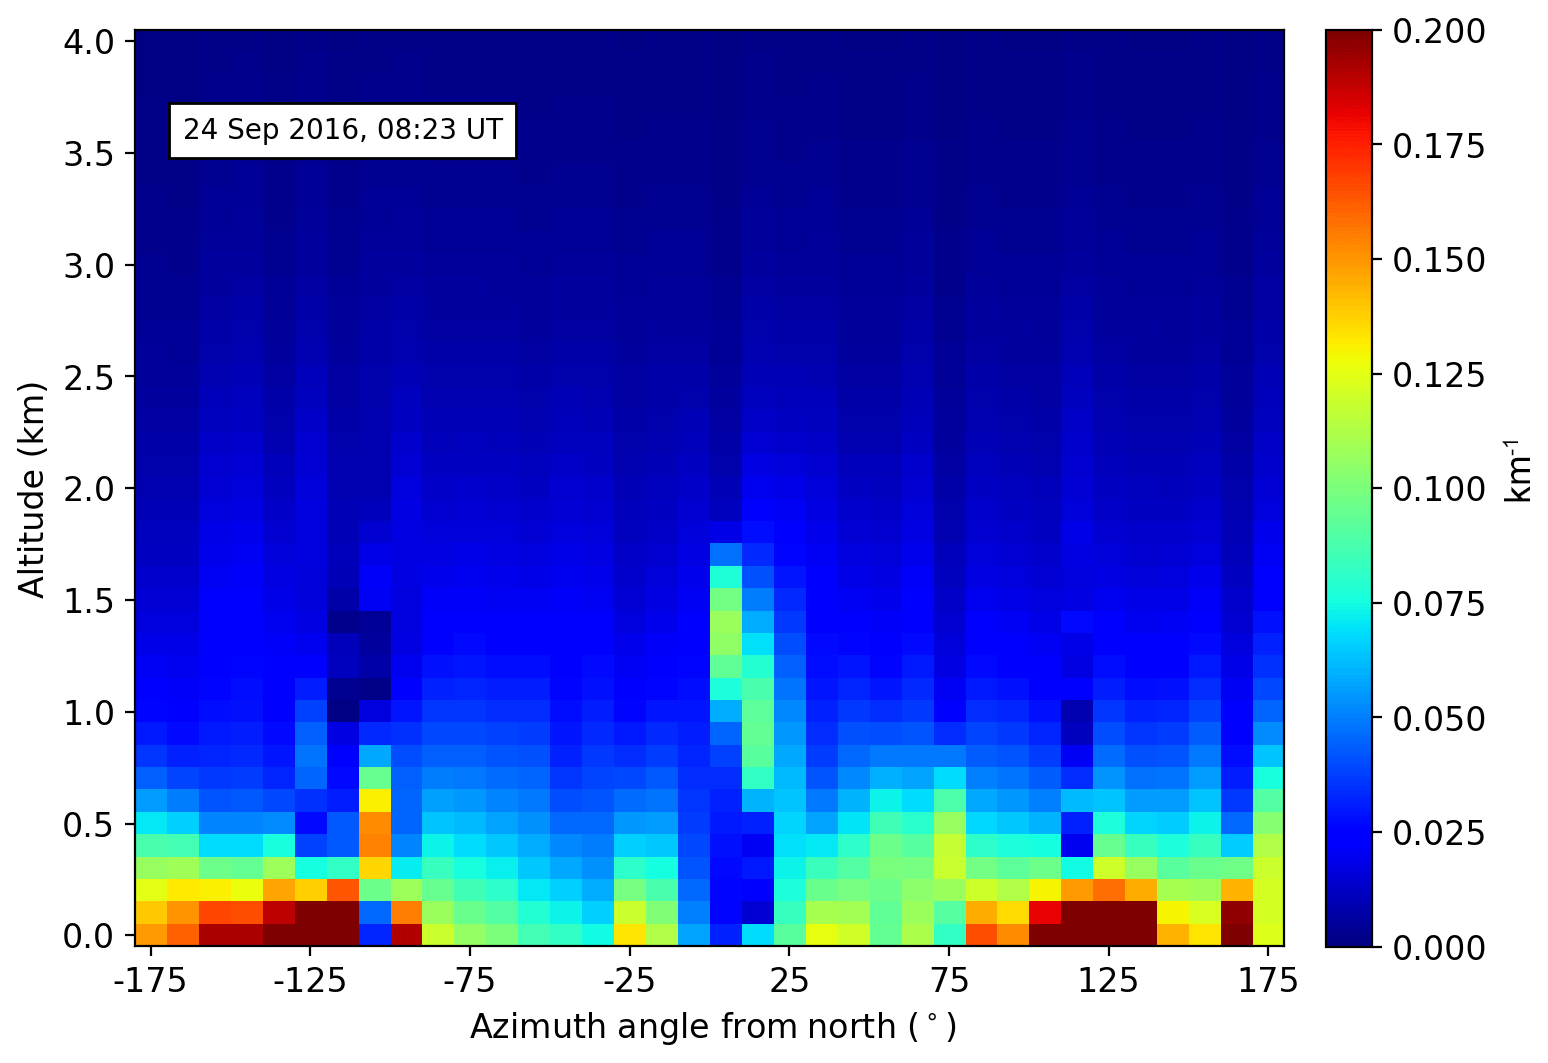
Figure 17Retrieved aerosol extinction profiles around the measurement site for the azimuthal scan shown in Fig. 15.
In addition to NO2, IMPACT measurements enable the oxygen dimer O4 to be retrieved from the same DOAS fit (Table 2). As O4 is a collision complex of O2 molecules, it depends on pressure only and is therefore a measure of the light path (e.g., Wagner et al., 2002; Wittrock et al., 2004, and references therein).
As a case study, Fig. 15 shows the measured intensity (a) and O4 slant columns (b) from one IMPACT scan (acquisition time ∼15 min) on 24 September 2016 under excellent viewing conditions. The position of the sun is clearly visible at ∼125∘ azimuth (solar azimuth angle, SAA) and ∼25∘ elevation. O4 slant columns close to the sun are reduced as a result of shorter average light paths due to strong forward scattering of aerosols. This is validated by simulated O4 slant columns for the same measurement geometry without aerosols, i.e., pure Rayleigh scattering (c) and with aerosols (d). The simulations have been performed using the radiative transfer model SCIATRAN (Rozanov et al., 2014) in its version 3.4.4. As input for the simulation, an exponential decrease (0.1 km−1 surface value, AOD=0.2) was used as the aerosol extinction profile, and a Henyey–Greenstein (HG) parametrization of the aerosol phase function with an asymmetry factor of g=0.75 and a single-scattering albedo SSA=0.95 was applied. These values were obtained from a close-by Cabauw AERONET station (Holben et al., 1998; Dubovik and King, 2000).
Simulated O4 slant columns for pure Rayleigh scattering differ strongly from measured O4 columns, both in absolute values and in the azimuthal distribution. In particular, the largely reduced columns around the sun are not reproduced by the simulation showing slightly reduced columns at the SAA and SAA + 180∘ only as a result of the Rayleigh phase function. In contrast, simulated columns including aerosols agree much better with measured columns and cover the azimuthal distribution (Fig. 15d). Thus, the comparison between the simulated and measured azimuthal distribution of O4 columns can be used to retrieve information about the aerosol properties and in particular its phase function.
Retrievals of aerosol properties, e.g., from AERONET stations, are usually based on intensity measurements in the solar almucantar, which in this case is the azimuthal distribution in ≈25∘ elevation. With MAX-DOAS it is also possible to incorporate O4 measurements in the retrieval of aerosol microphysical properties and phase function as suggested by Wagner et al. (2004). Frieß et al. (2006) demonstrated a corresponding retrieval based on intensity and O4 measurements in different azimuths and found that the largest sensitivity is gained from measurements in the aureole region of the sun, therefore requiring a small FOV, protection against direct sunlight and the capability to perform automated measurements in the azimuth. While measurements very close to the sun are challenging for IMPACT due to its large FOV, two important aspects can be investigated as a result of IMPACT's capability to record full 2-D maps very rapidly around the measurement site:
-
Is there a potential for O4 measurements in almucantars different than the solar almucantar to contribute to/support aerosol retrievals?
-
Is there a restriction regarding which almucantars can be used, and what is the criterion/threshold for the use or rejection?
As IMPACT is (currently) not radiometrically calibrated, we focus on exploiting O4 measurements rather than intensity for the retrieval of aerosol properties. In addition, it should be clearly mentioned that a full aerosol retrieval is far beyond the scope of this study, which is limited to the two research questions above.
For research question (1), it is a limitation that sky radiometers (e.g., within the AERONET network) and current state-of-the-art MAX-DOAS instruments are measuring in only one viewing geometry at a time. A scan along the solar almucantar then provides observations at different scattering angles. In contrast to these instruments, IMPACT measures many almucantars at the same time, in the case study shown in Fig. 15, both above and below the solar almucantar. The geometrical scattering angle (single-scattering case) has been calculated for every viewing geometry and is plotted in Fig. 16c. Obviously, almucantars above and below the solar almucantar provide slightly different scattering angles and might therefore complement the classical retrieval.
However, not all almucantars should be used, and, even if exploiting the solar almucantar only, a threshold for the lowest usable elevation angle should be regarded (research question 2). The reason is that a retrieval of, for example, the aerosol phase function requires the azimuthal distribution of measured O4 to be caused by the aerosol phase function only. In contrast, in the observations it is caused by the combined effect of (1) phase function and (2) varying aerosol load and extinction profile in different azimuth directions as well as along the light path, i.e., in different distances from the instrument. For measurements taken at large elevations, the aerosol load and profile can be assumed to be homogeneous as the horizontal distance around the measurement site from which information is obtained (in a single-scattering case this is the distance to the scattering point projected to the ground) is short. For small elevations, this horizontal extent around the measurement site is much larger – in a first approximation it is scaling with 1∕tan(elevation), if only averaging in the boundary layer is considered and the last scattering point is above the boundary layer height. Thus, for small elevations the aerosol load and profile can change substantially along the light path.
This effect is clearly present in Fig. 15b: measured O4 slant columns have a distinct maximum in small elevations centered around ∘ azimuth (ranging from ∘ to 25∘ azimuth), which is not reproduced by simulated O4 columns. As illustrated in Fig. 16c, this is not the location of largest scattering angles (occurring at ∘ azimuth only) and therefore not related to the O4 maximum expected in backscattering direction (due to preferred forward scattering and consequently larger light paths in backscattering direction). Furthermore, if the O4 maximum was an effect of the phase function, a second maximum would appear close to the ground at ∘ azimuth (given that the aerosol profile would not change with the azimuth), because scattering angles in −25 and −85∘ azimuth are identical (see Fig. 16c). Obviously, no second O4 maximum is present at −85∘ azimuth, indicating that the aerosol load seen in small elevation angles changes with the viewing azimuth. In particular, the observed maximum in O4 slant columns at −25∘ azimuth indicates smaller aerosol loads close to the ground (longer light paths) in this direction. As a result, almucantar scans in small elevation angles should not be used to retrieve aerosol information.
In order to quantify this finding, Fig. 16a shows two specific azimuthal distributions of measured (solid) and simulated (dashed) O4, i.e., two horizontal cross sections of Fig. 15b and c, for elevation angles of 4 and 25∘ (solar almucantar), respectively. While the agreement between measurement and simulation is very good in 25∘ elevation, differences in 4∘ are much larger, both in absolute values and in shape. Figure 16b shows the same data but plotted as a function of scattering angle. The solid line represents scattering angles counterclockwise from the position of the sun (SAA = 125∘) and the dashed line clockwise. For the solar almucantar, both lines agree quite well with each other as well as with the simulation (green line), indicating that the aerosol seen in 25∘ elevation is rather homogeneous around the measurement site and aerosol parameters used in the simulation are realistic. In contrast, the 4∘ almucantar does not match the simulation and – more importantly – O4 columns observed clockwise from the incoming direction show severe differences and another shape than those recorded counterclockwise. This cannot be explained with the aerosol phase function, which is symmetrical. This supports the conclusion that inhomogeneous aerosol content around the measurement site is seen in 4∘ elevation, i.e., close to the ground. This is furthermore supported by aerosol extinction profiles retrieved with BOREAS (Fig. 17) showing smaller values close to the ground between −50 and 25∘ azimuth. However, the BOREAS aerosol retrieval for this day is challenging due to the relatively small absolute aerosol load (AOD ≈ 0.2), and consequently Fig. 17 should not be overinterpreted (the general patterns appear to be reliable, but individual values should be regarded with care).
To elaborate a threshold of usable almucantars and to test their potential for aerosol retrievals, various SCIATRAN simulations have been performed based on different aerosol parameters. For each set of parameters, resulting correlation coefficients between measured and simulated O4 azimuthal distributions are shown in Fig. 16d as a function of elevation angle. Aerosol parameters leading to largest correlations are then compared to independently measured quantities from the AERONET station.
The blue curve in Fig. 16d corresponds to the original simulation shown in the previous plots using g=0.75 and SSA=0.95. For small elevations, correlation coefficients increase rapidly. This is due to a combination of the observed obstruction by trees discussed above and true inhomogeneities of the O4 azimuthal variation. The steep increase is followed by a much shallower increase until a plateau is reached at ≈10∘. For very large elevations >30∘, correlation coefficients decrease slightly, most likely as an effect of smaller O4 columns and thus poorer statistics.
It is found that changes in the SSA (red line) lead to almost the same results; i.e., the pure analysis of the shape of O4 columns at a specific almucantar is (not surprisingly) insensitive to the SSA.
The green and the magenta line were performed with the same SSA as the original simulation but larger asymmetry factors g. Resulting correlation coefficients are clearly smaller.
To conclude, the variation of O4 columns along almucantars contains information about the asymmetry factor g. As can be seen from Fig. 16d, the value of g=0.75 measured by the close-by AERONET station leads to the largest correlation coefficients. However, it should be mentioned that simulations using smaller asymmetry factors (not plotted) show a similar performance unless g reaches very small values (g<0.5). Consequently, the simple approach of using correlation coefficients as performed here is not a sufficient way to determine g with good precision. However, the potential of using O4 (ideally together with intensity) in more sophisticated retrievals appears to be promising.
For the two initial research questions the following can be concluded:
-
In general, different almucantars recorded simultaneously by IMPACT have slightly different scattering angles, meaning that the information content they provide is not redundant. Consequently, these almucantars have a potential to be used in future retrievals of the aerosol phase function. In particular, use of almucantar O4 columns turned out to contain information about the asymmetry factor g but to be insensitive to the SSA.
-
As a compromise, 10∘ elevation appears to be a reasonable threshold for deriving aerosol phase function information from almucantar O4 measurements. Note that this threshold corresponds to the special conditions during the analyzed case study (AOD, aerosol profile, weather and viewing conditions, etc.) as well as the true spatial homogeneity around the measurement location. However, results may be representative for semirural sites like Cabauw where the aerosol profile is assumed to be rather spatially constant. Within cities, the spatial variability of aerosols will be much larger, and therefore more of the lower almucantars would have to be excluded. As a recipe for unclear aerosol conditions, checking the agreement between measured O4 columns obtained clockwise and counterclockwise from the SAA (as in Fig. 16b) gives a first indication, whether data from the respective elevation angle can be used or not.
An advanced imaging-DOAS instrument (IMPACT) has been developed at the Institute of Environmental Physics of the University of Bremen. In contrast to most imaging-DOAS instruments reported thus far, IMPACT is not restricted to selected scenes but provides full-azimuthal coverage around the measurement site. Azimuthal pointing is performed stepwise by a motor while observations in 50 elevation angles are performed simultaneously due to the imaging capabilities. As a result, a complete panoramic scan is achieved in ∼15 min, allowing the retrieval of tropospheric trace gas profiles around the measurement site at high temporal resolution. In terms of robustness and flexible setup, IMPACT has similar advantages to those of the state-of-the-art MAX-DOAS instruments as a result of separating indoor (spectrometer) and outdoor (light-collecting) parts.
The instrument took part in the CINDI-2 intercomparison field campaign in Cabauw, the Netherlands, in September 2016, where an overall excellent agreement with MAX-DOAS measurements was obtained (correlation >99 % for coincident observations). In contrast to MAX-DOAS, IMPACT is able to resolve the temporal variation of NO2 slant columns in a fixed azimuth direction, which was observed to be as large as 20 % during a MAX-DOAS scanning sequence (10–15 min) in a case study under good weather and viewing conditions. This temporal variation of NO2 is present in profiles retrieved from IMPACT measurements as well, and corresponding surface concentrations of NO2 showed even larger changes of up to 40 %. This variation is missed by the MAX-DOAS profile that agrees better with IMPACT profiles acquired first, as a consequence of the scanning sequence which starts with small elevations containing most information.
The azimuthal distribution of NO2 around the measurement site was found to be very homogeneous on a long-term scale (campaign average) but highly variable on shorter timescales (snapshots). In small elevations, relative differences of NO2 slant columns up to ∼120 % (on average 35 %) were observed within one hemispheric scan. In conclusion, measurements in one direction are not enough to characterize tropospheric NO2, which is in particular crucial for MAX-DOAS validation of tropospheric NO2 from satellites.
The variability of the NO2 observed is best explained by the transport of pollution. Due to the fast data acquisition and full-azimuthal coverage of IMPACT, the trajectory of an exemplary NO2 transport event could be derived, and its most probable source region was identified in the vicinity of the measurement station (nearby industrial park or village of Lopik). This is supported by BOREAS profile inversions showing increasing NO2 concentrations close to the ground in the azimuthal direction of the trajectory's origin (the assumed source). The NO2 plume is then uplifted and transported along the measurement site in agreement with the trajectory derived before.
The comparison of measured and simulated O4 slant columns demonstrated the huge impact of aerosols on radiative transfer and thus the need to accurately consider them in air mass factor calculations and profile inversions. The azimuthal distribution of O4 columns was found to be sensitive to the asymmetry factor g, and for a test case, a simple trial-and-error retrieval was performed reproducing the value of g from a nearby AERONET station. As a further advantage, IMPACT is not limited to the solar almucantar as many elevations and therefore several almucantars are measured simultaneously. Each recorded almucantar observes slightly different scattering angles and provides therefore complementary information. However, care must be taken as for small elevations the influence area (i.e., the spatial region around the measurement site from which information is collected) is increasing. Thus, inhomogeneities of the aerosol distribution around the measurement site were found especially for elevation angles <10∘. Consequently, only almucantars with >10∘ elevation should be used in retrievals of aerosol phase functions. It is important to note that this holds true for specific conditions during CINDI-2 and the spatial aerosol variability at Cabauw. Nevertheless, Cabauw is believed to be representative for semirural environments. For use in different environments, the agreement between O4 columns clockwise and counterclockwise to the SAA should be checked before corresponding data are used in an aerosol phase function retrieval.
In summary, the added value of full-panoramic imaging-DOAS sensors like IMPACT, in comparison to MAX-DOAS instruments, is predominantly the ability to resolve the spatial and temporal trace gas variability around the measurement site, which has been demonstrated here for NO2. Thus, as a perspective for future applications, full-panoramic imaging-DOAS sensors have a large potential in particular for satellite validation activities, as for this purpose knowledge of the variability of trace gases around the measurement site (i.e., within a satellite pixel) is crucial.
IMPACT and MAX-DOAS raw data, slant columns, and profiles are provided upon request from the authors. The meteorological data can be accessed from the Cabauw experimental site for atmospheric research (CESAR) database website (http://www.cesar-database.nl/SearchDataset.do, last access: 25 July 2019). Aerosol data can be obtained from the AERONET website (https://aeronet.gsfc.nasa.gov/, last access: 25 July 2019).
EP, ASc and AR designed the sensor; EP, MO, ASe and SFS built, set up and operated the instrument during the CINDI-2 campaign. TB supported the instrument operation during CINDI-2 and performed the profile retrieval using BOREAS. FW and MV supported the instrument design and operation during CINDI-2. AR developed the DOAS retrieval code and supported the campaign organization. MV and JPB supported data interpretation. JSH operated the AERONET station located in Cabauw and provided complementary aerosol data. All authors contributed to the writing of the paper.
The authors declare that they have no conflict of interest.
We thank KNMI for organizing and hosting the CINDI-2 campaign and the CESAR test site team for their support and providing helpful complementary data. The Max Plank Institute for Chemistry, Mainz, provided dedicated Xenon lamp measurements, allowing us to perform pointing calibration, which was crucial for the analysis of the IMPACT measurements – many thanks in particular to Sebastian Donner, Jonas Kuhn and Thomas Wagner, who operated the lamp for long time periods in the field. We also acknowledge AERONET-Europe/ACTRIS for calibration and maintenance services – the research leading to these results has received funding from European Union's Horizon 2020 research and innovation program under grant agreement no. 654109. For the provision of mean pressure and temperature profiles used within the BOREAS retrieval, we thank François Hendrick and Marc Allaart. Financial support was provided by the University of Bremen and the EU-QA4ECV project. Further financial support through an M8 postdoc project from the University of Bremen Institutional Strategy in the framework of the Excellence Initiative is gratefully acknowledged. Mihalis Vrekoussis acknowledges support from the DFG-Research Center/Cluster of Excellence “The Ocean in the Earth System-MARUM”. Part of the computations were performed on the HPC cluster Aether at the University of Bremen, financed by DFG as part of the Excellence Initiative. ESA support for participation in CINDI-2 is gratefully acknowledged. Finally, we thank Udo Frieß and two anonymous referees for their efforts.
The article processing charges for this open-access publication were covered by the University of Bremen.
This paper was edited by Udo Frieß and reviewed by two anonymous referees.
Bobrowski, N., Hönninger, G., Lohberger, F., and Platt, U.: IDOAS: A new monitoring technique to study the 2-D distribution of volcanic gas emissions, J. Volcanol. Geoth. Res., 150, 329–338, https://doi.org/10.1016/j.jvolgeores.2005.05.004, 2006. a
Bösch, T., Rozanov, V., Richter, A., Peters, E., Rozanov, A., Wittrock, F., Merlaud, A., Lampel, J., Schmitt, S., de Haij, M., Berkhout, S., Henzing, B., Apituley, A., den Hoed, M., Vonk, J., Tiefengraber, M., Müller, M., and Burrows, J. P.: BOREAS – a new MAX-DOAS profile retrieval algorithm for aerosols and trace gases, Atmos. Meas. Tech., 11, 6833–6859, https://doi.org/10.5194/amt-11-6833-2018, 2018. a, b, c
Brewer, A. W., McElroy, C. T., and Kerr, J. B.: Nitrogen Dioxide Concentrations in the Atmosphere, Nature Phys. Sci., 246, 129–133, 1973. a
Burrows, J. P., Weber, M., Buchwitz, M., Rozanov, V., Ladstatter-Weissenmayer, A., Richter, A., DeBeek, R., Hoogen, R., Bramstedt, K., Eichmann, K. U., and Eisinger, M.: The global ozone monitoring experiment (GOME): Mission concept and first scientific results, J. Atmos. Sci., 56, 151–175, 1999. a
Dobson, G. M. B. and Harrison, D. N.: Measurements of the amount of ozone in the Earth's atmosphere and its relation to other geophysical conditions, in: Proc. R. Soc. Lond. A, 660–693, London, 1926. a
Donner, S., Kuhn, J., Van Roozendael, M., Bais, A., Beirle, S., Bösch, T., Bognar, K., Bruchkousky, I., Chan, K. L., Drosoglou, T., Fayt, C., Frieß, U., Hendrick, F., Hermans, C., Jin, J., Li, A., Ma, J., Peters, E., Pinardi, G., Richter, A., Schreier, S. F., Seyler, A., Strong, K., Tirpitz, J.-L., Wang, Y., Xie, P., Xu, J., Zhao, X., and Wagner, T.: Evaluating different methods for elevation calibration of MAX-DOAS instruments during the CINDI-2 campaign, Atmos. Meas. Tech. Discuss., https://doi.org/10.5194/amt-2019-115, in review, 2019. a
Dubovik, O. and King, M. D.: A flexible inversion algorithm for retrieval of aerosol optical properties from Sun and sky radiance measurements, J. Geophys. Res.-Atmos., 105, 20673–20696, https://doi.org/10.1029/2000JD900282, 2000. a
Frieß, U., Monks, P. S., Remedios, J. J., Rozanov, A., Sinreich, R., Wagner, T., and Platt, U.: MAX-DOAS O4 measurements: A new technique to derive information on atmospheric aerosols: 2. Modeling studies, J. Geophys. Res., 111, D14203, https://doi.org/10.1029/2005JD006618, 2006. a
Grainger, J. F. and Ring, J.: Anomalous Fraunhofer Line Profiles, Nature, 193, 762, https://doi.org/10.1038/193762a0, 1962. a
Hendrick, F., Pinardi, G., Roozendael, M. V., Apituley, A., Piters, A., Richter, A., Wagner, T., Kreher, K., Friess, U., and Lampel, J.: Fiducial Reference Measurements for Ground-Based DOAS Air-Quality Deliverable D13: Intercomparison Campaign Planning Document, 2016. a
Heue, K.-P., Wagner, T., Broccardo, S. P., Walter, D., Piketh, S. J., Ross, K. E., Beirle, S., and Platt, U.: Direct observation of two dimensional trace gas distributions with an airborne Imaging DOAS instrument, Atmos. Chem. Phys., 8, 6707–6717, https://doi.org/10.5194/acp-8-6707-2008, 2008. a
Holben, B. N., Eck, T., Slutsker, I., Tanré, D., Buis, J., Setzer, A., Vermote, E., Reagan, J., Kaufman, Y., Nakajima, T., Lavenu, F., Jankowiak, I., and Smirnov, A.: AERONET-A Federated Instrument Network and Data Archive for Aerosol Characterization, Remote Sens. Environ., 66, 1–16, 1998. a
Hönninger, G., von Friedeburg, C., and Platt, U.: Multi axis differential optical absorption spectroscopy (MAX-DOAS), Atmos. Chem. Phys., 4, 231-254, https://doi.org/10.5194/acp-4-231-2004, 2004. a, b
Kampa, M. and Castanas, E.: Human health effects of air pollution, Environ. Pollut., 151, 362–367, https://doi.org/10.1016/j.envpol.2007.06.012, 2008. a
Kreher, K., Van Roozendael, M., Hendrick, F., Apituley, A., Dimitropoulou, E., Frieß, U., Richter, A., Wagner, T., Abuhassan, N., Ang, L., Anguas, M., Bais, A., Benavent, N., Bösch, T., Bognar, K., Borovski, A., Bruchkovsky, I., Cede, A., Chan, K., Donner, S., Drosoglou, T., Fayt, C., Finkenzeller, H., Garcia-Nieto, D., Gielen, C., Gómez-Martín, L., Hao, N., Herman, J., Hermans, C., Hoque, S., Irie, H., Jin, J., Johnston, P., Butt, J. K., Khokhar, F., Koenig, T., Kuhn, J., Kumar, V., Lampel, J., Liu, C., Ma, J., Merlaud, A., Mishra, A. K., Müller, M., Navarro-Comas, M., Ostendorf, M., Pazmino, A., Peters, E., Pinardi, G., Pinharanda, M., Piters, A., Platt, U., Postylyakov, O., Prados-Roman, C., Puentedura, O., Querel, R., Saiz-Lopez, A., Schönhardt, A., Schreier, S., Seyler, A., Sinha, V., Spinei, E., Strong, K., Tack, F., Tian, X., Tiefengraber, M., Tirpitz, J.-L., van Gent, J., Volkamer, R., Vrekoussis, M., Wang, S., Wang, Z., Wenig, M., Wittrock, F., Xie, P., Xu, J., Yela, M., Zhang, C., and Zhao, X.: Intercomparison of NO2, O4, O3 and HCHO slant column measurements by MAX-DOAS and zenith-sky UV-Visible spectrometers during the CINDI-2 campaign, submitted, Atmos. Meas. Tech. Discuss., 2019. a, b, c, d
Lee, D. S.,Köhler, I., Grobler, E., Rohrer, F., Sausen, R., Gallardo-Klenner, L., Olivier, J. G. J., Dentener, F. J., and Bouwman, A. F.: Estimations of Global NOx Emissions and their Uncertainties, Atmos. Environ., 31, 1735–1749, 1997. a
Lee, H., Kim, Y. J., Jung, J., Lee, C., Heue, K. P., Platt, U., Hu, M., and Zhu, T.: Spatial and temporal variations in NO2 distributions over Beijing, China measured by imaging differential optical absorption spectroscopy, J. Environ. Manage., 90, 1814–1823, https://doi.org/10.1016/j.jenvman.2008.11.025, 2009. a
Lelieveld, J., Beirle, S., Hörmann, C., Stenchikov, G., and Wagner, T.: Abrupt recent trend changes in atmospheric nitrogen dioxide over the Middle East, Sci. Adv., 1, 1–5, https://doi.org/10.1126/sciadv.1500498, 2015. a
Lohberger, F., Hönninger, G., and Platt, U.: Ground-based imaging differential optical absorption spectroscopy of atmospheric gases, Appl. Opt., 43, 4711–4717, 2004. a
Manago, N., Takara, Y., Ando, F., Noro, N., Suzuki, M., Irie, H., and Kuze, H.: Visualizing spatial distribution of atmospheric nitrogen dioxide by means of hyperspectral imaging, Appl. Opt., 57, 5970–5977, 2018. a
Noxon, J. F.: Nitrogen-Dioxide in Stratosphere and Troposphere Measured by Ground-Based Absorption Spectroscopy, Science, 189, 547–549, 1975. a
Ortega, I., Koenig, T., Sinreich, R., Thomson, D., and Volkamer, R.: The CU 2-D-MAX-DOAS instrument – Part 1: Retrieval of 3-D distributions of NO2 and azimuth-dependent OVOC ratios, Atmos. Meas. Tech., 8, 2371–2395, https://doi.org/10.5194/amt-8-2371-2015, 2015. a, b
Ostendorf, M.: IMPACT – A new ground-based imaging DOAS instrument: Development, participation at the CINDI-2 campaign and first data analysis, Master thesis, University of Bremen, 2017. a
Perner, D., Ehhalt, D. H., Patz, H. W., Platt, U., Röth, E. P., and Volz, A.: OH – Radicals in the lower Troposphere, Geophys. Res. Lett., 3, 466–468, 1976. a
Peters, E., Wittrock, F., Großmann, K., Frieß, U., Richter, A., and Burrows, J. P.: Formaldehyde and nitrogen dioxide over the remote western Pacific Ocean: SCIAMACHY and GOME-2 validation using ship-based MAX-DOAS observations, Atmos. Chem. Phys., 12, 11179–11197, https://doi.org/10.5194/acp-12-11179-2012, 2012. a, b
Peters, E., Wittrock, F., Richter, A., Alvarado, L. M. A., Rozanov, V. V., and Burrows, J. P.: Liquid water absorption and scattering effects in DOAS retrievals over oceans, Atmos. Meas. Tech., 7, 4203–4221, https://doi.org/10.5194/amt-7-4203-2014, 2014. a
Piters, A. J. M., Boersma, K. F., Kroon, M., Hains, J. C., Van Roozendael, M., Wittrock, F., Abuhassan, N., Adams, C., Akrami, M., Allaart, M. A. F., Apituley, A., Beirle, S., Bergwerff, J. B., Berkhout, A. J. C., Brunner, D., Cede, A., Chong, J., Clémer, K., Fayt, C., Frieß, U., Gast, L. F. L., Gil-Ojeda, M., Goutail, F., Graves, R., Griesfeller, A., Großmann, K., Hemerijckx, G., Hendrick, F., Henzing, B., Herman, J., Hermans, C., Hoexum, M., van der Hoff, G. R., Irie, H., Johnston, P. V., Kanaya, Y., Kim, Y. J., Klein Baltink, H., Kreher, K., de Leeuw, G., Leigh, R., Merlaud, A., Moerman, M. M., Monks, P. S., Mount, G. H., Navarro-Comas, M., Oetjen, H., Pazmino, A., Perez-Camacho, M., Peters, E., du Piesanie, A., Pinardi, G., Puentedura, O., Richter, A., Roscoe, H. K., Schönhardt, A., Schwarzenbach, B., Shaiganfar, R., Sluis, W., Spinei, E., Stolk, A. P., Strong, K., Swart, D. P. J., Takashima, H., Vlemmix, T., Vrekoussis, M., Wagner, T., Whyte, C., Wilson, K. M., Yela, M., Yilmaz, S., Zieger, P., and Zhou, Y.: The Cabauw Intercomparison campaign for Nitrogen Dioxide measuring Instruments (CINDI): design, execution, and early results, Atmos. Meas. Tech., 5, 457–485, https://doi.org/10.5194/amt-5-457-2012, 2012. a
Platt, U. and Stutz, J.: Differential Optical Absorption Spectroscopy: Principles and Applications, Springer Verlag, Berlin Heidelberg, https://doi.org/10.1007/978-3-540-75776-4 , 2008. a
Platt, U., Perner, D., and Pätz, H. W.: Simultaneous measurement of atmospheric CH2O, O3, and NO2 by differential optical absorption, J. Geophys. Res.-Oceans, 84, 6329–6335, https://doi.org/10.1029/JC084iC10p06329, 1979. a
Popp, C., Brunner, D., Damm, A., Van Roozendael, M., Fayt, C., and Buchmann, B.: High-resolution NO2 remote sensing from the Airborne Prism EXperiment (APEX) imaging spectrometer, Atmos. Meas. Tech., 5, 2211–2225, https://doi.org/10.5194/amt-5-2211-2012, 2012. a
Richter, A., Burrows, J. P., Nüß, H., Granier, C., and Niemeier, U.: Increase in tropospheric nitrogen dioxide over China observed from space, Nature, 437, 129–132, 2005. a
Roscoe, H. K., Van Roozendael, M., Fayt, C., du Piesanie, A., Abuhassan, N., Adams, C., Akrami, M., Cede, A., Chong, J., Clémer, K., Friess, U., Gil Ojeda, M., Goutail, F., Graves, R., Griesfeller, A., Grossmann, K., Hemerijckx, G., Hendrick, F., Herman, J., Hermans, C., Irie, H., Johnston, P. V., Kanaya, Y., Kreher, K., Leigh, R., Merlaud, A., Mount, G. H., Navarro, M., Oetjen, H., Pazmino, A., Perez-Camacho, M., Peters, E., Pinardi, G., Puentedura, O., Richter, A., Schönhardt, A., Shaiganfar, R., Spinei, E., Strong, K., Takashima, H., Vlemmix, T., Vrekoussis, M., Wagner, T., Wittrock, F., Yela, M., Yilmaz, S., Boersma, F., Hains, J., Kroon, M., Piters, A., and Kim, Y. J.: Intercomparison of slant column measurements of NO2 and O4 by MAX-DOAS and zenith-sky UV and visible spectrometers, Atmos. Meas. Tech., 3, 1629–1646, https://doi.org/10.5194/amt-3-1629-2010, 2010. a, b
Rothman, L. S., Gordon, I. E., Barber, R. J., Dothe, H., Gamache, R. R., Goldman, A., Perevalov, V. I., Tashkun, S. A., and Tennyson, J.: HITEMP, the high-temperature molecular spectroscopic database, J. Quant. Spectrosc. Ra., 111, 2139–2150, https://doi.org/10.1016/j.jqsrt.2010.05.001, 2010. a
Rozanov, V. V., Rozanov, A. V., Kokhanovsky, A. A., and Burrows, J. P.: Radiative transfer through terrestrial atmosphere and ocean: Software package SCIATRAN, J. Quant. Spectrosc. Ra., 133, 13–71, 2014. a, b
Schönhardt, A., Altube, P., Gerilowski, K., Krautwurst, S., Hartmann, J., Meier, A. C., Richter, A., and Burrows, J. P.: A wide field-of-view imaging DOAS instrument for two-dimensional trace gas mapping from aircraft, Atmos. Meas. Tech., 8, 5113–5131, https://doi.org/10.5194/amt-8-5113-2015, 2015. a
Serdyuchenko, A., Gorshelev, V., Weber, M., Chehade, W., and Burrows, J. P.: High spectral resolution ozone absorption cross-sections – Part 2: Temperature dependence, Atmos. Meas. Tech., 7, 625–636, https://doi.org/10.5194/amt-7-625-2014, 2014. a
Seyler, A., Meier, A. C., Wittrock, F., Kattner, L., Mathieu-Üffing, B., Peters, E., Richter, A., Ruhtz, T., Schönhardt, A., Schmolke, S., and Burrows, J. P.: Studies of the horizontal inhomogeneities in NO2 concentrations above a shipping lane using ground-based MAX-DOAS and airborne imaging DOAS measurements, Atmos. Meas. Tech. Discuss., https://doi.org/10.5194/amt-2018-348, in review, 2018. a
Shaiganfar, R., Beirle, S., Sharma, M., Chauhan, A., Singh, R. P., and Wagner, T.: Estimation of NOx emissions from Delhi using Car MAX-DOAS observations and comparison with OMI satellite data, Atmos. Chem. Phys., 11, 10871–10887, https://doi.org/10.5194/acp-11-10871-2011, 2011. a
Shefov, N.: Intensivnosti nokotorykh emissiy sumerochnogo i nochnogo neba (Intensities of some Emissions of the Twilight and Night Sky), Spectral, electrophotometrical and radar researches of aurorae and airglow, IGY program, section IV, 1, 25, 1959. a
Shetter, R. E., Stedman, D. H., and West, D. H.: The photostationary state in Claremont, California, J. Air Pollut. Control Assoc., 33, 212–214, https://doi.org/10.1080/00022470.1983.10465566, 1983. a
Sinreich, R., Coburn, S., Dix, B., and Volkamer, R.: Ship-based detection of glyoxal over the remote tropical Pacific Ocean, Atmos. Chem. Phys., 10, 11359–11371, https://doi.org/10.5194/acp-10-11359-2010, 2010. a
Thalman, R. and Volkamer, R.: Temperature dependent absorption cross-sections of O2-O2 collision pairs between 340 and 630 nm and at atmospherically relevant pressure, Phys. Chem. Chem. Phys., 15, 15371–15381, https://doi.org/10.1039/c3cp50968k, 2013. a
Vandaele, A. C., Hermans, C., Simon, P. C., Van Roozendael, M., Guilmot, J. M., Carleer, M., and Colin, R.: Fourier Transform Measurement of NO2 Absorption Cross-Section in the Visible Range at Room Temperature, J. Atmos. Chem., 25, 289–305, 1996. a
Vountas, M., Rozanov, V. V., and Burrows, J. P.: Ring effect: Impact of Rotational Raman scattering on radiative transfer in earth's atmosphere, J. Quant. Spectrosc. Ra., 60, 943–961, 1998. a
Wagner, T., Von Friedeburg, C., Wenig, M., Otten, C., and Platt, U.: UV-visible observations of atmospheric O4 absorptions using direct moonlight and zenith-scattered sunlight for clear-sky and cloudy sky conditions, J. Geophys. Res., 107, https://doi.org/10.1029/2001JD001026, 2002. a
Wagner, T., Dix, B., von Friedeburg, C., Friess, U., Sanghavi, S., Sinreich, R., and Platt, U.: MAX-DOAS O4 measurements: A new technique to derive information on atmospheric aerosols – Principles and information content, J. Geophys. Res., 109, 2004. a
Wittrock, F., Oetjen, H., Richter, A., Fietkau, S., Medeke, T., Rozanov, A., and Burrows, J. P.: MAX-DOAS measurements of atmospheric trace gases in Ny-Ålesund - Radiative transfer studies and their application, Atmos. Chem. Phys., 4, 955–966, https://doi.org/10.5194/acp-4-955-2004, 2004. a
Note, an almucantar is a circle on the celestial sphere parallel to the horizon. The almucantar containing the sun, i.e., having the sun's elevation, is the solar almucantar. Within the community, both terms are frequently used synonymously, but it is important to distinguish here because IMPACT measures in many elevations at the same time, i.e., records many almucantars when measuring in different azimuths.