the Creative Commons Attribution 4.0 License.
the Creative Commons Attribution 4.0 License.
 | 21 Aug 2019
An IBBCEAS system for atmospheric measurements of glyoxal and methylglyoxal in the presence of high NO2 concentrations
Jingwei Liu
Yiming Yang
Haichao Wang
Yusheng Wu
Xuewei Lu
Mindong Chen
Jianlin Hu
Xiaobo Fan
Limin Zeng
Yuanhang Zhang
A system based on incoherent broadband cavity-enhanced absorption spectroscopy (IBBCEAS) has been developed for simultaneous measurement of nitrogen dioxide (NO2), glyoxal (GLY), and methylglyoxal (MGLY). In this system, the measured light absorption at around 460 nm is spectrally resolved. The concentration of absorbers is determined from a multicomponent fit. At an integration time of 100 s, the measurement sensitivity (2σ) for NO2, GLY, and MGLY is 18, 30, and 100 ppt, respectively. The measurement uncertainty, which mainly originates from path length calibration, sampling loss, and uncertainty of absorption cross sections is estimated to be 8 % for NO2, 8 % for GLY, and 16 % for MGLY. When deploying the instrument during field observations, we found significant influence of NO2 on the spectra fitting for retrieving GLY and MGLY concentrations, which is caused by the fact that NO2 has a higher absorption cross section and higher ambient concentration. In order to minimize such an effect, a NO2 photolytic convertor (NPC), which removes sampled NO2 at an efficiency of 76 %, was integrated on the IBBCEAS system. Since sampled GLY and MGLY are mostly (≥95 %) conserved after passing through the NPC, the quality of the spectra fitting and the measurement accuracy of ambient GLY and MGLY under NO2-rich environments could be improved.
- Article
(4268 KB) -
Supplement
(1057 KB) - BibTeX
- EndNote


Glyoxal (CHOCHO, GLY) and methylglyoxal (CH3COCHO, MGLY) are typical atmospheric α-dicarbonyl species that primarily enter the atmosphere through direct emissions from biomass burning and the oxidation of volatile organic compounds such as isoprene, aromatics, and alkenes (Fu et al., 2008). Therefore, GLY and MGLY are suitable indicators of the atmospheric oxidation capacity (DiGangi et al., 2012). Atmospheric sinks of GLY and MGLY include photolysis and reactions with OH radicals (Volkamer et al., 2005a; Fu et al., 2008), which play an important role in the formation of both O3 and peroxyacetyl nitrate (PAN) (Müller et al., 2016). Furthermore, the contribution of GLY and MGLY to the formation of secondary organic aerosol (SOA) has drawn widespread attention in the past few years (Washenfelder et al., 2011; Nakao et al., 2012; Meng et al., 2018). Although GLY and MGLY have relatively low molecular weights, they can form oligomers and participate in SOA formation in aqueous particles (Yu et al., 2011; Hamilton et al., 2013). In order to develop an in-depth understanding of the above processes, fast online measurements of GLY and MGLY with good sensitivity and accuracy are required.
Techniques for online measurements of GLY and MGLY can typically be categorized as methods based on either mass spectrometry or absorption spectroscopy. While proton transfer reaction time-of-flight mass spectrometry (PTR-ToF-MS) is considered to be a good mass spectrometry technique for measuring volatile organic compounds (VOCs), its sensitivity is still too low to monitor the ambient concentration of GLY (Thalman et al., 2015; Stonner et al., 2017) and both (H2O)3H3O+ and acrylic acid (C3H4O2) can interfere with MGLY results because they have the same m∕z ratio (Thalman et al., 2015; Yuan et al., 2017; Zarzana et al., 2018). There are also many types of optical methods, including long path differential optical absorption spectroscopy (LP-DOAS) (Volkamer et al., 2005a), cavity-enhanced differential optical absorption spectroscopy (CE-DOAS) (Thalman and Volkamer, 2010), multi-axis differential optical absorption spectroscopy (MAX-DOAS) (Li et al., 2014), laser-induced phosphorescence (LIP) (Henry et al., 2012), incoherent broadband cavity-enhanced absorption spectroscopy (IBBCEAS) (Min et al., 2016), and methods using satellite techniques like the global ozone monitoring experiment (GOME) (Vrekoussis et al., 2010) and ozone monitoring instrument (OMI) (Chan Miller et al., 2014).
Since the first application of IBBCEAS by Fiedler (Fiedler et al., 2003), it has been widely used in laboratory studies and field campaigns to measure atmospheric trace gases such as H2O, O3, O4, IO, I2, OIO, SO2, NO2, NO3, N2O5, HONO, HCHO, GLY, and MGLY (Vaughan et al., 2008; Washenfelder et al., 2008; Thalman and Volkamer, 2010; Axson et al., 2011; Kahan et al., 2012; Min et al., 2016; Wang et al., 2017; Duan et al., 2018). The core part of the instrument is a high-finesse cavity that holds of a pair of high-reflectivity mirrors, which typically have reflectivity greater than 0.9999. Because of the unmodulated broadband light source and multichannel detector, the concentrations of trace gases that have absorption structures can be determined simultaneously. Washenfelder et al. were the first to use this technology to measure GLY. The precision (1σ) of their system is 29 ppt for a 1 min sampling time (Washenfelder et al., 2008). Under the same time resolution, Thalman and Volkamer reduced the detection limit (2σ) to 19 ppt by using their LED-CE-DOAS (Thalman and Volkamer, 2010). The above two systems have been successfully applied to GLY measurements in field campaigns (Washenfelder et al., 2011; Coburn et al., 2014). From aspects of miniaturization and improving time resolution, Min et al. optimized Washenfelder et al.'s IBBCEAS for aircraft GLY measurements. The demonstrated precision (2σ) for retrievals of GLY is 34 ppt over 5 s (Min et al., 2016). The IBBCEAS developed by Fang et al. has a precision (1σ) of 28 ppt for GLY at 1 min averaging time. By applying a Kalman filter to the retrieved concentrations, their measurement precision was improved to 8 ppt over 21 s (Fang et al., 2017). Within the range where GLY and MGLY have absorption structures, NO2, H2O, and O4 also have structured absorptions; the spectra fitting and resultant concentrations of these α-dicarbonyl species may have interferences from NO2 because NO2 has a strong absorption structure between 430 to 470 nm and the ambient concentration of NO2 is much higher than those of GLY and MGLY. Thalman et al. first encountered the challenge of fitting GLY and MGLY absorption spectra in the presence of high NO2 concentrations (Thalman et al., 2015). Liang et al. thought that the interference was caused by the accuracy of the convoluted NO2 absorption cross section and tried to solve this problem by measuring the NO2 cross section with their own spectrometer (Liang et al., 2019). In this case, the accuracy of the retrieved NO2 and GLY concentrations will be dependent on the accuracy of the NO2 cross section they measured.
In this study, we present an incoherent broadband cavity-enhanced absorption spectroscopy system for measuring GLY and MGLY and we describe the instrumental setup in detail. Instrumental sample loss was systematically determined using a novel, self-developed standard gas generator to supply GLY and MGLY and by combining our IBBCEAS with a NO2 photolytic converter developed in-house; laboratory tests and in situ measurements were performed to investigate the interference of NO2 on spectra fitting and measurements of GLY and MGLY. The accuracy of GLY and MGLY measurements in the presence of high NO2 concentrations is discussed in terms of both experimental results and spectral simulations.
Instruments used in this study include a multi-gas calibrator (146i, Thermo Fisher Scientific Inc., Waltham, MA, USA), a standard gas generator for GLY and MGLY, a NO2 photolytic converter (NPC), and a IBBCEAS. The first two instruments were used to supply and maintain a constant concentration of gas mixture, i.e., NO2 and either GLY or MGLY. The NPC was used to photolyze the majority of the NO2 in the mixed gas and the IBBCEAS was used as the detector for the three gases. Besides the multi-gas calibrator, the other three instruments were developed in our laboratory. The optical layout, flow system, and operation of our IBBCEAS are described in Sect. 2.1 and the details of standard gas generator and NPC are described in Sect. 2.2 and 2.3.
2.1 IBBCEAS
2.1.1 Optical layout
The optical layout of the IBBCEAS system consists of a light source module, an optical cavity module, and a detection module. The core of the light source module is a single-color LED (M450D3, Thorlabs, Newton, NJ, USA), centered at 445 nm with a full width at half maximum (FWHM) of 18 nm. The LED is powered by a constant current source and fixed on a heat sink connected to a thermostat in order to minimize fluctuations of its operating current and operating temperature. By setting appropriate PID (proportion integration differentiation) parameters of the thermostat, the operating temperature was stabilized at , in order to reduce the intensity drift and wavelength shift of the LED.
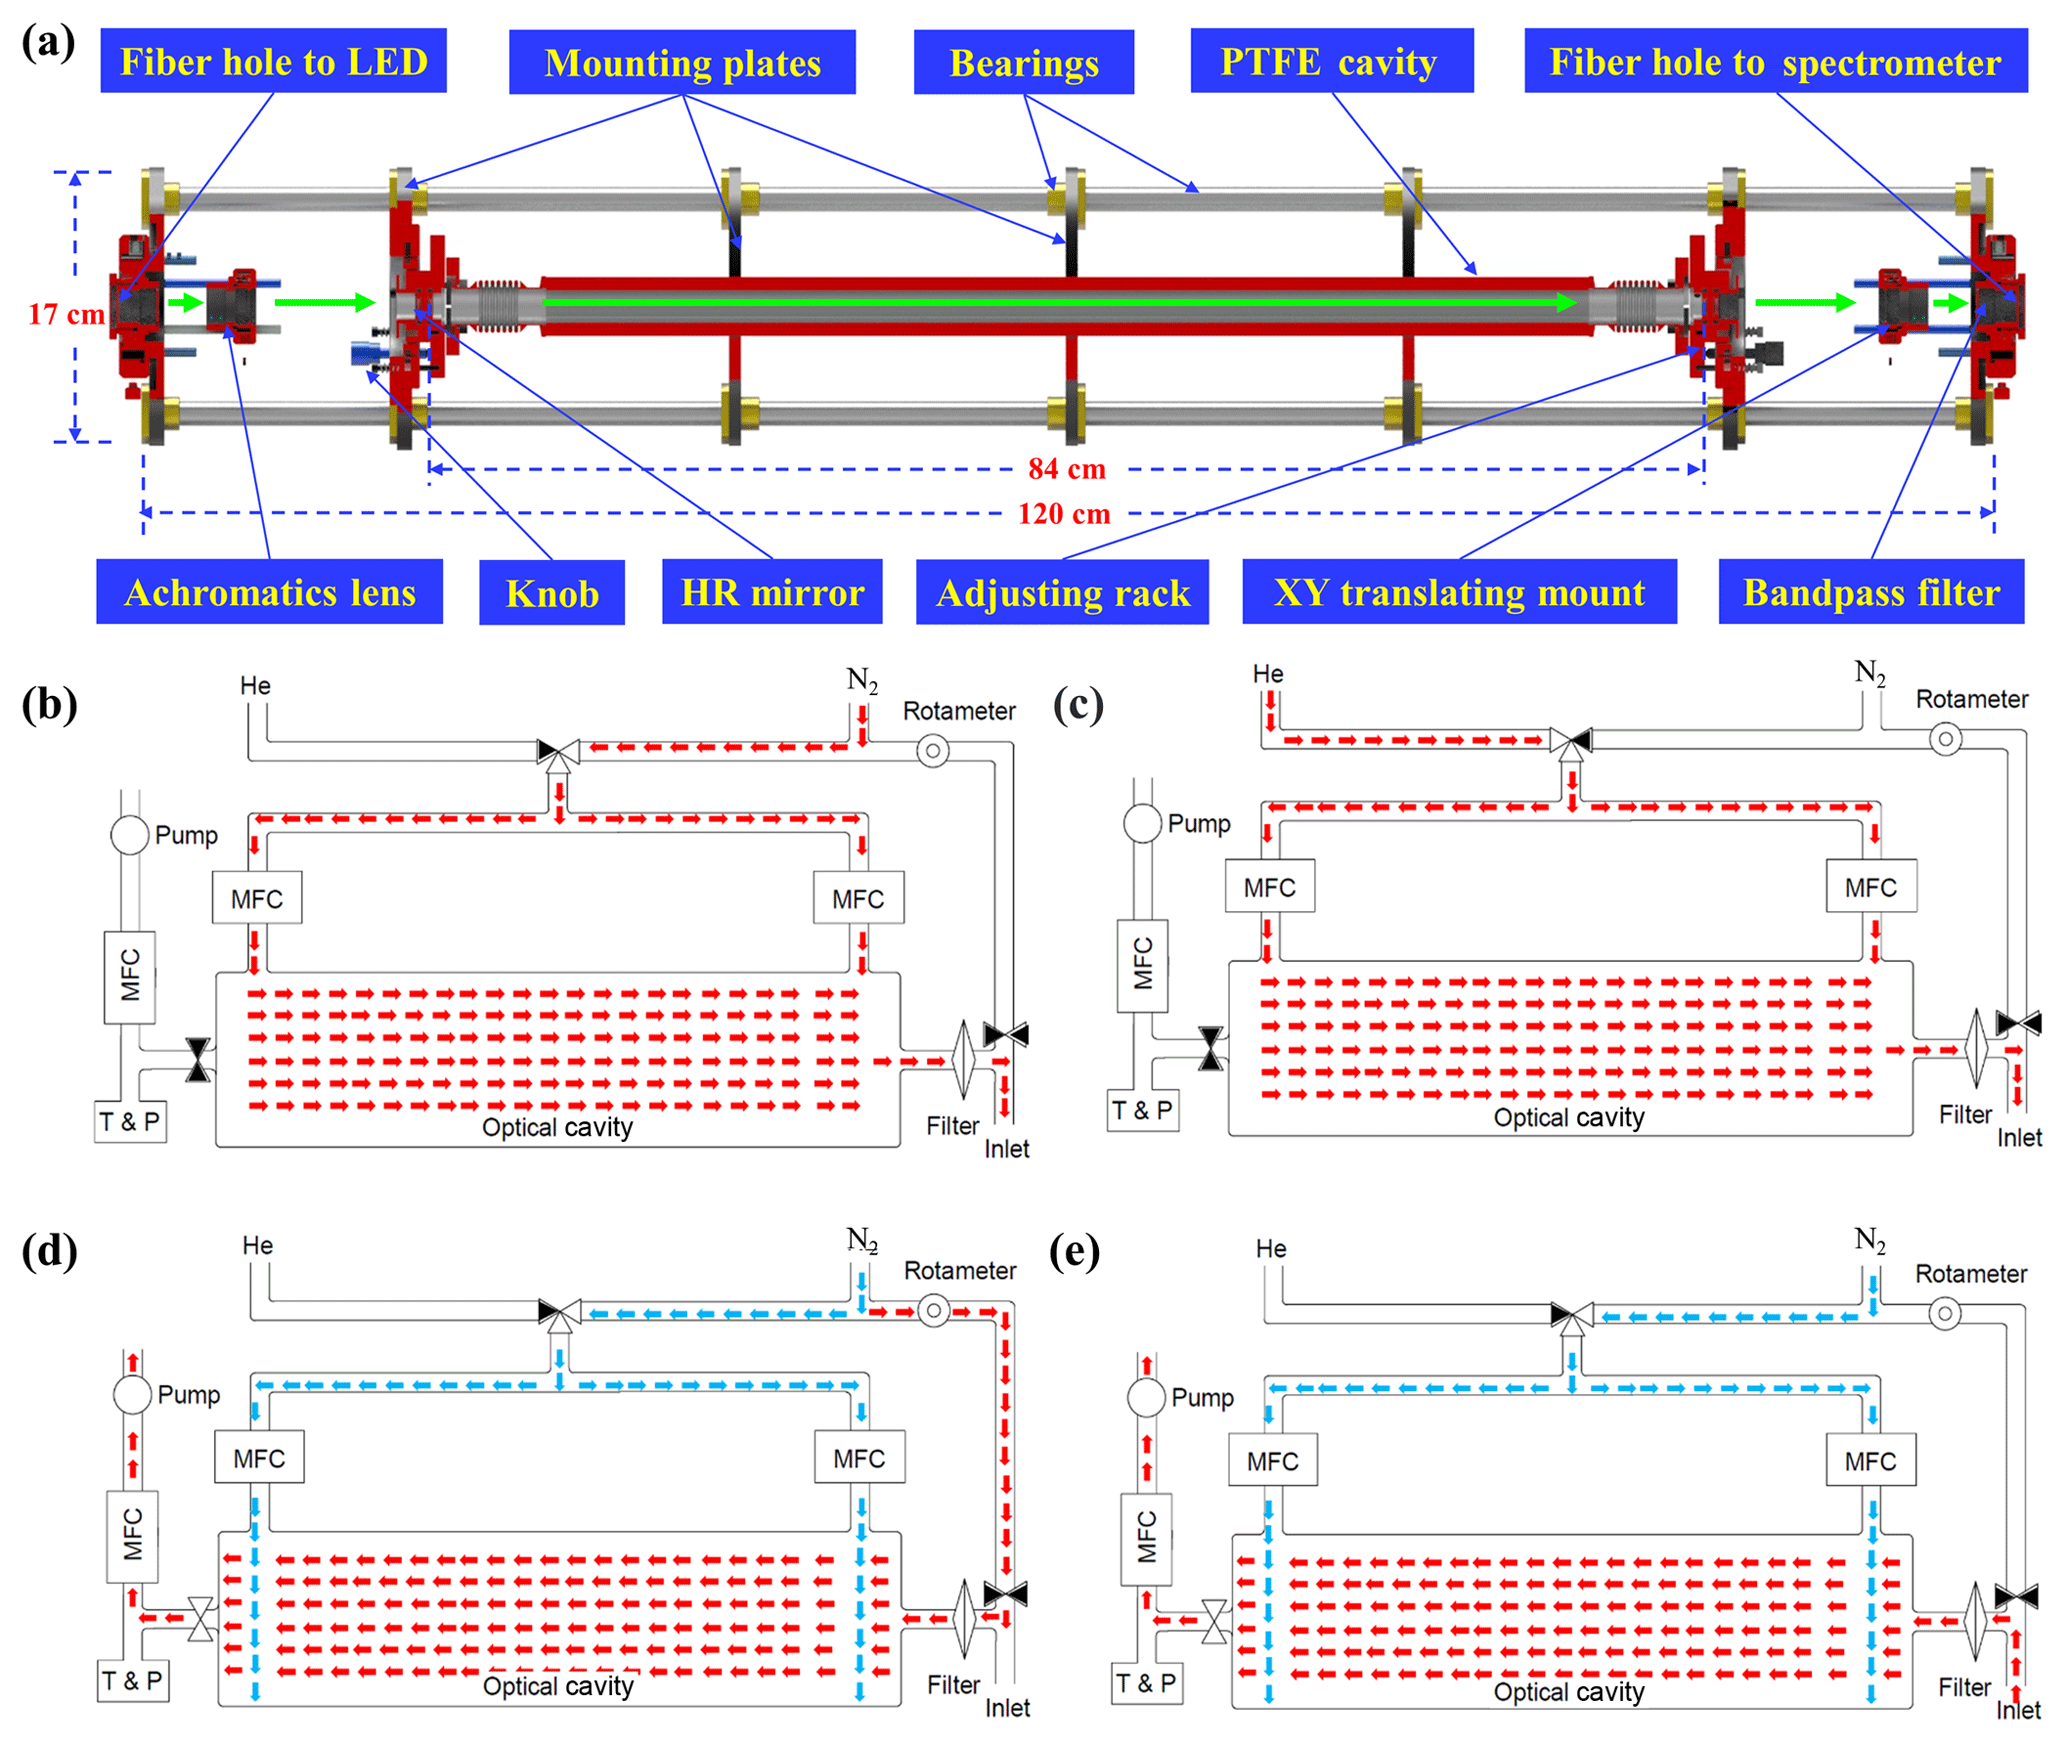
Figure 1(a) Optical cavity module of the IBBCEAS system. Schematic layout of the instrumental flow system depicting four working modes: (b) N2 mode, (c) He mode, (d) reference mode, and (e) sample mode. The N2 mode and He mode are used to calibrate mirror reflectivity and the reference mode and sample mode are used to calculate the concentrations of trace gases.
A schematic depiction of the main body of the optical cavity module, which consists of seven mounting plates and four stainless steel bearings, is shown in Fig. 1a. The mounting plates are used to fix optical components and the bearings are used to ensure the co-axiality of these components. The entire cavity module adopts the cage structure design to enhance the system stability; this design is more convenient for replacing parts and adjusting the optical path, which can improve system reproducibility. Light emitted from the LED is directed into the cavity module by an optical fiber (1606205, Avantes, Apeldoorn, the Netherlands), and before it is coupled to the cavity, the light is collimated by an achromatic lens (ACA254-030-A, Thorlabs, Newton, NJ, USA) with a 30.0 mm focal length, which is mounted on a XY translation mount (CXY1, Thorlabs, Newton, NJ, USA) to finely adjust its position in both the horizontal and vertical directions. Parallel light behind the lens is introduced into a high-finesse cavity formed by a pair of high-reflectivity mirrors (122330, Layertec GmbH, Mellingen, Germany) with a radius curvature of 1.0 m and a diameter of 25.0 mm. The distance between the mirrors is 84 cm and the reflectivity of the mirrors, which are each fixed on a customized adjusting rack to finely adjust their pitch and yaw, is reported to be greater than 0.9998 between 420 and 450 nm. There is a small hole in the adjusting rack for the purge gas to pass through and we typically use high-purity nitrogen (> 99.999 %) as the purge gas to protect the surface of mirrors. After passing through the cavity, light is focused by another achromatic lens (ACA254-050-A, Thorlabs, Newton, NJ, USA) with a 50.0 mm focal length and stray light behind this lens is eliminated by a bandpass filter (FF01-442/42-25, Semrock, NY, USA).
Light exits the cavity module through a fiber bundle (SR-OPT-8024, Andor Tech., Oxford Instruments, UK) that is coupled to the detection module, which is a grating spectrometer with a charge-coupled device (CCD) detector (Shamrock 303i, Andor Tech., Oxford Instruments, UK). The system uses 600 L mm−1 diffraction gratings (500 nm blaze) centered at 450 nm with wavelength coverage from 380 to 519 nm; the width of entrance slit is 100 µm and the corresponding wavelength resolution is 0.47 nm, which is determined by fitting the narrow emission line of a mercury lamp (Hg-1, Ocean Optics, Dunedin, FL, USA) at 435.84 nm. When operating the CCD detector, it is cooled to to prevent noise generated by dark current.
2.1.2 Flow system
As shown in Fig. 1, the IBBCEAS flow system includes an inlet tube, aerosol filter, optical cavity, temperature sensor, pressure sensor, rotary vane pump (50104, Thomas, Gardner Denver, Germany), rotameter, three mass flow controllers (MFCs), and three solenoid valves (6014, Bürkert, Ingelfingen, Germany). Since Teflon has the best GLY transmission efficiency (Min et al., 2016), the inlet tube, aerosol filter, and optical cavity were all constructed from Teflon.
After ambient air enters the IBBCEAS system through the fluorinated ethylene propylene (FEP) inlet tube, there is a polytetrafluoroethylene (PTFE) filter (25 µm thickness, 4.6 cm diameter, 2.5 µm pore size, Typris, China) to remove ambient aerosols. Gas passed through the filter is directed into the PTFE optical cavity (40.0 mm O.D., 20.0 mm I.D.) and its temperature and pressure are measured by the sensors after the cavity. The mass flow controller and a rotary vane pump at the end of the flow system maintain a constant gas flow rate through the cavity: 2 L min−1.
The solenoid valve separates a bypass line, which includes a rotameter that branches from the inlet tube in front of the PTFE filter; this bypass line is closed unless a reference spectrum is to be measured. The two remaining MFCs are used to control the flow rate of the two purge lines, through which either nitrogen or helium can enter the cavity module depending on which line has been opened by the solenoid valve. All valves and MFC flow rates are set automatically. Further operational details are given in the following sections.
2.1.3 Operation
The operation of the IBBCEAS system can be divided into four working modes, as shown in Fig. 1: measuring the spectrum of nitrogen (N2 mode), measuring the spectrum of helium (He mode), measuring reference spectra (reference mode), and measuring sample spectra (sample mode). The first two working modes are used to calculate the mirror reflectivity and the other two are used to calculate the concentrations of trace gases. The theoretical equations used for these calculations are given in Sect. 3.
The intensity of measured spectra take some time to stabilize when the gas in the cavity is switched from nitrogen to helium. The amount of time for intensity stabilization is inversely related to the helium flow rate into the cavity; we measured the time required for signal stabilization at five different helium flow rates: 100, 200, 300, 400, and 500 mL min−1. In order to reduce signal stabilization time and minimize signal fluctuation, we set the flow rate to 400 mL min−1, as it takes 2 min to achieve a stable signal. The signal also needs time to stabilize when the gas in the cavity is switched from the reference gas to sample air; we investigated a series of NO2 concentration gradients (105, 90, 70, and 50 ppb) as sample air to quantify this time. At least 20 s is required for four different concentrations of NO2 to reach steady state; therefore, we purged the cavity for 20 s when the system was switched between reference mode and sample mode. When operating our IBBCEAS system with the above settings, it typically takes 5 min to calibrate the reflectivity of the mirrors each day (2 min in N2 mode, 3 min in He mode) and 2 min h−1 to measure reference spectra in reference mode. For the rest of the day the system is operated in sample mode. Switching between the four working modes is done automatically by self-developed software. When the instrument is operating normally, the only thing that needs to be done manually is changing the aerosol filter every 12 or 24 h (depending on the concentration of particles in the sample air).
2.2 Standard gas generator for GLY and MGLY
Based on the methods described in previous studies (Washenfelder et al., 2008; Stonner et al., 2017), we designed a standard gas generator that uses high-purity nitrogen (> 99.999 %), a mass flow controller (F-201EV-MAD-22-V, 5 slm, Bronkhorst, the Netherlands), a U-type tube, a cold trap, on–off valves, three-way valves, a mixing chamber, a pump (50358, Thomas, Gardner Denver, Germany), and pure GLY or MGLY powder. The schematic setup of the standard gas generator is shown in Fig. S5 in the Supplement. The monomeric GLY and MGLY purification methods are the same as those described in the existing literature (Washenfelder et al., 2008; Pang et al., 2014). The operation of the standard gas generator is divided into the following three steps: (1) passing high-purity nitrogen over monomeric GLY or MGLY in the cold trap and transporting gaseous GLY or MGLY into the mix chamber; the temperature of cold trap ( C) is achieved by mixing dry ice and ethanol. (2) Rotating the three-way valves (V1 and V2) to make nitrogen enter the mix chamber directly to dilute gaseous GLY or MGLY. (3) Rotating the three-way valves (V3 and V4) and opening valve (V6) to connect the inlet and outlet of the mix chamber to the both ends of the air pump, which evenly mixes the GLY or MGLY with nitrogen. While the air pump material may absorb some GLY or MGLY, it does not affect the gas mixture in any way that will impair the subsequent experiments.
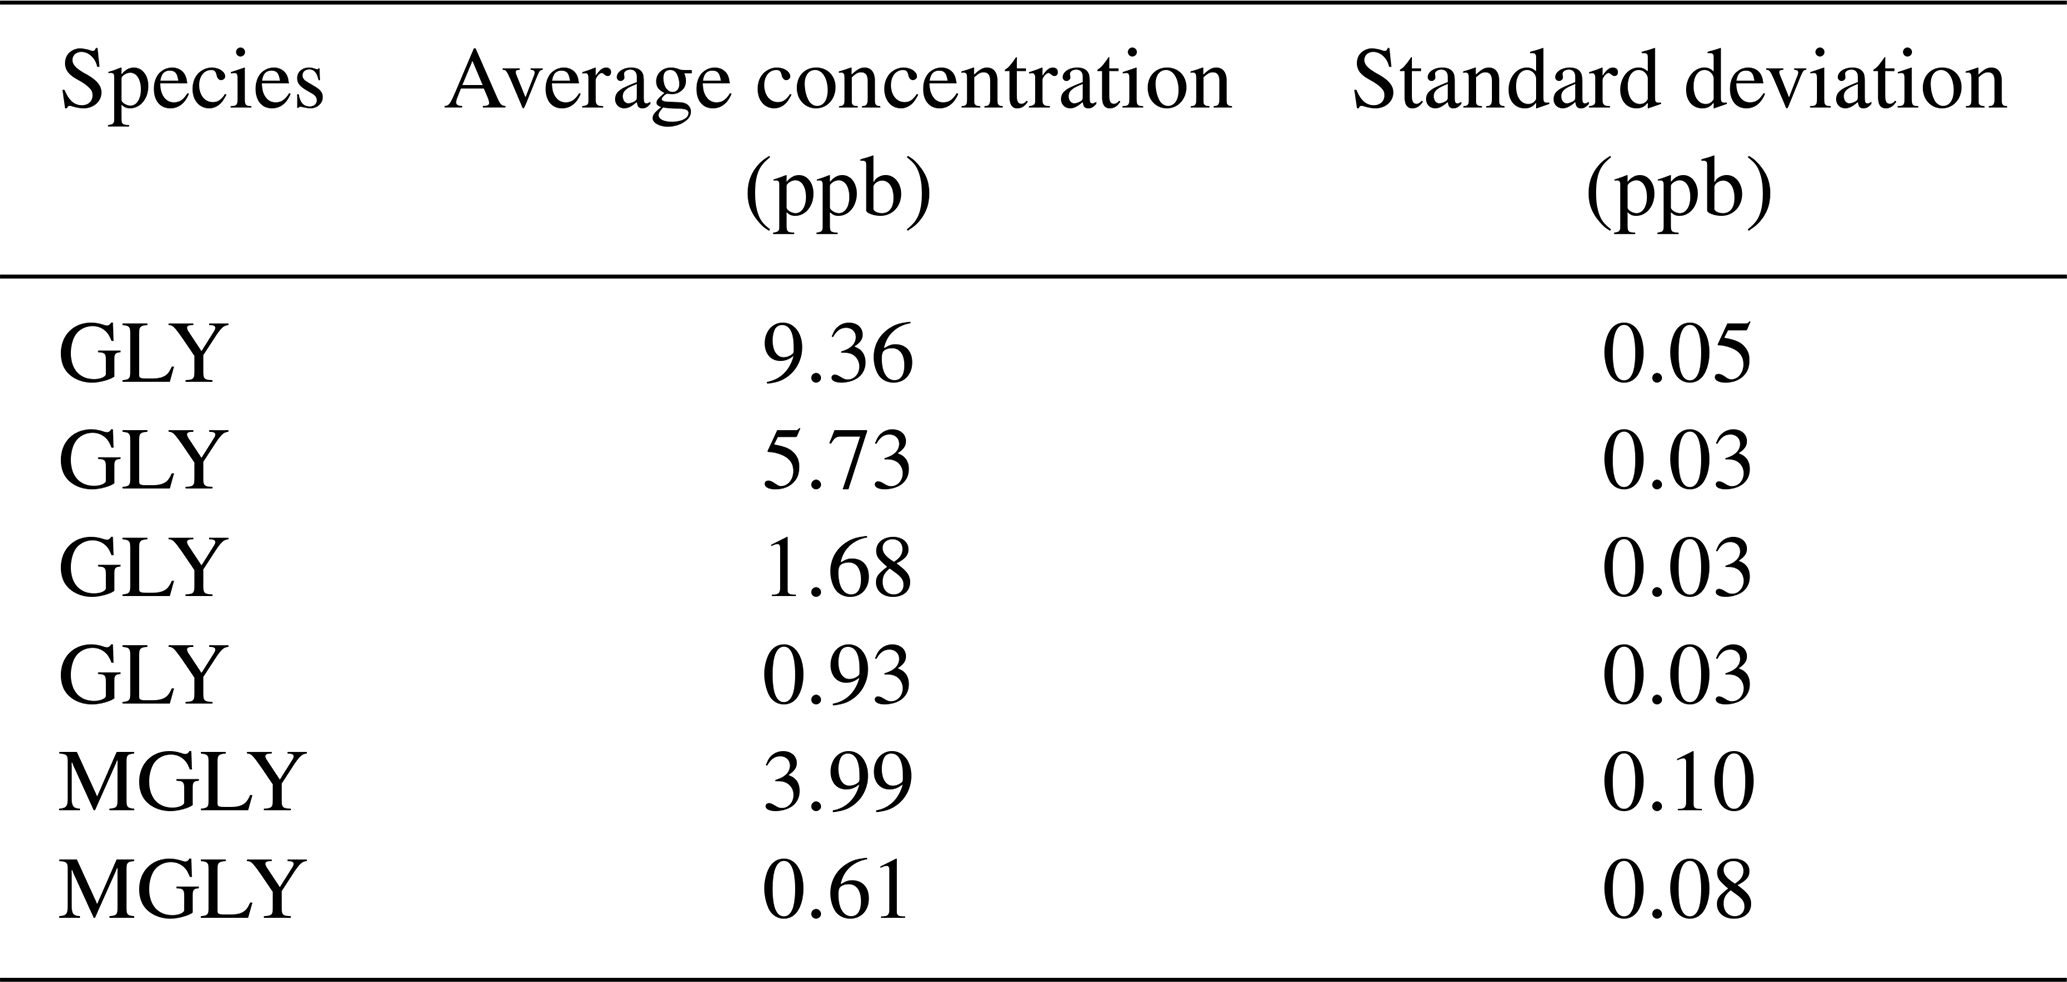
Compared to the methods that produce GLY or MGLY by either heating GLY trimer dihydrate powder or MGLY powder (Gen et al., 2018) or using a temperature-controlled Teflon bubbler filled with solution (Min et al., 2016; Zarzana et al., 2018), the standard gas produced by our generator is more stable and can be maintained at a relatively constant concentration; the 50 L mix chamber used in this study can provide a constant concentration of GLY or MGLY for approximately 20 min. Furthermore, our generator can produce GLY or MGLY concentrations on the order of parts per trillion to parts per million by adjusting the flow rate of the elution gas and the dilution ratio of the gas in the mix chamber. Results from several instrumental performance tests are recorded in Table 1. The concentrations of the fourth GLY test and second MGLY test are 0.93 and 0.61 ppb, respectively, which are close to their concentrations in ambient air (Li et al., 2014; Shen et al., 2018). During 20 min of the standard gas supplement, the standard deviation of each concentration test is much smaller than the uncertainty of our IBBCEAS system, which indicates that our standard gas generator can provide good stability and reliability.
Table 1Measurements of gaseous GLY and MGLY prepared by our standard gas generator and supplied for 20 min.
2.3 NO2 photolytic converter
The NO2 photolytic converter is mainly comprised of a photolytic module, power control module, and temperature control module. The photolysis cell is a 60.0 mm tube (18.0 mm outer diameter, 13.4 mm inner diameter). When the system is operating at a flow rate of 2 L min−1, the residence time is about 0.25 s. The core of the photolytic module is a set of 160 small LEDs (2865 COB, FLEDA, Taiwan) with a central wavelength of 395 nm and typical irradiance of 2000 mW cm−2. The instrumental stability of the photolytic module is maintained by operating the module at a constant current (2.5±0.01 A) and a constant temperature (), which are controlled by the power module and temperature module, respectively. The NPC was first used as a part of a NO2 measuring device that has been successfully deployed in many campaigns (Tan et al., 2018), and in this study, we use the NPC to remove NO2 from the sample gas. Further details about the photolytic efficiency for NO2, GLY, and MGLY are given in Sect. 4.2 and 4.3, respectively. Moreover, the photolysis of NO2 and the resulting O3 production in the NPC could probably lead to additional GLY and MGLY production in the condition of high VOC environment. However, as illustrated in the Supplement, this artifact is negligible given the short residence time of the sampled air in the NPC.
3.1 Determination of trace gas concentrations
The extinction coefficient, α(λ), accounts for absorption, Rayleigh scattering, and Mie scattering caused by gases and particles in the cavity and can be described mathematically following Eq. (1):
where λ is the wavelength of light, I0(λ) is the reference spectrum, Ia(λ) is the sample spectrum, d is the cavity length, R(λ) is the mirror reflectivity, σRayl(λ) is the extinction due to Rayleigh scattering, and dRatio is the ratio of effective cavity length to physical cavity length. Since particles are filtered out by the aerosol filter, Mie scattering in the cavity is negligible and α(λ) can be simplified to Eq. (2):
where σi(λ) and ni are the absorption cross section and number density of the ith gas absorber, respectively.
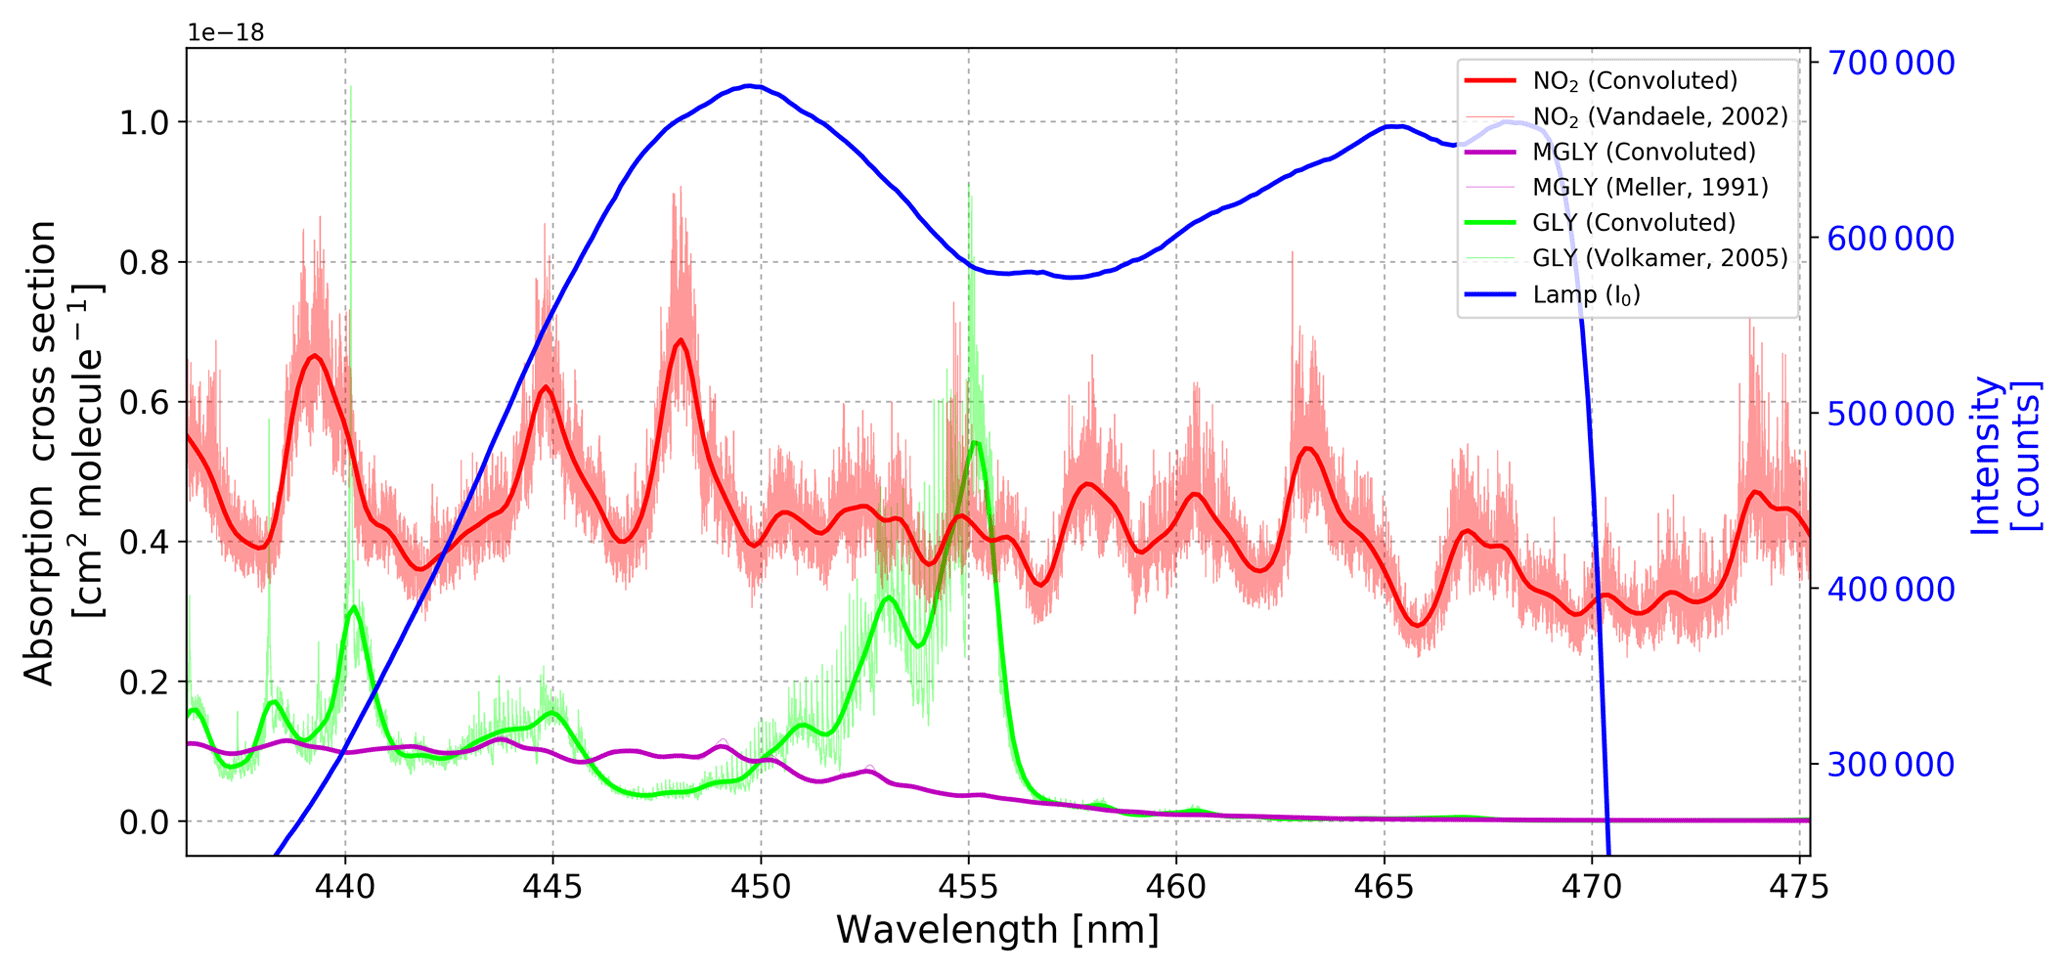
Figure 2Reference spectrum of the IBBCEAS system (blue) and absorption cross sections of NO2, GLY, and MGLY. The thin lines are the high-resolution cross sections documented in the literature, and the thick lines are the cross sections after processing with the instrument function determined by the Fraunhofer reference spectrum (Kurucz et al., 1984).
According to Eqs. (1) and (2), the effective absorption cross section of each absorber is required in order to determine the number density. Therefore, high-resolution absorption cross sections were obtained from the literature – NO2 (Vandaele, 2002), GLY (Volkamer et al., 2005b), MGLY (Meller et al., 1991), H2O (Rothman et al., 2005), O4 (Thalman and Volkamer, 2013) – and the absorption cross sections of NO2, GLY, MGLY, and H2O were processed with the instrument function determined by the Fraunhofer structure of a measured solar spectrum (Kurucz et al., 1984). Compared to the few Hg lines emitted around 430 nm, more Fraunhofer lines in the wavelength range of our interest (i.e., 440–460 nm) can be used to generate a wavelength-dependent instrument slit function that accounts for the change of spectral resolution over the CCD pixels. The absorption cross sections of NO2, GLY, and MGLY before and after processing with the instrument function are shown in Fig. 2. The thick, solid blue line in this figure is the reference spectrum of our IBBCEAS system, which overlaps the absorption structures of these three absorbers.
By using the α(λ) calculated by Eq. (1) and the absorption cross sections used in Eq. (2), the number density of the absorbers can be fitted simultaneously. The main algorithm of this fitting process is nonlinear least squares with a fifth-order polynomial to account for drift in light intensity and cavity throughput. All data processing was performed by DOAS Intelligent System (DOASIS) spectral fitting software (Kraus, 2006).
3.2 Mirror reflectivity and effective cavity length
In order to calculate α(λ) using Eq. (1), R(λ) and dRatio must be accurately quantified. We used pure nitrogen (> 99.999 %) and pure helium (> 99.999 %), two gases with distinct Rayleigh scattering sections, to calibrate R(λ) according to Eq. (3):
where d is the cavity length, is the spectrum obtained in N2 mode, IHe(λ) is the spectrum obtained in He mode, is the Rayleigh scattering cross section of nitrogen (Sneep and Ubachs, 2005), σRayl,He(λ) is the Rayleigh scattering cross section of helium (Rao, 1977), and and nHe are the number density of nitrogen and helium, respectively. The reflectivity calibration results and corresponding effective path length of our IBBCEAS system during a field observation campaign in the Yangtze River Delta (YRD), China, are shown in Fig. 3. During the campaign, the R(λ) was 0.99993 at 439 nm and the total uncertainty of this result is 5 % because of the uncertainty in the scattering cross sections of N2 (Sneep and Ubachs, 2005). After the system running continuously for 36 d, the change of the reflectivity was .
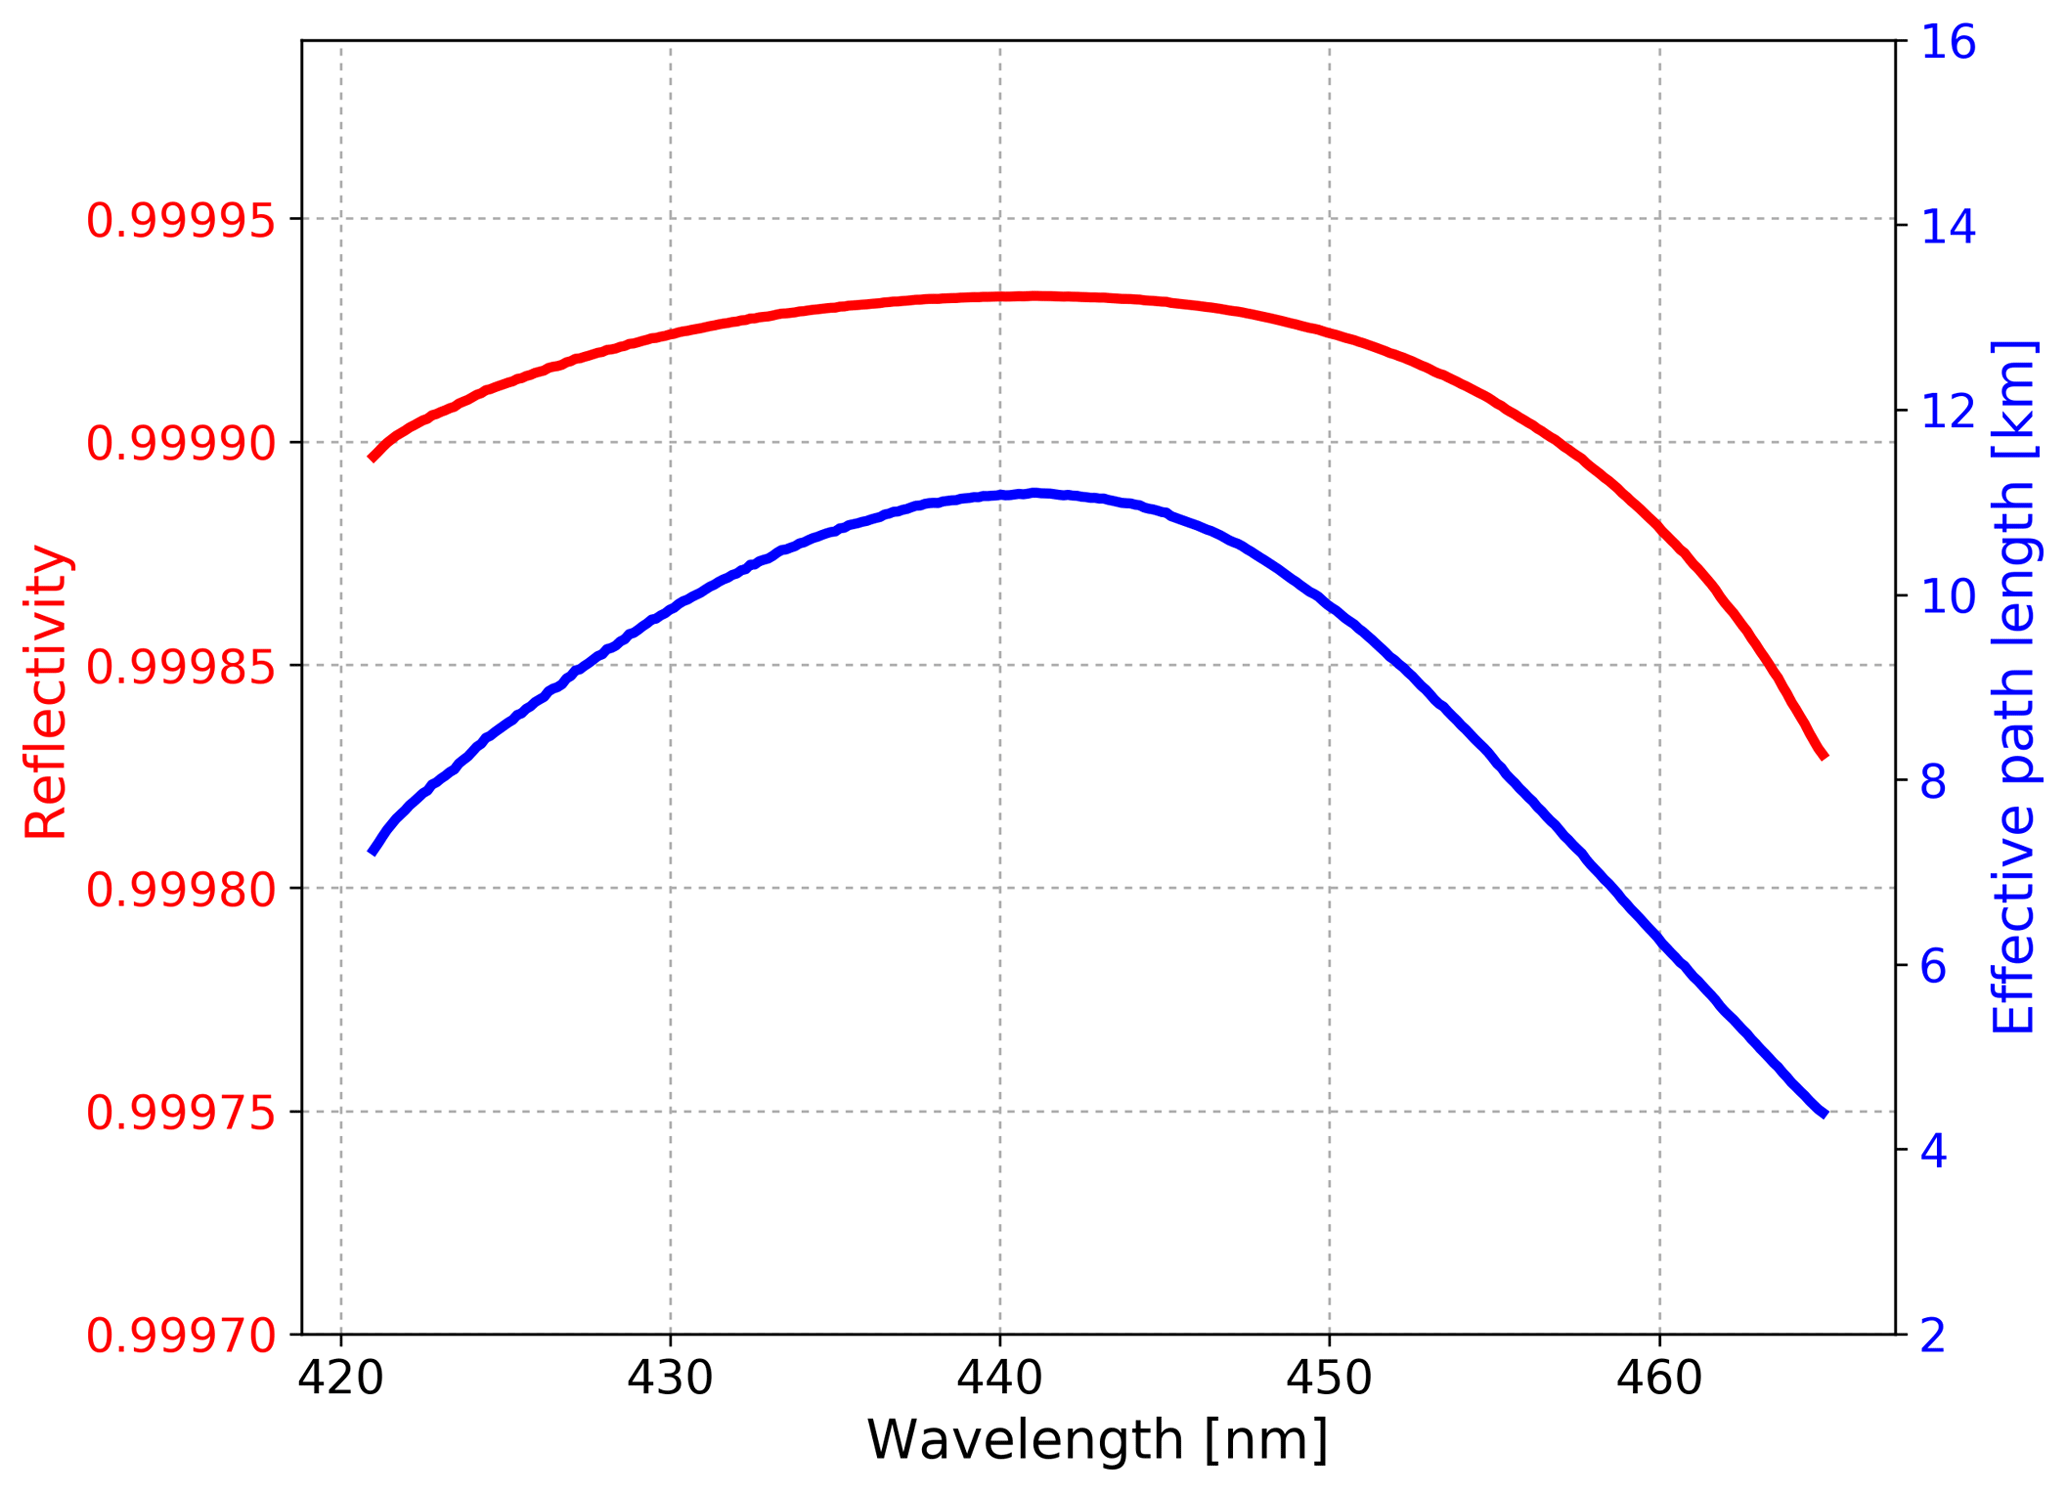
Figure 3Mirror reflectivity calibrated with high-purity nitrogen (> 99.999 %) and helium (> 99.999 %) and corresponding effective path length during the YRD campaign.
Because of the continuous purge gas at both ends of the cavity during sampling, the effective length of the cavity is shorter than its physical length; thus, dRatio is less than 1.0. In order to determine dRatio, we measured three NO2 concentrations in the cavity, which were prepared from a bottled standard (10.2 ppm NO2) and diluted with high-purity nitrogen (> 99.999 %) in the multi-gas calibrator (146i). The NO2 concentrations were measured with and without purge gas and denoted as and , respectively. When calculating and simultaneously with Eqs. (1) and (2), we assume that dRatio is equal to 1.0. Under this assumption, is less than when the same concentration of NO2 is being measured because the effective length of the cavity is overestimated. The measurement results of and can be found in the Supplement, which illustrates that the ratio fluctuated around 0.89 for the three NO2 concentrations. The only variable in Eqs. (1) and (2) is d; therefore, the ratio is equal to the dRatio. Because of the 4 % uncertainty of the NO2 absorption cross section (Vandaele, 2002) and 2 % uncertainty of the NO2 prepared by the 146i, the uncertainty of the dRatio is 4.5 %.
4.1 Instrument performance
4.1.1 Limit of detection and uncertainty
The precision of the IBBCEAS system can be estimated by calculating the Allan deviation (Allan, 1966), which is an algorithm that is commonly used for optical cavity technology (Brown et al., 2002; Langridge et al., 2008; Duan et al., 2018). We continuously measured 13 600 spectra in reference mode over 4 h and designated the average value of the first 100 spectra as I0. The remaining 13 500 spectra were averaged in sets of 2, 4, 6, continuing ultimately to 6750. Since the integration time of each spectrum is 1.0 s, we obtained a time series, Ia, that contains 6750 spectra with 2.0 s integration time, 3375 spectra with 4.0 s integration time, and so forth up to 2 spectra with 6750 s integration time. A time series of α at 439 nm was calculated using Eq. (1), and its Allan variance was determined using Eq. (4):
where t represents the integration time, n represents the number of time series, αi(t) is the extinction coefficient at each integration time from i=1 to i=n. The square root arithmetic of the , the Allan deviation , can be used to evaluate the instrumental precision.
The results plotted in Fig. 4 illustrate that when the integration time is less than 100 s, the sensitivity of our instrument can be improved by increasing the integration time. The instrument has the best precision when the integration time is near 100 s, after which the Allan deviation increases with integration time because of the drift of the light source. When the integration time is 100 s, the limit of detection (LOD) can be estimated by calculating the standard deviation of each absorber concentration retrieved from the 135 averaged spectra. The LOD of our IBBCEAS system in 100 s is estimated to be 18 ppt for NO2, 30 ppt for GLY, and 100 ppt for MGLY.

Figure 4Allan deviation at 439 nm. The precision (1σ) of the instrument is cm−1 for an integration time of 100 s.
According to Gaussian error propagation, the uncertainty associated with measurements of gas absorbers can be estimated using the uncertainty of the absorber's σ(λ), R(λ), dRatio, temperature, and pressure. For our IBBCEAS system, the uncertainty of R(λ) is 5 %, which is dominated by the uncertainty of the scattering cross sections of N2. The uncertainty of the dRatio is 4.5 % and those of temperature and pressure are both 0.5 %. The uncertainties of NO2, GLY, and MGLY can be found in the literature and are 4 % (Vandaele, 2002), 5 % (Volkamer et al., 2005b), and 15 % (Meller et al., 1991), respectively. Based on the above parameters, the accuracy of our IBBCEAS system is estimated to be ±8 % for NO2, ±8 % for GLY, and ±16 % for MGLY.
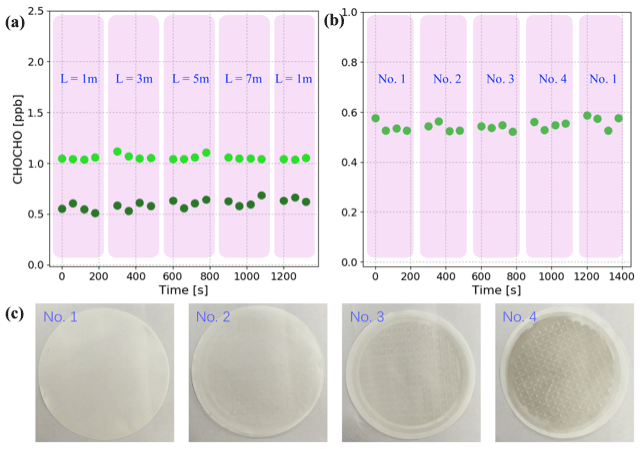
Figure 5Sample loss experiments: (a) two sets of GLY concentrations (light green dots and dark green dots) measured with different lengths of sampling line (L). Each pink overlay represents the concentrations measured with the same length of sampling line. (b) GLY concentrations measured using particle filters with different levels of cleanliness, which are marked as no. 1, no. 2, no. 3, and no. 4. Each pink overlay represents the concentrations measured with the same filter. (c) Samples of the four particle filters corresponding to (b); the daily average concentrations of PM2.5 corresponding to these filters are 0 (new filter), 11, 37, and 83 µg m−3, respectively.
4.1.2 Sample loss
Based on the standard gas generator for GLY and MGLY described in Sect. 2.2, experiments investigating sample loss in the sampling line were performed as follows. First, four Teflon sampling lines with lengths equal to 1, 3, 5, and 7 m were prepared. Second, the IBBCEAS system and standard gas generator were connected using the 1 m sampling line and gas was pumped into the IBBCEAS system for measurement. Third, the sampling line was replaced with the other lengths every 4 min in the following order: 3, 5, 7, and 1 m. The experiment was done twice for each length of sampling line and the results are shown in Fig. 5a. The concentrations measured during the first set of experiments fluctuated near 1.06 ppb and the concentrations measured during the second set fluctuated near 0.60 ppb. The two sets of experimental results demonstrated that sample loss is negligible in sampling line when its length is less than 7 m. Similarly, experiments investigating sample loss in the filters was performed using four filters with different levels of cleanliness (see Fig. 5c). Filter no. 1 is a clean filter that has never been used and no. 2, no. 3, and no. 4 are used filters that were saved during field campaigns; the daily average concentrations of PM2.5 corresponding to these filters are 11, 37, and 83 µg m−3, respectively. During the sample loss experiments, the length of sampling line between the IBBCEAS system and the standard gas generator was fixed at 1 m and the filter at the end of the sampling line changed in the following order: no. 1, no. 2, no. 3, no. 4, and no. 1. The concentration of GLY was constant, 0.55±0.02 ppb, when using the different filters (see Fig. 5b).
The above experiments demonstrate that GLY sample loss is negligible in both the sampling line and filter of our IBBCEAS system, which is consistent with the results from previous studies (Washenfelder et al., 2008; Min et al., 2016). The results from previous studies indicate that MGLY is even less reactive than GLY as the effective Henry's law consistent of MGLY is much smaller than that of GLY (Betterton and Hoffmann, 1988) and the gas-particle partitioning constant for MGLY is at least 30 times lower than that of GLY (Kroll et al., 2005); therefore, any loss of MGLY to the sampling line and filter should also be negligible.
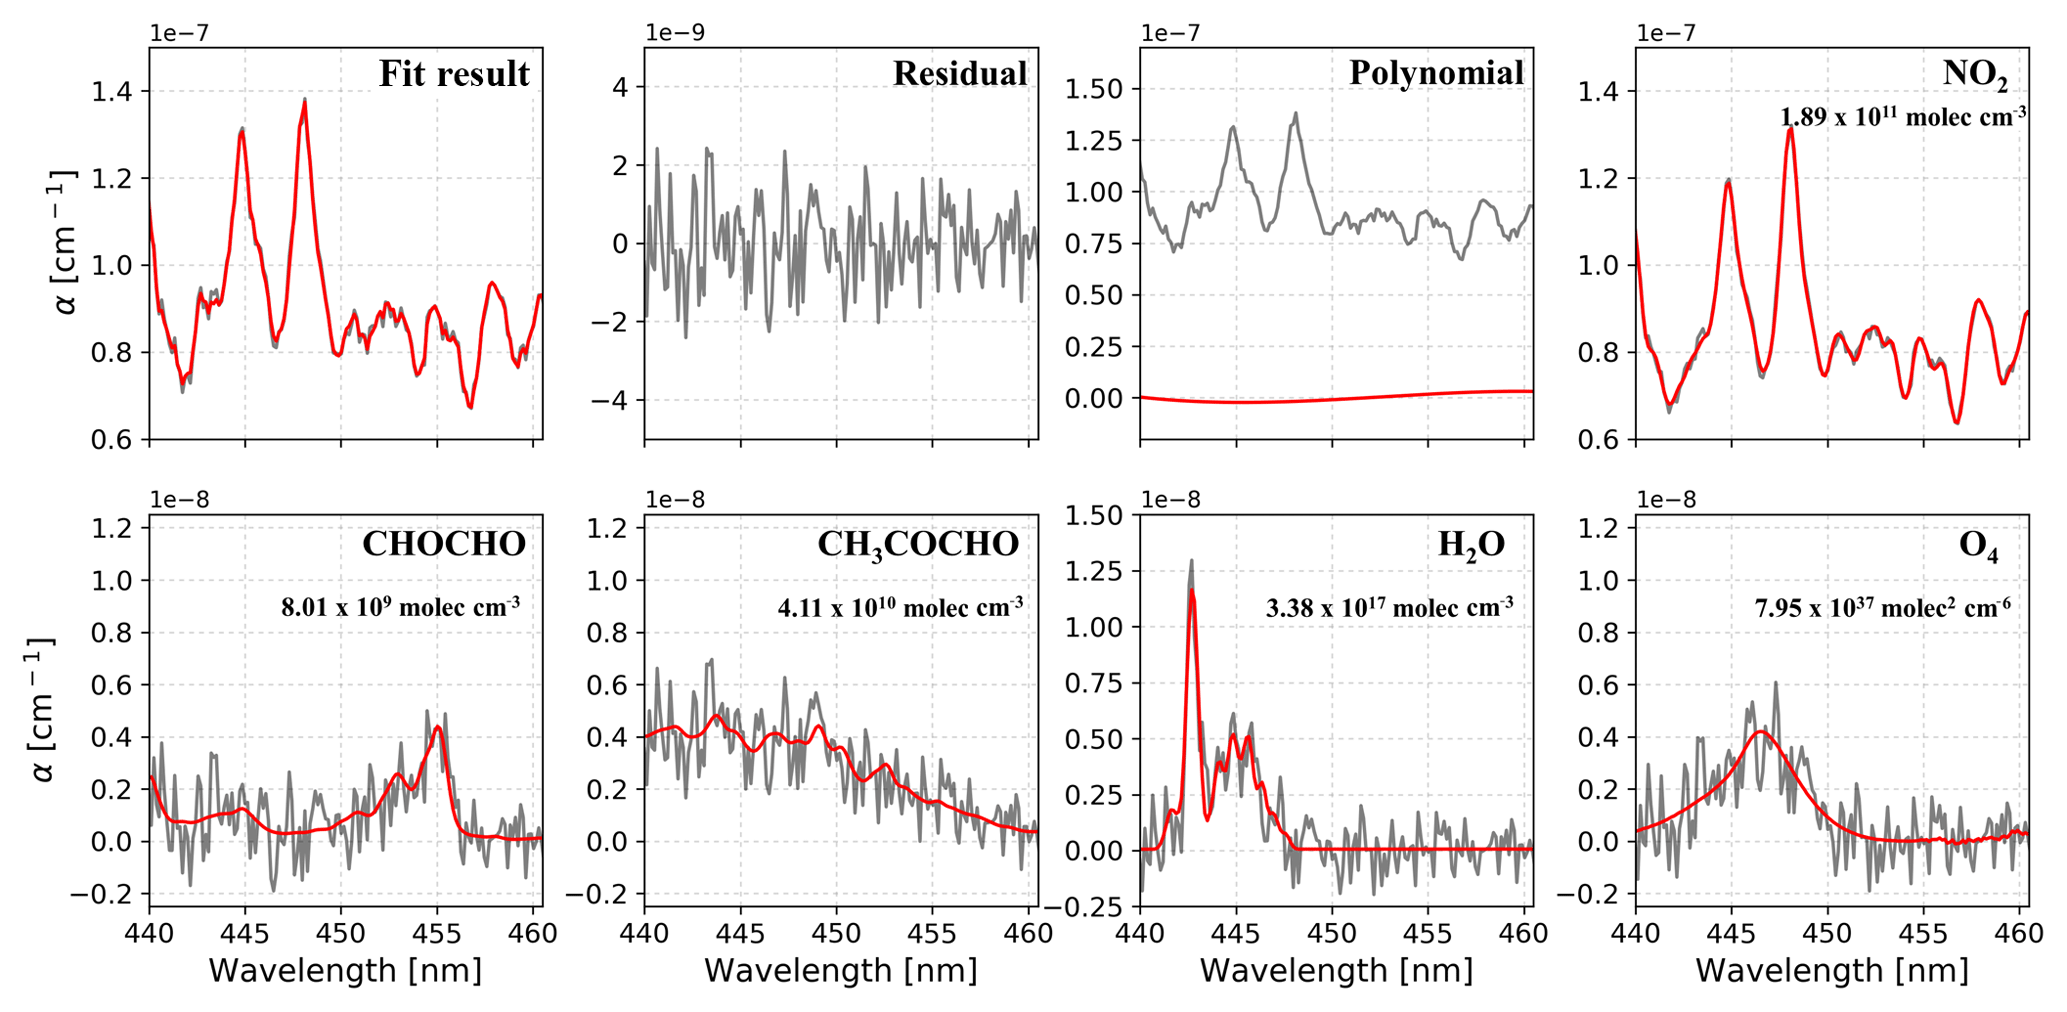
Figure 6An example of spectral fit for one spectrum (60 s average) measured during the YRD campaign. Retrievals of NO2, CHOCHO, CH3COCHO, H2O, and O4 are shown, as well as the fifth-order polynomial, total fit, and residual. Red is the fitted spectrum and black is the fitted result plus residual.
4.1.3 Interference of NO2 on spectra fitting
An example of spectra fit for one measurement during the YRD campaign is shown in Fig. 6. The air pollution events at this rural site are mostly dominated by biomass burning, so relatively high concentrations of GLY and MGLY were measured. The wavelength range that we chose for quantifying GLY and MGLY includes strong structured absorption of NO2. Furthermore, the concentration of NO2 in the troposphere is much higher than that of either GLY or MGLY, especially during the air pollution events in China; therefore, the presence of high NO2 concentrations may affect the spectral fitting of GLY and MGLY. In order to verify this conjecture, we processed the data obtained during two campaigns as follows: we plotted the changes in NO2 concentration and spectra fitting residual over time on the same graph to check whether they have the same general trend, normalized the NO2 concentration and fitting residual, and performed correlation analysis. Figure 7a illustrates that the NO2 concentration and fitting residual trends of the processed data from the YRD campaign are similar, especially when the mixing ratio of NO2 is greater than 10 ppb. The fitting residual is approximately when the NO2 mixing ratio is approximately 50 ppb. The correlation coefficient (R2) of these two normalized parameters is 0.949, which indicates very good agreement.
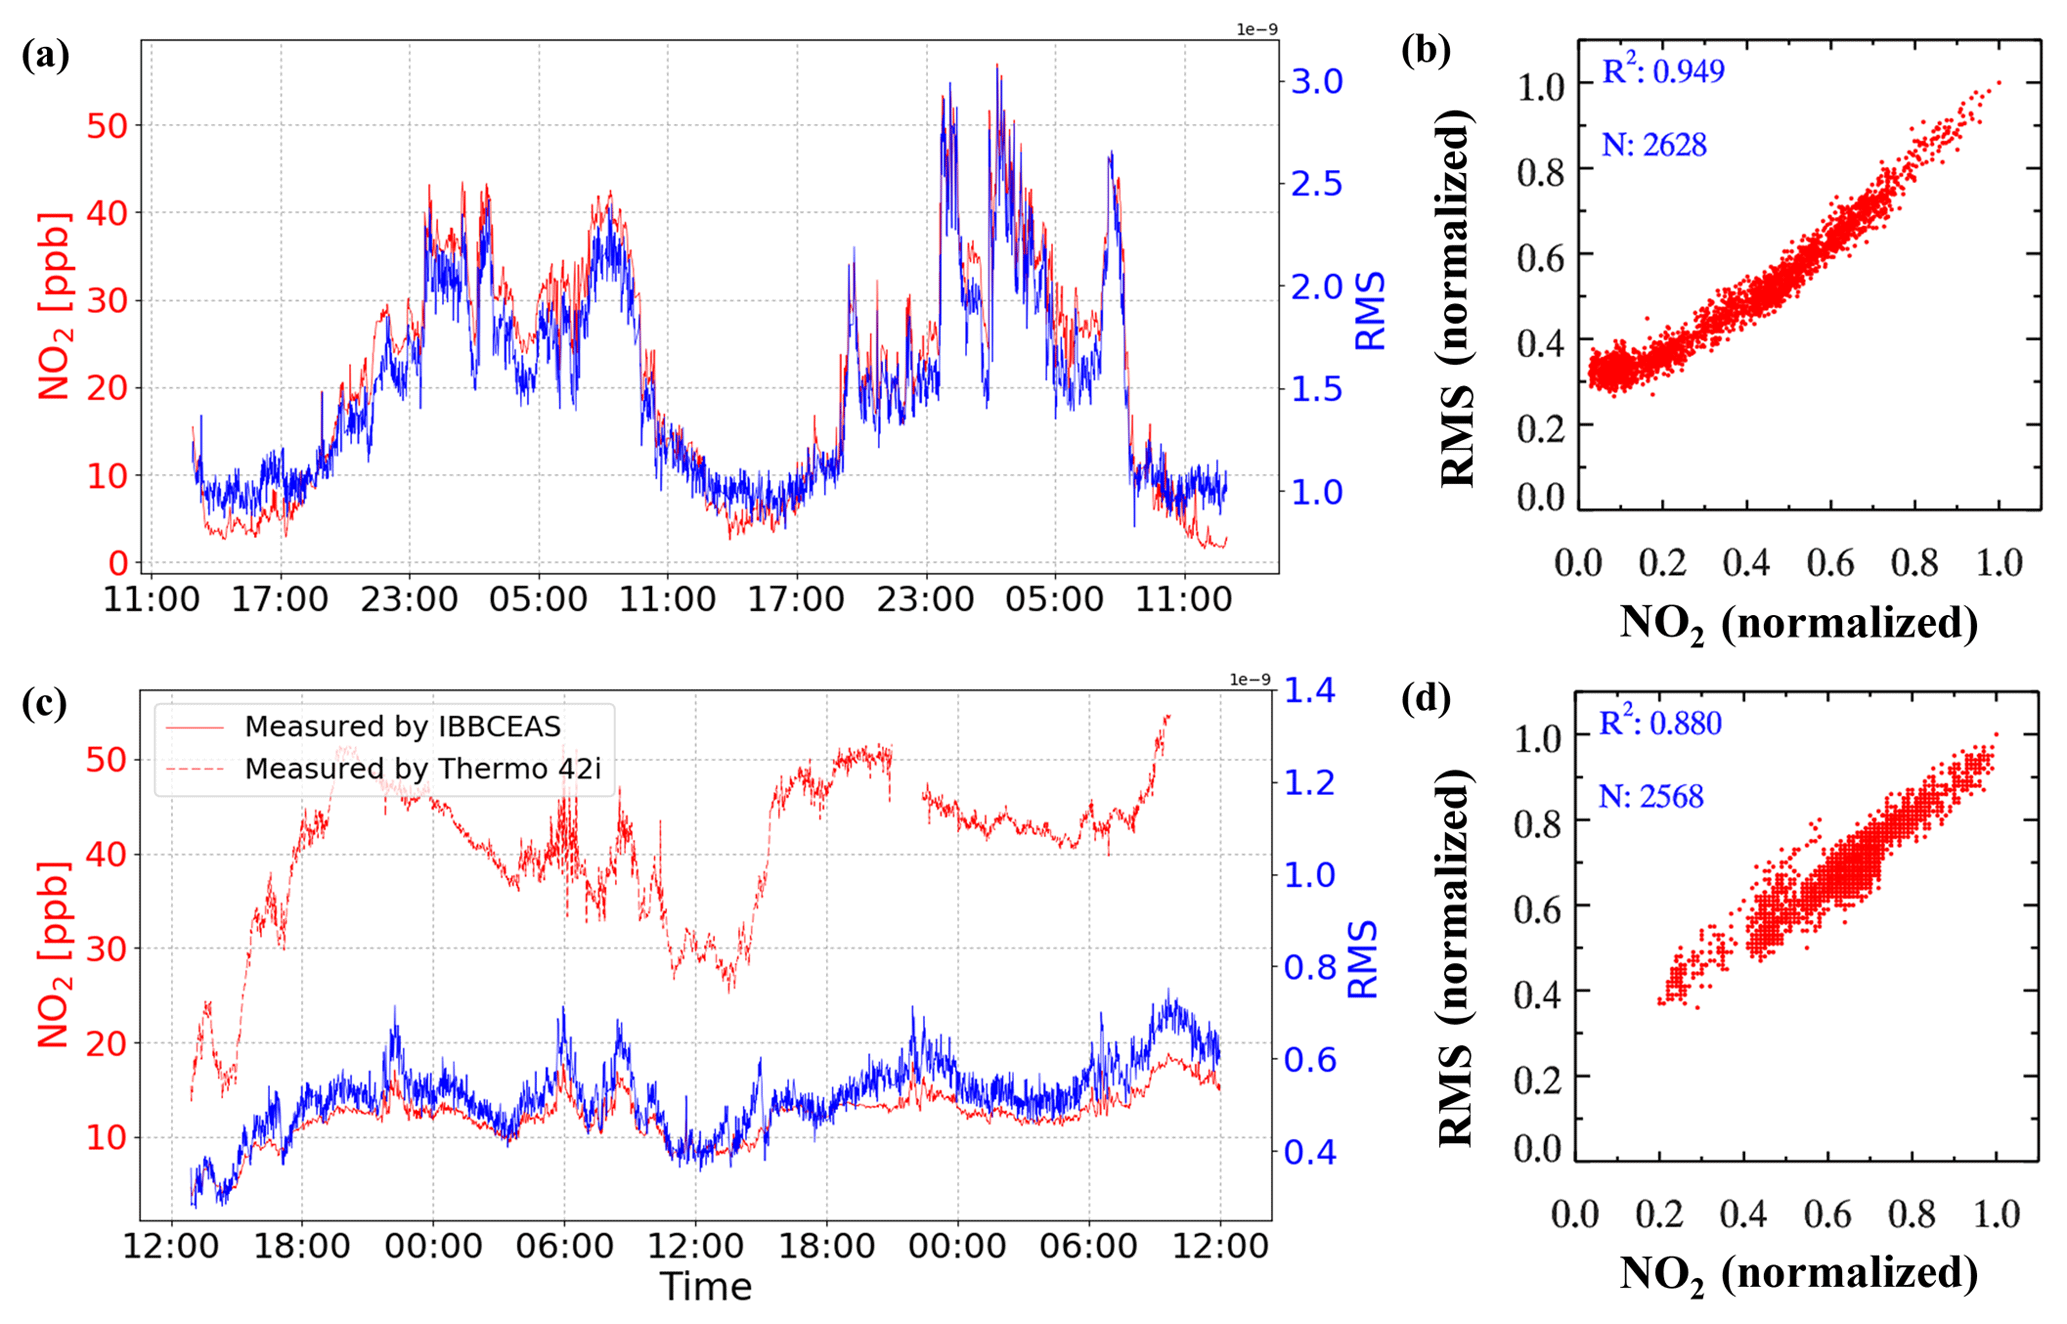
Figure 7(a) Time series and (b) correlation plot of NO2 concentration and fitting residual from the YRD campaign. (c) Time series and (d) correlation plot of NO2 concentration measured by IBBCEAS and the fitting residual from the Peking University campus (PKU campaign). The NO2 concentration and fitting residual are normalized for comparison.
During a field observation campaign performed on the Peking University campus (PKU campaign), we attached the NO2 photolytic convertor (NPC), described in Sect. 2.3, to the front of our IBBCEAS instrument to reduce the concentration of NO2 in the sampled gas; analysis of the experimental results is given in Fig. 7c and d. In addition to our IBBCEAS system, another instrument for measuring NO2 (42i, Thermo Fisher Scientific Inc., Waltham, MA, USA) was deployed during this campaign. Figure 7c shows that the NO2 concentration measured by our IBBCEAS system is much lower than that measured by the 42i when the NPC is being used. When using the NPC, the correlation coefficient of the NO2 concentration and fitting residual drops to 0.88 and the fitting residual falls to , while the ambient NO2 mixing ratio is still approximately 50 ppb. Based on the above analysis, high concentrations of NO2 interfere with the spectral fitting, and this interference can be reduced by using the NPC. A model simulation was performed to evaluate the NPC while sampling an atmospheric background with VOCs, which verified that the production of GLY and MGLY in the photolytic cell of the NPC was negligible. Details of the model simulation are available in the Supplement. The NO2 conversion efficiency of the NPC and its effect on the measured GLY and MGLY concentrations will be discussed in the following sections.
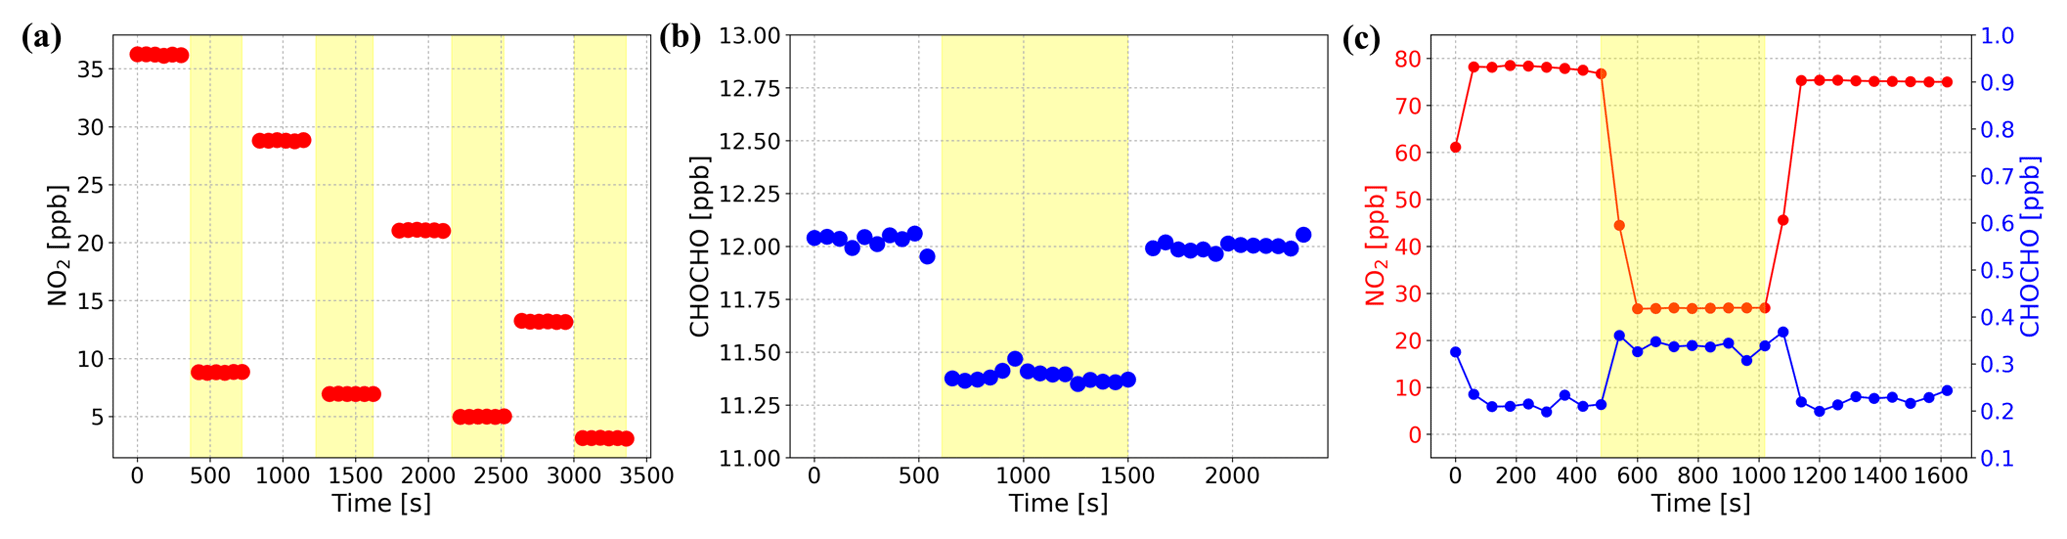
Figure 8(a) NO2 only test: a concentration gradient of NO2 gas samples was measured twice, with the NPC on (yellow overlay) and off. The removal efficiency is constant at 76 % for different NO2 concentrations. (b) GLY only test: the constant concentration of GLY produced by the standard gas generator was measured, with the NPC on (yellow overlay) and off. A small fraction of the GLY (5 %) was photolyzed by the NPC. (c) NO2 and GLY mixture test: well-mixed NO2 and GLY was measured, with the NPC on (yellow overlay) and off. The concentration of NO2 dropped while the NPC was running and that of GLY increased. After the NPC was turned off, their concentrations returned to the same level as before the NPC was turned on.
4.2 GLY measurements
In order to determine the NO2 removal efficiency of our NPC, we prepared a concentration gradient of NO2 gas samples, which were produced from a bottled standard (10.2 ppm NO2) and diluted with high-purity nitrogen (> 99.999 %) in the multi-gas calibrator; each NO2 concentration was measured twice, with the NPC on and off. The measurement results are shown in Fig. 8a, which illustrates that the removal efficiency of the NPC is constant at 76 % for the different concentrations of NO2. Stability tests of the instrument were also performed and indicate that the efficiency does not change over time on the scale of hours. The impact of the NPC on the measured GLY concentration was tested using a similar method, wherein the constant concentration of GLY produced by the standard gas generator was the gas to be measured. Based on the results shown in Fig. 8b, the NPC also photolyzes a small fraction of the GLY (5 %). Therefore, when the NPC is working, the GLY concentration obtained by spectra fitting needs to be corrected by dividing by 95 %.

Figure 9(a) The concentration of GLY is kept constant and mixed evenly with different concentrations of NO2 four times. The concentration of GLY measured by IBBCEAS increased as that of NO2 decreased, although only the NO2 concentration was reduced manually. (b) A series of spectra with constant GLY concentration and increasing NO2 concentration were simulated and then concentrations of GLY and NO2 were calculated by retrieving these simulated spectra. The retrieved GLY concentration decreased with the increasing NO2 concentration, although the set value of GLY concentration in the simulation was kept constant.
When repeating the above experiments using well-mixed NO2 and GLY as the gas to be measured, we observed an interesting phenomenon whereby the concentration of NO2 dropped rapidly while the NPC was running and the concentration of GLY increased. After the NPC was turned off, the concentrations of the two compounds returned to the same levels as before the NPC was turned on (see Fig. 8c). We conducted another experiment to prove that this phenomenon was not accidental. First, we prepared standard GLY and NO2 gases and stored them in separate PTFE bags. Second, we mixed the GLY and NO2 standard and delivered it to the IBBCEAS system. Third, we fixed the concentration of GLY in the cavity and gradually reduced the concentration of NO2. Based on the spectra fitting results (see Fig. 9a), the concentration of GLY increased as that of NO2 decreased, although we manually reduced the NO2 concentration without changing that of GLY. Therefore, there seems to be a competitive relationship between the spectra fitting of NO2 and GLY.
In order to further verify the observed phenomenon, we attempted to generate spectra to simulate the experimental NO2 and GLY gas tests. The spectra were created by the following steps: (i) set the NO2 concentration and GLY concentration nGLY to the value to be studied and substitute , , nGLY, and σGLY(λ) into Eq. (2) to calculate α(λ), where and σGLY(λ) are the absorption cross sections of NO2 and GLY after processing with the instrument function. (ii) Take the spectrum obtained during the reference mode as I0(λ) and substitute I0(λ), R(λ), d, σRayl(λ), dRatio, and α(λ) calculated in step (i) into Eq. (1). As all the parameters except Ia(λ) in Eq. (1) are already determined, Ia(λ) can be yielded. (iii) Add a set of random numbers between 100 and 1000 representing the noise of the system to the intensity corresponding to each wavelength of Ia(λ); this range, 100 and 1000 counts, was used because it is close to the actual noise level of our IBBCEAS system. We set the concentration of GLY to 1 ppb and the concentration of NO2 to 0, 15, 30, 45 ppb to generate a series of Ia(λ), and then calculated the concentration of these two gas absorbers from the generated Ia(λ). Results from the spectral simulations are shown in Fig. 9b. The fitting residual increased from to cm−1 as the NO2 concentration increased. It can be found that the retrieved GLY concentration is lower than its setting value while this is reversed for NO2. This is consistent with the experimental results discussed above. Therefore, it is obvious that the spectral resolving of NO2 and GLY are competing with each other. Since NO2 has a higher ambient concentration and stronger absorption structure than GLY, the GLY concentration determined by IBBCEAS could be underestimated in the presence of NO2, and the higher the NO2 concentration, the greater the underestimation. The uncertainty of simulation results is mainly caused by two things. (1) Random numbers could be not good enough to represent the actual noise of the whole system. Since the intensity of LED and the reflectivity of mirrors are not evenly distributed with the wavelength, the corresponding signal-to-noise ratios (SNRs) are also different at different wavelengths. As for our system, the SNR within 450–468 nm are higher than that at other wavelengths. If we only reduced the random number 5-fold within 450–468 nm and did not change it at other wavelengths, the fluctuation of the fitted GLY concentration was also reduced by 5 times. (2) The impact of Rayleigh scattering and Mie scattering are not explicitly considered during the simulation. In this case, whether a polynomial should be added in the spectral fitting or not would be a problem. The retrieved GLY concentration by using a fifth-order polynomial was 20 % higher than that without including a polynomial. Therefore, this method is presently only suitable for qualitative analysis instead of quantitative analysis. Further research is required to modify or parameterize the underestimation of GLY concentration and correct the measured value to be closer to its true value in ambient air.
4.3 MGLY measurements
Compared to NO2 and GLY, the absorption cross section of MGLY is less structured, which means it is difficult to accurately calculate its concentration using spectral fitting. As demonstrated by the results in Table 1, the difference in the measured MGLY concentrations is greater than those of GLY, although the GLY and MGLY standard gases were produced by the same method and measured using the same instrument. Hence, each step in the process of MGLY spectral fitting needs to be considered carefully.
Selecting reasonable spectral fit ranges is necessary in order to accurately fit the concentration of MGLY; we chose four spectral fit ranges based on the structure of the absorption cross section of MGLY: 440–451, 445–453, 440–453, and 430–453 nm. Each spectral fit range was used to fit two experimental sets of MGLY measurements, and the corresponding results are available in the Supplement. Although the MGLY concentrations were determined using the same experimental data, the fitting results from different spectral ranges varied greatly. The results of fit range (1) and fit range (3) are similar and the range of results of (3 is relatively small). Fit range (2) covers the narrowest wavelength range and the MGLY concentrations from (2) are discrete, especially when the mixing ratio of MGLY is approximately 4 ppb. In contrast, fit range (4) covers the widest wavelength range and its fitting results are not ideal enough, even accounting for negative values when MGLY concentration is low. Based on these results, we prefer to use fit range (3), which covers the wavelength range from 440 to 453 nm, to determine MGLY concentrations in our studies.
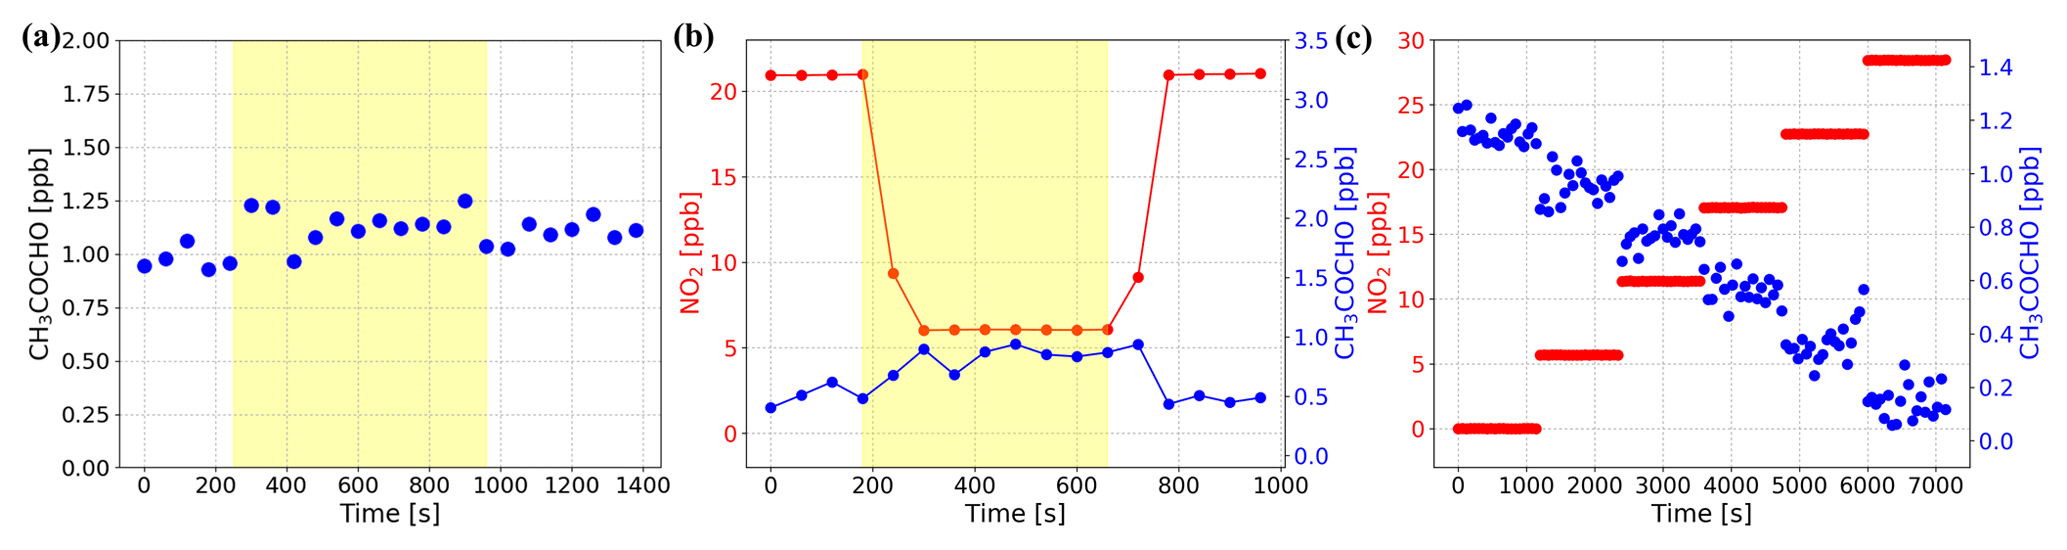
Figure 10(a) The constant concentration of MGLY produced by the standard gas generator was measured with the NPC on (yellow overlay) and off. The effect of NPC on MGLY concentration is negligible. (b) Well-mixed NO2 and MGLY were measured with the NPC on (yellow overlay) and off. The concentration of NO2 dropped while the NPC was running and that of MGLY increased. After the NPC was turned off, their concentrations returned to the same level as before the NPC was turned on. (c) A series of spectra with constant MGLY concentration and increasing NO2 concentration were simulated and then concentrations of MGLY and NO2 were calculated by retrieving these simulated spectra. The retrieved MGLY concentration decreased with the increasing NO2 concentration, although the set value of MGLY concentration in the simulation was kept constant.
In order to study the effect of NO2 on MGLY measurements, experiments similar to those described in Sect. 4.2 were conducted. First, prepared MGLY standard gas was passed through the NPC and measured by the IBBCEAS instrument. The results in Fig. 10a show that the NPC has no effect on the measured concentration of MGLY, which is different from the effect of the NPC on GLY. However, a similar phenomenon was observed when we repeated the above experiments with a mixture of MGLY and NO2 (see Fig. 10b); the concentration of NO2 dropped immediately once the NPC was turned on and the concentration of MGLY increased slightly, which is the same phenomenon that was observed for GLY. These results suggest that the MGLY concentration determined by IBBCEAS could also be underestimated in the presence of NO2.
Spectral simulations were also performed to investigate the accuracy of the measured MGLY concentrations in the presence of NO2. We set the concentration of MGLY to 1 ppb and the concentration of NO2 to 0, 5, 10, 15, 20, and 25 ppb, in order to generate a series of Ia(λ) using the same algorithm as in Sect. 4.2. The results of the simulations are shown in Fig. 10c, which illustrates that as the concentration of NO2 increases, the concentration of MGLY will be underestimated. Therefore, in the presence of high NO2 concentrations, measured MGLY concentrations may be lower than the real concentrations.
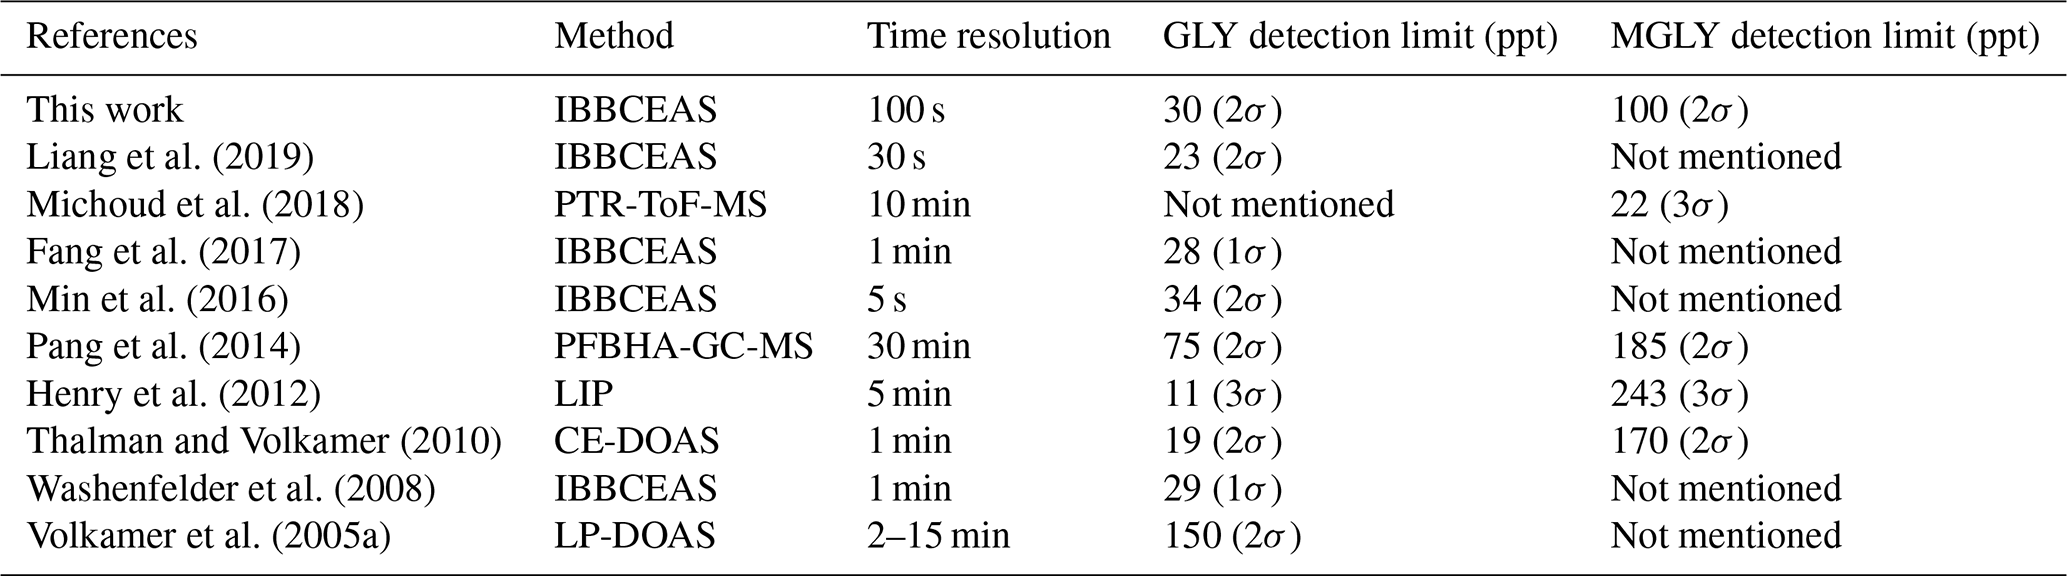
Table 2Comparisons of the new IBBCEAS system with other instruments.
4.4 Comparisons to existing instruments
Comparisons of our IBBCEAS system with other instruments that are able to measure GLY or MGLY within a time resolution of 30 min were made in Table 2. For the GLY measurement, IBBCEAS, PFBHA-GC-MS, LIP, and CE-DOAS are available with detection limit values of 11–75 ppt, and for the MGLY measurement, PTR-ToF-MS, CE-DOAS, and PFBHA-GC-MS are available with detection limit values of 22–185 ppt. Compared with the existing instruments, the ability of our IBBCEAS to detect GLY and MGLY is comparable. From a comprehensive perspective, the new IBBCEAS has a good performance and can be used to simultaneously measure the concentration of GLY and MGLY in the atmosphere.
In addition to the new IBBCEAS system, there are four IBBCEAS reported to be able to measure GLY (Washenfelder et al., 2008; Min et al., 2016; Fang et al., 2017; Liang et al., 2019). As is shown in Table 2, the detection limit of our system is slightly lower than that of Liang et al. and higher than that of Washenfelder et al. and Fang et al.. Compared with the IBBCEAS developed by Min et al., which is also used to simultaneously measure GLY and MGLY (Min et al., 2016), under the same integration time (100 s), the Allan deviation of our system () is comparable to that of their system (about ), which indicates that the IBBCEAS developed by us also has a good instrumental precision and stability. However, the volume of our IBBCEAS is at least twice as large as their system, and the time resolution is lower than theirs. So the IBBCEAS system developed by them will be a better choice for aircraft measurements. With respect to the measurement interference of NO2, Liang et al. tried to solve this problem by measuring NO2 cross section with their own spectrometer. This method improved the spectral fitting results and reduced the fitting residual by 33 % (Liang et al., 2019). For the IBBCEAS used by Thalman et al., the systematic bias was characterized as ≈1 ppt GLY per 1 ppb NO2, and ≈5 ppt MGLY per 1 ppb NO2. At low NO2 concentration (below 10 ppb), the small effect on GLY and MGLY retrievals was unnoticeable (Thalman et al., 2015). In contrast, before entering the cavity of our IBBCEAS, the NO2 in sampled air is reduced by 76 %, so the systematic bias of our system caused by NO2 can be reduced accordingly. Furthermore, during severe air pollution events, the NO2 concentration in the optical cavity was always controlled between 10 and 20 ppb (see Fig. 7c). When NO2 concentration in ambient air was 50 ppb, the fitting residual can be reduced by 80 %, which further ensures the minimization of NO2 interference on measurements of GLY and MGLY.
We have developed and characterized an IBBCEAS instrument for simultaneously measuring NO2, GLY, and MGLY in ambient air. Based on self-developed software, the entire system is highly automated; the only thing that needs to be done manually is replacing the particle filters during normal operation in field campaigns. Because of the uncertainties in the absorption cross sections, effective cavity length, and mirror reflectivity, the accuracies of the measured concentrations are estimated to be ±8 % for NO2, ±8 % for GLY, and ±16 % for MGLY. Compared to IBBCEAS systems for the measurement of GLY and MGLY discussed in the existing literature, the novelties of this study are as follows.
A standard gas generator has been set up to provide a constant concentration of GLY or MGLY that can be maintained down to approximately 200 ppt, which is similar to their real concentrations in troposphere. The standard gas generator enables systematic experiments investigating sample loss and characterizing the IBBCEAS system.
The interference of high NO2 concentration on spectra fitting, and subsequently determining the concentrations of GLY and MGLY, is analyzed and discussed using both measured results and spectral simulations. In order to minimize the effect of NO2 on GLY and MGLY, a NO2 photolytic converter was used to remove NO2 in the sampled air.
In summary, sample loss experiments with our IBBCEAS system demonstrated that sample loss of GLY and MGLY in the sampling line and particle filter are negligible. In terms of the interference of NO2 on GLY and MGLY measurements, the spectral fit residual increases as the NO2 concentration increases when all other conditions are the same. Furthermore, the measured GLY and MGLY may be underestimated in the presence of high NO2 concentrations. By utilizing the NPC to remove sampled NO2, the spectral fit residual is effectively reduced and the measured GLY and MGLY concentrations will be more accurate, such that the measured concentrations will be closer to their actual concentrations.
In order to accurately measure GLY and MGLY, the following methods could be developed to reduce the interference from NO2. First, the sampled gas could be pre-treated to reduce the NO2 concentration as much as possible without affecting GLY and MGLY. As discussed above, the higher NO2 concentration, the greater underestimation of GLY and MGLY concentration, so reducing the NO2 concentration can improve the accuracy of GLY and MGLY measurement results. The second method is quantifying the competitive relationships in spectra fitting between NO2 and both GLY and MGLY through laboratory experiments and theoretical calculations. After simultaneously retrieving concentrations of NO2, GLY, and MGLY, concentrations of GLY and MGLY could be corrected using the parametric relationship; however, because of the complexity of the actual atmosphere, parametric results obtained in the laboratory may not be able to be extended to field campaigns. The third option is to develop a suitable method for removing only GLY and MGLY in sampled air and to regard it as a new reference mode. By making the system switch between the new reference mode and sample mode frequently, the spectra acquired in both modes will include the absorption of NO2 and the spectra fitting will no longer be affected by NO2. Unfortunately, such methods with sufficient specificity to selectively remove GLY and MGLY are not currently available. Moreover, the iterative algorithm used in CE-DOAS (Horbanski et al., 2019) could be helpful to accurately measure the concentration of the three at the same time.
The datasets used in this study are available from the corresponding author upon request (li_xin@pku.edu.cn).
The supplement related to this article is available online at: https://doi.org/10.5194/amt-12-4439-2019-supplement.
JL analyzed the data and prepared the manuscript. HW and XL edited and refined the manuscript. XL, YZ, LM, JH and MC contributed to the conception of this study. XF and JL designed and constructed the cage system. XWL provided GLY and MGLY solid standards. YW designed and constructed the NO2 photolytic converter. JL and YY performed the experiments.
The authors declare that they have no conflict of interest.
This work was supported by the National Key R&D Program of China (2017YFC0209400) and by the National Natural Science Foundation of China (91644108). We thank Qingyu Liu from the Institute of Chemistry, Chinese Academy of Science, for his help in purifying GLY and MGLY solid standards.
This research has been supported by the National Key R&D Program of China (grant no. 2017YFC0209400) and the National Natural Science Foundation of China (grant no. 91644108).
This paper was edited by Mingjin Tang and reviewed by three anonymous referees.
Allan, D. W.: Statistics of atomic frequency standards, P. IEEE, 54, 221–230, 1966.
Axson, J. L., Washenfelder, R. A., Kahan, T. F., Young, C. J., Vaida, V., and Brown, S. S.: Absolute ozone absorption cross section in the Huggins Chappuis minimum (350–470 nm) at 296 K, Atmos. Chem. Phys., 11, 11581–11590, https://doi.org/10.5194/acp-11-11581-2011, 2011.
Betterton, E. A. and Hoffmann, M. R.: Henry's law constants of some environmentally important aldehydes, Environ. Sci. Technol., 22, 1415–1418, 1988.
Brown, S. S., Stark, H., Ciciora, S. J., McLaughlin, R. J., and Ravishankara, A.: Simultaneous in situ detection of atmospheric NO3 and N2 O5 via cavity ring-down spectroscopy, Rev. Sci. Instrum., 73, 3291–3301, 2002.
Chan Miller, C., Gonzalez Abad, G., Wang, H., Liu, X., Kurosu, T., Jacob, D. J., and Chance, K.: Glyoxal retrieval from the Ozone Monitoring Instrument, Atmos. Meas. Tech., 7, 3891–3907, https://doi.org/10.5194/amt-7-3891-2014, 2014.
Coburn, S., Ortega, I., Thalman, R., Blomquist, B., Fairall, C. W., and Volkamer, R.: Measurements of diurnal variations and eddy covariance (EC) fluxes of glyoxal in the tropical marine boundary layer: description of the Fast LED-CE-DOAS instrument, Atmos. Meas. Tech., 7, 3579–3595, https://doi.org/10.5194/amt-7-3579-2014, 2014.
DiGangi, J. P., Henry, S. B., Kammrath, A., Boyle, E. S., Kaser, L., Schnitzhofer, R., Graus, M., Turnipseed, A., Park, J.-H., Weber, R. J., Hornbrook, R. S., Cantrell, C. A., Maudlin III, R. L., Kim, S., Nakashima, Y., Wolfe, G. M., Kajii, Y., Apel, E. C., Goldstein, A. H., Guenther, A., Karl, T., Hansel, A., and Keutsch, F. N.: Observations of glyoxal and formaldehyde as metrics for the anthropogenic impact on rural photochemistry, Atmos. Chem. Phys., 12, 9529–9543, https://doi.org/10.5194/acp-12-9529-2012, 2012.
Duan, J., Qin, M., Ouyang, B., Fang, W., Li, X., Lu, K., Tang, K., Liang, S., Meng, F., Hu, Z., Xie, P., Liu, W., and Häsler, R.: Development of an incoherent broadband cavity-enhanced absorption spectrometer for in situ measurements of HONO and NO2, Atmos. Meas. Tech., 11, 4531–4543, https://doi.org/10.5194/amt-11-4531-2018, 2018.
Fang, B., Zhao, W., Xu, X., Zhou, J., Ma, X., Wang, S., Zhang, W., Venables, D. S., and Chen, W.: Portable broadband cavity-enhanced spectrometer utilizing Kalman filtering: application to real-time, in situ monitoring of glyoxal and nitrogen dioxide, Opt. Express, 25, 26910–26922, 2017.
Fiedler, S. E., Hese, A., and Ruth, A. A.: Incoherent broad-band cavity-enhanced absorption spectroscopy, Chem. Phys. Lett., 371, 284–294, 2003.
Fu, T.-M., Jacob, D. J., Wittrock, F., Burrows, J. P., Vrekoussis, M., and Henze, D. K.: Global budgets of atmospheric glyoxal and methylglyoxal, and implications for formation of secondary organic aerosols, J. Geophys. Res., 113, https://doi.org/10.1029/2007jd009505, 2008.
Gen, M., Huang, D. D., and Chan, C. K.: Reactive Uptake of Glyoxal by Ammonium-Containing Salt Particles as a Function of Relative Humidity, Environ. Sci. Technol., 52, 6903–6911, 2018.
Hamilton, J. F., Baeza-Romero, M. T., Finessi, E., Rickard, A. R., Healy, R. M., Peppe, S., Adams, T. J., Daniels, M. J., Ball, S. M., and Goodall, I. C.: Online and offline mass spectrometric study of the impact of oxidation and ageing on glyoxal chemistry and uptake onto ammonium sulfate aerosols, Faraday Discuss., 165, 447–472, 2013.
Henry, S. B., Kammrath, A., and Keutsch, F. N.: Quantification of gas-phase glyoxal and methylglyoxal via the Laser-Induced Phosphorescence of (methyl)GLyOxal Spectrometry (LIPGLOS) Method, Atmos. Meas. Tech., 5, 181–192, https://doi.org/10.5194/amt-5-181-2012, 2012.
Horbanski, M., Pöhler, D., Lampel, J., and Platt, U.: The ICAD (iterative cavity-enhanced DOAS) method, Atmos. Meas. Tech., 12, 3365–3381, https://doi.org/10.5194/amt-12-3365-2019, 2019.
Kahan, T. F., Washenfelder, R. A., Vaida, V., and Brown, S. S.: Cavity-enhanced measurements of hydrogen peroxide absorption cross sections from 353 to 410 nm, J. Phys. Chem. A, 116, 5941–5947, 2012.
Kraus, S.: DOASIS: A framework design for DOAS, Shaker, 2006.
Kroll, J. H., Ng, N. L., Murphy, S. M., Varutbangkul, V., Flagan, R. C., and Seinfeld, J. H.: Chamber studies of secondary organic aerosol growth by reactive uptake of simple carbonyl compounds, J. Geophys. Res.-Atmos., 110, https://doi.org/10.1029/2005jd006004, 2005.
Kurucz, R. L., Furenlid, I., Brault, J., and Testerman, L.: Solar flux atlas from 296 to 1300 nm, National Solar Observatory, 1984.
Langridge, J. M., Ball, S. M., Shillings, A. J., and Jones, R. L.: A broadband absorption spectrometer using light emitting diodes for ultrasensitive, in situ trace gas detection, Rev. Sci. Instrum., 79, 123110, https://doi.org/10.1063/1.3046282 , 2008.
Li, X., Rohrer, F., Brauers, T., Hofzumahaus, A., Lu, K., Shao, M., Zhang, Y. H., and Wahner, A.: Modeling of HCHO and CHOCHO at a semi-rural site in southern China during the PRIDE-PRD2006 campaign, Atmos. Chem. Phys., 14, 12291–12305, https://doi.org/10.5194/acp-14-12291-2014, 2014.
Liang, S., Qin, M., Xie, P., Duan, J., Fang, W., He, Y., Xu, J., Liu, J., Li, X., Tang, K., Meng, F., Ye, K., Liu, J., and Liu, W.: Development of an incoherent broadband cavity-enhanced absorption spectrometer for measurements of ambient glyoxal and NO2 in a polluted urban environment, Atmos. Meas. Tech., 12, 2499–2512, https://doi.org/10.5194/amt-12-2499-2019, 2019.
Meller, R., Raber, W., Crowley, J. N., Jenkin, M. E., and Moortgat, G. K.: The uv-visible absorption-spectrum of methylglyoxal, J. Photoch. Photobio. A, 62, 163–171, 1991.
Meng, J., Wang, G., Hou, Z., Liu, X., Wei, B., Wu, C., Cao, C., Wang, J., Li, J., Cao, J., Zhang, E., Dong, J., Liu, J., Ge, S., and Xie, Y.: Molecular distribution and stable carbon isotopic compositions of dicarboxylic acids and related SOA from biogenic sources in the summertime atmosphere of Mt. Tai in the North China Plain, Atmos. Chem. Phys., 18, 15069–15086, https://doi.org/10.5194/acp-18-15069-2018, 2018.
Michoud, V., Sauvage, S., Léonardis, T., Fronval, I., Kukui, A., Locoge, N., and Dusanter, S.: Field measurements of methylglyoxal using proton transfer reaction time-of-flight mass spectrometry and comparison to the DNPH-HPLC-UV method, Atmos. Meas. Tech., 11, 5729–5740, https://doi.org/10.5194/amt-11-5729-2018, 2018.
Min, K.-E., Washenfelder, R. A., Dubé, W. P., Langford, A. O., Edwards, P. M., Zarzana, K. J., Stutz, J., Lu, K., Rohrer, F., Zhang, Y., and Brown, S. S.: A broadband cavity enhanced absorption spectrometer for aircraft measurements of glyoxal, methylglyoxal, nitrous acid, nitrogen dioxide, and water vapor, Atmos. Meas. Tech., 9, 423–440, https://doi.org/10.5194/amt-9-423-2016, 2016.
Müller, M., Anderson, B. E., Beyersdorf, A. J., Crawford, J. H., Diskin, G. S., Eichler, P., Fried, A., Keutsch, F. N., Mikoviny, T., Thornhill, K. L., Walega, J. G., Weinheimer, A. J., Yang, M., Yokelson, R. J., and Wisthaler, A.: In situ measurements and modeling of reactive trace gases in a small biomass burning plume, Atmos. Chem. Phys., 16, 3813–3824, https://doi.org/10.5194/acp-16-3813-2016, 2016.
Nakao, S., Liu, Y., Tang, P., Chen, C.-L., Zhang, J., and Cocker III, D. R.: Chamber studies of SOA formation from aromatic hydrocarbons: observation of limited glyoxal uptake, Atmos. Chem. Phys., 12, 3927–3937, https://doi.org/10.5194/acp-12-3927-2012, 2012.
Pang, X., Lewis, A. C., Rickard, A. R., Baeza-Romero, M. T., Adams, T. J., Ball, S. M., Daniels, M. J. S., Goodall, I. C. A., Monks, P. S., Peppe, S., Ródenas García, M., Sánchez, P., and Muñoz, A.: A smog chamber comparison of a microfluidic derivatisation measurement of gas-phase glyoxal and methylglyoxal with other analytical techniques, Atmos. Meas. Tech., 7, 373–389, https://doi.org/10.5194/amt-7-373-2014, 2014.
Rao, A. P.: Absolute Rayleigh scattering cross sections of gases and freons of stratospheric interest in the visible and ultraviolet regions, NASA Technical Note, Alabama, USA, 1977.
Rothman, L. S., Jacquemart, D., Barbe, A., Chris Benner, D., Birk, M., Brown, L. R., Carleer, M. R., Chackerian, C., Chance, K., Coudert, L. H., Dana, V., Devi, V. M., Flaud, J. M., Gamache, R. R., Goldman, A., Hartmann, J. M., Jucks, K. W., Maki, A. G., Mandin, J. Y., Massie, S. T., Orphal, J., Perrin, A., Rinsland, C. P., Smith, M. A. H., Tennyson, J., Tolchenov, R. N., Toth, R. A., Vander Auwera, J., Varanasi, P., and Wagner, G.: The HITRAN 2004 molecular spectroscopic database, J. Quant. Spectrosc. Ra., 96, 139–204, 2005.
Shen, H., Chen, Z., Li, H., Qian, X., Qin, X., and Shi, W.: Gas-Particle Partitioning of Carbonyl Compounds in the Ambient Atmosphere, Environ. Sci. Technol., 52, 10997–11006, 2018.
Sneep, M. and Ubachs, W.: Direct measurement of the Rayleigh scattering cross section in various gases, J. Quant. Spectrosc. Ra., 92, 293–310, 2005.
Stonner, C., Derstroff, B., Klupfel, T., Crowley, J. N., and Williams, J.: Glyoxal measurement with a proton transfer reaction time of flight mass spectrometer (PTR-TOF-MS): characterization and calibration, J. Mass Spectrom., 52, 30–35, 2017.
Tan, Z., Rohrer, F., Lu, K., Ma, X., Bohn, B., Broch, S., Dong, H., Fuchs, H., Gkatzelis, G. I., Hofzumahaus, A., Holland, F., Li, X., Liu, Y., Liu, Y., Novelli, A., Shao, M., Wang, H., Wu, Y., Zeng, L., Hu, M., Kiendler-Scharr, A., Wahner, A., and Zhang, Y.: Wintertime photochemistry in Beijing: observations of ROx radical concentrations in the North China Plain during the BEST-ONE campaign, Atmos. Chem. Phys., 18, 12391–12411, https://doi.org/10.5194/acp-18-12391-2018, 2018.
Thalman, R. and Volkamer, R.: Inherent calibration of a blue LED-CE-DOAS instrument to measure iodine oxide, glyoxal, methyl glyoxal, nitrogen dioxide, water vapour and aerosol extinction in open cavity mode, Atmos. Meas. Tech., 3, 1797–1814, https://doi.org/10.5194/amt-3-1797-2010, 2010.
Thalman, R. and Volkamer, R.: Temperature dependent absorption cross-sections of O-2-O-2 collision pairs between 340 and 630 nm and at atmospherically relevant pressure, Phys. Chem. Chem. Phys., 15, 15371–15381, 2013.
Thalman, R., Baeza-Romero, M. T., Ball, S. M., Borrás, E., Daniels, M. J. S., Goodall, I. C. A., Henry, S. B., Karl, T., Keutsch, F. N., Kim, S., Mak, J., Monks, P. S., Muñoz, A., Orlando, J., Peppe, S., Rickard, A. R., Ródenas, M., Sánchez, P., Seco, R., Su, L., Tyndall, G., Vázquez, M., Vera, T., Waxman, E., and Volkamer, R.: Instrument intercomparison of glyoxal, methyl glyoxal and NO2 under simulated atmospheric conditions, Atmos. Meas. Tech., 8, 1835–1862, https://doi.org/10.5194/amt-8-1835-2015, 2015.
Vandaele, A. C.: High-resolution Fourier transform measurement of the NO2 visible and near-infrared absorption cross sections: Temperature and pressure effects, J. Geophys. Res., 107, https://doi.org/10.1029/2001jd000971, 2002.
Vaughan, S., Gherman, T., Ruth, A. A., and Orphal, J.: Incoherent broad-band cavity-enhanced absorption spectroscopy of the marine boundary layer species I 2, IO and OIO, Phys. Chem. Chem. Phys., 10, 4471–4477, 2008.
Volkamer, R., Molina, L. T., Molina, M. J., Shirley, T., and Brune, W. H.: DOAS measurement of glyoxal as an indicator for fast VOC chemistry in urban air, Geophys. Res. Lett., 32, https://doi.org/10.1029/2005GL022616, 2005a.
Volkamer, R., Spietz, P., Burrows, J., and Platt, U.: High-resolution absorption cross-section of glyoxal in the UV–vis and IR spectral ranges, J. Photoch. Photobio. A, 172, 35–46, 2005b.
Vrekoussis, M., Wittrock, F., Richter, A., and Burrows, J. P.: GOME-2 observations of oxygenated VOCs: what can we learn from the ratio glyoxal to formaldehyde on a global scale?, Atmos. Chem. Phys., 10, 10145–10160, https://doi.org/10.5194/acp-10-10145-2010, 2010.
Wang, H., Chen, J., and Lu, K.: Development of a portable cavity-enhanced absorption spectrometer for the measurement of ambient NO3 and N2O5: experimental setup, lab characterizations, and field applications in a polluted urban environment, Atmos. Meas. Tech., 10, 1465–1479, https://doi.org/10.5194/amt-10-1465-2017, 2017.
Washenfelder, R. A., Langford, A. O., Fuchs, H., and Brown, S. S.: Measurement of glyoxal using an incoherent broadband cavity enhanced absorption spectrometer, Atmos. Chem. Phys., 8, 7779–7793, https://doi.org/10.5194/acp-8-7779-2008, 2008.
Washenfelder, R. A., Young, C. J., Brown, S. S., Angevine, W. M., Atlas, E. L., Blake, D. R., Bon, D. M., Cubison, M. J., de Gouw, J. A., Dusanter, S., Flynn, J., Gilman, J. B., Graus, M., Griffith, S., Grossberg, N., Hayes, P. L., Jimenez, J. L., Kuster, W. C., Lefer, B. L., Pollack, I. B., Ryerson, T. B., Stark, H., Stevens, P. S., and Trainer, M. K.: The glyoxal budget and its contribution to organic aerosol for Los Angeles, California, during CalNex 2010, J. Geophys. Res.-Atmos., 116, https://doi.org/10.1029/2011jd016314, 2011.
Yu, G., Bayer, A. R., Galloway, M. M., Korshavn, K. J., Fry, C. G., and Keutsch, F. N.: Glyoxal in aqueous ammonium sulfate solutions: products, kinetics and hydration effects, Environ. Sci. Technol., 45, 6336–6342, 2011.
Yuan, B., Koss, A. R., Warneke, C., Coggon, M., Sekimoto, K., and de Gouw, J. A.: Proton-Transfer-Reaction Mass Spectrometry: Applications in Atmospheric Sciences, Chem. Rev., 117, 13187–13229, 2017.
Zarzana, K. J., Selimovic, V., Koss, A. R., Sekimoto, K., Coggon, M. M., Yuan, B., Dubé, W. P., Yokelson, R. J., Warneke, C., de Gouw, J. A., Roberts, J. M., and Brown, S. S.: Primary emissions of glyoxal and methylglyoxal from laboratory measurements of open biomass burning, Atmos. Chem. Phys., 18, 15451–15470, https://doi.org/10.5194/acp-18-15451-2018, 2018.