the Creative Commons Attribution 4.0 License.
the Creative Commons Attribution 4.0 License.
 | 10 Sep 2019
Dust mass, cloud condensation nuclei, and ice-nucleating particle profiling with polarization lidar: updated POLIPHON conversion factors from global AERONET analysis
Albert Ansmann
Rodanthi-Elisavet Mamouri
Julian Hofer
Holger Baars
Dietrich Althausen
Sabur F. Abdullaev
The POLIPHON (Polarization Lidar Photometer Networking) method permits the retrieval of particle number, surface area, and volume concentration for dust and non-dust aerosol components. The obtained microphysical properties are used to estimate height profiles of particle mass, cloud condensation nucleus (CCN) and ice-nucleating particle (INP) concentrations. The conversion of aerosol-type-dependent particle extinction coefficients, derived from polarization lidar observations, into the aerosol microphysical properties (number, surface area, volume) forms the central part of the POLIPHON computations. The conversion parameters are determined from Aerosol Robotic Network (AERONET) aerosol climatologies of optical and microphysical properties. In this article, we focus on the dust-related POLIPHON retrieval products and present an extended set of dust conversion factors considering all relevant deserts around the globe. We apply the new conversion factor set to a dust measurement with polarization lidar in Dushanbe, Tajikistan, in central Asia. Strong aerosol layering was observed with mineral dust advected from Kazakhstan (0–2 km height), Iran (2–5 km), the Arabian peninsula (5–7 km), and the Sahara (8–10 km). POLIPHON results obtained with different sets of conversion parameters were contrasted in this central Asian case study and permitted an estimation of the conversion uncertainties.


Increasing urbanization, rising aerosol pollution levels, and the need for an improved understanding of the relationship between aerosols, clouds, and precipitation motivated us to develop a robust and easy-to-handle lidar method for a height-resolved retrieval of particle mass concentration and cloud-relevant parameters (Mamouri and Ansmann, 2016, 2017). The recently introduced POLIPHON (Polarization Lidar Photometer Networking) technique allows the requested aerosol monitoring of environmental and meteorological parameters such as cloud condensation nuclei (CCN) and ice-nucleating particle (INP) concentrations. The method combines the unique features of polarization lidar (see, e.g., Freudenthaler et al., 2009; Tesche et al., 2011) with the well-established global aerosol climatology of aerosol optical and microphysical properties provided by AERONET (Aerosol Robotic Network) (Holben et al., 1998). The polarization lidar technique permits the separation of mineral dust and non-dust aerosol components (such as anthropogenic haze and biomass burning smoke over continents), whereas the multi-year AERONET database allows us to develop climatologically robust relationships between observable aerosol-type-dependent particle optical properties and the desired environmental and cloud-relevant aerosol parameters separately for the basic aerosol types of mineral dust, continental fine-mode aerosol pollution, and marine particles. These two aspects (aerosol type separation and aerosol-type-dependent conversion into respective microphysical properties) are the essential parts of the POLIPHON method, which is described in Sect. 2 with focus on mineral dust applications.
The POLIPHON method can be applied to observations with widespread ground-based single-wavelength polarization lidars (Cordoba-Jabonero et al., 2018) as well as to spaceborne single-wavelength polarization lidar measurements with CALIOP (Cloud-Aerosol Lidar Observations with Orthogonal Polarization) (Winker et al., 2009; Mamouri and Ansmann, 2015; Marinou et al., 2017, 2019). It is also generally applicable to observations with multiwavelength polarization lidars operated in well-organized ground-based lidar networks such as the European Aerosol Research Lidar Network (EARLINET) (Pappalardo et al., 2014) or the Asian Dust Network (Shimizu et al., 2004). POLIPHON products have been successfully compared with in situ measured vertical profiles of particle mass concentration (Mamali al., 2018), CCN (Düsing et al., 2018), and INP concentration (Schrod et al., 2017; Marinou et al., 2019), and recently with fine- and coarse-dust mass concentration, CCN concentration, and INP-relevant aerosol properties observed with research aircraft (over the lidar site) after long-range transport to the Caribbean (Haarig et al., 2019).
In this article, we extend the POLIPHON method towards dust applications around the globe. This effort is triggered for several reasons. First of all, mineral dust is a global player in the climate system by sensitively influencing the radiative transfer in the Earth atmosphere and by serving as an important reservoir for favorable INPs (Hoose and Möhler, 2012; Murray et al., 2012; Kanji et al., 2017). Heterogeneous ice nucleation on dust INPs can initiate ice and precipitation formation already at high temperatures of −15 to −35 ∘C (Seifert et al., 2010). Without aerosol particles ice and rain formation rates would be strongly reduced in the atmosphere. However, and this is the second reason for the dust-related improvements presented here, POLIPHON has, in the majority of case studies, been applied to Saharan dust observations only. Thus, only Saharan-dust-related conversion parameters have been determined so far. Now the following questions arise. Are these Saharan dust conversion factors valid for the different dust regimes around the globe? Do we need different sets of conversion factors for Saharan dust, Middle Eastern dust, East Asian dust, and dust in North and South America, southern Africa, and Australia? In case the differences in the conversion factors for different dust regions are small, are we then able to develop one universal set of conversion factors? This would facilitate the use of the POLIPHON method from space significantly. Guided by these questions we studied the AERONET database regarding the relationship between dust extinction values and dust number, surface, and volume concentrations in large detail. The study presented here was also motivated by the growing PollyNET (Portable Lidar System Network) activities (Baars et al., 2016; Engelmann et al., 2016). Meanwhile, long-term observations are available, e.g., for Greece and Cyprus, Israel, the United Arab Emirates, Tajikistan, and South Korea, and recently also for southern Chile. Many cruises across the Atlantic from northern Germany to southern Africa or South America with a Polly aboard the RV Polarstern have been conducted as well (Kanitz et al., 2013; Bohlmann et al., 2018). However, as mentioned the POLIPHON technique can be applied to any available polarization lidar observation around the world and in space.
The paper is organized as follows. A brief summary of the POLIPHON methodology is given in Sect. 2. with focus on mineral dust and the determination of dust conversion factors from worldwide AERONET observations. We analyzed long-term sun–sky photometer observations of 20 AERONET sites in or close to important mineral dust source regions around the world (AERONET, 2019). The results (conversion factors) of the in-depth AERONET data analysis are presented in Sect. 3. In Sect. 4, we discuss a Polly observation at Dushanbe, Tajikistan, with mineral dust up to the tropopause advected from central Asia (at heights below 2 km above ground), Iran and the Arabian peninsula (2–7 km height range), and the Sahara (above about 8 km height). The case study is used to demonstrate the full potential of the POLIPHON method for mineral dust profiling with the updated AERONET-based dust conversion factors and also how to estimate the conversion uncertainties in the POLIPHON products. Concluding remarks are given in Sect. 5.
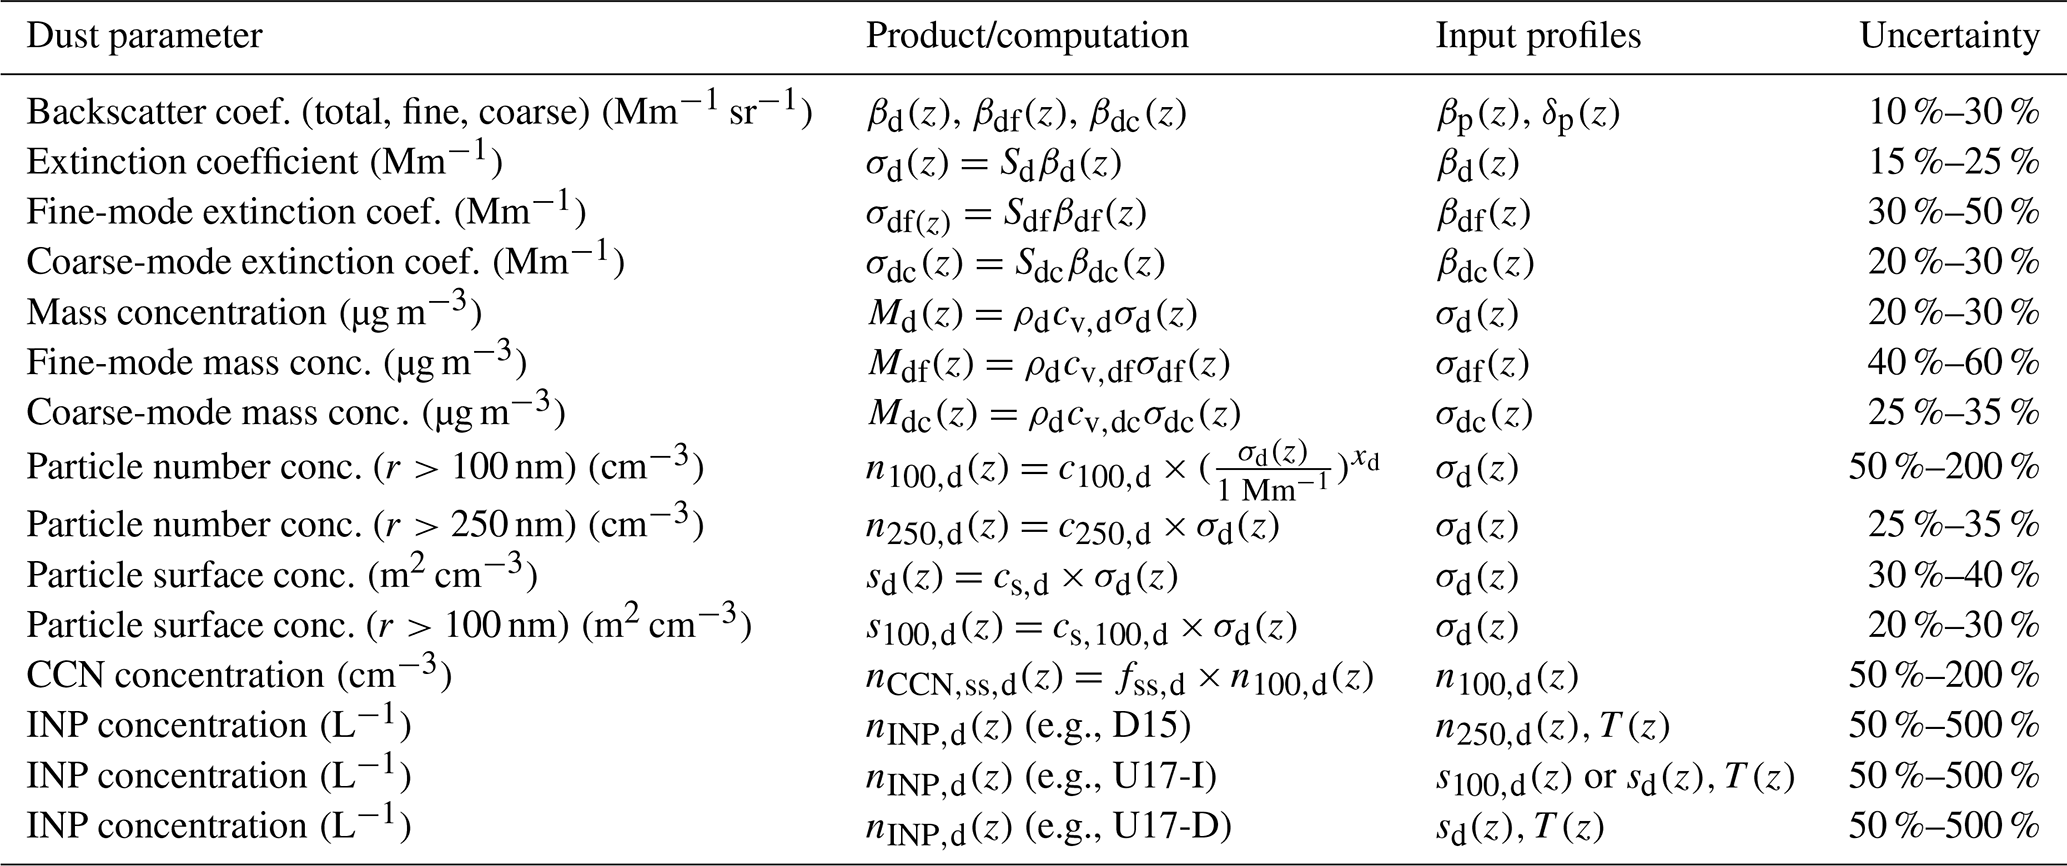
Table 1Overview of the dust-related computations and conversions within the POLIPHON data analysis. The needed conversion factors cv,d, cv,df, cv,dc, cs,d, , c100,d, and c250,d are listed in Table 4. In addition to the aerosol backscatter and extinction input profiles, β(z) (Mm−1 sr−1) and σ(z) (Mm−1), the temperature profile T(z) (K) is required in the nINP,d estimation. r denotes the radius of the particles. Uncertainties (right column) are discussed in Mamouri and Ansmann (2016, 2017). Minimum values of the given uncertainty ranges represent typical relative errors in the case of moderate to strong dust concentrations. The maximum values consider the potentially high uncertainties in the conversion factors, the needed input parameters, and applied INP parameterizations. See text in Sect. 2 for more details of the different retrieval steps, input parameters, and products.
2.1 Summary of the POLIPHON method with focus on dust
The POLIPHON method is described in detail by Mamouri and Ansmann (2014, 2015, 2016, 2017) and with respect to the INP concentration retrieval also by Marinou et al. (2019). The main part of the POLIPHON data analysis deals with the conversion of aerosol-type-dependent particle extinction coefficients into respective particle microphysical properties. Table 1 provides an overview of POLIPHON dust products and the respective conversions. Similar conversions for non-dust aerosols such as maritime particles or continental fine-mode aerosol pollution (urban haze, biomass burning smoke) can be found in Mamouri and Ansmann (2016, 2017).
Table 2Lidar ratios for different desert regions from AERONET observations at 675 nm (Shin et al., 2018) and from numerous lidar observations at 532 nm. Recommendations for lidar ratios to be used in the POLIPHON data analysis are given in the right column.
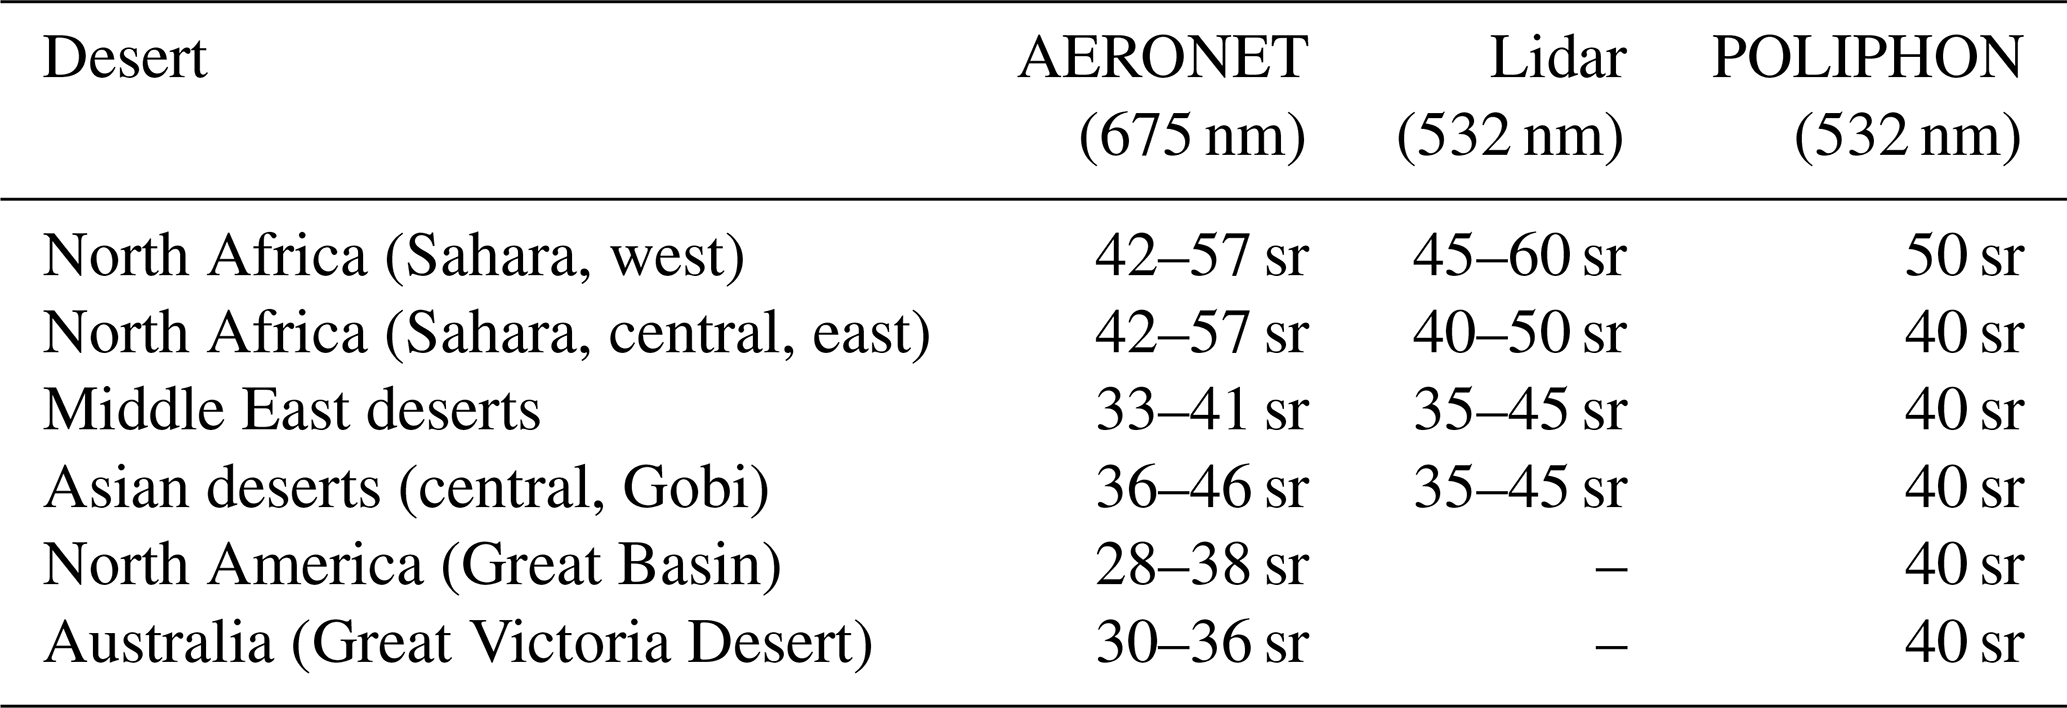
In the first part of the POLIPHON data analysis, the polarization lidar observations are analyzed to obtain height profiles of dust and non-dust backscatter coefficients. Here we assume that pure dust causes particle linear depolarization ratios of 0.3–0.35 around the globe, disregarding the dust source region. This is corroborated by numerous studies (see the reviews in Tesche et al., 2009; Mamouri and Ansmann, 2014, 2017) and also during recent field campaigns (Groß et al., 2015; Veselovskii et al., 2016; Haarig et al., 2017; Hofer et al., 2017). Details of the aerosol type separation procedure (including the separation of fine and coarse dust by the use of fine-mode- and coarse-mode-related dust depolarization ratios) can be found in Mamouri and Ansmann (2014, 2017). The derived total, fine-, and coarse-dust backscatter coefficients βd, βdf, and βdc are then converted to respective dust extinction values σd, σdf, and σdc by means of appropriate dust extinction-to-backscatter ratios or lidar ratios Sd, Sdf, and Sdc. As shown in Table 2, the 532 nm dust lidar ratio Sd may vary from about 30 to 60 sr for different mineral dust types (Müller et al., 2007; Tesche et al., 2011; Mamouri et al., 2013; Nisantzi et al., 2015; Groß et al., 2015; Veselovskii et al., 2016; Haarig et al., 2017; Hofer et al., 2017; Shin et al., 2018). However, for most dust regions, except the western Sahara, the typical dust lidar ratio is 40 sr at 532 nm. We therefore recommend using 40 sr as dust lidar ratio and to select 50 sr only in cases with airflow from the western Sahara. The best option is however to use actual Raman lidar observations of the dust lidar ratio. We further assume that (see lines 2–4 in Table 1). A relative uncertainty in the dust lidar ratio assumptions of 10 % is considered in the estimation of the relative uncertainties (error propagation) in Table 1.
In the second part of the POLIPHON data analysis (see Table 1, lines 5–15), the height profile of the dust mass concentration Md(z) is derived from the dust extinction coefficients σd(z), also separately for coarse dust (Mdc considering particles with a radius >500 nm) and fine dust (Mdf considering dust particles with radius <500 nm) from respective coarse- and fine-dust extinction coefficients σdc and σdf. The dust extinction coefficients are converted into dust particle volume concentrations vd, vdc, and vdf by means of extinction-to-volume conversion factors cv,d, cv,df, and cv,dc, and afterwards multiplied by the dust particle density ρd of 2.6 g cm−3 (Ansmann et al., 2012) to obtain the respective dust mass concentrations. The required conversion factors are determined from AERONET observations as described in Sects. 2.2 and 3.1.
Further POLIPHON conversion products listed in Table 1 (lines 8–15) are needed in the estimation of the cloud-relevant aerosol parameters such as the cloud condensation nucleus concentration (CCNC) and ice-nucleating particle concentration (INPC). The number concentration n100,d (considering particles with radius >100 nm) is a good proxy for the dust CCNC (Mamouri and Ansmann, 2016; Lv et al., 2018). However, CCNC depends on the water supersaturation at cloud base where aerosol particles mainly enter the cloud and serve as CCN. A typical water supersaturation value is 0.2 % (Siebert and Shaw, 2017) and occurs when air parcels are lifted into the base of a liquid water cloud by weak updrafts, e.g., in the case of fair weather cumuli. Water supersaturation values may exceed even 1 % in strong updrafts. For the conversion of σd into number concentration n100,d, the conversion parameters c100,d and exponent xd as shown in Table 1 are used and obtained from the AERONET observations (see Sects. 2.2 and 3.2).
We introduce the factor fss,d to consider the water supersaturation dependence. With increasing supersaturation at cloud base an increasing number of dust particles (i.e., particles with lower radius) can be activated as CCN. For a supersaturation value of 0.4 % even dust particles with radius of 70–80 nm become activated. According to Shinozuka et al. (2015), is appropriate when using n100,d as the basic aerosol parameter in the CCNC estimation but the supersaturation is 0.4 % (see Mamouri and Ansmann, 2016, for more details). For completeness, in Table 1, fss,d is 1.0, and the respective equation holds for a liquid-water supersaturation level of 0.2 %.
The particle number concentration n250,d (considering particles with radius >250 nm, Table 1, line 9) and the dust particle surface area concentration sd (line 10) and s100,d (considering only particles with radius >100 nm, line 11) are input in the estimation of height profiles of dust INPC when using the INPC parameterization for immersion freezing of DeMott et al. (2015) (Table 1, line 13, D15) and Ullrich et al. (2017) (line 14, U17-I) and for deposition nucleation of Ullrich et al. (2017) (line 15, U17-D). For the conversion of σd into number concentration n250,d and surface area concentrations sd and s100,d the conversion factors c250,d, cs,d, and are required. In addition to aerosol number and surface concentrations, the temperature profile T(z) and an assumed ice supersaturation value Sice (in the case of deposition-freezing INPC, U17-D) are input in the INPC estimation. The ice supersaturation Sice is set to a typical value of 1.15.
We introduce a new parameter (not considered in Mamouri and Ansmann, 2016), namely the surface area s100,d as an alternative input parameter in the estimation of immersion freezing INPC. In the case of immersion freezing, liquid droplets form first before freezing occurs. As discussed above, appropriate dust CCN for typical water supersaturation values of 0.2 % have a radius >100 nm. Only these particles (immersed in the liquid droplets) can then serve as INPs so that the surface area s100,d may be a more appropriate aerosol proxy in the INP estimation by using the immersion freezing parameterization U17-I (Ullrich et al., 2017) than the total surface area concentration sd. However, both parameters (sd, s100,d) are required in the INP parameterization. For deposition nucleation (heterogeneous ice nucleation by water vapor deposition directly on dust particles, without any liquid phase formation), sd is the relevant aerosol input parameter. All this is described in detail in Mamouri and Ansmann (2016). More details on the INPC retrieval are also given in Sect. 4.
Table 1 also provides an overview of the uncertainties in the POLIPHON products (Mamouri and Ansmann, 2016, 2017). The very large uncertainties in the estimation of n100,d, nCCN,d, and nINP,d (factor of 2–5) are obtained when taking all potential error sources into consideration. INPC parameterizations developed from field observations (for aerosol types that are sometimes not well characterized) and from laboratory experiments with fresh rather than aged dust particles, i.e., chemically and cloud-processed dust particles, must always be handled with care and may not be fully applicable to atmospheric conditions with predominantly aged dust so that uncertainties of the order of a magnitude can not be excluded. However, meanwhile a variety of studies indicate that uncertainties in the nCCN,d and nINP,d values of the order of 50 % are more realistic to characterize the errors in lidar-based CCNC and INPC estimations (Düsing et al., 2018; Marinou et al., 2019; Haarig et al., 2019). Uncertainties of 50 % are acceptable in process studies of aerosol–cloud interaction performed to investigate the role of dust in cloud evolution processes. Even uncertainties of a factor of 2–5 are acceptable in attempts to establish a vertically resolved tropospheric climatology for CCNC and INPC. Upper tropospheric long-term observations of INPC are not available in the literature, but strongly required (even if the uncertainties are high) to support weather and climate modeling.
2.2 POLIPHON dust conversion parameters
Trustworthy and climatologically robust conversion parameters obtained from AERONET observations are of central importance for the applicability and attractiveness of the POLIPHON method. For our study, we downloaded the following data sets of AERONET products (single measurements, inversion products, version 3, level 2.0) (AERONET, 2019): (1) the particle volume size distribution resolved in 22 size classes from 50 nm (bin 1) to 15 µm (bin 22), (2) the corresponding data sets of total, fine-mode-, and coarse-mode-related volume concentrations and effective radii (from which surface area concentrations can also be calculated), and (3) the corresponding data set of aerosol optical thickness (AOT) for eight wavelengths (denoted as extinction AOT in the AERONET database) together with respective Ångström exponents (AEs) for the 440–870 nm wavelength range. Details of the AERONET data-processing steps are given in Mamouri and Ansmann (2014, 2015, 2016, 2017).
To obtain climatologically representative dust conversion factors for a given AERONET station, we filtered out all AERONET data sets fulfilling the constraints of an Ångström exponent AE <0.3 and a 532 nm AOT >0.1. The AOT for 532 nm (in the following equations simply denoted as τd) is obtained from the 500 nm AOT τ500 and the Ångström exponent a, stored in the AERONET database, by
More information on the dust selection criteria is given in Sect. 3.
It is noteworthy to mention that recent airborne in situ observations of dust size distributions over the Sahara and remote dust outflow regions by Ryder et al. (2019) indirectly corroborate the applicability of the AERONET data analysis and inversion concept and therefore the high quality and consistency of the AERONET optical and microphysical data sets used in our study (AERONET, 2019). The AERONET inversion method required to obtain the dust microphysical properties from the measured optical properties assumes that only particles with a radius ≤15 µm are responsible for the observed dust-related optical effects. The presence of larger dust particles is ignored. Ryder et al. (2019) now show that dust particles with a radius >15 µm contribute only 1 %–3 % to the particle extinction coefficient at 550 nm. This means that this size cutoff effect in the AERONET data inversion procedure has practically no impact on the AERONET inversion products and thus a negligible influence on the derived POLIPHON conversion factors.
In the following, we use the example of the POLIPHON dust mass concentration retrieval to explain the role of the conversion factors and how we derived them from the AERONET database. The mass concentration of dust (index d) is given by
with the dust particle density ρd of 2.6 g cm−3 and the dust volume concentration vd. The required dust volume concentration in Eq. (2) can be obtained from the following conversion:
with the extinction-to-volume conversion factor (derived from the AERONET long-term observations) and the particle extinction coefficient σd,λ measured with lidar at wavelength λ. We concentrate on lidar observations at 532 nm in this study and omit the wavelength index λ in the following. The conversion factor is obtained from the AERONET observations of the vertically integrated particle volume concentration Vd (denoted also as column volume concentration) and the aerosol optical thickness τd (AOT at 532 nm, see Eq. 1),
To provide a link to the lidar-derived height profile of σd(z) (see Eq. 3), we introduce an aerosol layer depth with an arbitrarily chosen vertical extent D. With D, Eq. (4) can be written as
with the layer mean volume concentration vd and the layer mean particle extinction coefficient σd. For simplicity, we assume that all aerosol is confined to the introduced layer with vertical depth D. We may interpret this layer as the dust-containing boundary layer or as a lofted dust layer with a vertical extent D. The introduced layer depth D has no impact on the further retrieval of the conversion factors and is only required to move from column-integrated values and AOT to more lidar-relevant quantities like concentrations and extinction coefficients.
To obtain a climatologically representative dust conversion factor for a given AERONET station, we selected all individual dust observations (from number j=1 to Jd collected over many years), as mentioned defined by an Ångström exponent AE <0.3 and 532 nm AOT >0.1. For each dust observation j we computed and then determined the mean value, which we interpret as the climatologically representative POLIPHON conversion factor,
In the same way, all other conversion parameters in Table 1 are computed:
As before, indices df and dc denote fine-mode and coarse-mode dust fractions, respectively. In Mamouri and Ansmann (2015, 2016), we explain how we calculate , sd,j, and (discussed below) from the downloaded AERONET size distribution data sets.
In the retrieval of the conversion parameters required to obtain n100,d (Table 1, line 8), we used a different approach. Following the procedure suggested by Shinozuka et al. (2015), we applied a log–log regression analysis to the log(n100,d)–log(σd) data field for each of the considered 20 AERONET stations and determined in this way representative values for c100,d and xd that best fulfill the relationship,
as will be shown in the next section.
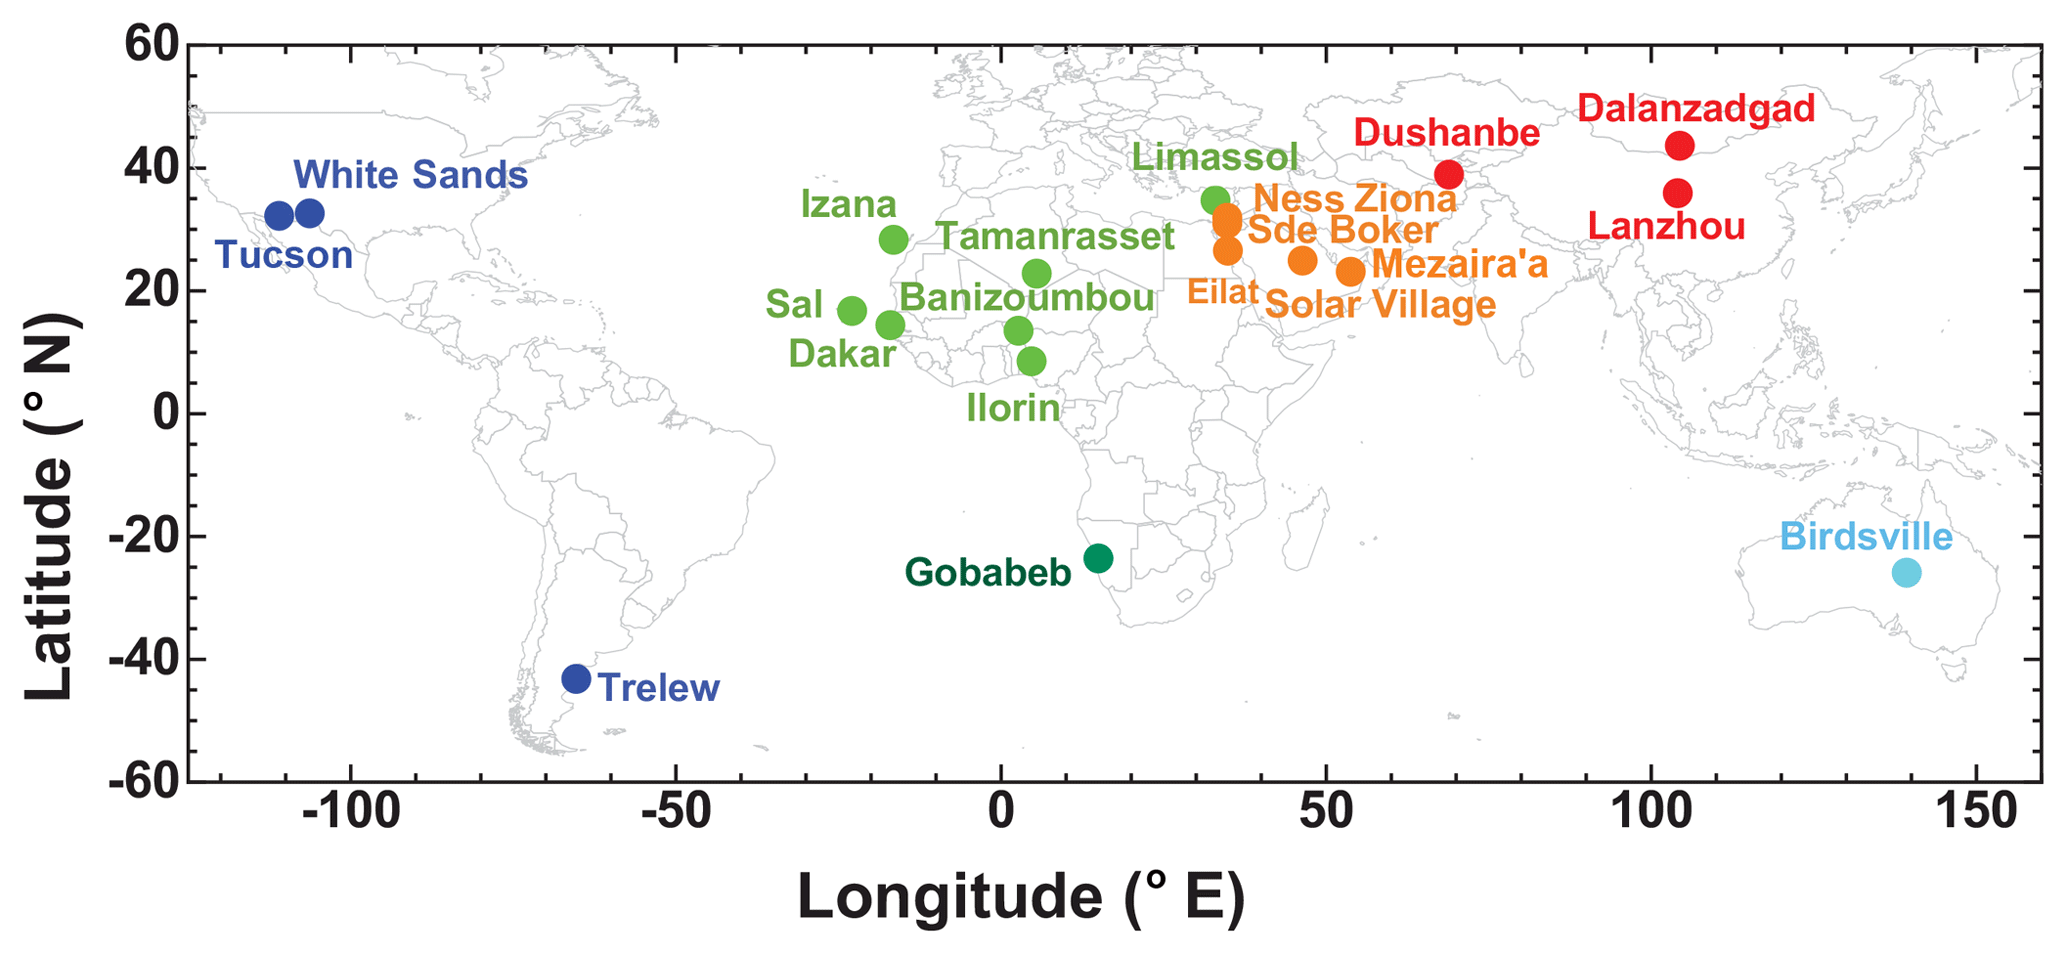
Figure 1Overview of the 20 AERONET stations used in this study.
Table 3Overview of AERONET stations, selected observational periods for which version 3 level 2.0 data are available (Giles et al., 2019), total number of observations (inversion products), 532 nm AOT (mean and SD), dust-related inversion cases Jd (AE <0.3, AOT >0.1), and 532 nm AOT (mean and SD) for the dust observations only.
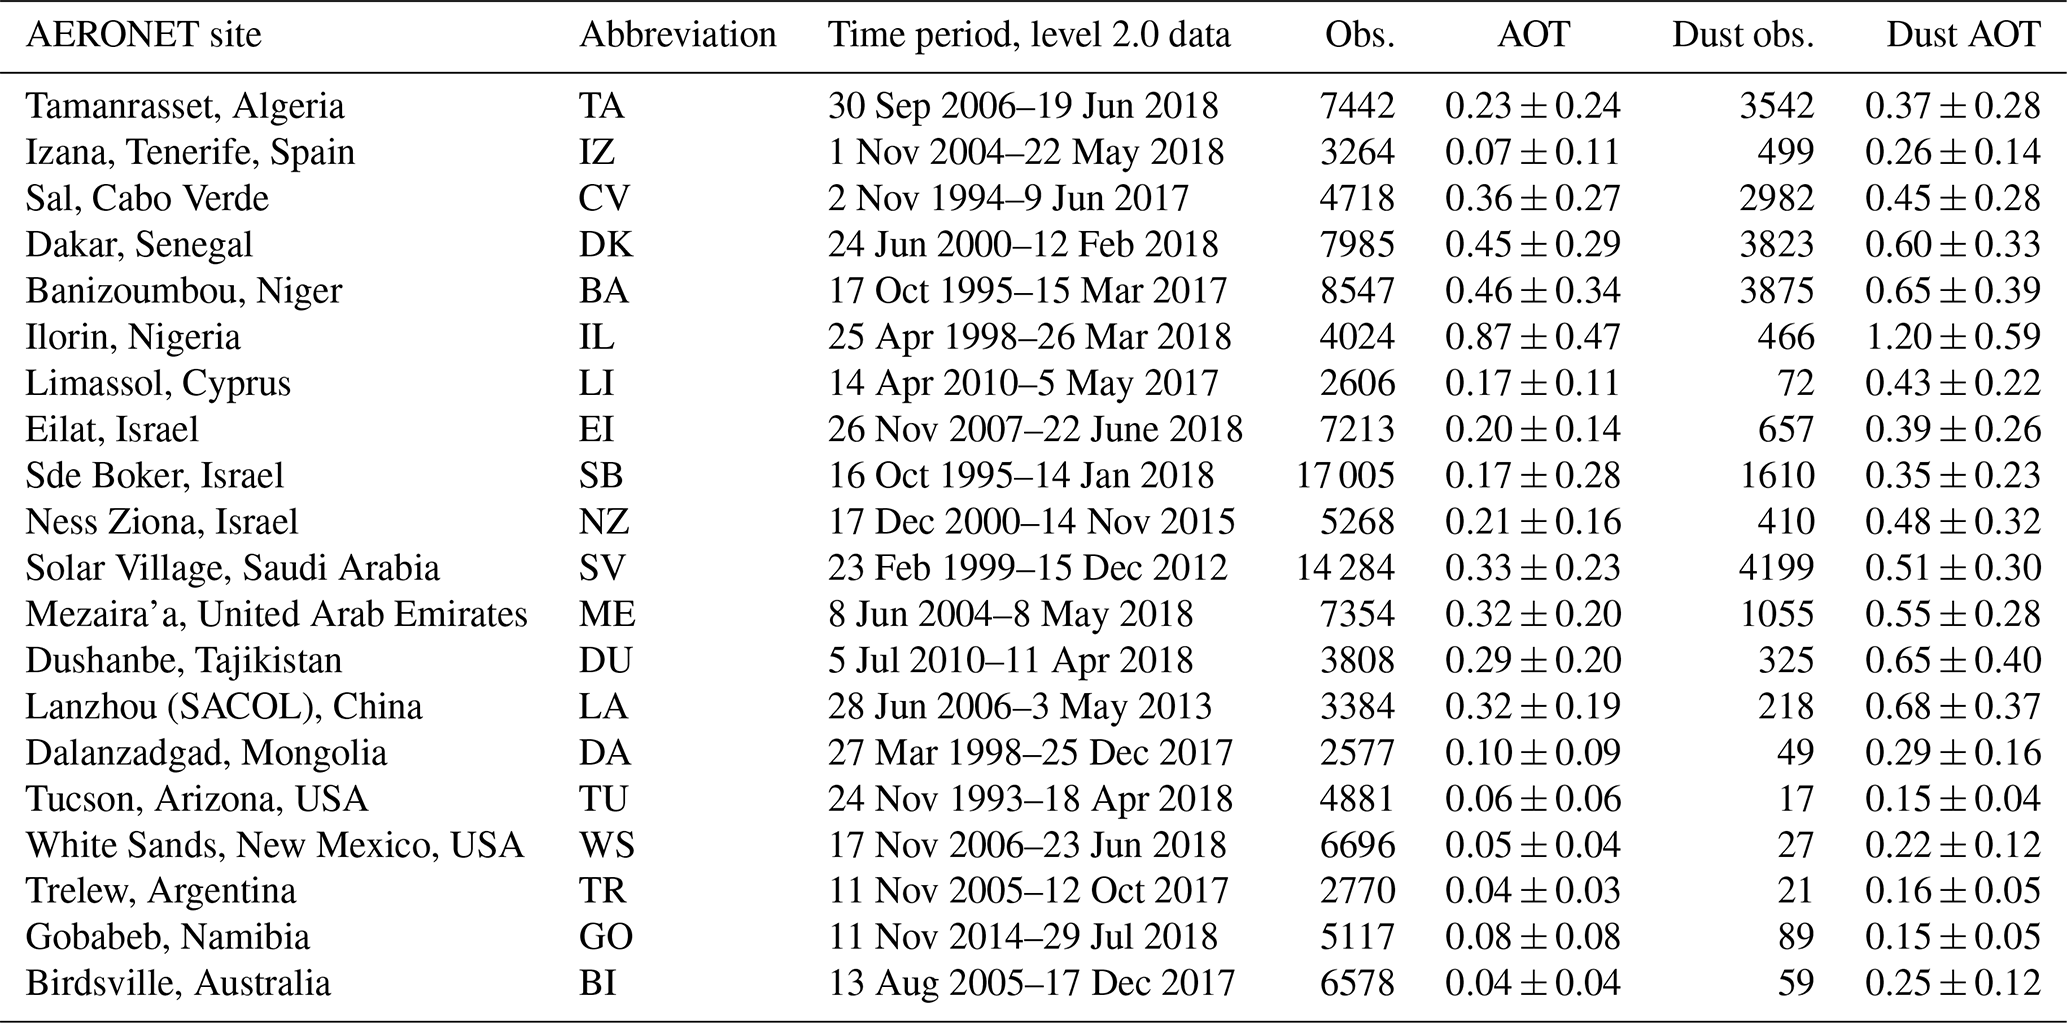
The AERONET sites considered in our study are shown in Fig. 1. Table 3 provides an overview of the stations together with the considered measurement periods, numbers of available individual observations, and the dust-related observations Jd in Eqs. (6)–(11), and mean aerosol and dust AOT values. We preferred stations in Africa, the Middle East, and Asia with long data records and large numbers of observations. As can be seen in Table 3, the number of useful dust observations (AE <0.3, AOT >0.1) ranges from 218 to 4199 for 13 out of the 20 sites and is thus sufficiently high enough for the statistical analysis. The first six stations (from Tamanrasset to Ilorin) in Table 3 are exclusively influenced by Saharan dust, the next six stations (Limassol to Mezaira'a) by Saharan and Middle Eastern (mainly Arabian desert) dust, and by three stations in central and East Asia (Dushanbe to Dalanzadgad), which are influenced by long-range transport from the Sahara and western Asian deserts (including deserts in Iran and Kazakhstan) but also strongly by desert dust from the Taklamakan and Gobi deserts (Lanzhou, Dalanzadgad). The Limassol data sets belong to the Sahara group because the majority of dust outbreaks contain Saharan dust (Nisantzi et al., 2015). Sun photometer observations in North America (Great Basin, Tucson, White Sands), southern America (Patagonian desert, Trelew), southern Africa (Kalahari Desert, Gobabeb), and in the central Australian desert (Birdsville) complete our global AERONET dust data set. It was difficult to find AERONET stations in North and South America with a useful number of cases indicating pure dust observations.
We defined an ambitious, quite demanding criterion to filter out the pure dust cases for our study. The constraints AOT >0.1 at 532 nm and Ångström exponents AE <0.3 for the 440–870 nm wavelength range guarantee that interference by anthropogenic pollution, biomass burning smoke, and marine particles is of minor importance. The mean values and standard deviations for dust AOT in Table 3 indicate that even for stations with relatively low mean dust AOT (Izana in the free troposphere, and for the stations in America and Australia), the impact of marine aerosol (showing approximately the same size distribution and AE characteristics as mineral dust and causing AOT of around 0.05) was still low. A sensitive impact of fine-mode-dominated fire smoke and urban haze on the conversion calculations is also unlikely as long as AE<0.3. Additional smoke contributions immediately lead to AE values clearly above 0.5 as our field campaign experience indicates (Tesche et al., 2009; Nisantzi et al., 2014; Hofer et al., 2017).

Figure 2Relationship between dust extinction coefficient σd (532 nm) and (a) dust particle number concentration n250,d, (b) surface area concentration sd, and (c) volume concentration vd. Correlations are shown for dust-dominated AERONET data sets (AE <0.3 and AOT >0.1 or σd>100 Mm−1) collected at sites in or close to major desert regions around the globe (indicated by different colors; see map in Fig. 1). The slopes of the dark green lines indicate the mean increase in n250,d, sd, and vd with σd for the African stations as defined in Sect. 2 and thus indicate the conversion factors c250,d (a, Eq. 9), cs,d (b, Eq. 10), and cv,d (c, Eq. 6), also given as numbers in (a), (b), and (c). All conversion parameters obtained from the entire AERONET analysis are listed in Table 4.
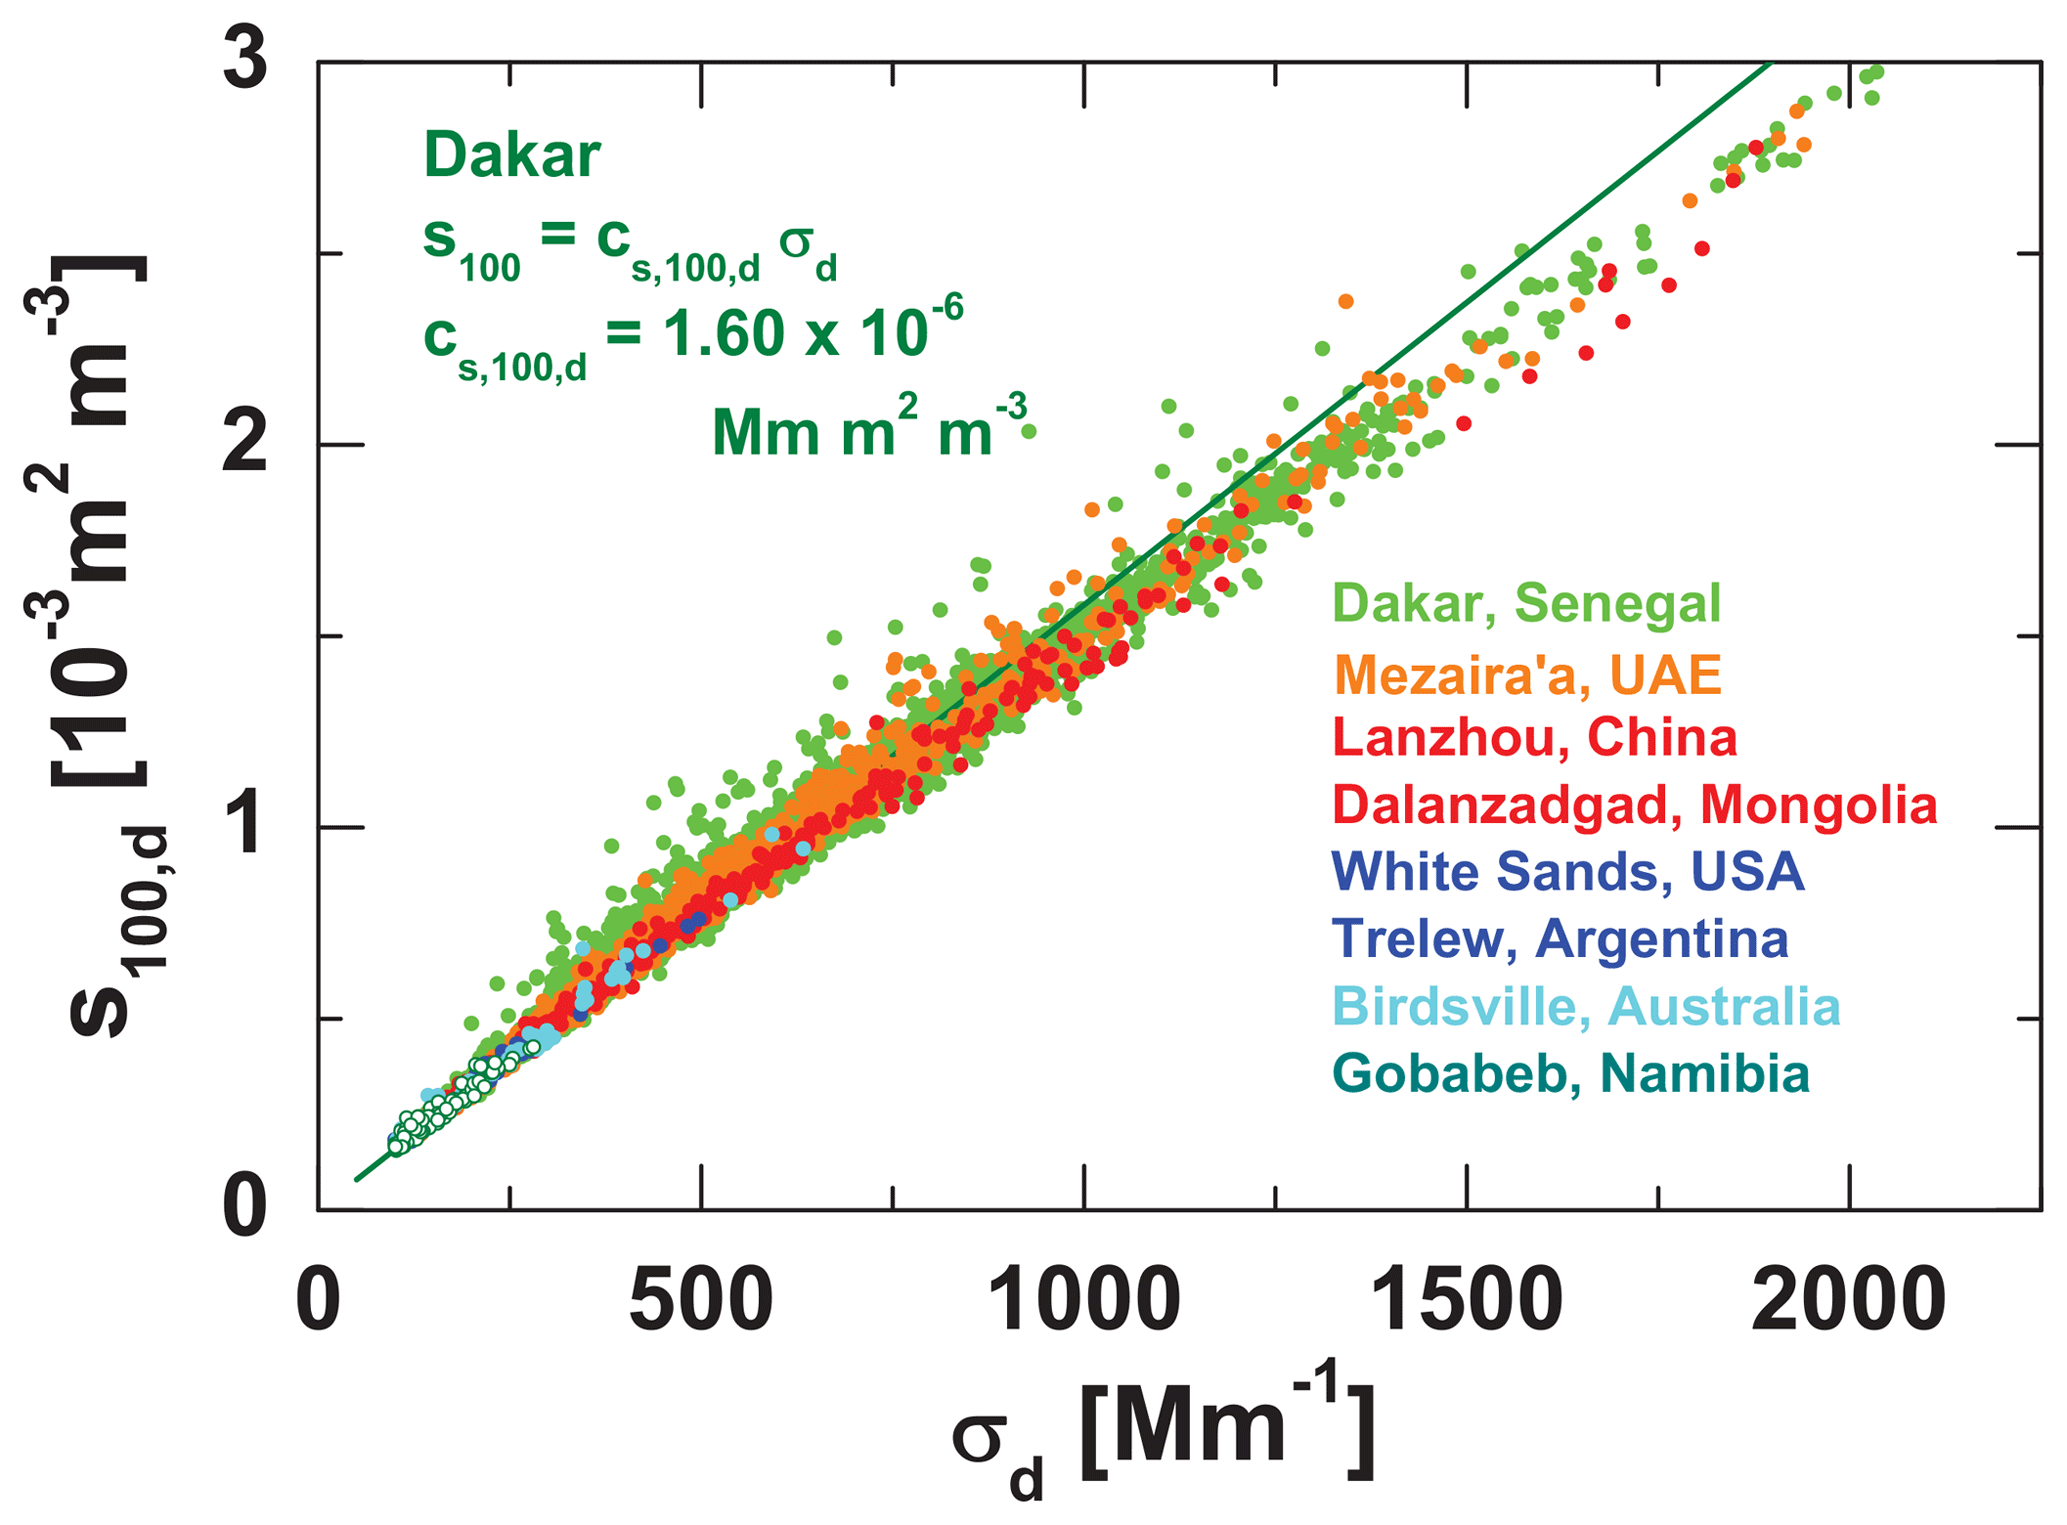
Figure 3Same as Fig. 2b, except for the relationship between dust extinction coefficient σd (532 nm) and surface area concentration s100,d considering particles with radius >100 nm only. The slope of the dark green line indicates the mean increase in s100,d with σd for Dakar, Senegal, as defined in Sect. 2 (Eq. 11).
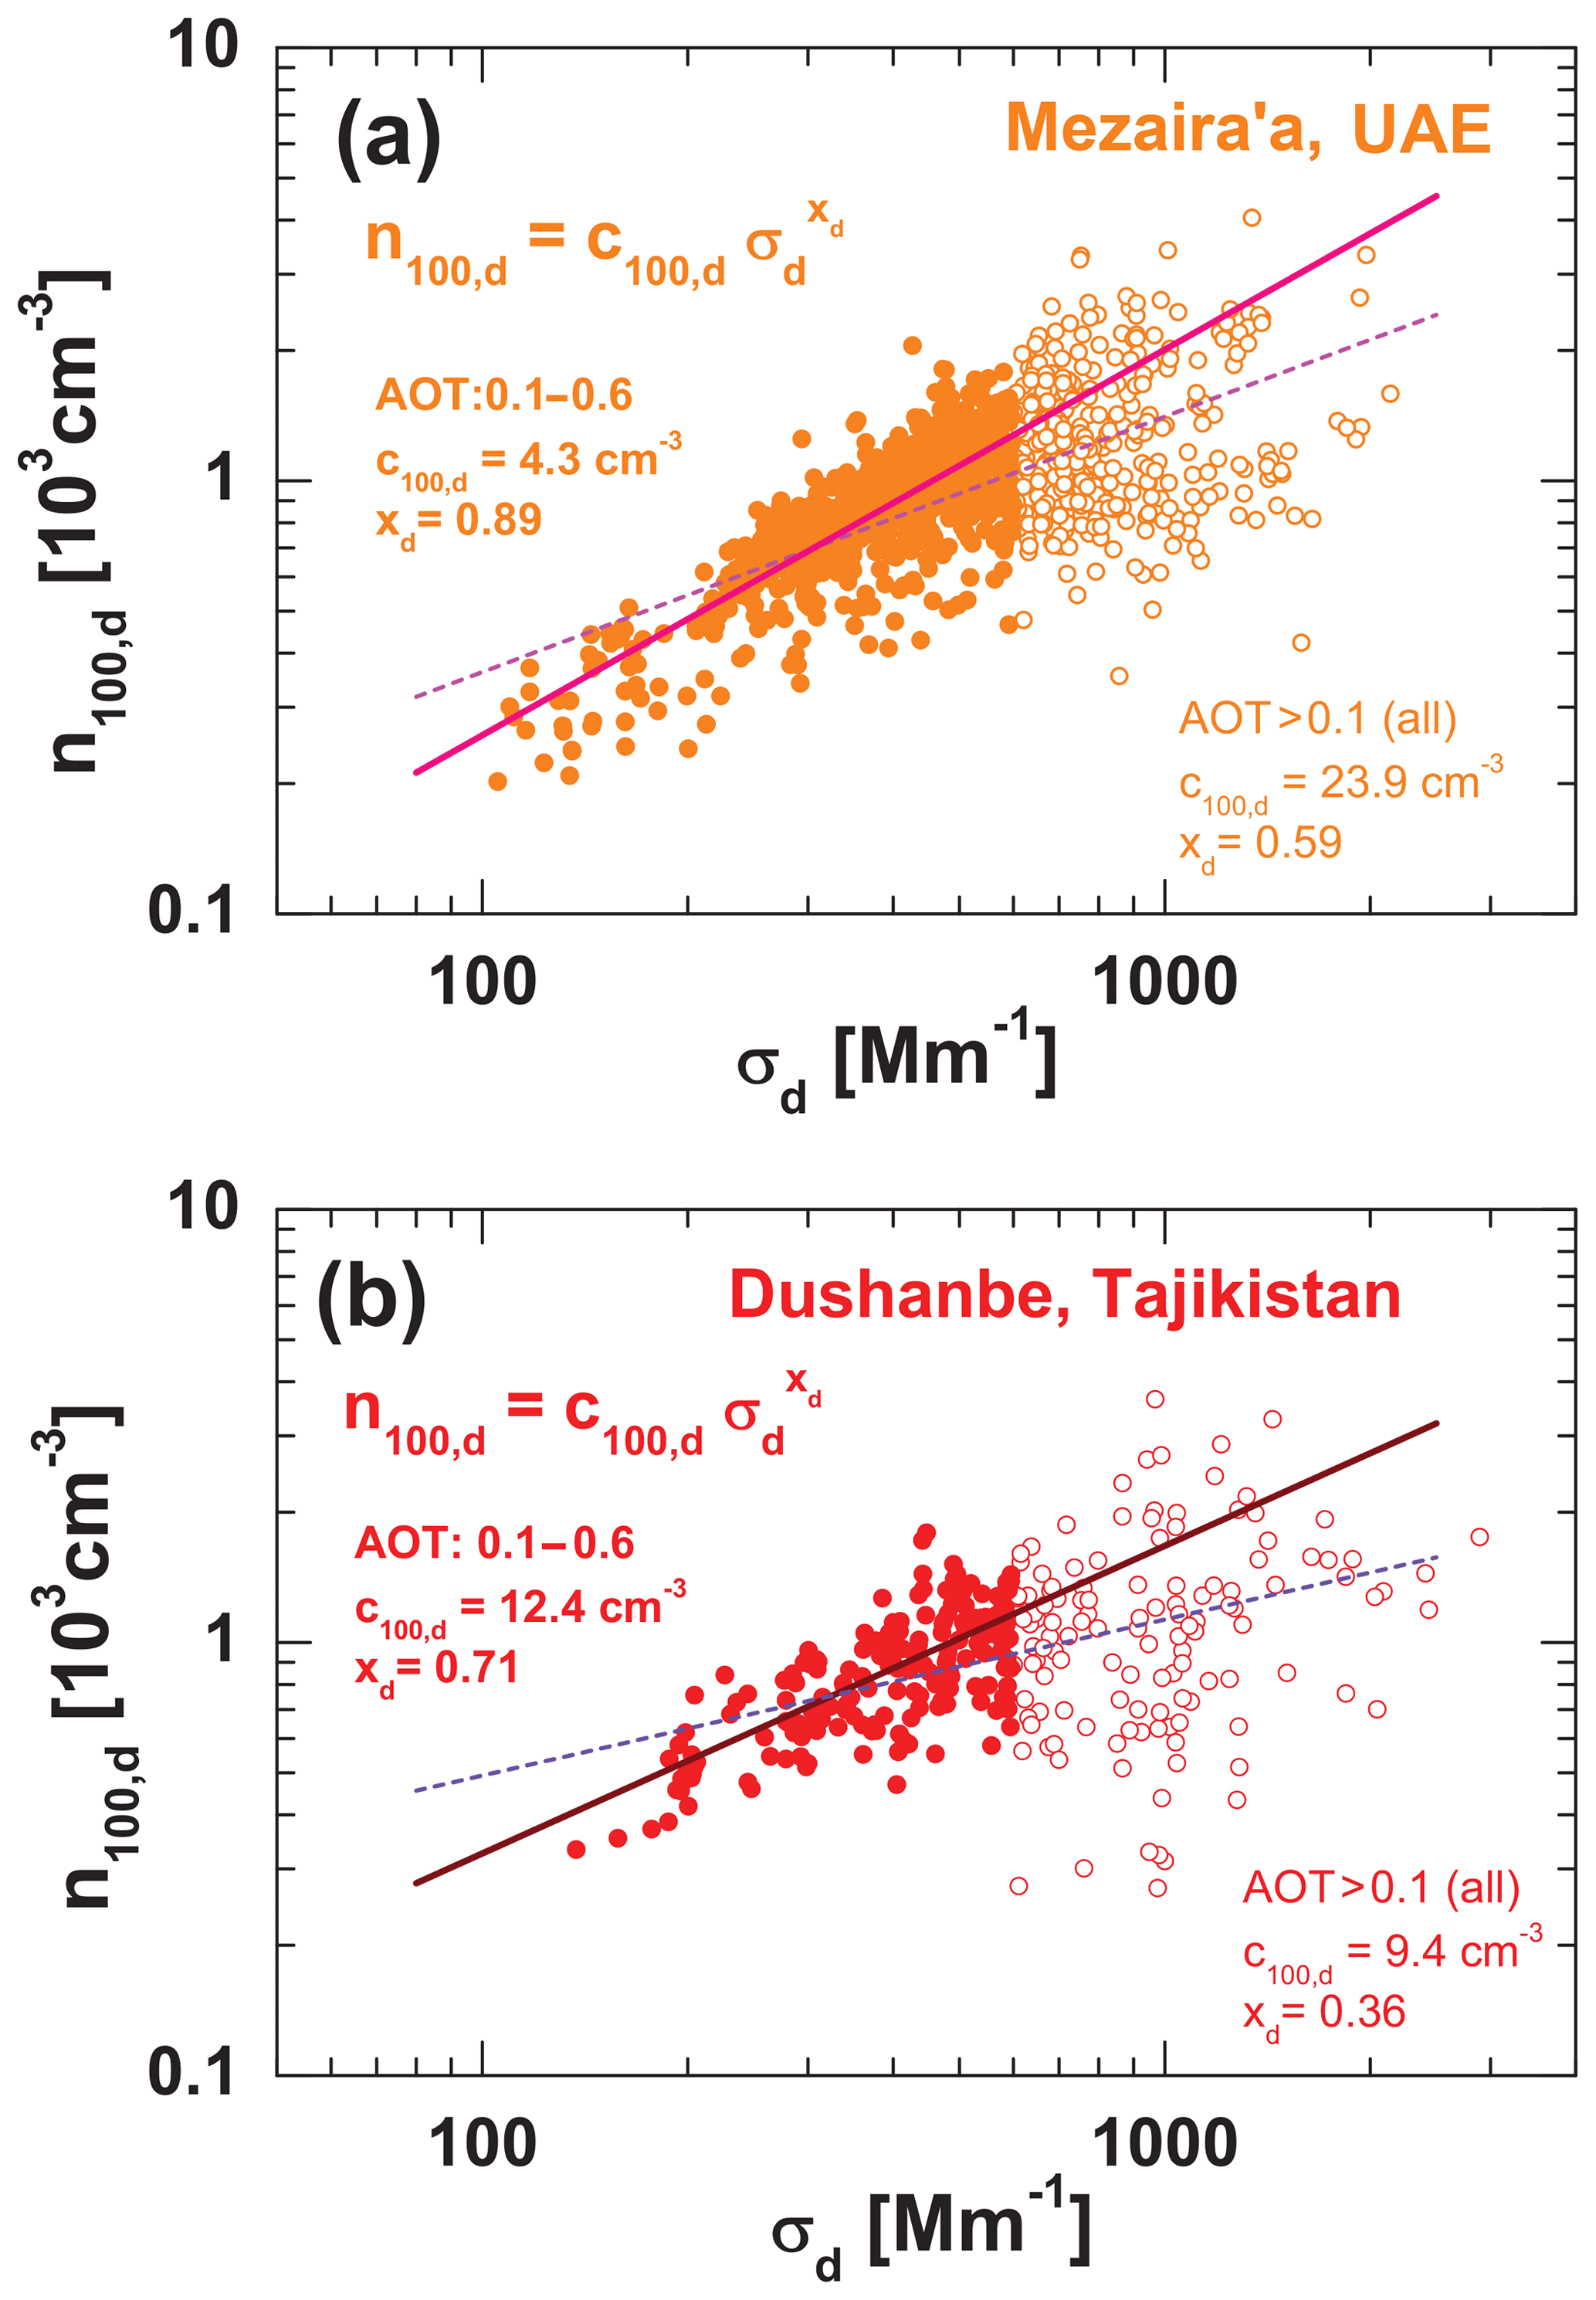
Figure 4Relationship between dust extinction coefficient σd (532 nm) and dust particle number concentration n100,d for AERONET dust observations at (a) Mezaira'a and (b) Dushanbe. Closed circles show the observations considering only 532 nm AOT values from 0.1 to 0.6. The open circles show all available observations (up to AOT of 3.0 or σd=3000 Mm−1). The regression analysis is applied to the log(n100,d)–log(σd) data field for each of the four data sets. The results of the analysis are given as numbers in the figures. The straight lines indicate the mean increase in log(n100,d) with log(σd) and thus the σd exponent xd (see Table 1, line 8, equation for n100,d).
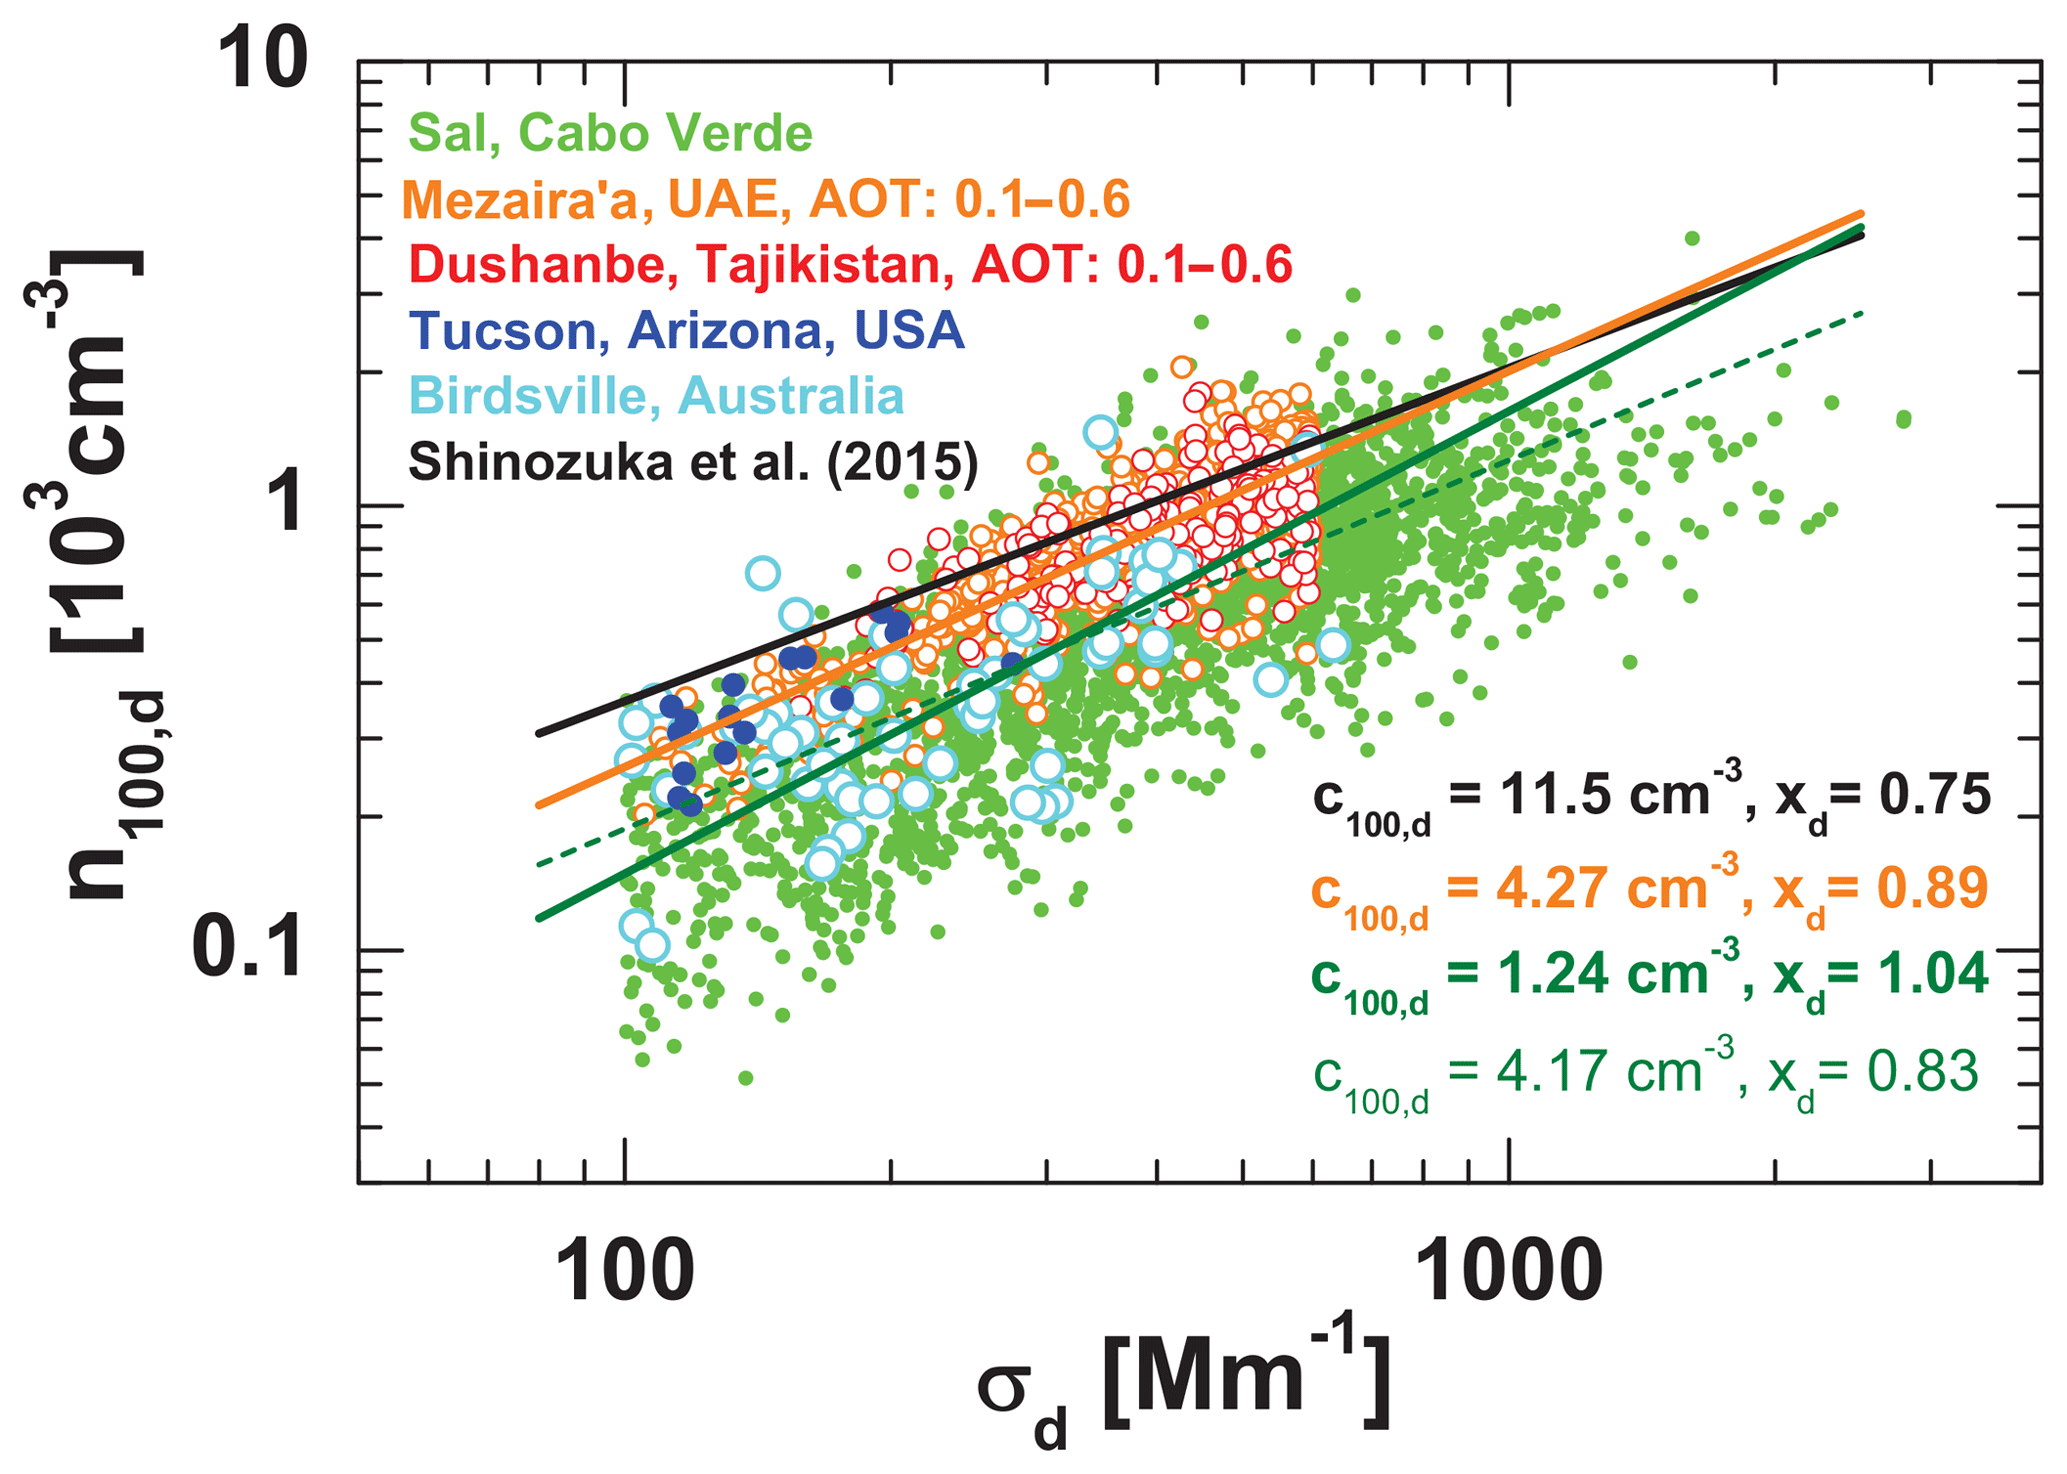
Figure 5Relationship between dust extinction coefficient σd (532 nm) and dust particle number concentration n100,d for different dust-dominated AERONET data sets collected at the indicated stations. The given regression analysis results and straight lines are based on observations at Mezaira'a (open orange circles, orange line, AOT from 0.1 to 0.6) and Cabo Verde (green closed circles, dark dashed green line, AOT from 0.1 to 3.0, and dark green thick solid line, AOT from 0.1 to 0.6). The dust conversion parameters presented by Shinozuka et al. (2015) are shown for comparison (black line and black c100,d and xd values).
3.1 Correlations between n250,d, sd, s100,d, and vd with dust extinction coefficient σd
In order to illustrate the variability in the POLIPHON conversion factors (summarized in Sect. 3.3 and Table 4), we start with basic correlations between the dust microphysical properties and the dust extinction coefficient. Figure 2 provides an overview of the relationship between the dust particle number concentration of larger particles n250,d and the dust extinction coefficient σd in (a), dust particle surface area concentration sd and σd in (b), and between the dust volume concentration vd and σd in (c). A total of 12 different AERONET stations are considered in the figure. The mean conversion factors c250,d (Eq. 9), cs,d (Eq. 10), and cv,d (Eq. 6) for the Saharan dust stations of Sal, Cabo Verde (a); Dakar, Senegal (b); and Tamanrasset, Algeria (c), are indicated as straight lines (regression lines). These stations are exclusively influenced by Saharan dust.
We simply set the layer depth D in Eq. (5) to 1000 m so that σd (in Mm−1 in Fig. 2) divided by 1000 yields the basic AERONET 532 nm AOT value. We selected different colors to distinguish Saharan dust observations (green), Middle Eastern measurements (orange), and data collected in central and East Asia (red). We used bluish colors (blue, cyan) for the American and Australian stations (respectively) and blue-green for the African site (in the Southern Hemisphere) of Gobabeb.
As can be seen in Fig. 2, there are no large differences in the correlation features for the different AERONET stations. The given Saharan dust conversion factors in (a) for Cabo Verde (based on 2982 data points), in (b) for Dakar, Senegal (3823 data points), and in (c) for Tamanrasset, Algeria (3542 data points), characterize the main relationship between the shown microphysical and optical parameters for the different dust regions very well. However, some contrasting features are visible, especially when comparing the Saharan with the central and East Asian stations and thus for clearly separated dust regions. The Middle Eastern AERONET sites are influenced by both Saharan and Middle Eastern dust.
The spread in the data mainly reflects variations in the dust aerosol characteristics (size distribution, refractive index) as a function of varying mixtures of freshly emitted local dust and long-range-transported aged dust. Fresh and aged dust mixtures may have occurred in different dust layers above each other (as in the case study in Sect. 4). Uncertainties in the AERONET data inversion procedure applied to obtain the microphysical properties from the measured AOT and sky radiance observations may have also contributed to the scatter in the data. The scatter provides an impression of the variability in the relationship between dust microphysical and optical properties and thus indicates the uncertainty in the determined conversion factors. However, it should also be mentioned that dust extinction coefficients in lofted layers above the boundary layer (in the free troposphere) seldom exceed 200–300 Mm−1. For σd<500 Mm−1 the scatter in the data is comparably low in Fig. 2.
Figure 3 indicates that the relationship between the surface area concentration s100,d, i.e., the CCN-related particle surface concentration, and the particle extinction coefficient σd at 532 nm is much more robust (less variable) than the one for sd vs. σd in Fig. 2b. The reason for this less noisy relationship is probably that the AERONET inversion analysis (for coarse-mode-dominated particle ensembles) is not very accurate for the small-particle fraction (radius classes from 50 to 100 nm) and this inversion-related uncertainty is then reflected in the variability of the sd values considering all particle classes. With increasing minimum particle radius in the surface area computation the variability in the relationship between respective surface area concentration and extinction coefficient decreases.
However, as will be shown in the next section, in contrast to the s100,d vs. σd relationship, the correlation between n100,d and σd is strongly variable. One of the reasons for this difference is that particles with large geometrical cross sections (coarse-mode particles) have a higher weight in the surface area computation (integral over all sizes classes) and thus control the s100,d values. In the n100,d calculation, on the other hand, the size classes with the highest particle number concentration (fine-mode classes) dominate the n100,d values.
3.2 Relationship between n100,d and dust extinction coefficient σd
A different method of data analysis is used for n100,d. As suggested by Shinozuka et al. (2015) we correlated log(n100,d) vs. log(σd). Figure 4 shows the relationship between particle number concentration n100,d and the dust extinction coefficient σd at 532 nm for two stations (Mezaira'a, Dushanbe) on a logarithmic scale. As outlined in Sect. 2, the particle number concentration n100,d, considering only the particles with dry radius >100 nm, represents the CCN reservoir in the case of dust particles for a typical water supersaturation of 0.2 % very well (Mamouri and Ansmann, 2016; Lv et al., 2018).
In Fig. 4, we highlight the difference in the correlation when using all available data (532 nm dust AOT from 0.1 to 3.0 or σd from 100 to 3000 Mm−1) and when using only observations with AOT <0.6. By detailed inspection of all data sets (station by station), we observed that the correlation strength significantly decreases with increasing AOT and is no longer clearly visible for all measurements with AOT from 1.0 to 3.0. The Dushanbe data set shown in Fig. 4b is a good example for this observation.
We can only speculate about the reason for the weak relationship for AOT >0.6. When the AOT is too large, the coarse-mode dust fraction may control the measured optical properties and respective inversion results so much that a trustworthy retrieval of the particle fraction with radii from 100 to 200 nm is no longer possible. Another explanation is related to the observational procedure. Most inversion computations are based on AERONET observations in the early morning and evening hours when the effective impact of aerosols is strongest (so that the effective dust AOT is even higher by a factor of 2 and more compared to that for the vertical column stored in the AERONET database). At these low-visibility conditions, the short-wavelength AERONET channels (340 and 380 nm) may have problems correctly measuring the overall AOT (Rayleigh AOT plus particle AOT). The short-wavelength AOT values are, however, especially important in the inversion retrieval of small dust particles and thus have a strong influence on the n100,d retrieval results.
As a consequence of the low correlation between log(n100,d) and log(σd) for large AOT, we restricted the determination of the conversion parameters c100,d and xd (see Eq. 12) by means of a regression analysis to AOT values from 0.1 to 0.6 (or respective σd from 100 to 600 Mm−1).
Figure 5 provides further insight into the correlation between log(n100,d) and log(σd). Observations for different stations influenced by Saharan, Middle Eastern, central Asian, American, and Australian dust are shown. The Saharan dust data set collected at Cabo Verde belongs to the few data sets (out of the 20 AERONET stations) with a likewise good correlation between log(n100,d) and log(σd) even for large extinction values >600 Mm−1 and corresponding AOT values >0.6. In Fig. 5, regression analysis results (in accordance with Eq. 12) for Mezaira'a (numbers in orange) and Cabo Verde (numbers in green) are compared. Furthermore, the relationship between n100,d and σd as found by Shinozuka et al. (2015) for dusty field sites is presented.
Table 4Dust conversion parameters required in the conversion of particle extinction coefficients σd at 532 nm into particle number, surface area, and volume concentration (index d for total dust, index df for fine dust, index dc for coarse dust) as described in Table 1. The mean values and SD for cv,d, cv,df, and cv,dc (10−12 Mm), of c250,d (Mm cm−3), and cs,d and (10−12 Mm m2 cm−3) are derived from the extended AERONET data analysis described in Sects. 2 and 3.1 for all sites listed in Table 3. c100,d (cm−3 for σd=1 Mm−1), and xd and respective standard deviations (SD) are obtained in the way described in Sect. 3.2 by considering only AOT from 0.1 to 0.6, except for Ilorin (all AOTs are used because only 12 % of AOT <0.6). No data (c100,d, xd) are listed when the regression coefficient <0.6. The regional–continental mean values (for North Africa, Middle East, Asia, America–Australia) are obtained by observation-weighted (Jd-weighted) averaging of the given station mean and SD values.

As mentioned above, most of the dust-related lidar observations in the free troposphere show dust extinction coefficients (σd)<200–300 Mm−1. For a moderate dust extinction value of 100 Mm−1, the POLIPHON retrieval yields and 250 cm−3 when using c100,d and xd numbers as derived from the Cabo Verde and Mezaira'a AERONET observations (AOT <0.6), respectively. Thus, a maximum overall error of a factor of 2 in Table 1 (for n100,d and nCCN,d) also concluded by Shinozuka et al. (2015) and corroborated by Mamouri and Ansmann (2016) is justified.
3.3 Overview of AERONET-derived conversion parameters
In Table 4, the AERONET-based conversion parameters for all stations are presented. Regional mean sets of conversion parameters are given as well. Figures 6 and 7 provide a station-by-station overview of the conversion parameters (mean and SD values). Systematic differences from region to region are visible in the case of c250,d and also weakly for cv,d. The conversion parameters for the Americas, Australia, and southern Africa need to be handled with caution because the number of available observations is relatively low and the mean 532 nm AOT of these observations was low as well with values from 0.15 to 0.25. A decrease in c250,d and a slight increase in cv,d (and cv,dc) from African to East Asian AERONET stations suggests that, for the same measured extinction coefficient (σd), the accumulation mode particle number concentration (in our case particles with radius from 250 to 500 nm) is slightly larger and the coarse-mode dust particle number concentration, dominating the dust volume concentration, is lower in the case of Saharan dust compared to East Asian dust. This behavior may indicate that the African AERONET stations, e.g., in Cabo Verde, Izana, and Dakar predominantly observe dust after long-range transport (which leads to a bit enhanced fine-dust fraction because of size-dependent sedimentation and removal of particles), whereas the East Asian AERONET stations may be influenced more frequently by the occurrence of local, freshly emitted dust with the relatively strong contribution of coarse-mode particles. Similar conditions as suggested for central and East Asia may hold for the American and Australian stations.

Figure 6Overview of POLIPHON conversion factors (a) c250,d, (b) cs,d, and (c) cv,d (mean and SD) derived from AERONET dust data sets collected at 20 stations around the world. The stations (and abbreviations) are given in Table 3. Total numbers of observations (considered in the statistical analyses for each stations) are given above the figure frame (a) followed by two lines with respective mean 532 nm dust AOTs for all data sets (considering only the dust cases with AOT 1). In (b), open circles show values of the surface-related conversion factor considering particles with a radius >100 nm, only. In (c), volume-related conversion factors are separately determined for total (index d), fine (index df, open symbols), and coarse dust (index dc, open symbols). The uncertainty bars for cv,dc are not shown, but are similar to the ones for cv,d. All statistical results are also summarized in Table 4.

Figure 7POLIPHON conversion parameters (a) c100,d and (b) xd derived from AERONET dust observations at 15 stations in northern Africa (green), the Middle East (orange), central and East Asia (red), North America (blue), and Australia (light blue).
The smooth but steady changes in c250,d and cv,d from the Saharan, over the Middle East to the central and eastern Asian AERONET stations indicate that the Middle Eastern stations are influenced by both local western Asian dust sources (mostly Arabian dust) and Saharan dust (advected with the prevailing westerly winds). Only the African stations and the East Asian stations (Lanzhou, Dalanzadgad) are clearly separated and allow us to contrast dust properties of African and Asian deserts. We did not make an attempt to separate Saharan from Arabian dust observations in the case of the Middle Eastern data sets by using backward trajectory analysis because of the relatively small differences in the Saharan and Middle Eastern conversion factors and the likewise large variability bars.
As discussed in Sect. 3.1 and corroborated by Fig. 3 the conversion factor is almost constant and mostly in the range from 1.55 to Mm m2 cm−3 for all stations (see also Table 4). In contrast, cs,d with values from 2.24 to Mm m2 cm−3 in Table 4 is significantly more variable. All in all, the observed regional differences in the dust conversion parameters in Fig. 6 are of the order of ±15 %–20 % for most of the parameters and stations.
Figure 7 provides a summarizing overview of the final results for c100,d and xd. Because of the large scatter in the log–log data fields expressed in the large uncertainty bars in the figure we can only give recommendations regarding the selection of the most reasonable set of dust conversion parameters. For the extinction exponent xd a value of 0.80 seems to be appropriate. This exponent is then linked to c100,d values of 5–6 cm−3 (at σd=1 Mm−1).
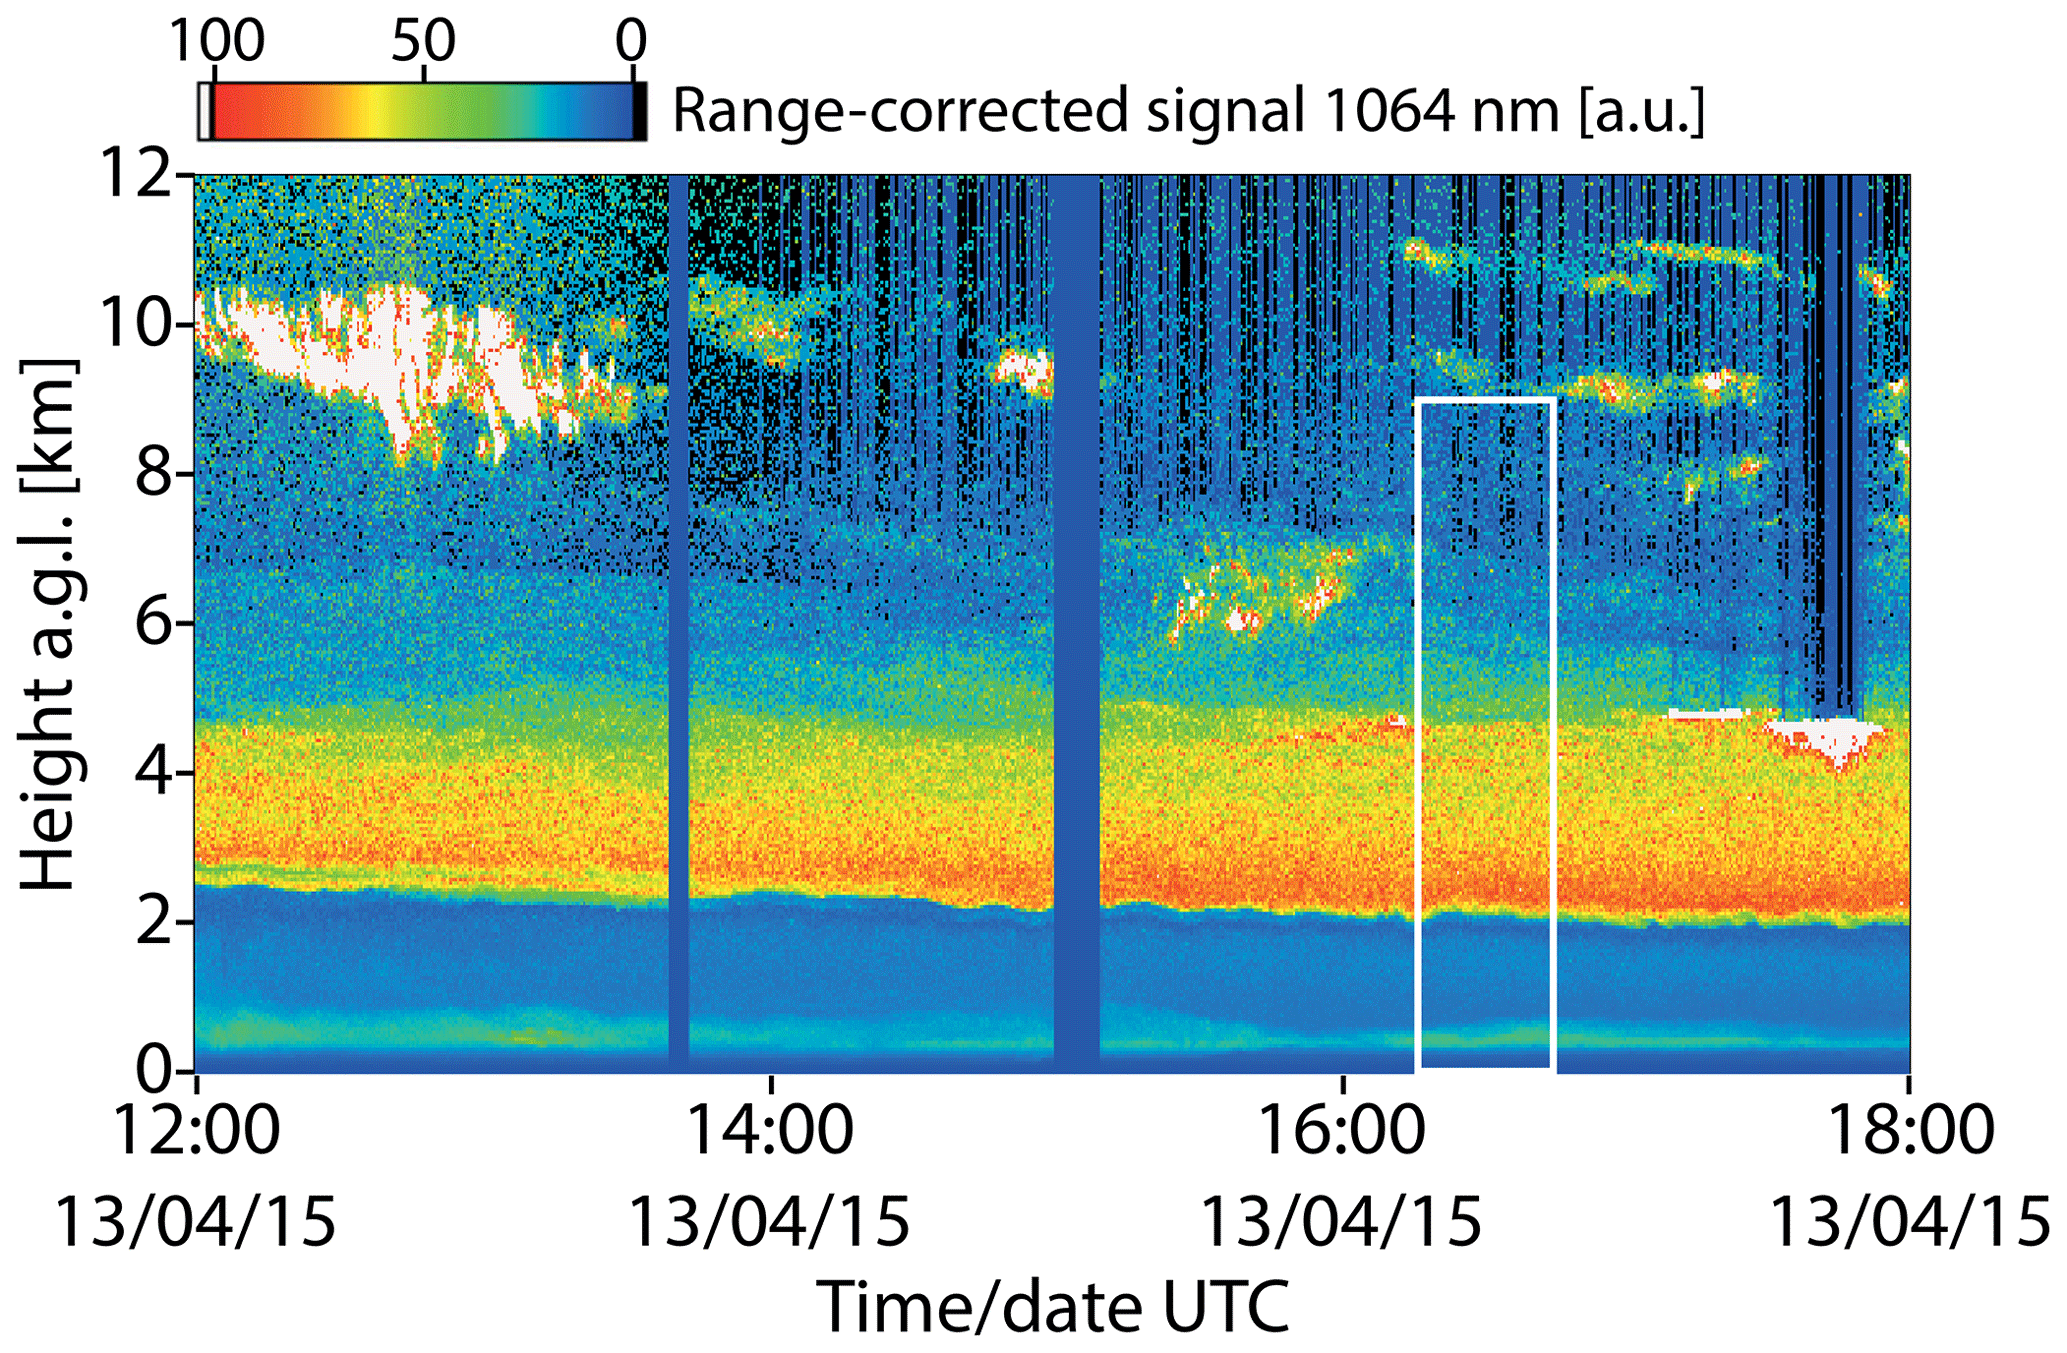
Figure 8Dust layering over the central Asian AERONET site of Dushanbe, Tajikistan, on 13 April 2015 observed with Polly lidar at 1064 nm (range-corrected signal). The densest layer from 2 to 5 km height a.g.l. (above ground level) contained dust particles from Iran, Afghanistan, and Oman according to the backward trajectories in Fig. 9. With increasing height, dust was advected from the Arabian peninsula and the Sahara. The polluted boundary layer reached up to about 2 km height and contained traces of local dust and dust from Kazakhstan. Above 6.5 km height (and temperatures ∘C) ice clouds developed triggered by dust particles, which are favorable ice-nucleating particles. POLIPHON results in Figs. 10–12 are derived for the height–time range indicated by the white rectangle.
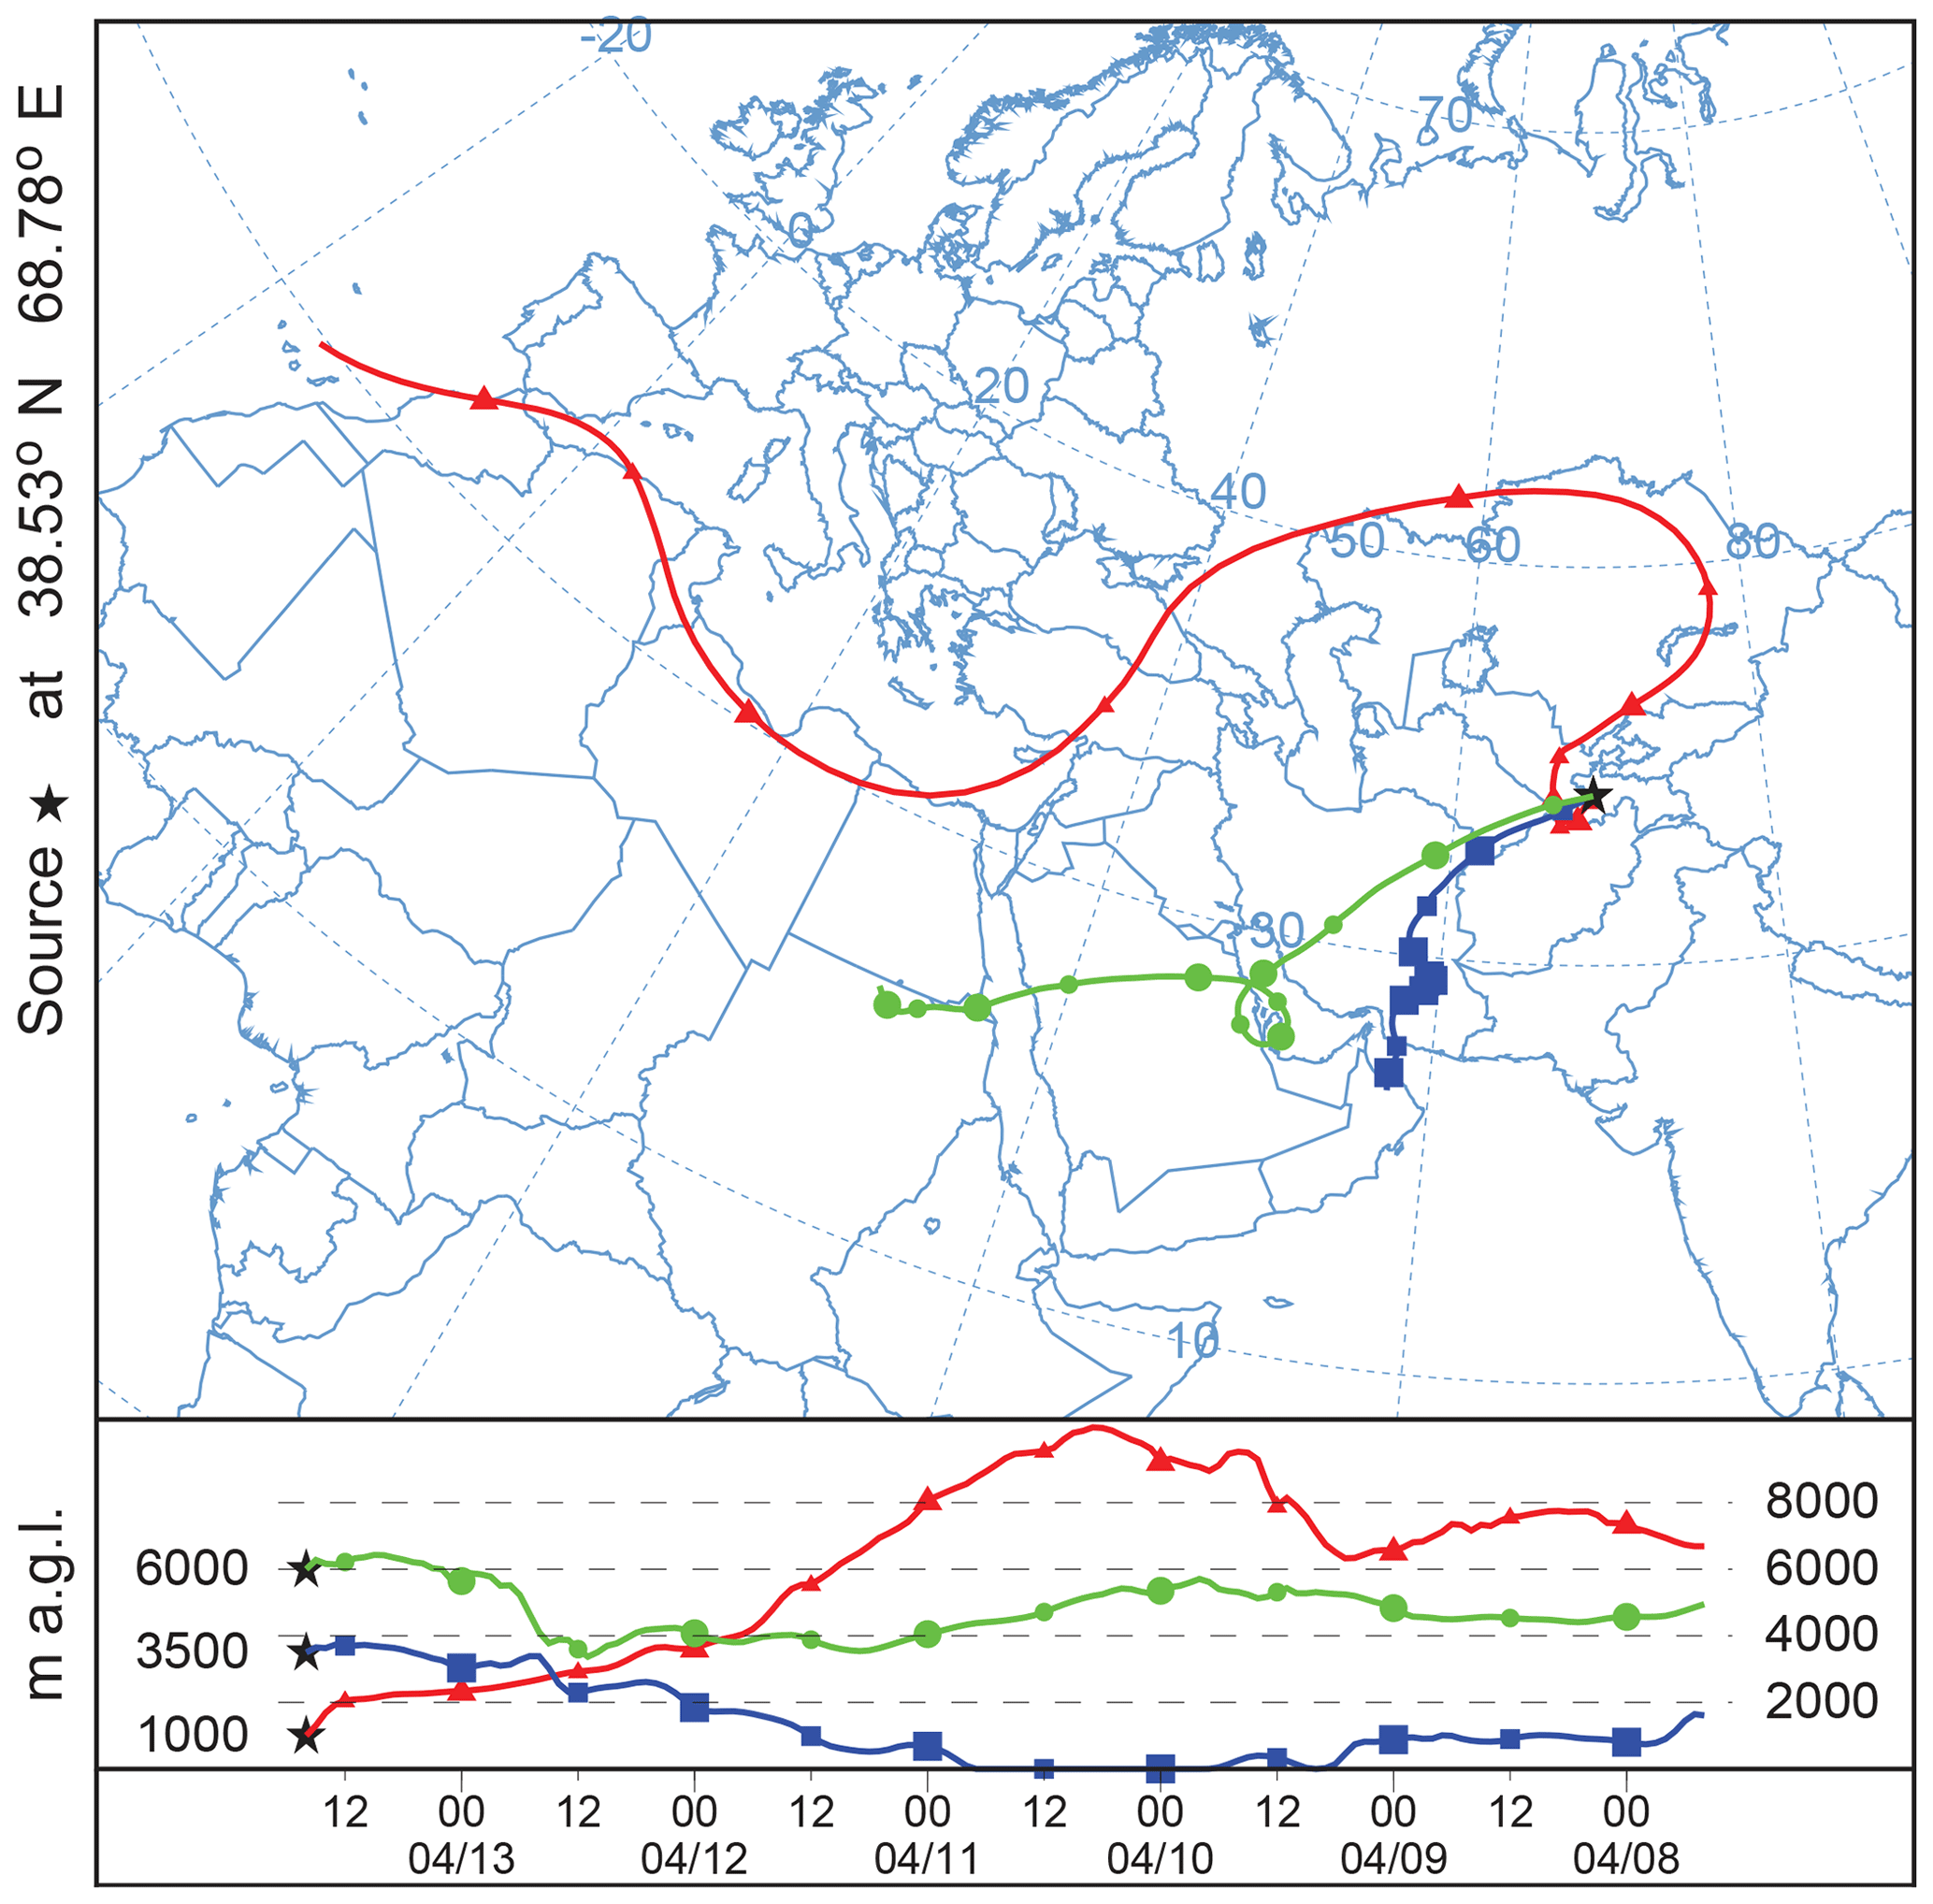
Figure 9The 6 d backward trajectories computed with the HYSPLIT (Hybrid Single Particle Lagrangian Integrated Trajectory) model (HYSPLIT, 2019; Stein et al., 2015; Rolph et al., 2017) for Dushanbe, Tajikistan, on 13 April 2015, 16:00 UTC. The computation is based on GDAS0.5 meteorological fields (GDAS, 2019). Arrival heights are at 1000 m (red, in the boundary layer with central Asian dust), 3500 m (blue, in a dense layer with dust from several western Asian deserts), and 6000 m (green, in dusty air from the Arabian peninsula and the Sahara).
We used the updated set of dust conversion parameters to analyze a dust measurement performed with a Polly system deployed at Dushanbe (38.6∘ N, 68.9∘ E, 820 m a.s.l.), Tajikistan, in April 2015. The lidar observations were performed in the framework of the 18-month field campaign CADEX (Central Asian Dust Experiment) (Hofer et al., 2017). The full potential of the POLIPHON method (Table 1) is shown. In addition, the impact of the selected conversion factors on the results is illuminated in the framework of an uncertainty analysis. The case presented here was already discussed in terms of optical properties by Hofer et al. (2017).
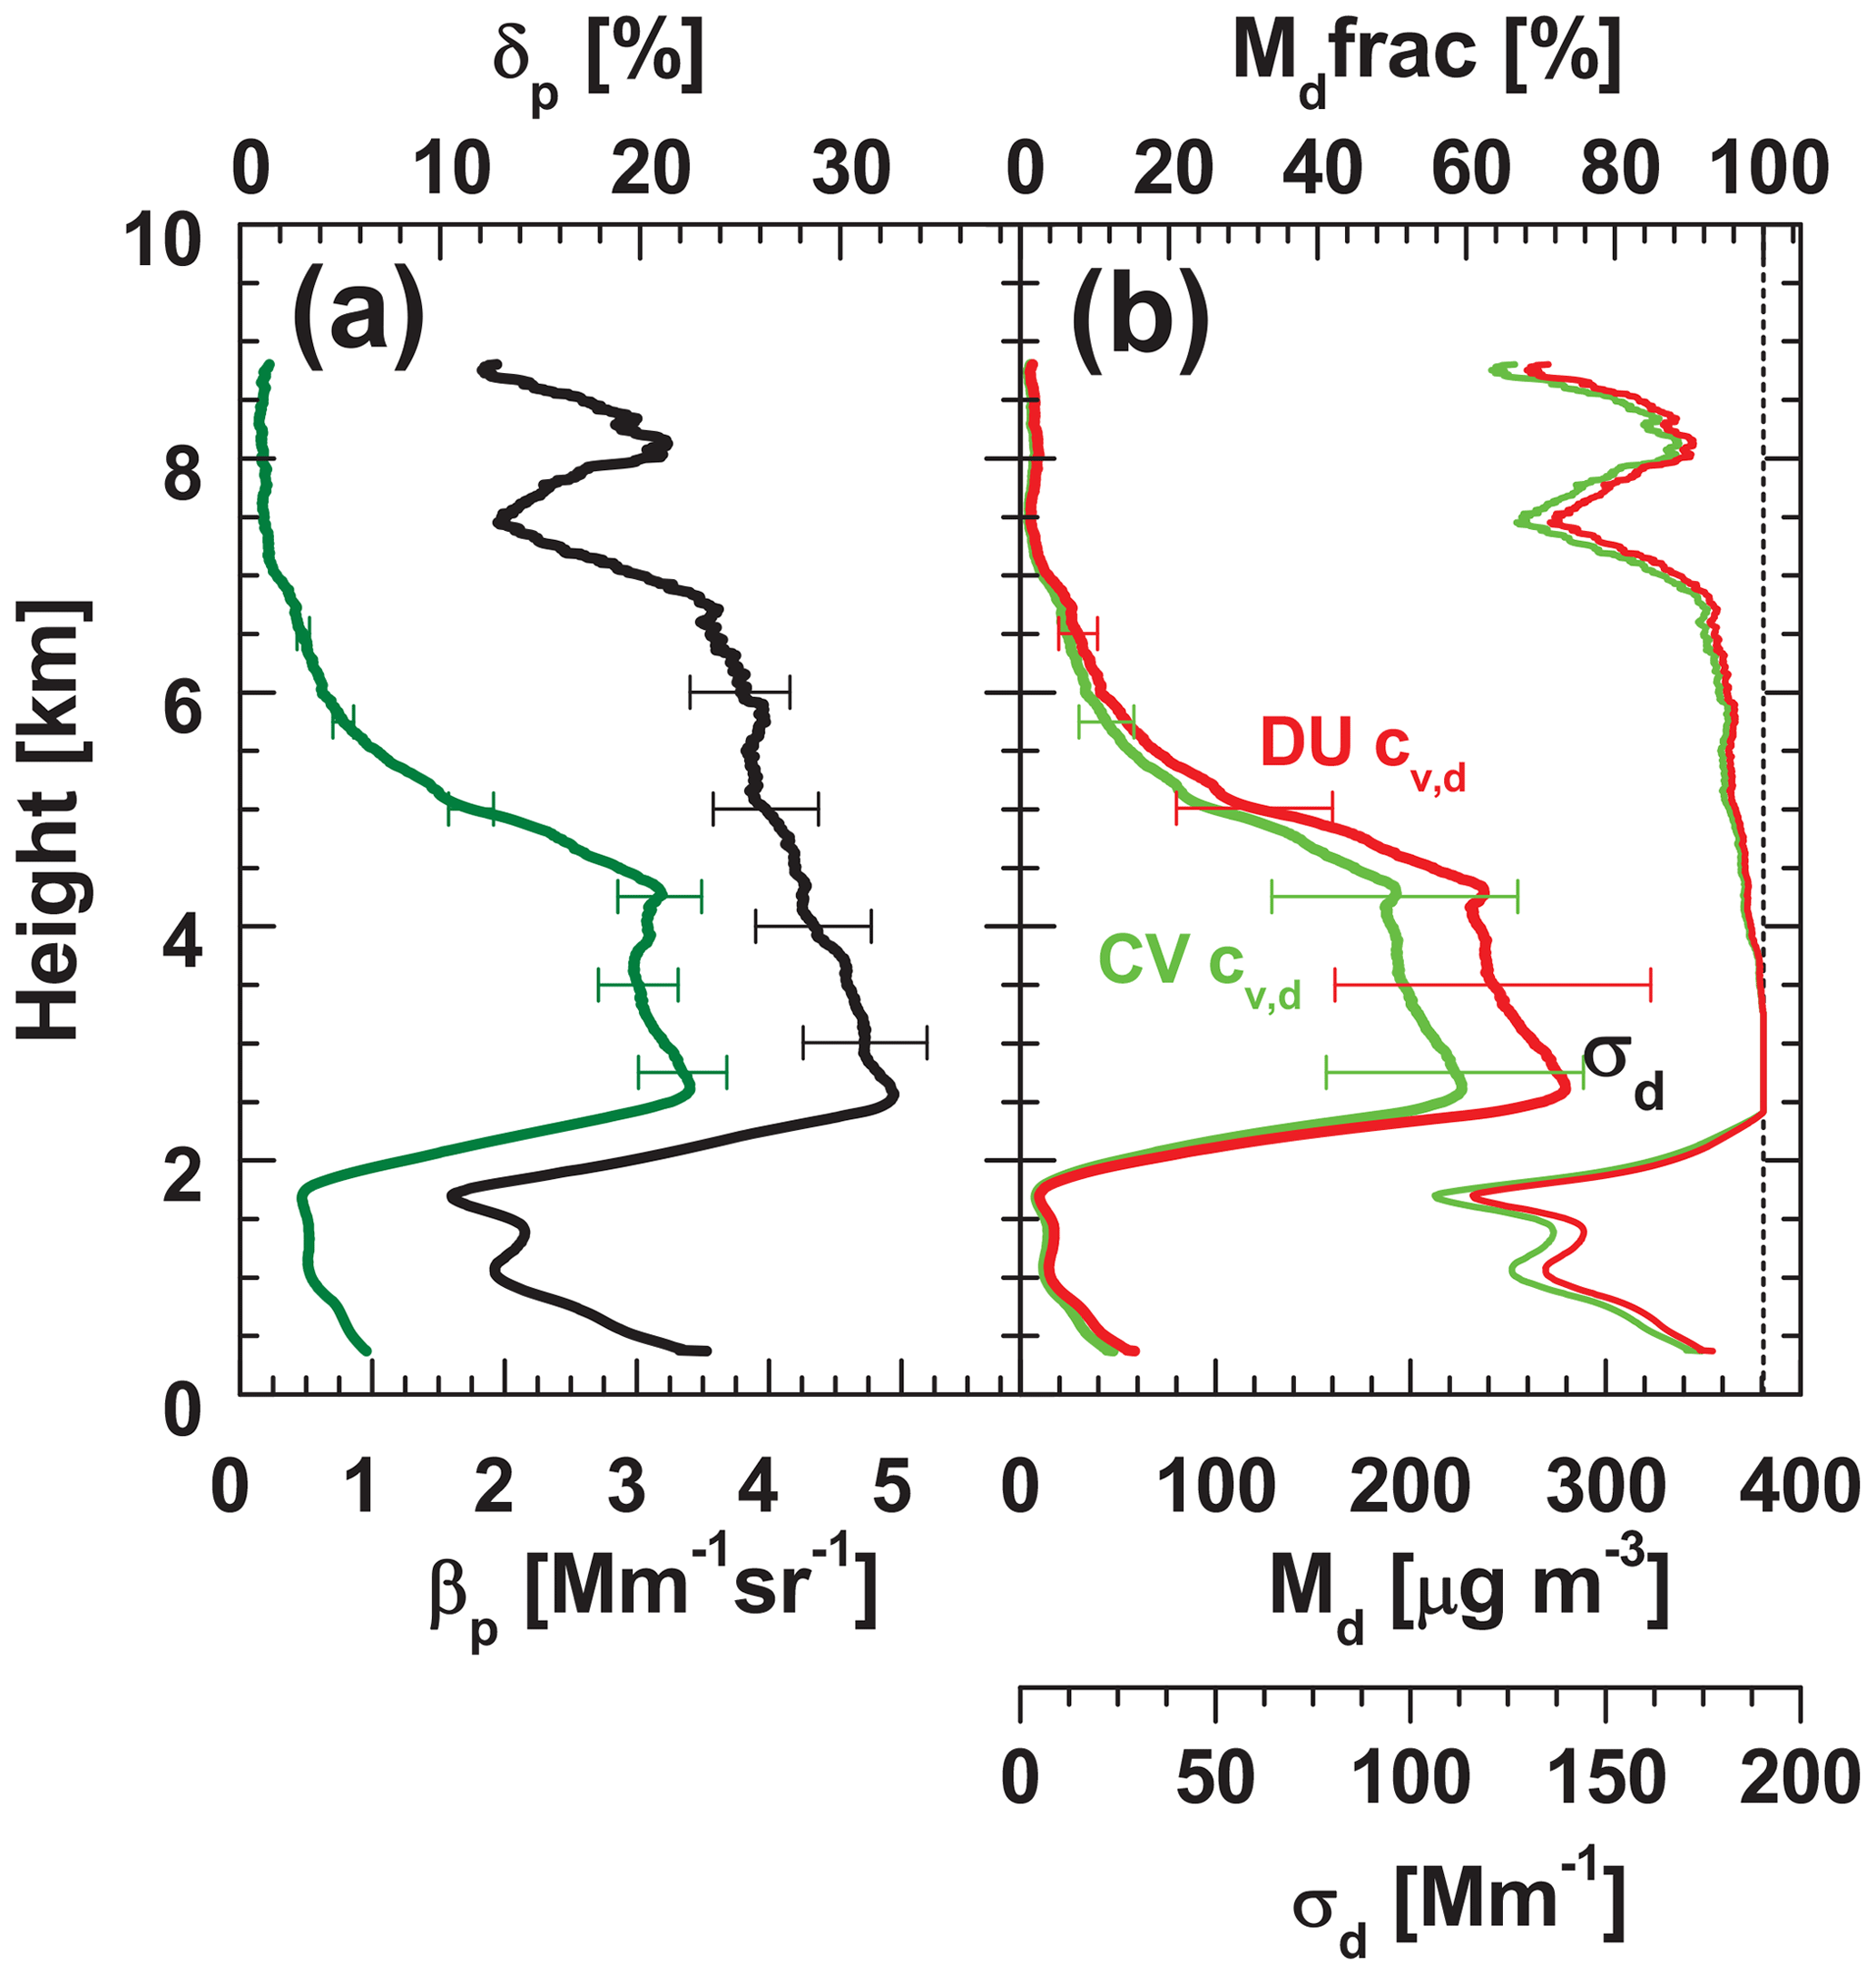
Figure 10Retrieval of dust mass concentration. From profiles of the particle backscatter coefficient βp (green curve in a, 532 nm) and particle linear depolarization ratio δp (black curve in a, 532 nm), the profile of the dust backscatter coefficient βd is determined and then converted into the dust extinction coefficient σd (red curve in b) by means of a lidar ratio of 40 sr. The σd profile is then converted into mass concentration Md (shown in b as thick lines) by means of volume conversion factors cv,d of Mm for Sal, Cabo Verde (CV, green Md profile; see Table. 4), and Mm for Dushanbe (DU, red Md profile) and dust particle density ρd=2.6 g cm−3. Respective profiles of Md fraction (thin red and green curves in b) are also shown. The Polly lidar observation was performed at Dushanbe on 13 April 2015, 16:15–16:44 UTC (white rectangle in Fig. 8). The temporally averaged lidar signal profiles were smoothed with 750 m before the computation of βp and δp. Error bars indicate (a) 10 % and (b) 30 % uncertainty (typical uncertainty according to Table 1).
Figure 8 presents an overview of the aerosol conditions observed with lidar on 13 April 2015. A pronounced dust layer was detected between 2 and 5 km height (above ground level, a.g.l., about 3–6 km height above sea level, a.s.l.). Dust was observed up to cirrus heights. The AERONET sun photometer observations at Dushanbe showed a 500 nm AOT of 0.4, AE of 0.2, and a fine-mode fraction (FMF) of 0.2 (just before sunset close to 13:00 UTC). Thus, fine dust contributed about 20 % to the overall (fine and coarse) dust extinction coefficient. According to the backward trajectories in Fig. 9, mineral dust in the polluted boundary layer (0–2 km height) originated from Kazakhstan and local dust sources. The dust particles in the thick dust layer from 2 to 5 km height were mostly emitted in Iran and Oman. Higher up (above 5 km) long-range transport of dust from the Arabian peninsula (5–7 km height) and even the Sahara (8–10 km) prevailed. More details on the long-range transport features in comparison with aerosol transport modeling are given in Hofer et al. (2017).
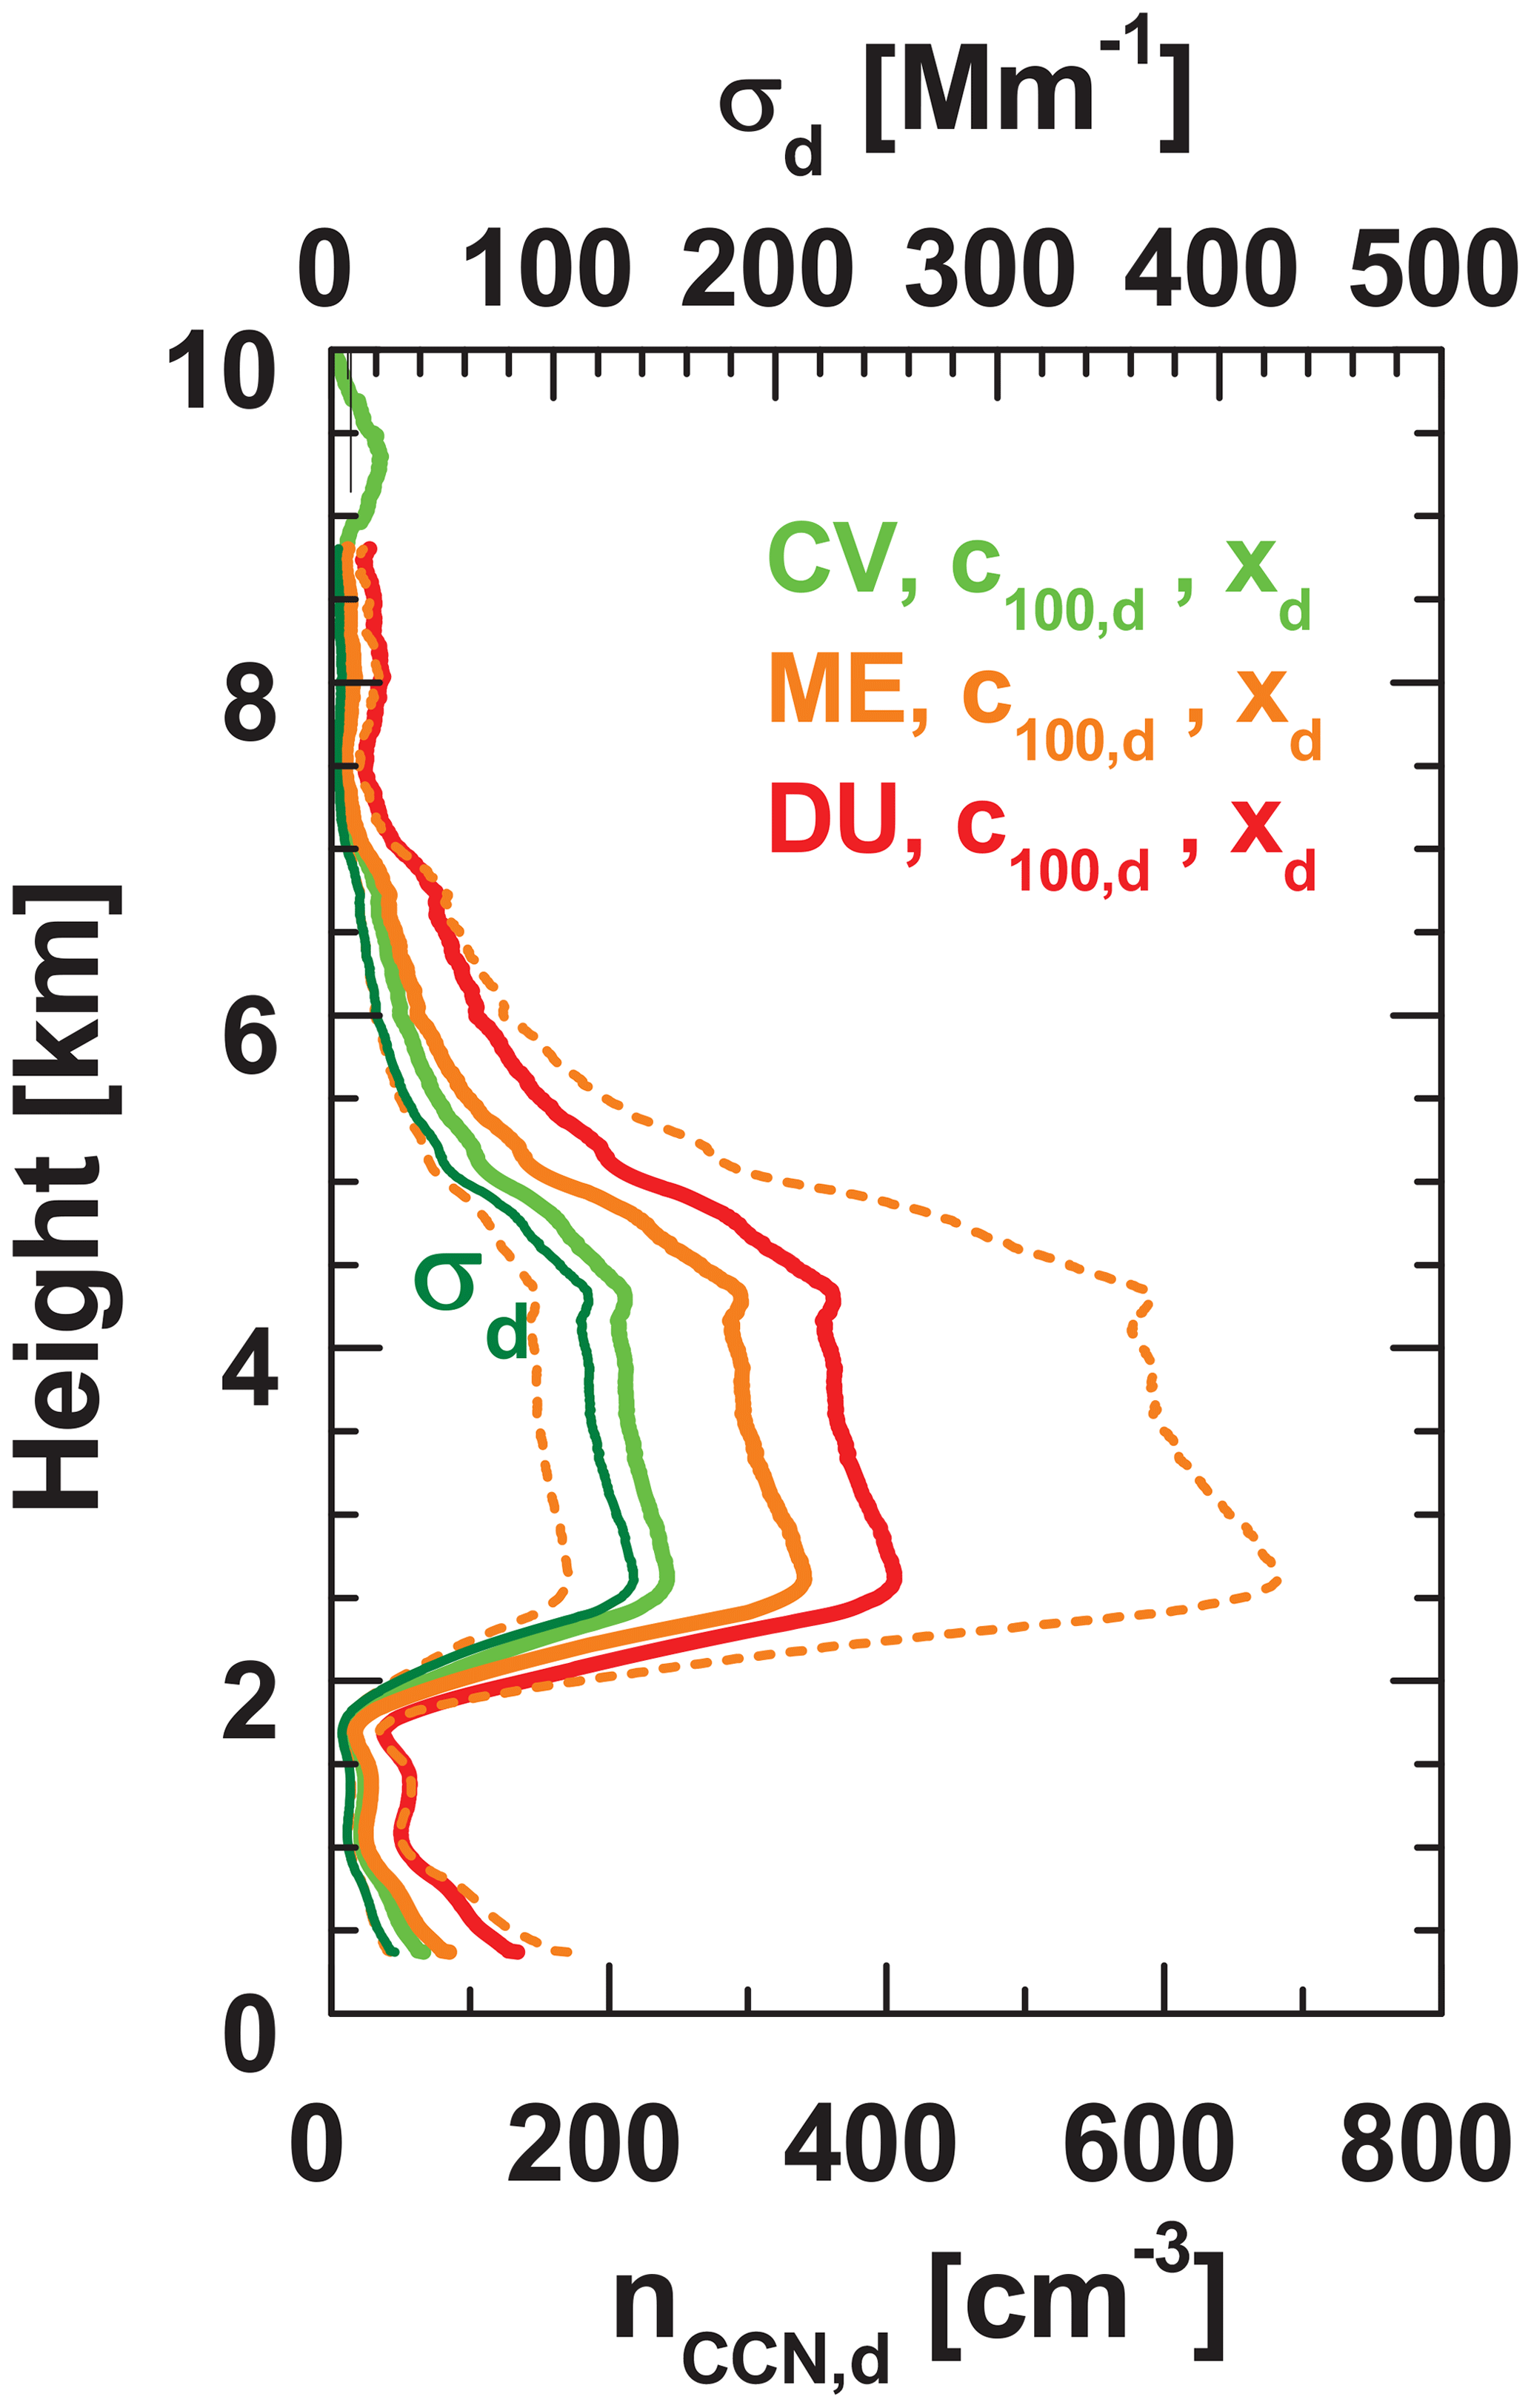
Figure 11Estimation of dust CCNC profiles for the 16:15–16:44 UTC time period on 13 April 2015. The profile of the dust extinction coefficients σd (thin dark green) is converted into a profile of n100,d by means of the conversion parameters c100,d and xd given in Table 4 for Sal, Cabo Verde (CV, green profile), Mezaira'a (ME, orange profile), and Dushanbe (DU, red profile). For the assumed typical water supersaturation value of 0.2 % at the base of a convective cloud, and thus (see Table 1, line 12, equation for ). The uncertainty range is assumed to be of the order of a factor of 2 (indicated by dashed curves around the orange ME curve).
Figure 10a shows the basic lidar profiles used in the POLIPHON data analysis. The height profiles of the particle (dust + non-dust) backscatter coefficient and the related particle linear depolarization ratio are used to derive the dust and non-dust extinction profiles (Mamouri and Ansmann, 2014, 2017). The dust extinction coefficients are then converted into the dust mass concentrations in Fig. 10b by means of the dust conversion factor cv,d in Table 4 for Dushanbe (red profiles in Fig. 10b). The mass computation is performed in the way described in Table 1. The corresponding dust mass fraction (ratio of dust mass concentration to total particle mass concentration) is presented in Fig. 10b as well. To provide an estimate of the uncertainty in the dust mass concentration introduced by the conversion uncertainty, two conversion factors for Dushanbe and for Cabo Verde, representing a relatively high and low value of all conversion factors listed in Table 4, were applied in Fig. 10. The resulting differences in the POLIPHON results are well covered by the overall uncertainty in the POLIPHON mass retrieval of 30 % (see the error bars in Fig. 10), which also includes the uncertainty in the dust extinction determination.
Figure 11 presents the POLIPHON results in terms of several CCNC profiles obtained with conversion parameter sets for Cabo Verde, Mezaira'a, and Dushanbe (see Table 4). As mentioned, for a water supersaturation value of 0.2 %. According to the discussion in Sect. 3.2 and the uncertainty information in Table 1 the overall uncertainty in the regression analysis of n100,d with σd is of the order of 50 %–200 %. In Fig. 11, an uncertainty factor of 2 is considered by the dashed lines. Compared to this factor-of-2 uncertainty margin, the impact of the applied different conversion parameter sets is likewise small.
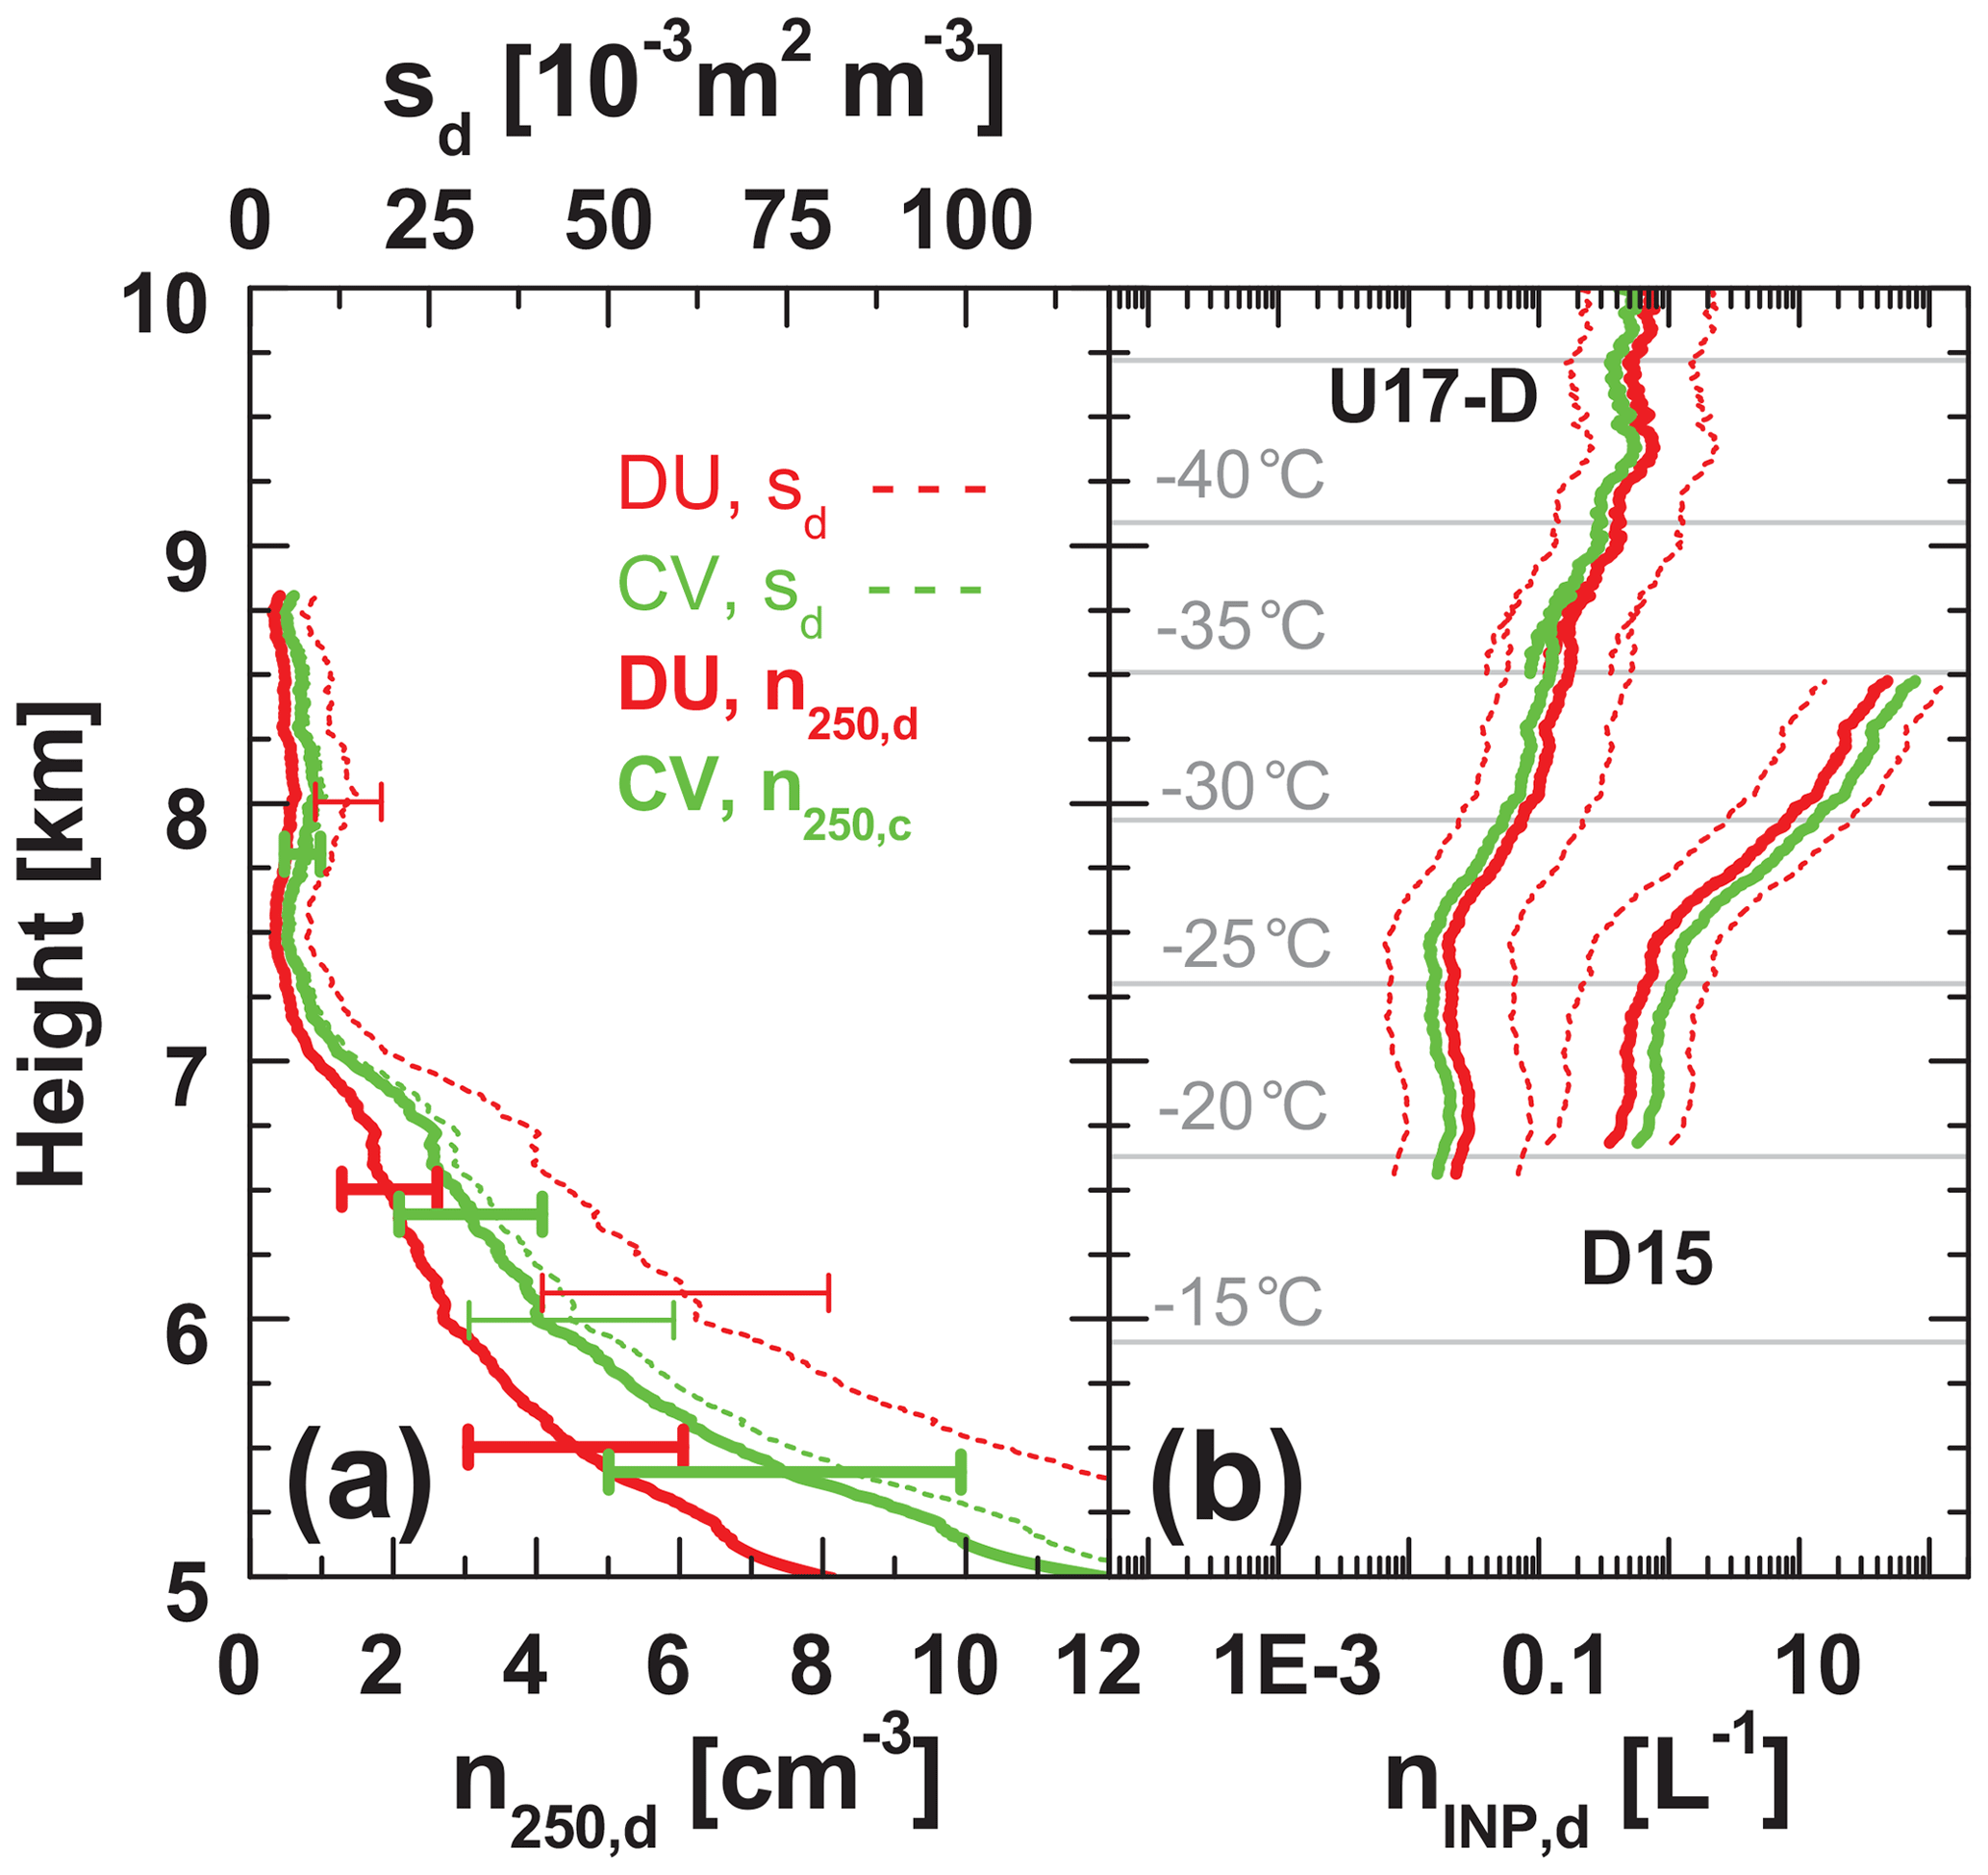
Figure 12Estimation of INPC profiles for the 16:15–16:44 UTC time period on 13 April 2015. The profile of σd in Fig. 11 (thin dark green profile) is converted into profiles of the particle number concentration n250,d (thick solid lines in a) and surface area concentration sd (thin dashed lines in a) by means of the conversion factors c250,d and cs,d in Table 4 for Dushanbe (DU, red profiles) and Sal, Cabo Verde (CV, green profiles). The profiles of n250,d and sd together with the actual GDAS temperature profile are input parameters in the INP parameterization schemes U17-D (deposition nucleation) and D15 (immersion freezing; see Table 1). In the deposition–nucleation INPC estimation, a typical ice supersaturation value of Sice=1.15 is assumed. The INP parameterizations are valid for temperatures of about −20 ∘C and lower. The D15 parameterization holds for temperatures down to −35 ∘C only. Error bars indicate uncertainties of 30 % in (a). The nINP,d uncertainty range is assumed to be 1 order of magnitude indicated by dashed lines in (b). We added nINP,d profile segments for the 8.5–10 km height range, derived from lidar observations in cloud-free air from 15:15 to 16:10 UTC on 13 April 2015 (see Fig. 8).
Figure 12 shows the POLIPHON results with focus on ice-nucleating particle concentration (INPC). As outlined in detail in Mamouri and Ansmann (2016), the POLIPHON data analysis delivers height profiles of the large particle number concentration n250,d and of the dust surface area concentration sd in Fig. 12a with an accuracy of about 25 %–30 % in the case of pronounced dust layers. Again, we applied two contrasting conversion parameter sets (Dushanbe, Cabo Verde). The differences in the results are well covered by the overall POLIPHON uncertainties of 30 %.
The profile of n250,d is then input in the INPC computation by means of the immersion-freezing parameterization of DeMott et al. (2015) (see Fig. 12b, D15 profile) and the profile of sd is needed as input in the INPC parameterization of Ullrich et al. (2017) (deposition nucleation mode, U17-D profile in Fig. 12b). In addition to the aerosol profiles, actual GDAS temperatures (indicated as horizontal grey lines in Fig. 12b) are required in the calculations of nINP,d profiles. Deposition freezing usually takes place in the upper troposphere at temperatures clearly below −30 ∘C and depends on the ice supersaturation level Sice in an ascending air parcel. Sice is set to a typical value of 1.15 in Fig. 12b. Dashed lines indicate an uncertainty of a factor of 3 (or an uncertainty range of 1 order of magnitude) caused by the INPC parameterization schemes. Compared to this uncertainty the impact of an uncertainty in the conversion factors on the relative error of the n250,d and sd values and finally on the accuracy of the INPC estimates is of minor importance.
In Fig. 12b, we added an INPC profile segment (from 8.5 to 10 km) based on observations in cloud-free air from 15:15 to 16:10 UTC (see Fig. 8, just before the time period indicated by the white frame) to extend the INPC profile up to the height range where several cirrus layers formed. The patchy ice cloud cluster at 7 km between 15:00 and 16:30 UTC (see Fig. 8) probably formed via immersion freezing at temperatures around −25 ∘C. INPC was high with 1–10 L−1, and thus triggered the nucleation of a considerable number of ice crystals. Higher up, at 9–11 km and corresponding temperatures from −35 to −50 ∘C, deposition freezing prevails in addition to homogeneous freezing. The use of the U17-D parameterization indicates INPC values of 0.1–1 L−1, which is relatively low and may explain the short-lived thin ice cloud features with a low number of ice crystals (occurring after 16:15 UTC) and the absence of large cirrus fields with extended virga zones.
An extended global AERONET analysis has been performed to create a global data set of dust-related POLIPHON conversion factors. We analyzed AERONET observations for all relevant desert regions in Africa, the Middle East, central and East Asia, the Americas, and Australia and provide respective regional conversion parameter sets. Significant differences in the obtained conversion parameters caused by potentially different dust composition and size distribution characteristics for different desert regions were not found. Furthermore, the presented Tajikistan case study showed that the use of different, contrasting conversion parameters did not have a large (dominating) impact on the overall uncertainty in the POLIPHON results. This is an advantage for spaceborne lidar applications when one wants to use, for example, one set of conversion parameters in global observations. This universal conversion parameter set may be the mean of all Saharan, Middle Eastern, and Asian dust conversion parameters given in Table 4. For ground-based observations it is however always advisable to make use of the specific regional conversion parameters and to check the uncertainty caused by the conversion by using different conversion parameter sets listed in Table 4.
In conclusion, we can state that appropriate conversion parameters are now available for mineral dust around the globe. In addition, conversion parameters representing pure marine conditions are available from marine Barbados AERONET observations (Mamouri and Ansmann, 2016, 2017). As an outlook, it remains to be investigated in detail the conversion parameters for anthropogenic aerosol particles (urban haze, rural background aerosol, forest fire smoke) by using AERONET data collected at very different places with very different fine-mode aerosol and climatic conditions around the globe.
All data used in this work can be accessed through the AERONET home page at https://aeronet.gsfc.nasa.gov/ (AERONET, 2019). Polly lidar observations (level 0 data, measured signals) are in the PollyNET database (http://polly.rsd.tropos.de/, PollyNET, 2019). All the analysis products are available at TROPOS upon request (info@tropos.de).
AA and REM worked on the applied methodology and prepared the paper. JH provided the Dushanbe case study results. DA, JH, and SFA took care of the excellent performance of the Polly lidar and AERONET photometer during the 18-month CADEX field campaign.
The authors declare that they have no conflict of interest.
We are grateful to all PIs of the AERONET sites used in this study for maintaining their instruments and providing their data to the community. We thank AERONET for their continuous efforts in providing high-quality measurements and products. We thank AERONET-Europe for providing calibration service. AERONET-Europe is also part of the ACTRIS-2 project. Aerosol source apportionment analysis has been supported by air mass transport computation with the NOAA (National Oceanic and Atmospheric Administration) HYSPLIT (Hybrid Single Particle Lagrangian Integrated Trajectory) model using GDAS meteorological data. We also thank the three reviewers for very fruitful suggestions.
The authors acknowledge funding from the Horizon 2020 Research and Innovation program ACTRIS-2 Integrating Activities (H2020-INFRAIA-2014-2015, grant agreement no. 654109). The CADEX project was funded by the German Federal Ministry of Education and Research in the context of “Partnerships for sustainable problem solving in emerging and developing countries” under the grant number 01DK14014.
The publication of this article was funded by the
Open Access Fund of the Leibniz Association.
This paper was edited by Vassilis Amiridis and reviewed by three anonymous referees.
AERONET: AERONET aerosol data base, available at: http://aeronet.gsfc.nasa.gov/, last access: 22 Februray 2019. a, b, c, d
Ansmann, A., Seifert, P., Tesche, M., and Wandinger, U.: Profiling of fine and coarse particle mass: case studies of Saharan dust and Eyjafjallajökull/Grimsvötn volcanic plumes, Atmos. Chem. Phys., 12, 9399–9415, https://doi.org/10.5194/acp-12-9399-2012, 2012. a
Ansmann, A., Mamouri, R.-E., Bühl, J., Seifert, P., Engelmann, R., Hofer, J., Nisantzi, A., Atkinson, J. D., Kanji, Z. A., Sierau, B., Vrekoussis, M., and Sciare, J.: Ice-nucleating particle versus ice crystal number concentration in altocumulus and cirrus embedded in Saharan dust: A closure study, Atmos. Chem. Phys. Discuss., https://doi.org/10.5194/acp-2019-447, in review, 2019.
Baars, H., Kanitz, T., Engelmann, R., Althausen, D., Heese, B., Komppula, M., Preißler, J., Tesche, M., Ansmann, A., Wandinger, U., Lim, J.-H., Ahn, J. Y., Stachlewska, I. S., Amiridis, V., Marinou, E., Seifert, P., Hofer, J., Skupin, A., Schneider, F., Bohlmann, S., Foth, A., Bley, S., Pfüller, A., Giannakaki, E., Lihavainen, H., Viisanen, Y., Hooda, R. K., Pereira, S. N., Bortoli, D., Wagner, F., Mattis, I., Janicka, L., Markowicz, K. M., Achtert, P., Artaxo, P., Pauliquevis, T., Souza, R. A. F., Sharma, V. P., van Zyl, P. G., Beukes, J. P., Sun, J., Rohwer, E. G., Deng, R., Mamouri, R.-E., and Zamorano, F.: An overview of the first decade of PollyNET: an emerging network of automated Raman-polarization lidars for continuous aerosol profiling, Atmos. Chem. Phys., 16, 5111–5137, https://doi.org/10.5194/acp-16-5111-2016, 2016. a
Bohlmann, S., Baars, H., Radenz, M., Engelmann, R., and Macke, A.: Ship-borne aerosol profiling with lidar over the Atlantic Ocean: from pure marine conditions to complex dust–smoke mixtures, Atmos. Chem. Phys., 18, 9661–9679, https://doi.org/10.5194/acp-18-9661-2018, 2018. a
Córdoba-Jabonero, C., Sicard, M., Ansmann, A., del Águila, A., and Baars, H.: Separation of the optical and mass features of particle components in different aerosol mixtures by using POLIPHON retrievals in synergy with continuous polarized Micro-Pulse Lidar (P-MPL) measurements, Atmos. Meas. Tech., 11, 4775–4795, https://doi.org/10.5194/amt-11-4775-2018, 2018. a
DeMott, P. J., Prenni, A. J., McMeeking, G. R., Sullivan, R. C., Petters, M. D., Tobo, Y., Niemand, M., Möhler, O., Snider, J. R., Wang, Z., and Kreidenweis, S. M.: Integrating laboratory and field data to quantify the immersion freezing ice nucleation activity of mineral dust particles, Atmos. Chem. Phys., 15, 393–409, https://doi.org/10.5194/acp-15-393-2015, 2015. a, b
Düsing, S., Wehner, B., Seifert, P., Ansmann, A., Baars, H., Ditas, F., Henning, S., Ma, N., Poulain, L., Siebert, H., Wiedensohler, A., and Macke, A.: Helicopter-borne observations of the continental background aerosol in combination with remote sensing and ground-based measurements, Atmos. Chem. Phys., 18, 1263–1290, https://doi.org/10.5194/acp-18-1263-2018, 2018. a, b
Engelmann, R., Kanitz, T., Baars, H., Heese, B., Althausen, D., Skupin, A., Wandinger, U., Komppula, M., Stachlewska, I. S., Amiridis, V., Marinou, E., Mattis, I., Linné, H., and Ansmann, A.: The automated multiwavelength Raman polarization and water-vapor lidar PollyXT: the neXT generation, Atmos. Meas. Tech., 9, 1767–1784, https://doi.org/10.5194/amt-9-1767-2016, 2016. a
Freudenthaler, V., Esselborn, M., Wiegner, M., Heese, B., Tesche, M., Ansmann, A., Müller, D., Althausen, D., Wirth, M., Fix, A., Ehret, G., Knippertz, P., Toledano, C., Gasteiger, J., Garhammer, M., and Seefeldner, M.: Depolarization ratio profiling at several wavelengths in pure Saharan dust during SAMUM 2006, Tellus B, 61, 165–179, https://doi.org/10.1111/j.1600-0889.2008.00396.x, 2009. a
GDAS: Global Data Assimilation System, meteorological data base, available at: https://www.ready.noaa.gov/gdas05.php, last access: 20 February 2019. a
Giles, D. M., Sinyuk, A., Sorokin, M. G., Schafer, J. S., Smirnov, A., Slutsker, I., Eck, T. F., Holben, B. N., Lewis, J. R., Campbell, J. R., Welton, E. J., Korkin, S. V., and Lyapustin, A. I.: Advancements in the Aerosol Robotic Network (AERONET) Version 3 database – automated near-real-time quality control algorithm with improved cloud screening for Sun photometer aerosol optical depth (AOD) measurements, Atmos. Meas. Tech., 12, 169–209, https://doi.org/10.5194/amt-12-169-2019, 2019. a
Groß, S., Freudenthaler, V., Schepanski, K., Toledano, C., Schäfler, A., Ansmann, A., and Weinzierl, B.: Optical properties of long-range transported Saharan dust over Barbados as measured by dual-wavelength depolarization Raman lidar measurements, Atmos. Chem. Phys., 15, 11067–11080, https://doi.org/10.5194/acp-15-11067-2015, 2015. a, b
Haarig, M., Ansmann, A., Althausen, D., Klepel, A., Groß, S., Freudenthaler, V., Toledano, C., Mamouri, R.-E., Farrell, D. A., Prescod, D. A., Marinou, E., Burton, S. P., Gasteiger, J., Engelmann, R., and Baars, H.: Triple-wavelength depolarization-ratio profiling of Saharan dust over Barbados during SALTRACE in 2013 and 2014, Atmos. Chem. Phys., 17, 10767–10794, https://doi.org/10.5194/acp-17-10767-2017, 2017. a, b
Haarig, M., Walser, A., Ansmann, A., Dollner, M., Althausen, D., Sauer, D., Farrell, D., and Weinzierl, B.: CCN concentration and INP-relevant aerosol profiles in the Saharan Air Layer over Barbados from polarization lidar and airborne in situ measurements, Atmos. Chem. Phys. Discuss., https://doi.org/10.5194/acp-2019-466, in review, 2019. a, b
Hofer, J., Althausen, D., Abdullaev, S. F., Makhmudov, A. N., Nazarov, B. I., Schettler, G., Engelmann, R., Baars, H., Fomba, K. W., Müller, K., Heinold, B., Kandler, K., and Ansmann, A.: Long-term profiling of mineral dust and pollution aerosol with multiwavelength polarization Raman lidar at the Central Asian site of Dushanbe, Tajikistan: case studies, Atmos. Chem. Phys., 17, 14559–14577, https://doi.org/10.5194/acp-17-14559-2017, 2017. a, b, c, d, e, f
Holben, B. N., Eck, T. F., Slutsker, I., Tanré, D., Buis, J. P., Setzer, A., Vermote, E., Reagan, J. A., Kaufman, Y. J., Nakajima, T., Lavenu, F., Jankowiak, I., and Smirnov, A.: AERONET – a federated instrument network and data archive for aerosol characterization, Remote Sens. Environ., 66, 1–16, 1998. a
Hoose, C. and Möhler, O.: Heterogeneous ice nucleation on atmospheric aerosols: a review of results from laboratory experiments, Atmos. Chem. Phys., 12, 9817–9854, https://doi.org/10.5194/acp-12-9817-2012, 2012. a
HYSPLIT: HYbrid Single-Particle Lagrangian Integrated Trajectory model, backward trajectory calculation tool, available at: http://ready.arl.noaa.gov/HYSPLIT_traj.php, last access: 22 February 2019. a
Kanitz, T., Ansmann, A., Engelmann, R., and Althausen, D.: North‐south cross sections of the vertical aerosol distribution over the Atlantic Ocean from multiwavelength Raman/polarization lidar during Polarstern cruises, J. Geophys. Res.-Atmos., 118, 2643–2655, https://doi.org/10.1002/jgrd.50273, 2013. a
Kanji, Z. A., Ladino, L. A., Wex, H., Boose, Y., Burkert-Kohn, M., Cziczo, D. J., and Krämer, M.: Chapter 1: Overview of ice nucleating particles, Meteor Monogr., Am. Meteorol. Soc., 58, 1–33, https://doi.org/10.1175/amsmonographs-d-16-0006.1, 2017. a
Lv, M., Wang, Z., Li, Z., Luo, T., Ferrare, R., Liu, D., Wu, D., Mao, J., Wan, B., Zhang, F., and Wang, Y.: Retrieval of cloud condensation nuclei number concentration profiles from lidar extinction and backscatter data, J. Geophys. Res.-Atmos., 123, 6082–6098, https://doi.org/10.1029/2017JD028102, 2018. a, b
Mamali, D., Marinou, E., Sciare, J., Pikridas, M., Kokkalis, P., Kottas, M., Binietoglou, I., Tsekeri, A., Keleshis, C., Engelmann, R., Baars, H., Ansmann, A., Amiridis, V., Russchenberg, H., and Biskos, G.: Vertical profiles of aerosol mass concentration derived by unmanned airborne in situ and remote sensing instruments during dust events, Atmos. Meas. Tech., 11, 2897–2910, https://doi.org/10.5194/amt-11-2897-2018, 2018. a
Mamouri, R. E. and Ansmann, A.: Fine and coarse dust separation with polarization lidar, Atmos. Meas. Tech., 7, 3717–3735, https://doi.org/10.5194/amt-7-3717-2014, 2014. a, b, c, d, e
Mamouri, R. E. and Ansmann, A.: Estimated desert-dust ice nuclei profiles from polarization lidar: methodology and case studies, Atmos. Chem. Phys., 15, 3463–3477, https://doi.org/10.5194/acp-15-3463-2015, 2015. a, b, c, d
Mamouri, R.-E. and Ansmann, A.: Potential of polarization lidar to provide profiles of CCN- and INP-relevant aerosol parameters, Atmos. Chem. Phys., 16, 5905–5931, https://doi.org/10.5194/acp-16-5905-2016, 2016. a, b, c, d, e, f, g, h, i, j, k, l, m, n, o
Mamouri, R.-E. and Ansmann, A.: Potential of polarization/Raman lidar to separate fine dust, coarse dust, maritime, and anthropogenic aerosol profiles, Atmos. Meas. Tech., 10, 3403–3427, https://doi.org/10.5194/amt-10-3403-2017, 2017. a, b, c, d, e, f, g, h, i, j
Mamouri, R. E., Ansmann, A., Nasantzi, A., Kokkalis, P., Schwarz, A., and Hadjimitsis, D.: Low Arabian extinction-to-backscatter ratio, Geophys. Res. Lett., 40, 4762–4766, https://doi.org/10.1002/grl.50898, 2013. a
Marinou, E., Amiridis, V., Binietoglou, I., Tsikerdekis, A., Solomos, S., Proestakis, E., Konsta, D., Papagiannopoulos, N., Tsekeri, A., Vlastou, G., Zanis, P., Balis, D., Wandinger, U., and Ansmann, A.: Three-dimensional evolution of Saharan dust transport towards Europe based on a 9-year EARLINET-optimized CALIPSO dataset, Atmos. Chem. Phys., 17, 5893–5919, https://doi.org/10.5194/acp-17-5893-2017, 2017. a
Marinou, E., Tesche, M., Nenes, A., Ansmann, A., Schrod, J., Mamali, D., Tsekeri, A., Pikridas, M., Baars, H., Engelmann, R., Voudouri, K.-A., Solomos, S., Sciare, J., Groß, S., Ewald, F., and Amiridis, V.: Retrieval of ice-nucleating particle concentrations from lidar observations and comparison with UAV in situ measurements, Atmos. Chem. Phys., 19, 11315–11342, https://doi.org/10.5194/acp-19-11315-2019, 2019. a, b, c, d
Müller, D., Mattis, I., Ansmann, A., Wandinger, U., Ritter, C., and Kaiser, D.: Multiwavelength Raman lidar observations of particle growth during long-range transport of forest-fire smoke in the free troposphere, Geophys. Res. Lett., 34, L05803, https://doi.org/10.1029/2006GL027936, 2007. a
Murray, B. J., O'Sullivan, D., Atkinson, J. D., and Webb, M. E.: Ice nucleation by particles immersed in supercooled cloud droplets, Chem. Soc. Rev., 41, 6519–6554, https://doi.org/10.1039/c2cs35200a, 2012. a
Nisantzi, A., Mamouri, R. E., Ansmann, A., and Hadjimitsis, D.: Injection of mineral dust into the free troposphere during fire events observed with polarization lidar at Limassol, Cyprus, Atmos. Chem. Phys., 14, 12155–12165, https://doi.org/10.5194/acp-14-12155-2014, 2014. a
Nisantzi, A., Mamouri, R. E., Ansmann, A., Schuster, G. L., and Hadjimitsis, D. G.: Middle East versus Saharan dust extinction-to-backscatter ratios, Atmos. Chem. Phys., 15, 7071–7084, https://doi.org/10.5194/acp-15-7071-2015, 2015. a, b
Pappalardo, G., Amodeo, A., Apituley, A., Comeron, A., Freudenthaler, V., Linné, H., Ansmann, A., Bösenberg, J., D'Amico, G., Mattis, I., Mona, L., Wandinger, U., Amiridis, V., Alados-Arboledas, L., Nicolae, D., and Wiegner, M.: EARLINET: towards an advanced sustainable European aerosol lidar network, Atmos. Meas. Tech., 7, 2389–2409, https://doi.org/10.5194/amt-7-2389-2014, 2014. a
PollyNET: PollyNET lidar data base, available at: http://polly.rsd.tropos.de/, last access: 22 Februray 2019. a
Rolph, G., Stein, A., and Stunder, B.: Real-time Environmental Applications and Display sYstem: READY, Environ. Modell. Softw., 95, 210–228, https://doi.org/10.1016/j.envsoft.2017.06.025, 2017. a
Ryder, C. L., Highwood, E. J., Walser, A., Seibert, P., Philipp, A., and Weinzierl, B.: Coarse and Giant Particles are Ubiquitous in Saharan Dust Export Regions and are Radiatively Significant over the Sahara, Atmos. Chem. Phys. Discuss., https://doi.org/10.5194/acp-2019-421, in review, 2019. a, b
Schrod, J., Weber, D., Drücke, J., Keleshis, C., Pikridas, M., Ebert, M., Cvetković, B., Nickovic, S., Marinou, E., Baars, H., Ansmann, A., Vrekoussis, M., Mihalopoulos, N., Sciare, J., Curtius, J., and Bingemer, H. G.: Ice nucleating particles over the Eastern Mediterranean measured by unmanned aircraft systems, Atmos. Chem. Phys., 17, 4817–4835, https://doi.org/10.5194/acp-17-4817-2017, 2017. a
Seifert, P., Ansmann, A., Mattis, I., Wandinger, U., Tesche, M., Engelmann, R., Müller, D., Pérez, C., and Haustein, K.: Saharan dust and heterogeneous ice formation: eleven years of cloud observations at a central European EARLINET site, J. Geophys. Res., 115, D20201, https://doi.org/10.1029/2009JD013222, 2010. a
Shimizu, A., Sugimoto, N., Matsui, I., Arao, K., Uno, I., Murayama,T., Kagawa, N., Aoki, K., Uchiyama, A., and Yamazaki, A.: Continuous observations of Asian dust and other aerosols by polarization lidars in China and Japan during ACE-Asia, J. Geophys.Res., 109, D19S17, https://doi.org/10.1029/2002JD003253, 2004. a
Shin, S.-K., Tesche, M., Kim, K., Kezoudi, M., Tatarov, B., Müller, D., and Noh, Y.: On the spectral depolarisation and lidar ratio of mineral dust provided in the AERONET version 3 inversion product, Atmos. Chem. Phys., 18, 12735–12746, https://doi.org/10.5194/acp-18-12735-2018, 2018. a, b
Shinozuka, Y., Clarke, A. D., Nenes, A., Jefferson, A., Wood, R., McNaughton, C. S., Ström, J., Tunved, P., Redemann, J., Thornhill, K. L., Moore, R. H., Lathem, T. L., Lin, J. J., and Yoon, Y. J.: The relationship between cloud condensation nuclei (CCN) concentration and light extinction of dried particles: indications of underlying aerosol processes and implications for satellite-based CCN estimates, Atmos. Chem. Phys., 15, 7585–7604, https://doi.org/10.5194/acp-15-7585-2015, 2015. a, b, c, d, e, f
Siebert, H. and Shaw, R.: Supersaturation Fluctuations during the Early Stage of Cumulus Formation, J. Atmos. Sci., 74, 975–988, https://doi.org/10.1175/JAS-D-16-0115.1, 2017. a
Stein, A. F., Draxler, R. R., Rolph, G. D., Stunder, B. J. B., Cohen, M. D., and Ngan, F.: NOAA's HYSPLIT atmospheric transport and dispersion modeling system, B. Am. Meteorol. Soc., 96, 2059–2077, https://doi.org/10.1175/BAMS-D-14-00110.1, 2015 a
Tesche, M., Ansmann, A., Müller, D., Althausen, D., Engelmann, R., Freudenthaler, V., and Groß, S.: Vertically resolved separation of dust and smoke over Cape Verde using multiwavelength Raman and polarization lidars during Saharan Mineral Dust Experiment 2008, J. Geophys. Res., 114, D13202, https://doi.org/10.1029/2009JD011862, 2009. a, b
Tesche, M., Groß, S., Ansmann, A., Müller, D., Althausen, D., Freudenthaler, V., and Esselborn, M.: Profiling of Saharan dust and biomass-burning smoke with multiwavelength polarization Raman lidar at Cape Verde, Tellus B, 63, 649–676, https://doi.org/10.1111/j.1600-0889.2011.00548.x, 2011. a, b
Ullrich, R., Hoose, C., Möhler, O., Niemand, M., Wagner, R., Höhler, K., Hiranuma, N., Saathoff, H., and Leisner, T.: A new ice nucleation active site parameterization for desert dust and soot, J. Atmos. Sci., 74, 699–717, 2017. a, b, c, d
Veselovskii, I., Goloub, P., Podvin, T., Bovchaliuk, V., Derimian, Y., Augustin, P., Fourmentin, M., Tanre, D., Korenskiy, M., Whiteman, D. N., Diallo, A., Ndiaye, T., Kolgotin, A., and Dubovik, O.: Retrieval of optical and physical properties of African dust from multiwavelength Raman lidar measurements during the SHADOW campaign in Senegal, Atmos. Chem. Phys., 16, 7013–7028, https://doi.org/10.5194/acp-16-7013-2016, 2016. a, b
Winker, D. M., Vaughan, M. A., Omar, A., Hu, Y., Powell, K. A., Liu, Z., Hunt, W. H., and Young, S. A.: Overview of the CALIPSO mission and CALIOP data processing algorithms, J. Atmos. Ocean. Tech., 26, 2310–2323, 2009. a
- Abstract
- Introduction
- Methodological background
- Conversion parameters from the AERONET database
- Lidar measurement example: case study of a dust observation in Tajikistan
- Conclusions
- Data availability
- Author contributions
- Competing interests
- Acknowledgements
- Financial support
- Review statement
- References