the Creative Commons Attribution 4.0 License.
the Creative Commons Attribution 4.0 License.
 | 16 Sep 2019
A study of a two-dimensional scanned lunar image for Advanced Technology Microwave Sounder (ATMS) geometric calibration
Jun Zhou
Hu Yang
The NOAA-20 satellite was successfully launched on 18 November 2017. It carries five key instruments, including the Advanced Technology Microwave Sounder (ATMS). On 31 January 2018, the spacecraft performed a pitch-over maneuver operation, during which two-dimensional lunar scan observations were collected. In this study, a technique has been developed by which the ATMS on-orbit geometric calibration accuracy can be validated based on this lunar scan dataset. The fully calibrated data are fitted to the antenna pattern coordinates via a Gaussian function. The deviation in the center of the fit function from the origin of the frame is taken to be the boresight pointing error of the instrument. This deviation is further transformed to the Euler angle roll and pitch defined in the spacecraft coordinate system. The estimated ATMS boresight pointing Euler angle roll (pitch) is 0.05∘ (0.22∘) at K band, −0.07∘ (0.25∘) at Ka band, 0.02∘ (0.24∘) at V band, () at W band, and (0.02∘) at G band. The results are validated by comparing them with those derived from the coastline inflection point method, showing a good correlation. For the sounding channels where the coastline method is inapplicable, the lunar scan method is still capable of delivering reasonable estimations of their geometric calibration errors.


On 18 November 2017, NOAA-20 satellite was launched to a polar orbit 824 km above the Earth with an inclination angle of 98.7∘, leading its predecessor Suomi National Polar-orbiting Partnership (SNPP) by half an orbit. It inherits all the five key instruments from SNPP, that is, the Advanced Technology Microwave Sounder (ATMS), the Cross-track Infrared Sounder (CrIS), the Ozone Mapping and Profiler Suite, the Visible Infrared Imaging Radiometer Suite (VIIRS), and the Clouds and the Earth’s Radiant Energy System (CERES). ATMS is a cross-track scanning microwave radiometer, providing total of 22 channels at microwave frequencies ranging from 23 to 183 GHz for profiling the atmospheric temperature and moisture under all weather conditions. As part of the ATMS calibration and validation activities, the geolocation accuracy of ATMS data must be well characterized and documented during postlaunch.
Most of the methods applied to assess the on-orbit geolocation error of microwave sensors rely on Earth targets, such as the coastline inflection point method (CIP) (Hoffman et al., 1987; Smith et al., 2009; Gregorich and Aumann, 2003; Currey, 2002), image co-registration method (Wang et al., 2013, 2017; Wolfe et al., 2002, 2013; Khlopenkov et al., 2010), land–sea fraction method (LFM) (Bennartz, 1999), and ascending and descending observation comparison (Moradi et al., 2013). A recent study (Zhou et al., 2019) disclosed that antenna beam misalignment is a major error source in the ATMS total geolocation error budget. This static error term causes the ATMS boresight pointing error to have a scan-angle-dependent feature that should be corrected by Euler angle roll and pitch determined at each field-of-view (FOV) position. In that study, the coastline inflection point method has been improved by taking this into account. In addition, the coastlines along the in-track and cross-track directions are carefully selected to assess the geolocation error in a more accurate way. By taking these measures, the retrieval error can be reduced below 10 % and the scan-angle-dependent feature of geolocation error is also largely mitigated. Based on the retrieved Euler angles, correction matrices can be built and applied to the operational geolocation process to enhance the on-orbit geolocation accuracy.
However, the application of these Earth-target-dependent methods has some limitations. Firstly, they can only be applied to the window channels of microwave radiometers, as sounding channels cannot see Earth's surface due to strong atmospheric absorption. Secondly, the existence of clouds will shade the Earth target, and thus the cloud contaminated pixels need to be screened out. Regarding the aforementioned issues, it is very necessary to develop an on-orbit boresight pointing accuracy evaluation algorithm that is completely independent of the Earth targets.
As a distinctive target with stable microwave emission in the cold cosmic background, the Moon has already been proven to be very useful in evaluating ATMS long-term calibration stability. In doing so, a physical model is developed to simulate the lunar emission at microwave frequencies (Yang et al., 2018). However, the possibility of using the Moon for geolocation validation and correction of microwave sensors has not been widely discussed. Attempts have been made to utilize the lunar intrusion data to assess the boresight pointing error of the Microwave Humidity Sounder (MHS) (Burgdorf et al., 2016) and ATMS (Zhou et al., 2017) and the mutual alignment of channels of MHS (Bonsignori, 2018). The advantage of using lunar intrusion data to assess the beam misalignment is that it will not interrupt the routine operations of the satellite. However, the disadvantage is only the along-track component of the misalignment can be obtained, since the Moon only passes four space-view pixels, sampled 1.1∘ apart along the cross-track direction (Bonsignori, 2018). Besides, for ATMS it has already been proven that its boresight pointing error is scan-angle dependent (Zhou et al., 2019). The beam misalignment estimated at space views thus cannot represent those at the Earth views, which are truly valuable for the on-orbit geolocation accuracy enhancement.
On 31 January 2018, a spacecraft pitch maneuver operation was carried out for NOAA-20 satellite, when the lunar disk was in a full-moon phase. The spacecraft was pitched completely 360∘ over about 14 min, when the satellite entered the Earth umbra region, thereby enabling all the instruments to acquire full scans of deep space. For ATMS, this maneuver establishes a baseline radiometer output from pure cold space. In the middle of the pitch-over operation, a full-moon disk radiation flux was captured at a pitch angle of around 179∘ and data were collected for all channels of ATMS. This two-dimensional lunar scan observation dataset provides a unique chance to study the ATMS radiometric and geometric calibration accuracy.
The objective of this study is to develop an algorithm to assess ATMS boresight pointing accuracy based on the two-dimensional lunar scan observations during the pitch-over maneuver operation. This paper is organized as follows: Sect. 2 explains the ATMS instrument scan geometry and geolocation process; this is followed by a presentation of the lunar scan observations captured by ATMS during the pitch-over maneuver operation. Section 3 describes the methodology, Sect. 4 presents the results and the validation with the coastline method developed in Zhou et al. (2019), and discussion and conclusions are given in Sect. 5.
2.1 Scan geometry
During the process of pitch maneuver, the ATMS instrument performed a normal scan and data from the Earth view, deep space view (DSV), and internal calibration target (ICT) view were collected. For each ATMS scan cycle, the Earth is viewed at 96 different scan angles, which are distributed symmetrically around the nadir direction. A total of 96 ATMS field-of-view (FOV) samples are taken, with each FOV sample representing the midpoint of a brief sampling interval of about 18 ms (JPSS ATMS SDR Calibration ATBD, 2013). With a scan rate of 61.6∘ s−1, the angular sampling interval is 1.11∘. Therefore, the angular range between the first and last (i.e., 96th) sample centroids is 105.45∘ (i.e., 52.725∘ relative to nadir). At each scan, while there are four warm load samples being taken at angles of 193.3, 194.4, 195.5, and 196.6∘, four deep space-view samples can also be collected around 83.4∘, with each sample spaced 1.11∘ apart (Yang and Weng, 2016). The Moon's disk was captured by ATMS at all channels during the pitch-over maneuver operation. The Moon appears between ATMS FOV 60 to 70 in about ±20 scan lines around center peak pitch angle of 180∘. With the DSV and ICT samples at each scan, the collected raw data counts of lunar scans were able to be transferred to the lunar radiation flux by using the two-point calibration equation (Yang et al., 2016).

Figure 1ATMS scan geometry when operating in pitch-over mode. XSC, YSC, and ZSC are the axes of spacecraft coordinate system and its Y−Z plane is the scan plane. The lunar vector entered the scan plane as the spacecraft rotated about 180∘ pitch angle around YSC.
2.2 Geolocation algorithm
The goal of the ATMS geolocation algorithm is to map the beam pointing vector to geodetic longitude and latitude on the Earth ellipsoid for each FOV at each scan position. Specifically, the ATMS geolocation process includes an instrument geolocation module and a common geolocation module. In the instrument geolocation module, the sensor exit vector in the antenna coordinate system is built from scan angle ϑ:
bAnt is then transformed to the spacecraft coordinate system (SC) by applying the antenna beam misalignment correction matrix ROTInst∕Ant and the instrument mounting matrix ROTSC∕Inst. The antenna beam alignment with respect to the instrument cube was measured as Euler angles during the antenna subsystem verification test for each channel at three different scan positions (FOV 1, 48, and 96) and interpolated to the other positions. Instrument mounting error is defined as the misalignment between the instrument and the spacecraft coordinate systems. It is measured in terms of Euler angles during the prelaunch ground test (JPSS ATMS Calibration Data Book, 2007). The corrected vector continues to go through the common geolocation module which is shared among all the sensors onboard NOAA-20. In this module, the beam vector is first transformed from the spacecraft coordinate system to Earth-centered initial (ECI) coordinate system through the matrix ROTECI∕SC built from the quaternions of spacecraft attitude. The rotation matrix ROTECEF∕ECI is then applied to transform the beam vector from ECI to the Earth-centered–Earth-fixed (ECEF) coordinate system by taking Earth orientation, including polar wander, procession, and nutation, into account. Finally, the geodetic latitude and longitude for each FOV can be derived from the intersection of the corrected sensor exit vector bECEF with the WGS84 reference frame (Baker, 2011). The complete geolocation algorithm is shown in the following equation:
The antenna beam pointing direction is differentiated into five bands: K (channel 1), Ka (channel 2), V (channels 3–15), W (channel 16), and G (channels 17–22) bands. Each band has its own set of latitude and longitude values at each beam position.
This study focuses on the evaluation and correction of the static error mainly originating from the antenna beam misalignment and the instrument mounting error, which are the dominant part in the total geolocation error budget. Even though these static error terms have been measured in the prelaunch ground test and the corrections have been included in the geolocation process, residual errors may still exist due to the on-orbit thermal dynamic change and shift during and after the launch.
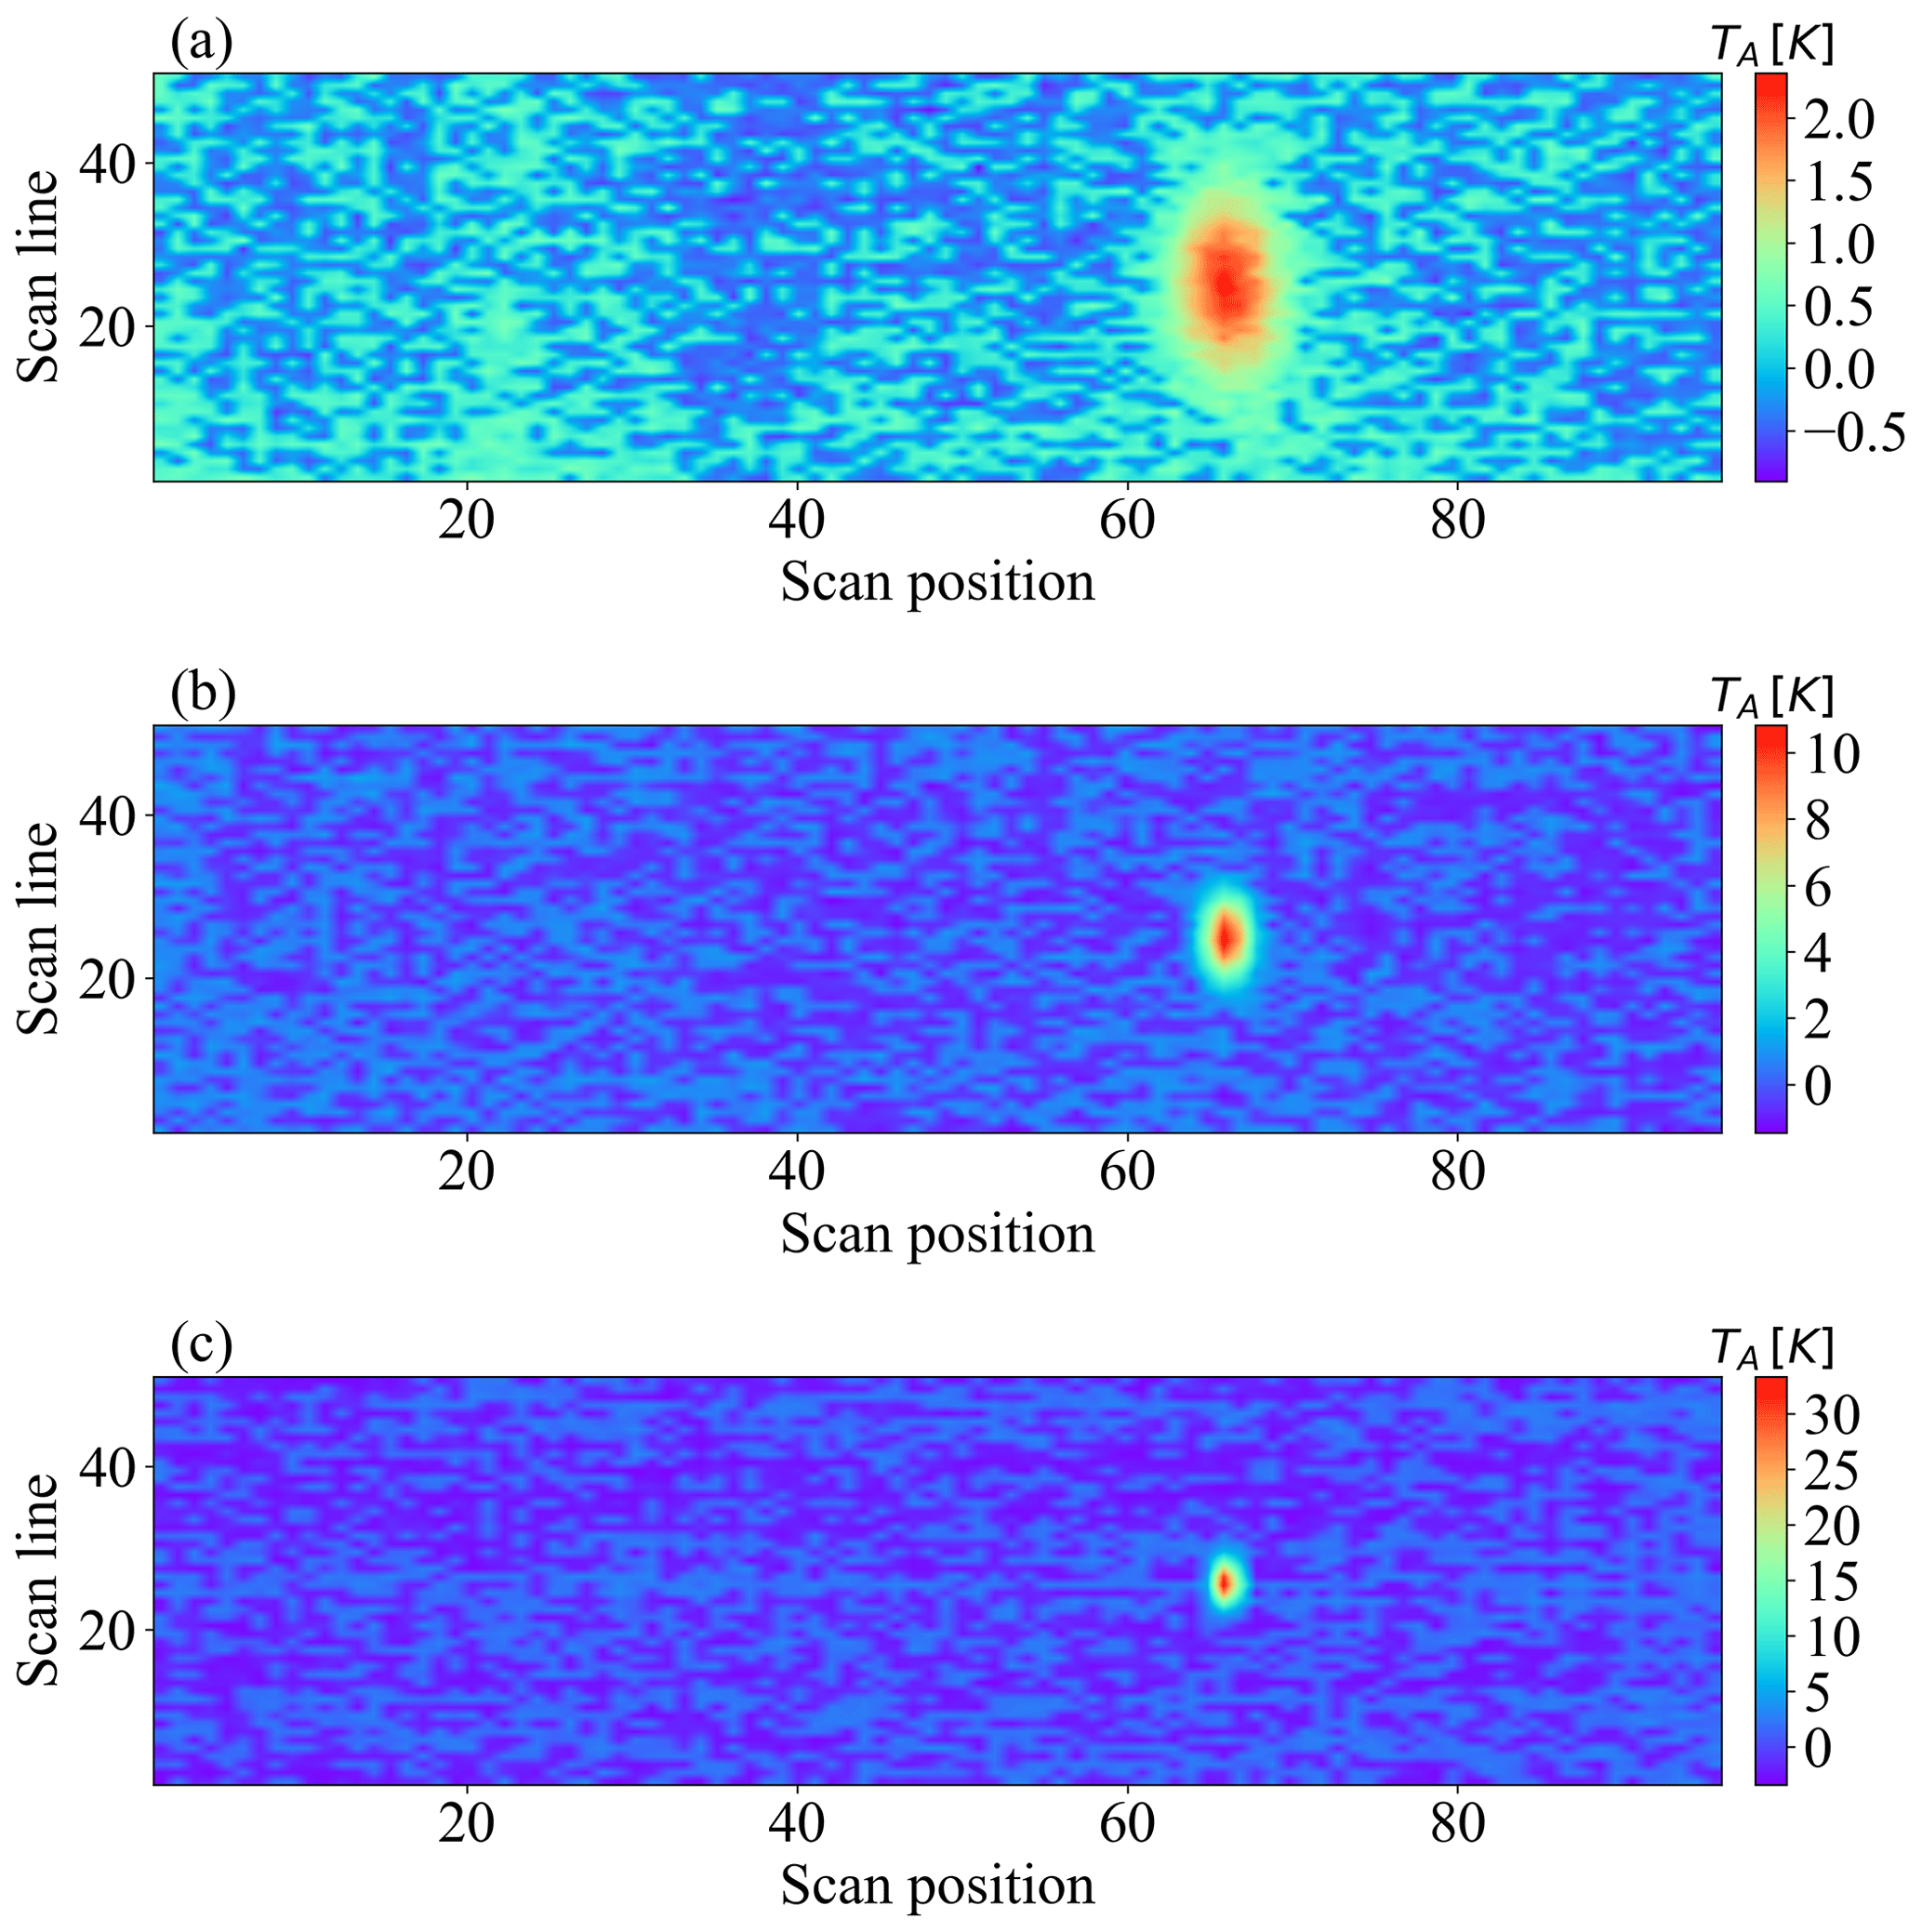
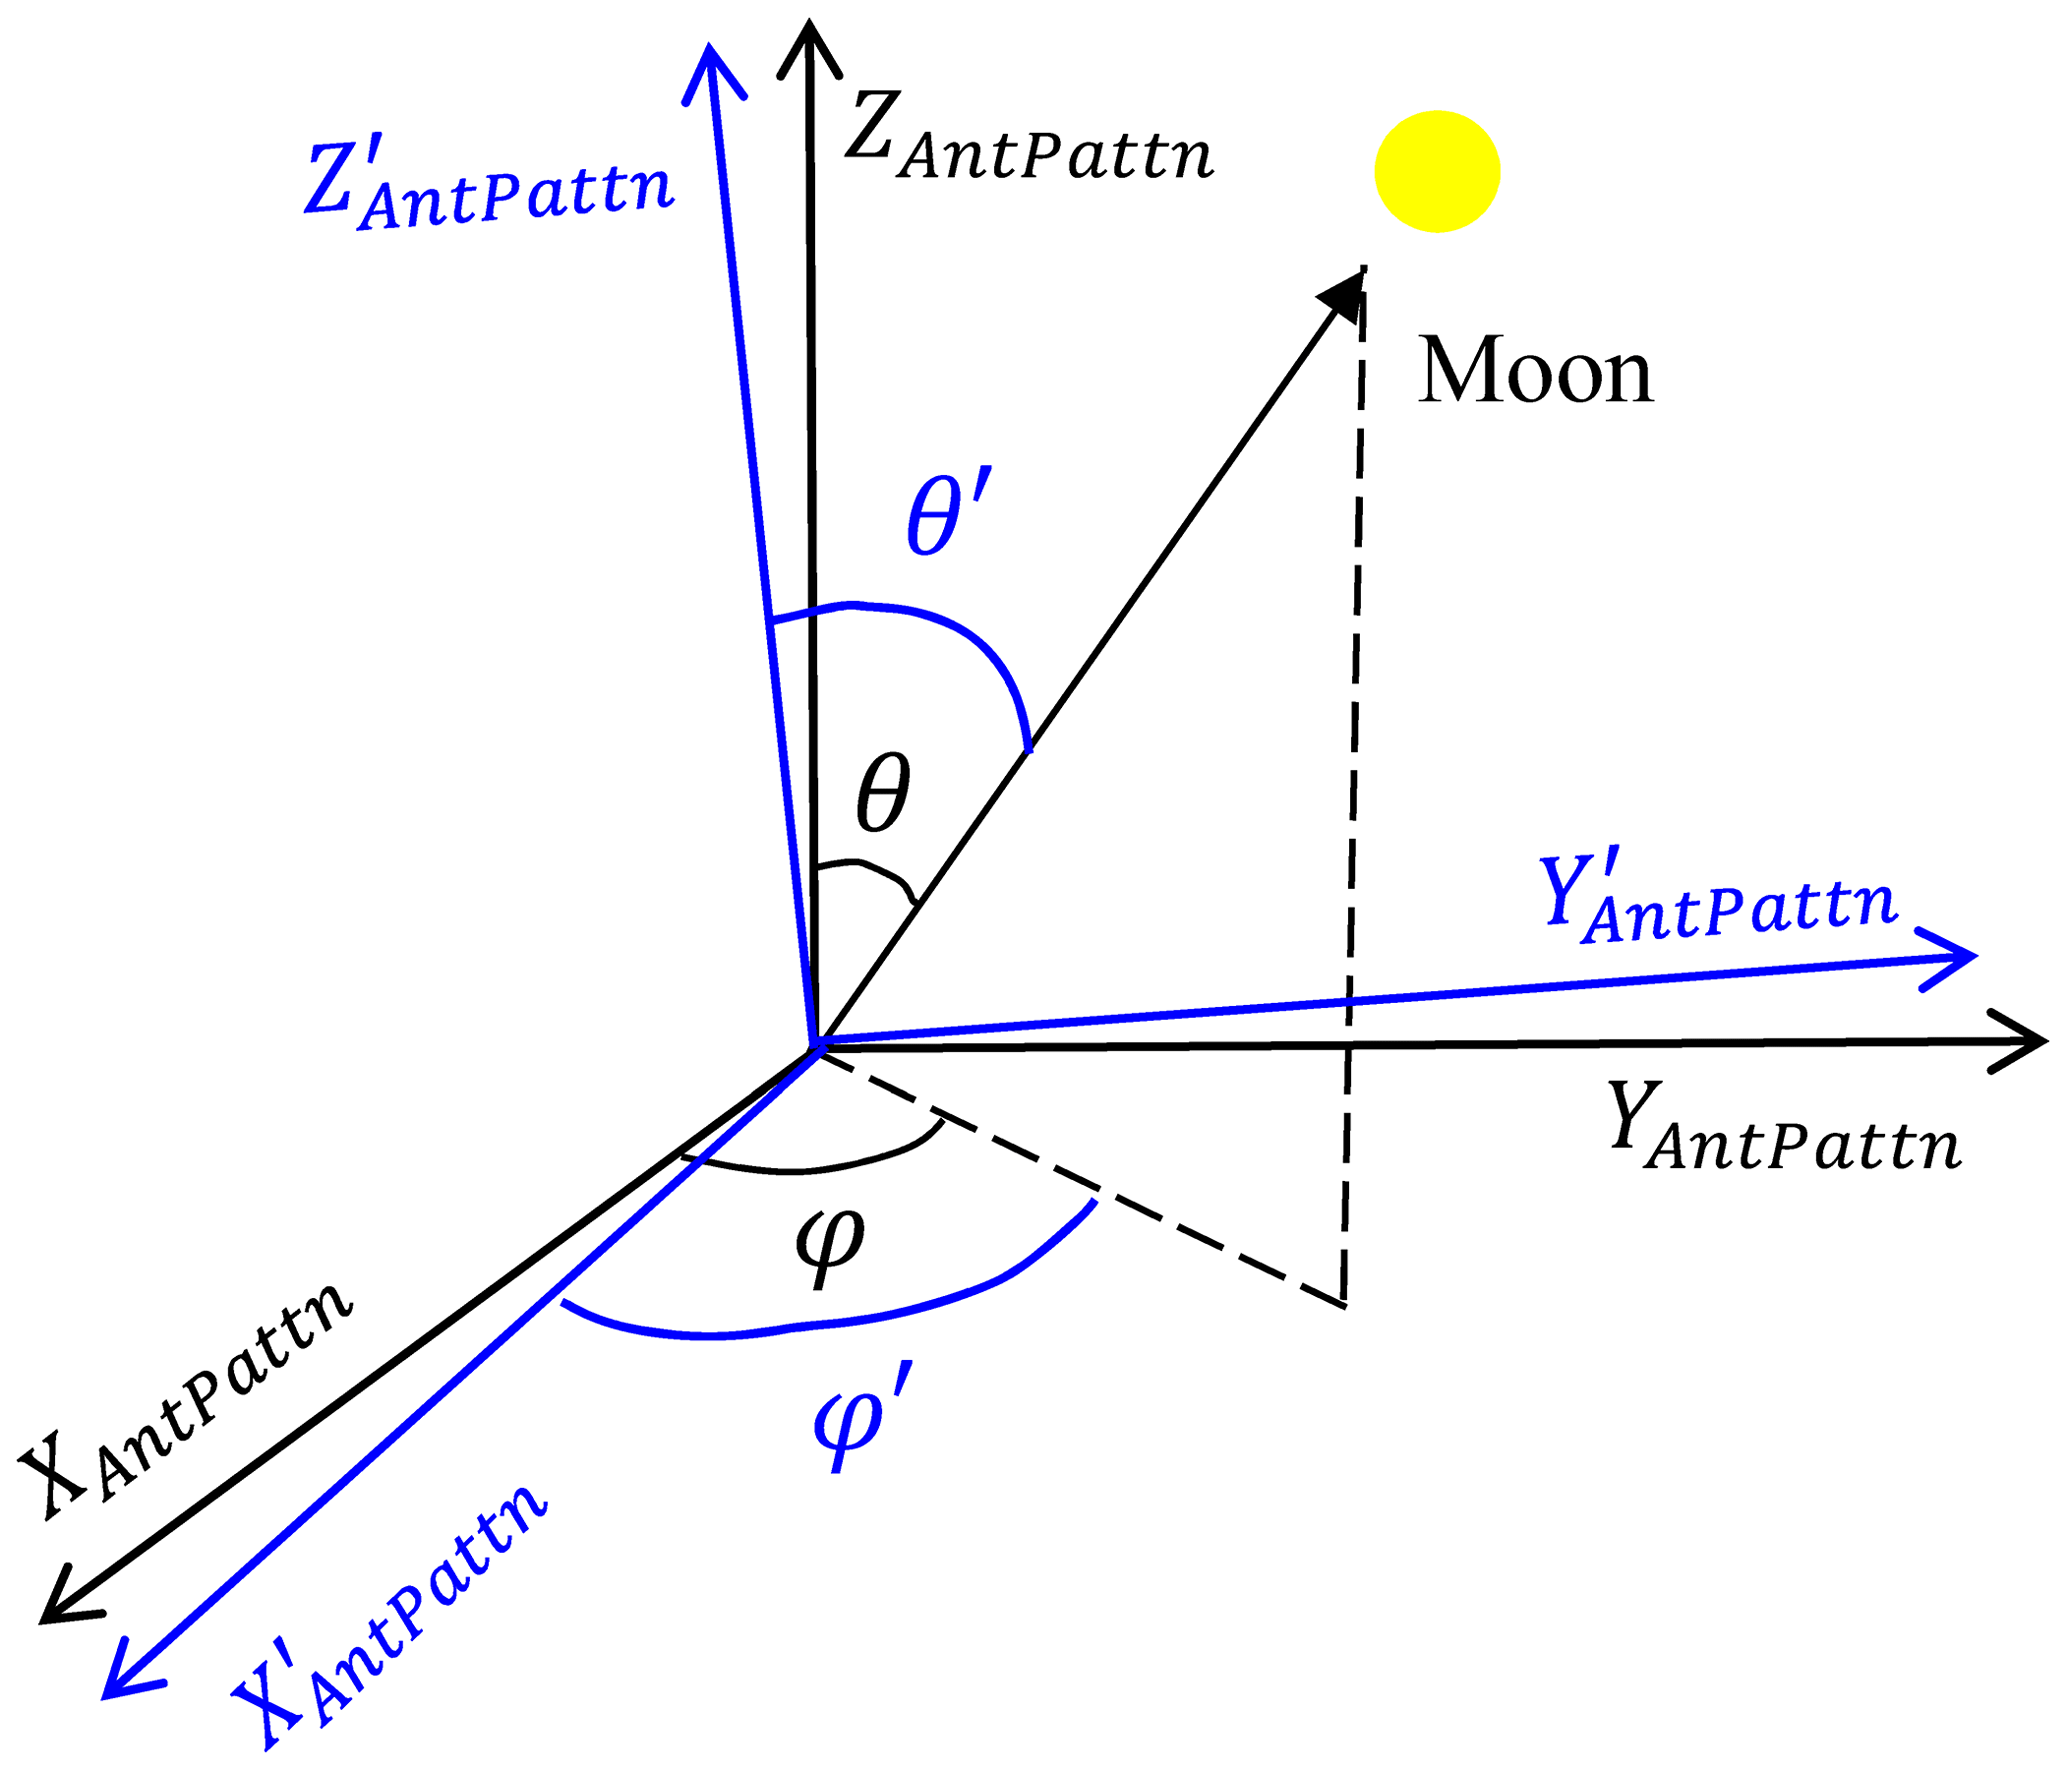
Figure 3Schematic illustration of the moon vector in the antenna pattern frame. , and are the real axes of the frame and XAntPattn,YAntPattn, and ZAntPattn are the nominal axes with beam boresight pointing error. θ′ and φ′ and θ and φ are the zenith and azimuthal angles of the moon vector determined in the real and nominal frames, respectively.
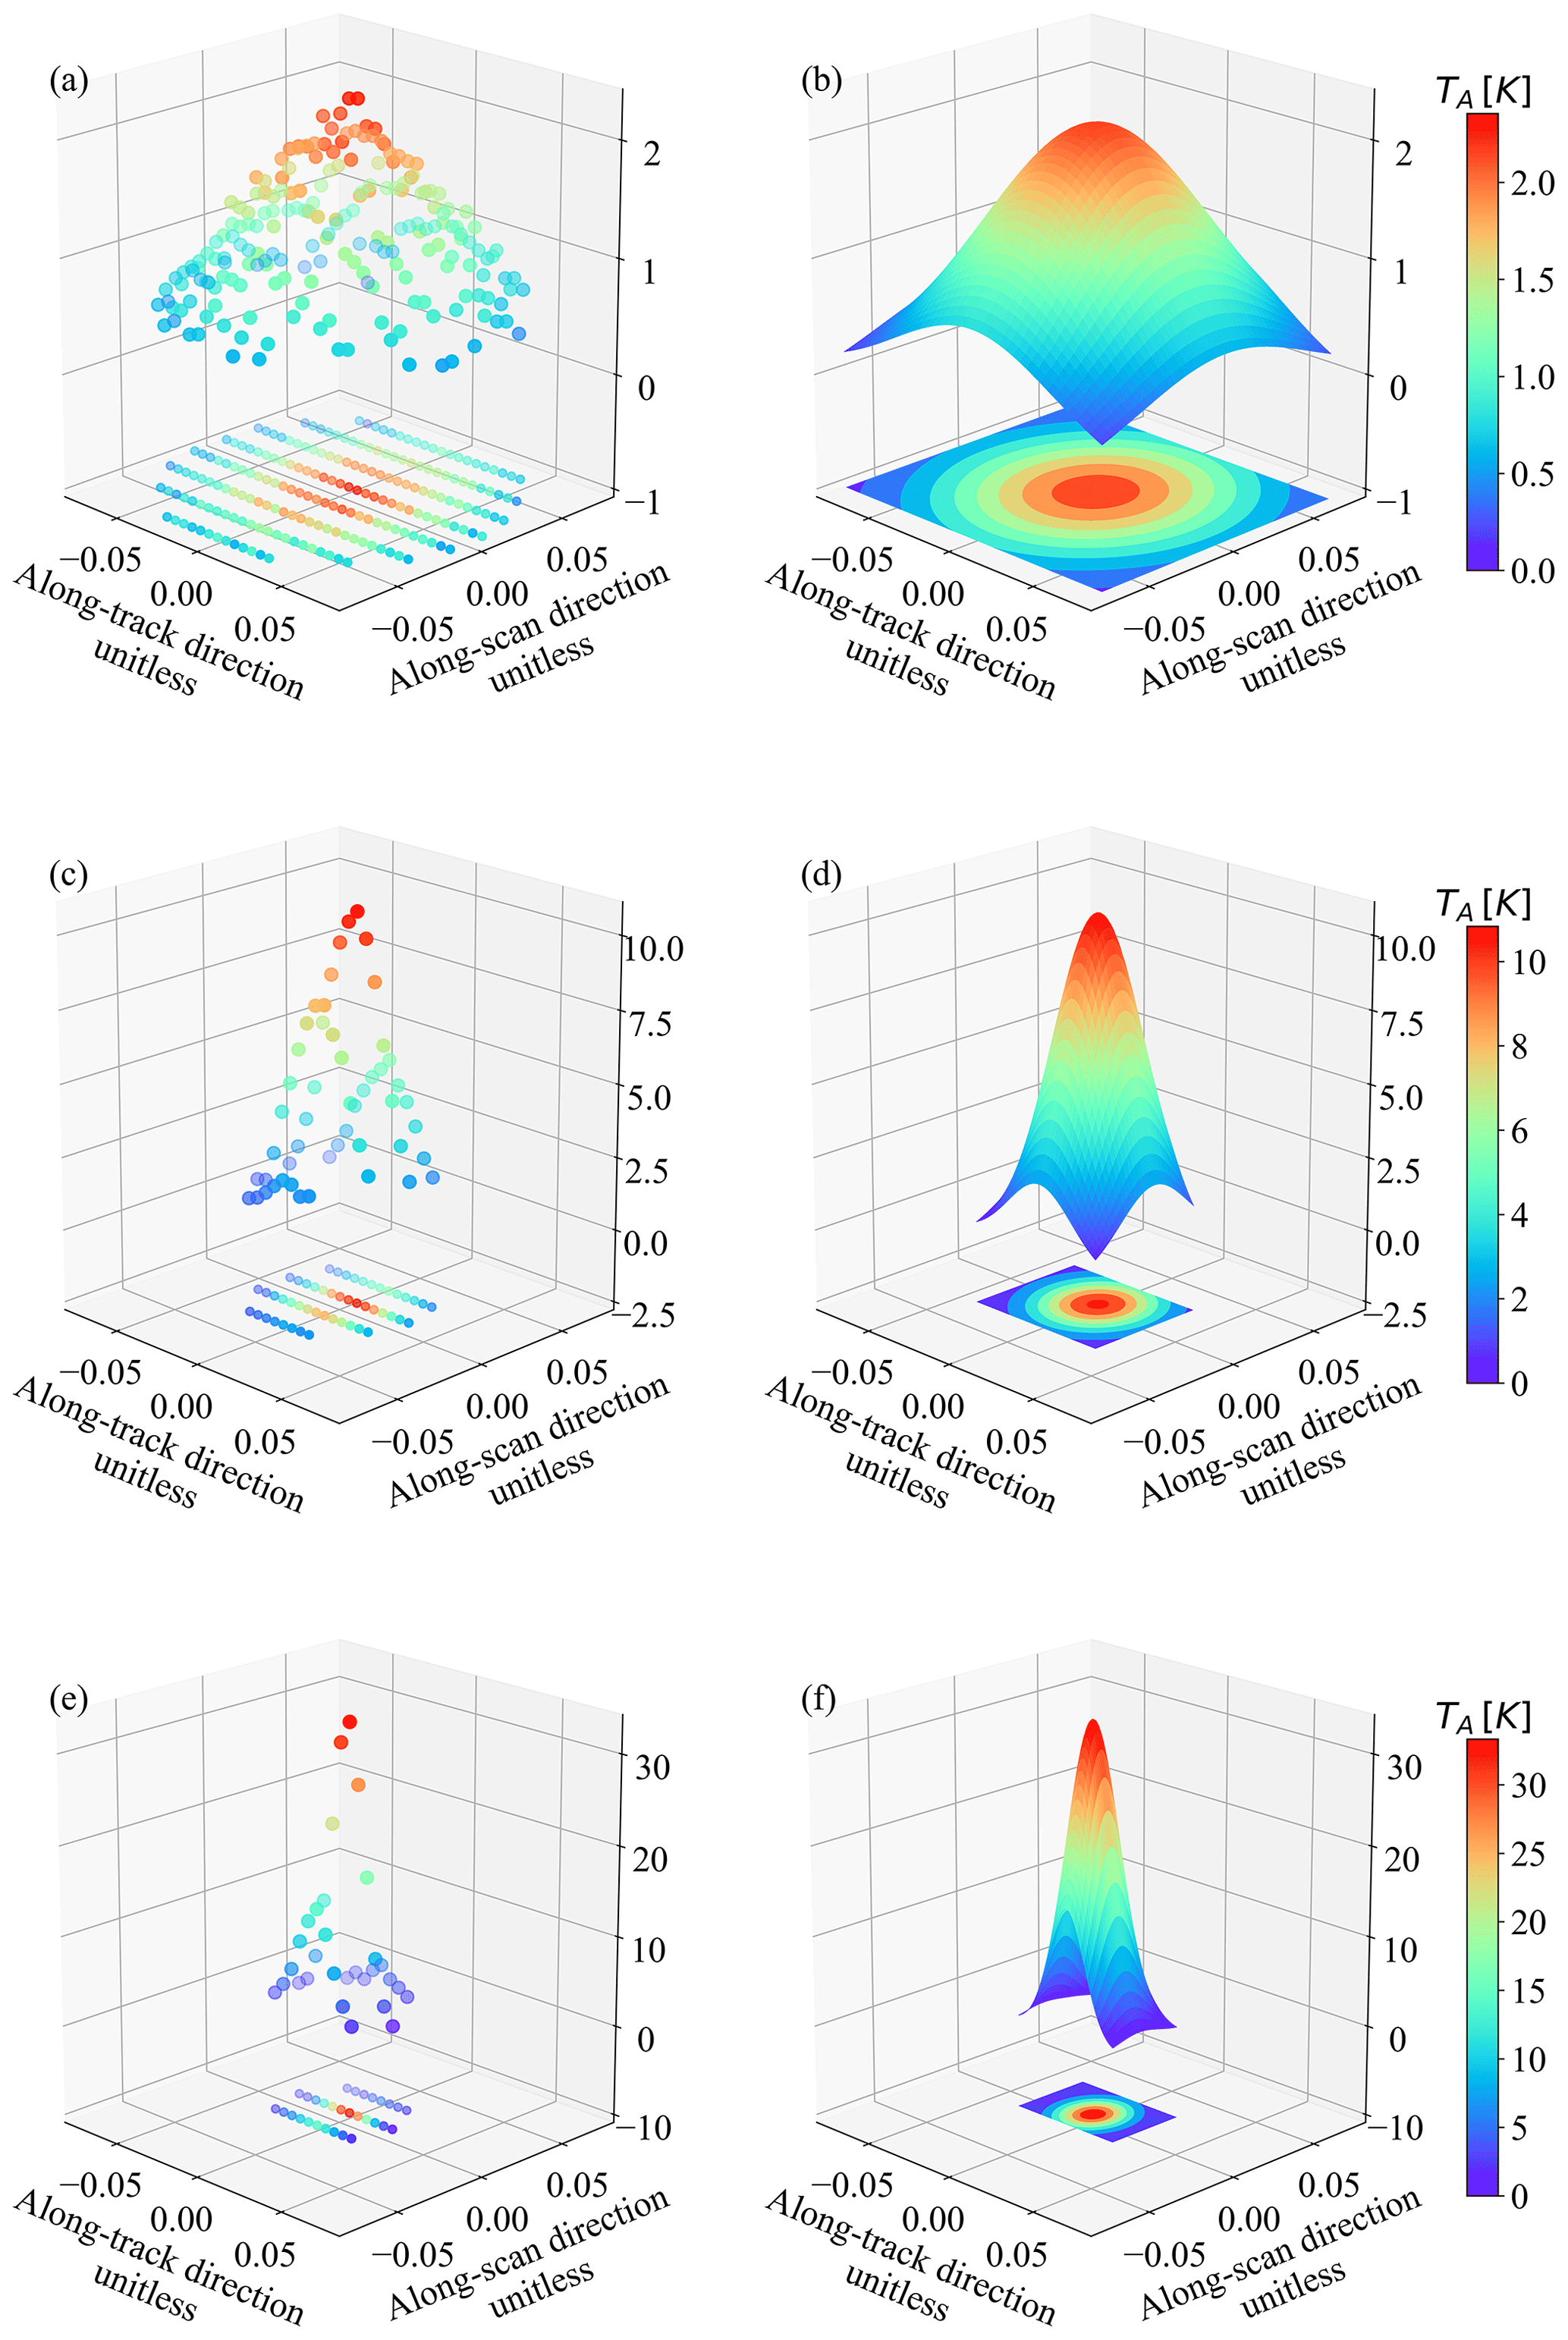
Figure 4Raw observations (the first column) and their fitted two-dimensional Gaussian function (the second column) of channels 1 (a–b), 3 (c–d), and 17 (e–f) in the antenna pattern coordinate system.
When operating in normal mode, the spacecraft coordinate system is fixed to the spacecraft with its origin at the spacecraft center of mass, z axis (ZSC) pointing towards nadir, x axis (XSC) pointing to the along-track direction, and y axis (YSC) completing the right-hand coordinate system. While performing the pitch-over maneuver operation, the satellite was rotating around YSC, as is shown in Fig. 1. For ATMS, the scan is performed in y−z plane of the antenna coordinate system. As the antenna and instrument coordinates are aligned with the spacecraft frame, the pitch-over maneuver operation made the scan plane rotate around YSC with the satellite. When the scan plane rotated towards the Moon, a full lunar disk radiation flux was captured and the data were collected for all channels of ATMS.
The observed raw data counts were transferred to the lunar radiation flux by using the calibration equation with the warm load brightness temperature and cold space brightness temperature being further corrected for warm bias, Earth side-lobe contamination, as well as reflector emission contamination (Yang et al., 2016). To derive the pure lunar signal, the cosmic background radiation is subtracted from the calibrated brightness temperature. Figure 2 shows the observed lunar brightness temperature for channels 1, 3 and 17. Note that in Fig. 2, since the beam width is different for different channel, the lunar disk extended over more scan lines and FOVs for lower-frequency channels (channel 1) than higher-frequency channels (channel 3 with 2.2∘ and channel 17 with 1.1∘).
The lunar scan data can be expressed as the integration of antenna response weighted moon radiance over a solid angle Ωmoon and sampling time τ:
where ΩA is a beam solid angle, Tb is the brightness temperature of the Moon's disk, and Gant(θ,φ) is ATMS antenna pattern. Tb depends on the effective surface emissivity and the phase angle of the Moon. As the change of the phase angle during the pitch-over operation is less than 0.001∘, Tb can be regarded as a constant for a certain channel and taken out of the integration. Therefore, the lunar observations can be modeled as the scaled integration of antenna response. For ATMS, the antenna response has a Gaussian-like distribution with its peak located at the center of the antenna pattern frame. Accordingly, the lunar scan data should appear the same shape in that frame except that the spread of the Gaussian function is widened by the integration over a solid angle and sampling time. More details about the lunar modeling can be found in Yang et al. (2018).
In this section, the method of projecting lunar observations into the antenna pattern frame is presented, followed by the development of the algorithm to derive the ATMS boresight pointing error from the projected lunar scan data.
3.1 Determination of lunar position in antenna pattern coordinates
The antenna pattern coordinate system, where the antenna response is measured in the prelaunch ground test, is defined with its x axis (XAntPattn) pointing to the along-track direction, z axis (ZAntPattn) being aligned with the beam vector, and y axis (YAntPattn) completing the right-hand coordinate system. The zenith and azimuthal angles of the moon vector in this frame, shown as the (θ,φ) in black in Fig. 3, can be determined through the following process.
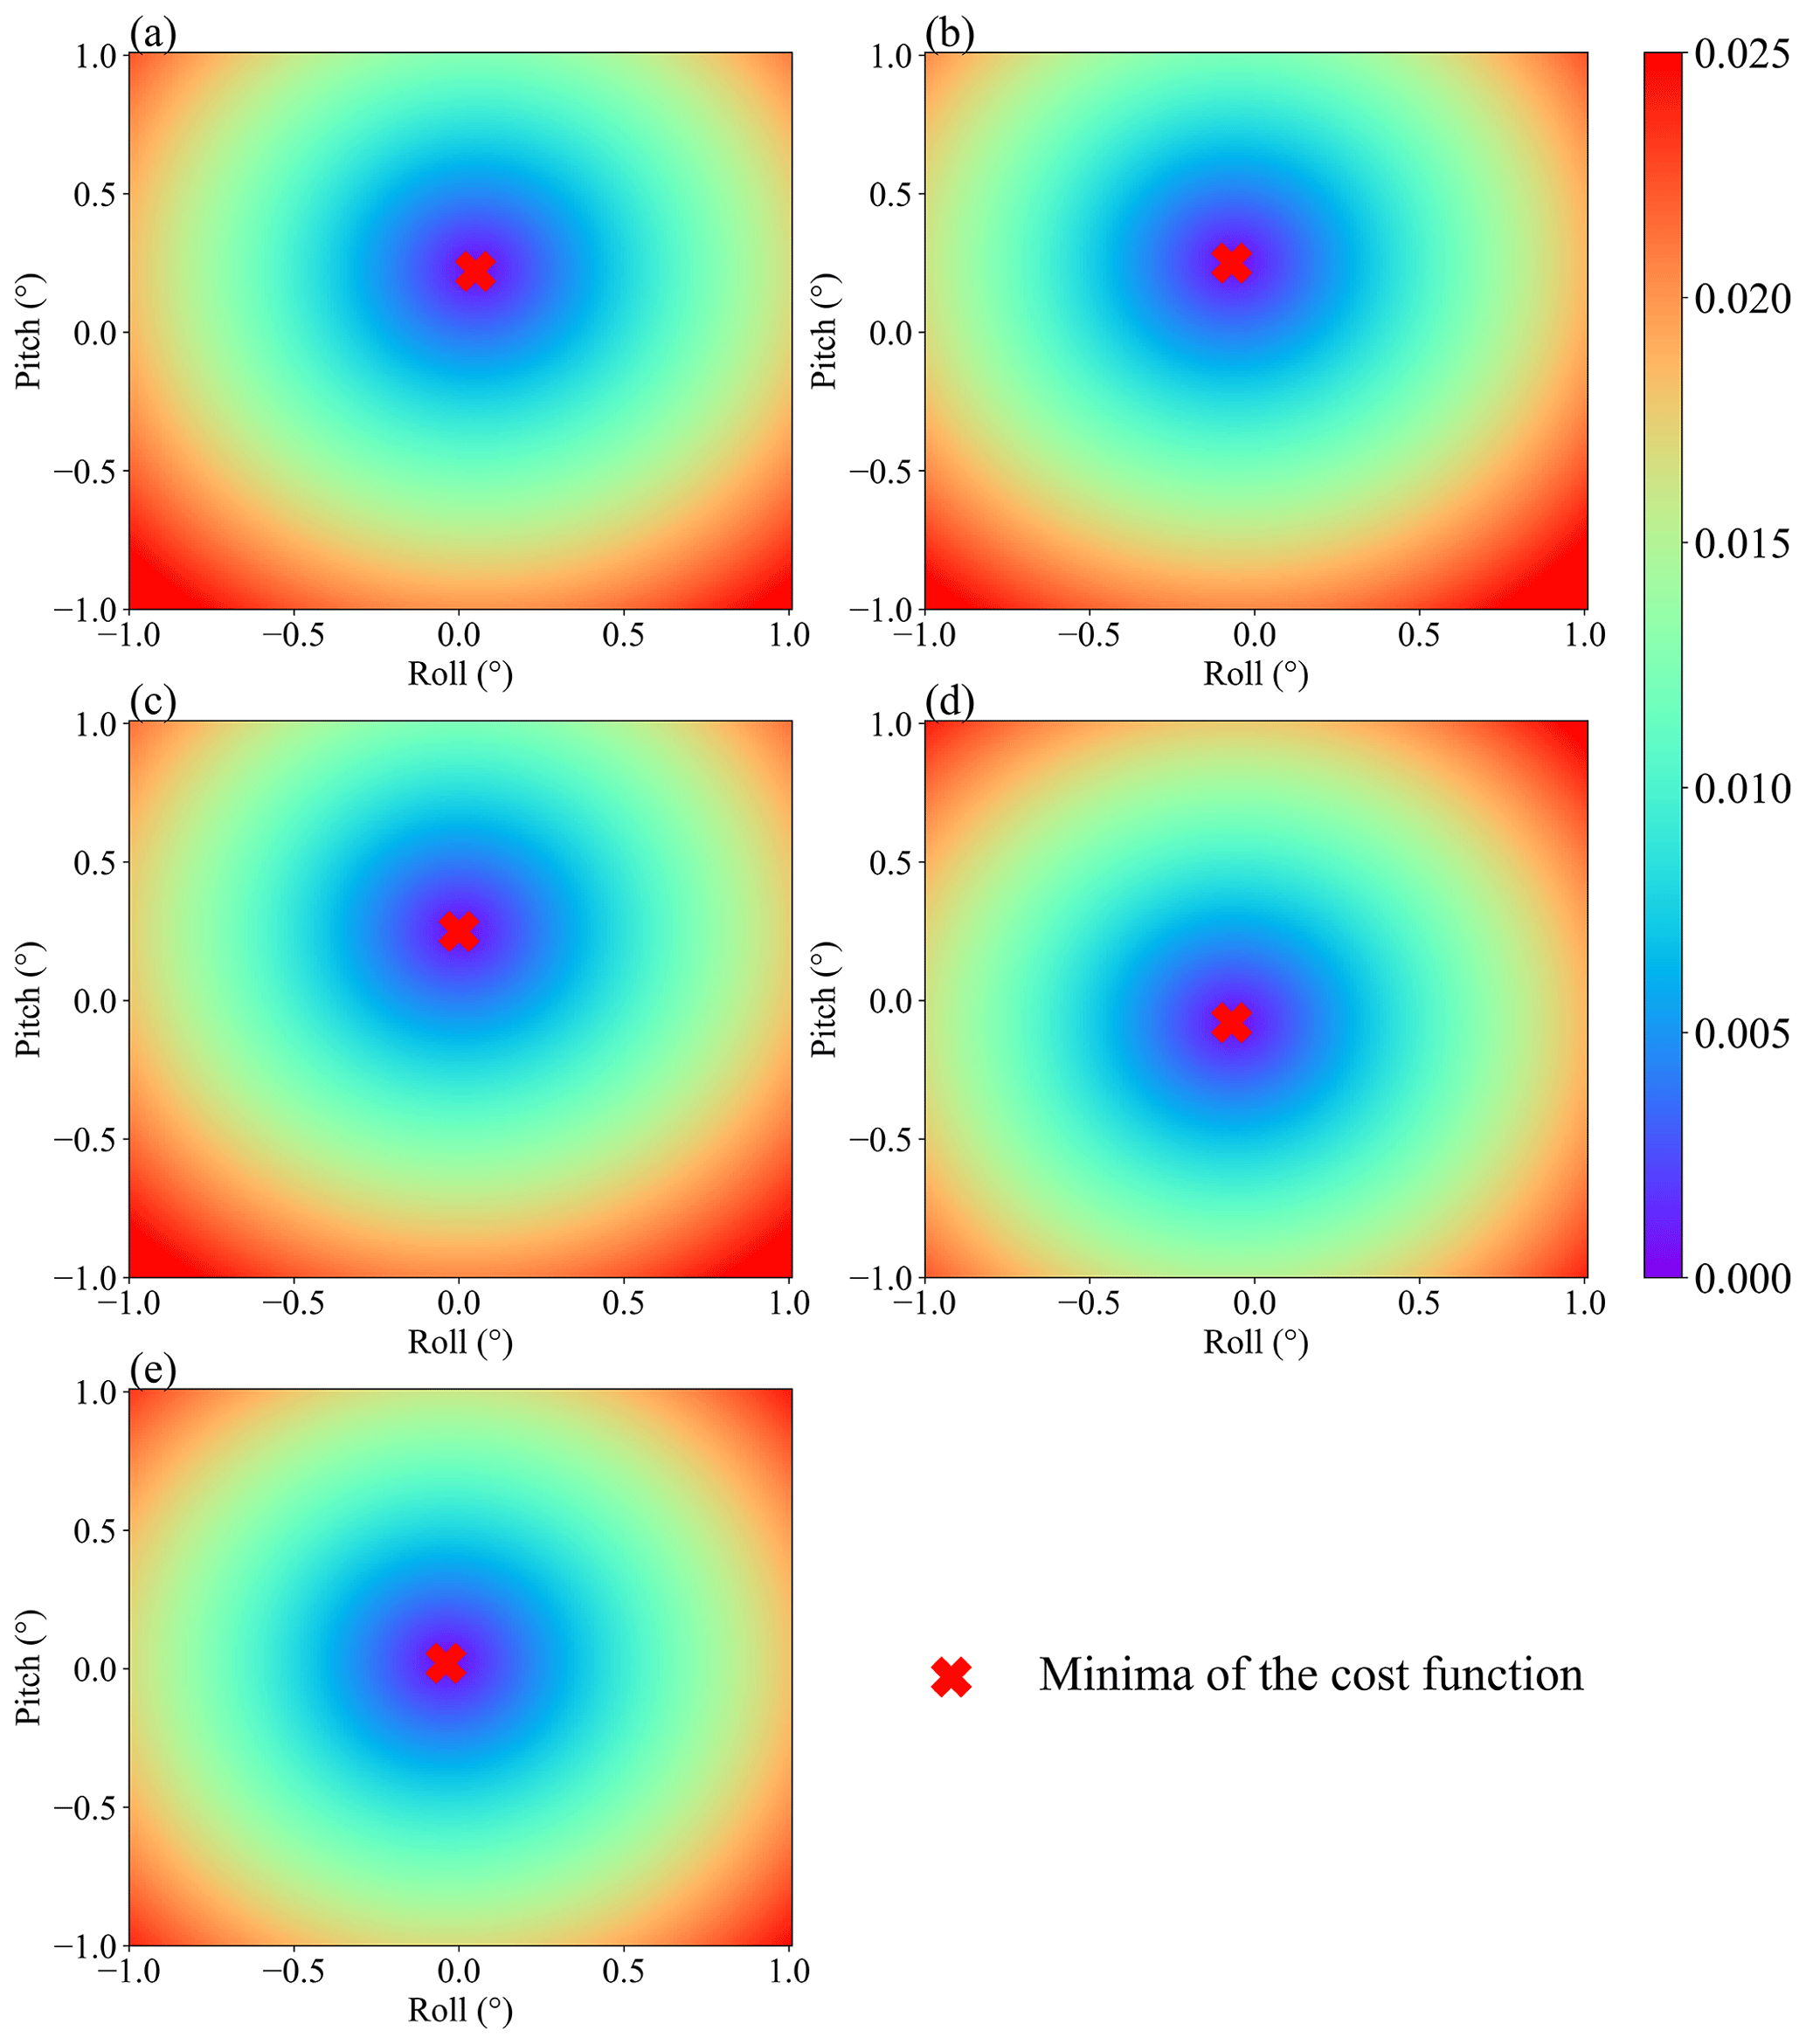
Figure 5Variation in cost function with respect to the shifting of the Euler angle roll and pitch for ATMS channels 1 (a), 2 (b), 3 (c), 16 (d), and 17 (e). The red crosses represent the points where the minima of the cost functions are found.
Given the ephemeris of the Moon and the satellite position vector provided by GPS, the lunar vector (lECI) originating from satellite to the Moon in ECI at any observation time can be calculated through the Naval Observatory Vector Astrometry Software Package version F3.1 (NOVAS F3.1). This software package is an open-source library for computing various commonly used quantities in positional astronomy (Kaplan et al., 2011). It has been implemented in the Algorithm Development Library (ADL), a software program for NOAA polar-orbiting satellite data process, to calculate the sun and moon vectors in order to determine the zenith and azimuthal angles of the Sun and set the lunar intrusion flag (https://jpss.ssec.wisc.edu/, last access: 4 September 2019). lECI is then transformed back to antenna coordinate system by applying the transpose of the rotation matrices in operational geolocation process Eq. (2):
To further transform lAnt into the antenna pattern coordinate system, the rotation matrix ROTAntPattn∕Ant needs to be created. This can be done by defining the three axes of the antenna pattern coordinate in the antenna coordinate system. According to its definition, XAntPattn is aligned with XAnt, ZAntPattn is aligned with bAnt, and YAntPattn is the cross-product of ZAntPattn and XAntPattn. Therefore, the rotation matrix ROTAntPattn∕Ant can be built as follows.
Then the lunar vector in the antenna pattern coordinate system can be derived as follows.
The zenith and azimuthal angle of the lunar vector in the polar coordinate system of the antenna pattern can be obtained as follows.
To present the Gaussian-like distribution of observations, the data are projected in Cartesian coordinates.
The observations of channels 1, 3, and 17 projected in antenna pattern coordinates are plotted in Fig. 4a, c, and e. To extract the valid lunar signal, the observations with the zenith angle larger than a certain value where the negative observations appear are excluded from the dataset. Because of the difference in beam width, the FOV positions that can detect the moon radiance range from FOV 63 to 70 for channels 1–2, FOV 65 to 68 for channels 3–16, and FOV 65 to 67 for channels 17–22. FOV 66 is the scan position where the center of the Moon appears closest to the center of FOV.
3.2 Development of the evaluation algorithm
As described in Sect. 3.1, the key issue in determining the position of the Moon in antenna patterns is to correctly establish the antenna pattern frame based on the pointing direction of beam vector. If the boresight pointing error exists, as in the case shown in Fig. 3, the beam misalignment will make the actual antenna pattern coordinate deviate from its nominal position . The deviation of the antenna pattern frame leads to errors in the determined zenith and azimuthal angles of the moon vector. Through Eqs. (4)–(11), the lunar vector is projected into the nominal antenna pattern frame, not the actual one where the observations are carried out. Consequently, the maxima of the observations in the nominal antenna pattern frame will shift from the coordinate origin.
The basic idea of using lunar scan data to identify the ATMS geometric calibration error is to correct the nominal antenna pattern frame until it is perfectly aligned with the actual one, under which condition the maxima of the observations would be located at the origin of the antenna pattern frame. The correction can be done by correcting each axis of the antenna pattern frame, with the Euler angles counteracting the geometric calibration error. To maintain consistency with the coastline method (Zhou et al., 2019), in which the boresight pointing error is defined in terms of Euler angle roll and pitch at each FOV in the spacecraft coordinate system, the axes of the antenna pattern coordinate system need to be transformed from the antenna coordinate system to the spacecraft coordinate system by going through the rotation matrices in Eq. (2), corrected and then transformed back to the antenna coordinate system:
where ROTcorr is the correction matrix. Since FOV 66 is the scan position where the lunar vector is closest to the FOV center during the pitch-over maneuver operation, the beam pointing error of that specific FOV is supposed to have the strongest contribution to the shift of the observation peak in the antenna pattern frame. Therefore, the elements of ROTcorr are defined by Euler angle roll ξr and pitch ξp in the spacecraft coordinate system at the 66th scan position.
Table 1Euler angles at FOV 66 retrieved from the lunar scan method and coastline inflection point method, as well as the absolute difference between them.
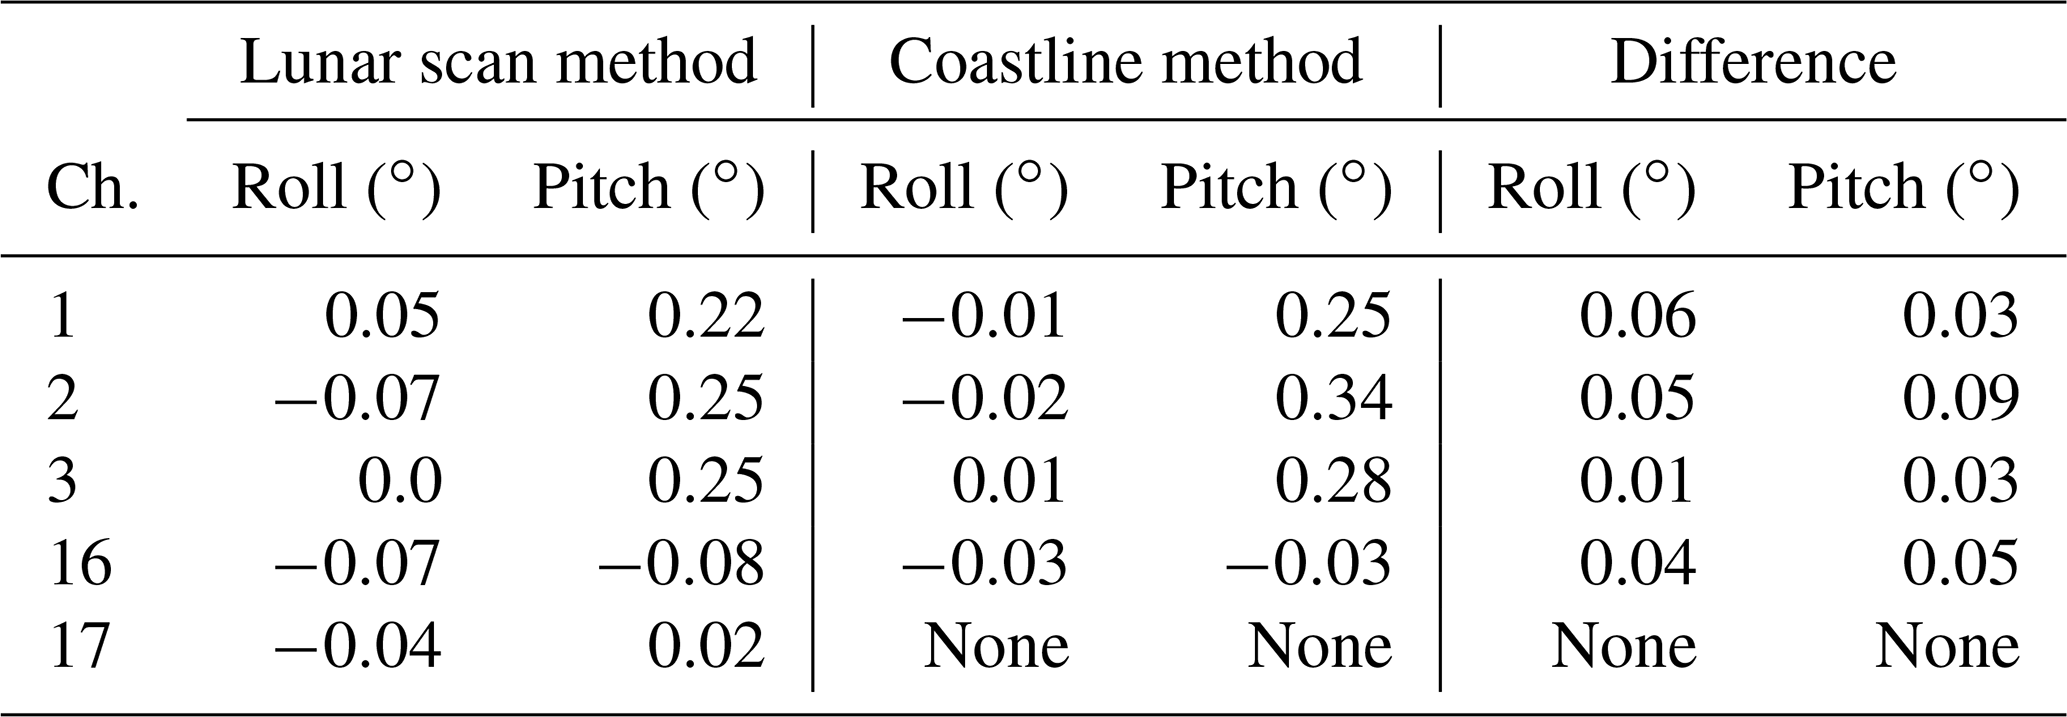
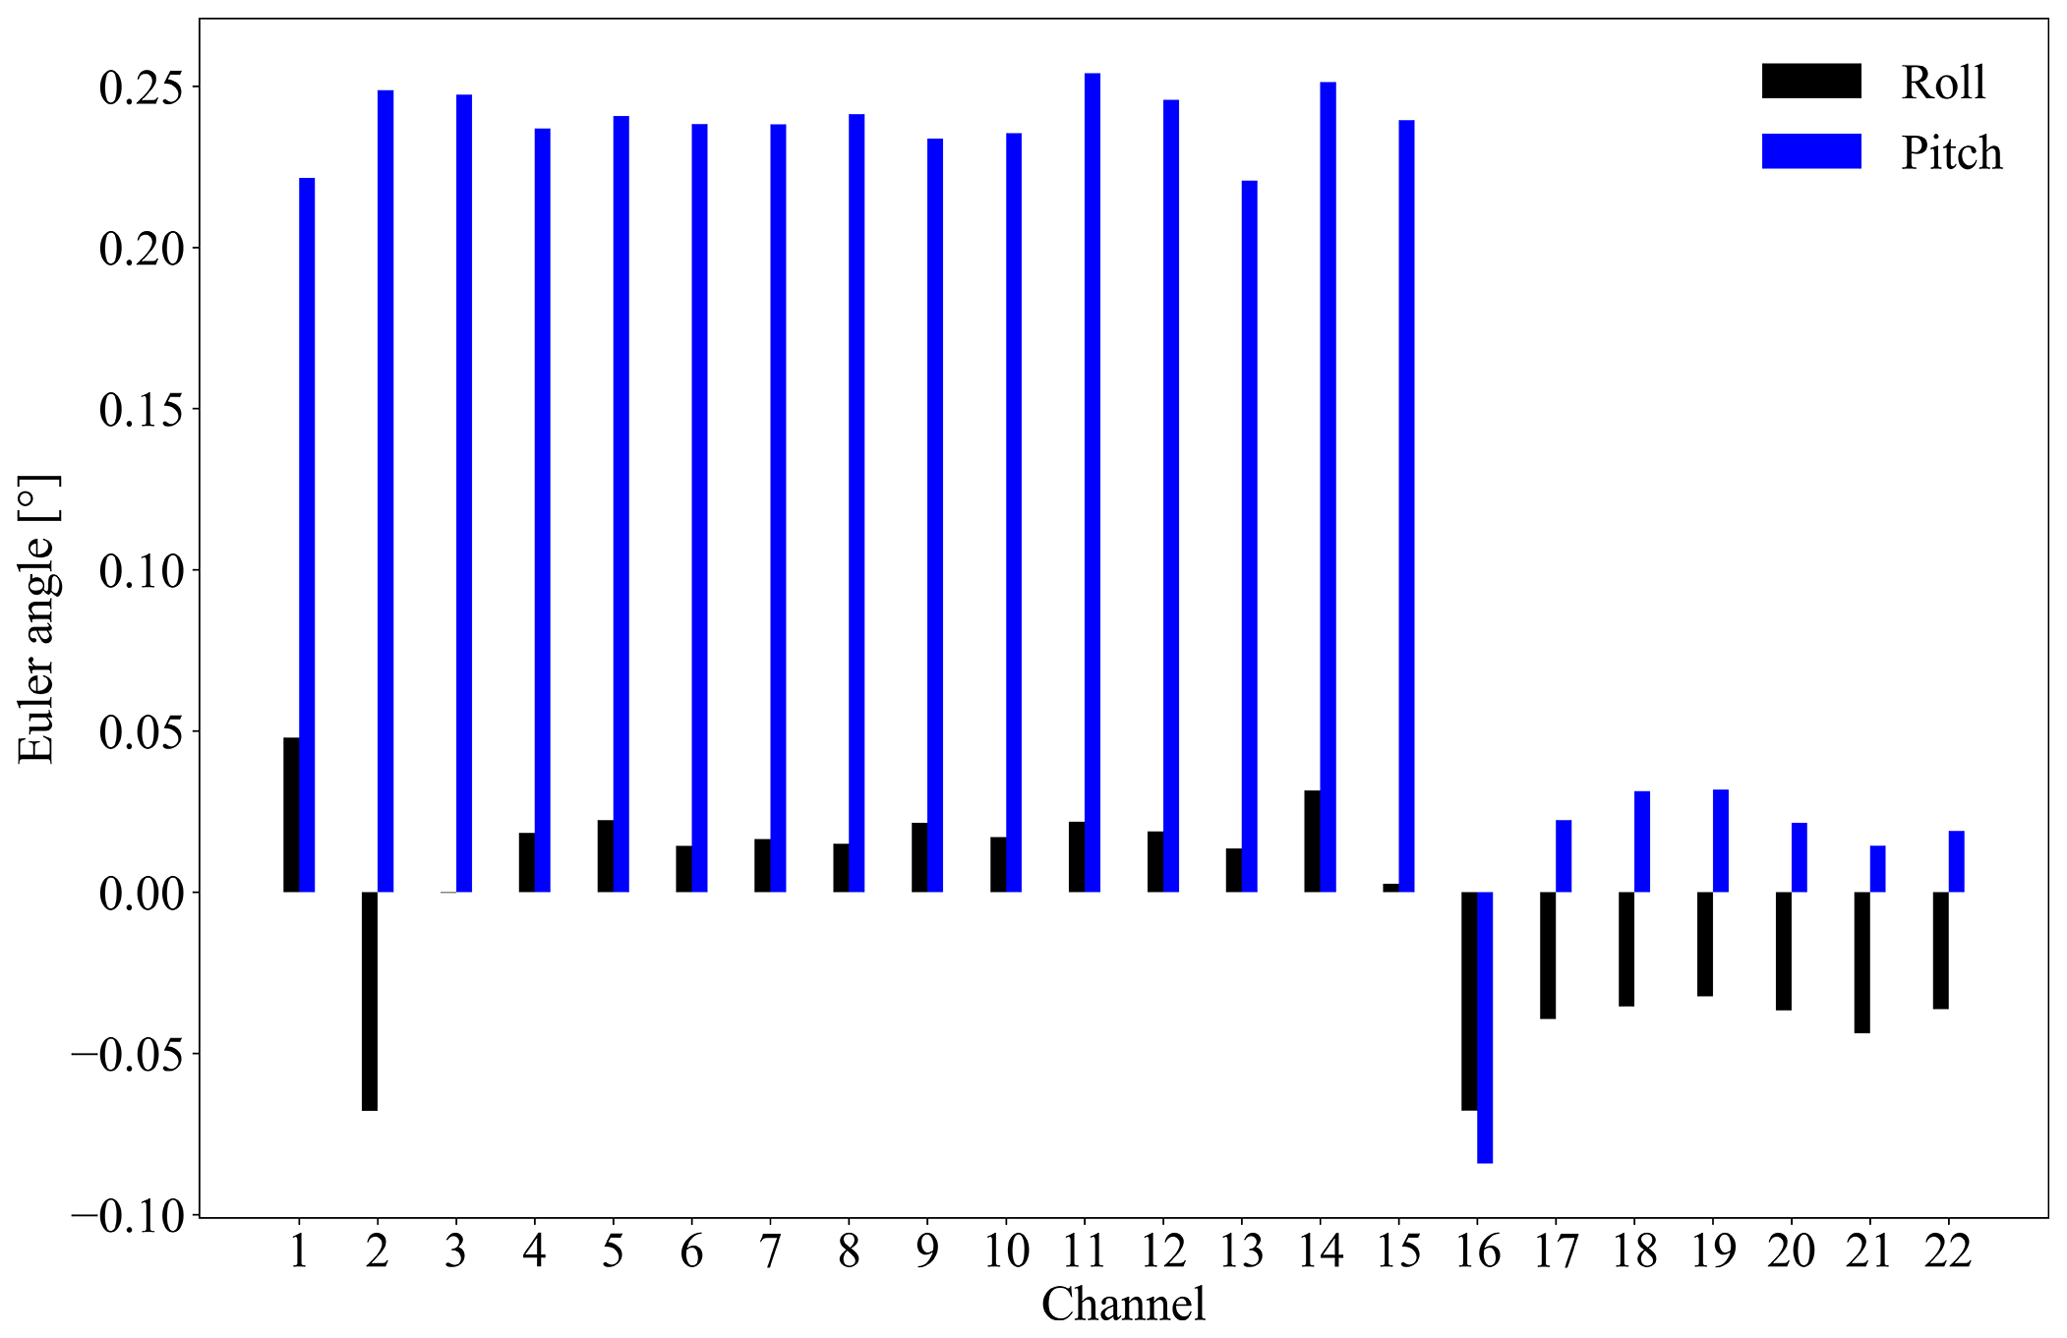
Figure 6Retrieved Euler angle roll (black bars) and pitch (blue bars) for ATMS channels 1–22.
The same correction process is applied to ZAntPattn. After the vectors of the x and z axes of the antenna pattern coordinate system in the antenna frame are corrected, the rotation matrix can be updated through Eqs. (7) and (8) and the lunar vector in the antenna pattern frame can be relocated through Eqs. (9)–(11). Since the observations are made at discrete points, the Moon may not pass the center of the antenna pattern during the pitch-over maneuver operation. To determine the position of the lunar vector in the antenna pattern frame where the Moon reaches the center of the antenna pattern, the observations are fitted by the two-dimensional Gaussian function:
where A is the amplitude, (σx,σy) are the Gaussian rms width along the x and y axis directions, and (x0,y0) is the position of the center of the Gaussian function. The cost function can be defined as follows:
The fitting can also help to reduce the observation noise, especially for channels 1 and 2, whose signal-to-noise ratios are lower than other channels. The fitting results are presented in Fig. 4b, d, and f.
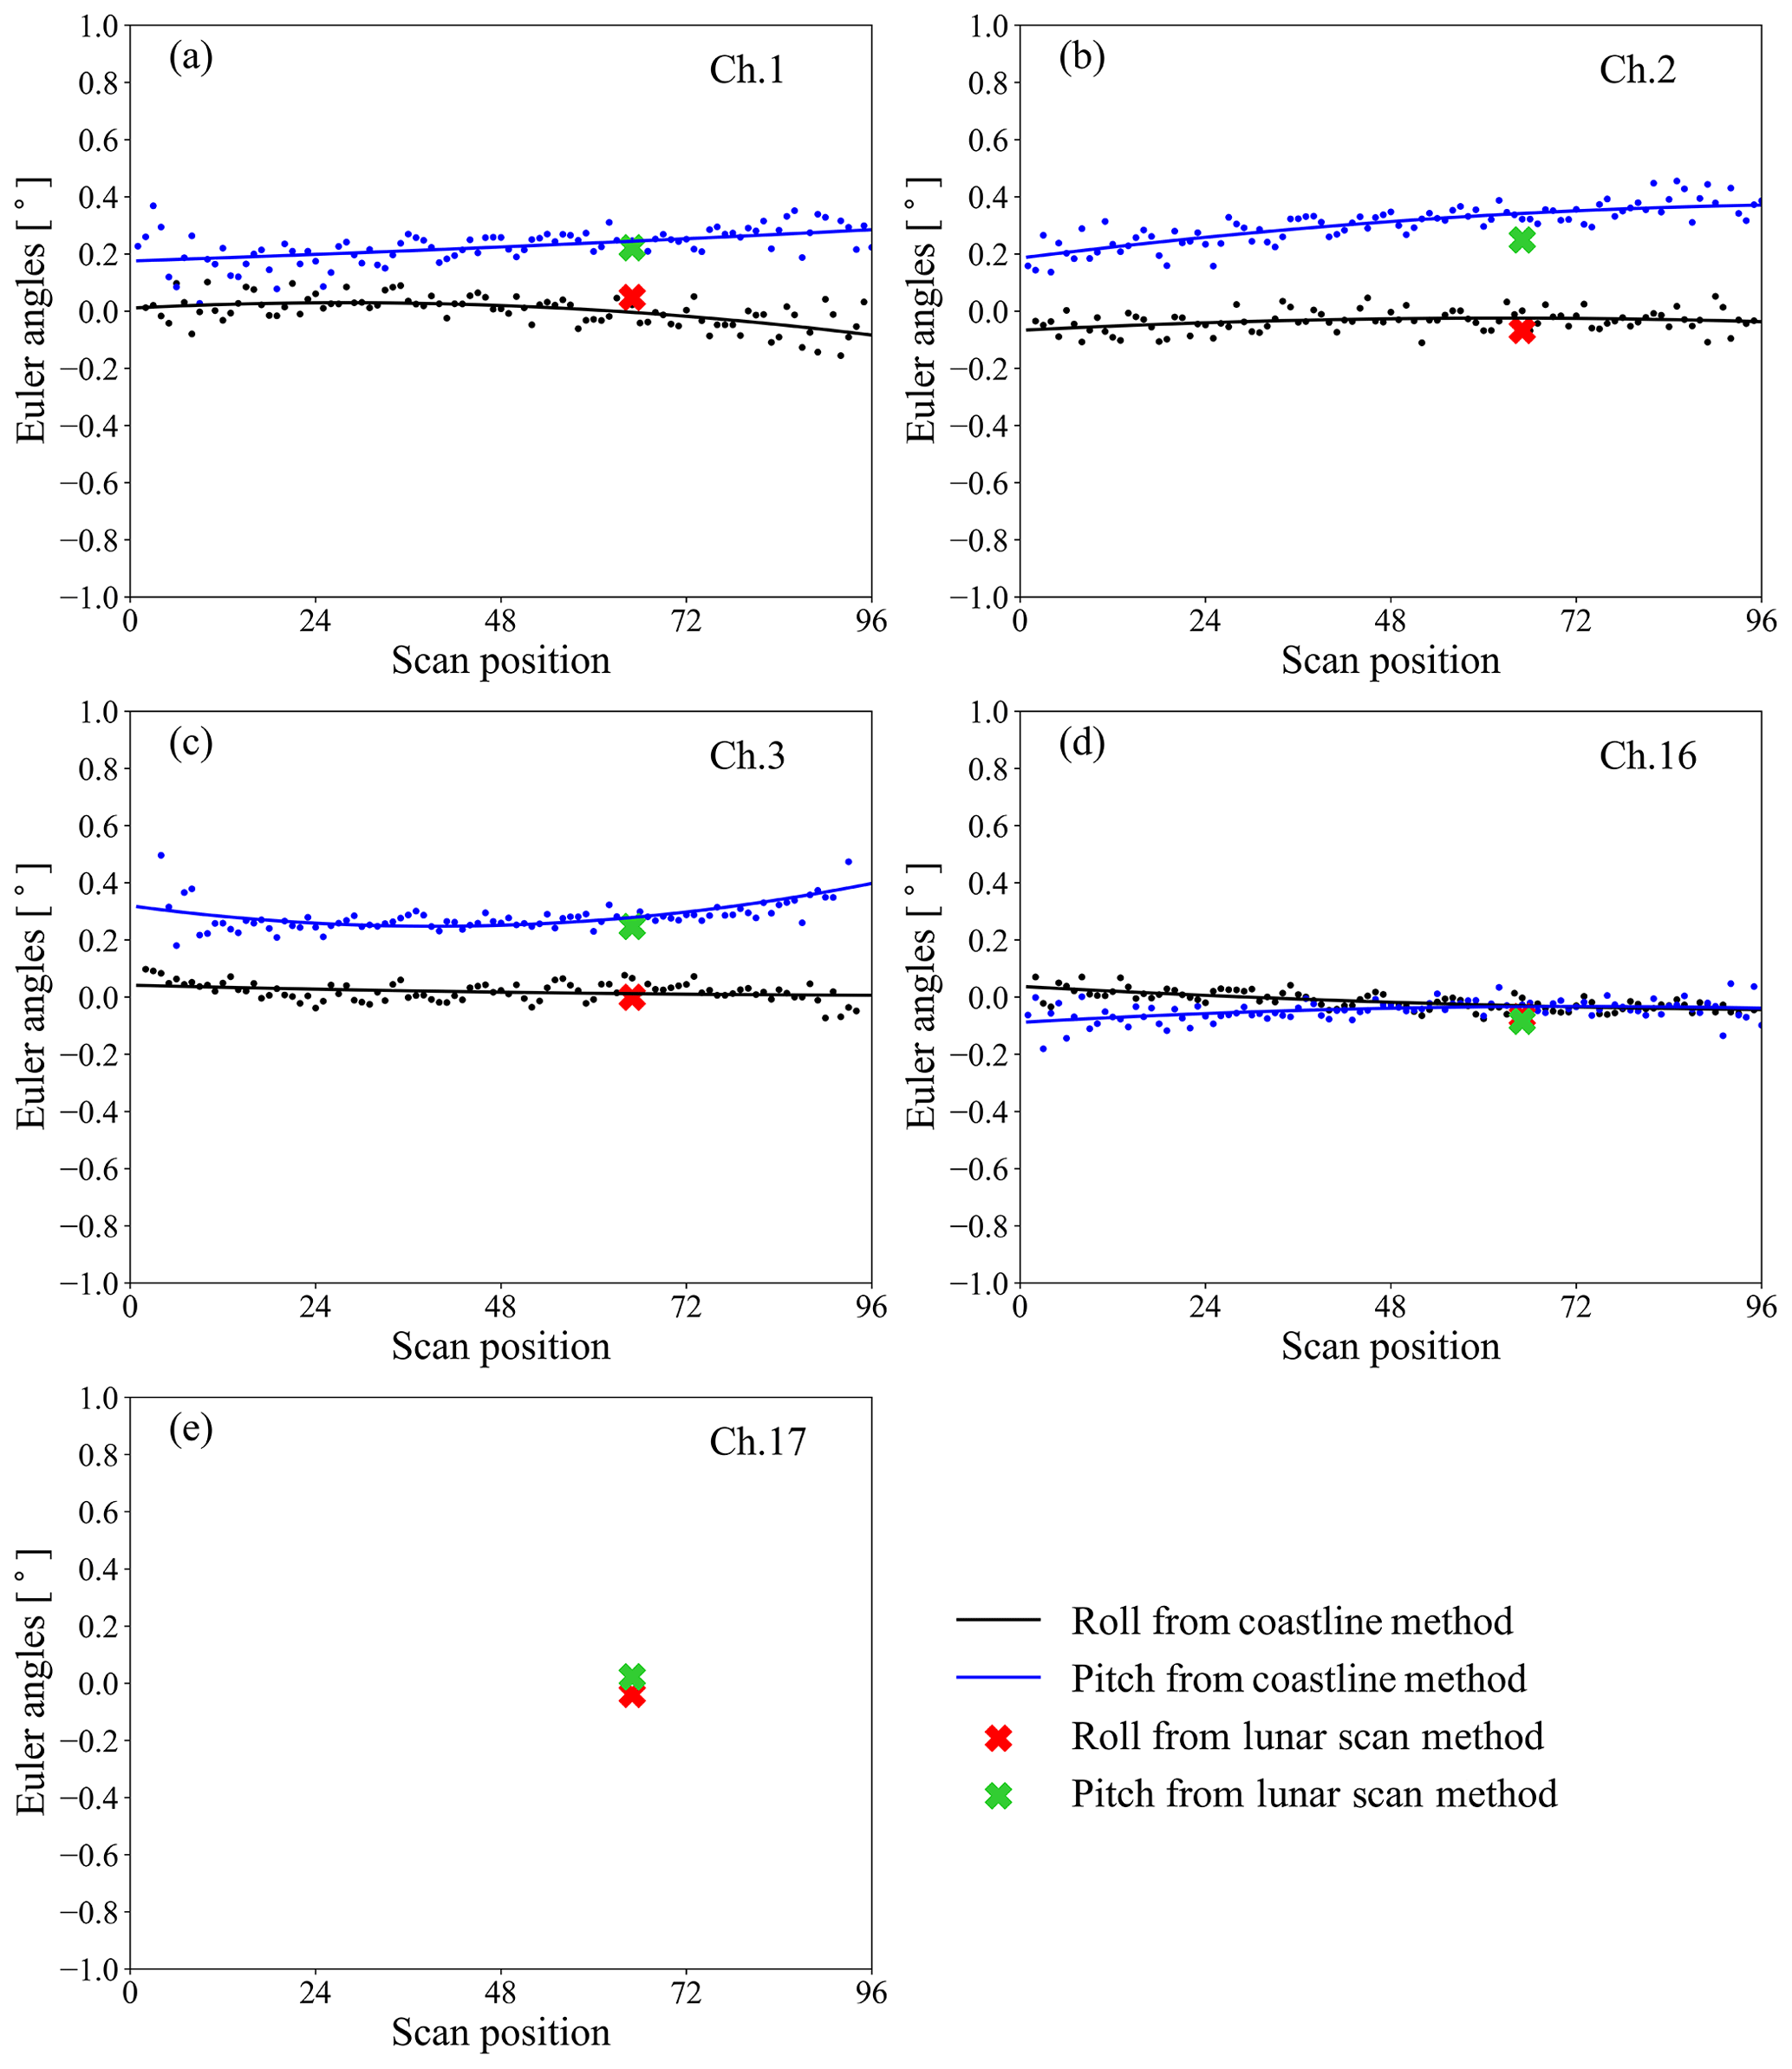
Figure 7Comparison between the Euler angles retrieved from the coastline inflection point method and those from the lunar scan method.
The steps of the evaluation algorithm are summarized as below. Given an initial value of Euler angles (ξr,ξp), the axes of the nominal antenna pattern frame (Eqs. 5–6) are corrected through Eqs. (12)–(13). Then the rotation matrix ROTAntPattn∕Ant defined in Eq. (8) is updated, through which the Moon in the antenna pattern frame is relocated by applying Eqs. (9)–(11). The observations projected in the antenna pattern frame are fitted by two-dimensional Gaussian function (Eq. 14), and the center of the function is used to calculate the cost function (Eq. 15). The Euler angles are adjusted and the above process is repeated until the cost function reaches its minima. The Euler angles that correspond to the minima of the cost function are the estimated boresight pointing error.
The evaluation algorithm developed in Sect. 3 is applied to ATMS lunar scan observations obtained during the NOAA-20 pitch-over maneuver operation. Figure 5 shows the variation in the cost function with the Euler angle roll and pitch being tuned from −1∘ to 1∘ with 0.01∘ intervals. For each channel, a unique minimum value of the cost function is found and the pair of roll and pitch angle at that point is taken to be the boresight pointing error for that channel.
The estimated boresight pointing error for the ATMS total 22 channels are presented in Fig. 6. It is noticeable that channels 1–15 have a large boresight pointing error in the pitch direction of up to 0.25∘, while the error in roll direction of these channels and the error in roll and pitch directions of other channels are below 0.08∘. The retrieved Euler angles of the channels in each band are quite stable, which coincides with the fact that the channels in each band share the same geolocation position. The Euler angle roll (pitch) averaged over the channels of each band is 0.05∘ (0.22∘) at K band, (0.25∘) at Ka band, 0.02∘ (0.24∘) at V band, () at W band, and (0.02∘) at G band.
To independently validate the boresight pointing error estimated from the lunar scan observations, the retrieved Euler angle roll and pitch at FOV 66 are compared with those retrieved from the coastline inflection point method (Zhou et al., 2019). The results are presented in Fig. 7. Note that in the coastline method the Euler angle roll and pitch at each FOV position is retrieved from the samples around that specific position. To reduce the uncertainty, the retrieved roll and pitch of each channel is then fitted by a quadratic polynomial function, and the Euler angle at each FOV on the fitting line is taken as the final solution, which is shown as the black and blue lines in Fig. 7. The Euler angle roll and pitch at FOV 66 derived from the lunar observations are plotted as the red and green crosses on the same panel. The numbers are also listed in Table 1.
The correlation between the Euler angles retrieved from these two independent methods is evident. Considering that the RMSE of the fitting in the coastline method is 0.05∘ on average, the difference between the two methods is close to the uncertainty of the coastline method except for the pitch of channel 2. The lunar scan algorithm can measure the on-orbit instrument boresight pointing error to subpixel accuracy. For the sounding channels where the coastline method is inapplicable, the lunar scan algorithm is still capable of delivering reasonable estimations of the geometric calibration errors. The retrieval error of the lunar scan method could be mainly caused by the instrument noise and the irregularities of the antenna pattern. With more lunar scan data accumulated in the future, the uncertainty of the method can be better estimated and reduced.
In this study, a unique two-dimensional lunar scan dataset from Advanced Technology Microwave Sounder (ATMS) onboard NOAA-20 was studied and an algorithm was developed for validating ATMS pointing accuracy based on this dataset. Beam pointing errors were derived in terms of Euler angle roll and pitch defined in the spacecraft coordinate system so that they can be directly compared with those retrieved by the coastline method proposed in our previous study. Existing research has shown that ATMS boresight pointing error has scan-angle-dependent feature due to the dominant role played by antenna beam misalignment in the total error budget. As the Moon's signal has the most significant impact on FOV 66 during the pitch-over maneuver, the boresight pointing error assessed by this lunar scan dataset is regarded as the error at that specific scan position. Retrieved results show that NOAA-20 ATMS beam misalignment in terms of Euler angle roll (pitch) at FOV 66 is estimated to be 0.05∘ (0.22∘) at K band, (0.25∘) at Ka band, 0.02∘ (0.24∘) at V band, () at W band, and (0.02∘) at G band. These results are validated by the coastline method, showing a good correlation. For the sounding channels where the coastline method is inapplicable, the lunar scan method is still capable of delivering reasonable estimations of the geometric calibration errors. The uncertainty of the lunar scan method could be mainly caused by the instrument noise and the irregularities of the antenna pattern. More lunar scan data are needed to better assess and reduce the retrieval uncertainty. As with the coastline inflection point method, the lunar scan method estimates the boresight pointing error caused by all the possible instrument interfaces, such as the antenna beam misalignment and the instrument mounting error. Further identifying the amount of bias that each internal interface of the instrument could cause is beyond the capability of the lunar scan algorithm.
The advantage of this method is that it can be used as a unique method for assessing the instrument beam pointing error during the postlaunch instrument early check-up phase. It can also serve as a supplement for the Earth-target-based technique to evaluate the geometric calibration accuracy of sounding channels. For window channels, it can provide a cross-check of the methods relying on ground reference.
For NOAA-20 operating in an afternoon orbit, the pitch maneuver brings the Moon into the ATMS scan plane at a specific scan angle, and thus only the beam pointing error at that specific FOV position can be derived through the algorithm developed in this study. If the roll-over maneuver is carefully designed and carried out at appropriate times, allowing the Moon to enter the scan plane at different scan angles, the pointing error at other FOVs can be evaluated as well.
The NOAA-20 ATMS data during pitch-over maneuver are available from NOAA CLASS: https://www.bou.class.noaa.gov/saa/products/welcome;jsessionid=D424F0127A4B97AD2AFF957AA2B15687 (NOAA CLASS, 2019). Some of the data are displayed on STAR ICVS: https://www.star.nesdis.noaa.gov/icvs/index.php (STAR ICVS, 2019). The lunar vector is calculated through the Naval Observatory Vector Astrometry Software (NOVAS) Package, which is an open-source library provided by https://aa.usno.navy.mil/software/novas/novas_info.php (NOVAS, 2019). The instrument beam vector and rotation matrices of ATMS geolocation process are output from Algorithm Development Library (ADL) software: https://jpss.ssec.wisc.edu/ (NOAA JPSS ADL, 2019).
HY started and guided this investigation. JZ developed the retrieval algorithm. HY and JZ prepared the manuscript.
The authors declare that they have no conflict of interest.
This study was supported by NOAA (grant nos. NA14NES4320003 and NA19NES4320002; Cooperative Institute for Satellite Earth System Studies-CISESS).
This paper was edited by S. Joseph Munchak and reviewed by two anonymous referees.
Baker, N.: Joint Polar Satellite System (JPPS) VIIRS Geolocation Algorithm Theoretical Basis Document (ATBD), document, Goddard Space Flight Center, Greenbelt, MD, USA, July, 2011. a
Bennartz, R.: On the use of SSM/I measurements in coastal regions, J. Atmos. Ocean. Tech., 16, 417–432, 1999. a
Bonsignori, R.: In-orbit verification of microwave humidity sounder spectral channels coregistration using the moon, Applied Remote Sensing, 12, 025013, https://doi.org/10.1117/1.JRS.12.025013, 2018. a, b
Burgdorf, M., Buehler, S. A., Lang, T., Michel, S., and Hans, I.: The Moon as a photometric calibration standard for microwave sensors, Atmos. Meas. Tech., 9, 3467–3475, https://doi.org/10.5194/amt-9-3467-2016, 2016. a
Currey, J. C.: Geolocation assessment algorithm for CALIPSO using coastline detection, Nat. Aeronaut. Space Admin. (NASA) Langley Res. Center, Hampton, VA, USA, Tech. Rep. NASA/TP-2002-211956, 1–27, 2002. a
Gregorich, D. T. and Aumann, H. H.: Verification of AIRS boresight accuracy using coastline detection, IEEE T. Geosci. Remote, 41, 298–302, 2003. a
Hoffman, L. H., Weaver, W. L., and Kibler, J. F: Calculation and accuracy of ERBE scanner measurement locations, NASA Langley Research Center, Hampton, VI, USA, Tech. Rep. NASA/TP-2670, 1–34, 1987. a
Joint Polar Satellite System (JPSS) Advanced Technology Microwave Sounder (ATMS): SDR Calibration Algorithm Theoretical Algorithm Theoretical Basis Document (ATBD), Center for Satellite Applications and Research, College Park, Maryland, 18 December, 2013. a
Joint Polar Satellite System (JPSS) Advanced Technology Microwave Sounder (ATMS): Calibration Data Book, document ATMS PFM P/N 1362460-1 S/N 302, Northrop Grumman, Azusa, CA, USA, March, 2007. a
Kaplan, G., Bartlett, J., Monet, A., Bangert, J., and Puatua, W.: User’s Guide to NOVAS Version F3.1, Navval Observatory Vector Astrometry, Fortran Edition, U.S. Naval Observatory, March, 2011. a
Khlopenkov, K. V., Trishchenko, A. P., and Luo, Y.: Achieving subpixel georeferencing accuracy in the Canadian AVHRR processing system, IEEE Geosci. Remote S., 48, 2150–2161, 2010. a
NOAA Comprehensive Large Array-data Stewardship System (CLASS): NOAA-20 ATMS data, available at: https://www.bou.class.noaa.gov/saa/products/welcome, last access: 4 September 2019. a
NOAA Joint Polar Satellite System (JPSS) Algorithm Development Library software (ADL): The instrument beam vector and rotation matrices of ATMS geolocation process, available at: https://jpss.ssec.wisc.edu/, last access: 4 September 2019. a
Naval Observatory Vector Astrometry Software (NOVAS) Package: The Lunar vector, available at: https://aa.usno.navy.mil/software/novas/novas_info.php, last access: 4 September 2019. a
Moradi,I., Meng, H., Ferraro, R. R., and Bilanow S.: Correcting geolocation errors for microwave instruments aboard NOAA satellites, IEEE T. Geosci. Remote, 51, 3625–3637, 2013. a
STAR Integrated Calibration/Validation System Long-term Monitoring (ICVS): NOAA-20 ATMS data, available at: https://www.star.nesdis.noaa.gov/icvs/index.php, last access: 4 September 2019. a
Smith, G. L., Priestley, K. J., Hess, P. C., Currey C., and Spence, P.: Validation of geolocation of measurements of the Clouds and the Earth’s Radiant Energy System (CERES) scanning radiometers aboard three spacecraft, J. Atmos. Ocean. Tech., 26, 2379–2391, 2009. a
Wang L., Tremblay, D. A., Han, Y., Esplin M., Hagan, D. E., Predina, J., Suwinski, L., Jin, X., and Chen, Y.: Geolocation assessment for CrIS sensor data records, J. Geophys. Res.-Atmos., 118, 12690–12704, 2013. a
Wang, L., Zhang, B., Tremblay, D., and Han, Y.: Improved scheme for Cross-track Infrared Sounder geolocation assessment and optimization, J. Geophys. Res.-Atmos., 122, 519–536, https://doi.org/10.1002/2016JD025812, 2017. a
Wolfe, R. E., Nishihama, M., Fleig, A. J., Kuyper, J. A., Roy, D. P., Storey, J. C., and Patt, F. S.: Achieving sub-pixel geolocation accuracy in support of MODIS land science, Remote Sens. Environ., 83, 31–49, 2002. a
Wolfe, R. E., Lin, G., Nishihama, M., Tewari, K. P., Tilton, J. C., and Isaacman, A. R.: Suomi NPP VIIRS prelaunch and on-orbit geometric calibration and characterization, J. Geophys. Res.-Atmos., 118, 11508–11521, 2013. a
Yang, H. and Weng, F.: Corrections for on-orbit ATMS lunar contamination, IEEE T. Geosci. Remote, 54, 1918–1924, 2016. a
Yang, H., Weng, F., and Anderson, K.: Estimation of ATMS antenna emission from cold space observations, IEEE T. Geosci. Remote, 54, 4479–4487, 2016. a, b
Yang, H., Zhou, J., Weng, F., Sun, N., Andeson, K., Liu, Q., and Kim, E.: Developing Vicarious Calibration for Microwave Sounding Instruments Using Lunar Radiation, IEEE T. Geosci. Remote, 56, 6723–6733, 2018. a, b
Zhou, J., Yang, H., and Weng, F.: Validate and improve ATMS geolocation accuracy by using lunar observations, IEEE IGARSS 2017, Fort Worth, Texas, USA, 2017. a
Zhou, J., Yang, H., and Anderson, K.: SNPP ATMS On-Orbit Geolocation Error Evaluation and Correction Algorithm, IEEE T. Geosci. Remote, 99, 1–11, 2019. a, b, c, d, e