the Creative Commons Attribution 4.0 License.
the Creative Commons Attribution 4.0 License.
 | 24 Sep 2019
A Tale of Two Dust Storms: analysis of a complex dust event in the Middle East
Steven D. Miller
Louie D. Grasso
Qijing Bian
Sonia M. Kreidenweis
Jack F. Dostalek
Jeremy E. Solbrig
Jennifer Bukowski
Susan C. van den Heever
Yi Wang
Xiaoguang Xu
Annette L. Walker
Ting-Chi Wu
Milija Zupanski
Christine Chiu
Jeffrey S. Reid
Lofted mineral dust over data-sparse regions presents considerable challenges to satellite-based remote sensing methods and numerical weather prediction alike. The southwest Asia domain is replete with such examples, with its diverse array of dust sources, dust mineralogy, and meteorologically driven lofting mechanisms on multiple spatial and temporal scales. A microcosm of these challenges occurred over 3–4 August 2016 when two dust plumes, one lofted within an inland dry air mass and another embedded within a moist air mass, met over the southern Arabian Peninsula. Whereas conventional infrared-based techniques readily detected the dry air mass dust plume, they experienced marked difficulties in detecting the moist air mass dust plume, becoming apparent when visible reflectance revealed the plume crossing over an adjacent dark water background. In combining information from numerical modeling, multi-satellite and multi-sensor observations of lofted dust and moisture profiles, and idealized radiative transfer simulations, we develop a better understanding of the environmental controls of this event, characterizing the sensitivity of infrared-based dust detection to column water vapor, dust vertical extent, and dust optical properties. Differences in assumptions of dust complex refractive index translate to variations in the sign and magnitude of the split-window brightness temperature difference commonly used for detecting mineral dust. A multi-sensor technique for mitigating the radiative masking effects of water vapor via modulation of the split-window dust-detection threshold, predicated on idealized simulations tied to these driving factors, is proposed and demonstrated. The new technique, indexed to an independent description of the surface-to-500 hPa atmospheric column moisture, reveals parts of the missing dust plume embedded in the moist air mass, with the best performance realized over land surfaces.
- Article
(19176 KB) -
Supplement
(59315 KB) - BibTeX
- EndNote


The monitoring of mineral dust life cycle is a high priority for the global aerosol community in terms of basic research, climate, and operational purposes (Benedetti et al., 2018). To the latter, mineral dust poses unique and significant challenges in terms of its effects on visibility, electronics performance, and electro-optical signal propagation. The coastal (littoral) zones represent a unique challenge for analyzing and predicting the evolution of aerosol distributions and properties. The land–sea interface (surface and air mass discontinuities) gives rise to highly dynamic and diurnally varying flow patterns which redistribute dust horizontally and vertically, and through changes in humidity modulate its optical properties on fine-spatial and temporal scales (van den Heever et al., 2006; Reid et al., 2008; Igel et al., 2018). Coastal topography further complicates redistribution patterns and can also serve as focal points for convection and associated convective downdrafts, which redistribute and loft new dust in arid environments (e.g., Grant and van den Heever, 2014; Seigel and van den Heever, 2012; Miller et al., 2008).
Such fine-scale features and interactions are inherently difficult to predict in numerical models and require accurate observations and coupled data assimilation techniques to produce and evaluate a representative analysis (Frolov et al., 2016; Penny and Hamill, 2017; Zupanski, 2017). Given the sparsity of applicable surface-based observations, particularly over maritime regions, detection and characterization of aerosol properties for short-term forecasting applications in coastal zones worldwide are problems best suited to satellite-based remote sensing. Passive radiometer-based methods, the most readily available form of satellite data, face their own array of challenges in coastal zones. Shallow water and high-turbidity conditions produce bright backgrounds, which can obscure signal and cause biases in visible-based remote sensing retrievals. Furthermore, the land–sea interface produces strong horizontal gradients in column moisture between continental and maritime air masses confuse thermal infrared-based satellite techniques for dust detection.
Dust products suitable for data assimilation into numerical forecast models are in high demand (e.g., Benedetti et al., 2018, and references therein). While there are numerous dust detection algorithms available, historically they have been qualitative in nature and often used for plume detection work. In order for a product to be assimilated, careful error characterization is required. This characterization requires numerous analyses to understand the sensitivity of the retrieval to the overall environment. Here, we consider a case where infrared-based detection performance varied significantly for ostensibly similar mineral dust plumes adjacent to one another in the southern Arabian Peninsula – one well detected and the other missed entirely. Through a combination of remote sensing and modeling, we examine the impacts of the background environment on detection and characterization of lofted dust in the Middle East. The epilogue of this “tale of two dust storms” speaks to where, when, and to what extent conventional infrared-based detection techniques are useful in various environments, and to the important consideration of the inherent uncertainties arising from natural variance in mineral dust characteristics.
This study is conducted as part of a Multidisciplinary University Research Initiative (MURI) conducted under the auspices of the Office of Naval Research (ONR) – the Holistic Analysis of Aerosols in Littoral Environments (HAALE-MURI). The HAALE-MURI diverse team of expertise in numerical modeling, atmospheric aerosol physics, satellite-based passive and active remote sensing, and data assimilation, assembled to improve our fundamental understanding of the principal driving factors that govern aerosol distribution, optical properties, and microphysical properties in coastal regions. The research includes development of new techniques for remote sensing and coupled data assimilation toward improved analysis and forecasting of parameters relevant to electro-optical propagation. It takes a holistic approach to this challenge of understanding processes in a connected system as opposed to stand-alone analyses that may not fully account for parameter coupling. The wide array of expertise brought to bear on this topic aims to build upon the community's knowledge base and analysis tools for littoral-zone aerosol distribution, properties, and processes.
The paper is structured as follows. Section 2 takes inventory of existing satellite-based dust detection algorithms commonly used for global aerosol mapping. Section 3 details, from modeled and observed perspectives, a case study showing a widely varied performance of the traditional “split-window” infrared-based dust detection technique. The sensitivity of the split-window dust signal to water vapor and dust optical and geometric properties via idealized radiative transfer model (RTM) simulations is examined in Sect. 4. Section 5 presents a new approach to the split-window technique based on modulation of detection thresholds as a function of column water vapor information. The paper concludes in Sect. 6 with a summary of the findings together with implications and recommendations for global satellite-based dust detection algorithms.
2.1 Basic principles
The scientific literature is replete with satellite-based methodologies for lofted dust detection and characterization. Ultraviolet techniques (e.g., Herman et al., 1997; Torres et al., 1998, 2007) take advantage of differences (spectral- and angular-dependent) in backscattered radiances for absorbing and scattering aerosol species with respect to a molecular atmosphere. Moving into the visible light and near-infrared wavelengths, algorithms take advantage of the preferential absorption of blue light to enhance contrast over bright surfaces and vis-à-vis meteorological clouds (e.g., Miller et al., 2003; Hsu et al., 2004, 2013; Qu et al., 2006). Combinations of visible, shortwave-infrared, and thermal infrared are used to attain contrast between dust over water and over land, respectively (e.g., Shenk and Curran, 1974; Ackerman, 1989; Tanré and Legrand, 1991; Legrand et al., 2001; Hansell et al., 2007; Cho et al., 2013). Recent advancements have enabled the use of O2 A and B absorption bands and their nearby continuum channels to derive dust and smoke layer height over dark ocean and vegetated land surfaces (Xu et al., 2017, 2019).
2.2 The infrared split window
The most commonly implemented techniques for satellite-based dust detection involve the reststrahlen band of silica (or quartz), a common and often significant constituent of mineral dusts found worldwide (Di Biagio et al., 2017) caused by the Si–O vibrational bending mode in the 8–10 µm range (Peterson and Weinman, 1969; Salisbury et al., 1987; Wald et al., 1998). This optical feature for mineral dusts results in elevated values of the real (scattering) and imaginary (absorption) parts of the complex index of refraction for silicates, producing commensurately higher values of extinction than surrounding wavelengths.
Passive radiometer narrowband channels positioned in the 8–12 µm atmospheric window (a spectral region where the gaseous atmosphere is largely transparent), used for imaging and describing the properties of meteorological clouds and the surface, can take advantage of the silica spectral fingerprint for dust detection. When used in tandem, the ∼10 and ∼12 µm narrowband spectral channels are often referred to as the split window, so called because although this part of the infrared spectrum is an atmospheric window, water vapor absorption is not entirely negligible; namely it is slightly stronger at ∼12 µm than at ∼10 µm. As such, this atmospheric spectral window is “split” between channels residing in relatively clean and more absorbing portions of it. Hereafter, we will refer to the brightness temperature difference (BTD) between these two wavelengths, i.e., T(10 µm)–T(12 µm) as the split-window BTD, or SWBTD.
Sensitivity of the SWBTD to atmospheric water vapor is well established, and it has long been incorporated as corrections to retrievals of sea surface temperatures (e.g., McMillin, 1975), land surface temperature (e.g., Wan and Dozier, 1996), and characterization of the lower atmosphere moisture itself (Lindsey et al., 2014). The enhanced absorption of water vapor at 12 µm produces a slightly positive SWBTD for conditions of a warm surface (skin) temperature and adiabatic lapse rate – a signal that is of opposite sign to that produced by mineral dust. Thus, the negative SWBTD signal produced by lofted dust may be counterbalanced by the positive SWBTD produced by water vapor in certain situations, especially when the dust is embedded within or residing below the “masking” moist layer. The masking effect of water vapor on the negative SWBTD dust signal establishes a working hypothesis for the missing dust plume of our southern Arabian Peninsula case study.
Moving away from the reststrahlen band, the strength of dust extinction decreases gradually from 10 to 12 µm with some variability in magnitude related to composition and shape (Hansell Jr. et al., 2011). This tendency typically results in a negative SWBTD that can become significant (e.g., values between 0 and −6 K) when the underlying surface is warmer than the lofted dust layer. Assuming other factors (e.g., dust layer height) are equal, the dust signal is most pronounced during the daytime over deserts, when the skin temperature is much higher than the air temperature and the lapse rate of the lower atmosphere is close to dry adiabatic. The optical properties of meteorological clouds differ from those of mineral dust, making the SWBTD test useful for isolating lofted dust layers in a cloudy scene. Optically thin cirrus clouds typically exhibit a relatively large positive SWBTD – opposite to the dust signal (e.g., Strabala et al., 1994). Optically thick clouds tend to show near-zero to slightly positive values of the SWBTD. However, intervening clouds (above the dust layer) will obscure and mask out the SWBTD dust signal, limiting the applicability of this passive detection satellite technique to cases of cloud-free line of sight from the satellite to the dust layer.
2.3 Satellite techniques enlisting the split window
The European Organisation for the Exploitation of Meteorological Satellites (EUMETSAT; https://www.eumetsat.int/website/home/Data/Products/Atmosphere/index.html, last access: 9 September 2019) demonstrates a red–green–blue (RGB) dust enhancement technique (EUMETSAT Dust RGB; e.g., Lensky and Rosenfeld, 2008) that takes advantage of the SWBTD dust signature. The appeal of the infrared-based techniques is their 24 h utility, although the strong dependencies on the atmospheric profile and the diurnal pattern of surface temperature can make for varying performance and ambiguity. Over deserts, the surface possesses a similar mineralogy and radiometric behavior to the locally lofted dust, producing SWBTD false alarms. Over ocean surfaces, where the temperature of the water may be close to or cooler than the lofted dust layer, the SWBTD dust signal is inherently weaker and does not become significant unless the dust layer itself is optically thick. These challenges are readily apparent in the EUMETSAT RGBs but are overcome in part by the application of these algorithms to geostationary data, in which case motion helps analysts to differentiate between actual dust and false alarms locked to the surface structures.
Work-arounds to the surface signal ambiguity problem have been attempted (e.g., Legrand et al., 2001; Tramutoli, 2005, 2007). Miller et al. (2017) employ a front-end cloud mask with a priori information on the clear-sky background surface emissivity to identify and suppress the undesired enhancement of land surfaces, via a Dynamic Enhancement Background Reduction Algorithm (DEBRA). However, DEBRA's ability to detect lofted dust through improved signal to noise nevertheless faces the same physical limitations as the EUMETSAT Dust RGB product, as it enlists the same spectral bands (and leverages the same physics) to identify dust layers.
In both SWBTD-based dust detection techniques, we hypothesized that the effects of water vapor absorption in the lower atmosphere would significantly impact performance. Although dust characteristically is associated with arid environments and inherently lower column water vapor, cases do arise when dust is lofted within or transported into anomalously moist (with respect to regional climatology) air mass environments. The effects of SWBTD dust signal suppression by water vapor in terms of moisture amount, dust amount, temperature profile, and positioning of the dust layer within the moist profile have not been examined systematically in the literature. We begin to explore some of these questions here.
A highly useful case allowing us to explore the impacts of water vapor on SWBTD occurred during early August 2016, when two dust storms met in east–west alignment over the southern Arabian Peninsula of southwest Asia. The western dust storm originated on the morning of 3 August over the Saudi Arabian interior, near its northeastern borders with Iraq and Kuwait, and moved south–southeast. The eastern storm formed later that day and evening along the southeastern portion of the Arabian Peninsula and moved northward. On the morning of 4 August and over the next 2 d, these two large dust plumes juxtaposed but did not mix – remaining bound to the air masses that carried them.
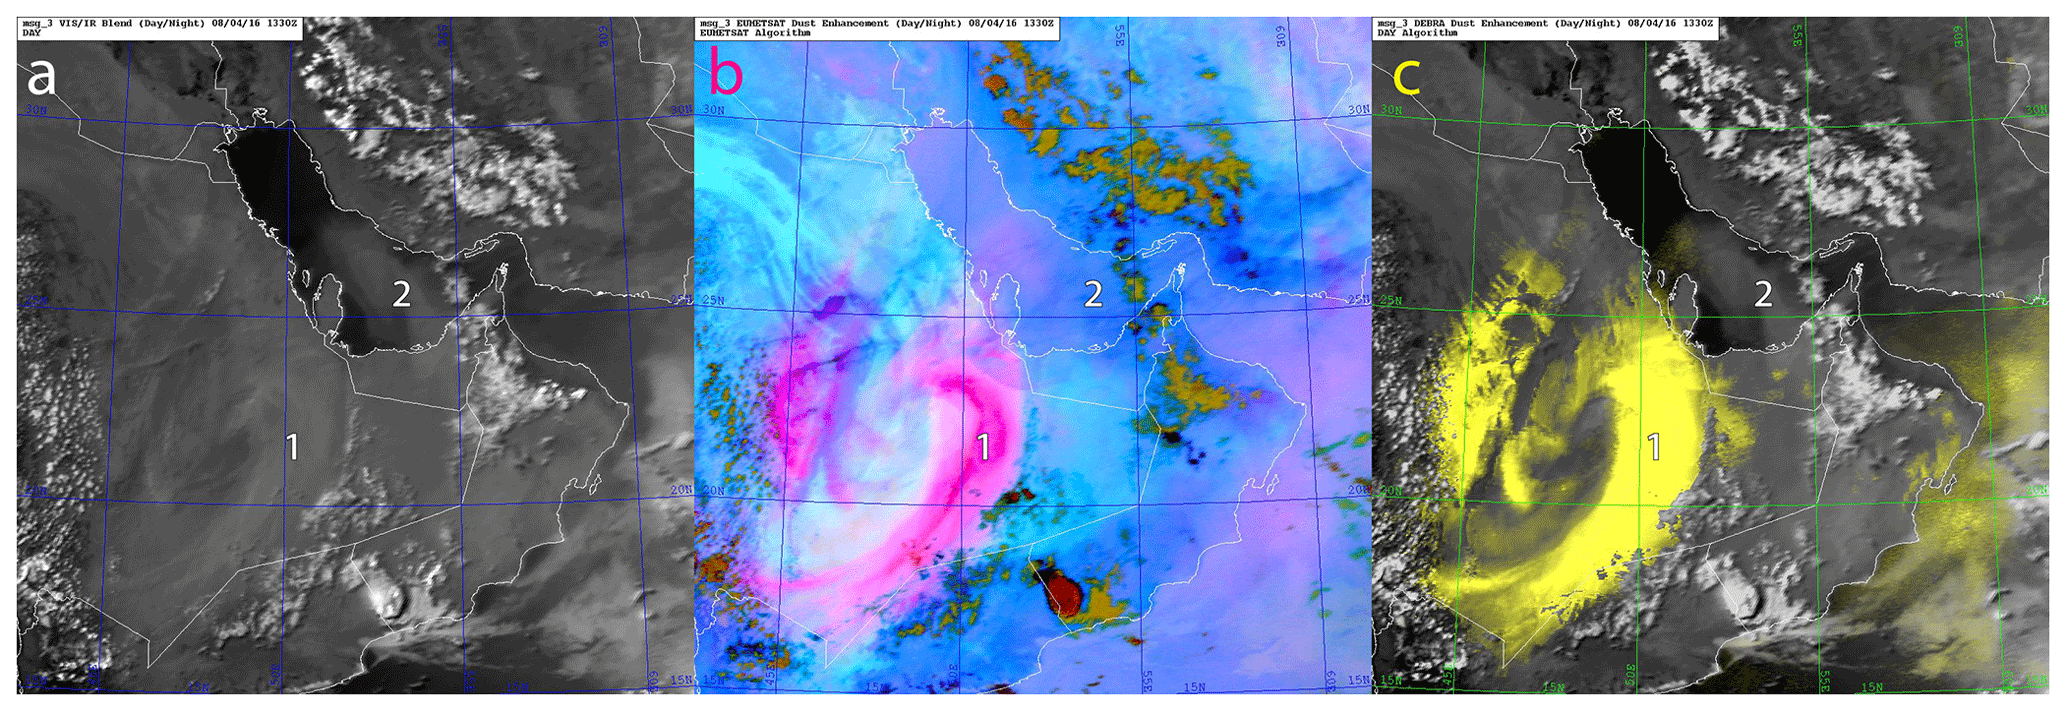
Figure 1Meteosat Second Generation-8 satellite imagery on 4 August 2016 at 13:00 for (a) visible reflectance, and infrared-based significant dust enhancements from (b) EUMETSAT (dust is represented by the color magenta), and (c) DEBRA (dust is represented by the color yellow) algorithms. The label “1” on each panel denotes the well-detected overland dust plume, while the label “2” denotes the overwater portion of a significant dust plume that was missed by the infrared-based dust detection methods. Here, the missing dust plume is only evident in visible imagery (a) due to its high contrast against the relatively dark ocean background.
Figure 1, showing Meteosat Second Generation-8 (MSG-8) imagery collected on 4 August at 13:00 UTC (about 16:00 local time in Qatar; located in the center of these frames), illustrates our motivation for studying these two disparate dust storms. Panel a shows conventional visible reflectance imagery, while panels b and c show algorithmic enhancements of dust via the EUMETSAT Dust RGB product and the DEBRA technique of Miller et al. (2017), respectively. Noteworthy is the markedly different performance of the SWBTD-based dust enhancements for the two dust plumes, labeled “1” and “2” in Fig. 1. Both methods readily capture the northern-originating inland (western) dust plume but completely miss the southern-originating (eastern) plume entering the southern Persian Gulf (also known as the Arabian Gulf, and hereafter referred to as the southern Gulf, SG).
Associated with these two storms were marked differences in air mass properties – the western storm was embedded within a dry continental air mass (low column-integrated moisture as measured by total precipitable water, TPW) and the eastern storm within a moist maritime air mass originating from the northern Arabian Sea. It is hypothesized that the dry and moist air masses associated with these dust storms played a governing role in the varied performance of SWBTD-based satellite dust detection algorithms. To better understand this possible linkage, we begin by considering the meteorological conditions, surface and satellite observations, and numerical model analysis associated with this case.
3.1 Meteorological lead-up: synoptic-scale and mesoscale forcing
The following is a synopsis of the case study based on analysis of numerical modeling and surface station observations. The Navy Global Environmental Model (NAVGEM; Hogan et al., 2014) and the Weather Research and Forecasting model coupled with Chemistry (WRF–Chem; Grell et al., 2005) model were used to interpret aspects of the synoptic-scale and mesoscale conditions for this case. WRF–Chem was coupled to a Naval Research Laboratory (NRL) dust source database for southwest Asia (Walker et al., 2009) to examine dust lofting and transport. Figure 2 shows a NAVGEM analysis of the 500 hPa geopotential height field and the relative vorticity during the initial stages of the event. Figure 3 shows WRF–Chem simulations for the column integrated dust mass for selected times across the 3–4 August period leading up to the satellite imagery shown in Fig. 1. Both dust plumes seen in satellite imagery were captured by this coupled model system. This case study was also simulated using the Regional Atmospheric Modeling System (RAMS; Cotton et al., 2003; Saleeby and van den Heever, 2013), and differences in the amounts of dust lofted between the WRF and RAMS simulations are detailed by Saleeby et al. (2019).

Figure 2NAVGEM 500 hPa geopotential height and relative vorticity analysis for 00:00 Z, 3 August 2016.
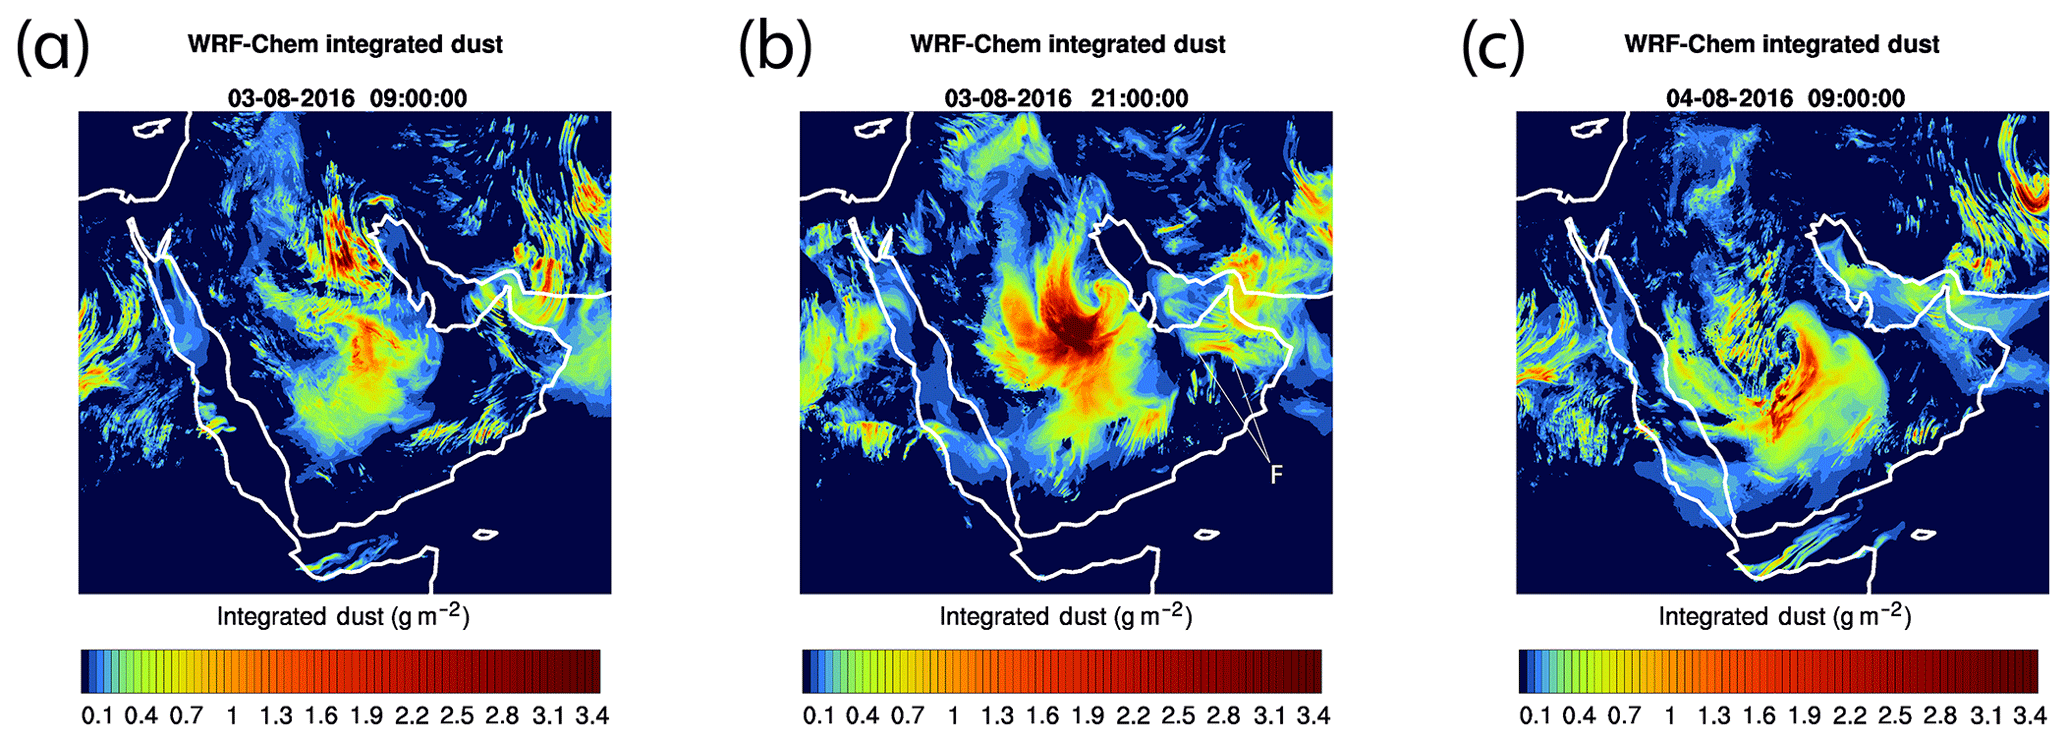
Figure 3WRF–Chem-simulated vertically integrated dust (g m−2) on the following: (a) 3 August 2016, 09:00 UTC, (b) 21:00 UTC, and (c) 4 August at 09:00 UTC leading up to the 4 August observations of missing dust shown in Fig. 1. The feature “F” in panel (b) denotes pooling of dust along a southerly surge of air near the surface, responding to the low-pressure system in the SG.
For 3 August 2016 at 00:00 Z, NAVGEM analysis (Fig. 2) showed a broad 588 dm geopotential height upper-level ridge over northeast Africa and the Arabian Peninsula. At this time, a southward-moving shortwave over southern Iraq started to traverse around this high-pressure ridge and descend into the central Saudi Peninsula. Between 05:00 and 06:00 Z on 3 August, this shortwave intensified the winds from 700 hPa down to the surface, mobilizing dust from southern Iraq across the Ad Dahna desert to the Rub' al Khālī over the eastern edge of the Saudi plateau. This dust was transported within a very dry air mass (TPW < 20 mm; discussed in Sect. 3.4). As the shortwave continued to move around the ridge and southwestward on 4 August, this lofted dust was readily observable over the Saudi plateau in various dust-enhanced satellite imagery products.
Between 12:00 and 18:00 Z on 3 August, both model and surface observations showed a mesoscale low-pressure system forming over the SG east of Qatar. The alignment of the Al Hajar mountains in northern Oman and the Zagros Mountains in southwestern Iran aided in the blocking and redirection of the surface winds, reinforcing the cyclonic flow around the surface low in the SG. Strong southerly winds formed in response to this surface low, mobilizing dust from 3 August 18:00 to 4 August 09:00 Z over an area extending from Oman to the coast of the United Arab Emirates (UAE).
During this period, surface stations from the Oman coast to the UAE coast reported southerly winds at 2.5–10.5 m s−1 (5–20 kn) and were accompanied by observations of dust in suspension, dust raised by winds at the time of observation, dust devils, and slight-to-moderate dust storms. Evidence of dust lofting and pooling along a surface front formed by this southerly surge, as captured by WRF–Chem coupled to the NRL dust source database, is noted in Fig. 3b (animation provided as S1 in the Supplement). Convection initiated in this region may have produced haboobs (Miller et al., 2008) that contributed as a secondary source to the model's total dust loading. The correct placement and timing of such convection is a major challenge for numerical modeling and thus poses a source of uncertainty in regional dust forecasting. Dust from these various sources comprised the eastern plume, which was transported into the SG on 4 August (Fig. 1).
Surface observations collected across the southeastern portion of the Arabian Peninsula between 09:00 and 12:00 Z on 4 August show that the surface winds weakened across the region over this period, although dust storms and blowing dust conditions prevailed. By 18:00 Z, nearly all stations across the region reported dust in suspension, with only one station still reporting an active (i.e., blowing) dust storm. Although the surface dust lofting event had ended by this time, satellite imagery showed copious dust aloft, being transported northward. This dust remained in suspension over the region for the following 2 d before being dispersed by the synoptic-scale flow or settling out.
3.2 Satellite observations: passive sensors
Figure 4 shows true color, SWBTD, and DEBRA dust-enhanced imagery for a zoomed-in portion of Fig. 1 as observed by the Visible Infrared Imaging Radiometer Suite (VIIRS) instrument on the Suomi National Polar-orbiting Partnership (Suomi NPP) satellite. In Fig. 4a, the tan coloration of the plume in the SG (as noted by label “2” in the panels of Fig. 1) is characteristic of lofted dust. Although not as obvious over the bright desert interior due to poor brightness contrast, low color contrast, and relatively low surface variability, the true color imagery shows this plume originates from inland portions of eastern UAE, flanking the Al Hajar mountain range in northern Oman. The preferential absorption of blue-wavelength light by iron-bearing minerals, responsible for the perceived tan coloration, was also keyed on by visible-based dark-target dust enhancements from the National Aeronautics and Space Administration (NASA) Aqua satellite's Moderate Resolution Imaging Spectroradiometer (MODIS) (e.g., Miller, 2003; not shown), confirming the composition of the plume as silicate dust as opposed to meteorological clouds, biomass smoke, or pollution. This dust would also be expected to produce a distinct negative SWBTD signal and thus be readily enhanced by DEBRA, but enhancement was not achieved in this case. Instead, the SWBTD signal (Fig. 4b) in this region is near zero or slightly positive, resulting in DEBRA missing the dust plume (i.e., not enhanced as yellow in Fig. 4c) almost entirely.
DEBRA includes a cloud mask preprocessing step, which enlists the SWBTD as a “restoral test” for pixels erroneously flagged as cloud instead of optically thick dust. It was further confirmed, by temporarily turning it off in the processing, that the cloud mask itself was not contributing to the missing dust in the original DEBRA algorithm. As the EUMETSAT Dust RGB algorithm (Fig. 1b), which also misses the eastern dust entirely, does not enlist a cloud mask, this exercise was done simply as a sanity check before pursuing alternative explanations for the missing dust.
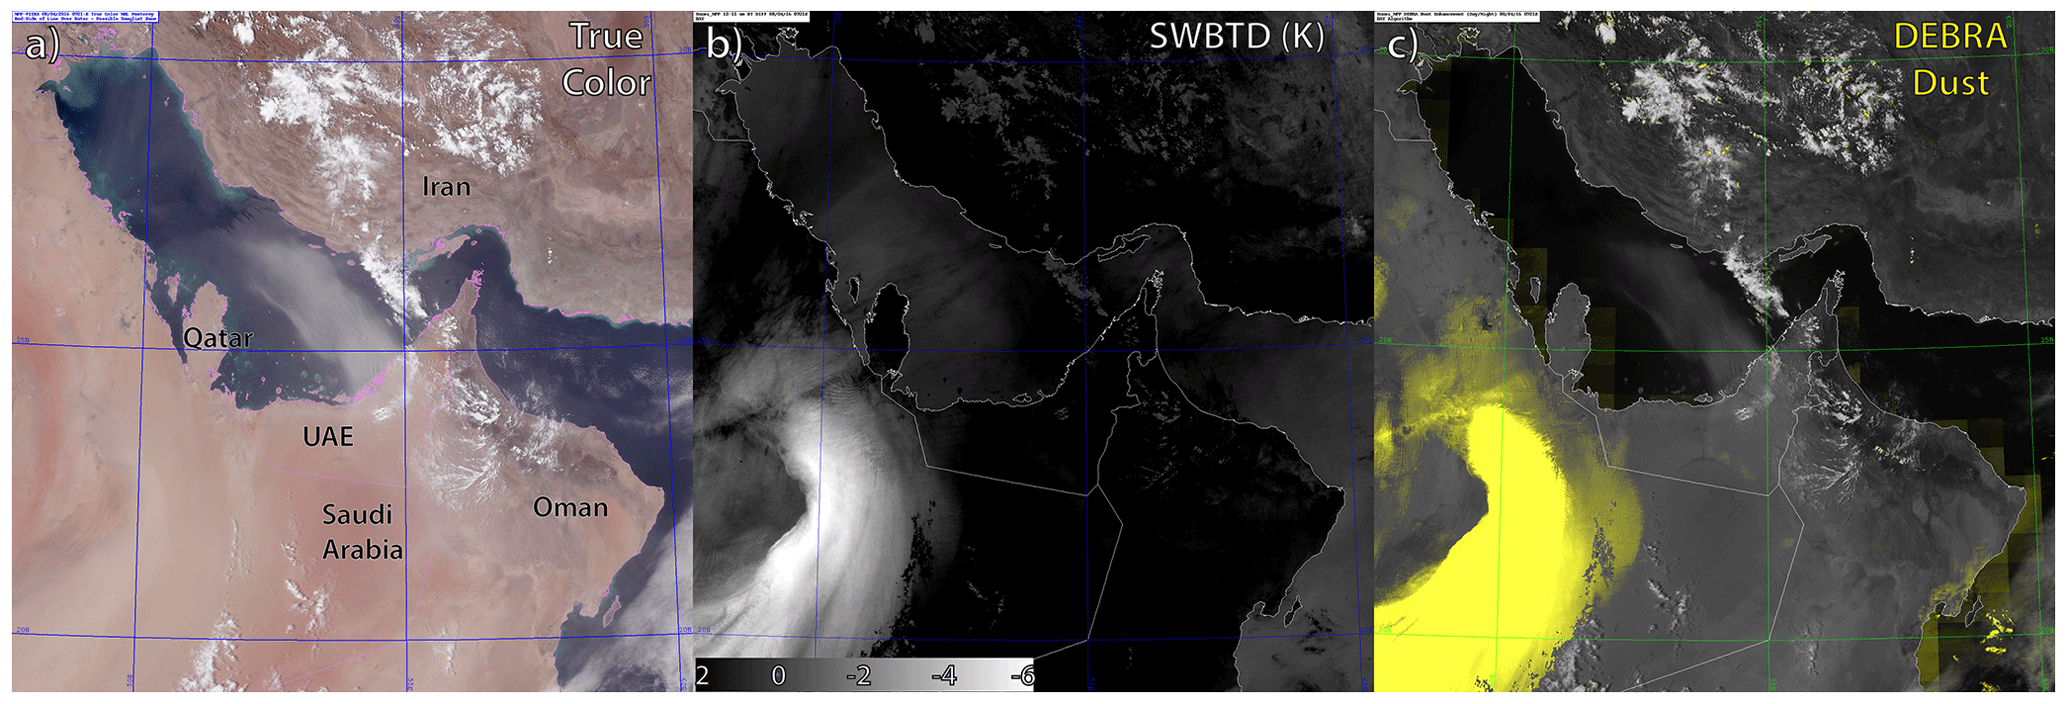
Figure 4Suomi NPP VIIRS imagery showing (a) true color, (b) the SWBTD (scaled here from 2 to −6 K), and (c) DEBRA-dust (enhanced dust in yellow) imagery composite from 4 August 2016, 09:21 UTC. Whereas DEBRA identifies the western dust plume prominently, it fails to identify the eastern “missing” plume over the eastern UAE and extending offshore. The tan coloration of this missing plume, indicative of mineral composition, is revealed via true color imagery in contrast to nearby meteorological clouds that appear white.
Geostationary MSG-8 visible-band imagery (time-resolved at 15 min, provided as S2 in the Supplement) provides insight into the additional factors contributing to the eastern dust plume. The imagery shows morning-time convection initiating offshore of Oman, between the coastal cities of Lakabi (18.23∘ N, 56.55∘ E) and Ras Madrakah (18.98∘ N, 57.79∘ E) on 3 August 2016 at 04:00 UTC (∼ 08:00 local time). By 08:15 UTC, a well-defined boundary marked by leading-edge cumulus formed and began moving inland in a northwesterly direction. Such features are indicators of a cold pool outflow and gust front associated with evaporative cooling, which is common to convection occurring in dry lower atmospheric environments. This outflow may have produced additional dust lofting via the haboob mechanism (e.g., Miller et al., 2008). The gust front appears to superimpose with the daytime inland-moving sea breeze front along coastal Oman. The presence of dust was inferred by high visible reflectance and reduced land surface texture behind the front, although standard dust-enhancement products (SWBTD) gave no indication of lofted dust.
By 13:00 UTC (17:00 local time) on 3 August 2016, the coastal Oman dust-laden front had just crossed the border between Oman and southern Saudi Arabia at 20∘ N, 55∘ E. Infrared signatures of clouds oriented along the front were lost by 18:00 UTC. By this time, the front had come under the influence of the southerly flow (the principal source of dust lofting in the missing plume; described in Sect. 3.1), taking a more northward track along the Saudi–Omani border, moving toward the southern border of the UAE. Both visible (Fig. 1a) and true color (Fig. 4a) imagery from the following day show a dust plume which consists of both local and secondary regionally lofted sources as described, extending through central UAE and nosing offshore into the SG.
The well-detected and missed dust plumes, as observed in juxtaposition on 4 August 2016, contained very different spectral properties across the infrared window, in which the SWBTD operates. Figure 5 shows information from Aqua MODIS and Atmospheric Infrared Sounder (AIRS) instruments, collected at 09:15 UTC. Figure 5a shows the domain of interest via MODIS true color imagery and denotes locations of selected AIRS spectral plots shown in Fig. 5d. Locations 1–2 correspond to offshore and onshore locations within the SWBTD-missed dust plume, and location 3 is within part of the SWBTD-detected dust plume. Figure 5b shows MODIS retrievals of aerosol optical depth (AOD) via the visible-based “Deep Blue” algorithm (Hsu et al., 2004, 2013). Figure 5c shows a field of 10.35–12.3 µm (monochromatic wavelengths; not band averaged) SWBTD from AIRS, where negative values shown in blue correspond to dust detections.
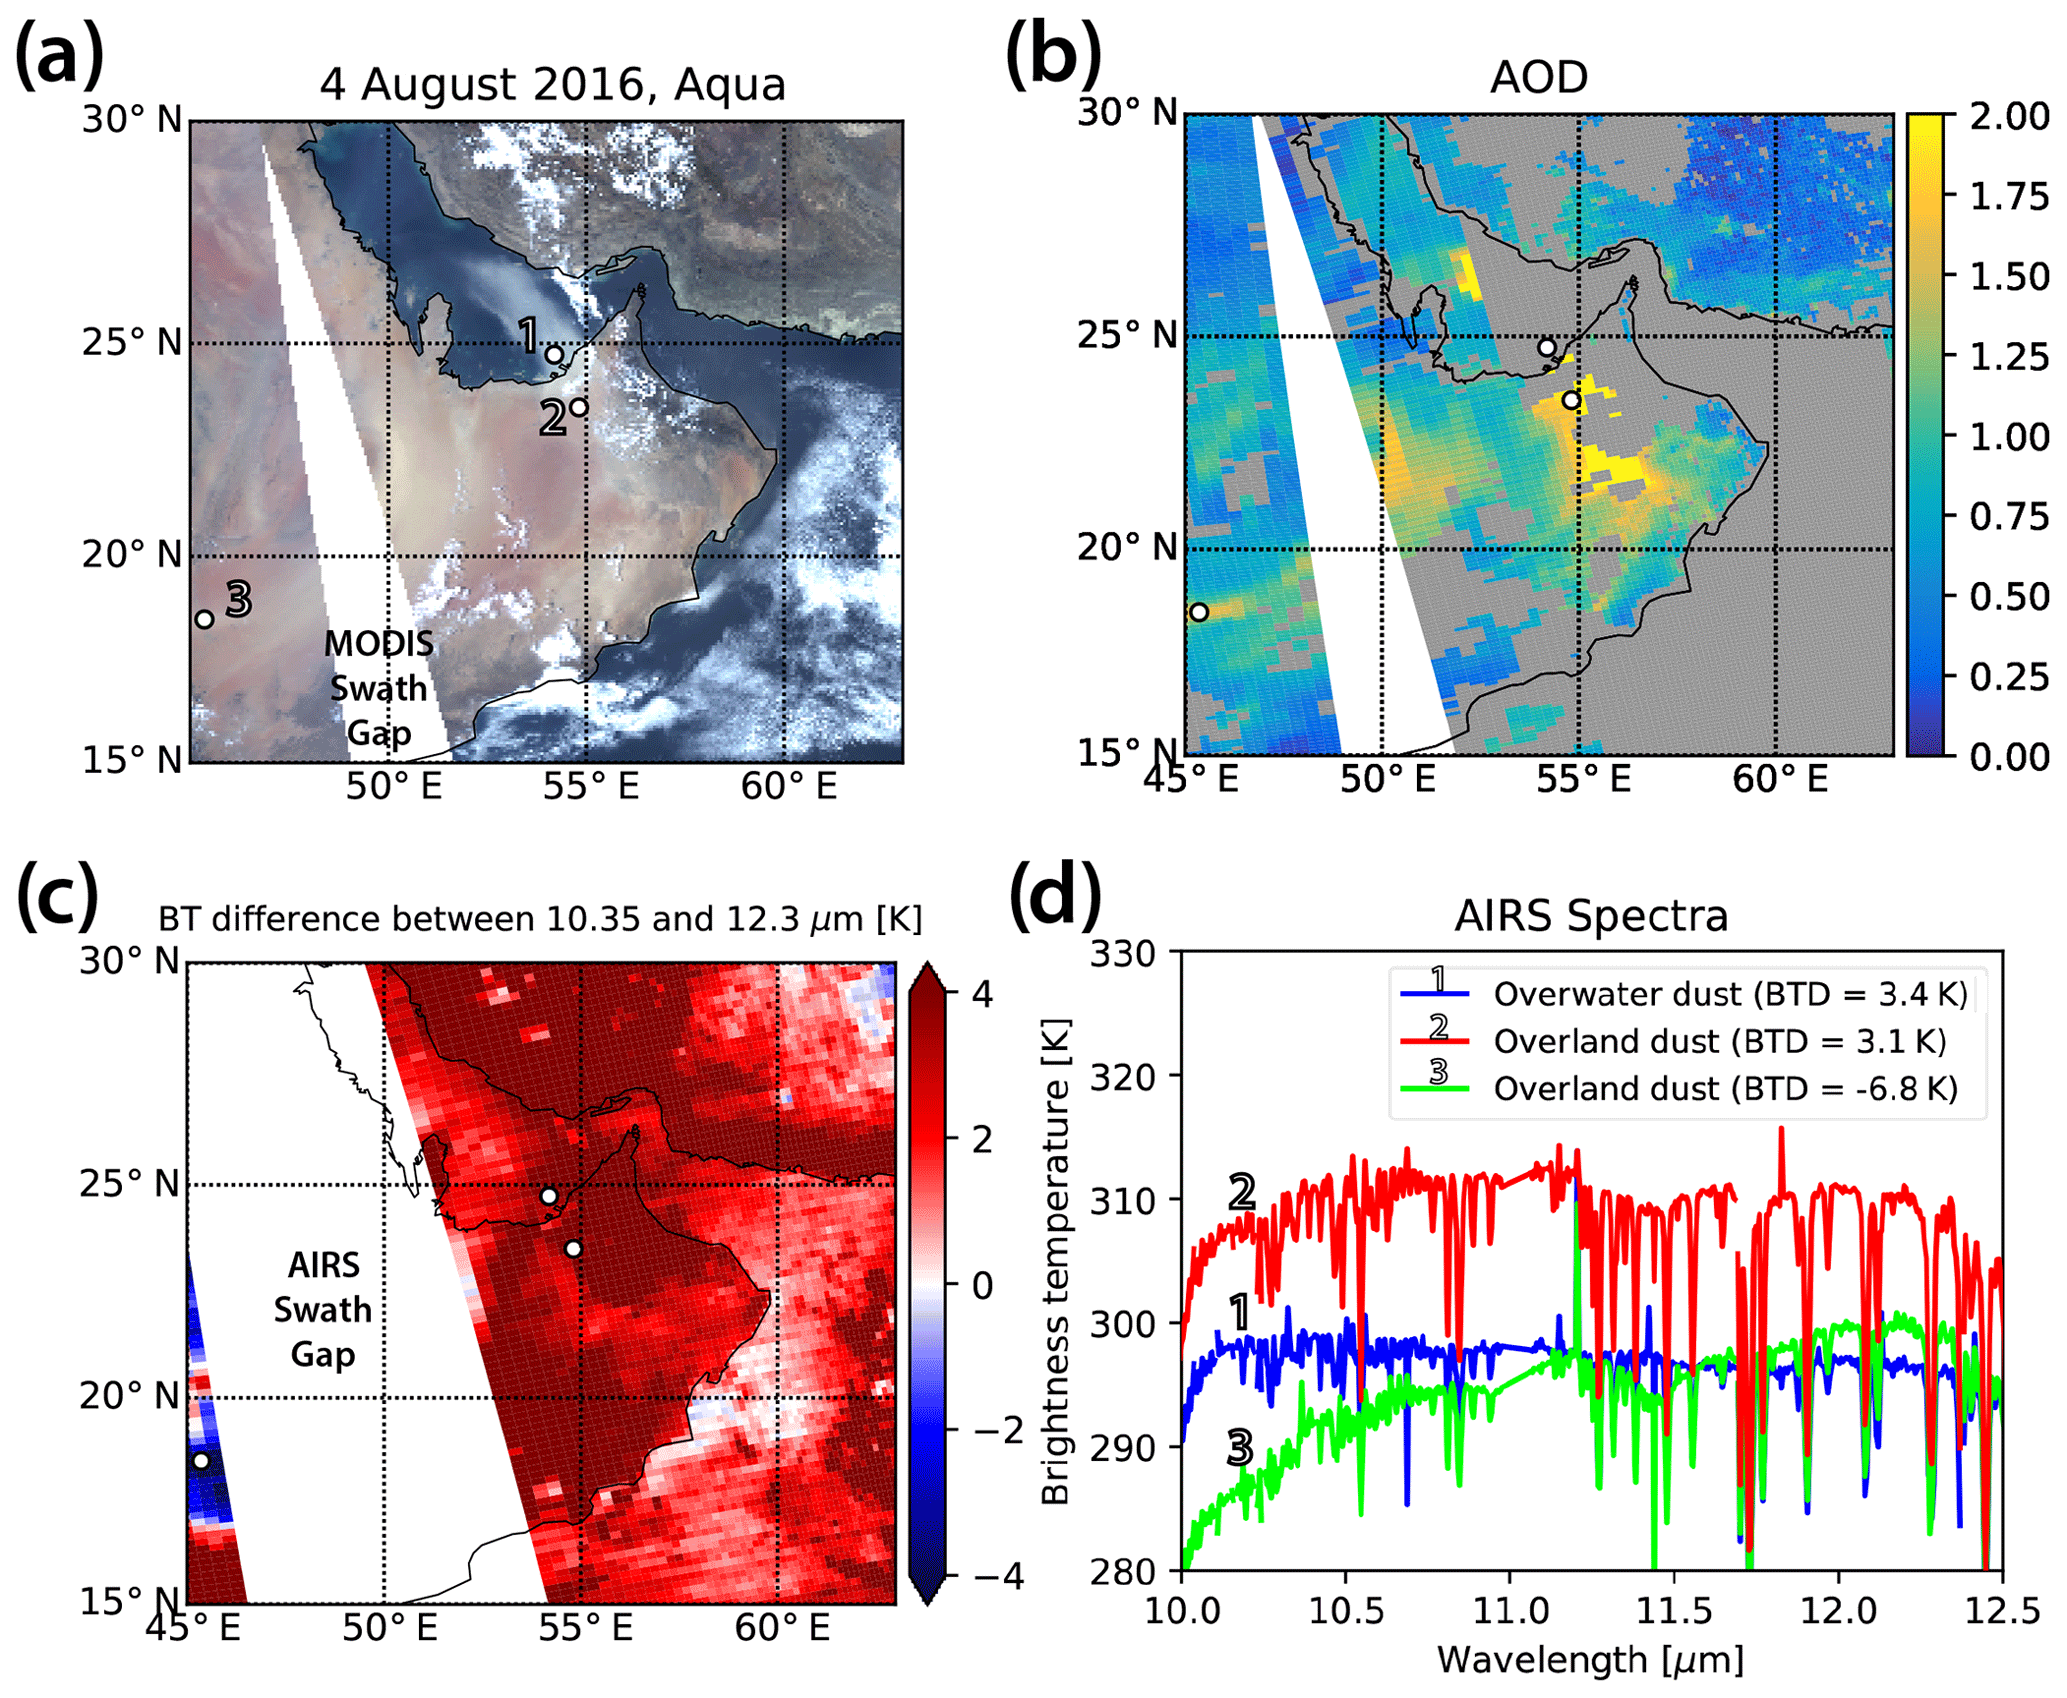
Figure 5NASA Aqua satellite measurements for the 4 August 2016 (09:15 UTC) case study, showing (a) MODIS true color imagery, with sample locations for the missed dust plume overwater (1) and overland (2), and a southwestern portion of the extensive and well-detected inland plume (3), (b) corresponding MODIS AOD retrieval, (c) AIRS-derived SWBTD (10.35–12.3 µm), and (d) resolved AIRS spectra across the split-window region for the three sample locations noted in (a). The specific AIRS SWBTD value at each location is given in the parentheses.
AIRS spectra (and associated SWBTD values) at the selected dust plume locations noted in Fig. 5a are shown in Fig. 5d. The 1650 km wide swath width of AIRS (narrower than the 2330 km swath of MODIS) accounts for the differences in the width of data gaps between adjacent satellite overpasses. While the AIRS swath gap on this day corresponded to a significant portion of the well-detected dust plume, a portion of the western swath intersects the southwestern edge of the same storm (near location 3) and thus is relevant to the comparison of dust signals between the two air masses. Whereas the spectra (Fig. 5d) associated with location 3 produce a strongly negative SWBTD, indicative of lofted dust, locations 1 and 2 produce positive SWBTD values – explaining the inability of the EUMETSAT and DEBRA methods to infer the presence of dust at those locations.
3.3 Vertical profile information from passive sensors
Passive imaging radiometers, while providing useful information on the horizontal distribution and column-integrated properties of dust storms, offer very limited information in terms of vertical structure. Active optical sensors such as lidar are very useful in this regard, but terrestrial systems are few and far between. Even less common are spaceborne lidars, which extend coverage to the global scale but typically provide only a curtain slice of the atmospheric column, owing to their non-scanning configuration. The resultant poor spatial sampling, combined with relegation to polar-orbiting satellites that offer infrequent revisits of a given location, reduces the chances of leveraging spaceborne lidar observations for a localized case study. At the time of this case study, two NASA cloud–aerosol lidar systems were operational – the Cloud-Aerosol Lidar with Orthogonal Polarization (CALIOP; Hunt et al., 2009) on the NASA Cloud-Aerosol Lidar and Infrared Pathfinder Satellite Observation (CALIPSO) satellite (Winker et al., 2009) and the NASA Cloud-Aerosol Transport System (CATS; McGill et al., 2015) on the International Space Station (ISS).
By what can best be described as a stroke of incredible serendipity, both the ISS and CALIPSO satellites carrying these lidar systems crossed over the same region of the UAE within minutes of each other (nearly a simultaneous nadir overpass) on the evening between 3 and 4 August 2016. Moreover, the conjunction occurred at the very time that the “missing” dust plume was forming and being transported northward by various mechanisms described in Sect. 3.1 and 3.2. Traveling from NW to SE on the ISS, CATS crossed over the UAE on 3 August at ∼ 22:08 UTC. Roughly 15 min later, at ∼ 22:23 UTC, CALIOP crossed the same area on its NE-to-SW descending node track. This conjunction of active systems provided a golden opportunity to assess the vertical structure of the missing dust plume at a critical time in its development.
Figures 6 and 7 show the satellite ground tracks and corresponding lidar profiles of total attenuated backscatter for CATS and CALIOP, respectively. Differences seen in the magnitudes of total attenuated backscatter are due primarily to the different wavelengths (1064 nm for CATS and 532 nm for CALIOP) shown in these figures. Both profiles indicate a deep layer (0–5 km above mean sea level, AMSL) of suspended aerosol (identified by CALIPSO algorithms, not shown, as likely dust) common to the region during this time of year (e.g., Nabavi et al., 2016). Embedded within this background are more significant backscatter features tied to local, recently lofted and optically thicker dust. Meteorological clouds, especially those in the middle and lower atmospheres composed of mixed or liquid phase droplets, act as very strong attenuators of lidar energy. Attenuation from these clouds, also present within the CATS and CALIOP profiles, accounts for the occasionally seen vertically oriented dark stripes or bands in the lower atmosphere of both lidar profiles.
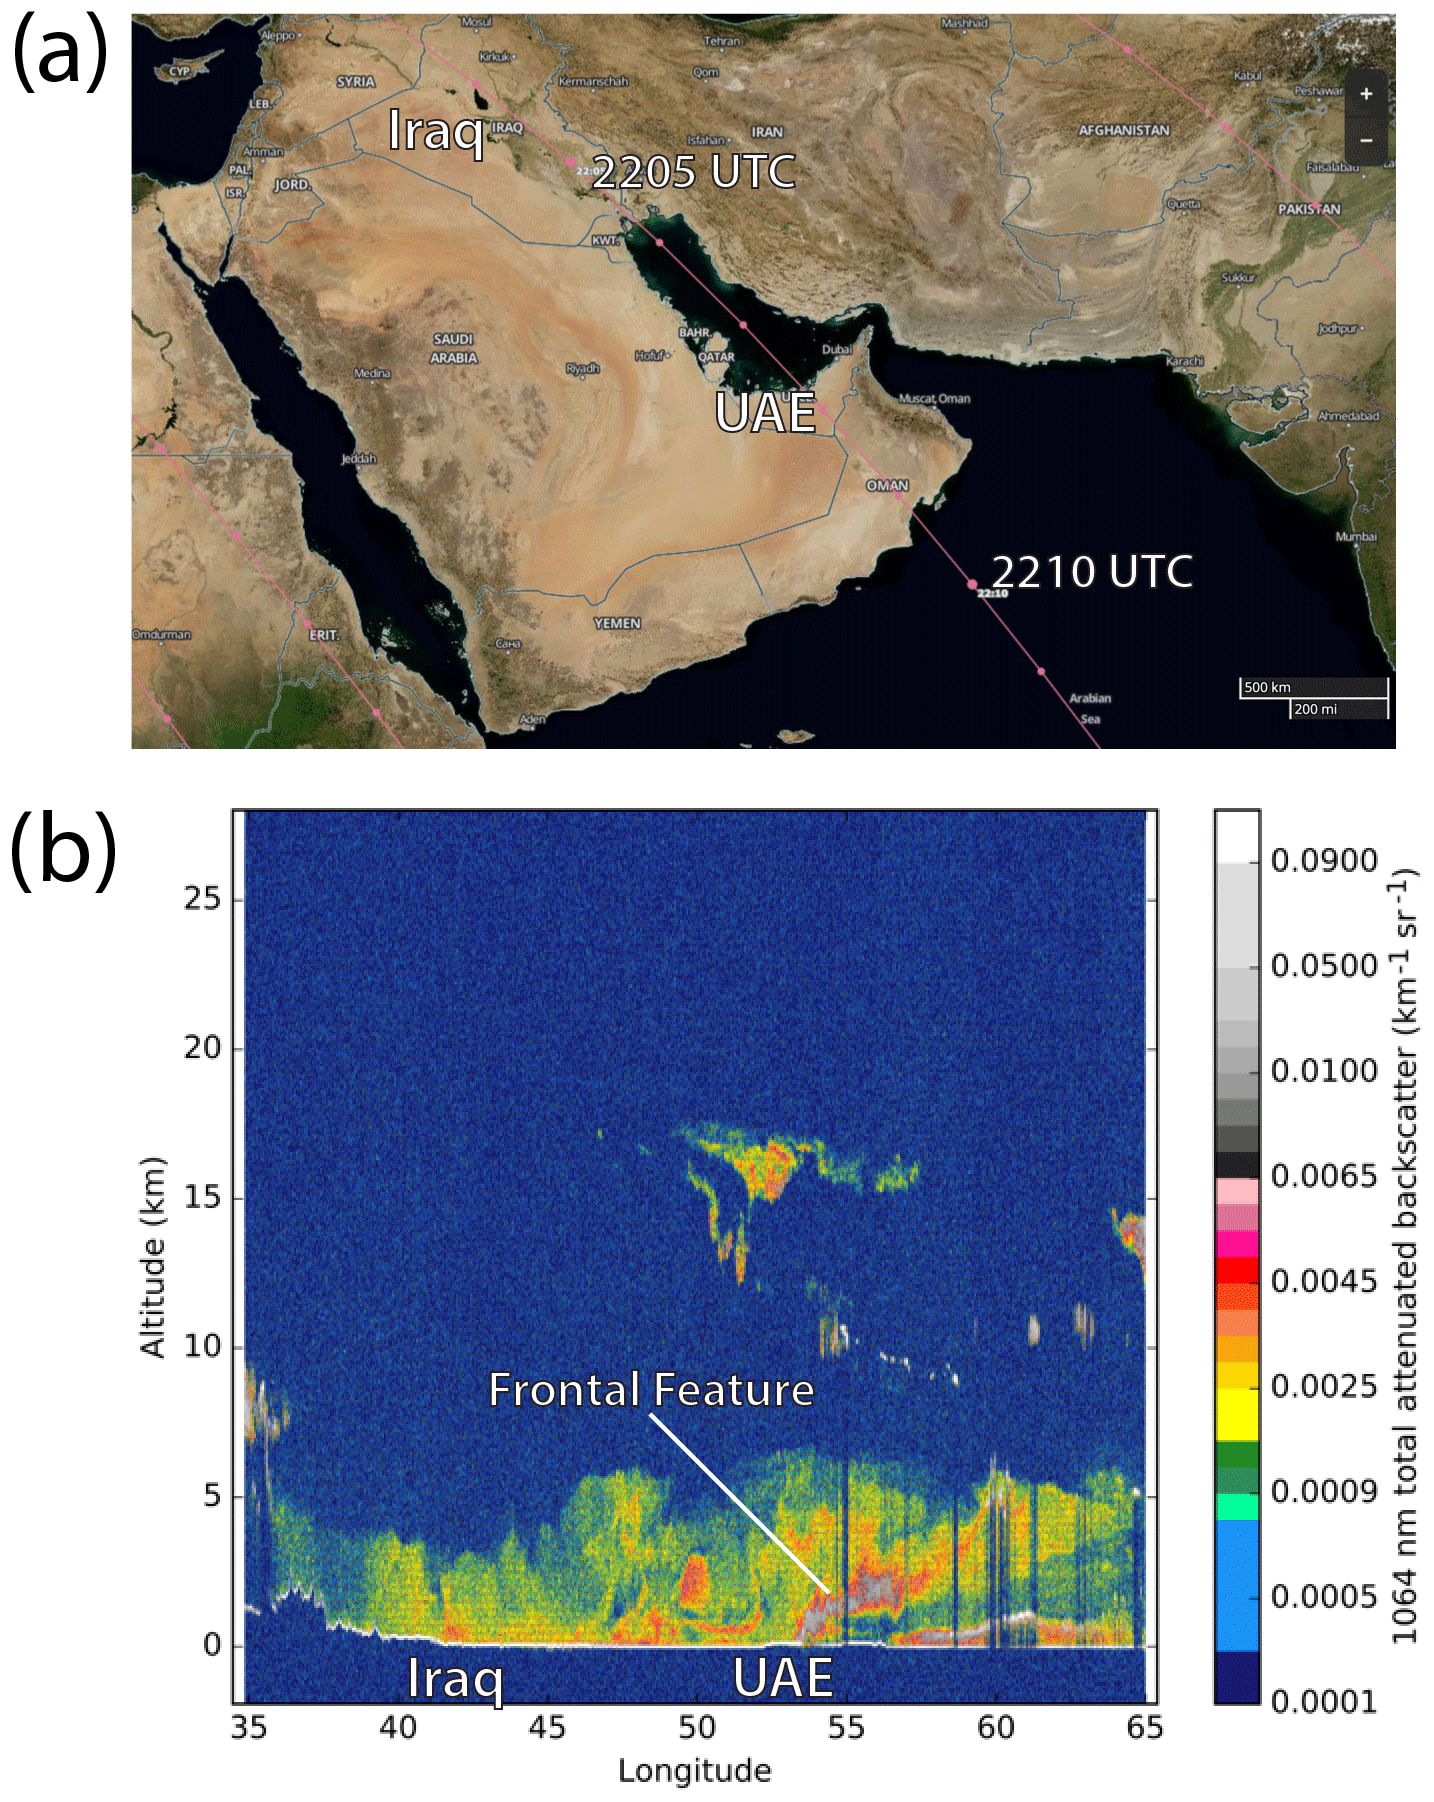
Figure 6(a) ISS ground track (NASA Worldview) and (b) CATS 1064 nm total attenuated backscatter cross section for 3 August 2016, ∼ 22:03–22:14 UTC. Noted is an apparent dust frontal feature extending from the surface to 2–3 km above mean sea level.
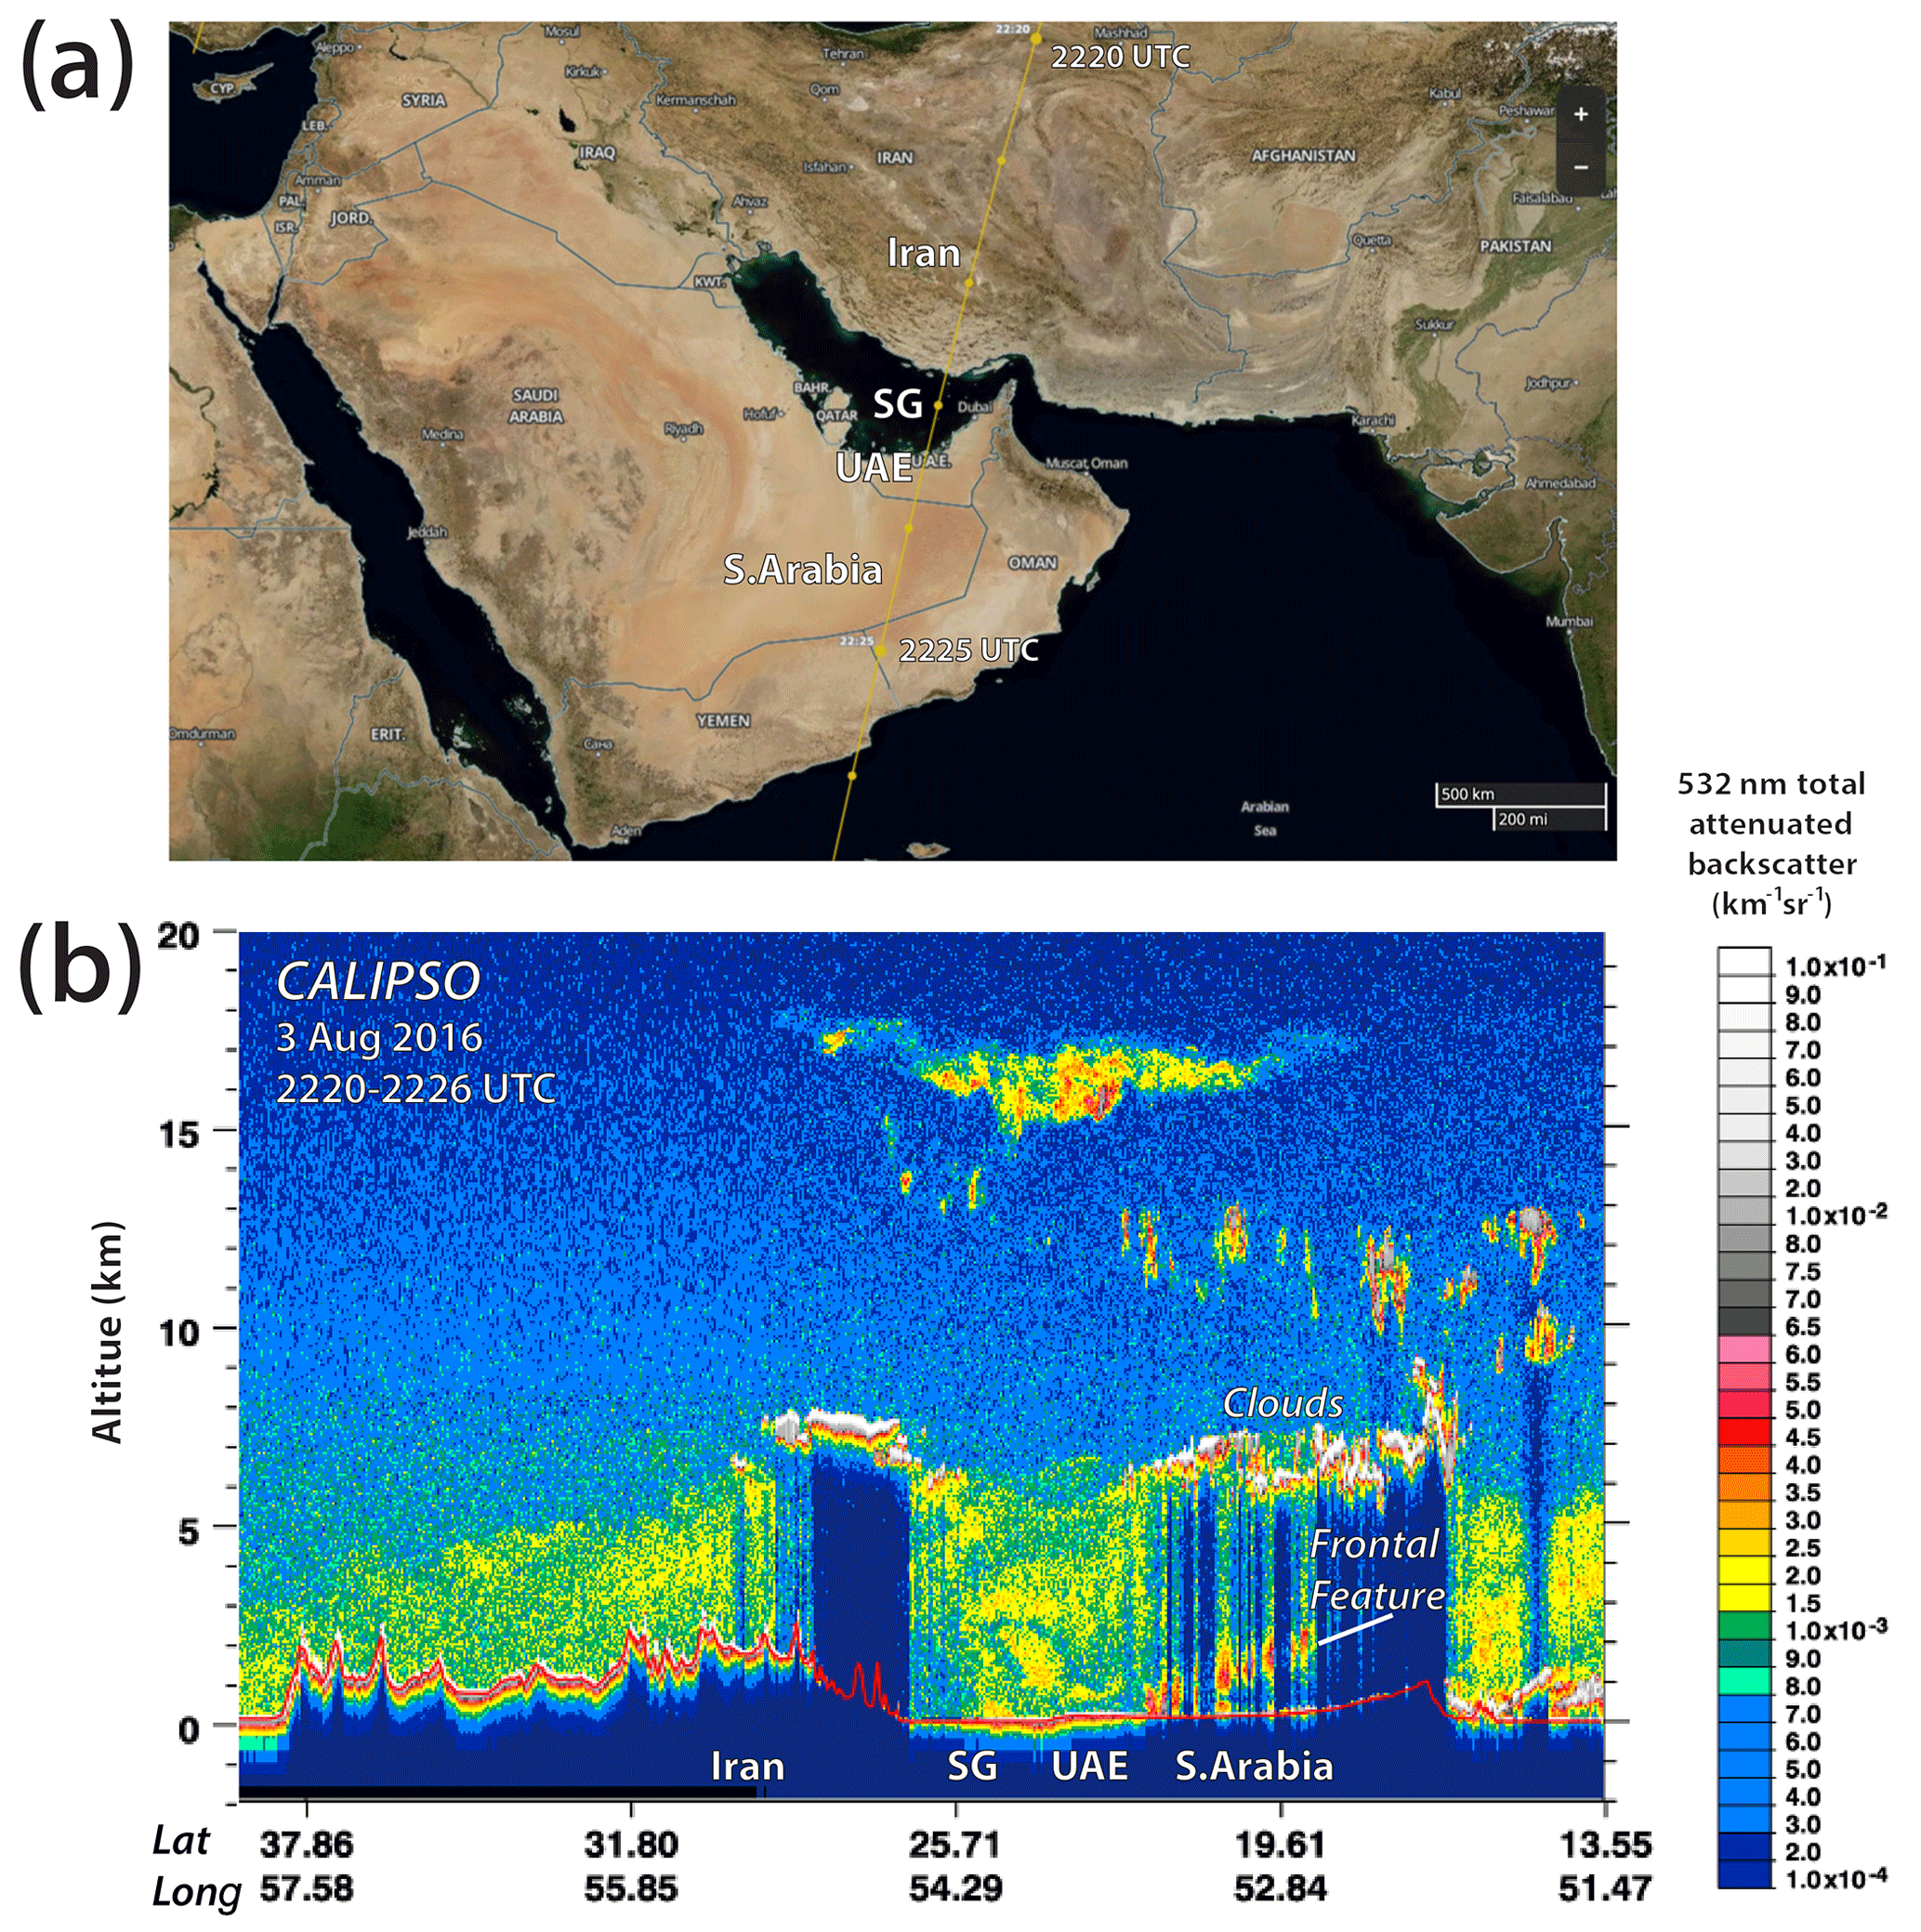
Figure 7(a) CALIPSO ground track (NASA Worldview) and (b) CALIOP 532 nm total attenuated backscatter cross section for 3 August 2016, ∼ 22:20–22:26 UTC (within ∼15 min of CATS). The same dust frontal feature noted in Fig. 6 is present near the southern UAE border with Saudi Arabia.
A key item of interest in these lidar profiles is the labeled “Frontal Feature”, seen in both CATS and CALIOP observations over the southeastern UAE. This feature arcs from the surface up to ∼2–3 km. The diffuse character of its lower and upper boundaries, combined with its significant backscatter (entering the range of the color scaling typically relegated to cloud signals), is indicative of an optically thick dust layer. In the CALIOP data of Fig. 7, the same arc feature seen in the CATS data of Fig. 6 is present but appears less continuous, due to the intermittent beam attenuation by the overriding mid-level clouds encountered along the NE approach of CALIPSO but avoided by the W-NW approach of the ISS.
The timing and location of the frontal feature are consistent with the WRF–Chem and RAMS model simulations and surface station observations of a southeasterly flow surge associated with the forming low pressure over the SG (Sect. 3.1). The southbound components of both CATS and CALIOP would have encountered the leading edge of this frontal structure. The effects that a frontal surge would have on dust already in suspension, in terms of the dust pooling and riding up and atop the surface front, is consistent with the lidar observations. Thesa effects are identified in the model simulations: in Fig. 3b, the area labeled “F” shows the bowing of suspended dust along the southerly surge and also as northbound streamline plumes characteristic of freshly lofted dust forming in its wake. From these dual lidar observations, we infer that the missing dust plume has significant mass loading in the 0–3 km layer (∼1000 to 700 hPa) of the atmospheric column.
3.4 Atmospheric moisture
We turn our attention now to the topic of atmospheric moisture, which is hypothesized to have played a governing role in the performance (or lack thereof) of the infrared-based dust detection techniques. Figure 8 shows WRF–Chem simulations, corresponding to Fig. 3, of the 24 h period leading up to the 4 August 2016 event depicted in Fig. 1 (animation provided as S3 in the Supplement). The simulations show a very dry (low TPW) air mass in cyclonic rotation (the shortwave discussed in Sect. 3.1) descending through central Saudi Arabia, which is associated with the well-detected dust plume. Close inspection of Figs. 1, 4 and 5 reveals that this dry air mass correlates positively with the well-detected western dust plume. Meanwhile, a tongue of high TPW extends across Oman and northward through the eastern UAE. Strong southerly winds entrained relatively moist air (TPW > 45 mm) from the Arabian Sea maritime air mass. The frontal surge that occurred over the evening hours of 3–4 August is manifest in Fig. 8b (compare to Fig. 3b) as an enhanced gradient of moisture. Cross-referencing once again to observations in Figs. 1, 4, and 5, this moist air mass envelopes the region of the missing eastern dust plume.
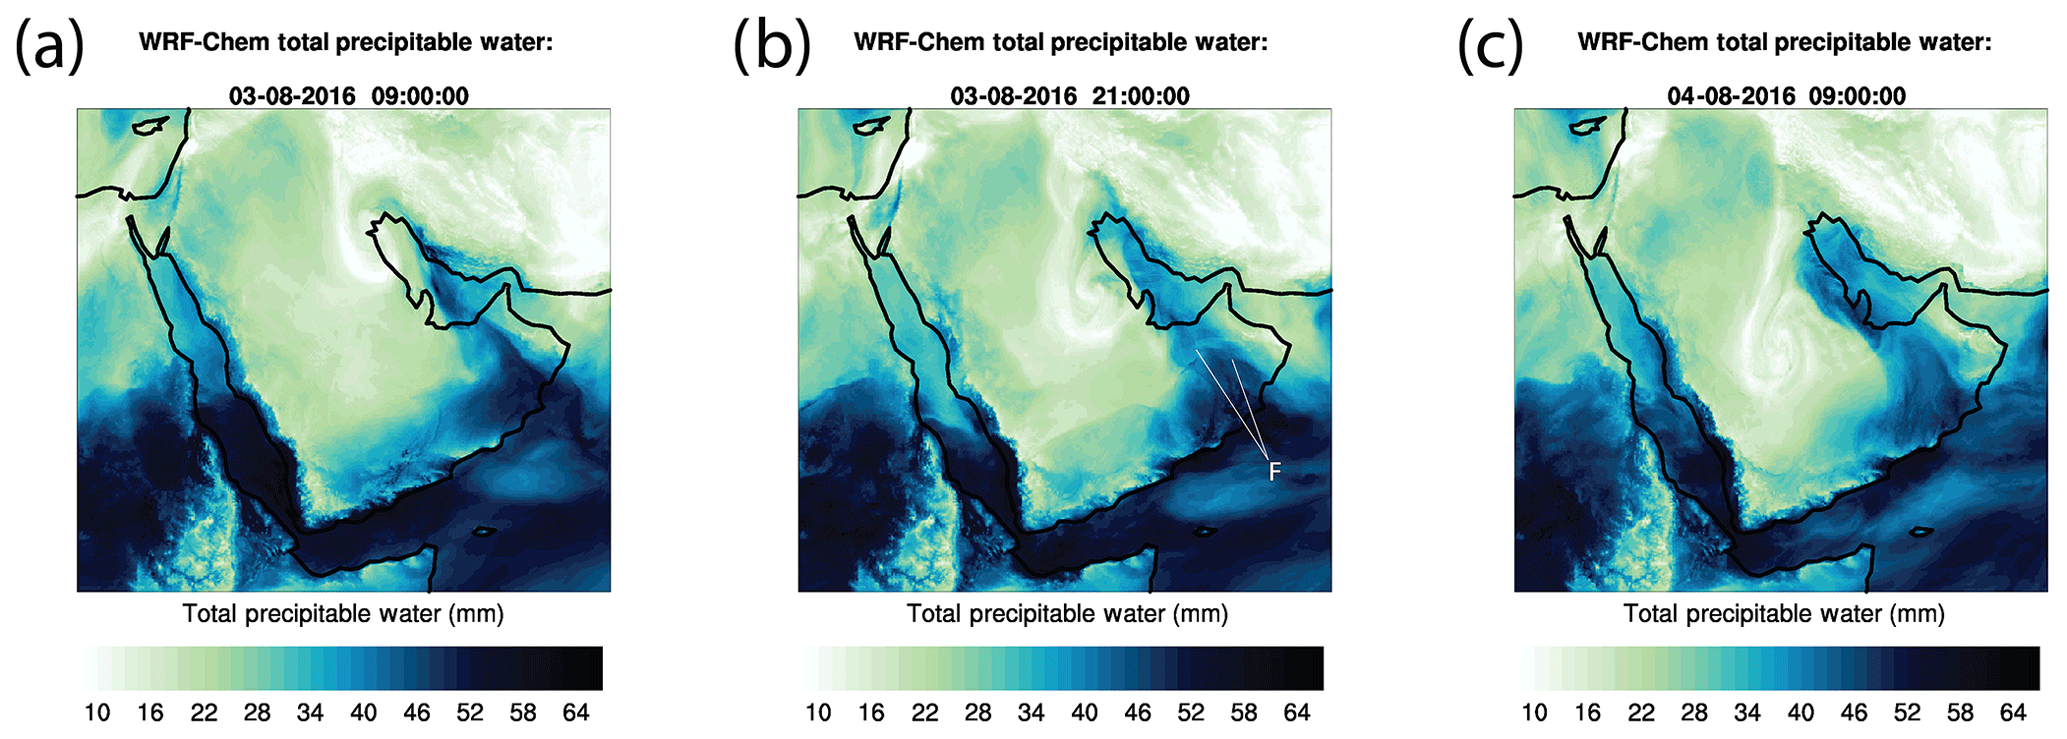
Figure 8As in Fig. 3 but showing total precipitable water (TPW; mm). The frontal feature denoted in Fig. 3b and discussed in Sect. 3.3 is shown again here as “F” in panel (b).
Properties of the dry and moist atmospheric air masses were also characterized directly by independent satellite retrievals. The National Oceanic and Atmospheric Administration (NOAA) Unique Combined Atmospheric Processing System (NUCAPS; Gambacorta and Barnet, 2013), run operationally since 2013, uses cloud-cleared radiances and an iterative regularized least squares minimization algorithm to produce vertical profiles of temperature, water vapor, and trace gases from microwave and infrared radiances. The retrieval enlists input from the Cross-track Infrared Sounder (CrIS) and the Advanced Technology Microwave Sounder (ATMS) on NOAA's Suomi NPP and NOAA-20 satellites. NUCAPS provides 30 retrievals at 100 levels between 1100 and 0.16 hPa across a 2200 km swath. Owing to the projection of the cross-track scanning sensor footprints, spatial resolution ranges from ∼50 km at nadir to km at the scan edge. Nalli et al. (2016) demonstrate that NUCAPS water vapor profiles compare favorably to radiosonde data and to numerical weather prediction models in terms of moisture magnitude and gradients in a variety of atmospheric flows.
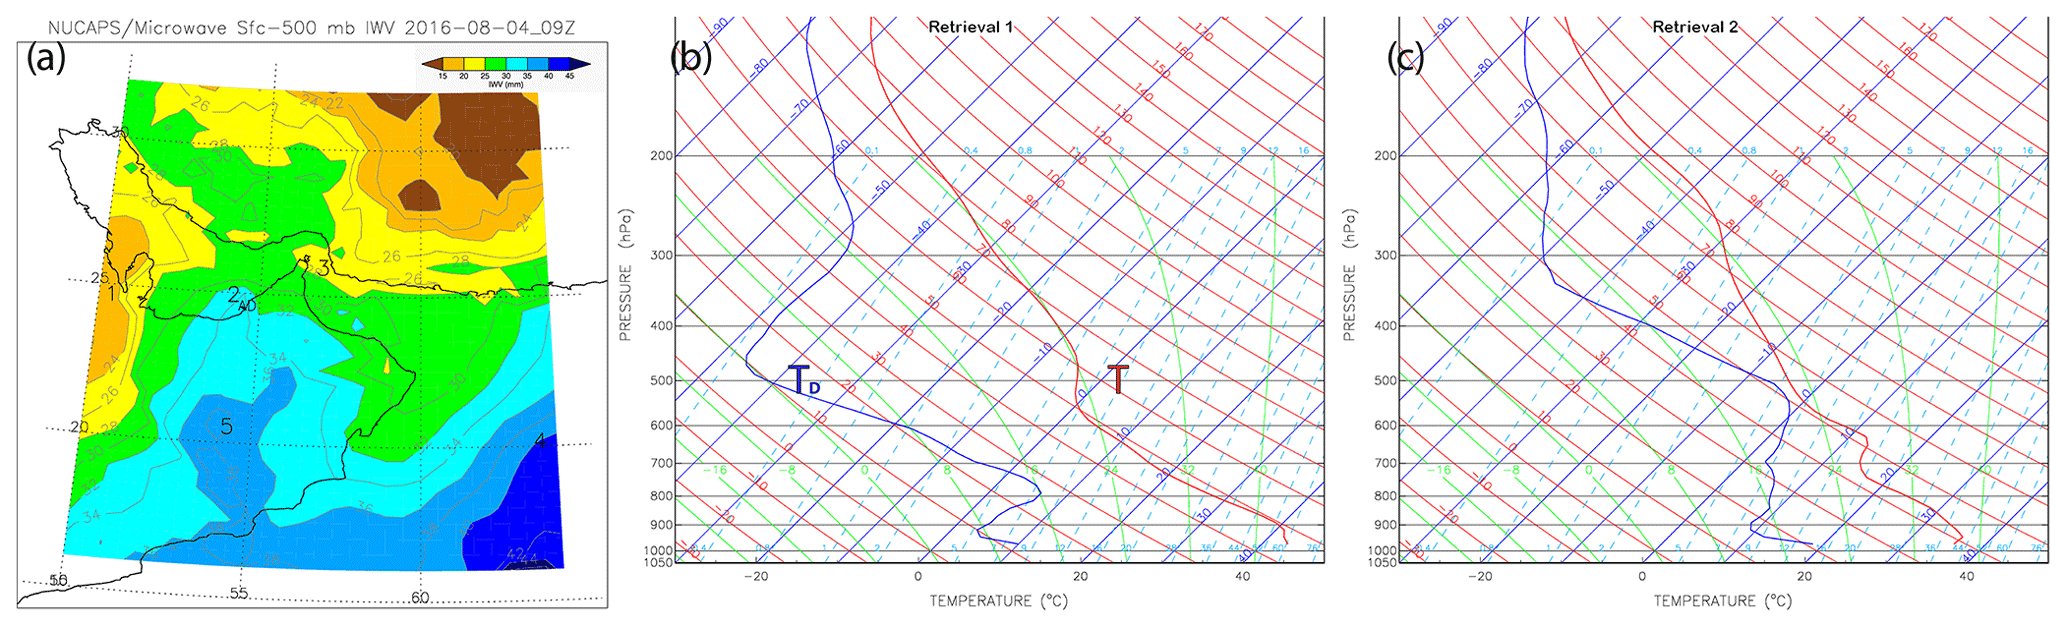
Figure 9NUCAPS-derived integrated water vapor between the surface and 500 hPa (a) valid on 4 August 2016 at 09:21 UTC, and profiles of temperature (T) and dew point temperature (TD) at two selected locations: (b) the dry air mass (location 1, west of Qatar) and (c) moist air mass (location 2, offshore of UAE in the SG). Panel (a) shows large differences (∼15–20 mm) in low- to mid-level moisture in the regions represented by the two soundings.
Figure 9 shows NUCAPS retrievals for the Suomi NPP pass over the southern Arabian Peninsula on 4 August 2016 at 09:21 UTC (same overpass as shown in Fig. 4). A plan view of low- to mid-troposphere (surface-to-500 hPa) integrated water vapor (IWV; Fig. 9a), a sub-column of the TPW, shows a tongue of moisture extending from coastal Oman to the SG. The structure of this moist air mass, drawn northward by the surface low over the SG as discussed in Sect. 3.1, is consistent with the WRF–Chem analysis shown in Fig. 8. Selected NUCAPS temperature and dew point temperature profiles for two locations within portions of the dry and moist air mass dust plumes are shown in Fig. 9b and c. NUCAPS data show large differences in low- and mid-tropospheric IWV (∼15–20 mm), especially at mid-tropospheric levels around 500 hPa where the difference in dew point depression between locations 1 (dry) and 2 (moist) is ∼35 ∘C.
These diverse model and observational datasets provide a comprehensive understanding of the meteorological conditions associated with the case study. Further, they motivate a more in-depth analysis, based on RTM simulations and in consideration of varying dust optical properties, of the potential impacts of atmospheric moisture differences on the SWBTD dust signal. This analysis is aimed at determining the necessary conditions for producing the missing dust outcome in the case study, while looking toward comprehensive methods of mitigating the water vapor masking effect on infrared detection techniques in general.
4.1 Microphysical and optical property assumptions
Differences in SWBTD among various dust plumes may arise from water vapor masking, different optical properties, optical depth, or more likely a combination of all factors. The composition of mineral dust varies as a function of location, yielding different optical properties (and commensurate SWBTD signal strengths) for a given mass loading and size distribution. Thus, for the current case study it is important to take an inventory of variations due to a range of refractive indices (RIs) characteristic of dust sources over the Arabian Peninsula and to consider to what extent these variations might account for the disparate behaviors of the infrared (IR) dust detection performance in the two dust plumes.
Several sets of RI for varying dust types characteristic of the Arabian Peninsula reside in the literature. For this analysis, we enlisted recommendations from (i) the quartz-dominated (99 % quartz and 1 % hematite) species from the Aerosol Refractive Index Archive (ARIA; http://eodg.atm.ox.ac.uk/ARIA/, last access: 9 September 2019), (ii) the Optical Properties of Aerosols and Clouds database (OPAC; Hess et al., 1998), and (iii) Saudi Arabian dust properties from Di Biagio et al. (2017; hereafter DB17). The values of these RI databases, along with spectral optical properties derived from Mie theory for 2.4 µm effective radii (as defined by Hansen and Travis, 1974) dust at wavelengths used in constructing the SWBTD, are provided in Table 1. Mass extinction coefficients (kext; m−2 kg−1) are multiplied by the dust loading (mass mixing ratio), the density of air, and the geometric thickness of the dust-laden model layers to compute the dust optical thickness. The dust optical thicknesses of each layer are then combined to yield the total column dust AOD. The single-scattering albedo describes the fraction of the extinction that is due to scattering processes (vs. absorption), and the asymmetry parameter provides a metric for directional scattering (1.0 denotes complete forward scatter, −1.0 denotes complete backscatter, and 0.0 denotes isotropic, or directional-independent, scatter).
Table 1Refractive indices (RI), mass extinction coefficient (kext), single-scattering albedo (ωo), and asymmetry parameter (g) assumed for idealized SWBTD dust signal calculations with a dust effective radius of 2.4 µm.

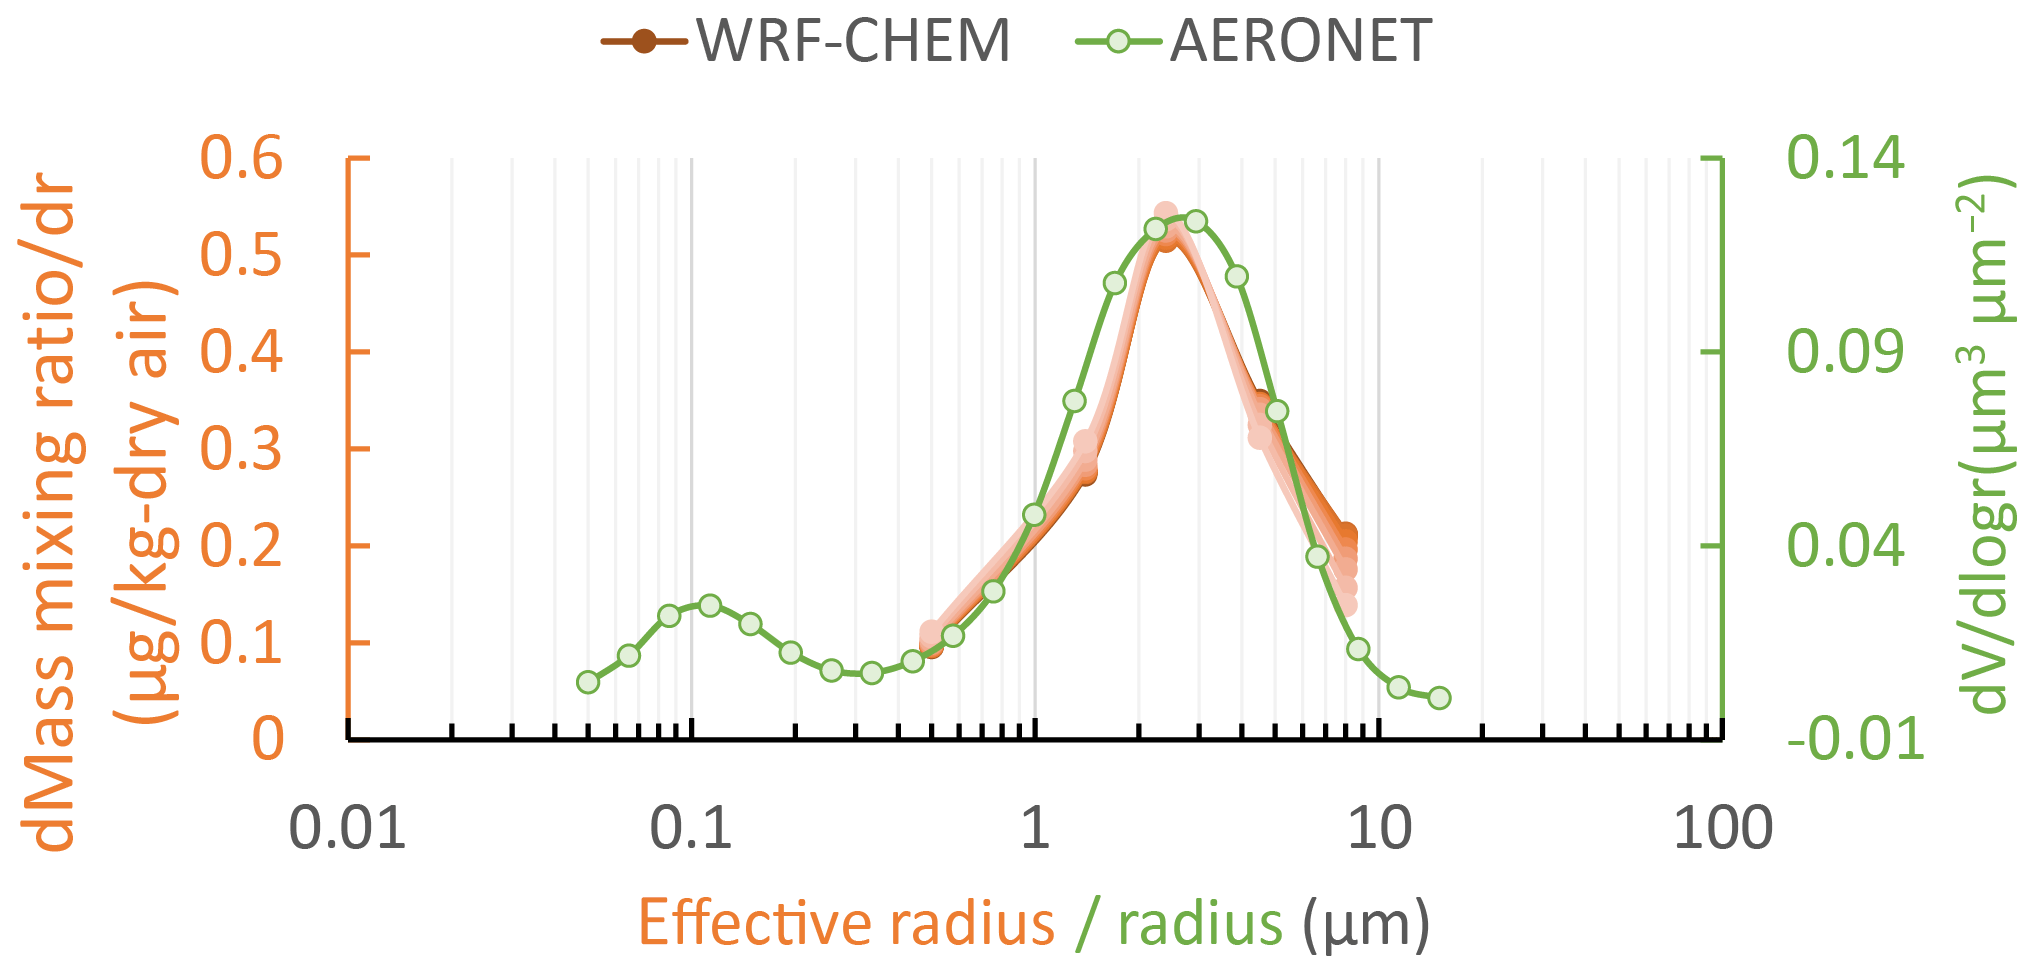
Figure 10Comparison between the volume size distribution of AERONET data (2016 average) at Kuwait University site and the mass distribution of dust-laden columns in WRF–Chem.
The spherical particle approximation of Mie theory was assumed in computing the dust optical properties. Using simulated and measured spectra, Klüser et al. (2016) found significant variance of infrared dust optical properties for spherical vs. aspherical (specific “habits” of needles and disks) and varying mineralogy and assumptions. Specifically, while the general structure of extinction is similar among the permutations, they find shifts to peak extinction and moderate variations to the structure of single-scattering albedo, phase function, and its associated asymmetry parameter. Mixtures of mineral components, randomly oriented irregular particle shapes which may skew the bulk optical properties toward those of oblate spheroids (as in the case of ice clouds; Baran et al., 2005), and the phase function smoothing effects of multiple scatter in optically thick dust media considered here may reduce the magnitude of disparities implied by the idealized simulations. Suffice to say that Mie theory, or any fixed assumption on dust optical properties, comes attached with uncertainties (Meng et al., 2010). In what remains a highly under-constrained problem, the simulation results presented hereafter should be interpreted as representative of bulk dust properties that are, to first order, consistent with the satellite-observed SWBTD behavior.
With these caveats in mind, an effective dust radius of 2.4 µm was used in the idealized RTM calculations, corresponding to the large particle radius mode of an averaged dataset collected at the Kuwait University AERONET site during 2016 (Fig. 10). Overplotted in Fig. 10 are the averaged WRF–Chem model binned size distributions for atmospheric columns having total summed dust volume concentrations (dust loading) greater than 0.6 µm−3 µm−2 for the current case study. These data show that the model assumptions made here were consistent with the AERONET-observed large particle radius mode. This representativeness is important for simulations in Sect. 4.3.
Table 2Examples of AOD for 10.35 and 12.30 µm for three different dust loading amounts, using dust RI and optical property assumptions from Table 1 and an assumed dust layer thickness of 2 km.
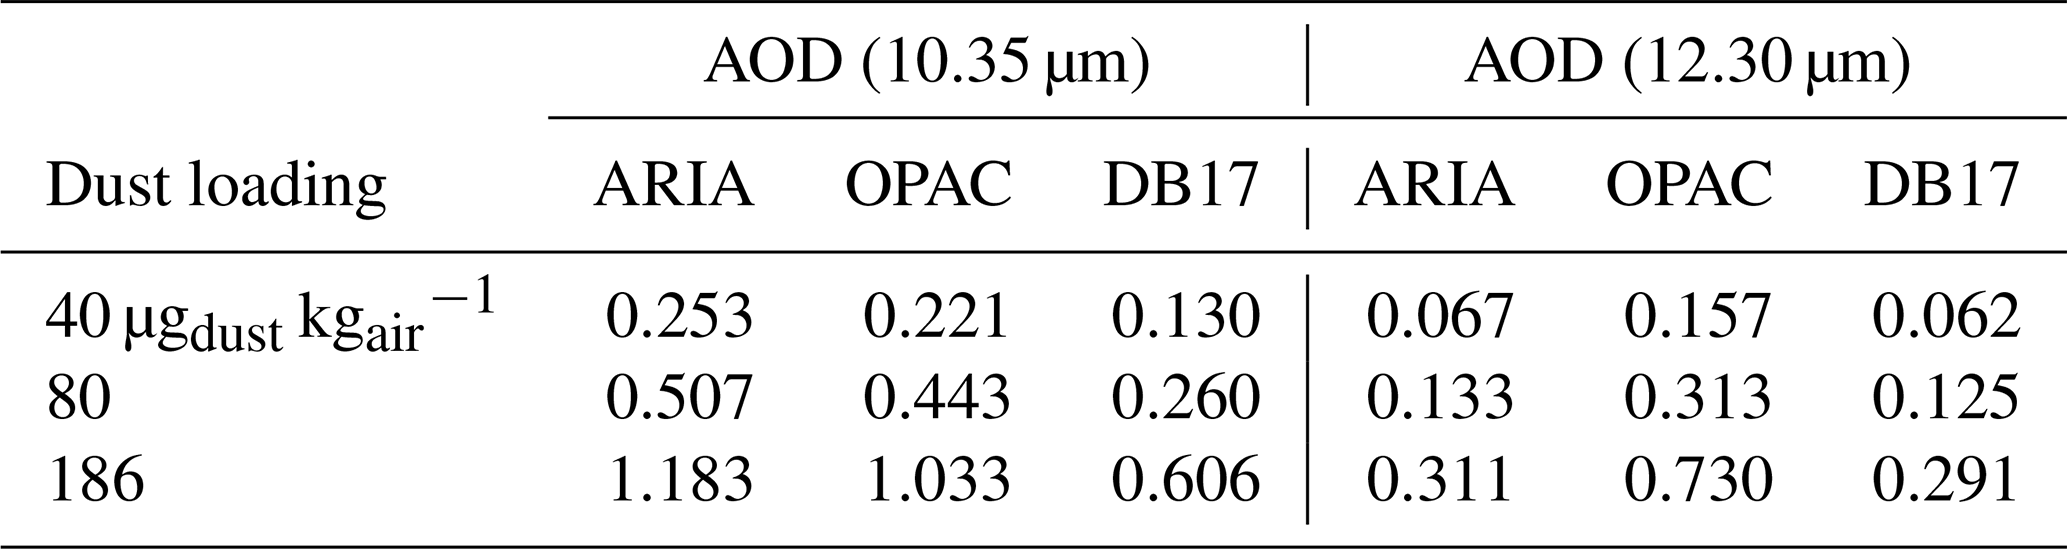
Table 2 shows example values of AOD computed at the SWBTD component wavelengths for three different total column dust loadings (40, 80, and 186 in units of columnar volume concentration; µgdust ) and the three sets of assumed RI (Table 1) based on Mie theory for a dust effective radius of 2.4 µm. At 10.35 µm, the real part of the RI (which dominates the extinction via scattering) is much lower for DB17 than the OPAC and ARIA databases, resulting in an AOD that is about a factor of 2 smaller. At 12.3 µm, the ARIA and DB17 RIs produce similar AODs, while OPAC is significantly larger – the difference in this case being OPAC's larger imaginary RI component (translating to enhanced absorption). Despite these differences, the proportional relationship of extinction between the two wavelengths maintains and AOD (10.35 µm) > AOD (12.3 µm) among the various composition and loading assumptions. Hence, the sign of the SWBTD for mineral dust for extinction alone remains negative for all three databases. However, the magnitude of the SWBTD for a given RI database will vary as a function of different temperature, moisture, and dust profile scenarios.
4.2 Radiative transfer calculations
Corresponding values of SWBTD from the three dust RI databases were calculated using the hybrid Eddington RTM of Deeter and Evans (1998), following its implementation by Grasso and Greenwald (2004). Figure 11 shows results for idealized single dust layers having optical properties corresponding to ARIA, with an effective particle radius of 2.4 µm, residing in a dry adiabatic temperature profile with surface temperature of 300 K. A 2 km thick dust layer of variable AOD (referenced at 10.35 µm) shown (from clear sky to optically thick; AOD > 10) was raised through the atmospheric column, and the column moisture was increased linearly, which accounts for the change in TPW along the x axis. The AOD values of 0.254, 0.507, and 1.183 are a function of the dust loading values of 40, 80, and 186 (µg(dust) kg(dry air)−1), respectively. The y axis of Fig. 11 shows magnitude of the computed SWBTD. Included is the clear-sky reference (AOD = 0), which shows a trend toward positive SWBTD as TPW increases, owing to larger 12.3 µm vapor absorption.
The effect of increasing TPW on the structure of the dust signal in Fig. 11 follows this same positive trend, with little variation in dust layer height for low-AOD layers. However, as the dust layer AOD increases, two principal effects are noted. The first effect is the increasing spread of SWBTD values, for a given dust AOD and TPW value, among a family of dust layer heights. The lower altitude layers are less negative than the more elevated layers, as the former reside below a deeper column of atmospheric moisture and thus experience greater suppression of the negative SWBTD dust signal. The second effect is, for a given dust AOD and for increasing TPW, the divergence of SWBTD for the family of dust layer heights. This behavior appears for values of AOD > 0.5 and is most prominent for high values of AOD. Here, very little impact of water vapor is seen for dust layers in the middle to upper atmosphere, while strong, non-linear impacts occur for the low-altitude dust. The spread of SWBTD within a family of dust layer heights over the range of TPW shown varies from a few degrees to 10∘, with values of 5–7 K for an optically thicker (AOD 0.5 to 2.0; for example see Fig. 5b) dust plume in the lower atmosphere.
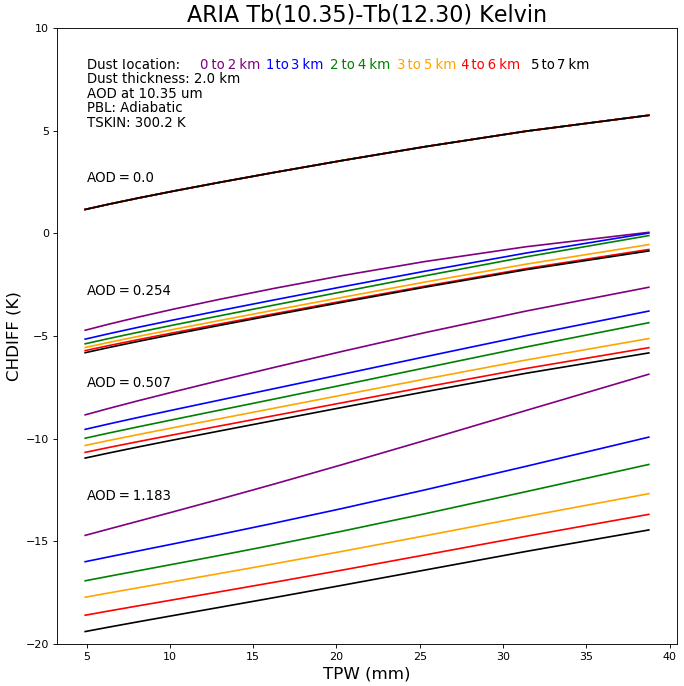
Figure 11SWBTD channel difference (CHDIFF) for clear-sky conditions and for various configurations of dust layer optical thickness and dust height (ARIA dust type), shown as a function of column-integrated atmospheric moisture (TPW).
Figure 12 compares the RTM analyses for ARIA, OPAC, and DB17 RI databases assuming the same effective dust particle radius, loading, and atmospheric profile assumptions as in Fig. 11. The expected sensitivity of the SWBTD signal to the dust layer height is evident in all three databases, with higher-altitude dust layers invariably producing stronger (i.e., more negative) SWBTD dust signals. Also, the higher water vapor concentrations of the moist profiles (TPW > 30 mm) result in weaker (i.e., less negative, or in some cases positive) SWBTD dust signals compared to the dry (TPW < 20 mm) profiles. The role of AOD is also evident: since the RI of DB17 yields a much lower 10.35 µm AOD, its associated SWBTD dust signals were weaker (less negative) than the other two databases. The ARIA database, based on a nearly pure quartz composition, produced the largest SWBTD dust signals. Interestingly, DB17 exhibits a greater spread among the dust layer altitudes for higher values of AOD (Fig. 12h, i). The more scattering nature of DB17 extinction at 12.30 µm compared to the other databases (ωo in Table 1) may produce a radiometrically cooler dust layer temperature than more absorbing dust layers – a signal becomes increasingly apparent as the influence of the overlying water vapor decreases as the dust layer's altitude is increased.
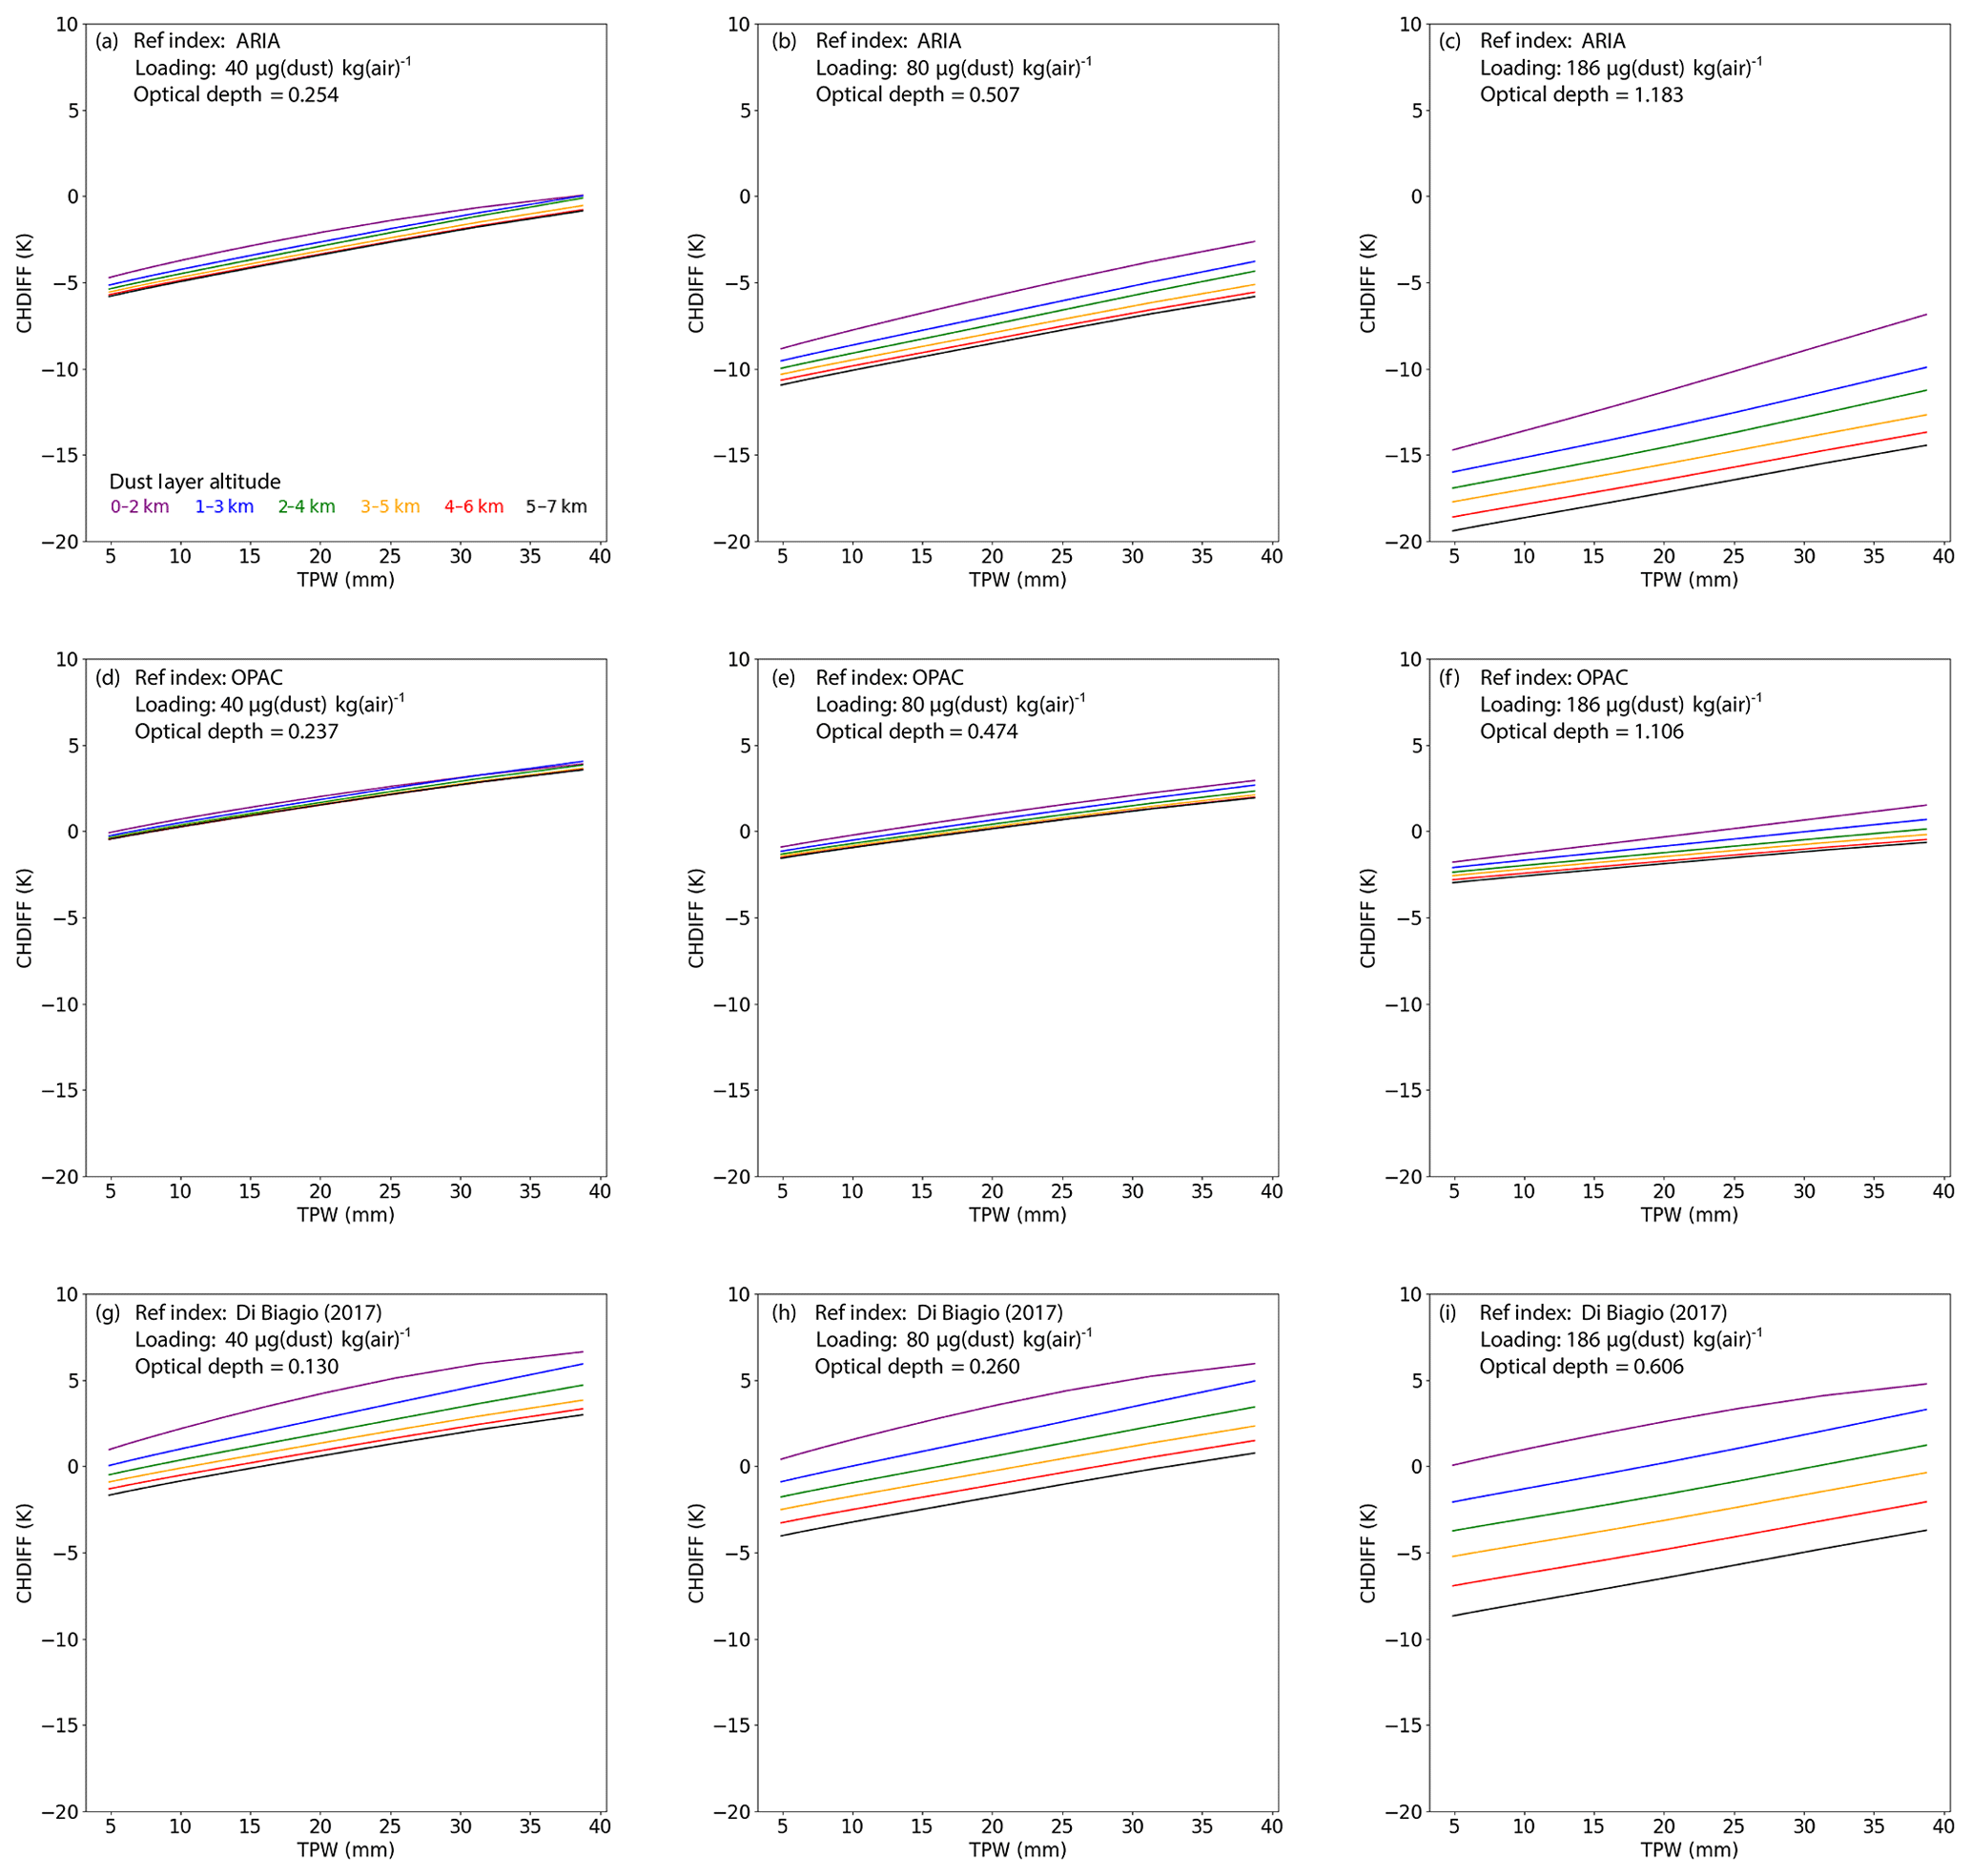
Figure 12Same as Fig. 11 but comparing the ARIA (a–c), OPAC (d–f), and Di Biagio (2017) (g–i) refractive index databases for common assumptions of dust loading.
Despite the differences in magnitude of signal among the three representative dust types considered, the trends in SWBTD associated with dust loading, atmospheric profiles, and the heights of the dust layers were similar in the dry atmosphere. Thus, whereas variation in the dust mineralogy cannot be neglected when considering the selection of SWBTD thresholds, it alone cannot explain the lack of a negative SWBTD dust signal as was observed in the 4 August 2016 missing plume case, particularly for the optically thick component of the missing plume residing over inland portions of the UAE. Thus, the role of water vapor must be considered for these IR-based dust detection techniques.
4.3 Simulated impacts of water vapor
One practical way to illustrate the impact of water vapor on SWBTD-based dust detection under more realistic (non-idealized) conditions is via radiative transfer simulations of the SWBTD conducted on the fully configurable environmental state of a forecast model. Specifically, we can examine the differential signal for dust as would be observed by a satellite for spatially varying lofted dust within an atmosphere with and without water vapor. A WRF–Chem forecast was used for this exercise, valid for 12:00 UTC on 4 August 2016. Whereas the model does not capture the exact details of the moisture and lofted dust distributions for this case, it is sufficiently representative to illustrate the impacts of water vapor on SWBTD-based dust detection. Figure 10 demonstrates the representativeness of the model's dust distribution for this case. For the radiative transfer calculations, again using the hybrid Eddington model of Deeter and Evans (1998) and following its implementation by Grasso and Greenwald (2004), we used dust concentration and spatial distribution as determined by WRF–Chem and assigned dust optical properties based on the ARIA database described in Sect. 4.2.
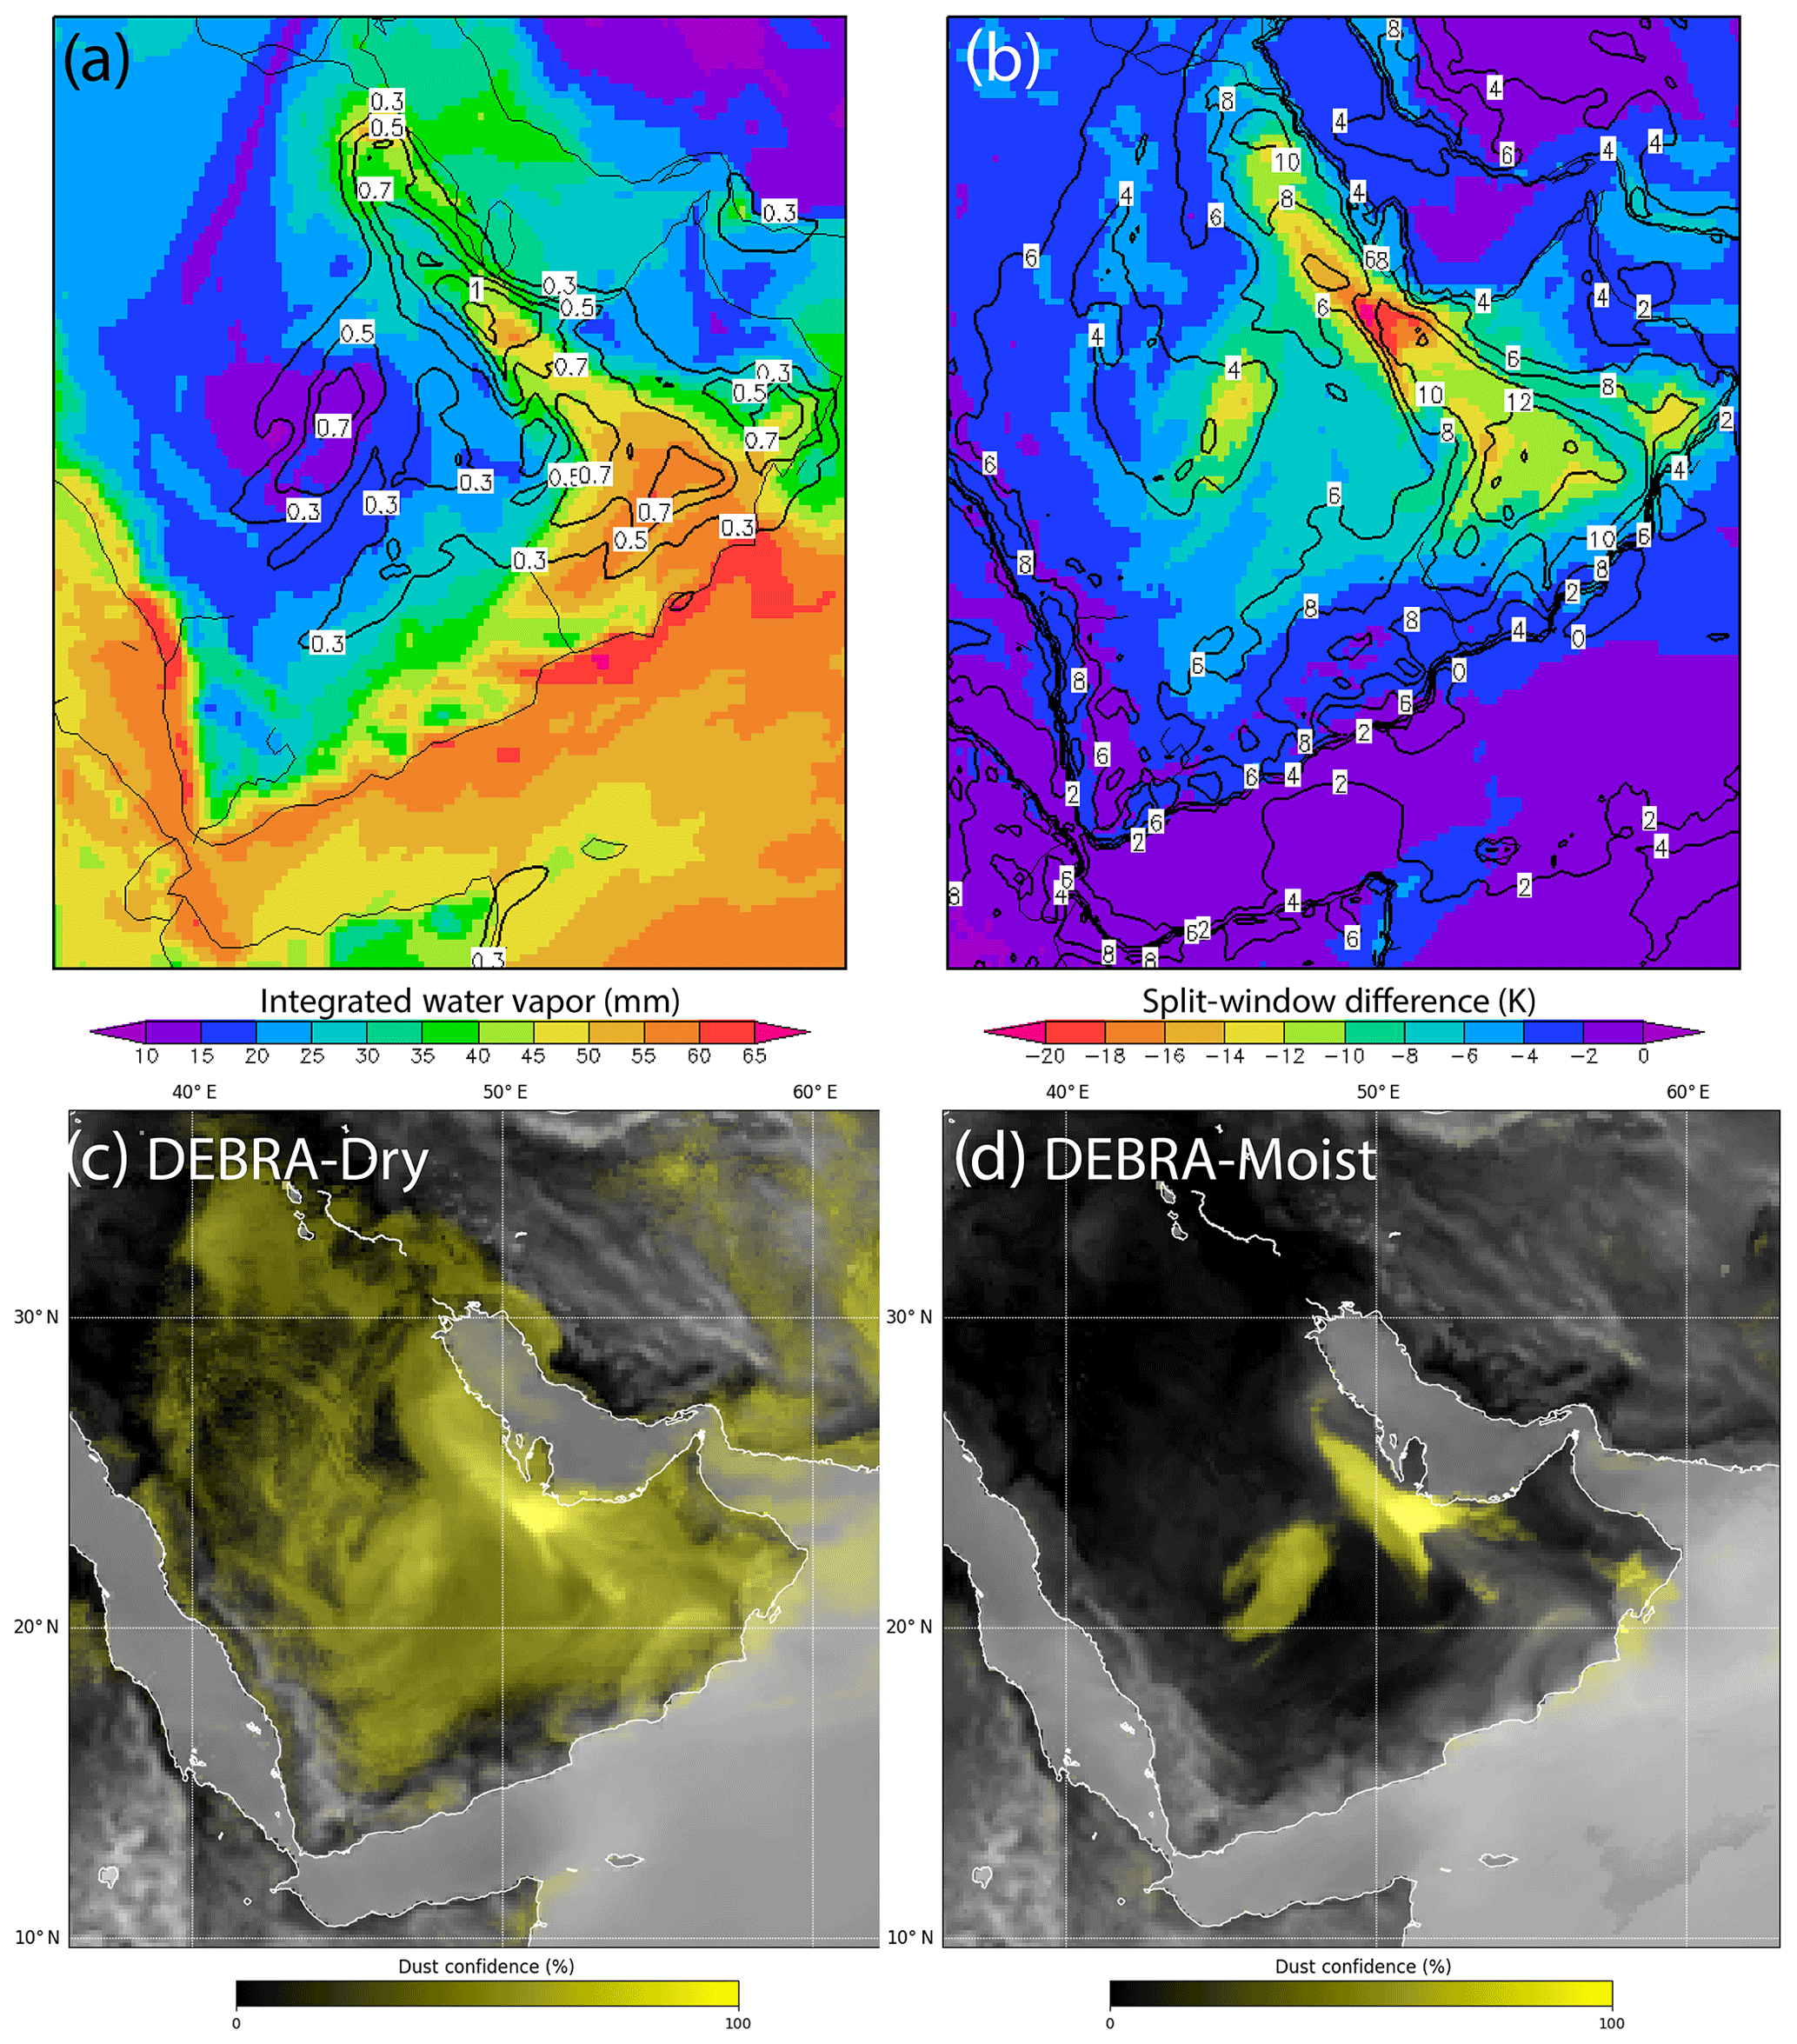
Figure 13Model-based analysis of water vapor impacts on SWBTD-based dust detection, based on a WRF–Chem simulation valid at 12:00 UTC on 4 August 2016. Panels show (a) shaded IWV overlaid by contours of aerosol optical depth at 10.35 µm, (b) shaded SWBTD for a dry atmosphere overlaid by contours of differences between the SWBTD computed for the full IWV field and for a dry atmosphere, (c) synthetic DEBRA imagery for a dry atmosphere, and (d) corresponding synthetic DEBRA imagery for the full IWV field.
The results of these simulations are shown in Fig. 13. Figure 13a shows the distribution of IWV in shading, and the location of dust plumes, in terms of the 10.35 µm AOD, as contours. Dust in the 1.4 µm WRF–Chem model size bin was used, as it provided the closest match to the DEBRA-based satellite observations of the dust distribution for this case. The two significant dust plumes are evident in the contours of Fig. 13a, although the model's moist air mass dust plume is displaced to the south and west of where it was observed (this shift is of no consequence for the illustration of water vapor impacts). Figure 13b shows in shading the SWBTD dust signal for a “dry” (i.e., water vapor mixing ratios were set to vanishingly small values of g kg−1 at all levels) atmosphere. The differential effect of moisture on this signal, shown as contours in Fig. 13b, is defined as SWBTD (moist) minus SWBTD (dry). In this case, “moist” pertains to the original distribution of atmospheric moisture in the model. Positive values of this difference show how column moisture is making the SWBTD less negative and thus weakening the observable dust signal that is used for dust enhancement by algorithms such as DEBRA.
The impacts to DEBRA can be evaluated directly, by producing a suite of synthetic observations and running these through the DEBRA algorithm. Based on this approach, Fig. 13c shows how DEBRA would perform in a completely dry environment and under the assumption that the background is completely characterized. Here, the region of the non-zero dust detection confidence factor is widespread and is indicative of the pervasive dust suspension in this model run. Figure 13d shows the effects of DEBRA dust detection suppression by the inclusion of atmospheric moisture for the exact same model distribution of lofted dust. While parts of the two significant dust plumes remain enhanced in the full-atmosphere simulation, the preferential suppression of the dust signal particularly in moist regions is very evident. This synthetic DEBRA performance is consistent with the idealized single-column simulations of Sect. 4.2, and its structure is anticipated by the location of significant positive-valued contours in Fig. 13b. These simulated results are also consistent with the observed disparity in IR-based dust detection for the dry and moist environment dust plumes.
Considering the modeled sensitivity of the SWBTD dust signal to column water vapor and to the location of the dust in the profile, we examined to what extent the detection might be improved by incorporating atmospheric column moisture and expected dust layer altitude as a priori information into SWBTD-based detection algorithms. Whereas the DEBRA dust enhancement enlists a dynamic lower boundary (accounting for a spatially and temporally varying land surface emissivity signal) for its scaling of the SWBTD, its upper boundary is held fixed. Moreover, both scaling bounds are predicated on an implicit assumption of a characteristic or climatological column moisture value (monthly means, computed over several years of observations). Considering these assumptions, it is not surprising that DEBRA would struggle when confronted with a situation of anomalous moisture, such as encountered in the current case study.
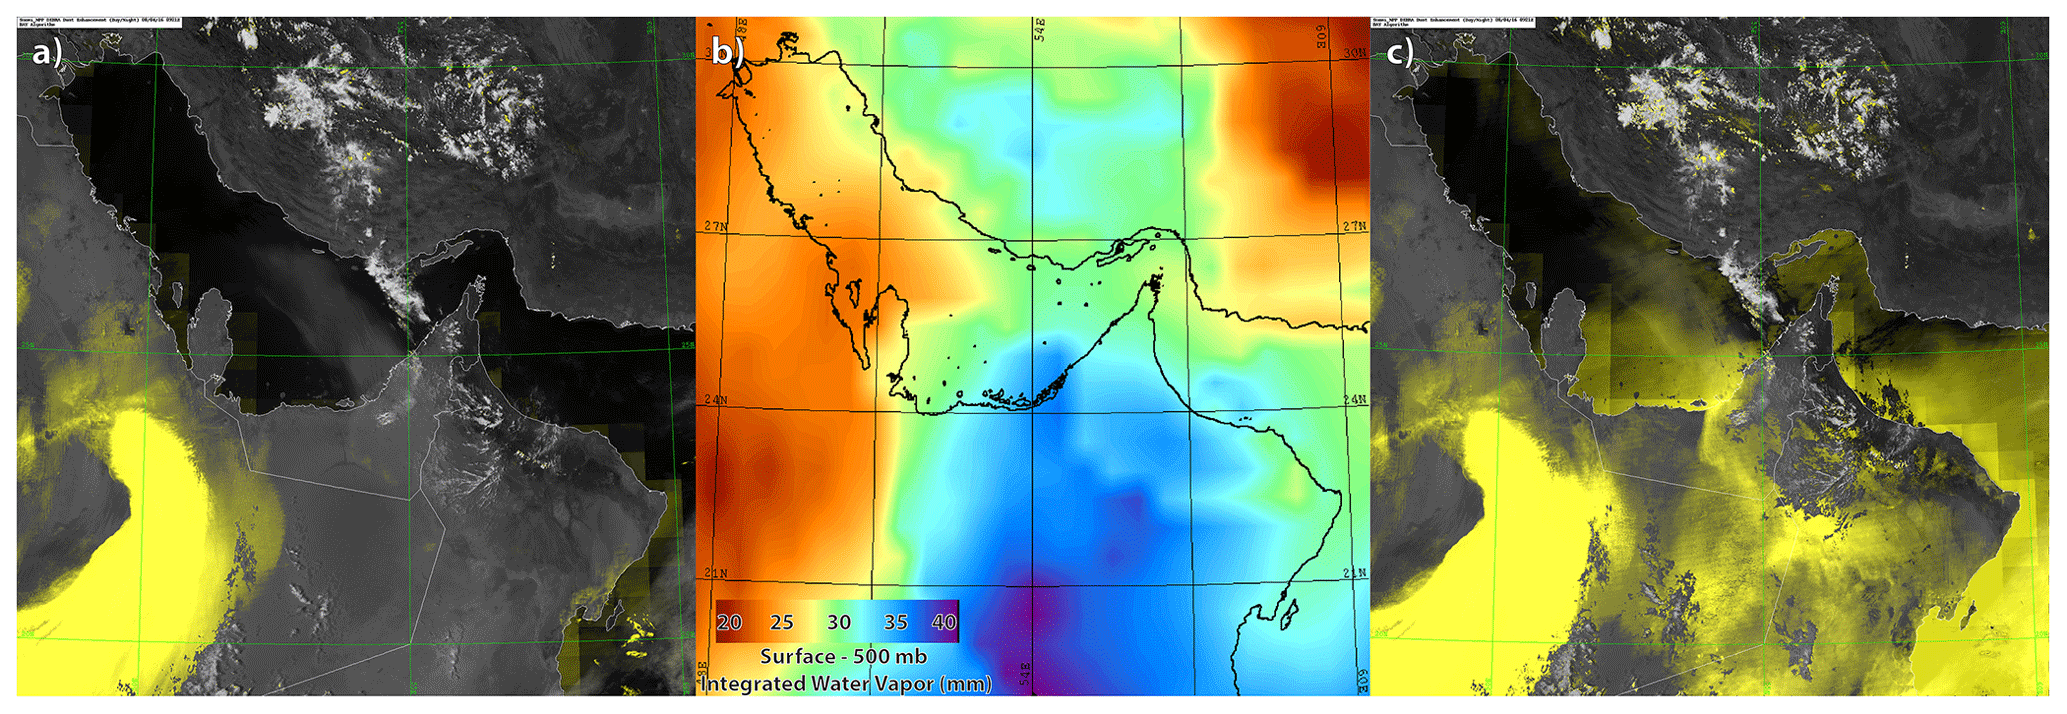
Figure 14(a) Original DEBRA (Fig. 4a) dust enhancement, (b) NUCAPS surface-to-500 hPa IWV (via Fig. 9a) used as an index to modulate the SWBTD, and (c) the revised DEBRA dust enhancement with IWV-modulated SWBTD thresholds applied, capturing significant portions of the missing dust plume both on- and offshore.
To examine the potential of moisture information to improve SWBTD dust detection performance, we enlisted the self-contained multi-sensor observing system of VIIRS, CrIS and ATMS (the last two sensors providing the NUCAPS retrievals) on Suomi NPP. First, NUCAPS surface-to-500 hPa IWV data (shown in Fig. 9) were remapped to the VIIRS domain (Fig. 4) via a bilinear interpolation. To provide a first-order index for modulating the SWBTD thresholds, these IWV data were then normalized between low and high bounds of 25 and 45 mm (i.e., set to 0.0 below 25 mm, 1.0 above 45 mm, and ranging linearly in between), respectively. Based on the simulated dynamic range of SWBTD for moderate to optically thick dust residing in the lower atmosphere (e.g., Fig. 11; AOD = 1.183, 0–2 km) as observed by CALIOP and CATS (Figs. 6–7) for this case, we selected an additive shift factor of a 7 K magnitude. This magnitude was multiplied with the IWV normalized term such that zero shift to the SWBTD threshold was applied to the low-bound range of IWV, a maximum positive shift of 7 to the high-bound IWV, and variable shift magnitudes varying linearly for 0 to 7 in between.
The shift factor was introduced to a modified version of the DEBRA algorithm as a first-order correction to the SWBTD dust signal dampening effect of IWV – applied on a per pixel basis (i.e., spatially resolved) to both the cloud mask restoral and the SWBTD dust detection tests. The results of this procedure, applied to the Suomi NPP observations from 09:21 UTC, 4 August 2016, are shown in Fig. 14. Figure 14a is a reproduction of the original DEBRA dust enhancement (Fig. 4a), Fig. 14b shows the remapped NUCAPS surface-to-500 hPa IWV (Fig. 9a), and Fig. 14c is the modified DEBRA result.
Evident in Fig. 14c are portions of the previously missing dust storm over eastern portions of the southeastern Arabian Peninsula region. While the enhancements follow the general structure of the elevated IWV region, some areas nested therein remain unenhanced by DEBRA, while other areas appear enhanced above and beyond what the structure of the linear IWV shift would have suggested. The region of south-central Iran, for example, remains unenhanced (except for some cloud-edge artifacts). Also, the overland portion of the missing plume along the north-central coastal region of the UAE shows a clear demarcation between the inland dust and relatively clear air to the west. Newly enhanced dust over the eastern UAE, northern Oman, and into the SG agrees with regions discernable from true color (Fig. 4a). The divergent patterns between IWV and enhancement in these areas give confidence that the IWV shift is not simply imparting an image of itself and masquerading as enhanced dust.
Overwater performance, inherently more difficult for SWBTD techniques, is seen to be variable in Fig. 14c. The region of dust over the SG is detected, but not well isolated, in the modified DEBRA. The overwater enhancements follow more of the IWV shift structure, although the presence of dust in these overwater regions is not likely to be a false alarm. A lidar overpass (not shown) from CATS from 4 August, which did not cross SG but transected a region just to the east in the north-central Gulf of Oman, confirmed the presence of widespread background dust from the surface to 5 km, reminiscent of the structures seen in Figs. 5 and 6. Thus, the structure of enhancement in overwater dusty regions may follow as an artifact of the IWV shift pattern, with modulations therein tied to variations of dust optical depth and altitude.
Further improvements to the performance of the IWV-indexed SWBTD dust detection method would require modulation of the IWV shift factor as a function of an assumed dust vertical profile. If limited-coverage lidar information were available from satellite, surface, or aerial platforms, it could provide a first guess of the vertical distribution of dust across a region (e.g., Miller et al., 2014). Alternatively, model information may provide an estimate of the levels in which dust is most likely to reside. Likewise, in the absence of simultaneous satellite retrievals (e.g., NUCAPS) of column IWV, model information may also be used to provide a best guess at the atmospheric moisture profile. Data assimilation methods which consider the covariance between dust and other environmental state parameters (e.g., Zupanski et al., 2018) may also be enlisted to refine this method.
The synergy of numerical modeling, multi-sensor satellite observations, and radiative transfer calculations for varying aerosol micro- and macrophysical properties offers a unique, multidimensional perspective on a challenging Middle Eastern dust event. Collectively, they tell a tale of two dust storms embedded within and responding to the dynamics of their parent air masses – one leading to “the best of times” and the other to “the worst of times” in terms of SWBTD dust detection performance. Based on this multi-component analysis, we arrive at the following salient conclusions:
-
Despite the dynamic lower-bound of SWBTD threshold used in DEBRA, which mitigates terrain false-alarm effects, the absolute bounds and range of SWBTD scaling are predicated on an implicit climatological column water vapor assumption. This condition leads to sub-optimal or outright failure of dust detection in situations of anomalously high moisture that depart from those assumptions.
-
The unique topography of the southeastern Arabian Peninsula and surroundings provides for one such anomalous air mass environment: a southerly surge capable of lofting significant dust via a variety of mechanisms. These sources are embedded within a maritime (moist) air mass originating from the northern Arabian Sea.
-
The effects of the moist air mass on the SWBTD are to impart a positive bias which depends on the amount of water vapor above the dust layer, and hence the altitude of the dust layer, as well as the lapse rate and surface temperature. Idealized and model simulations for moist and dry characteristic air masses indicate a spread of possible SWBTD based on dust composition assumptions and provide a basis for introducing a modulation to the SWBTD indexed to the surface-to-500 hPa integrated water vapor.
-
Based on these simulations and the incorporation of NUCAPS IWV information, a new approach to modulating the DEBRA SWBTD dust detection logic was proposed and demonstrated – yielding improved detection for a dust plume embedded in deep column moisture. Results are promising for overland plumes, with mixed performance over water, suggesting the need for further constraints on the vertical distribution of dust.
Overall, this study underscores the important roles of atmospheric moisture and dust vertical structure in satellite-based SWBTD detectability of lofted mineral dust. Demonstrated here for the Arabian Peninsula, these challenges are germane to other regions of the world – wherever arid and semi-arid regimes juxtapose with tropical and maritime humid air masses. At such interfaces, intrusions of anomalous air masses will influence SWBTD performance. This study demonstrates that with a priori information on the moisture profile and dust altitude (e.g., from lidar information as was available here or by some other informed assumption), a limited ability to improve the analysis of dust is possible.
This research finds promise in the incorporation of water-vapor-indexed information, either retrieved or modeled, into the SWBTD dust detection techniques. As such, these results point to the benefits of multi-sensor applications and model fusion. Whenever possible, combining IR with visible and/or active sensor (when available) information will reduce detection ambiguity over both land and water backgrounds. If active sensor information is available even for a local cross section (e.g., as provided by CALIOP or CATS curtain observations), constraints on aerosol layer height within a given environment would enable a more dynamic SWBTD algorithm that could yield further improvements to dust detection. A priori information on aerosol layer heights could also be provided by numerical modeling, which can incorporate intermittent past observations on the aerosol profile (e.g., from lidar) and carry that information forward to the current observation time via the model forecast.
Additional papers exploring diverse topics, including model-based aerosol distribution and property sensitivity analyses (Bukowski et al., 2019; Saleeby et al., 2019) and new three-dimensional model visualization approaches (Albers et al., 2019), augment the HAALE-MURI research conducted for this case study. Interested researchers are encouraged to contact the authors of this paper and others of the ACP/AMT special issue to collaborate on aerosol remote sensing techniques, process characterization and forecasting topics of mutual interest.
Satellite data sets used in this research can be requested from public sources:
VIIRS and NUCAPS from http://class.noaa.gov (last access: 9 September 2019), MODIS from http://modis.gsfc.nasa.gov (last access: 9 September 2019), AIRS from http://airs.jpl.nasa.gov (last access: 9 September 2019), CALIPSO from http://eosweb.larc.nasa.gov (last access: 9 September 2019), CATS from http://cats.gsfc.nasa.gov (last access: 9 September 2019), and MSG from http://www.eumetsat.int (last access: 9 September 2019). The WRF-Chem model is available from http://www2acom.ucar.edu/wrf-chem (last access: 9 September 2019). The NAVGEM and NRL Dust Source Data base are maintained by the Naval Research Laboratory, Monterey (http://nrl.navy.mil/field-sites/monterey (last access: 9 September 2019)). Finally, the Aerosol Refractive Index Archive (ARIA) is located at http://eodg.atm.ox.ac.uk/ARIA (last access: 9 September 2019).
The supplement related to this article is available online at: https://doi.org/10.5194/amt-12-5101-2019-supplement.
SDM conceived the study based on an event first identified by JR and prepared the paper with the help of all co-authors. LG, QB, SK, XX, and CC supported radiative transfer calculations and dust optical property analyses. JD, JS, YW, and JW provided satellite data, tools, and analysis. AW conducted the synoptic-scale analysis, and JB, SCvdH, TCW, and MZ provided model data supporting case interpretation.
The authors declare that they have no conflict of interest.
This article is part of the special issue “Holistic Analysis of Aerosol in Littoral Environments – A Multidisciplinary University Research Initiative (ACP–AMT inter-journal SI)”. It is not associated with a conference.
The support of the Office of Naval Research and the NOAA Joint Polar Satellite System (JPSS) program office are gratefully acknowledged.
We acknowledge the use of imagery from the NASA Worldview application (https://worldview.earthdata.nasa.gov/, last access: 9 September 2019), which is part of the NASA Earth Observing System Data and Information System (EOSDIS).
This research has been supported by the Office of Naval Research (grant no. N00014-16-1-2040).
This paper was edited by Sebastian Schmidt and reviewed by Michael Folmer and Michael Garay.
Ackerman, S. A.: Using the radiative temperature difference at 3.7 and 11 µm to track dust outbreaks, Remote Sens. Environ., 27, 129–133, 1989.
Albers, S., Saleeby, S., Kreidenweis, S., Bian, E., Xian, P., Toth, Z., and Miller, S. D.: A fast visible wavelength 3-D radiative transfer procedure for NWP visualization and forward modeling, Appl. Chem. Phys., submitted, 2019.
Baran, A. J., Shcherbakov, V. N., Baker, B. A., Gayet, J. F., and Lawson, R. P.: On the scattering phase function of non-symmetric ice-crystals, Q. J. Roy. Meteorol. Soc., 131, 2609–2616, 2005.
Benedetti, A., Reid, J. S., Knippertz, P., Marsham, J. H., Di Giuseppe, F., Rémy, S., Basart, S., Boucher, O., Brooks, I. M., Menut, L., Mona, L., Laj, P., Pappalardo, G., Wiedensohler, A., Baklanov, A., Brooks, M., Colarco, P. R., Cuevas, E., da Silva, A., Escribano, J., Flemming, J., Huneeus, N., Jorba, O., Kazadzis, S., Kinne, S., Popp, T., Quinn, P. K., Sekiyama, T. T., Tanaka, T., and Terradellas, E.: Status and future of numerical atmospheric aerosol prediction with a focus on data requirements, Atmos. Chem. Phys., 18, 10615–10643, https://doi.org/10.5194/acp-18-10615-2018, 2018.
Bukowski, J. and van den Heever, S. C.: Effect of horizontal model resolution on the convective redistribution of mineral dust over the Arabian Peninsula, Appl. Chem. Phys., submitted, 2019.
Cho, H.-M., Nasiri, S. L., Yang, P., Laszlo, I., and Zhao, X.: Detection of Optically Thin Mineral Dust Aerosol Layers over the Ocean Using MODIS, J. Atmos. Ocean. Tech., 30, 896–916, 2013.
Cotton, W. R., Pielke Sr., R. A., Walko, R. L., Liston, G. E., Tremback, C. J., Jiang, H., McAnelly, R. L., Harrington, J. Y., Nicholls, M. E., Carrio, G. G., and McFadden, J. P.: RAMS 2001: Current status and future directions, Meteor. Atmos. Phys., 82, 5–29, 2003.
Deeter, M. and Evans, K. F.: A hybrid Eddington–single scatter radiative transfer model for computing radiances from thermally emitting atmospheres, J. Quant. Spectrosc. Ra., 60, 635–648, 1998.
Di Biagio, C., Formenti, P., Balkanski, Y., Caponi, L., Cazaunau, M., Pangui, E., Journet, E., Nowak, S., Caquineau, S., Andreae, M. O., Kandler, K., Saeed, T., Piketh, S., Seibert, D., Williams, E., and Doussin, J.-F.: Global scale variability of the mineral dust long-wave refractive index: a new dataset of in situ measurements for climate modeling and remote sensing, Atmos. Chem. Phys., 17, 1901–1929, https://doi.org/10.5194/acp-17-1901-2017, 2017.
Frolov, S., Bishop, C. H., Holt, T., Cummings, J., and Kuhl, D.: Facilitating strongly coupled ocean-atmosphere data assimilation with an interface solver, Mon. Weather Rev., 144, 3–20, 2016.
Gambacorta, A. and Barnet, C.: Methodology and information content of the NOAA NESDIS operational channel selection for the Cross-Track Infrared Sounder (CrIS), IEEE T. Geosci. Remote, 51, 3207–3216, https://doi.org/10.1109/TGRS.2012.2220369, 2013.
Grant, L. D. and van den Heever, S. C.: Aerosol-cloud-land surface interactions within tropical sea breeze convection, J. Geophys. Res., 119, 8340–8361, 2014.
Grasso, L. D. and Greenwald, T. J.: Analysis of 10.7 mm brightness temperatures of a simulated thunderstorm with two-moment microphysics, Mon. Weather Rev., 132, 815–825, 2004.
Grell G. A., Peckham, S. E., Schmitz, R., McKeen, S. A., Frost, G., Skamarock, W. C., and Eder, B.: Fully coupled 'online' chemistry in the WRF model, Atmos. Environ., 39, 6957–6976, 2005.
Hansell, R. A., Ou, S. C., Liou, K. N., Roskovensky, J. K., Tsay, S. C., Hsu, C., and Ji, Q.: Simultaneous detection/separation of mineral dust and cirrus clouds using MODIS thermal infrared window data, Geophys. Res. Lett., 34, L11808, https://doi.org/10.1029/2007GL029388, 2007.
Hansell Jr., R. A., Reid, J. S., Tsay, S. C., Roush, T. L., and Kalashnikova, O. V.: A sensitivity study on the effects of particle chemistry, asphericity and size on the mass extinction efficiency of mineral dust in the earth's atmosphere: from the near to thermal IR, Atmos. Chem. Phys., 11, 1527–1547, https://doi.org/10.5194/acp-11-1527-2011, 2011.
Hansen, J. E. and Travis, L. D.: Light scattering in planetary atmospheres, Space Sci. Rev., 16, 527–610, 1974.
Herman, J., Bhartia, P., Torres, O., Hsu, C., Seftor, C., and Celarier, E.: Global distribution of UV-absorbing aerosols from Nimbus 7/TOMS data, J. Geophys. Res., 102, 16911–16922, 1997.
Hess, M., Koepke, P., and Schult, I.: Optical properties of aerosols and clouds: The software package OPAC, B. Am. Meteorol. Soc., 79, 831–844, 1998.
Hogan, T. F., Liu, M., Ridout, J. A., Peng, M. S., Whitcomb, T. R., Ruston, B. C., Reynolds, C. A., Eckermann, S. D., Moskaitis, J. R., Baker, N. L., McCormack, J. P., Viner, K. C., McLay, J. G., Flatau, M. K., Xu, L., Chen, C., and Chang, S. W.: The Navy Global Environmental Model, Oceanography, 27, 116–125, 2014.
Hsu, N. C., Tsay, S.-C., King, M. D., and Herman, J. R.: Aerosol properties over bright reflecting source regions, IEEE T. Geosci. Remote, 42, 557–569, 2004.
Hsu, N. C., Jeong, M.-J., Bettenhausen, C., Sayer, A. M., Hansell, R., Seftor, C. S., Huang, J., and Tsay, S.-C.: Enhanced Deep Blue aerosol retrieval algorithm: the second generation, J. Geophys. Res., 118, 9296–9315, 2013.
Hunt, W. H., Winker, D. M., Vaughan, M. A., Powell, K. A., Lucker, P. L., and Weimer, C.: CALIPSO lidar description and performance assessment, J. Atmos. Ocean. Tech., 26, 1214–1228, 2009.
Igel, A. L., van den Heever, S. C., and Johnson, J. S.: Meteorological and land surface properties impacting sea breeze extent and aerosol distribution in a dry environment, J. Geophys. Res., 123, 22–37, 2018.
Klüser, L., Di Biagio, C., Kleiber, P. D., Formenti, P., and Grassian, V. H.: Optical properties of non-spherical desert dust particles in the terrestrial infrared – An asymptotic approximation approach, J. Quant. Spectrosc. Ra., 178, 209–223, https://doi.org/10.1016/j.jqsrt.2015.11.020, 2016.
Legrand, M., Plana-Fattori, A., and N'doumé, C.: Satellite detection of dust using the IR imagery of Meteosat: 1. Infrared difference dust index, J. Geophys. Res., 106, 18251–18274, 2001.
Lensky, I. M. and Rosenfeld, D.: Clouds-Aerosols-Precipitation Satellite Analysis Tool (CAPSAT), Atmos. Chem. Phys., 8, 6739–6753, https://doi.org/10.5194/acp-8-6739-2008, 2008.
Lindsey, D. T., Grasso, L., Dostalek, J. F., and Kerkmann, J.: Use of the GOES-R split-window difference to diagnose deepening low-level water vapor, J. Appl. Meteorol. Clim., 53, 2005–2016, 2014.
McGill, M. J., Yorks, J. E., Scott, V. S., Kupchock, A. W., and Selmer, P. A.: The Cloud-Aerosol Transport System (CATS), 2015: A technology demonstration on the International Space Station, Proc. SPIE, 9612, https://doi.org/10.1117/12.2190841, 2015.
McMillin, L.: Estimation of sea surface temperatures from two infrared window measurements with different absorption, J. Geophys. Res., 80, 5113–5117, 1975.
Meng, Z., Yang, P., Kattawar, G. W., Bi, L., Liou, K. N., and Laszlo, I.: Single-scattering properties of nonspherical mineral dust aerosols: A database for application to radiative transfer calculations, J. Aerosol Sci., 41, 501–512, 2010.
Miller, S. D.: A consolidated technique for enhancing desert dust storms with MODIS, Geophys. Res. Lett., 30, 2071, https://doi.org/10.1029/2003GL018279, 2003.
Miller, S. D., Kuciauskas, A. P., Liu, M., Ji, Q., Reid, J. S., Breed, D. W., Walker, A. L., and Mandoos, A. A.: Haboob dust storms of the southern Arabian Peninsula, J. Geophys. Res., 113, D01202, https://doi.org/10.1029/2007JD008550, 2008.
Miller, S. D., Forsythe, J. M., Partain, P. T., Haynes, J. M., Bankert, R. L., Sengupta, M., Mitrescu, C., Hawkins, J. D., and Vonder Haar, T. H.: Estimating three-dimensional cloud structure from statistically blended active and passive sensor observations, J. Appl. Meteor. Clim., 53, 437–455, 2014.
Miller, S. D., Bankert, R. L., Solbrig, J. E., Forsythe, J. M., Noh, Y.-J., and Grasso, L.: A dynamic enhancement with background reduction algorithm: Overview and application to satellite-based dust storm detection, J. Geophys. Res., 122, 12938–12959, https://doi.org/10.1002/2017JD027365, 2017.
Nabavi, S. O., Haimberger, L., and Samimi, C.: Climatology of dust distribution over West Asia from homogenized remote sensing data, Aeolian Res., 21, 93–107, 2016.
Nalli, N. R., Barnet, C. D., Reale, T., Liu, Q., Morris, V. R., Spackman, J. R., Joseph, E., Tan, C., Sun, B., Tilley, F., Ruby, L., and Wolfe., D.: Satellite sounder observations of contrasting tropospheric moisture transport regimes: Saharan air layers, Hadley cells, and atmospheric rivers, J. Hydrometeor., 17, 2997–3006, 2016.
Penny, S. G. and Hamill, T. M.: Coupled data assimilation for integrated earth system analysis and prediction, B. Am. Meteorol. Soc., 98, 169–172, https://doi.org/10.1175/BAMS-D-17-0036.1, 2017.
Peterson, J. T. and Weinman, J. A.: Optical properties of Quartz dust particles at Infrared Wavelengths, J. Geophys. Res., 74, 6947–6952, 1969.
Qu, J. J., Hao, X., Kafatos, M., and Wang, L.: Asian dust storm monitoring combining Terra and Aqua MODIS SRB measurements, IEEE Geosci. Remote Sens. Lett., 3, 484–486, 2006.
Reid, J. S., Piketh, S. J., Walker, A. L., Burger, R. P., Ross, K. E., Westphal, D. L., Bruintjes, R. T., Holben, B. N., Hsu, C., Jensen, T. L., Kahn, R. A., Kuciauskas, A. P., Mandoos, A. A., Mangoosh, A. A., Miller, S. D., Porter, J. N., Reid, E. A., and Tsay, S.-C.: An overview of UAE flight operations: observations of summertime atmospheric thermodynamics and aerosol profiles of the southern Arabian Gulf, J. Geophys. Res., 113, D14213, https://doi.org/10.1029/2007JD009435, 2008.
Saleeby, S. M. and van den Heever, S. C.: Developments in the CSU-RAMS Aerosol Model: Emissions, Nucleation, Regeneration, Deposition, and Radiation, J. Appl. Meteor. Climatol., 52, 2601–2622, 2013.
Saleeby, S. M., van den Heever, S. C., Bukowski, J., Walker, A. L., Solbrig, J. E., Atwood, S. A., Bian, Q., Kreidenweis, S. M., Wang, Y., Wang, J., and Miller, S. D.: The influence of simulated surface dust lofting and atmospheric loading on radiative forcing, Atmos. Chem. Phys., 19, 10279–10301, https://doi.org/10.5194/acp-19-10279-2019, 2019.
Salisbury, J. W., Hapke, B., and Eastes, J. W.: Usefulness of weak bands in the midinfrared remote sensing of particulate planetary surfaces, J. Geophys. Res., 92, 702–710, 1987.
Seigel, R. B. and van den Heever, S. C.: Dust lofting and ingestion by supercell storms, J. Atmos. Sci., 69, 1453–1473, 2012.
Shenk, W. E. and Curran, R. J.: The detection of dust storms over land and water with satellite visible and infrared measurements, Mon. Weather Rev., 102, 830–837, 1974.
Strabala, K. I., Ackerman, S. A., and Menzel, W. P.: Cloud properties inferred from 8–12 µm data, J. Appl. Meteorol., 33, 212–229, 1994.
Tanré, D. and Legrand, M.: On the satellite retrieval of Saharan dust optical thickness over land: Two different approaches, J. Geophys. Res., 96, 5221–5227, 1991.
Torres, O., Bhartia, P. K., Herman, J. R., Ahmad, Z., and Gleason, J.: Derivation of aerosol properties from satellite measurements of backscattered ultraviolet radiation: Theoretical basis, J. Geophys. Res., 103, 17099–17110, 1998.
Torres, O., Tanskanen, A., Veihelmann, B., Ahn, C., Braak, R., Bhartia, P. K., Veefkind, P., and Levelt, P.: Aerosols and surface UV products from ozone monitoring instrument observations: An overview, J. Geophys. Res., 112, D24S47, https://doi.org/10.1029/2007JD008809, 2007.
Tramutoli, V.: Robust satellite techniques for natural and environmental hazards monitoring and mitigation: Ten years of successful applications, in: Proc. 9th Int. Symp on Physical Measurements and Signatures in Remote Sensing (Vol. XXXVI (7/W20), pp. 792–795), edited by: Liang, S., et al., ISPRS, Beijing, China, 2005.
Tramutoli, V.: Robust satellite techniques (RST) for natural and environmental hazards monitoring and mitigation: Theory and applications, Proceedings of Multitemp, https://doi.org/10.1109/MULTITEMP.2007.4293057, 2007.
van den Heever, S. C., Carrio, G. G., Cotton, W. R., DeMott, P. J., and Prenni, A. J.: Impacts of nucleating aerosol on Florida storms, Part I: Mesoscale simulations, J. Atmos. Sci., 63, 1752–1775, 2006.
Wald, A. E., Kaufman, Y. J., Tanré, D., and Gao, B.-C.: Daytime and nighttime detection of mineral dust over desert using infrared spectral contrast, J. Geophys. Res., 103, 32307–32313, 1998.
Walker, A. L., Liu, M., Miller, S. D., Richardson, K. A., and Westphal, D. L.: Development of a dust source database for mesoscale forecasting in southwest Asia, J. Geophys. Res., 114, D18207, https://doi.org/10.1029/2008JD011541, 2009.
Wan Z. and Dozier, J.: A generalized split-window algorithm for retrieving land-surface temperature from space, IEEE T. Geosci. Remote, 34, 892–905, 1996.
Winker, D. M., Vaughan, M. A., Omar, A., Hu, Y., Powell, K. A., Liu, Z., Hunt, W. H., and Young, S. A.: Overview of the CALIPSO mission and the CALIOP data processing algorithms, J. Atmos. Ocean. Tech., 26, 2310–2323, 2009.
Xu, X., Wang, J., Wang, Y., Zeng, J., Torres, O., Yang, Y., Marshak, A., Reid, J., and Miller, S. D.: Passive remote sensing of altitude and optical depth of dust plumes using the oxygen A and B bands: First results from EPIC/DSCOVR at Lagrange-1 point, Geophys. Res. Lett., 44, 7544–7554, https://doi.org/10.1002/2017GL073939, 2017.
Xu, X., Wang, J., Wang, Y., Zeng, J., Torres, O., Reid, J. S., Miller, S. D., Martins, J. V., and Remer, L. A.: Detecting layer height of smoke aerosols over vegetated land and water surfaces via oxygen absorption bands: hourly results from EPIC/DSCOVR in deep space, Atmos. Meas. Tech., 12, 3269–3288, https://doi.org/10.5194/amt-12-3269-2019, 2019.
Zupanski, M.: Data assimilation for coupled modeling systems, Data Assimilation for Atmospheric, Oceanic, and Hydrologic Applications (Vol. III), edited by: Park, S. K. and Xu, L., Springer, Berlin, 553 pp., https://doi.org/10.1007/978-3-319-43415-5, 2017.
- Abstract
- Introduction
- Satellite-based dust detection methods
- Case study description: Middle East dust storms, 3–4 August 2016
- Idealized dust sensitivity analysis
- A vapor-indexed dust detection method
- Summary and conclusion
- Data availability
- Author contributions
- Competing interests
- Special issue statement
- Acknowledgements
- Financial support
- Review statement
- References
- Supplement