the Creative Commons Attribution 4.0 License.
the Creative Commons Attribution 4.0 License.
 | 18 Oct 2019
Sulfur dioxide layer height retrieval from Sentinel-5 Precursor/TROPOMI using FP_ILM
Dmitry S. Efremenko
Diego G. Loyola
Robert Spurr
Lieven Clarisse
The accurate determination of the location, height, and loading of sulfur dioxide (SO2) plumes emitted by volcanic eruptions is essential for aviation safety. The SO2 layer height is also one of the most critical parameters with respect to determining the impact on the climate. Retrievals of SO2 plume height have been carried out using satellite UV backscatter measurements, but, until now, such algorithms are very time-consuming. We have developed an extremely fast yet accurate SO2 layer height retrieval using the Full-Physics Inverse Learning Machine (FP_ILM) algorithm. This is the first time the algorithm has been applied to measurements from the TROPOMI instrument onboard the Sentinel-5 Precursor platform. In this paper, we demonstrate the ability of the FP_ILM algorithm to retrieve SO2 plume layer heights in near-real-time applications with an accuracy of better than 2 km for SO2 total columns larger than 20 DU. We present SO2 layer height results for the volcanic eruptions of Sinabung in February 2018, Sierra Negra in June 2018, and Raikoke in June 2019, observed by TROPOMI.


Global satellite observations allow for the timely detection and monitoring of SO2 emitted from volcanic eruptions, even in remote regions, where no ground-based instruments are installed (see, e.g., Fioletov et al., 2013). Satellite measurements of UV earthshine spectra in the wavelength range between 305 and 335 nm provide the highest sensitivity to SO2 in the Earth's atmosphere. Volcanic eruptions can inject large amounts of sulfur dioxide (SO2) into the atmosphere, where it is either subject to wet and dry deposition, as well as oxidization within a few days in the troposphere (see, e.g., Lee et al., 2011 or Myles et al., 2011), or oxidization over a period of several weeks to sulfate aerosols in the stratosphere (see, e.g., Robock, 2000; Forster et al., 2007 and von Glasow et al., 2009). Sulfate aerosols can affect the Earth's radiative forcing and have an impact on clouds (see, e.g., McCormick et al., 1995; Robock, 2000 and Malavelle et al., 2017).
Based on UV earthshine measurements, SO2 vertical column densities (VCDs) can be retrieved easily using techniques such as differential optical absorption spectroscopy (DOAS; see, e.g., Rix et al., 2012), a principal component analysis (PCA; see, e.g., Li et al., 2017), or the Krueger–Kerr algorithm, which was applied to retrieve SO2 from NASA TOMS (see, e.g., Krueger et al., 1995). These methods are fast enough for near-real-time (NRT) retrievals. Nevertheless, all algorithms retrieve only the slant column – to calculate the VCD, a conversion factor (called the air mass factor, AMF) has to be applied, which includes explicit or implicit assumptions about the vertical distribution of SO2 in order to determine the effective light path. Note that AMFs are calculated by means of multiple-scattering radiative transfer models assuming known vertical distributions of SO2 and O3, as well as viewing, surface, and cloud properties.
Unfortunately, the vertical distribution (in terms of the plume layer height) of SO2 is usually unknown at the time of the measurement as it is not easy to extract from the spectral signature (see Yang et al., 2009 and Nowlan et al., 2011): the SO2 loading (the VCD) has a direct effect on the optical depth, whereas the layer height (LH) has an indirect effect on the optical depth as it influences the number of photons passing through the SO2 layer, the UV wavelengths interacting with the SO2 layer, and the layer optical depth due to the temperature dependency of the SO2 absorption cross sections (Yang et al., 2009).
Even if there are ground-based or aircraft measurements of the SO2 layer height (LH), the data are generally difficult to use for validation, as, e.g., for strong eruptions (a volcanic explosivity index, VEI, of greater than or equal to 3), volcanic plumes are typically transported over long distances and the number of collocations is small. Thus, for volcanic SO2 measurements, the vertical distribution of SO2 is a key parameter limiting the product accuracy. The usual approach for operational SO2 retrievals is to assume several different a priori SO2 vertical distributions and provide VCDs for each (see, e.g., Theys et al., 2017) along with an averaging kernel (AK), so that the user can calculate the VCD for an arbitrary SO2 vertical distribution. However, in the upper troposphere and above, the vertical SO2 distribution has little impact on the VCD.
To date, SO2 layer height retrievals have used computationally demanding direct fitting inversion methods, which are not suitable for NRT applications. For the retrievals based on satellite UV measurements, Yang et al. (2009) and Yang et al. (2010) developed an “Extended Iterative Spectral Fitting” (EISF) algorithm for the Ozone Monitoring Instrument (OMI) aboard the NASA Aura satellite, and Nowlan et al. (2011) introduced an optimal estimation (OE) scheme for the GOME-2 instrument (Global Ozone Monitoring Experiment-2) aboard the EUMETSAT/ESA MetOp satellite fleet. For strong volcanic eruptions (VEI ≥ 3), the accuracy of the retrieved SO2 LHs using this approach is in the 0.5–1 km range, whereas for small SO2 absorption it is around 2 km (see Nowlan et al., 2011).
Satellite infrared sounders also offer the opportunity to measure both SO2 VCDs and LHs (see Clarisse et al., 2008, 2014; Carboni et al., 2012, 2016) using optimal estimation algorithms for the Infrared Atmospheric Sounding Interferometer (IASI) aboard the EUMETSAT/ESA MetOp satellite fleet. While infrared sounders have an inferior sensitivity to lower tropospheric SO2 compared with UV instruments, the layer height retrievals tend to have a better accuracy, and perform well even for low column amounts (up to the single-DU level; see, e.g., Clarisse et al., 2014 or Carboni et al., 2016); however, the horizontal resolution (12 km) is rather coarse.
In contrast, the TROPOMI instrument onboard the Sentinel-5 Precursor satellite (S5P) launched on 13 October 2017 has a much higher spatial resolution of 7×3.5 km2, and will operate at an even smaller resolution of 5.5×3.5 km2 beginning mid-August 2019. This allows us to observe and study SO2 plumes at an unprecedented level of detail. Data turnover from TROPOMI is very large, and this consideration will require the development of new retrieval schemes for the fast and accurate retrieval of SO2 layer heights in an operational environment.
To this end, we have developed an algorithm called “Full-Physics Inverse Learning Machine” (hereafter referred to as FP_ILM) for the retrieval of the SO2 LH based on satellite UV earthshine spectra. The FP_ILM algorithm has been used for the retrieval of ozone profile shapes (Xu et al., 2017), the retrieval of surface properties accounting for bidirectional reflectance distribution function (BRDF) effects (Loyola et al., 2019), and the retrieval of SO2 LH from GOME-2 (Efremenko et al., 2017). The algorithm creates a mapping between the spectral radiance and SO2 LHs using machine learning methods. The time-consuming training phase of the algorithm using radiative transfer model calculations is performed off-line, and only the inversion operator has to be applied to satellite measurements – this makes the algorithm extremely fast; thus, it can be used in near-real-time processing environments. In this second paper on the FP_ILM SO2 LH, we describe some improvements to the original algorithm from Efremenko et al. (2017), and we apply it to a number of volcanic eruptions observed by TROPOMI during the operational phase of the mission (started April 2018).
The paper is organized as follows. In Sect. 2 we describe the improved FP_ILM SO2 LH algorithm. The sensitivity of retrieved SO2 LHs to a number of different parameters is discussed in Sect. 3. In Sect. 4, the FP_ILM is applied to S5P data to retrieve SO2 LHs for selected volcanic eruptions. Section 5 describes how the algorithm could be integrated in the operational TROPOMI SO2 VCD retrieval algorithm. We summarize the paper in Sect. 6.
Conceptually, the FP_ILM consists of a training phase, in which the inversion operator is obtained using synthetic data generated with an appropriate radiative transfer (RT) model, and an operational phase, in which the inversion operator is applied to real satellite measurements. The main advantage of the FP_ILM over classical direct fitting approaches is that the time-consuming training phase involving complex RT modeling is performed off-line; the inverse operator itself is robust and computationally simple and, therefore, extremely fast. In our previous paper (see Efremenko et al., 2017), we first introduced the FP_ILM algorithm and applied it to GOME-2 observations of a number of volcanic eruptions. We used a combination of principal component analysis (PCA) and principal component regression (PCR) methods to train the inversion operator in order to retrieve the SO2 LH. For the current paper we have improved the FP_ILM algorithm with the use of a neural network (NN) approach, as outlined below.
Table 1Physical parameters varied for the generation of reflectance spectra. The optimized parameter range for training the final FP_ILM retrieval operator is shown. (SZA: solar zenith angle; VZA: viewing zenith angle; RAA: relative azimuth angle; VCD: vertical column density; LH: layer height.)
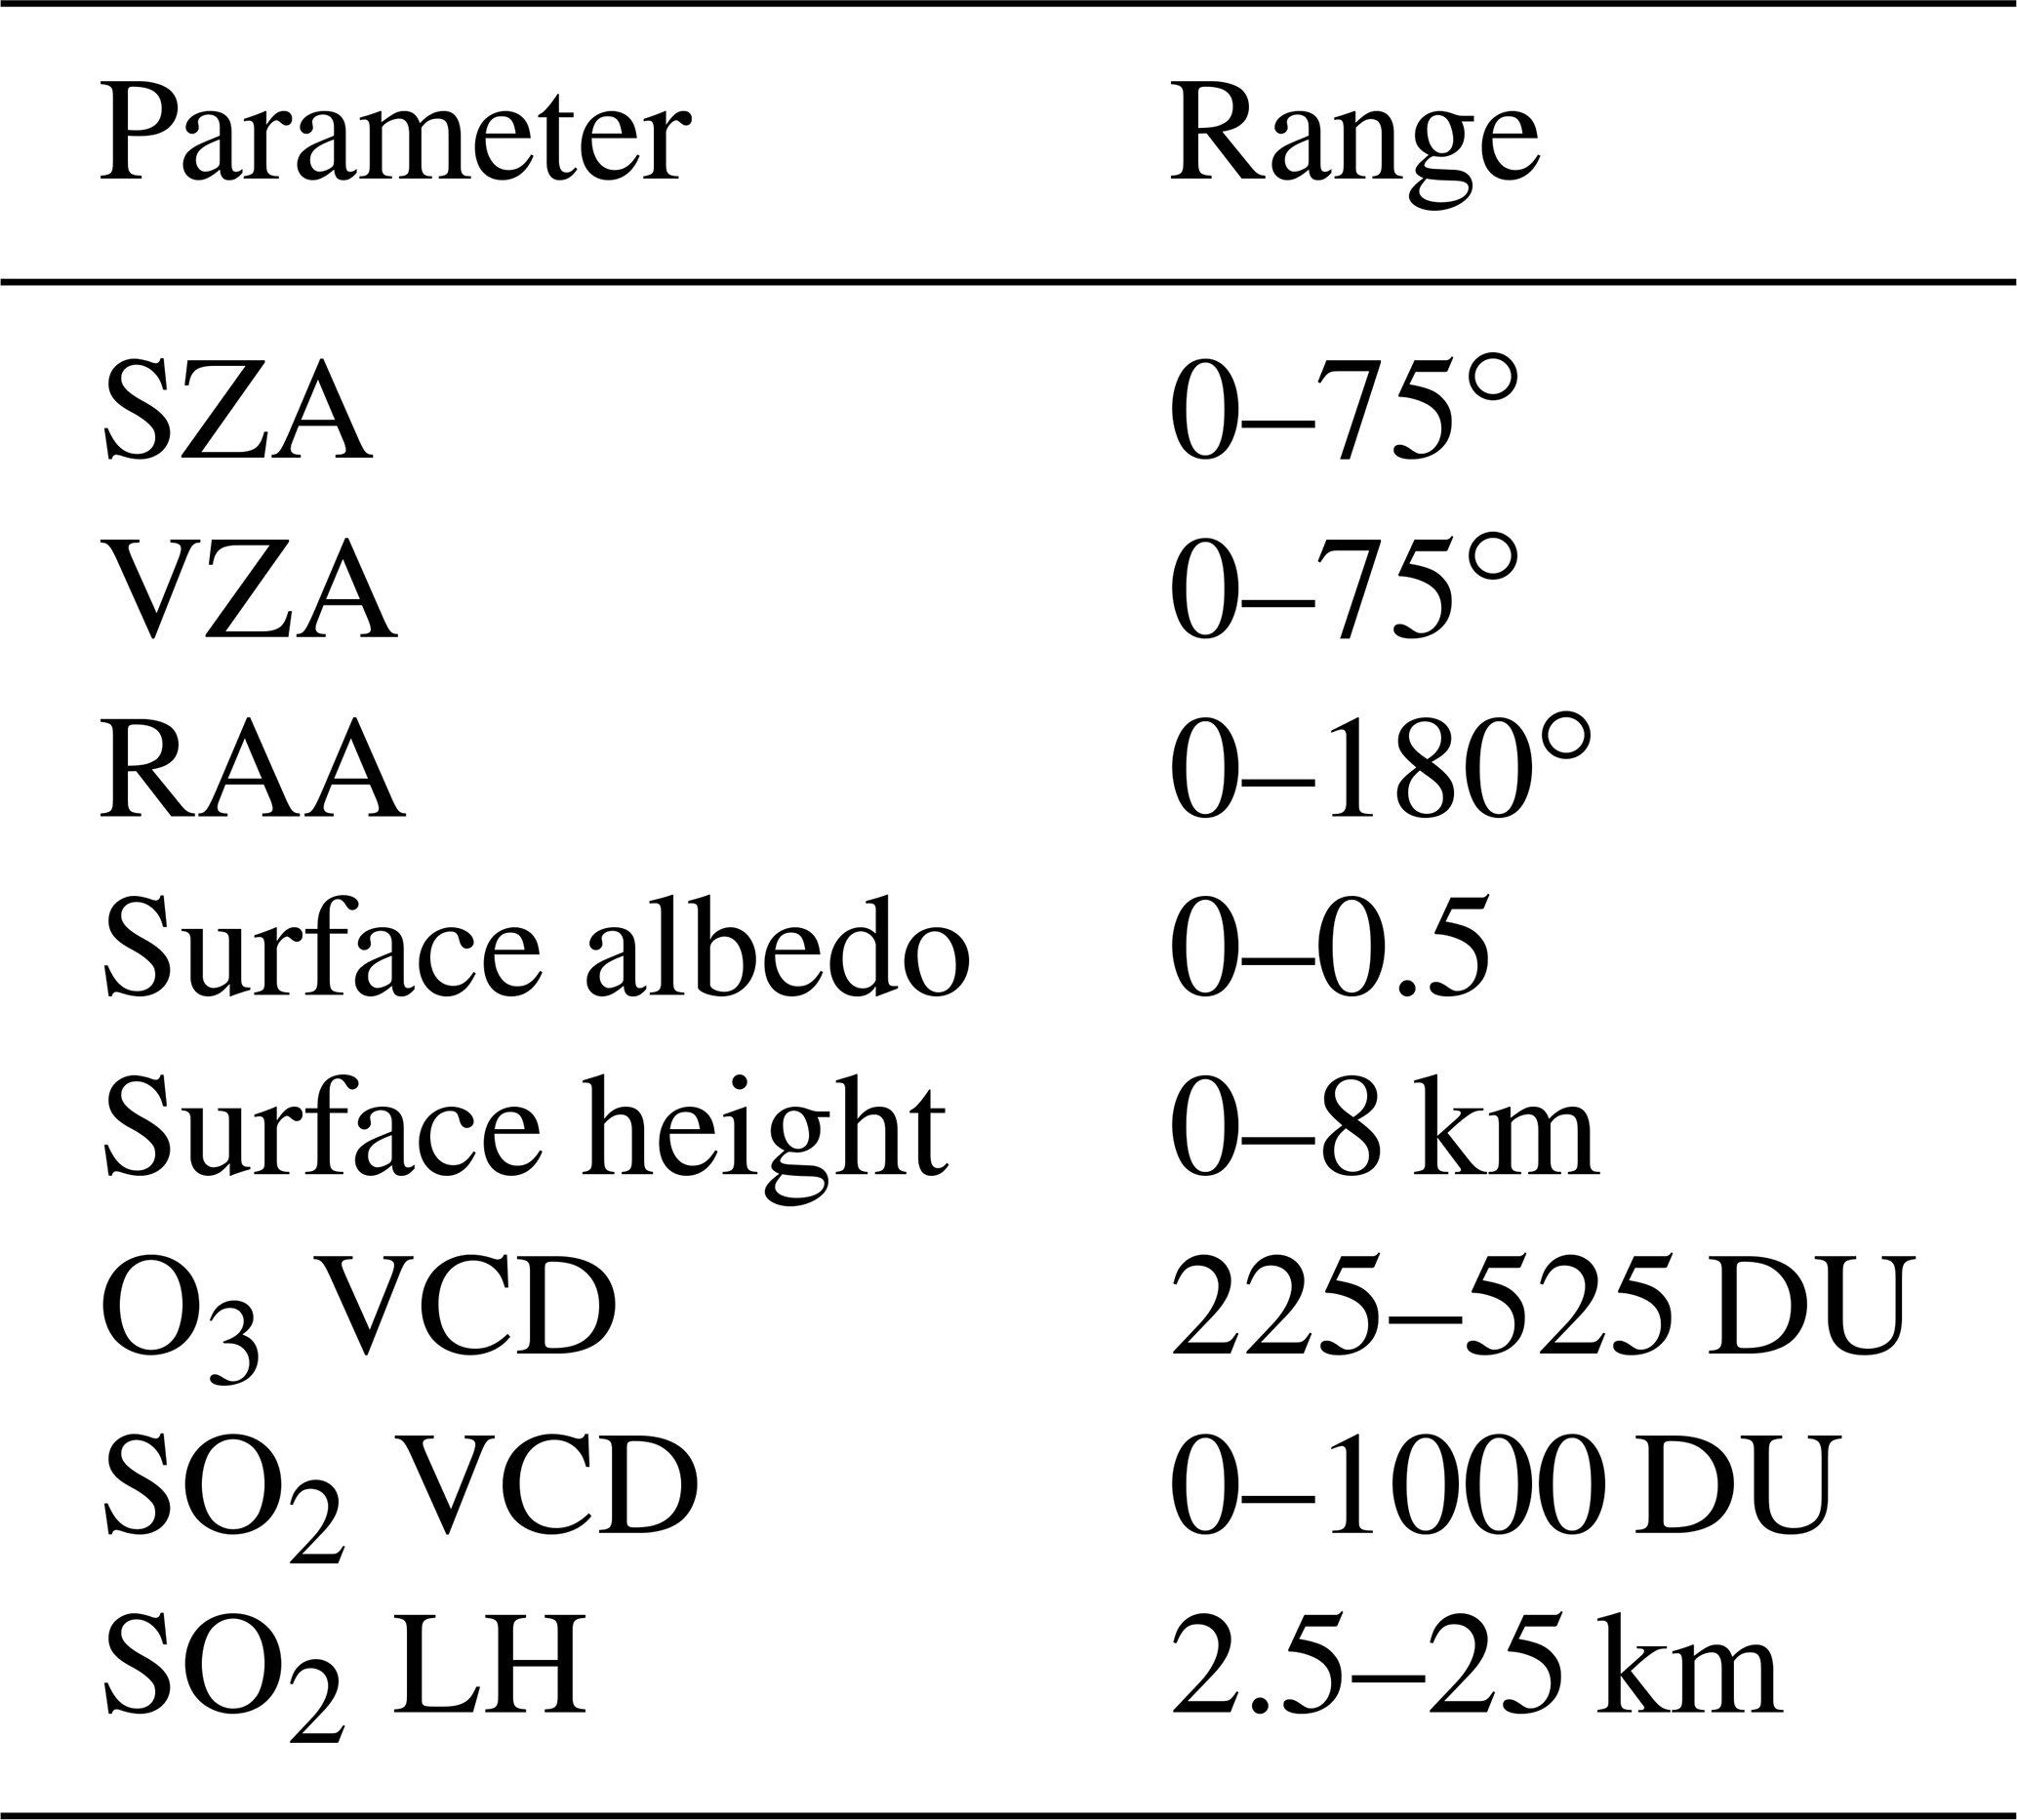
During the training phase, the LInearized Discrete Ordinate Radiative Transfer model (LIDORT) with inelastic rotational Raman scattering (RRS) implementation (Spurr et al., 2008) is deployed to compute simulated reflectance spectra in the 310–335 nm wavelength range. These spectra depend upon the following n=8 input parameters: the SO2 VCD and LH, the surface albedo, the surface height, the O3 VCD, the solar zenith angle (SZA), the viewing zenith angle (VZA), and the relative azimuth angle (RAA). Table 1 provides a summary of the final parameter space after optimization (see below) used for the training of the final retrieval operator. Note that O3 has to be included due to the strong spectral interference between SO2 and O3 in the spectral range considered. Ozone profiles are classified according to the total column amount of O3, and the month and latitude zones as specified in the TOMS Version 8 O3 profile climatology (Bhartia, 2003). The SO2 plume profile is taken to have a Gaussian shape, characterized by the total SO2 VCD loading and centered at a peak-concentration layer height zp, along with a half-width fixed to 2.5 km. In the following, the retrieval of the SO2 layer height refers to the retrieval of the peak-concentration height zp.
Simulations were carried out on a pressure/temperature/height grid from the US standard atmosphere, with a finer-grid vertical height resolution of 0.25 km below 15 km in order to properly resolve the Gaussian SO2 plume shape. In total, some 131 072 simulated reflectance spectra have been calculated on a selective parameter grid established by means of a smart sampling technique developed by Loyola et al. (2016). Further details on the smart sampling technique applied to the SO2 LH retrieval can be found in Efremenko et al. (2017).
The use of the LIDORT-RRS RT model is necessary, as it enables us to account for the effect of Raman scattering in the atmosphere: solar irradiances exhibit strong Fraunhofer structures in this part of the UV spectral range, and earthshine spectra are characterized by the “filling-in” of Fraunhofer-solar and telluric-absorber features due to “inelastic” (wavelength-redistributed) rotational-Raman scattering by air molecules. For further details, see Efremenko et al. (2017) and Spurr et al. (2008).
The simulated high-resolution reflectance spectra are convolved with the TROPOMI instrument spectral response function (ISRF) v3.0.0 (released 1 April 2018) (available at: http://www.tropomi.eu/data-products/isrf-dataset/, last access: 14 October 2019). Note that the TROPOMI instrument comprises 450 rows, which are in principle single detectors with their own ISRFs. The signal-to-noise ratio (SNR) is about 1000 in our UV wavelength range. Thus, to account for instrumental noise in the training phase, uncorrelated Gaussian noise with a fixed SNR of 1000 is added to the simulated spectral data.
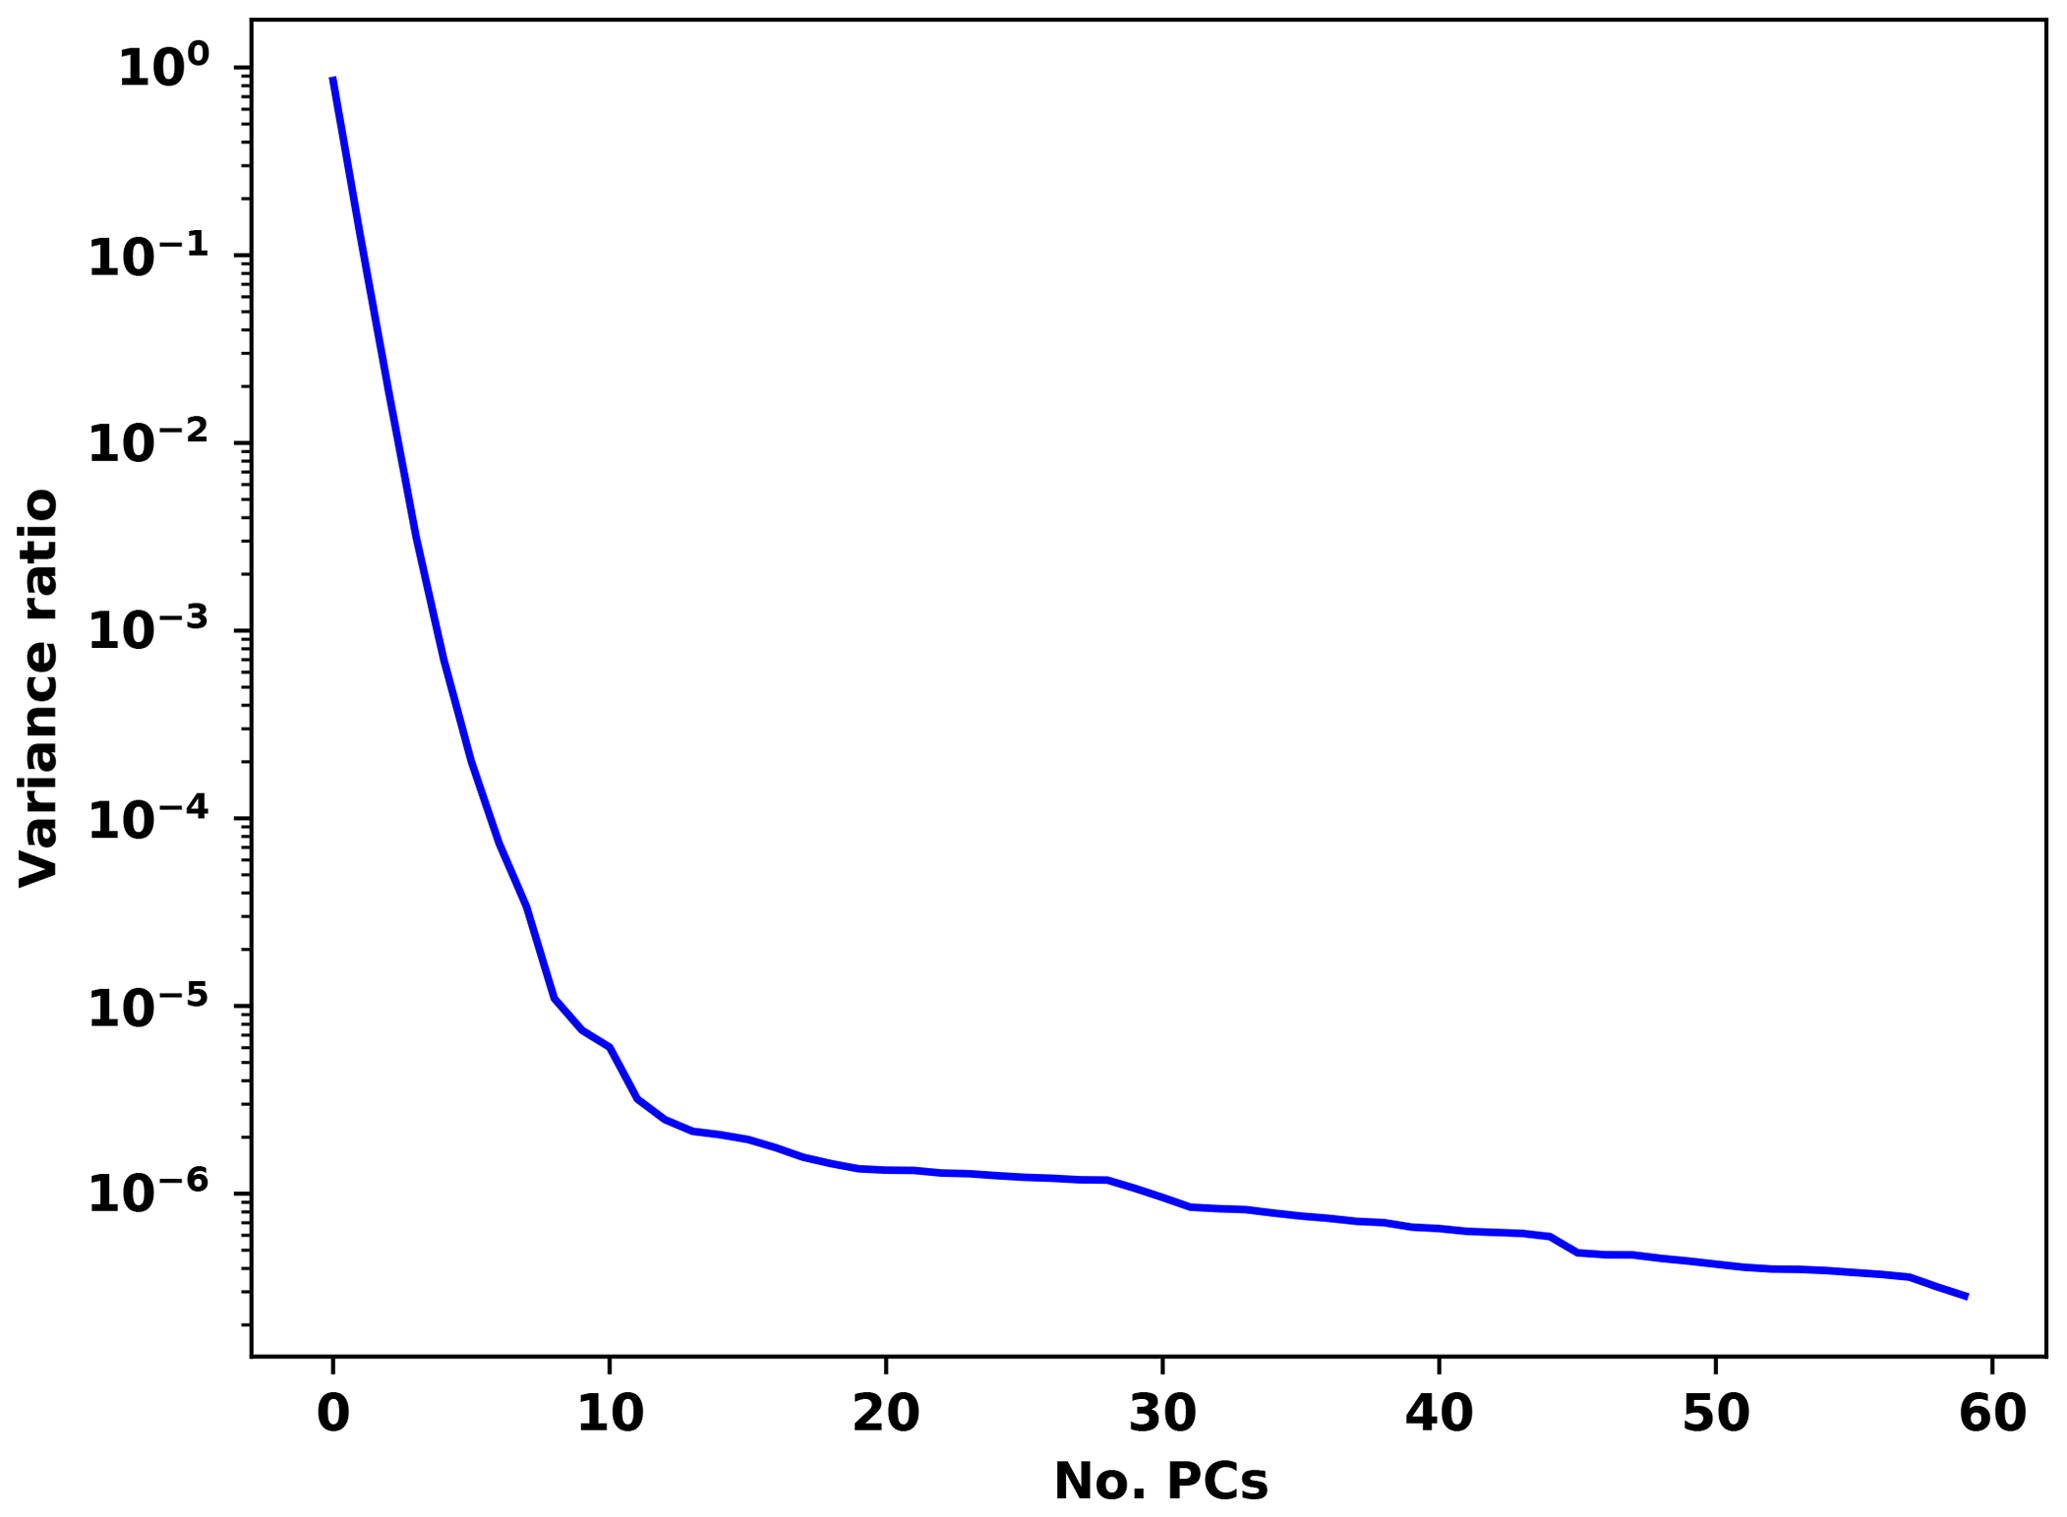
Figure 1“Explained” variance ratio as a function of the number of principal components. The inclusion of 10 PCs already accounts for 99.994 % of the spectral variance.
To extract the information about the layer height and to reduce the dimensionality of the spectral dataset, a PCA is applied to the simulated spectra. By characterizing the set of simulated measurements with fewer parameters in this fashion, a simpler, more stable, and computationally efficient inversion scheme can be realized. It was found that using 10 principal components (PCs) was sufficient to retrieve information about the SO2 LH. These 10 PCs accounted for 99.994 % of the spectral variance. The inclusion of additional PCs beyond 10 did not result in any improvements to the LH retrievals, as higher-order PCs are increasingly affected by noise. Figure 1 shows the ratio between the variance of the PCA-derived dataset and the total variance of the complete spectra dataset (the “explained” variance ratio) as a function of the number of PCs included in the PCA.
The 10 PCs, along with the information about the O3 VCD, the SZA/VZA/RAA angles, the surface pressure, and albedo of each training data point, are then used as input to train a feed-forward artificial neural network (NN) including regression (in our case a “Multilayer Perceptron Regression” – MLPR), with the corresponding SO2 LH as the output layer. Note here that the SO2 VCD is not part of the training, as it depends directly on the SO2 layer height.
In general, NNs can be used for establishing a non-linear mapping between a dataset of numeric inputs and a set of numeric outputs. A NN consists of interconnected neurons (or nodes) that implement a simple, non-linear function (a sigmoid function in our case) of the inputs. Neural networking is a powerful tool for determining non-linear dependencies between datasets in remote sensing, as shown by Loyola (2006). It consists of an input layer (representing the abovementioned input parameters), at least one so-called hidden layer, and an output layer (representing the expected output – in our case the SO2 LH). Each neuron in the hidden layer(s) transforms the values from the previous layer(s) with a weighted linear summation, followed by a non-linear activation function, which is the sigmoid function in our case. The output layer receives the values from the last hidden layer and transforms them into output values.
The training of the MLPR is an iterative process that tries to minimize the so-called loss function (also known as the cost function), which is a measure of how well a model predicts the expected outcome; at each time step, the partial derivatives of the loss function with respect to the model parameters are computed in order to update the parameters. We note here that MLPR uses the “mean square error” loss function. A regularization term is added to the loss function that shrinks model parameters to prevent over-fitting: By building a complex neural network, it is quite easy to perfectly fit the training dataset. However, when this model is evaluated on new data (here the satellite measurements), it performs very poorly. Thus, the regularization modifies the loss function by adding additional terms that penalize large weight vectors and preferring diffuse weight vectors.
After carrying out a PCA and MLPR parameter optimization using closed-loop retrievals to minimize differences between the retrieved and simulated layer heights, the final configuration for the neural network settled on the use of two hidden layers, with 32 nodes in the first layer and 10 nodes in the second.
In the operational phase, the first step is to use the principal component scores acquired during the training phase to transform a given TROPOMI spectral measurement dataset to one with a lower dimension. Once this is done, the neural network inverse function is then applied to retrieve the SO2 LH. In order to avoid the training of the NN for each of the 450 TROPOMI detector rows (with their own ISRF), we only trained the network for every 50th detector row and interpolated the retrieved SO2 LH results to the actual row where it was detected.
We note that the FP_ILM algorithm only needs to be re-trained when large changes in the ISRF or SNR occur (see Sect. 3).
In this section, we study the dependency of the layer height retrieval on different parameters. We discriminate between direct dependencies (i.e., those parameters affecting the reflectance spectra) and indirect dependencies (i.e., affecting the training data and inversion algorithm) of the retrieved layer height:
-
Direct dependencies are defined as the viewing geometry, surface properties, ISRF, noise level (SNR), instrumental stray light, and O3 VCD.
-
Indirect dependencies are defined as the number of layers in the neural network, number of PCs, and parameter ranges for training.
First, we train the FP_ILM operator using 90 % of the training dataset (see Table 1), and then apply the trained operator to the remaining 10 % training spectra, for which we know the exact SO2 LH. Figure 2 (red dots) shows the SO2 LH difference as a function of solar/viewing geometry, SO2 VCD, O3 VCD, albedo, and surface pressure, respectively. The figure clearly shows a number of marked dependencies in the retrieved layer height, with notably high differences with respect to the real SO2 LH for low and high layer heights, for low SO2 VCD as well as for high SZA.
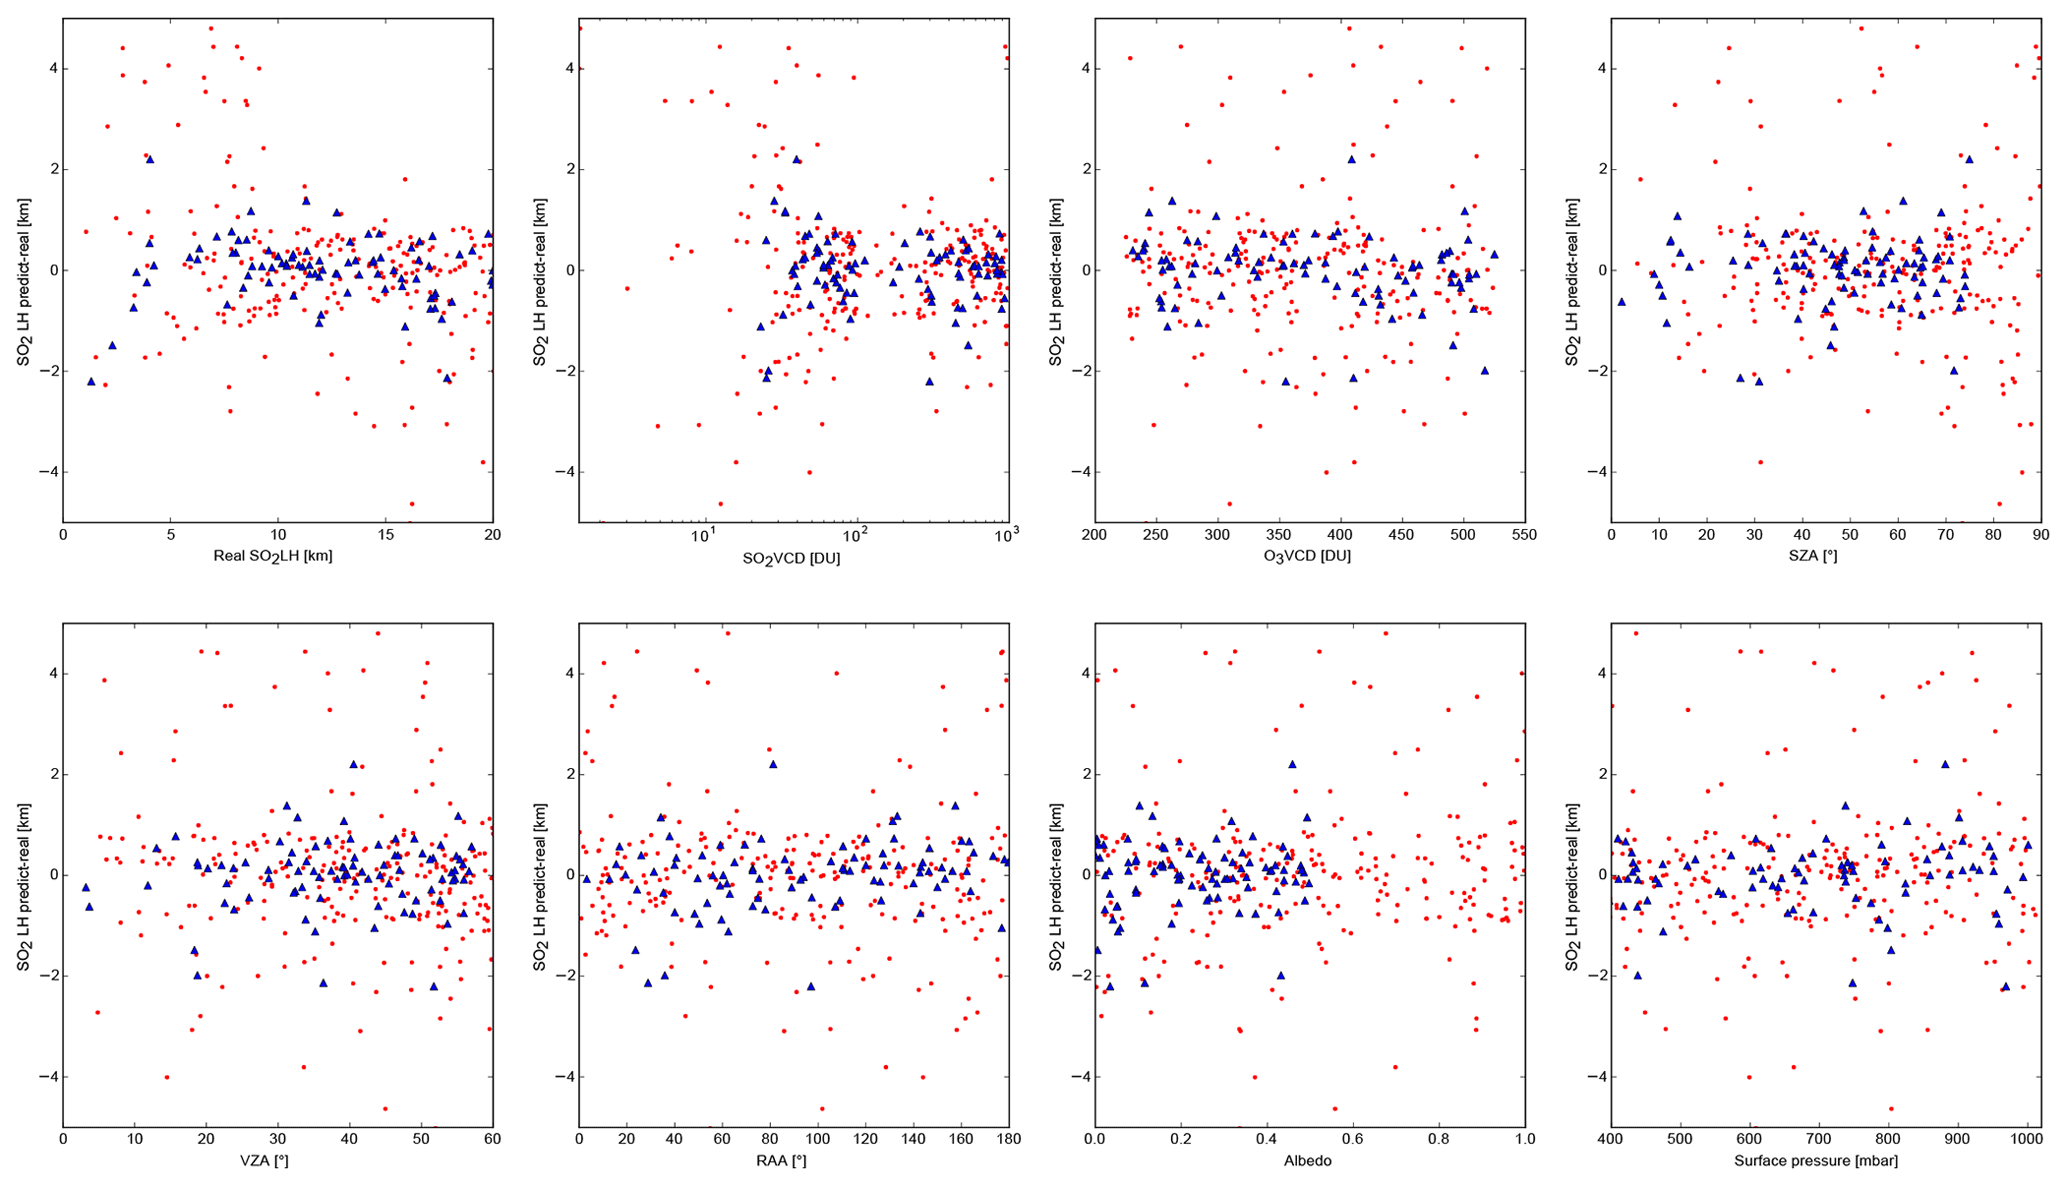
Figure 2Dependency of the retrieved SO2 layer height as a function of eight parameters as indicated. Plotted are the layer height differences (in km) between the retrieved layer heights and those simulated using the independent verification dataset (i.e., a 10 % subdivision of the entire training dataset). Red dots show the dependencies using the entire training dataset, whereas blue triangles show the dependencies with an optimized training dataset (i.e., restricted to SO2 VCD values greater than or equal to 20 DU, SZAs less than or equal to 75∘, and albedos less than or equal to 0.5).
Regarding the SZA dependency, a cutoff limit of 75∘ is usually set in operational SO2 retrievals, because at high SZAs the light path becomes very long and the noise level increases. Accordingly, we limit the SZA of the spectra used in the training to SZA values less than or equal to 75∘ in the following.
Clearly, for small SO2 VCDs, the information content on the LH in the spectral signature is very low. It follows that the inclusion of spectra with low SO2 content in the training will have a negative effect on the entire neural network. In principle, for lower SO2 VCD loadings, more PCs could be included, but at some point the noise level signature will exceed that of the actual SO2 absorption.
We performed several tests in which we limited the training dataset by varying the allowed input parameter ranges. We found an optimal parameter range that allows for the retrieval of a broad range of SO2 LHs, even for low SO2 VCDs. In the training phase, we only use spectra with SO2 VCDs greater than or equal to 20 DU, surface albedo values less than or equal to 0.5, and SZAs less than or equal to 75∘ to train the final inversion operator for TROPOMI. The albedo limit is set to 0.5, as large albedo values will induce large variations in the spectra (multiple reflections from the surface). These additional variations correlate with the variations due to perturbations in the SO2 VCD and LH. Therefore, to make the algorithm more stable, we restrict the albedo range to the physically relevant cases. We further limited the training values of the SO2 LH to the range between 0 and 25 km. Although higher LHs from strong volcanic eruptions can occur, the use of a broad training data range also has an influence on the accuracy of the retrieval. To a limited extent, however, the FP_ILM is also able to extrapolate to an untrained parameter range, although with significantly less accuracy.
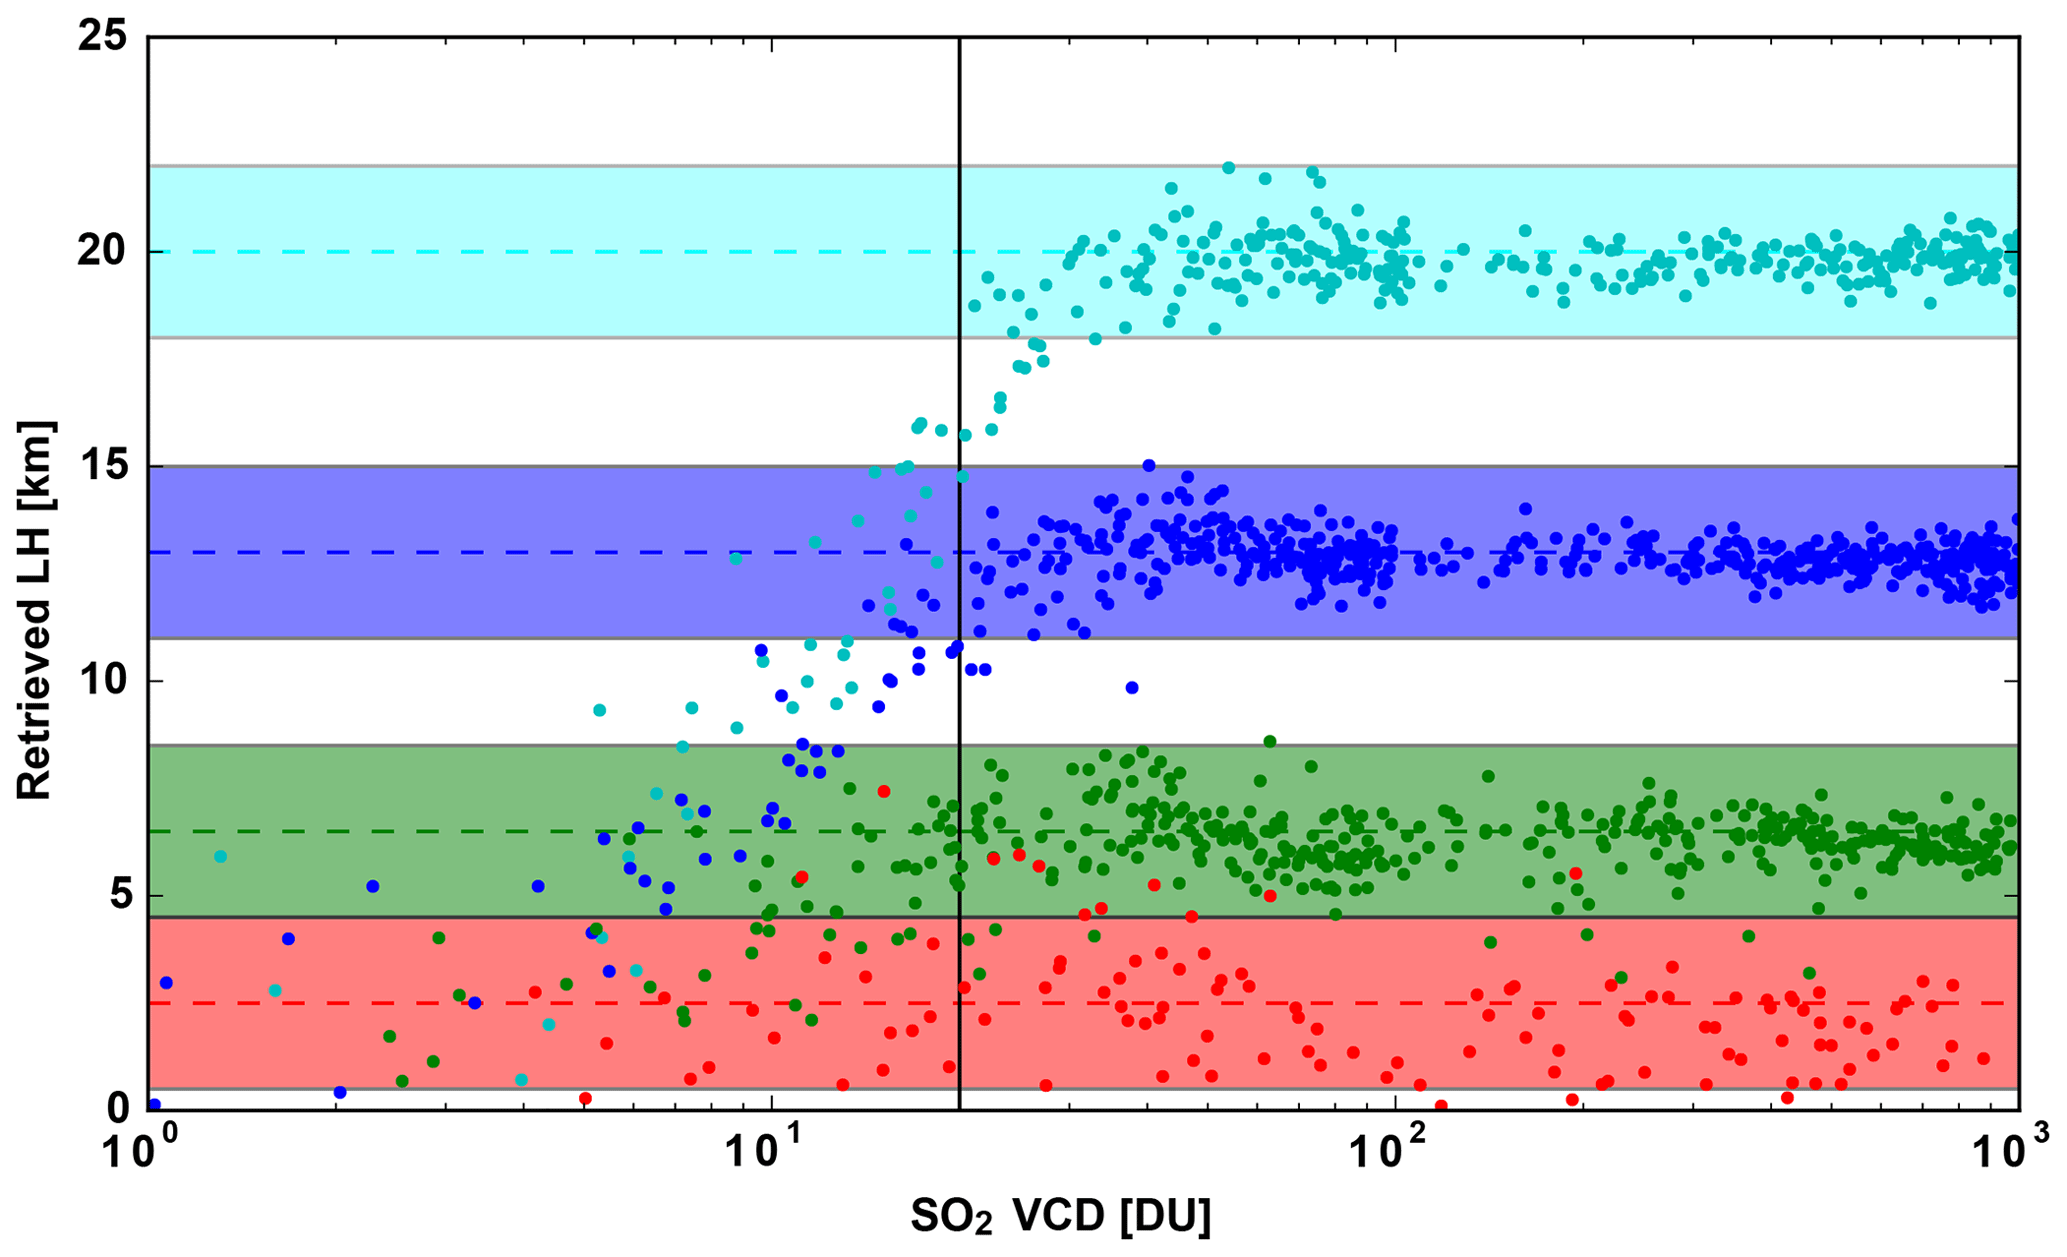
Figure 3Dependency of the retrieved SO2 LH as a function of SO2 total vertical column, using the independent test dataset. The different LHs for which the test spectra have been generated are color-coded. The horizontal color bars indicate a 2 km uncertainty on the retrieved SO2 LH.
Using the optimized training dataset (see Table 1 for a summary of the parameter space), Fig. 2 (blue triangles) shows that the error on the retrieved SO2 LH is less than 2 km and the dependency on the SO2 VCD is reduced. Figure 3 shows the retrieved layer height as a function of the SO2 VCD. As mentioned above, for low SO2 VCDs, high-altitude layer heights cannot be retrieved – there is always a bias towards low layer heights. Only for SO2 loadings in excess of 20 DU, do we retrieve layer heights with an uncertainty of less than 2 km.
To investigate the dependency of the retrieved SO2 LHs as a function of the SNR, we used two different noise levels (a SNR of 500 and 1500). Figure 4 clearly shows that the SNR only has a minor effect on the accuracy of the retrieved layer height, with only slightly higher accuracy for increased SNR. This is to be expected, as we used the first 10 PC scores and, thus, basically removed all noise features.
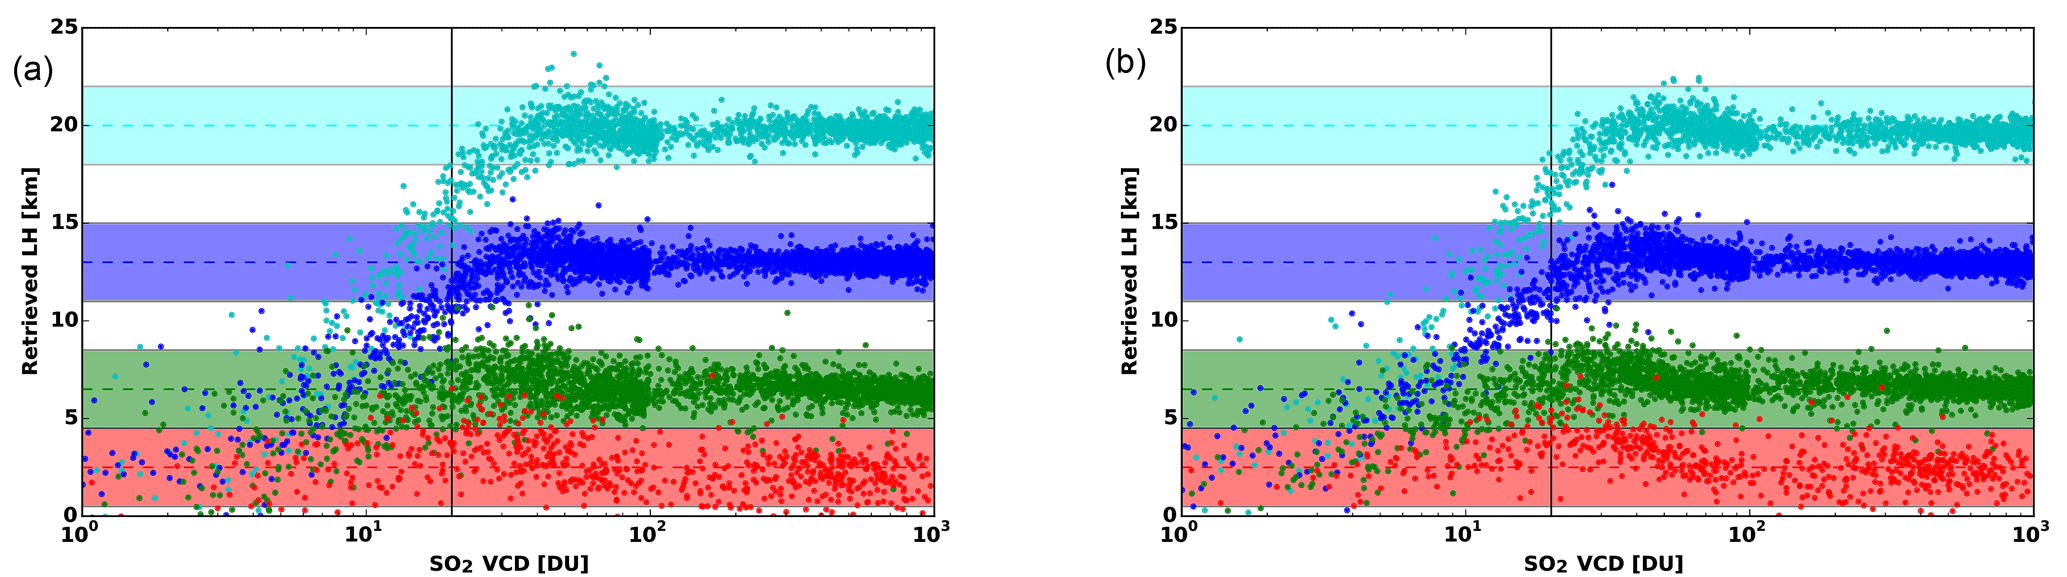
Figure 4Dependency of the retrieved SO2 LHs on the SNR. Same as Fig. 3 with different SNR values. Panel (a) shows a SNR of 500, and panel (b) shows a SNR of 1500.
Concerning the dependency on the ISRF, we note that in the operational retrieval of SO2 LHs from TROPOMI data, each detector row is effectively a single instrument with its own ISRF. The accuracy of the retrieved SO2 LH can vary across detector rows. Figure 5 shows the SO2 LH results when applied to the Sinabung eruption (see Sect. 4.1). Black dots show the LHs for each 50th row, whereas the red cross shows the interpolated LH for the measurement row. Clearly, the retrieved LH is slightly different in each row (within 1 km) due to the different ISRF used for training the NN. Note that we determine the LH for a set of fixed detector rows (for which we have trained the FP_ILM separately), and then interpolate the layer height to the actual row. In this way we avoid jumps in the retrieved layer height between adjacent detector rows.
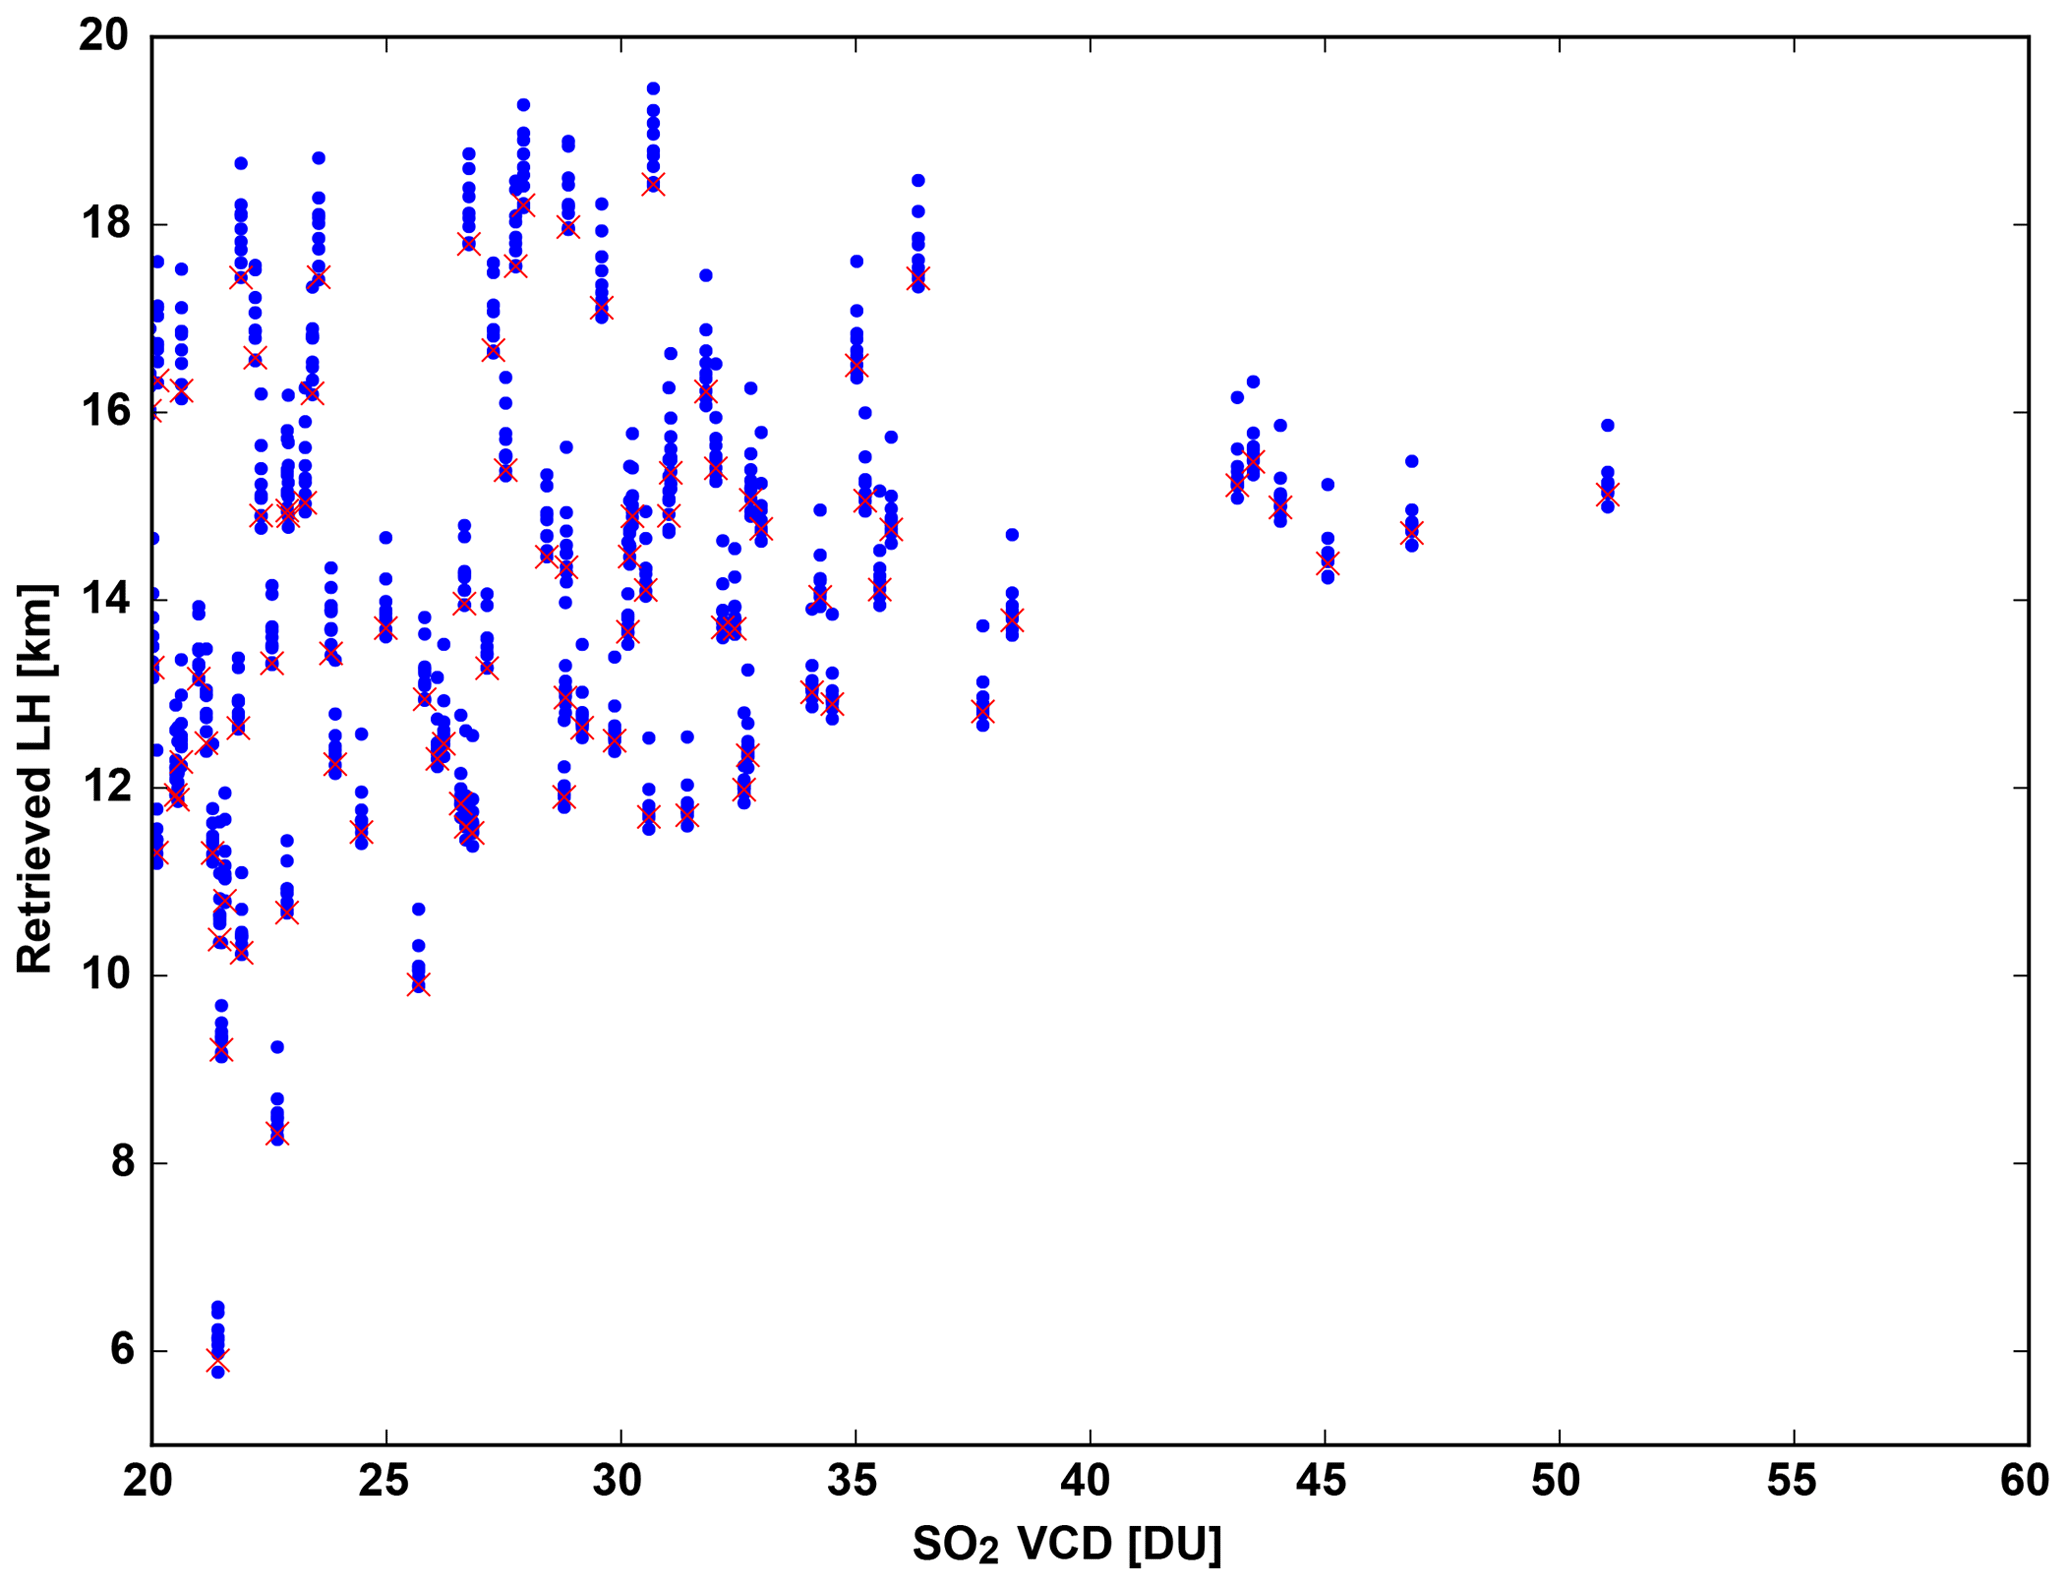
Figure 5Dependency of the retrieved SO2 LH on the TROPOMI instrument row. The SO2 LH as a function of the SO2 VCD is shown for the Sinabung eruption. Blue dots show the SO2 LH result for every 50th detector row, whereas red crosses show the LH interpolated to the measurement row.
Instrumental stray light can introduce spectral features that may lead to bias in the retrieved SO2 LH. However, according to Kleipool et al. (2018) the in-band stray light of TROPOMI after correction is as low as 0.5 % and, thus, can be neglected. Furthermore, no evidence for out-of-band-stray light was found (Quintus Kleipool, personal communication, 2019).
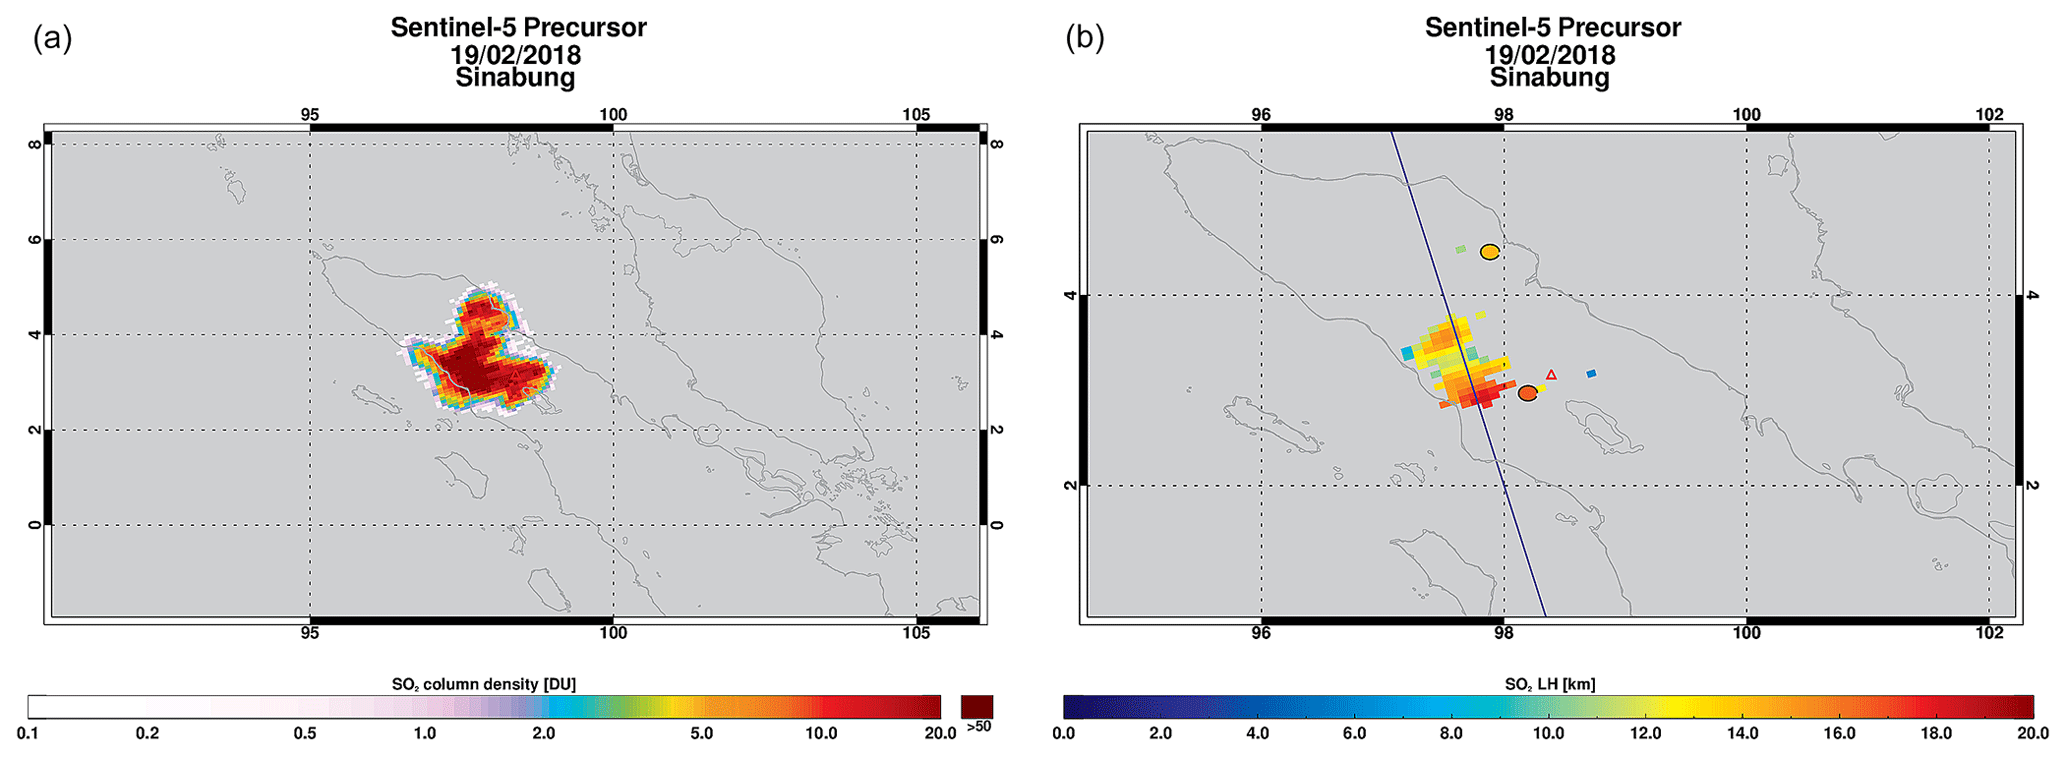
Figure 6SO2 VCD (a) and SO2 LH (b) for the TROPOMI measurements of the Sinabung volcano on 19 February 2018, at an overpass time of around 06:30 UTC. SO2 LH results are only shown for VCD values greater than or equal to 20 DU. In panel (b) MLS/Aura results (the two colored circles) and the CALIPSO ground track (cf. Fig. 7) are shown.
During major volcanic eruptions (VEI ≥ 3) with very high SO2 loadings, the O3 VCD retrievals may be inaccurate due to SO2 interference. However, this effect is negligible for weak eruptions. For strong eruptions (exceeding about 50 DU of SO2) the error on the O3 VCD may reach a few percent (see Lerot et al., 2014), which means that the error on the SO2 LH is still negligible.
Reflectance spectra from TROPOMI are determined from the operational L1 solar irradiance and earthshine radiance data (solar irradiance is measured on a daily basis). To correct for Doppler shifts between earthshine and irradiance spectra, we apply the wavelength calibration information from the operational L2 SO2 product to first register the solar spectrum and then we use the fitted shift and squeeze parameters from the DOAS retrieval to calibrate the earthshine spectra. From this calibrated L1 data, we then calculate reflectances in the 310–335 nm wavelength range.
In the following subsections, we have applied the FP_ILM operator to three major volcanic eruptions measured by TROPOMI. We chose eruptions with a peak SO2 VCD exceeding our 20 DU threshold criterion and with an extended SO2 plume that allows us to compare the FP_ILM results with independent retrievals from other satellite data sources. In addition to L1 reflectances, we use information on SO2 VCD, O3 VCD, surface, and viewing conditions from the operational SO2 L2 product (see Pedergnana et al., 2018).
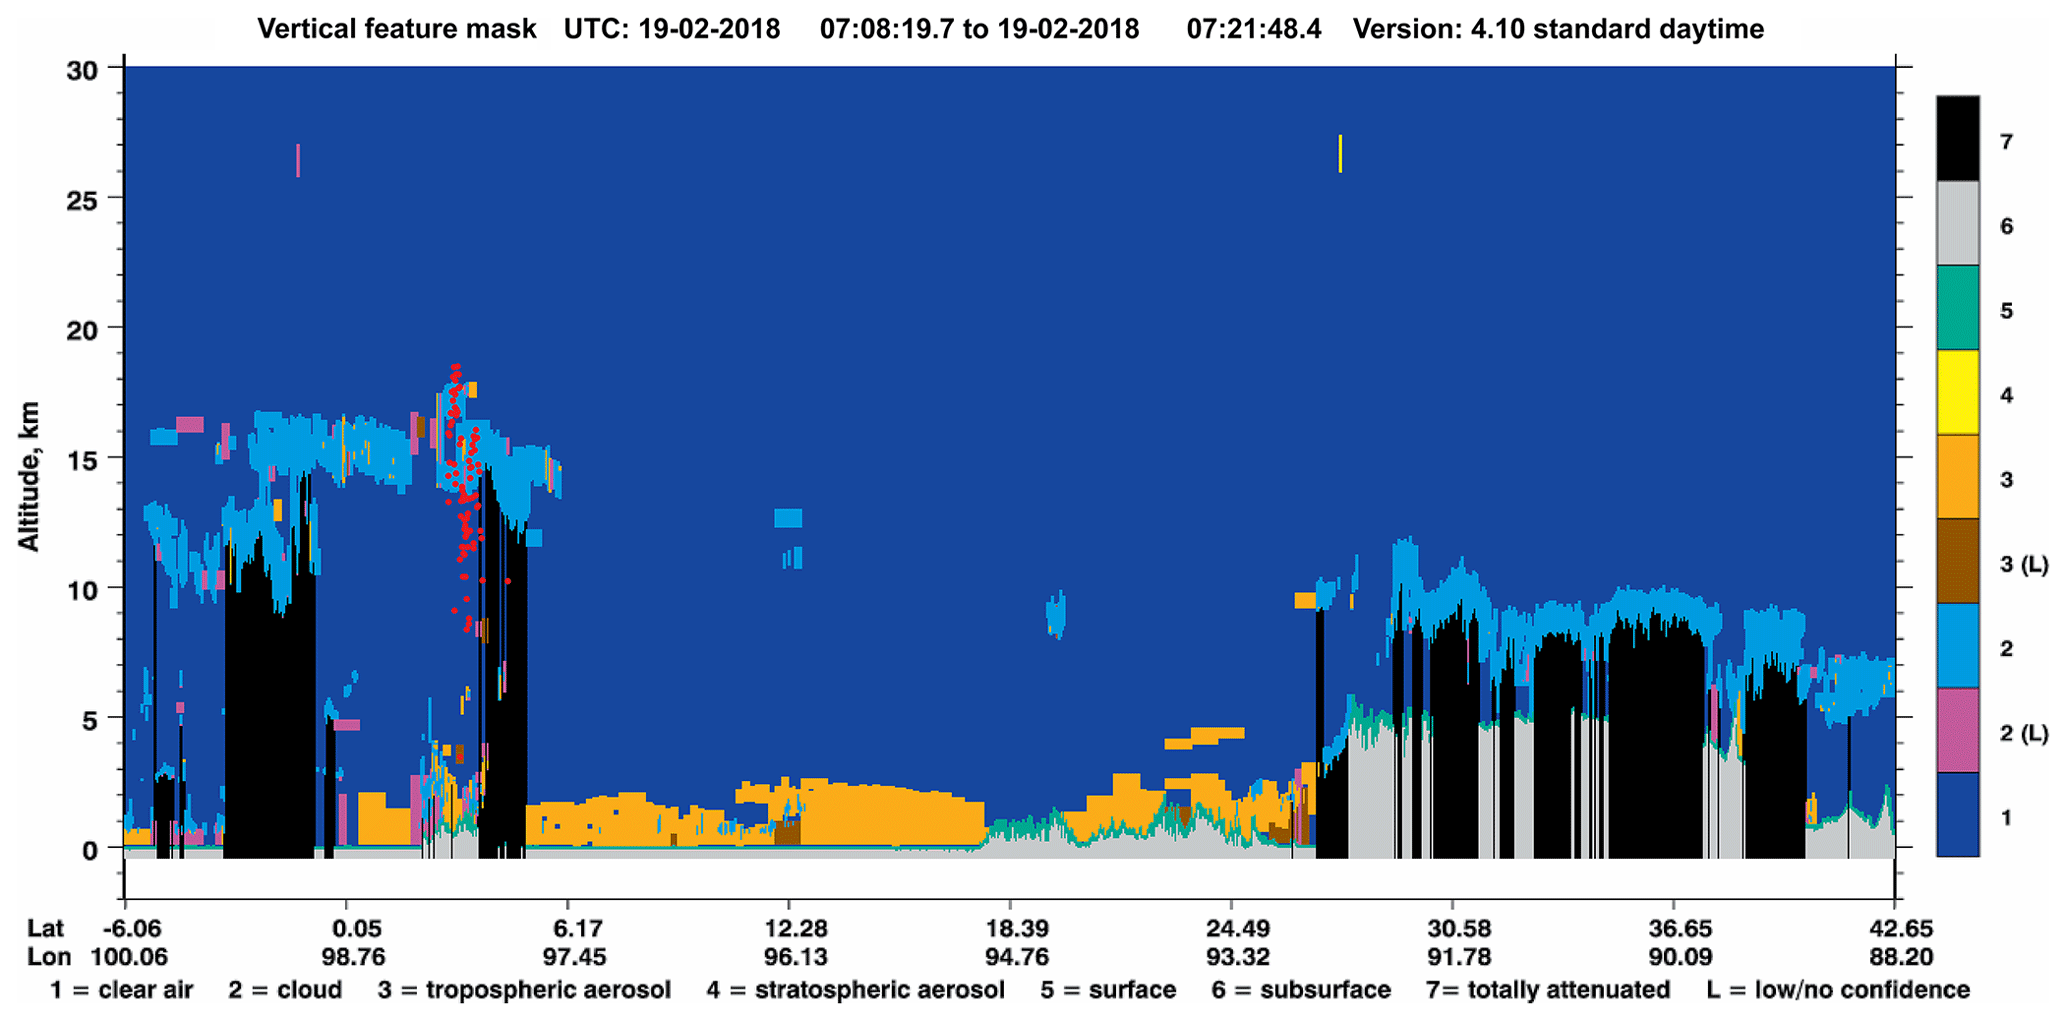
Figure 7CALIOP/CALIPSO vertical feature mask for the measurement of the Sinabung volcanic eruption on 19 February 2018 at around 07:15 UTC. Red dots show the retrieved LH for pixels with SO2 VCD values greater than or equal to 20 DU. The ground track of the CALIPSO measurements is shown in Fig. 6. The volcano is located at 3.17∘ N, 98.39∘ E. The plume is clearly visible in the left section of the image. Note that the classification scheme sometimes cannot pick up the volcanic ash or sulfate aerosol because of competing clouds. CALIPSO image credit: NASA.
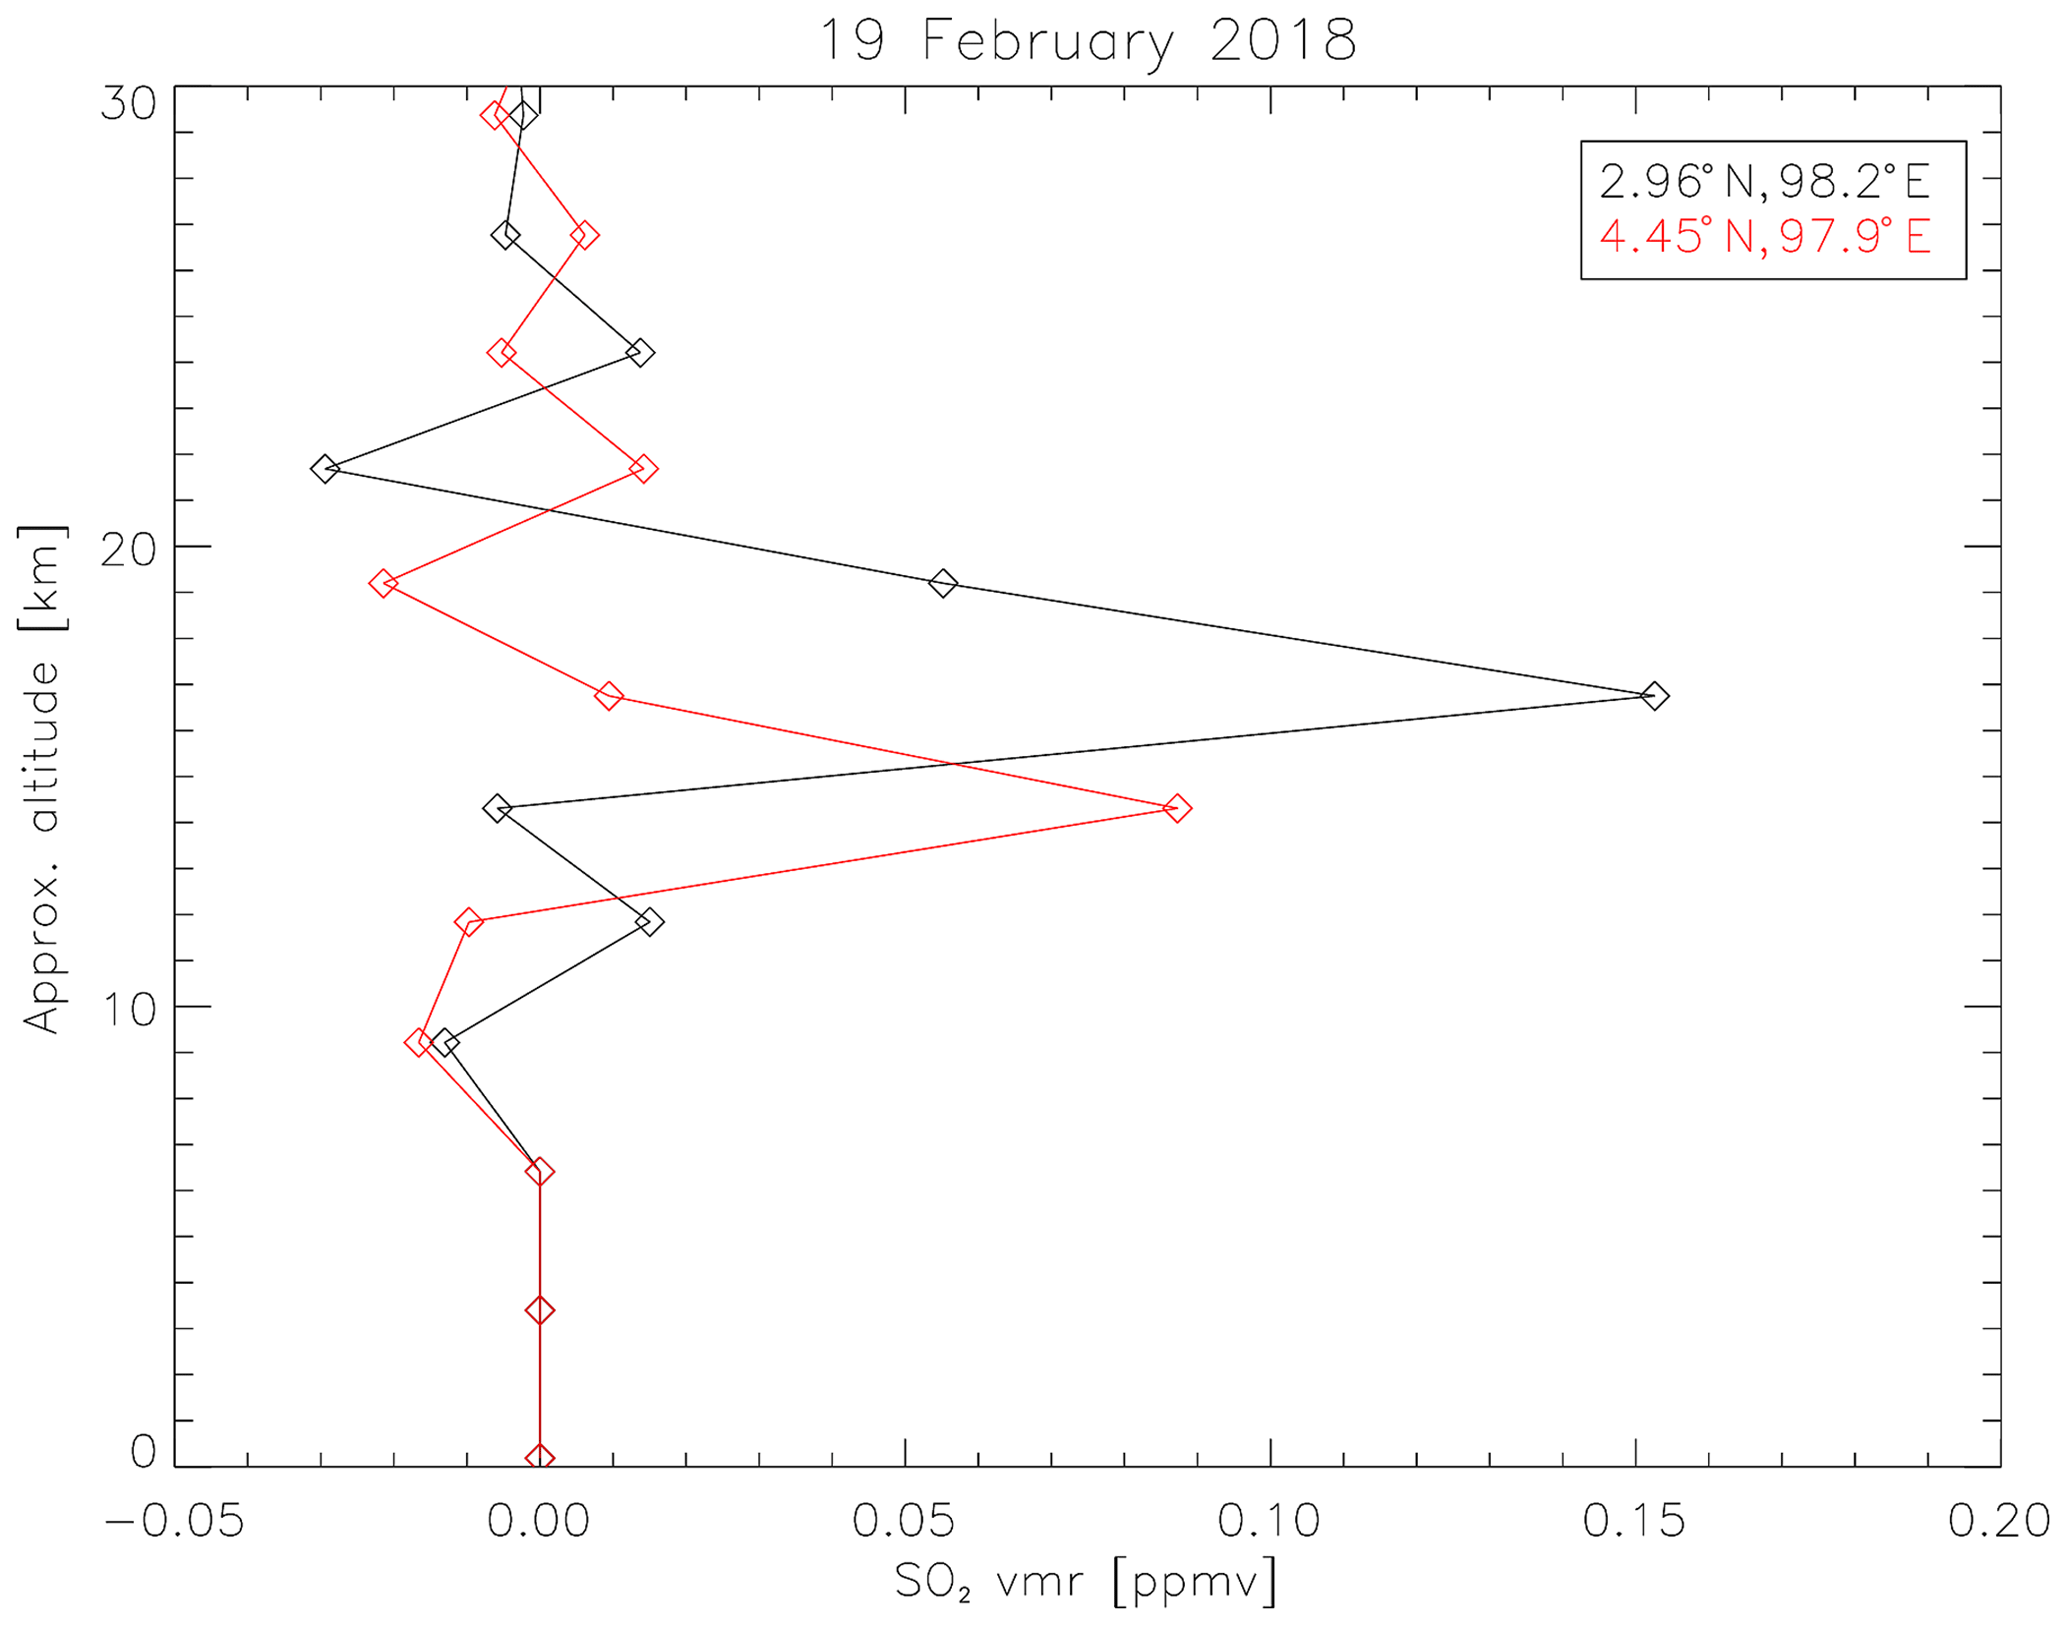
Figure 8MLS SO2 profile for two measurements intersecting the volcanic plume of the Sinabung volcanic eruption on 19 February 2018, clearly showing the presence of an SO2 layer at an altitude of around 16 km close to the volcano (black) and 13 km in the extended plume farther north (red). The position of the measurements is shown in Fig. 6.
For validation of our results, we performed comparisons with independent MetOp/IASI SO2 LH data (see Clarisse et al., 2014 for details), as well as SO2 profile data from the Microwave Limb Sounder (MLS) on the NASA/Aura satellite (see Pumphrey et al., 2015). The MetOp platforms have different orbits from that of S5P, with widely different overpass times; thus, direct satellite comparisons with IASI data will only give a qualitative validation on the accuracy of retrieved SO2 LHs from TROPOMI measurements. The afternoon Aura/MLS overpass is nearly coincident with TROPOMI. The MLS can provide some information on the SO2 LH, albeit with limited spatial coverage and vertical resolution, as it is only sensitive above an altitude of about 147 hPa (i.e., above around 13 km). We also checked on the availability of an overpass of the Cloud-Aerosol Lidar and Infrared Pathfinder Satellite Observation (CALIPSO, Winker et al., 2010) satellite with the Cloud-Aerosol Lidar with Orthogonal Polarization (CALIOP) instrument. Note that CALIPSO measures only ash and aerosol absorption profiles. In this regard, we note that SO2 plumes and ash or aerosols are not necessarily colocated, as gas and ash can separate in volcanic clouds. At the time of writing, IASI and MLS data are unfortunately the only sources for independent SO2 LH satellite validation.
4.1 Sinabung
The Sinabung stratovolcano (2460 m summit elevation) on the island of Sumatra had been highly active until September 2010 and was then quiet until a new eruptive phase began in September 2013 that lasted until March 2018 (see Venzke, 2018b). On 19 February 2018, Sinabung erupted violently at around 02:55 UTC with its largest explosion to date, emitting a volcanic ash plume that rose to an altitude of at least 16.8 km and an SO2 plume of up to 50 DU of SO2 that was observed by several satellite instruments, including TROPOMI (see Fig. 6, overpass time of around 06:30 UTC), OMI, IASI (overpass times of around 03:30 and 15:00 UTC), and MLS (overpass time of around 07:10 UTC). There was also an overpass of CALIPSO/CALIOP at about 07:15 UTC, over the volcanic plume.
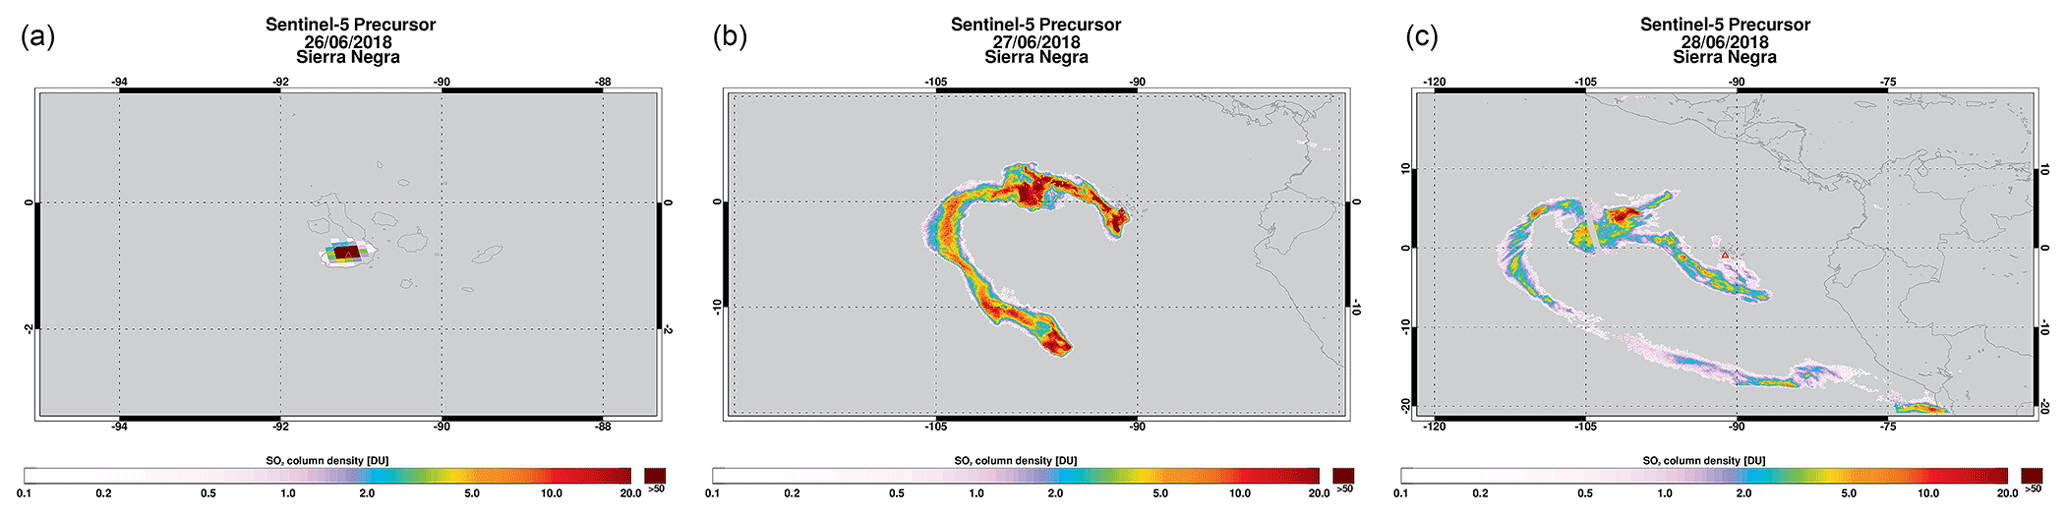
Figure 9SO2 VCD for the TROPOMI measurements of the Sierra Negra volcano from 26 (a) to 28 June 2018 (b), with overpass times of around 19:50 UTC.
The FP_ILM algorithm retrieved SO2 LHs extending up to 17 km (see Fig. 6); these show excellent agreement with the MLS SO2 profile measurements inside the plume (see colored circles in Fig. 6), with peaks at 16.75 km close to the volcano, and 14.31 km in the northern part of the plume (see Fig. 8). Furthermore, our results are in close agreement with CALIPSO measurements, clearly showing an attenuation by ash or aerosols at altitudes around 15–18 km (color-coded in orange). Fresh volcanic plumes are typically rich in water vapor (especially for tropical eruptions); thus, the volcanic clouds also contain high concentrations of water droplets. Therefore, the classification in the CALIPSO vertical feature mask sometimes fails to pick up the volcanic ash or sulfate aerosol because of competing clouds. Nevertheless the altitudes of the identified features are likely those of the volcanic plumes themselves, given the collocations in time and space. We note that the brightness temperature difference plots (not shown) can help in the identification of an ash layer, as the difference in the brightness temperature between the CALIPSO channels at 10.6 and 12.05 µm becomes negative for ash, whereas for normal clouds it is positive.
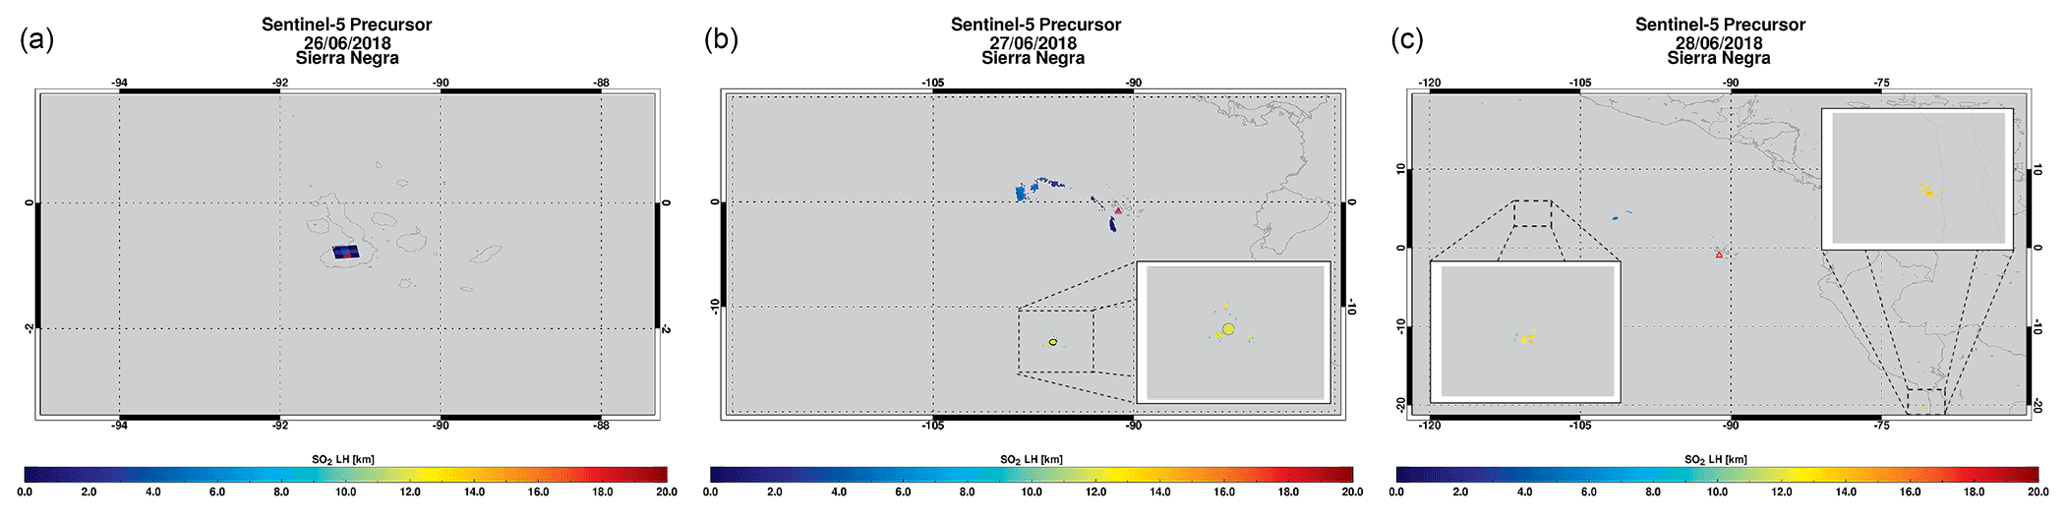
Figure 10FP_ILM SO2 LHs for the TROPOMI measurements shown in Fig. 9. Note that only pixels with SO2 VCD values greater than or equal to 20 DU are shown. The MLS SO2 measurement of the volcanic plume on 27 June is indicated by a colored circle.
In the figure we have superimposed our FP_ILM SO2 LH results in red dots. SO2 LHs retrieved for IASI/MetOp-A and -B measurements (not shown) indicated LH values at about 13 km for the 03:30 UTC overpass and LHs up to 18 km around the overpass time of 15:00 UTC; these results agree well with the TROPOMI results.
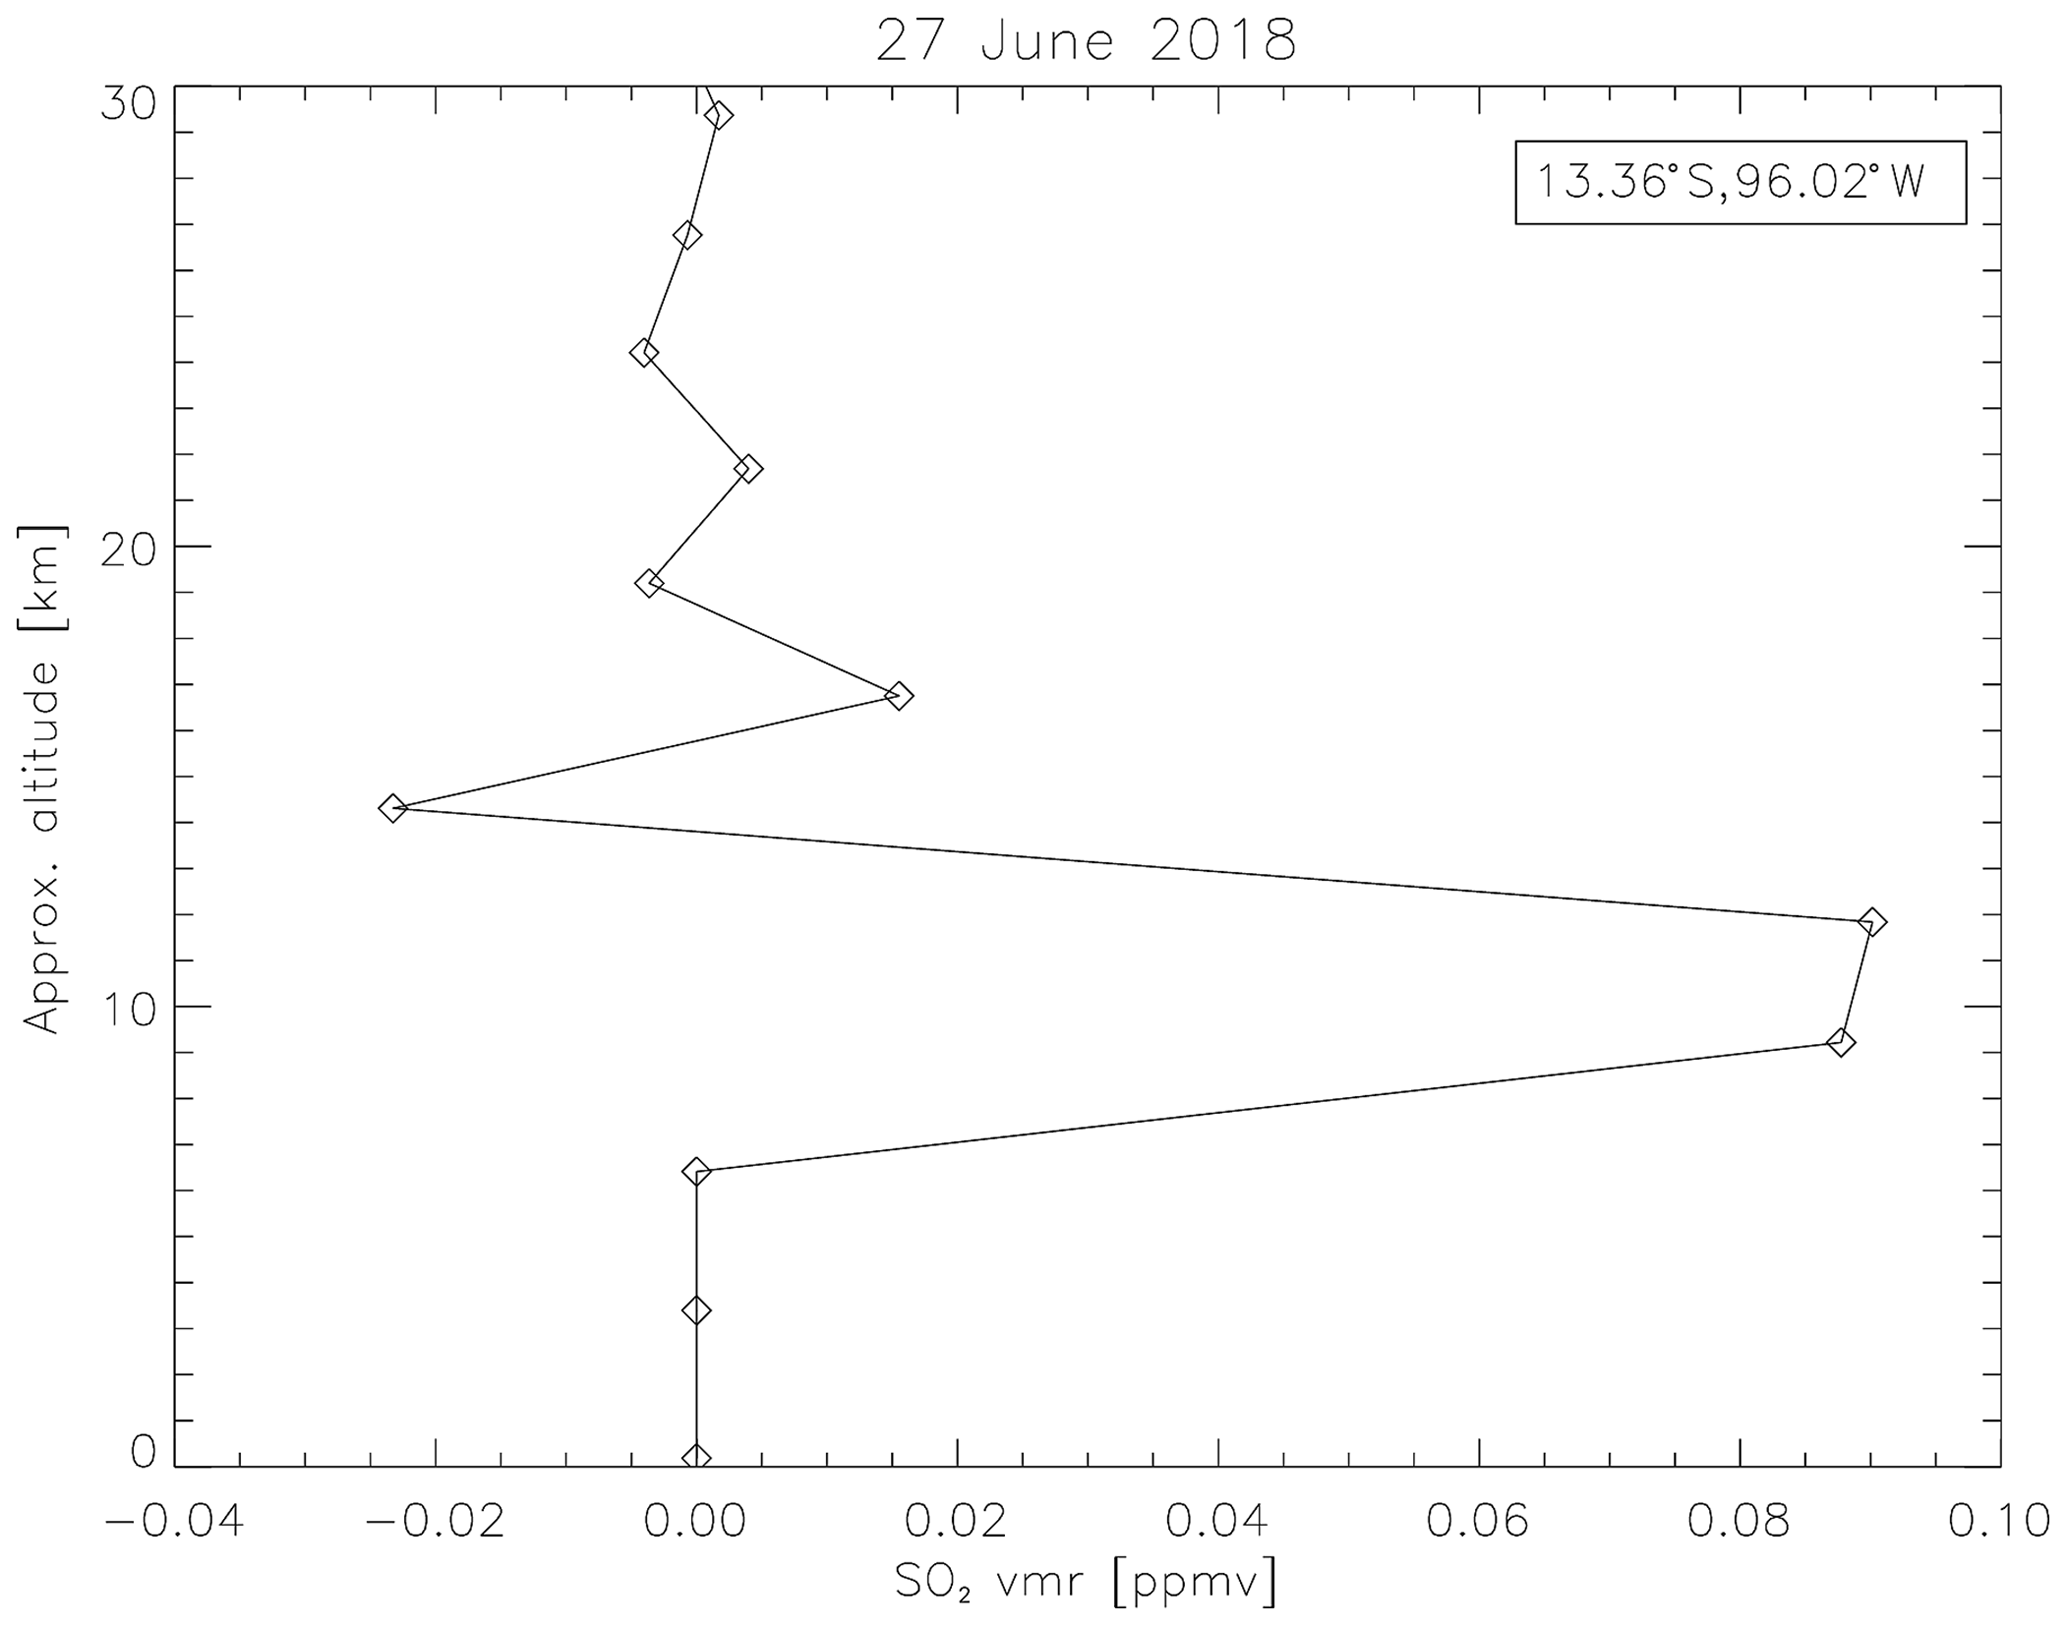
Figure 11MLS SO2 profile measured on 27 June 2018 (at a measurement time of 20:16 UTC) in the extended volcanic plume from the Sierra Negra eruption, clearly showing the presence of an SO2 layer at an altitude range from 9 to 11 km. The position of the measurements is shown in Fig. 10.
Also the Pusat Vulkanologi dan Mitigasi Bencana Geologi (see http://vsi.esdm.go.id/, last access: 14 October 2019) (PVMBG, also known as CVGHM) reported “a dark gray plume with a high volume of ash that rose at least to 16.8 km” at 08:53 UTC. Furthermore, the Darwin Volcanic Ash Advisory Center (see http://www.bom.gov.au/aviation/volcanic-ash/, last access: 14 October 2019) (VAAC) reported that LH values for these Sinabung ash plumes identified in satellite images, recorded by webcams, and reported by PVMBG continued to rise throughout the day to 13.7 km.
4.2 Sierra Negra
On 26 June 2018 a strong eruption occurred at the Sierra Negra shield volcano (1124 m summit elevation), located on Isabela Island (Galapagos). According to Venzke (2018a), this volcano has erupted several times since 1948, with the last eruption reported in 2005. After an increase in seismicity, Sierra Negra erupted at 20:09 UTC, producing a dense ash and SO2 plume. The eruption was divided into an initial very energetic phase (VEI = 3) characterized by the opening of five fissures that lasted 1 day, and a long phase with lava flows from 27 July to 23 August 2018 that also displayed decreased gas emissions. TROPOMI was able to measure a very strong SO2 plume (with loading in excess of 500 DU) only a few minutes (overpass at 20:12 UTC) after the start of the first eruption, as well as an extended SO2 plume for several days after the eruption.
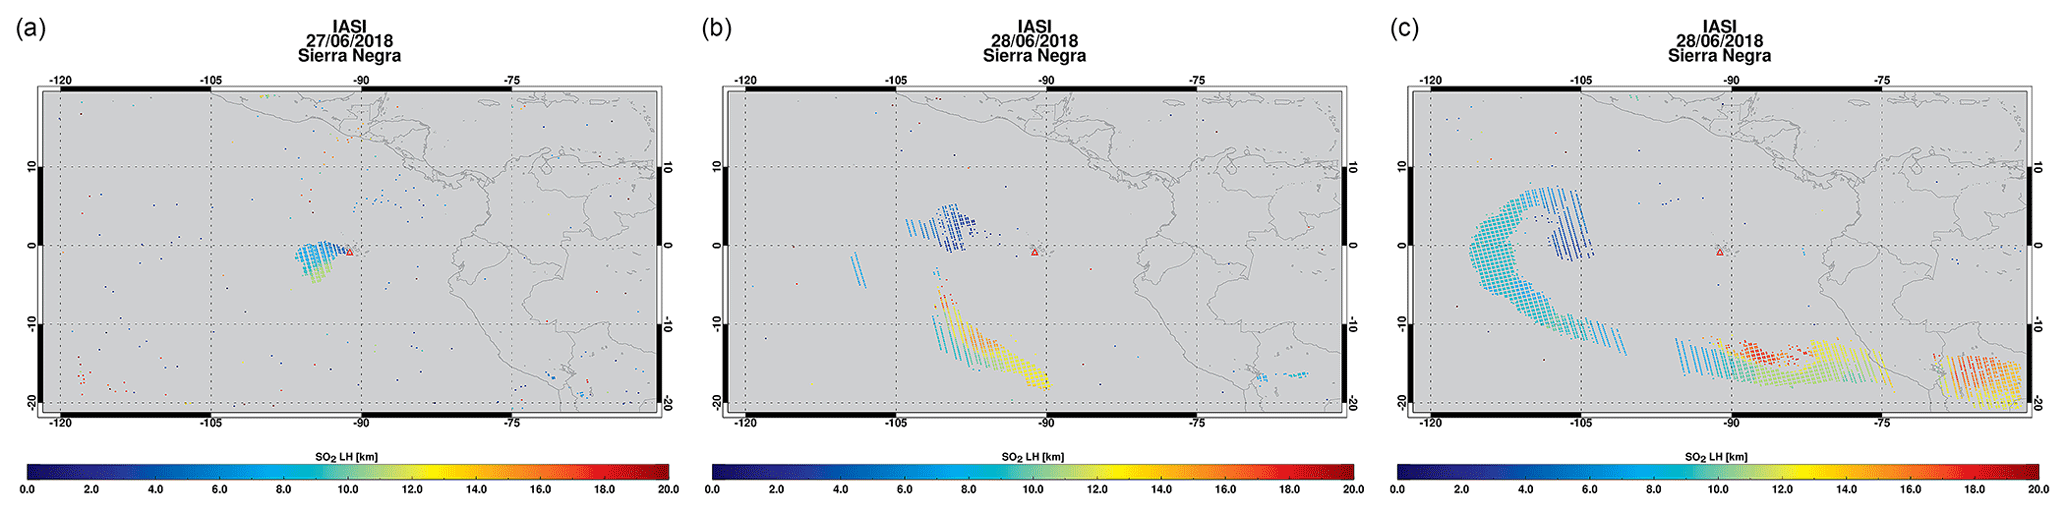
Figure 12MetOp-A and -B IASI SO2 LH results for the Sierra Negra SO2 plume from 27 (a) to 29 June 2018 (b) with overpass times of around 02:00 – about 6 h after the TROPOMI measurement.
Figure 9 shows the SO2 plume from 26 to 28 June at overpass times of around 20:12 UTC. The corresponding FP_ILM SO2 LH is shown in Fig. 10. On 26 June, shortly after the eruption began, the retrieved SO2 LH was around 4–6 km. On the following days, however, a much higher SO2 LH of around 14 km was retrieved by FP_ILM, with some parts of the plume reaching an altitude of about 18 km. We note here that these high SO2 LH values are not visible in the figure as they were retrieved for a SO2 VCD of about 10 DU and, hence, with low accuracy – in the figure only SO2 LH results for SO2 VCDs great than or equal to 20 DU are shown.
We found only one closely related MLS SO2 profile measurement intersecting the SO2 plume on 27 June, at a measurement time of 20:16 UTC, i.e., shortly after the TROPOMI measurement (see colored circle in Fig. 10b). The MLS data in Fig. 11 show an SO2 layer in the altitude range from 9 to 12 km, which is in excellent agreement with the FP_ILM SO2 LH results of around 11 to 13 km at the same coordinates (see zoom-in).
Figure 12 shows the SO2 LHs retrieved by IASI from 27 to 29 June. Note that the IASI overpass is at around 02:00 UTC – about 6 h after the TROPOMI overpass. Nevertheless the LHs retrieved close to the volcano are in very good agreement with the FP_ILM results, which are also at about 4–6 km. Similarly for the extended plume, for which only a few pixels are shown in Fig. 10, the agreement is very good, with LHs of about 13 km.
4.3 Raikoke
On 22 June 2019 at 04:00 local time, the Raikoke stratovolcano located on the Kuril Islands (Russia, 551 m summit elevation) erupted explosively (VEI ≥ 4) after being dormant since 1924. There were several strong distinct explosions, producing a dense ash and SO2 plume that rose to an altitude of 13 km the on the first few days and was entrained into the stratosphere (see Sennert, 2019). This was the strongest volcanic eruption since the Merapi eruption in 2011, producing a colossal SO2 plume with an SO2 loading of more than 900 DU on 22 June 2019, which was dispersed by strong winds over Russia and North America, and was even detectable 2 weeks after the volcanic eruption. The Raikoke eruption was still ongoing during the writing of this paper. Further results for this eruption are expected to be the subject of a future publication.
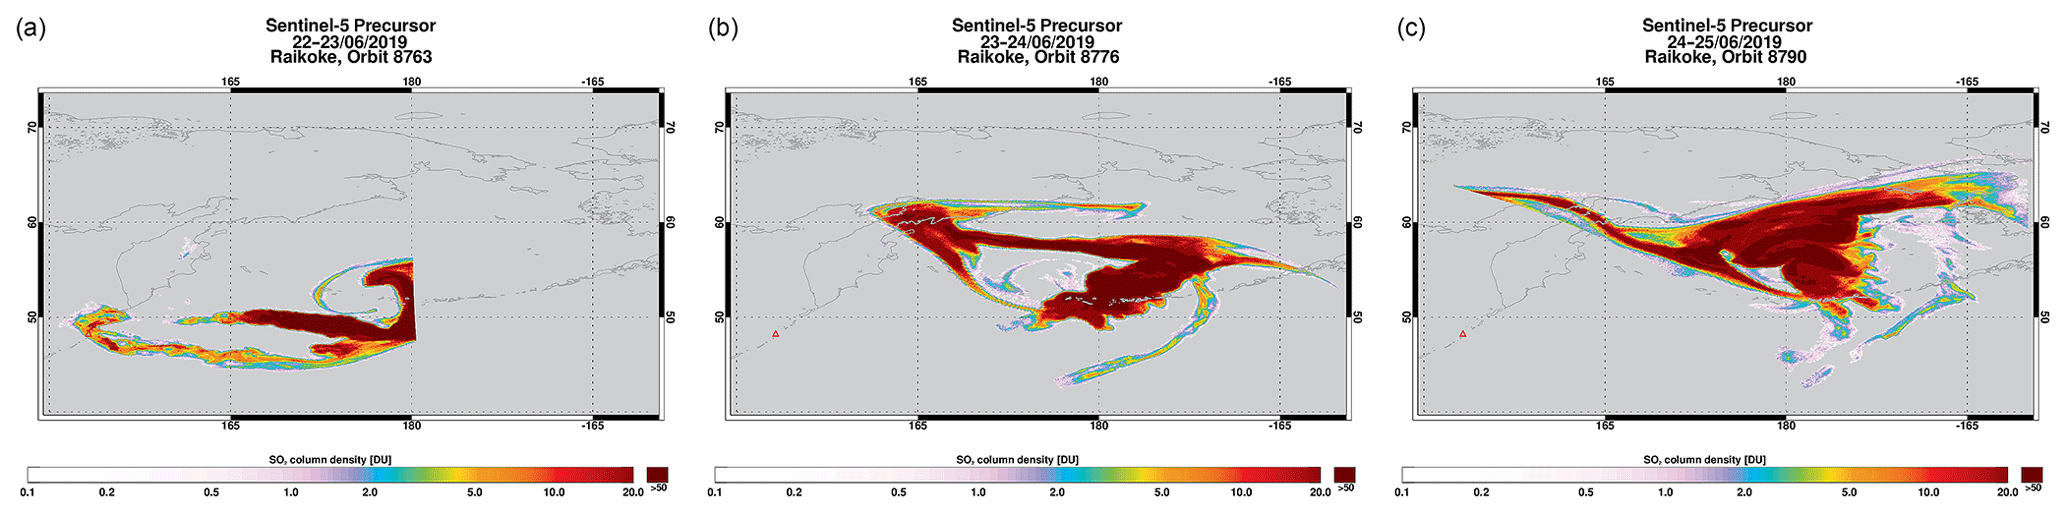
Figure 13SO2 VCD for the TROPOMI measurements of the Raikoke volcanic eruption, measured on 22/23 June 2019 (a), 23/24 June 2019 (b), and 24/25 June 2019 (c), with overpass times of around 02:00 UTC (Orbit 8763, a), and 00:00 UTC (orbits 8776 and 8790).
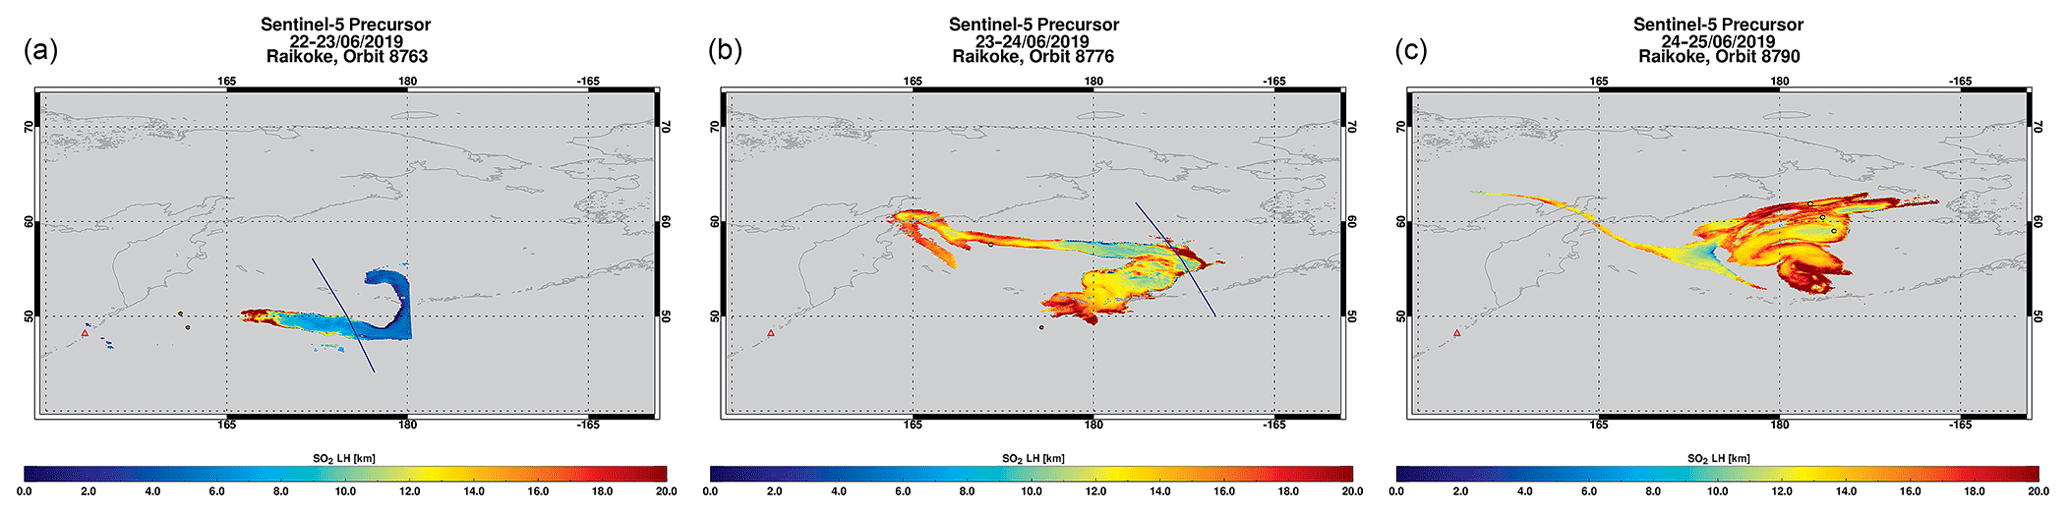
Figure 14SO2 LH retrieved for the TROPOMI orbits shown in Fig. 13. Only pixels with SO2 VCDs greater than or equal to 20 DU are shown. Colored circles indicate the MLS/Aura SO2 profile peak height for the results shown in Fig. 15. The blue lines indicate the CALIPSO ground track for the results shown in Fig. 16.
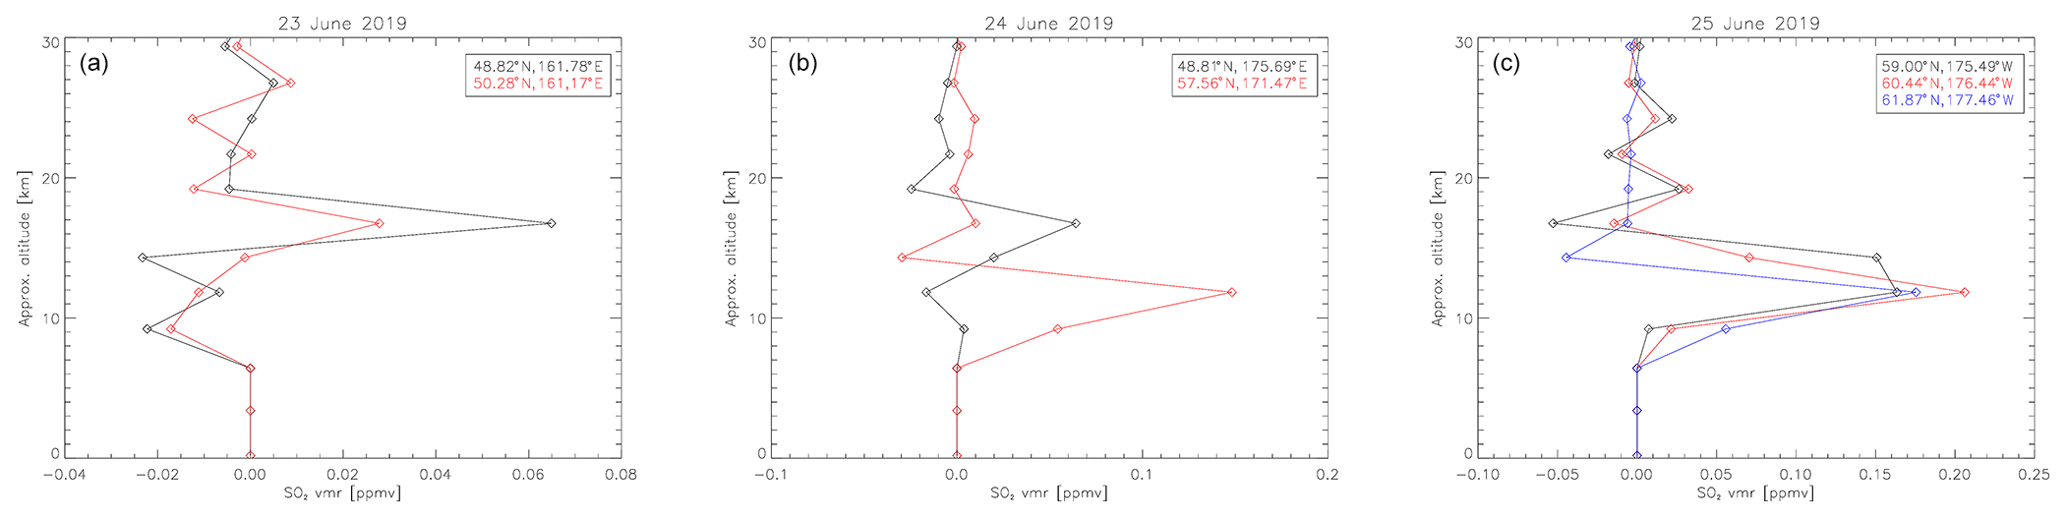
Figure 15MLS SO2 profiles measured on 23 June 2019 (a, overpass at around 02:20 UTC), 24 June 2019 (b, overpass at around 01:30 UTC), and 25 June 2019 (c, overpass at around 00:30 UTC), in the extended volcanic plume from the Raikoke eruption, clearly showing the presence of an SO2 layer at an altitude of around 17 km on 23 June, two distinct layers at 12 and 17 km at different positions of the plume on 24 June 2019, and around 12–14 km on 25 June 2019. The position of the measurements is shown in Fig. 14.
Figure 13 shows SO2 VCD measured by TROPOMI for the first 3 days after the eruption. Note that the SO2 plume is close to the date line with several overlapping S5P orbits at different overpass times. Therefore, we have chosen to plot only one single orbit per day in the images. The figure shows the plume at overpass times of around 00:00 and 02:00 UTC.
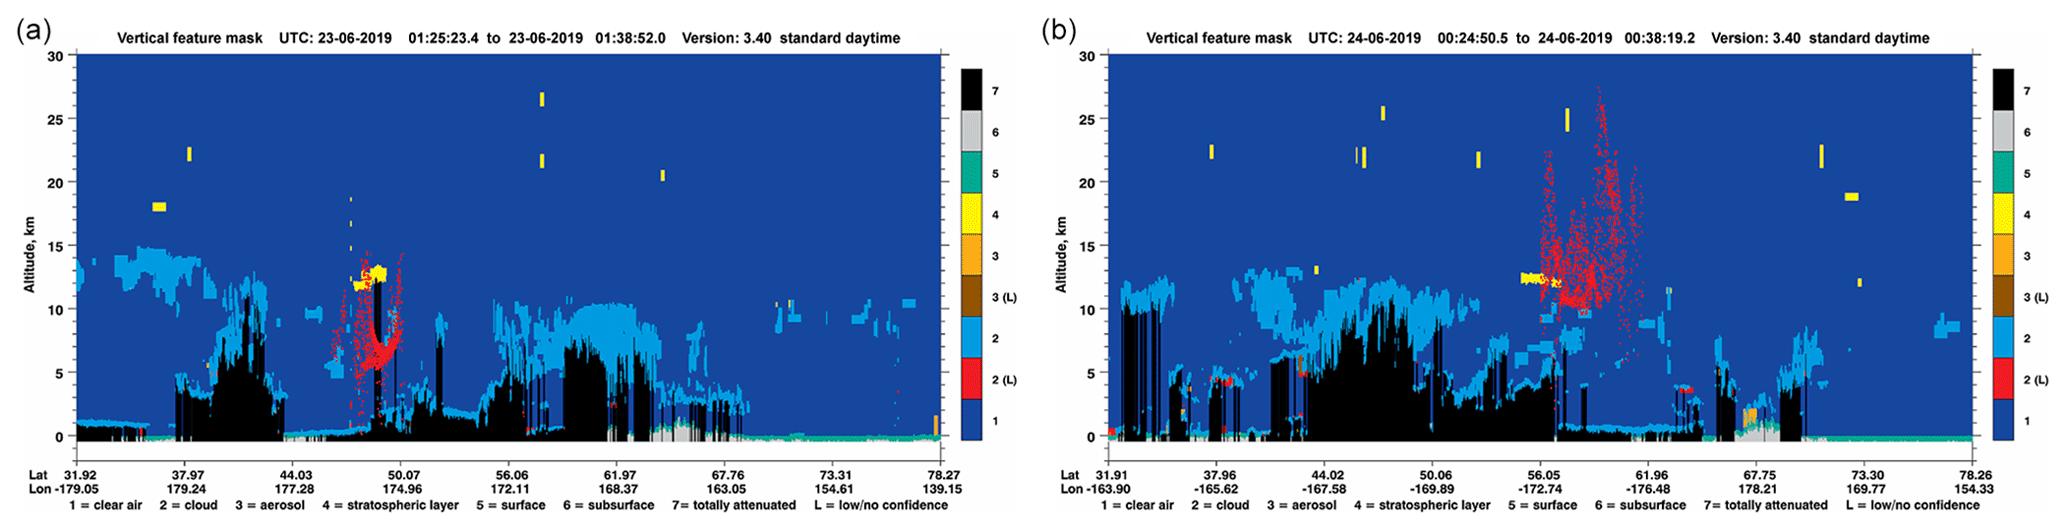
Figure 16CALIOP/CALIPSO vertical feature mask for the measurements of the Raikoke plume on 23 June 2019 at around 01:30 UTC (a) and on 24 June 2019 at around 00:30 UTC (b). Red dots show the retrieved FP_ILM SO2 LH for pixels with SO2 VCDs greater than or equal to 20 DU. The ground track of the CALIPSO measurements is shown in Fig. 14. Note that the classification scheme sometimes cannot pick up the volcanic ash or sulfate aerosol because of competing clouds. CALIPSO image credit: NASA.
Figure 14 shows the corresponding SO2 LH retrieved by the FP_ILM for SO2 VCDs greater than or equal to 20 DU. Clearly, the plume shows several layers, with SO2 LHs ranging from 6–8 km up to 19 km on 23 June and from 11 km up to 20 km on 24 June 2019. This is in very good agreement with MLS data (colored circles in the figure) with overpass times of around 02:20 UTC on 23 June (panel a), around 01:30 UTC on 24 June (panel b) and around 00:30 UTC on 25 June (panel c): the MLS profiles in Fig. 15 show an SO2 layer at 17 km on 23 June, two distinct layers at 12 and 17 km at different positions of the plume on 24 June, and a layer in the range from 12 to 14 km on 25 June.
In addition, CALIOP/CALIPSO was able to detect the ash plume during the first few days after the eruption, with plume height values in very good agreement with the FP_ILM SO2 LH results. On 22 June an ash plume at 17 km was detected (not shown here). The CALIPSO data from 23 June (overpass at around 01:30 UTC; shown in Fig. 16a) show an ash layer around 5–8 km in the northern part of the plume (i.e., around 46∘ N), and a second ash layer around 13 km in the southern part, which is in very good agreement with the FP_ILM SO2 LH results. On 24 June an ash layer at 13 km is visible which is in agreement with the lowest SO2 LHs retrieved. Note that the CALIPSO ground tracks are shown in Fig. 14 (blue line).
The latest IASI retrievals indicate that the bulk of the SO2 mass is contained at an altitude between 9 and 15 km (not shown here). We note that at the time of writing this paper, the IASI LH retrieval algorithm is undergoing improvements to handle cases with very large SO2 loadings in the center of the plume. As the Raikoke eruption was still ongoing during the writing of this paper, we refer here to an upcoming publication of the IASI results for the Raikoke eruption.
In this section we describe the manner in which the algorithm could be implemented in the operational S5P/TROPOMI ground segment.
As the same input parameters are used for retrieving operational SO2 VCD, i.e., O3 VCD, viewing parameters, and surface conditions as well as radiance and irradiance data, the FP_ILM algorithm can be easily integrated within the operational UPAS processor used for generating the SO2 products. In the operational TROPOMI environment, cloud properties and the O3 VCD are retrieved before the SO2 algorithm is started. Thus, all of the required input parameters are already available when the FP_ILM algorithm is triggered in the case of a volcanic eruption. Only the wavelength calibration and calculation of the reflectance spectrum has to be performed prior to retrieving the SO2 LH, as this step differs from the operational SO2 VCD retrieval.
To process a satellite pixel containing volcanic SO2, the FP_ILM algorithm should be triggered by the operational enhanced SO2 detection flag (see Theys, 2018 for a reference) and using a threshold (a priori) SO2 VCD of at least 10 DU. The resulting SO2 LH for this pixel should be stored in the final L2 SO2 product and can be also used to calculate an optimized SO2 VCD for this LH.
The SO2 LH retrieval only takes about 2 ms per TROPOMI spectrum; hence, even for an extended volcanic plume, the entire LH retrieval can be performed in a matter of seconds. This is important for operational retrieval environments with strong time constraints. Currently, the entire processing of a single TROPOMI pixel (i.e., cloud parameters, O3 and SO2 VCD retrieval) in the operational ground segment takes about 90 ms, which translates to about 24 min for an entire S5P orbit. Thus, the additional time required for the retrieval of the SO2 LH for selected pixels is not significant.
We have developed a new algorithm for the fast and accurate retrieval of SO2 layer heights from UV earthshine observations of volcanic SO2 eruptions by the TROPOMI sensor onboard the Sentinel-5 Precursor platform. The SO2 LH retrieval has two phases: (1) a computationally expensive off-line training phase in which the retrieval inverse operator is obtained using the FP_ILM (Full-Physics Learning Machine) algorithm, and (2) a fast operational phase, in which the FP_ILM inverse operator is applied to measured UV reflectance spectra. The FP_ILM combines a principal component analysis with a neural network regression using the UV reflectance, O3 total column, viewing geometries, and surface properties as input. Based on an optimized training dataset created with smart sampling techniques, the principal component scores calculated for reflectance spectra in the 310–335 nm wavelength range are used along with the other parameters to train a feed-forward artificial neural network. For S5P/TROPOMI measurement data, an initial dimensionality reduction of the reflectance spectra is performed by applying the PCA-derived principal component scores before retrieving SO2 LH with the trained neural network.
The FP_ILM can be used for NRT applications with strict time constraints. S5P/TROPOMI, with its high spatial and spectral resolution, provides a huge amount of data and the computationally intensive direct fitting approaches to SO2 LH retrieval developed so far are not applicable. In contrast, the FP_ILM operator performs SO2 LH retrieval within about 2 ms per TROPOMI spectrum. Hence, even the retrieval on extended volcanic plumes can be performed in a matter of a few seconds, allowing for the determination of the SO2 layer height with an accuracy better than 2 km for SO2 total column densities larger than 20 DU.
In this paper, we deployed an independent simulated reflectance spectra dataset to investigate the accuracy of SO2 LH retrievals and their dependencies on a number of different factors and parameters both direct and indirect. In particular, it was found that the retrieved SO2 LH is strongly dependent on the SO2 VCD for low VCDs (VCDs ≤ 20 DU) as well as for high SZAs (SZAs ≥ 75∘). For high VCDs and low SZA, according to closed-loop tests, the SO2 LH can be retrieved with an accuracy of better than 2 km. We also investigated the dependencies on ISRF and SNR, both of which turned out to be relatively slight effects.
Broad-band spectral scattering and absorption due to sulfate aerosols or volcanic ash plumes will certainly affect SO2 LH retrievals. Although not considered in the present work, we will address this important issue in a forthcoming paper in this series; aerosols will be explicitly accounted for in the training of the FP_ILM. Nevertheless, we should note that SO2 and ash are likely to be colocated only for fresh volcanic plumes. For mature plumes, mass differences will ensure that ash and SO2 plumes are not located at similar altitudes, and the corresponding plumes are thus subject to different wind-direction dispersal.
We applied the FP_ILM to a number of volcanic eruptions (VEI ≥ 3) observed recently by S5P/TROPOMI. Our SO2 LH results were compared to SO2 LHs retrieved from IR measurements from two MetOp/IASI satellites, as well as the NASA Aura/MLS SO2 profile and CALIOP/CALIPSO ash and aerosol measurements. Unfortunately the orbits of the MetOp satellites and S5P have widely different overpass times, allowing for only qualitative comparisons. Despite this, there is generally very good agreement between the IASI and TROPOMI results. Very good agreement with MLS data was found, which provides SO2 profiles with limited spatial coverage and vertical resolution, however with overpass times close to the S5P overpass. Nevertheless, further verification work is certainly needed. For the Sinabung eruption in February 2018 and the Raikoke eruption in 2019, our results also showed excellent agreement with CALIOP/CALIPSO LIDAR data measuring the ash plume.
Sentinel-5p SO2 L1 and L2 data can be accessed via the Sentinel-5p Pre-Operations Data Hub https://s5phub.copernicus.eu/dhus/\#/home (last access: 14 October 2019). S5p L2 SO2 data has https://doi.org/10.5270/S5P-yr8kdpp. IASI SO2 LH data is available via the IASI AERIS portal https://iasi.aeris-data.fr/SO2/ (last access: 14 October 2019). NASA CALIPSO data can be downloaded from https://www-calipso.larc.nasa.gov/ (last access: 16 October 2019). NASA MLS data can be downloaded from the NASA GES DISC archive https://acdisc.gesdisc.eosdis.nasa.gov/data/Aura_MLS_Level2/ML2SO2.004/ (last access: 16 October 2019). We note that all datasets can be also accessed via the NASA Earthdata website https://search.earthdata.nasa.gov/search (last access: 14 October 2019).
PH conceived of the study, with the help from DSE and DGL; carried out the analysis and retrievals; and wrote the paper. RS developed and provided the LIDORT-RRS code and related support, as well as the model description in the paper. LC provided the IASI SO2 LH datasets and associated support regarding using the dataset.
The authors declare that they have no conflict of interest.
This article is part of the special issue “TROPOMI on Sentinel-5 Precursor: first year in operation (AMT/ACPT inter-journal SI)”. It is not associated with a conference.
We are grateful to Nicolas Theys for helpful discussions of the SO2 layer height retrieval from UV sensors. We acknowledge ESA, KNMI, DLR, and BIRA for the Sentinel-5 Precursor L1 & L2 data and NASA for the CALIPSO and MLS data used in the paper. We would like to thank three anonymous referees for their comments that helped us improve the paper. We hereby acknowledge financial support from DLR (S5P KTR 2472046) for the development of TROPOMI retrieval algorithms as well as from EUNADICS-AV for the development of the SO2 LH retrieval algorithm. Lieven Clarisse is a research associate supported by the Belgian F.R.S.-FNRS. Sentinel-5 Precursor is a European Space Agency (ESA) mission on behalf of the European Commission (EC). The TROPOMI payload is a joint development of the ESA and the Netherlands Space Office (NSO). The Sentinel-5 Precursor ground-segment development has been funded by ESA and with national contributions from the Netherlands, Germany, and Belgium.
The article processing charges for this open-access publication were covered by a Research Centre of the Helmholtz Association.
This paper was edited by Ilse Aben and reviewed by three anonymous referees.
Bhartia, P.: Algorithm Theoretical Baseline Document, TOMS v8 Total ozone algorithm, Tech. rep., NASA, Greenbelt, Md., available at: https://disc.gsfc.nasa.gov/datasets/TOMSN7L3mtoz_V008/summary?keywords=ozone, (last access: 14 October 2019), 2003. a
Carboni, E., Grainger, R., Walker, J., Dudhia, A., and Siddans, R.: A new scheme for sulphur dioxide retrieval from IASI measurements: application to the Eyjafjallajökull eruption of April and May 2010, Atmos. Chem. Phys., 12, 11417–11434, https://doi.org/10.5194/acp-12-11417-2012, 2012. a
Carboni, E., Grainger, R. G., Mather, T. A., Pyle, D. M., Thomas, G. E., Siddans, R., Smith, A. J. A., Dudhia, A., Koukouli, M. E., and Balis, D.: The vertical distribution of volcanic SO2 plumes measured by IASI, Atmos. Chem. Phys., 16, 4343–4367, https://doi.org/10.5194/acp-16-4343-2016, 2016. a, b
Clarisse, L., Coheur, P. F., Prata, A. J., Hurtmans, D., Razavi, A., Phulpin, T., Hadji-Lazaro, J., and Clerbaux, C.: Tracking and quantifying volcanic SO2 with IASI, the September 2007 eruption at Jebel at Tair, Atmos. Chem. Phys., 8, 7723–7734, https://doi.org/10.5194/acp-8-7723-2008, 2008. a
Clarisse, L., Coheur, P.-F., Theys, N., Hurtmans, D., and Clerbaux, C.: The 2011 Nabro eruption, a SO2 plume height analysis using IASI measurements, Atmos. Chem. Phys., 14, 3095–3111, https://doi.org/10.5194/acp-14-3095-2014, 2014. a, b, c
Efremenko, D. S., Loyola R., D. G., Hedelt, P., and Spurr, R. J. D.: Volcanic SO2 plume height retrieval from UV sensors using a full-physics inverse learning machine algorithm, Int. J. Remote Sens., 38, 1–27, https://doi.org/10.1080/01431161.2017.1348644, 2017. a, b, c, d, e
Fioletov, V. E., McLinden, C. A., Krotkov, N., Yang, K., Loyola, D. G., Valks, P., Theys, N., Van Roozendael, M., Nowlan, C. R., Chance, K., Liu, X., Lee, C., and Martin, R. V.: Application of OMI, SCIAMACHY, and GOME-2 satellite SO2 retrievals for detection of large emission sources, J. Geophys. Res.-Atmos., 118, 11399–11418, https://doi.org/10.1002/jgrd.50826, 2013. a
Forster, P., Ramaswamy, V., Artaxo, P., Berntsen, J., Betts, R., Fahey, D. W., Haywood, J., Lean, J., Lowe, D. C., Myhre, G., Nganga, J., Prinn, R., Raga, G., Schulz, M., van Dorland, R., Bodeker, G., Boucher, O., Collins, W. D., Conway, T. J., Dlugokencky, E., Elkins, J. W., Etheridge, D., Foukal, P., Fraser, P., Geller, M., Joos, F., Keeling, C. D., Keeling, R., Kinne, S., Lassey, K., Lohmann, U., Manning, A. C., Montzka, S. A., Oram, D., O'Shaughnessy, K., Piper, S. C., Plattner, G. K., Ponater, M., Ramankutty, N., Reid, G. C., Rind, D., Rosenlof, K. H., Sausen, R., Schwarzkopf, D., Solanki, S. K., Stenchikov, G., Stuber, N., Takemura, T., Textor, C., Wang, R., Weiss, R., and Whorf, T.: Changes in atmospheric constituents and in radiative forcing, chap. 2, 129–234, Cambridge University Press, Cambridge, New York, 2007. a
Kleipool, Q., Ludewig, A., Babić, L., Bartstra, R., Braak, R., Dierssen, W., Dewitte, P.-J., Kenter, P., Landzaat, R., Leloux, J., Loots, E., Meijering, P., van der Plas, E., Rozemeijer, N., Schepers, D., Schiavini, D., Smeets, J., Vacanti, G., Vonk, F., and Veefkind, P.: Pre-launch calibration results of the TROPOMI payload on-board the Sentinel-5 Precursor satellite, Atmos. Meas. Tech., 11, 6439–6479, https://doi.org/10.5194/amt-11-6439-2018, 2018. a
Krueger, A. J., Walter, L. S., Bhartia, P. K., Schnetzler, C. C., Krotkov, N. A., Sprod, I., and Bluth, G. J. S.: Volcanic sulfur dioxide measurements from the total ozone mapping spectrometer instruments, J. Geophys. Res., 100, 14057–14076, https://doi.org/10.1029/95JD01222, 1995. a
Lee, C., Martin, R. V., van Donkelaar, A., Lee, H., Dickerson, R. R., Hains, J. C., Krotkov, N., Richter, A., Vinnikov, K., and Schwab, J. J.: SO2 emissions and lifetimes: Estimates from inverse modeling using in situ and global, space-based (SCIAMACHY and OMI) observations, J. Geophys. Res.-Atmos., 116, d06304, https://doi.org/10.1029/2010JD014758, 2011. a
Lerot, C., Van Roozendael, M., Spurr, R., Loyola, D., Coldewey-Egbers, M., Kochenova, S., van Gent, J., Koukouli, M., Balis, D., Lambert, J.-C., Granville, J., and Zehner, C.: Homogenized total ozone data records from the European sensors GOME/ERS-2, SCIAMACHY/Envisat, and GOME-2/MetOp-A, J. Geophys. Res.-Atmos., 119, 1639–1662, https://doi.org/10.1002/2013JD020831, 2014. a
Li, C., Krotkov, N. A., Carn, S., Zhang, Y., Spurr, R. J. D., and Joiner, J.: New-generation NASA Aura Ozone Monitoring Instrument (OMI) volcanic SO2 dataset: algorithm description, initial results, and continuation with the Suomi-NPP Ozone Mapping and Profiler Suite (OMPS), Atmos. Meas. Tech., 10, 445–458, https://doi.org/10.5194/amt-10-445-2017, 2017. a
Loyola, D. G.: Applications of neural network methods to the processing of earth observation satellite data, Neural Net., 19, 168–177, https://doi.org/10.1016/j.neunet.2006.01.010, 2006. a
Loyola, D. G., Pedergnana, M., and Gimeno Garcia, S.: Smart sampling and incremental function learning for very large high dimensional data, Neural Net., 78, 75–87, https://doi.org/10.1016/j.neunet.2015.09.001, 2016. a
Loyola, D. G., Xu, J., Heue, K.-P., and Zimmer, W.: Applying FP_ILM to the retrieval of geometry-dependent effective Lambertian equivalent reflectivity (GE_LER) to account for BRDF effects on UVN satellite measurements of trace gases, clouds and aerosols, Atmos. Meas. Tech. Discuss., https://doi.org/10.5194/amt-2019-37, in review, 2019. a
Malavelle, F. F., Haywood, J. M., Jones, A., Gettelman, A., Clarisse, L., Bauduin, S., Allan, R. P., Karset, I. H. H., Kristjánsson, J. E., Oreopoulos, L., Cho, N., Lee, D., Bellouin, N., Boucher, O., Grosvenor, D. P., Carslaw, K. S., Dhomse, S., Mann, G. W., Schmidt, A., Coe, H., Hartley, M. E., Dalvi, M., Hill, A. A., Johnson, B. T., Johnson, C. E., Knight, J. R., O'Connor, F. M., Partridge, D. G., Stier, P., Myhre, G., Platnick, S., Stephens, G. L., Takahashi, H., and Thordarson, T.: Strong constraints on aerosol-cloud interactions from volcanic eruptions, Nature, 546, 485–491, https://doi.org/10.1038/nature22974, 2017. a
McCormick, M. P., Thomason, L. W., and Trepte, C. R.: Atmospheric effects of the Mt Pinatubo eruption, Nature, 373, 399–404, https://doi.org/10.1038/373399a0, 1995. a
Myles, L., Meyers, T. P., and Robinson, L.: Relaxed eddy accumulation measurements of ammonia, nitric acid, sulfur dioxide and particulate sulfate dry deposition near Tampa, FL, USA, Environ. Res. Lett., 2, https://doi.org/10.1088/1748-9326/2/3/034004, 2011. a
Nowlan, C. R., Liu, X., Chance, K., Cai, Z., Kurosu, T. P., Lee, C., and Martin, R. V.: Retrievals of sulfur dioxide from the Global Ozone Monitoring Experiment 2 (GOME-2) using an optimal estimation approach: Algorithm and initial validation, J. Geophys. Res.-Atmos., 116, d18301, https://doi.org/10.1029/2011JD015808, 2011. a, b, c
Pedergnana, M., Loyola, D., Apitouley, A., Sneep, M., and Veefkind, P.: Sentinel-5 precursor/TROPOMI Level 2 Product User Manual Sulphur Dioxide SO2, Tech. Rep. 1.1.2, BIRA, https://sentinel.esa.int/documents/247904/2474726/Sentinel-5P-Level-2-Product-User-Manual-Sulphur-Dioxide (last access: 14 October 2019), 2018. a
Pumphrey, H. C., Read, W. G., Livesey, N. J., and Yang, K.: Observations of volcanic SO2 from MLS on Aura, Atmos. Meas. Tech., 8, 195–209, https://doi.org/10.5194/amt-8-195-2015, 2015. a
Rix, M., Valks, P., Hao, N., Loyola, D., Schlager, H., Huntrieser, H., Flemming, J., Koehler, U., Schumann, U., and Inness, A.: Volcanic SO2, BrO and plume height estimations using GOME-2 satellite measurements during the eruption of Eyjafjallajökull in May 2010, J. Geophys. Res.-Atmos., 117, D00U19, https://doi.org/10.1029/2011JD016718, 2012. a
Robock, A.: Volcanic eruptions and climate, Rev. Geophys., 38, 191–219, https://doi.org/10.1029/1998RG000054, 2000. a, b
Sennert, S. K. (Ed.): Report on Raikoke (Russia), Weekly Volcanic Activity Report, 19 June–25 June 2019, Global Volcanism Program, Smithsonian Institution and US Geological Survey, 2019. a
Spurr, R., de Haan, J., van Oss, R., and Vasilkov, A.: Discrete-ordinate radiative transfer in a stratified medium with first-order rotational Raman scattering, J. Quant. Spectrosc. Ra., 109, 404–425, https://doi.org/10.1016/j.jqsrt.2007.08.011, 2008. a, b
Theys, N., De Smedt, I., Yu, H., Danckaert, T., van Gent, J., Hörmann, C., Wagner, T., Hedelt, P., Bauer, H., Romahn, F., Pedergnana, M., Loyola, D., and Van Roozendael, M.: Sulfur dioxide retrievals from TROPOMI onboard Sentinel-5 Precursor: algorithm theoretical basis, Atmos. Meas. Tech., 10, 119–153, https://doi.org/10.5194/amt-10-119-2017, 2017. a
Theys, N. E. A.: S5P/TROPOMI SO2 ATBD, Tech. Rep. 1.1.0, BIRA, available at: https://sentinels.copernicus.eu/documents/247904/2476257/Sentinel-5P-ATBD-SO2-TROPOMI (last access: 14 October 2019), 2018. a
Venzke, E. (Ed.): Report on Sierra Negra (Ecuador), Bulletin of the Global Volcanism Network, 43, Global Volcanism Program, Smithsonian Institution, 2018a. a
Venzke, E. (Ed.): Report on Sinabung (Indonesia), Bulletin of the Global Volcanism Network, 43, Global Volcanism Program, Smithsonian Institution, 2018b. a
von Glasow, R., Bobrowski, N., and Kern, C.: The effects of volcanic eruptions on atmospheric chemistry, Chem. Geol., 263, 131–142, https://doi.org/10.1016/j.chemgeo.2008.08.020, 2009. a
Winker, D. M., Pelon, J., Coakley, J. A., Ackerman, S. A., Charlson, R. J., Colarco, P. R., Flamant, P., Fu, Q., Hoff, R. M., Kittaka, C., Kubar, T. L., Le Treut, H., Mccormick, M. P., Mégie, G., Poole, L., Powell, K., Trepte, C., Vaughan, M. A., and Wielicki, B. A.: The CALIPSO Mission, B. Am. Meteor. Soc., 91, 1211–1230, https://doi.org/10.1175/2010BAMS3009.1, 2010. a
Xu, J., Schüssler, O., Loyola R., D., Romahn, F., and Doicu, A.: A novel ozone profile shape retrieval using Full-Physics Inverse Learning Machine (FP-ILM)., IEEE J. Sel. Topics Appl. Earth Observ. Remote Sens., 10, 5442–5457, https://doi.org/10.1109/JSTARS.2017.2740168, 2017. a
Yang, K., Liu, X., Krotkov, N. A., Krueger, A. J., and Carn, S. A.: Estimating the altitude of volcanic sulfur dioxide plumes from space borne hyper-spectral UV measurements, Geophys. Res. Lett., 36, https://doi.org/10.1029/2009GL038025, 2009. a, b, c
Yang, K., Liu, X., Bhartia, P. K., Krotkov, N. A., Carn, S. A., Hughes, E. J., Krueger, A. J., Spurr, R. J. D., and Trahan, S. G.: Direct retrieval of sulfur dioxide amount and altitude from spaceborne hyperspectral UV measurements: Theory and application, J. Geophys. Res.-Atmos., 115, https://doi.org/10.1029/2010JD013982, 2010. a