the Creative Commons Attribution 4.0 License.
the Creative Commons Attribution 4.0 License.
 | 04 Nov 2019
SAETTA: high-resolution 3-D mapping of the total lightning activity in the Mediterranean Basin over Corsica, with a focus on a mesoscale convective system event
Sylvain Coquillat
Eric Defer
Pierre de Guibert
Dominique Lambert
Jean-Pierre Pinty
Véronique Pont
Serge Prieur
Ronald J. Thomas
Paul R. Krehbiel
William Rison
Deployed on the mountainous island of Corsica for thunderstorm monitoring purposes in the Mediterranean Basin, SAETTA is a network of 12 LMA (Lightning Mapping Array, designed by New Mexico Tech, USA) stations that allows the 3-D mapping of very high-frequency (VHF) radiation emitted by cloud discharges in the 60–66 MHz band. It works at high temporal (∼40 ns in each 80 µs time window) and spatial (tens of meters at best) resolution within a range of about 350 km. Originally deployed in May 2014, SAETTA was commissioned during the summer and autumn seasons and has now been permanently operational since April 2016 until at least the end of 2020. We first evaluate the performances of SAETTA through the radial, azimuthal, and altitude errors of VHF source localization with the theoretical model of Thomas et al. (2004). We also compute on a 240 km × 240 km domain the minimum altitude at which a VHF source can be detected by at least six stations by taking into account the masking effect of the relief. We then report the 3-year observations on the same domain in terms of number of lightning days per square kilometer (i.e., total number of days during which lightning has been detected in a given 1 km square pixel) and in terms of lightning days integrated across the domain. The lightning activity is first maximum in June because of daytime convection driven by solar energy input, but concentrates on a specific hot spot in July just above the intersection of the three main valleys. This hot spot is probably due to the low-level convergence of moist air fluxes from sea breezes channeled by the three valleys. Lightning activity increases again in September due to numerous small thunderstorms above the sea and to some high-precipitation events. Finally we report lightning observations of unusual high-altitude discharges associated with the mesoscale convective system of 8 June 2015. Most of them are small discharges on top of an intense convective core during convective surges. They are considered in the flash classification of Thomas et al. (2003) to be small–isolated and short–isolated flashes. The other high-altitude discharges, much less numerous, are long-range flashes that develop through the stratiform region and suddenly undergo upward propagations towards an uppermost thin layer of charge. This latter observation is apparently consistent with the recent conceptual model of Dye and Bansemer (2019) that explains such an upper-level layer of charge in the stratiform region by the development of a non-riming ice collisional charging in a mesoscale updraft.


Lightning is a multiscale phenomenon that occurs at the end of a chain of dynamical and microphysical processes that act throughout the formation and the lifetime of a thunderstorm cloud. The key processes are low-level convergence of moist air, convection, liquid and solid condensation of water vapor, latent heat release, interactions between cloud particles, and precipitation, all resulting in cloud electrification. Lightning acts as a relaxation and a limiter of the electric field resulting from the cloud electrification due to microphysical interactions, especially by the noninductive charging process during graupel–ice crystal collisions (see Saunders, 2008). It can therefore be considered a bulk tracer of the intense convection or a proxy of each of the cloud processes mentioned above provided it is observed at high spatial and time resolutions.
Various lightning detection systems have been used so far in operational mode or for scientific research purposes. Most of them are designed to detect the electromagnetic field radiated by lightning in the low-frequency (LF; 30–300 kHz) and very low-frequency (VLF; 3–30 kHz) ranges. Those ones (e.g., Euclid-Météorage, ATDnet, and ZEUS in Europe; NLDN in the USA; or WWLLN worldwide) can localize at rather long range the ground impact of the return stroke that is the most powerful phase of a cloud-to-ground (CG) lightning flash, or it can localize intracloud discharges in 2-D. The networks do not yet provide comprehensive information on the thunderstorm cell by which the lightning flashes are produced. Some detection systems such as the LMA (Lightning Mapping Array of the New Mexico Tech; see Thomas et al., 2004) are designed to observe lightning in the very high-frequency (VHF; 30–300 MHz) range, which allows detection of the lightning leader phases and mapping of the lightning branches inside the cloud. This provides information on lightning closely linked with the microphysical structure of the cloud in which the discharges propagate.
In the frame of the HyMeX program (Ducrocq et al., 2014), which aims at documenting the water cycle in the Mediterranean Basin that is considered a climatic hot spot (Giorgi, 2006), we plan to monitor the convection to address the question about the evolution of high-precipitation events and deep convection in response to climate change. For this purpose, the Collectivité Territoriale de Corse – via the PCOA (CORSiCA Atmospheric Observations Platform, https://corsica.obs-mip.fr/, last access: 23 October 2019) – gave us the opportunity to equip Corsica with a LMA network that is considered a reference for the accurate detection of total lightning activity. The instrument is called SAETTA, which is the abbreviation of “Suivi de l'Activité Electrique Tridimensionnelle Totale de l'Atmosphère” (monitoring of the total tridimensional electrical activity of the atmosphere) that means “lightning” in the Corsican language. In combination with the CG observation of Météorage (the French part of the Euclid network), this setup provides a comprehensive description of the total lightning activity.
As a matter of fact, Corsica has a complex and tortuous relief, with mountainous massifs made up of more than a hundred summits, culminating at more than 2000 m altitude, located only a few kilometers from the coasts. Thus it is often described as “a mountain in the sea”. Another important aspect is the upwind sea surface evaporation forced by synoptic flows (Adler et al., 2016; Scheffknecht et al., 2016). These characteristic features of the mountainous island explain the torrential nature of the rivers of Corsica. The climatic particularities related to its geographical position combined with its specific relief generate very violent precipitation which can spread over time, generating torrential floods, especially in autumn (Lambert and Argence, 2008; Scheffknecht et al., 2016, 2017). The deployment of the LMA in this area will allow us to address scientific issues related to stormy convection in a complex maritime and mountain environment, where fine-scale processes make its forecast trickier. Sea, valley, and slope breezes are expected to play a key part in the triggering of convection (Barthlott and Kirshbaum, 2013; Tidiga et al., 2018). The influence of mid- and upper-level synoptic fluxes on these local dynamical features can even complicate the process (Ducrocq et al., 2008); meanwhile low-level fluxes are continuously carrying humid air from the surrounding sea (Adler et al., 2016).
The initial deployment of SAETTA in Corsica took place in May 2014. SAETTA functioned operationally from July to October in 2014 and from April to December in 2015, and has been in permanent operation since April 2016 until at least the end of 2020. It is planned to operate well into the future in order to obtain long-term observations for issues related to climatic trends. So far, SAETTA has documented lightning activity from the regional scale to the flash scale, providing a monthly climatology showing different trends from one month to the next, but also specific observations of lightning of all types – including unusual flashes showing a jump towards the top of the cloud in its trailing stratiform region – and even inverted dipolar structures.
In the following, we first present the SAETTA network and its performances in Sect. 2, then describe the overall observations performed from 2014 to 2016 in Sect. 3, describe insight into specific and unusual events detected so far at storm and lightning scales in Sect. 4, and discuss the perspective of such an instrument with respect to the scientific questions addressed and to the operational needs for ground-based and spaceborne lightning observations. Several results presented benefited from the use of the XLMA software developed by Ron Thomas (Thomas et al., 2003), which was used as an analysis and display tool.
The SAETTA network consists of 12 LMA stations (Lightning Mapping Array, developed by New Mexico Tech, USA), which allow the mapping of lightning flashes in three dimensions in real time, at high temporal and spatial resolutions, within a range of about 350 km centered on Corsica. Actually, each station independently detects – in the 60–66 MHz bandwidth – the impulsive radio frequency radiations produced by the leader phase of lightning flashes and accurately measures the time of arrival of the signals thanks to an accurate time base provided by a GPS receiver. Hence, a leader segment – so-called VHF source hereafter – that emits an impulsive radiation from the position (x, y, z) and at the time t detected by at least four stations of the network can be fairly accurately located and dated using the time of arrival (TOA) technique (see Appendix A in Thomas et al., 2004). As a matter of fact, a minimum of six stations are required in the data processing although only four unknowns (x, y, z, t) are to be determined for each VHF source. This consideration of redundant measurements is useful for checking the solution's validity.
Several advantages arise from a 12-station network: for instance, the redundancy/reliability in the case of short-term and long-term failures, the effect of localized high-rate storms on a sensor's contribution to more-distant activity, and the improved geometry for geo-location of distant lightning while maintaining height accuracy for nearby low-altitude lightning channels. Another advantage would be that more VHF sources can be located during a given discharge because two different sets of six stations can detect sources in the same time window. Nevertheless, during a high-flash-rate period or during spread and very active events, each lightning flash is logically less well sampled since sources emitted by numerous different lightning flashes compete to be detected by the two sets of six stations in the same time windows.
A comprehensive description of the operation of LMA stations is available in Appendix A of Thomas et al. (2004). As in all LMA systems, each SAETTA station is configured to record on an internal disk the amplitude and the arrival time of the strongest radiation event – above an adjusted detection threshold – which it detects and digitizes in each time window of 80 µs. The accurate time of arrival is obtained thanks to a GPS receiver (timing error of about 12 ns) that controls the frequency of a 25 MHz oscillator allowing the data acquisition with a theoretical 40 ns time resolution within each 80 µs time window (see Thomas et al., 2004, for explanation about the actual time resolution). The data are collected on site at each station by changing the internal disks, which are brought back to the Laboratoire d'Aérologie in Toulouse (France) to implement the calculation of the 3-D position of the VHF sources. In addition, each station is connected by wireless communication links via a modem and a GSM antenna in order (i) to monitor and control the station operation by displaying a large amount of information (e.g., the detection threshold, the filling rate of the internal disk, the battery voltage, the load current from the solar panel) and (ii) to send decimated data in real time (temporal resolution degraded to 400 µs and with higher detection threshold) to a central calculator for real-time processing and display, with about 1 min of delay (http://lma.aero.obs-mip.fr/temps_reel.html, last access: 23 October 2019). During specific periods such as a measurement campaign, the time window of the recorded data can be reduced to 10 µs and the detection threshold of the decimated data sent by telephony can be reduced too, both remotely. The main advantage of reducing the time window is to allow detection of more VHF sources during fast lightning processes like, for example, dart leaders that typically last only a few hundred microseconds and therefore are not well sampled with an 80 µs time window.
2.1 Location of the SAETTA stations
The 12 SAETTA stations are spread over an area about 70 km in the west–east direction and about 180 km in the south–north direction (see Fig. 1). The distances between two stations vary from 20.7 to 180.8 km, with an average value of 67.3 km. This geographic configuration is unique to the SAETTA network compared to the other LMA networks; i.e., SAETTA is a relatively large network for almost the same number of stations. By comparison, the New Mexico Tech LMA network (see Thomas et al., 2004) is constituted of 13 stations with a minimum distance between them of about 12 km, a maximum of about 76 km, and an average of 36 km, which is approximately half of SAETTA characteristics.
This configuration dates back to 2016. In the previous two years 2014 and 2015, the stations now located in Ersa and in Pertusato (the northern and southern ends of the network, respectively), were located in Foce di Bilia on a hill 35 km northwest of Pertusato station and in Pinarellu on the roof of the Genoese tower of Pinarellu Island, 27 km southeast of Coscione station. This change was made because the former sites had not been entirely satisfactory in terms of noise level and functionality. In this previous configuration, the distances between two stations varied from 20.7 to 118.0 km, with an average value of 59.8 km. Thus, the new configuration has led to an extension of the network in the south–north direction.
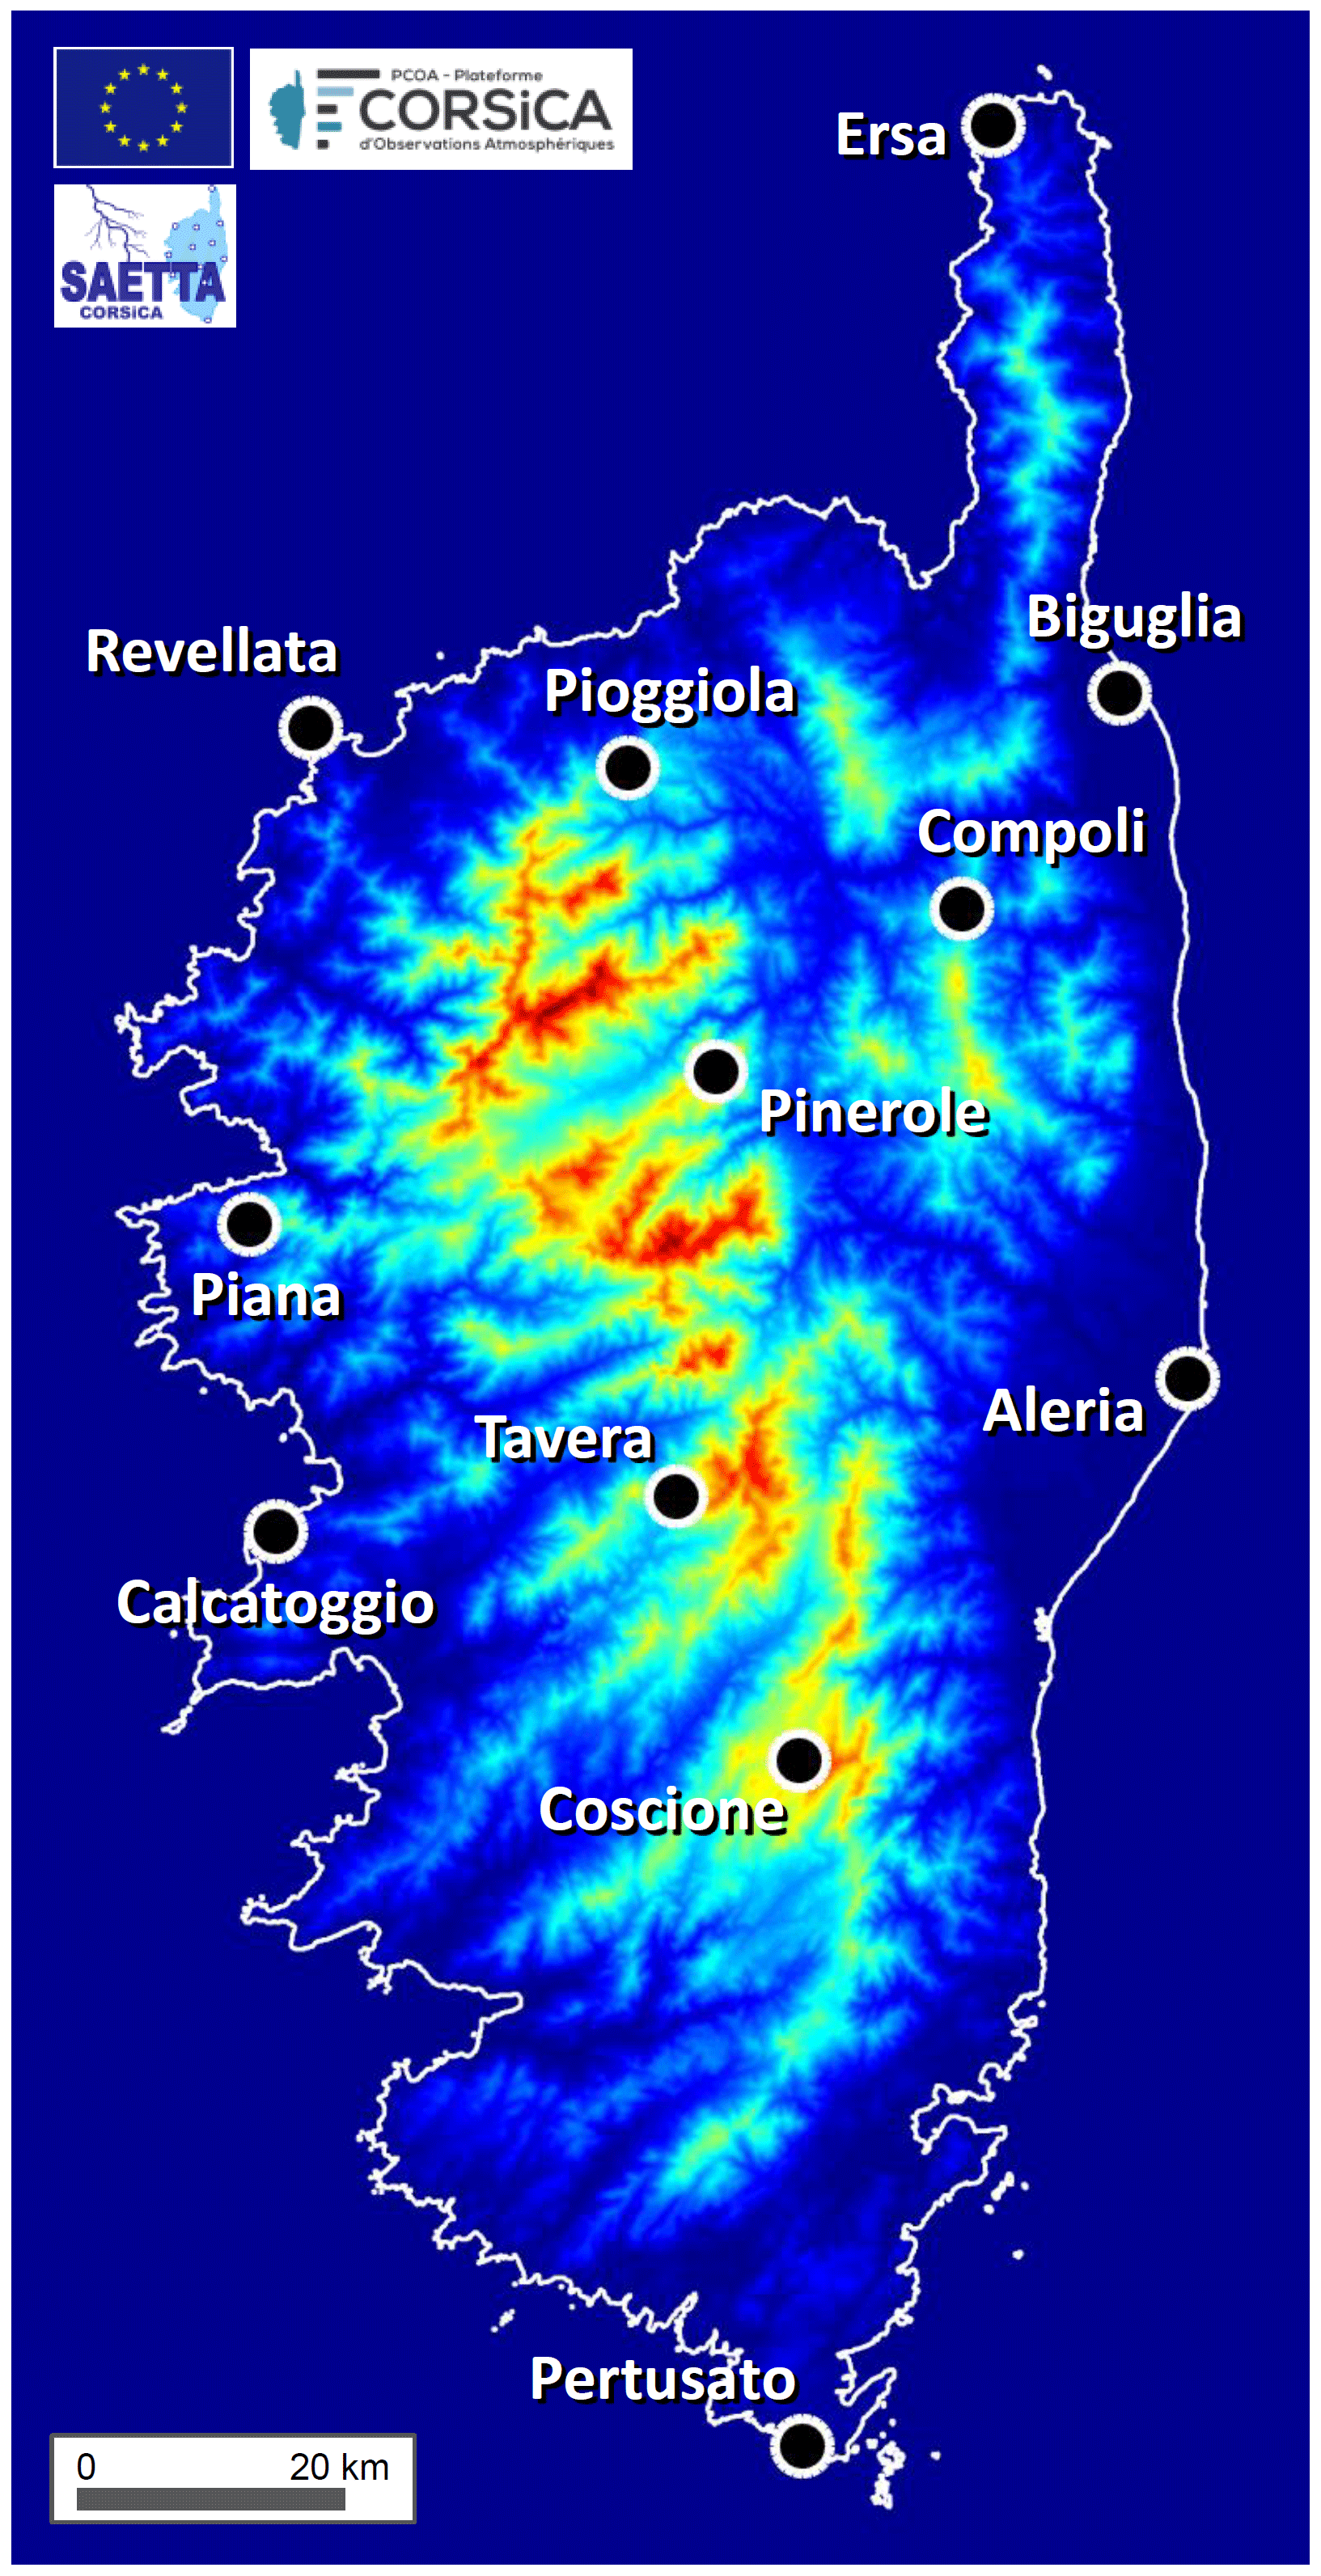
Figure 1Map of Corsica with the location of the 12 SAETTA stations since 2016.
The stations are located on sites as remote as possible from any electromagnetic pollution, with the widest possible field of view of the sky (LMA is line of sight, so it only detects sources above the horizon), and with proper access to the GSM mobile phone network. The choice of sites faced two challenges: (i) put as many stations aloft to maximize the power of detection by avoiding any masking effect by the relief and (ii) find accessible sites, these two objectives being most often antithetical. Basically, five stations are located on the summit of relatively high mountains along the main south–north dorsal ridge; the rest are installed on the outskirts of Corsica, more or less close to the sea in relatively high and unobstructed places. This configuration makes it possible to detect VHF sources at low altitude by at least six stations on either side of the central mountain range of the island. It nevertheless has a disadvantage in winter conditions since the high-altitude stations can be covered with snow and automatically put into hibernation during this period.
Table 1Altitude above mean sea level (m) of the 12 SAETTA stations during the first period from 2014 to 2015 (third column) and since 2016 when three stations were moved (fourth column). The vertical difference is the difference in altitude between the highest and the lowest stations.

Consequently, the SAETTA network has another unique configuration: the altitude range of the SAETTA stations (see Table 1) is much wider than that of most other networks, particularly in the USA. The gap between the maximum and the minimum altitudes reaches 1946.4 m. By comparison, the equivalent gap is less than about 520 m for the Oklahoma LMA, less than about 460 m for the New Mexico Tech LMA used during the STEPS campaign in Colorado and Arkansas, and equal to 335.4 m for the north Alabama LMA (see Koshak et al., 2004). The SAETTA configuration thus possesses a significant vertical baseline. According to Thomas et al. (2004) and Koshak et al. (2004), this characteristic is expected to allow for a better determination of the VHF source altitude for distant sources. This point is addressed hereafter in Sect. 2.3.

Figure 2Capability of VHF source detection by the SAETTA network in the 240 km × 240 km domain of better detection accuracy centered on Corsica: minimum altitude of direct vision by at least six stations of the network. (a) Full network with 12 stations (red squares). (b) Network with the three highest stations off (e.g., because of snow cover in winter). Isocontours at 1000 m altitude are indicated by black lines. Horizontal resolution: 5 km; vertical resolution: 500 m.
2.2 Geometric capability of VHF source detection by SAETTA
In order to give an idea of the capability of VHF source detection by SAETTA, the minimum altitude at which a VHF source can be directly seen by at least six SAETTA stations was computed, with the complete network on the one hand and with the three highest-altitude stations turned off (because of snow cover in winter conditions) on the other hand. The details of the calculation, which takes into account the roundness of the Earth but not the atmospheric refraction, are presented in Appendix A. The results are displayed as maps in Fig. 2. The considered domain is 240 km × 240 km centered on the Pinerole station, which is the highest of the network (1950 m). This domain corresponds to the field of better detection accuracy by SAETTA (see Sect. 2.3). The chosen horizontal (5 km) and vertical (500 m) resolutions are rather weak because the calculations are very time-consuming, but the maps give a good idea of the SAETTA detection capability. Most of the VHF sources can be detected above about 1 km or less on the west and east sides of the island, above 2 to 3 km over and north of Corsica, and only above 4 to 5 km beyond 100 km from the center of the island in seven sectors in the south and southeast of Corsica. In winter conditions, the detection capability deteriorates significantly, especially in the southwest where it is impossible to detect sources below 7–8 km. Anywhere else, 5 km seems to be the average minimum altitude in winter, except in the NW and NE corners of the sea domain where low levels can still be scrutinized. For longer-range observation up to about 350 km from the center of the network, see Sect. 3.1. One must keep in mind that atmospheric refraction is not taken into account in the calculations; consequently the altitudes calculated here overestimate the real minimum altitudes of VHF source detection. Actually, electromagnetic waves propagating in the clear sky are deflected downwards because of the refractive index gradient, which is most often directed downward. Therefore, VHF sources can be detected even below the limits indicated in Fig. 2.
2.3 Location accuracy of the SAETTA network
With regard to the uncertainty of localization of VHF sources by the SAETTA network, reference can be made to the article by Thomas et al. (2004), who evaluated both theoretically and experimentally the location accuracy of the LMA used during the STEPS 2000 experiment (Lang et al., 2004). They found that short-duration pulses emitted by a VHF transmitter carried by a sounding balloon between 6 and 12 km altitude over the central part of the network were located with an accuracy of about 6–12 m in the horizontal position and about 20–30 m in height, in the optimal situation. They also developed a geometrical model the results of which were in good agreement with experimentally observed errors from a sounding balloon and from aircraft tracks. Koshak et al. (2004) also addressed the problem of location accuracy of the LMA by developing a source retrieval algorithm for theoretically studying the location errors. More recently, Chmielewski and Bruning (2016) have explored location errors and detection efficiency of various LMA networks in the United States by means of model simulations based on methods previously developed by Koshak et al. (2004) and Thomas et al. (2004).
The geometric model of Thomas et al. (2004) is therefore a suitable tool for evaluating the SAETTA network performances. It provides analytical formulations of the increase in the source location uncertainties with distance, based on the spherical coordinates (r, θ, ϕ) of a VHF source relative to the center of the network. For example, the azimuth angle ϕ is determined primarily by stations having the greatest separation transverse to the propagation line of the signal emitted by the sources. Therefore, the more extended the network is in any direction, the better the determination of the azimuth angle ϕ. Given the larger extension of the SAETTA network in the south–north direction, azimuth angles are therefore expected to be better determined in the west–east direction. This is confirmed by the errors calculated with the geometrical model, for VHF sources at 10 km altitude seen from 12 stations, and displayed in Fig. 3. The azimuthal errors, which correspond to the central graphs, exhibit lower values in the west–east direction. Furthermore, the comparison between the 2014–2015 network and the 2016 network configurations confirms that the larger the south-to-north extension of the network, the lower the errors are in the west–east direction. The same behavior can be pointed out from Fig. 3 for the range error since it also depends on the transverse extent according to Thomas et al. (2004). One can turn his attention to the fact that the theoretical errors are calculated here for sources located at 10 km altitude and detected by 12 stations. This is the best case for comparing networks. But if we consider lower sources, the errors will increase, especially at a low level where sources cannot be detected by numerous stations because of the masking effect of the relief.
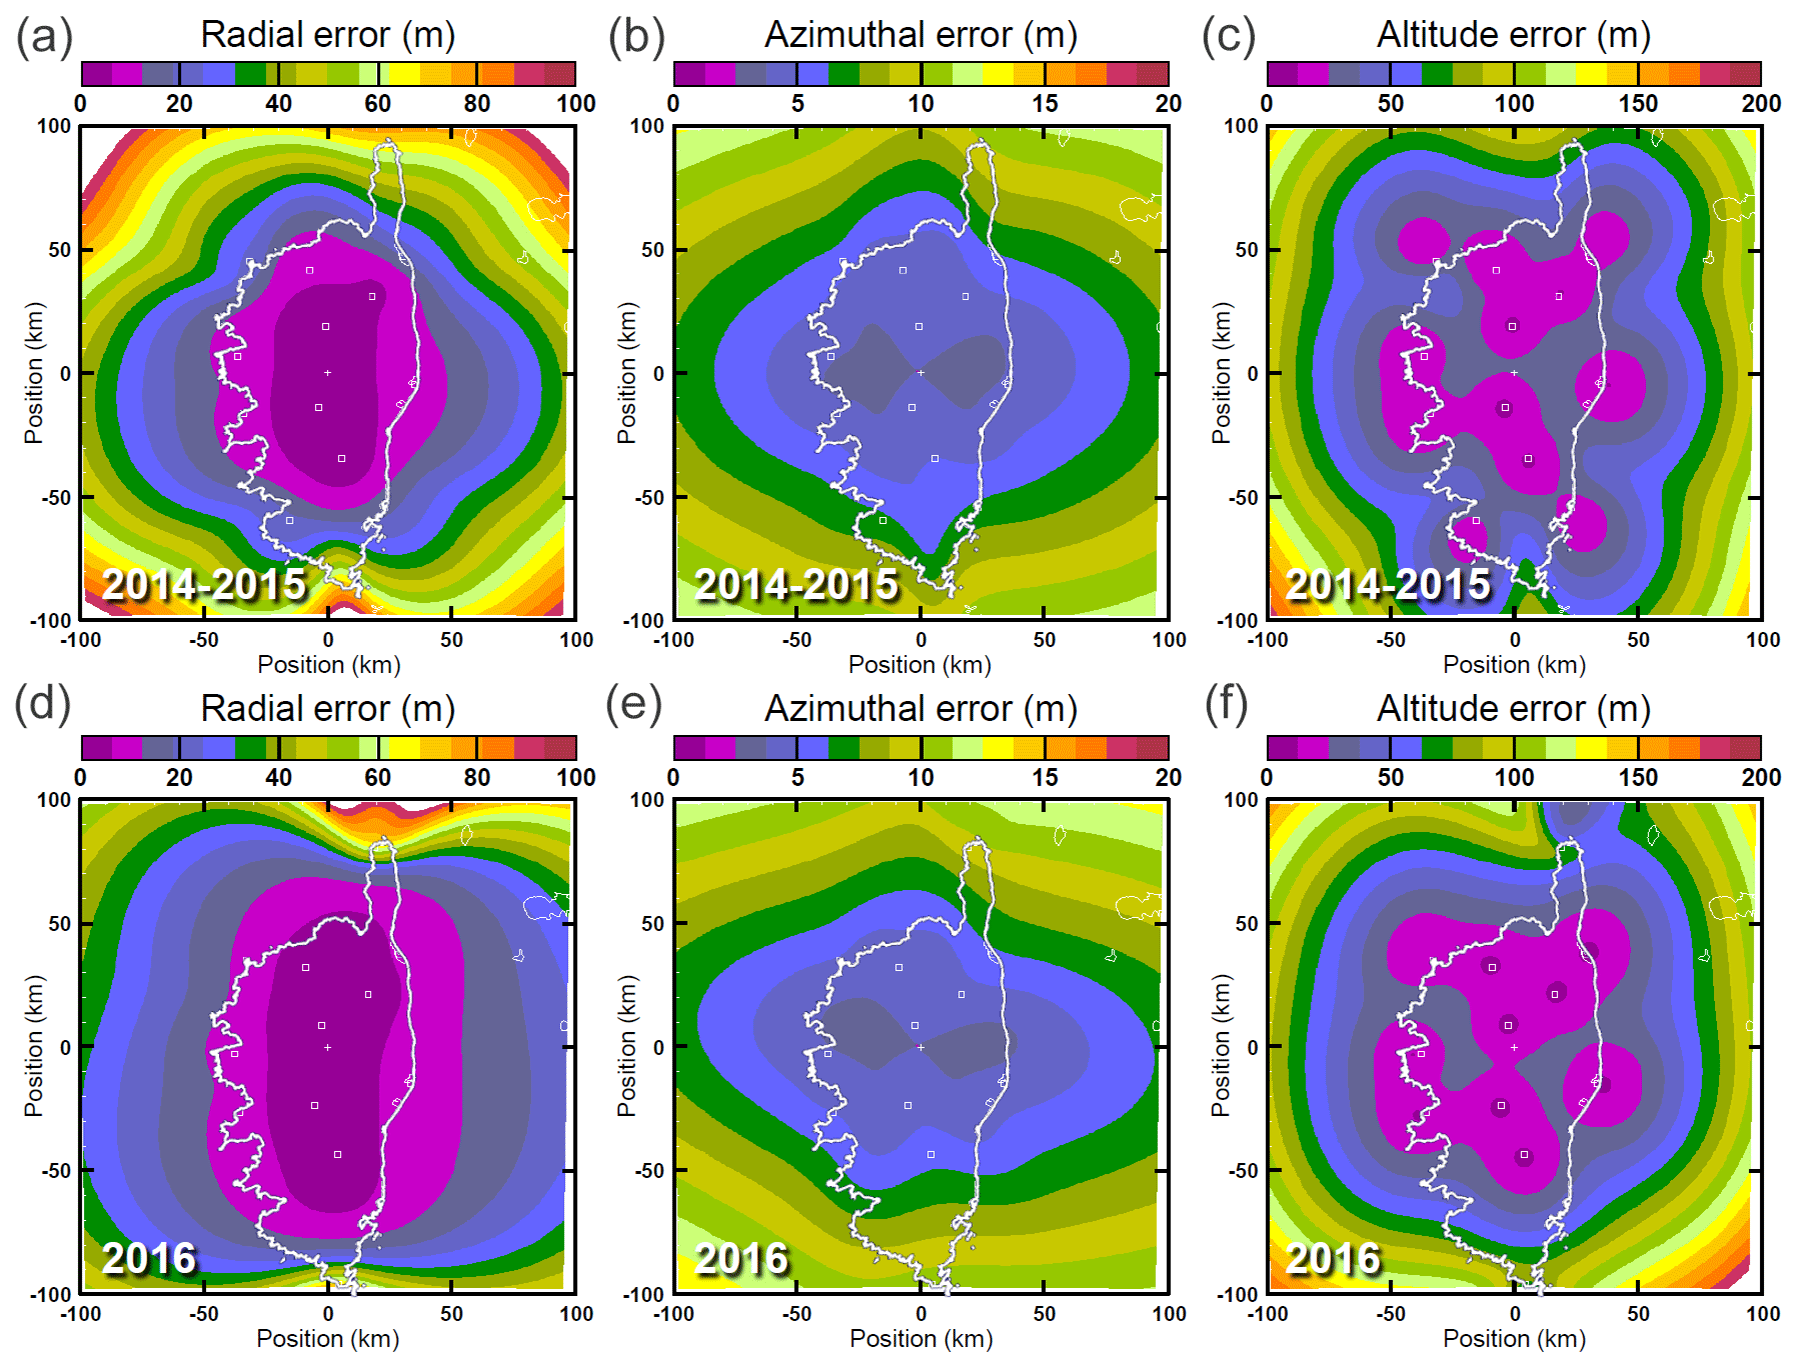
Figure 3Radial, azimuthal, and altitude errors computed with the geometrical model of Thomas et al. (2004) for VHF sources located at 10 km altitude seen from 12 stations. (a, b, c) Initial SAETTA network in 2014 and 2015; (d, e, f) new SAETTA network since 2016. Station locations are indicated by white squares.
The geometrical model also predicts that the slant range r and altitude z uncertainties increase versus r2 while the azimuth uncertainty more slowly increases versus r (see Fig. 12 in Thomas et al., 2004). This behavior is illustrated in Fig. 3: far from the network, the geographical error gradient is much higher for range and altitude determination (left and right graphs, respectively) compared to the relatively small geographical error gradient of azimuth determination (central graphs). The azimuth is best determined and the corresponding errors are the smallest. Looking into detail at Fig. 3 for the 2016 network, the theoretical errors can be evaluated, for example, about 50 km from the center of the network and compared with that of the STEPS network according to Fig. 12 of Thomas et al. (2004). According to Fig. 3, the radial, azimuthal, and 10 km altitude errors at 50 km from the center of the SAETTA network are about 15, 8, and 40 m, respectively. According to Fig. 12 of Thomas et al. (2004), the radial, azimuthal, and altitude errors at 50 km from the center of the STEPS network are about 100, 16, and 80 m, respectively (these values are the average values of the errors in both the east–west and north–south directions, i.e., black and red solid lines at the abscissa at 50 km). The comparison shows that theoretical errors seem less important for the SAETTA network, especially for the slant range r. The greater horizontal extension D of the SAETTA network is undoubtedly at the origin of this behavior since the theoretical errors are inversely proportional to D according to Thomas et al. (2004), and even inversely proportional to the square of D for the radial error.
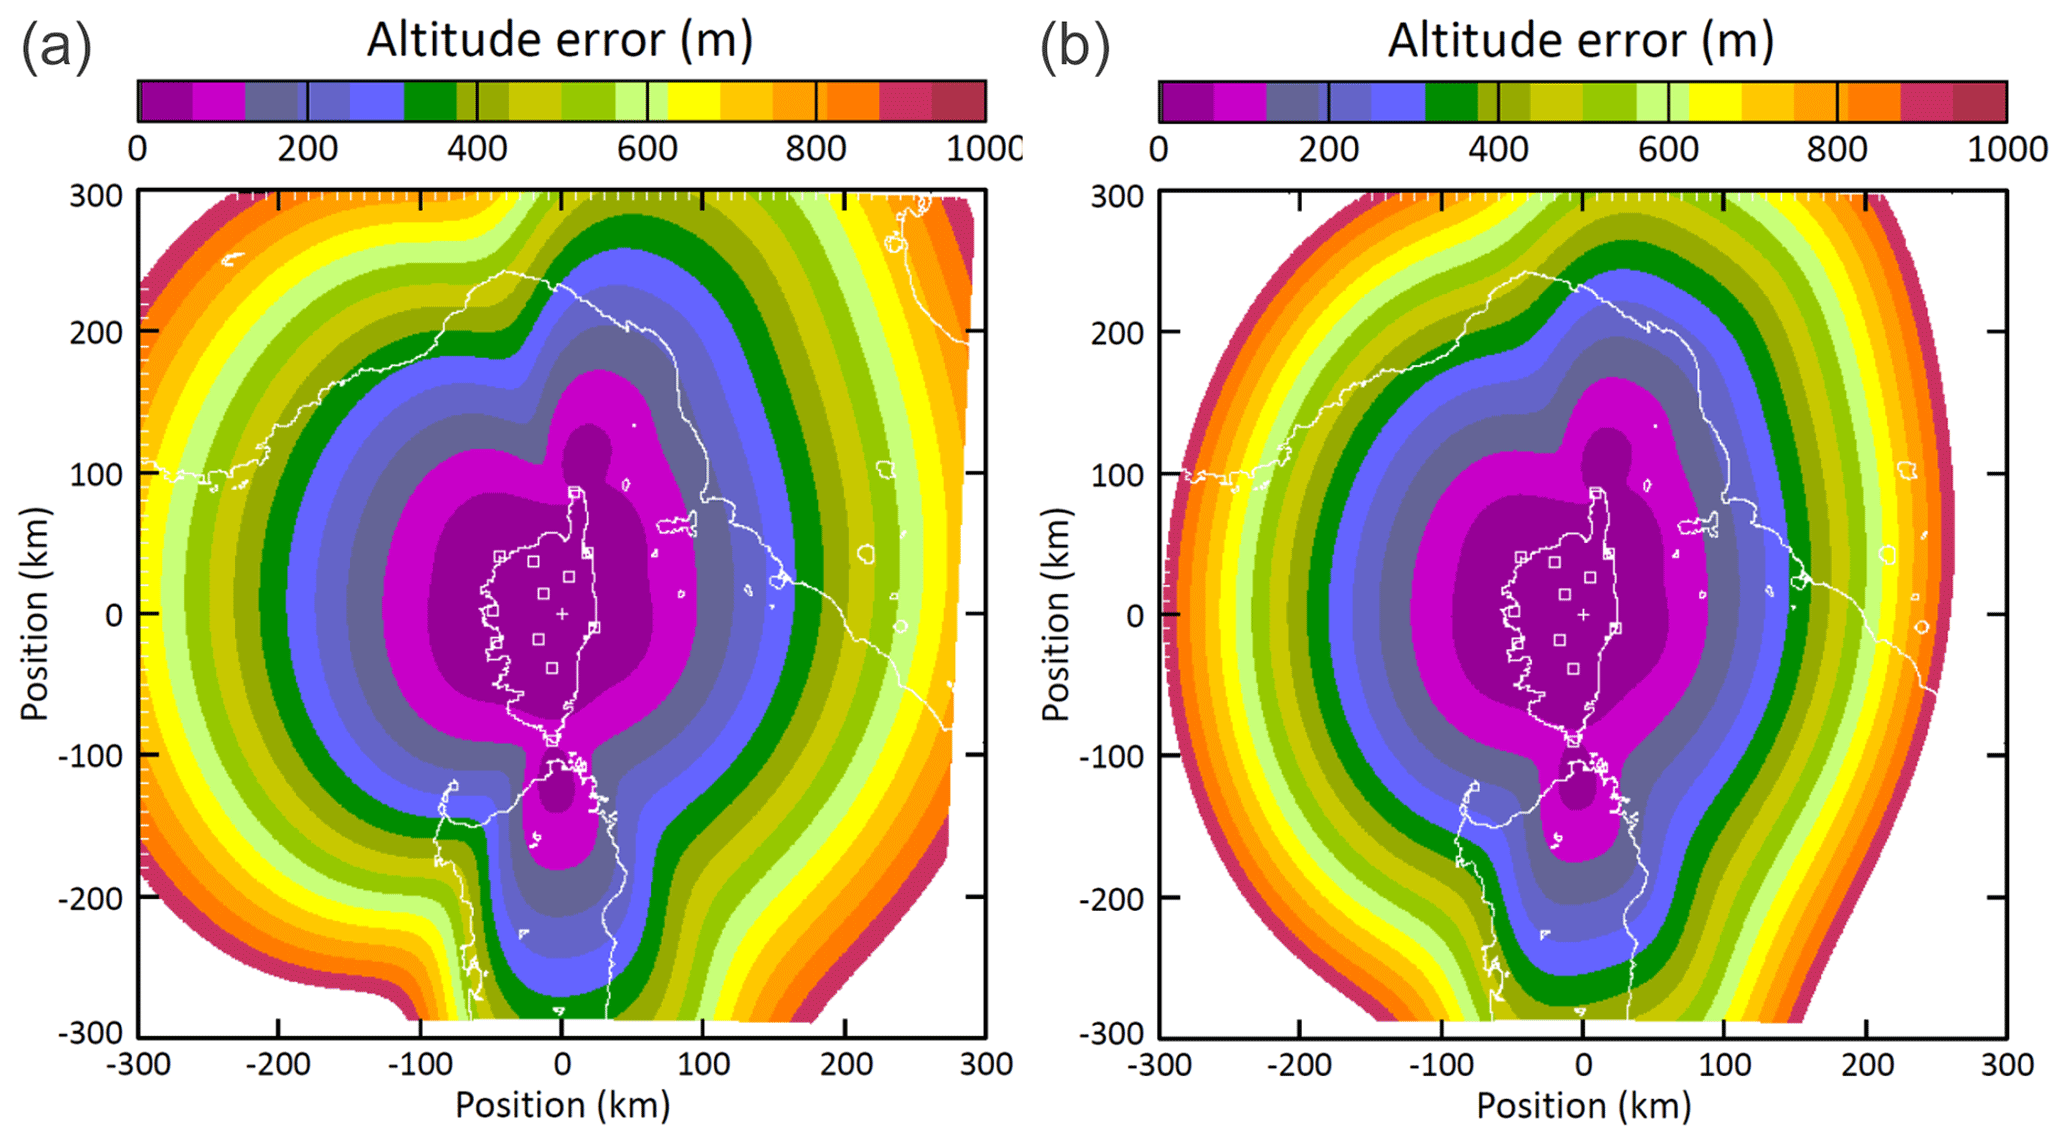
Figure 4Altitude error computed with the geometrical model of Thomas et al. (2004) for VHF sources at 10 km of altitude seen from 12 stations in a large domain: analysis for the 2016 network (a) and for the same network considered flat with an average altitude of about 863 m (b).
The SAETTA network possesses a significant vertical baseline that allows us to overcome the insufficient vertical separation among the stations that can be a source of error in the determination of the VHF sources' altitude via the elevation angle θ, especially for distant sources (Thomas et al., 2004; Koshak et al., 2004). In order to evaluate the contribution of this vertical baseline to the localization accuracy of VHF sources, the calculation of the altitude error was first carried out for the SAETTA 2016 network over a wide domain (300 km × 300 km), and a second time for the same network but considered flat with all the stations located at the same average altitude of 863 m. Displayed in Fig. 4, the results confirm the above expectation for distant sources. Within a radius of about 150 km from the center of the network, the altitude errors are quite similar for both network configurations (actual and flat networks). The main differences arise in regions beyond this radius, where the altitude error strongly increases for a flat network. Therefore, the vertical baseline due to having some stations at higher altitudes improves the accuracy for lightning detection over the mainland of Italy and France.
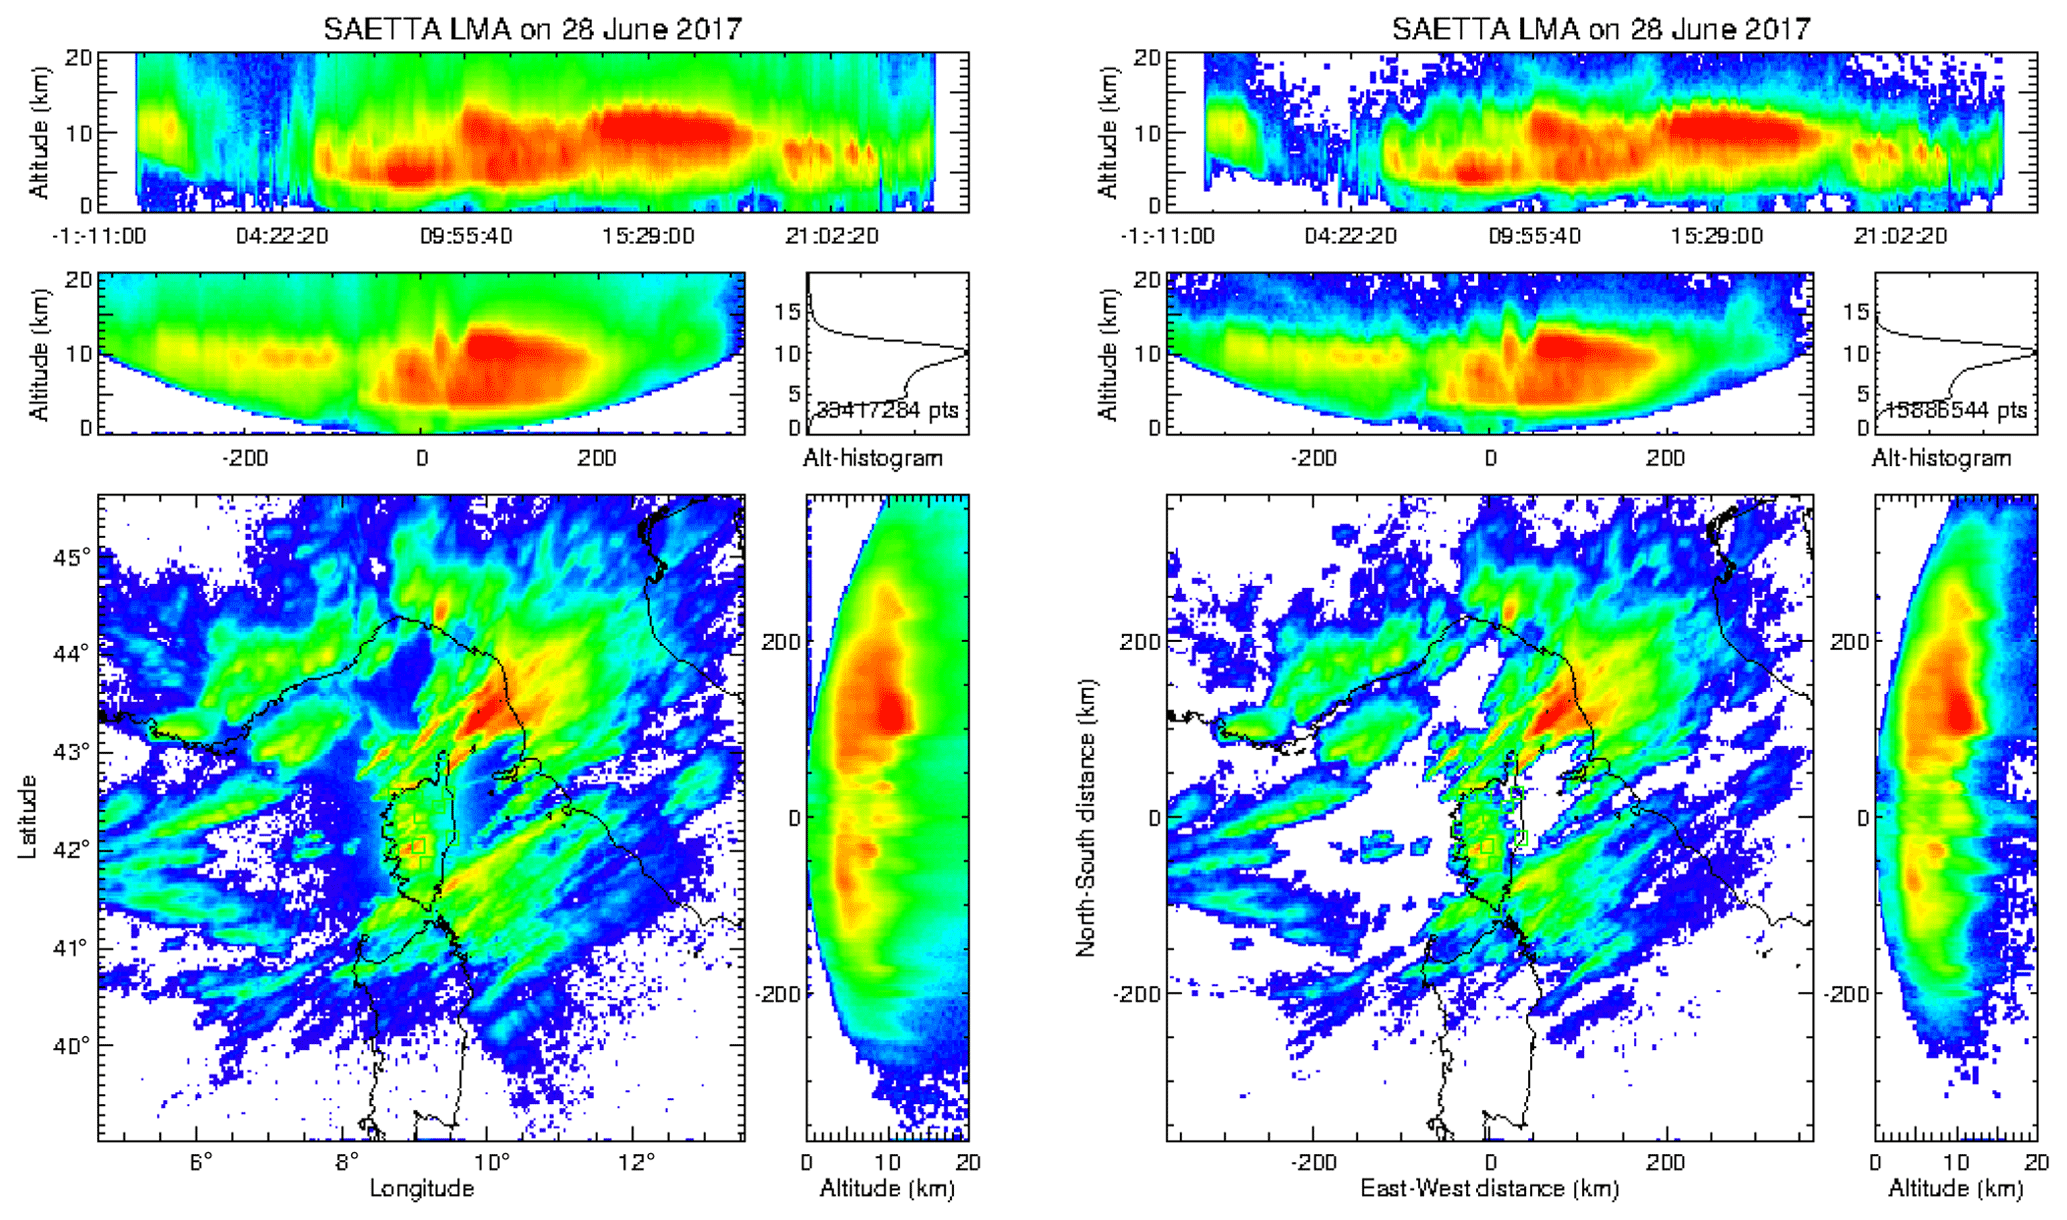
Figure 5VHF sources detected by SAETTA during the storm event of 28 June 2017. Left: source density of unfiltered data with angular projection (minimum of six stations, χ2≤5). Right: source density of filtered data with Cartesian coordinate projection on the same domain (minimum of seven stations, χ2≤0.5). Composition of each graph: altitude vs. time (top); altitude vs. longitude or view from the south (center left); VHF source altitude histogram (center right); latitude vs. longitude or geographical projection (bottom left); altitude vs. latitude or view from the west (bottom right).
3.1 Typical lightning observation
SAETTA is able to detect flash activity up to approximately 350 km from the center of the network (Pinerole station). An example of this large-scale detection is displayed in Fig. 5 as VHF source density for the 28 June 2017 event. The left graph corresponds to minimally filtered data (minimum of six stations and reduced chi-square χ2≤5; see Thomas et al., 2004). It is composed of various panels according to the conventional XLMA format: altitude vs. time (top panel); altitude vs. longitude or view from the south (center left panel); VHF sources altitude histogram (center right panel); latitude vs. longitude or geographical projection (bottom left panel); altitude vs. latitude or view from the west (bottom right panel). One can see in the vertical projections (center left and bottom right panels) that lower layers are poorly and even undocumented far from the network because of the Earth roundness, as it is with meteorological radars. Unfortunately, locally generated noise events can lie close in time to lightning events and therefore may be considered in the calculation of VHF source positions, producing slightly fuzzy lightning contours. The best way to minimize their impact on observations is to restrict the sources to those located by more than six stations with a better goodness of fit (i.e., lower reduced chi-square). The right graph in Fig. 5 corresponds to such filtered data: the VHF sources have been determined with a minimum of seven stations and with χ2≤0.5. Those values were determined empirically for SAETTA based on several observations at different time and space scales. By comparing the geographical projections (bottom left panels) of the left and right graphs in Fig. 5, one can see that the highest densities remain almost not affected by the filtering. The same behavior is visible at lightning scale (not shown here) where discharge channels remain very well described and noisy sources are eliminated after filtering. From here on, all the results presented below will relate to VHF sources determined with this filtering (minimum of seven stations and χ2≤0.5).
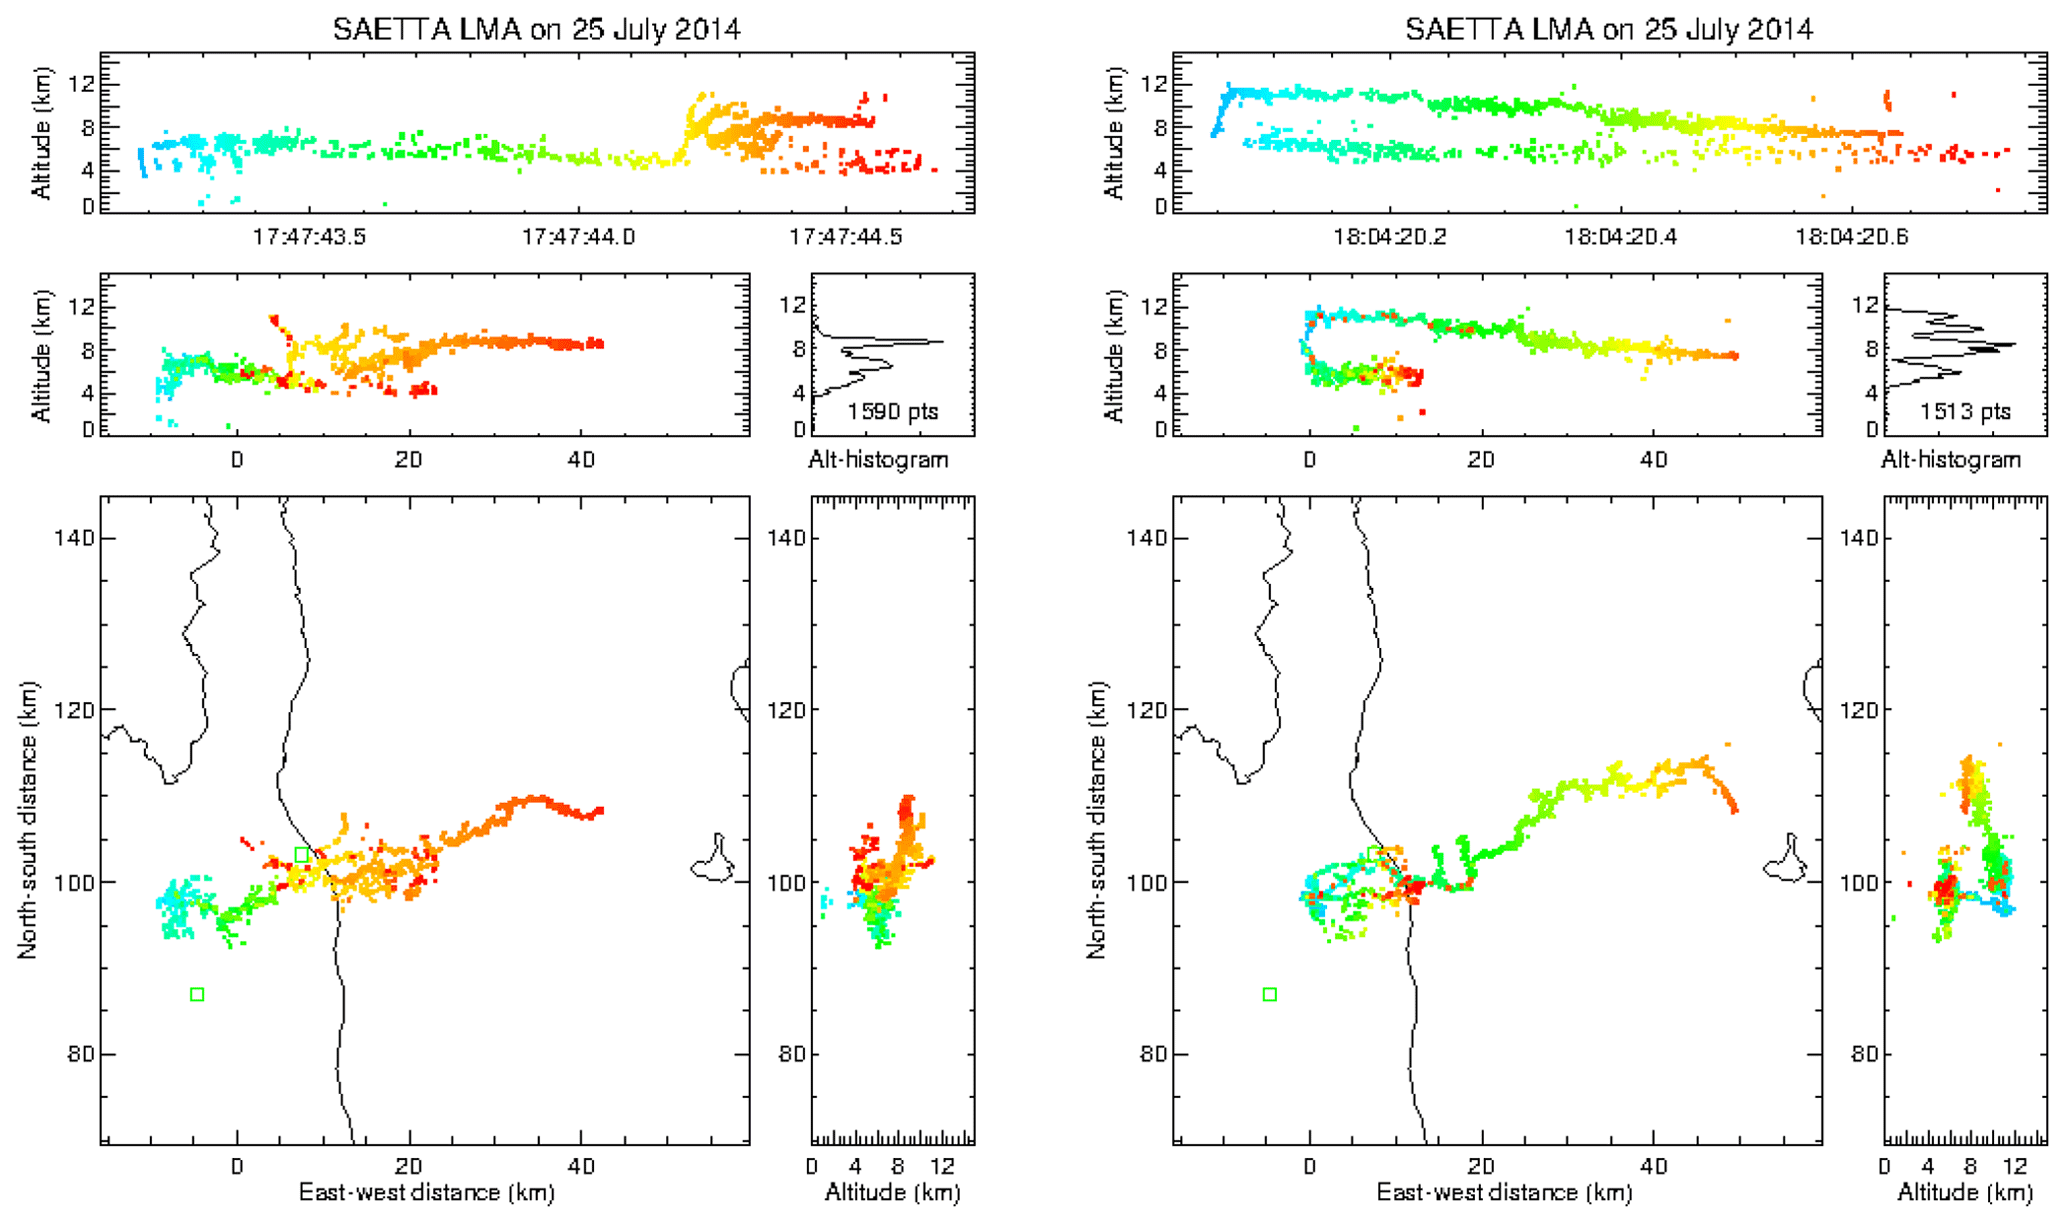
Figure 6Examples of CG (left) and IC (right) lightning detected by SAETTA on 25 July 2014. Each dot corresponds to a VHF source detected by SAETTA. The colors indicate the time during the sequence: from blue (beginning of the time window) to red (end of the time window). Station locations are indicated by green squares. Composition of each graph is the same as in Fig. 5.
Another example of SAETTA detection is displayed in Fig. 6. Here the observation is made at the lightning scale for about 1 s. The left graph represents cloud-to-ground (CG) lightning. Looking to the top frame (altitude of VHF sources versus time), one can easily see that the initial phase of the discharge (beginning of the time sequence in blue) consists of a descending negative leader that starts at about 6 km high just before 14:47:43.2 and descends to about 3.6 km after which it is no longer reported by LMA. Its propagation speed is roughly evaluated at 3×10⁵ m s−1. It is followed by four other leaders propagating towards the ground between 14:47:43.2 and 14:47:43.4. The polarity of the leaders is deduced from the power with which the VHF sources are detected since intermittent negative leaders radiate much more than continuous positive leaders. Afterward a positive leader propagates almost horizontally over about 15 km in the trailing stratiform region of the cloud according to the plan view in the bottom left panel until 17:47:44.2 when a negative leader suddenly propagates upward to the upper part of the cloud and spreads over about 40 km. In the meantime, a positive leader subsequently appears to develop in the lower layer at about 4.5 km in altitude. It looks like an IC flash started at 17:47:44.2, finally producing a hybrid flash. This flash is very similar to the event M reported by van der Velde and Montanya (2013) in their Fig. 6. A time–distance plot could provide a good estimation of the speed of ascent of the upper negative leader, so that one can refer to the time–distance plot of the M event in Fig. 7 of van der Velde and Montanya (2013) to have an idea about the scale of speed values.
The right graph in Fig. 6 represents an intra-cloud (IC) lightning flash. The corresponding top panel shows that the initial phase of the discharge corresponds to an ascending negative leader triggered at about 7 km in altitude and propagating up to about 11 km. Then it propagates over approximately 55 km following a slow descent, which is most probably due to the sedimentation of the charged ice particles that have been transported in the stratiform region and to which the discharge connects (Carey et al., 2005; Ely et al., 2008). About 30 ms after the triggering of the negative leader, the positive leader also propagates horizontally in the lower part of the discharge. In the end of the time sequence (red, at about 12:04:20.63) a fast ascending discharge (recoil leader) follows the main vertical branching of the flash and then propagates almost horizontally in the upper part of the initial negative leader path (spaced red dots in the center left panel).
3.2 Short lightning climatology over Corsica
In order to assess the behavior of convection over Corsica, overall data for all years of observation are accumulated. The data analysis focuses on the 240 km × 240 km domain of better detection accuracy centered on Corsica with filtered data (VHF sources determined with a minimum of seven stations and with a reduced-chi square χ2≤0.5). At the present time the data processing and analysis of 3 years of observation have been completed (2014; 2015; 2016). The sample size is not yet large enough to call this climatology but it gives the first details of the stormy behavior in this region.
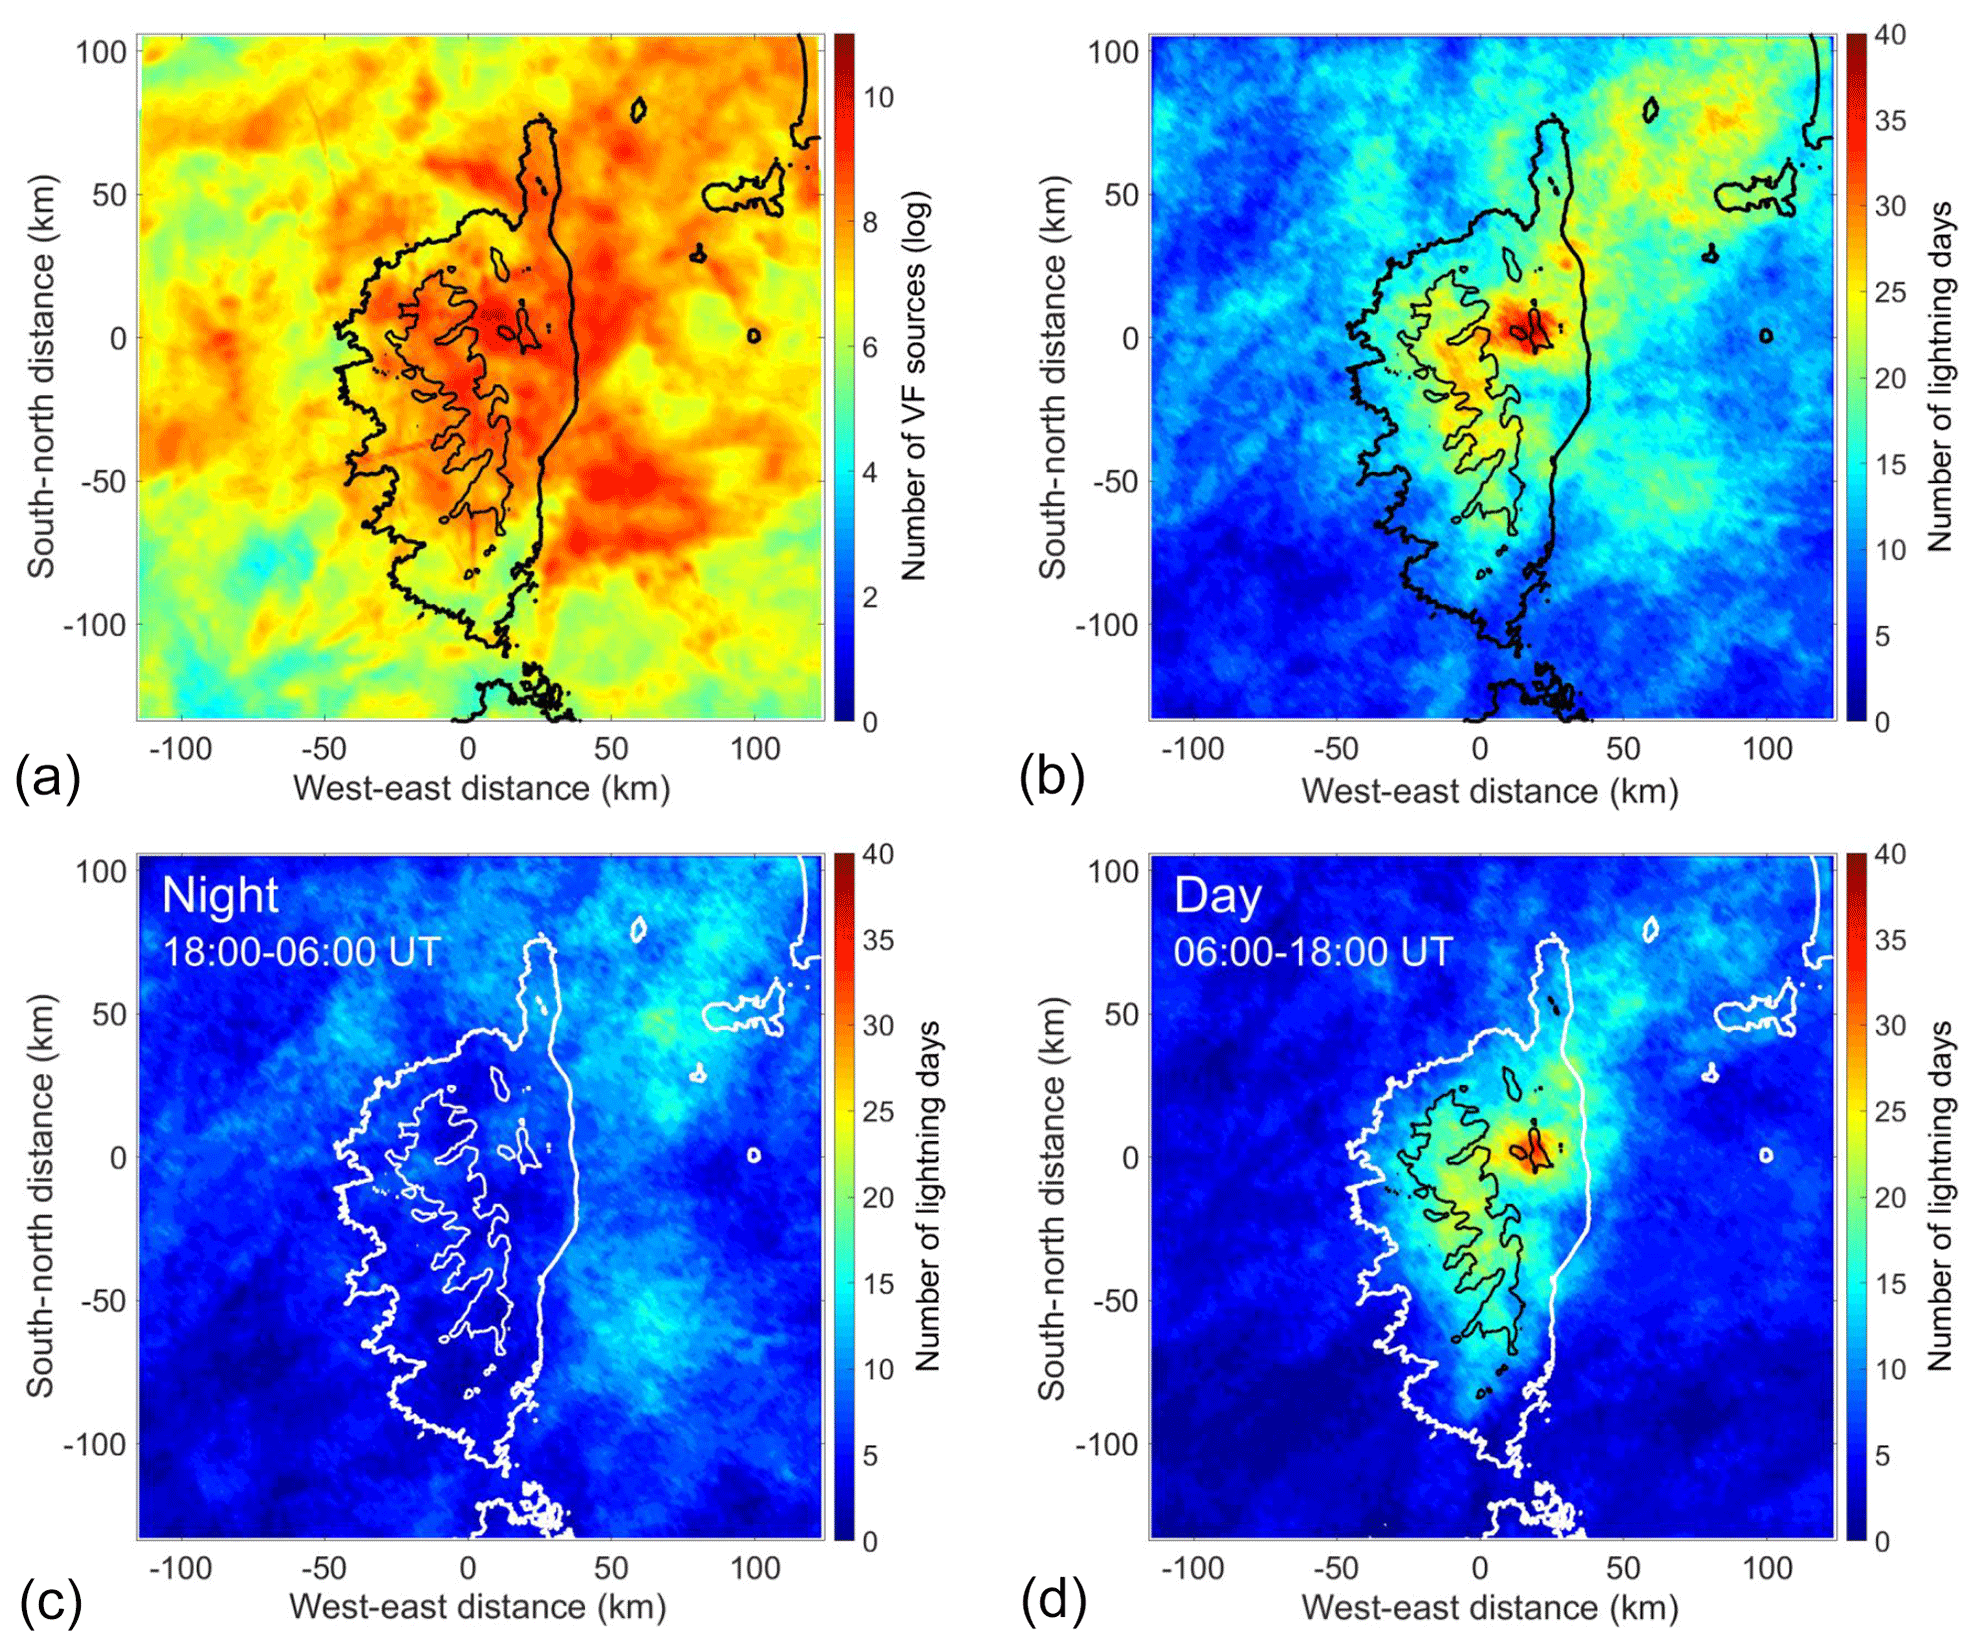
Figure 7Overall cumulative number of filtered VHF sources in the 240 km × 240 km domain of better detection accuracy centered on Corsica for 2014 to 2016 (a); frequency of lightning days for the overall set of filtered data on the same domain and during the same period (b); frequency of lightning days at night (c) and day (d). A lightning day in a given pixel is defined as a day during which at least five VHF sources are detected in that pixel. Isocontours at 1000 m altitude are indicated by black or white lines inside Corsica.
The overall cumulative number of filtered VHF sources is displayed in Fig. 7a. The VHF sources are counted on 1 km × 1 km pixels. Not clearly visible in this top left figure with a log scale in base 10, the highest values (dark red) are located above the main relief of the island of Corsica, and more specifically in the center of the northern part at the crossroads of three large valleys, roughly between the Pinerole and Compoli stations (see Fig. 1). Other high values are located above the sea near the east coast, and also west of Cape Corse (long relief oriented south–north, forming the northern tip of Corsica).
We built a “storm days” map by counting the total number of days during which at least five VHF sources have been detected, in each 1 km × 1 km pixel. This value of five sources has been tested and chosen so as not to take into account isolated sources corresponding to residual noise or poorly located sources, while keeping the events with low lightning activity. It is a compromise that respects the storm activity actually observed. The overall frequency of storm days for 2014 to 2016 is displayed in Fig. 7b. The high-value patterns are somewhat different from those of the cumulative number of VHF sources. A big maximum (dark red, 10 km south of Compoli station) appears in the northern part of the island a few kilometers to the east of the maximum of VHF sources displayed in Fig. 7a. Secondary maxima (orange and yellow) are located over the central main relief, over a small area close to the Biguglia station (see Fig. 1), and over the sea in the northeast quarter of the domain. The high values of VHF source number (Fig. 7a) corresponding to low frequencies (Fig. 7b) are obviously the signature of very intense events, e.g., almost everywhere over the sea where red is displayed in Fig. 7a.
By comparing Fig. 7a and b, one realizes that the north center perimeter encompassing the crossroads of the three main valleys and the relief south of the Compoli station seems to be a place where thunderstorms are together very active and often present. The question that comes naturally to mind is when it happens and why it happens in this location. To answer to the first point, the study of the frequency of the events was differentiated on the one hand between night and day and on the other hand according to the month of the year. The frequency of lightning during the night between 18:00 and 06:00 UT is displayed in Fig. 7c and that during the day between 06:00 and 18:00 UT in Fig. 7d, both with the same color scale as the overall frequency (Fig. 7b). It is clear that night is much less affected by convection and when it is, it occurs over the sea. Meanwhile daytime lightning activity provides the main contribution to the overall frequency pattern. A more precise study of the diurnal evolution of the lightning activity was carried out for the observation of July only. The results not presented here show that the maximum activity is due to storm events occurring between 11:00 and 14:00 UT. As expected, the maximum of lightning frequency over the relief of Corsica is thus mainly due to diurnal convection.
The differentiation of the storm frequency according to the month of the year is displayed in Fig. 8 from June to September (most active months). June is characterized by a maximum of lightning activity over the whole relief, and especially in the center of the island and just south of Compoli station. In July the most frequent lightning activity concentrates over the northern half of the island, with a main maximum close to the crossroads of the three main valleys and a secondary maximum in the northeast quarter of the domain in the Gulf of Genoa. In August, the lightning activity becomes scarce with a maximum located close to the east coast in the vicinity of the Biguglia station (see Fig. 1) and again with a secondary maximum in the Gulf of Genoa. At last in September the maximum lightning activity is located over the sea 20–40 km east of Cap Corse, while secondary maxima are present on the west flank of southeast main relief and close to the southeast coast. The maximum of lightning day frequency observed in Fig. 7 is thus mainly due to July and to some extent June lightning activity.
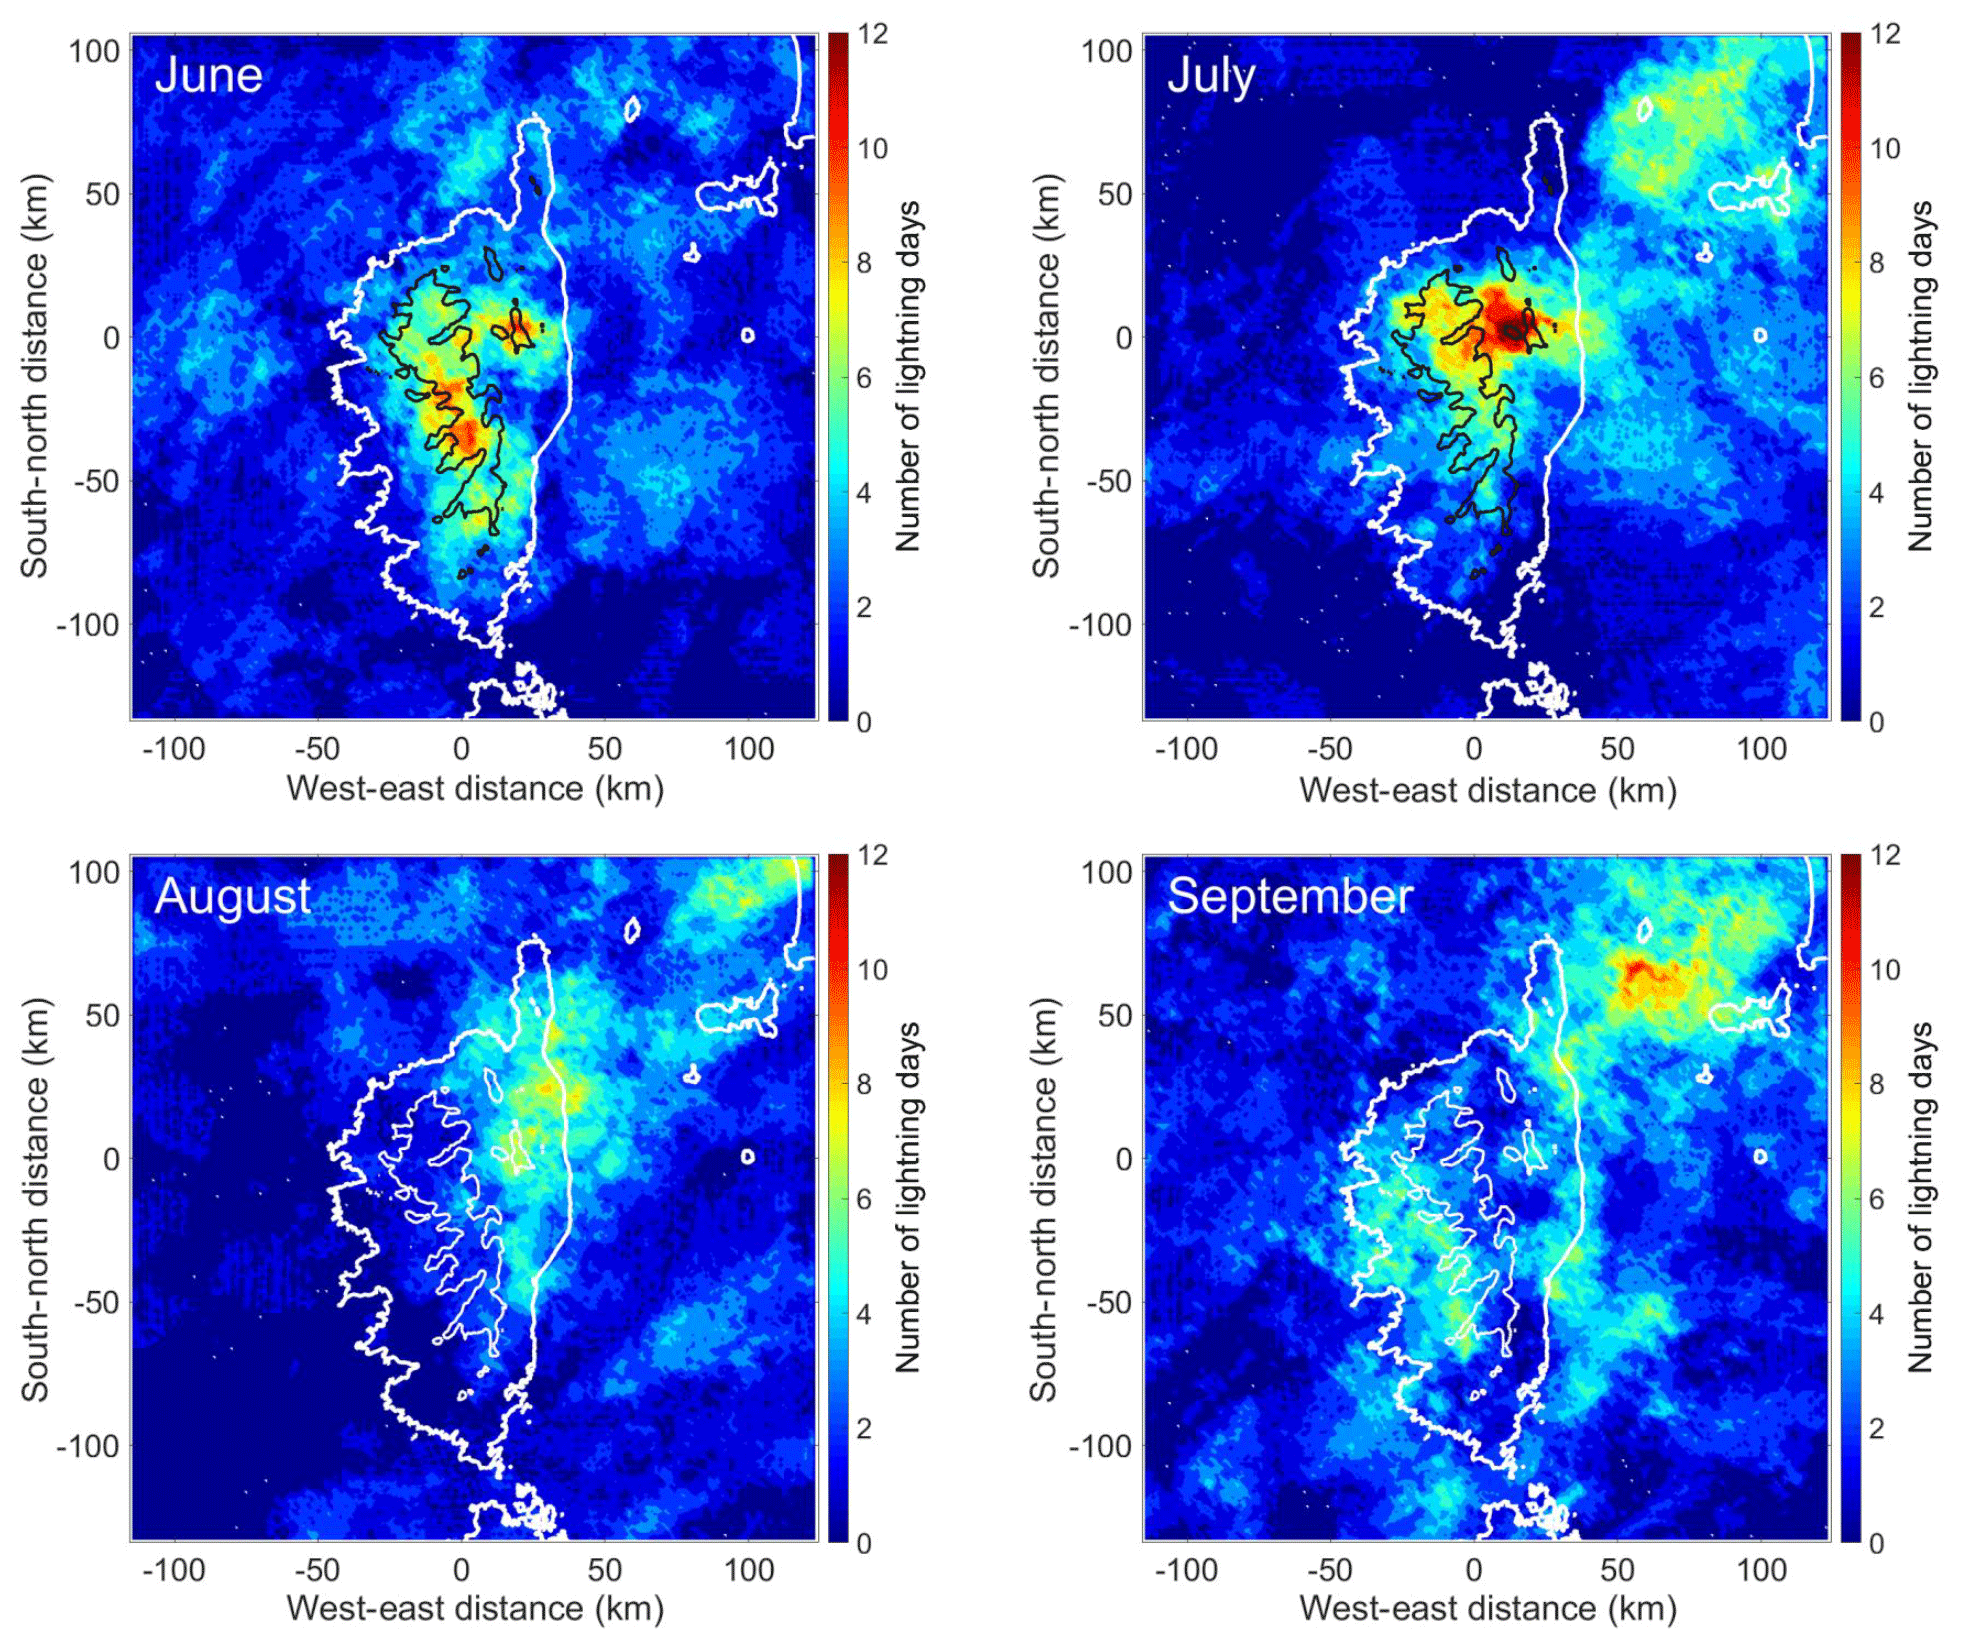
Figure 8Maps of monthly number of lightning days in the 240 km × 240 km domain of better detection accuracy centered on Corsica from June to September for 2014 to 2016. Isocontours at 1000 m altitude are indicated by black or white lines inside Corsica.
To complete these geographical observations, one can also look at the overall observations reported as a histogram in Fig. 9. This figure shows the total number of lightning days on the domain of better detection accuracy for each month and each year, together with the monthly average number of lightning days. The available data set is enriched here with the dates of the thunderstorms of 2017, which are simply issued from quicklooks (http://saetta-lma.aero.obs-mip.fr/, last access: 23 October 2019; all 2017 data not yet processed). The graph exhibits two maxima in June and in September, and a minimum in August (winter is disregarded). From May to August the number of lightning days seems to follow the elevation of the Sun in the sky; i.e., convection is controlled by the flow of solar energy. While from September, the number of lightning days increases significantly in the domain. The corresponding events can be either numerous small storms over the sea or over the relief (Barthlott et al., 2016) or high-precipitation events such as those occurring in southern France or in Corsica (Ducrocq et al., 2008; Lambert and Argence, 2008; Nuissier et al., 2011; Ducrocq et al., 2013; Scheffknecht et al., 2016), which are formed under the influence of synoptic flows that interact with the relief of Corsica through low-level water vapor fluxes (Adler et al., 2016). The key ingredients that control their development are orographic forcing, low-level convergence, strong moisture fluxes, and conditionally unstable flow. Furthermore, during the autumn season the sea surface is still warm and constitutes a pool of water vapor and energy. Meanwhile upper-level cold air begins to progress from the north, associated with low geopotential height in the region.
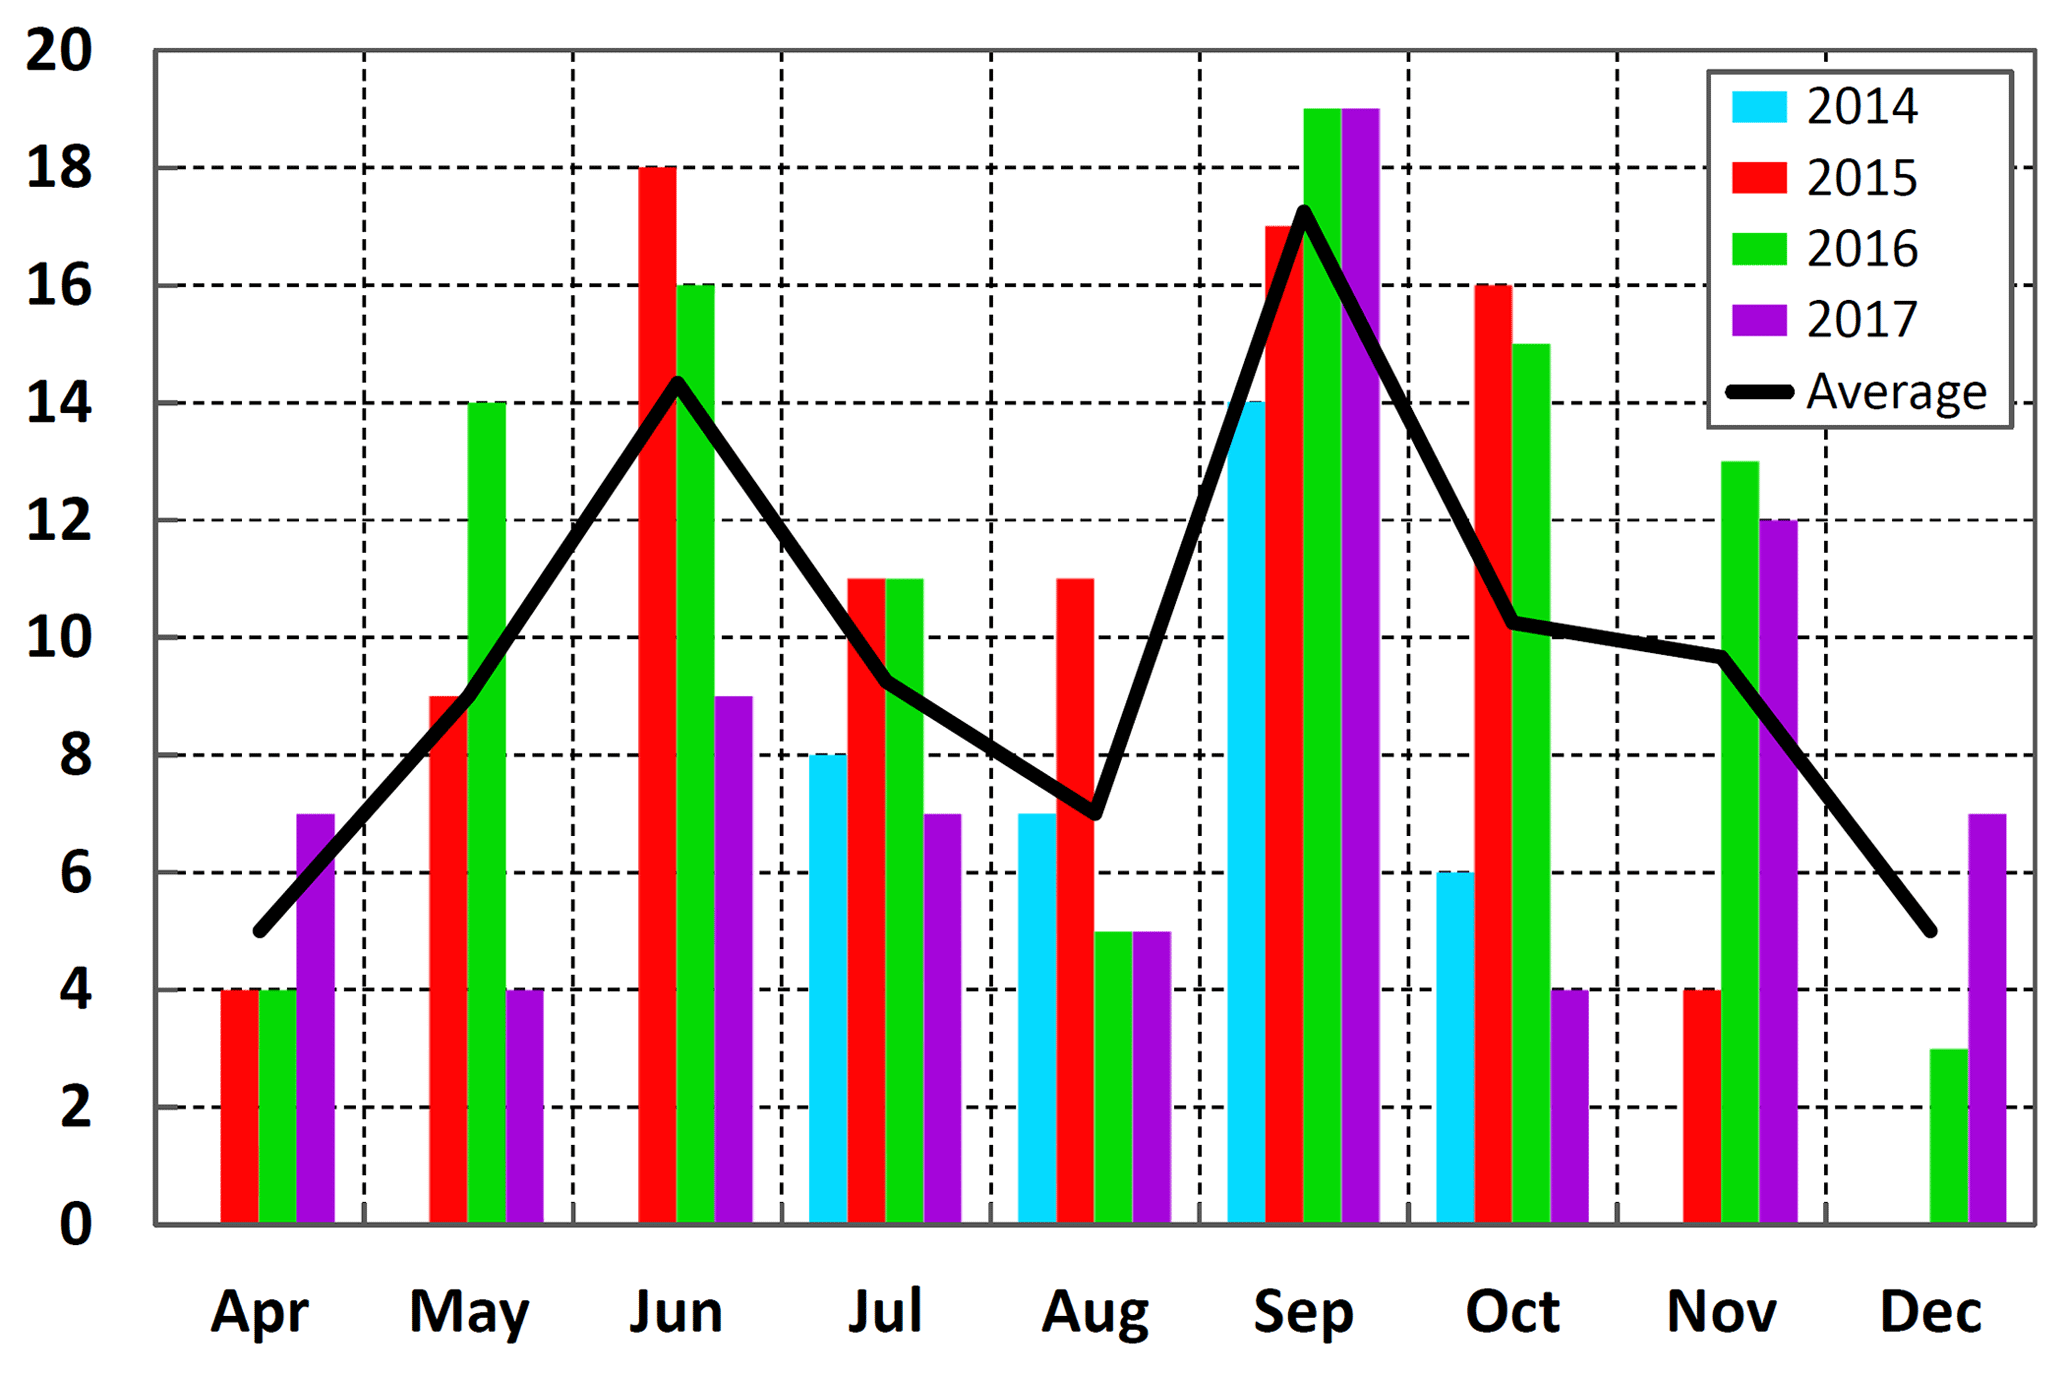
Figure 9Monthly number of lightning days in the 240 km × 240 km domain of better detection accuracy centered on Corsica for 2014 to 2017.
In July the number of lightning days is not the highest (Fig. 9), but since thunderstorms often occur in the same micro-region, the frequency of thunderstorms per pixel in this zone is the highest (Fig. 8). If we add the fact that the number of lightning days in July is particularly homogeneous from year to year (between 7 and 11 over 4 years in Fig. 9), it seems that this area is the seat of very specific and reproducible processes that lead to this maximum frequency of thunderstorm days in this location in July between 11:00 and 14:00 UT.
So to answer the second point of the question asked before (i.e., why thunderstorms are together very active and often present in the north center of Corsica), one has to analyze the processes involved in convection in July between 11:00 and 14:00 UT in the center of the northern part of Corsica. This work is currently being carried out by means of high-resolution numerical simulations and will be the subject of a forthcoming paper. The first results (Tidiga et al., 2018) show that the convection follows the setting up of sea breezes, which are then channeled through the three main valleys, which leads to a strong convergence of low-level moisture flows in the convection trigger zone. This result is to be compared with the influence of valley and slope breezes as suggested by Barthlott and Kirshbaum (2013).
Hereafter we report specific events that were detected by SAETTA in 2015. They concern high-altitude discharges in the convective core and in the trailing stratiform region of several thunderstorms. Such events raise open questions about the conditions for the triggering of cloud discharges and for thunderstorm electrification.
From 7 to 10 June 2015, Corsica underwent 4 consecutive days of intense, stationary, and long-lasting diurnal convection over most part of the relief with lightning activity characterized by the highest VHF sources between 12 and 13 km altitude. The 7 June event lasted 05 h 50 min (from 09:40 to 15:30 UT) and exhibited high-altitude discharges on top of a convective core and one high-altitude discharge in the trailing stratiform region (15:26:15 UT). The 8 June event lasted 03 h 50 min from 10:10 to 14:00 UT and exhibited high-altitude discharges on top of a convective core and six high-altitude discharges in the stratiform region (12:38:39; 12:43:02; 12:54:05; 12:59:20; 13:21:43; 13:57:18 UT). The 9 June event lasted 06 h 30 min from 09:10 to 15:40 UT and exhibited high-altitude discharges on top of a convective core and one high-altitude discharge in the stratiform region (11:58:38 UT). The 10 June event lasted 04 h 20 min from 10:00 to 14:20 UT but did not exhibit any specific high-altitude discharges.
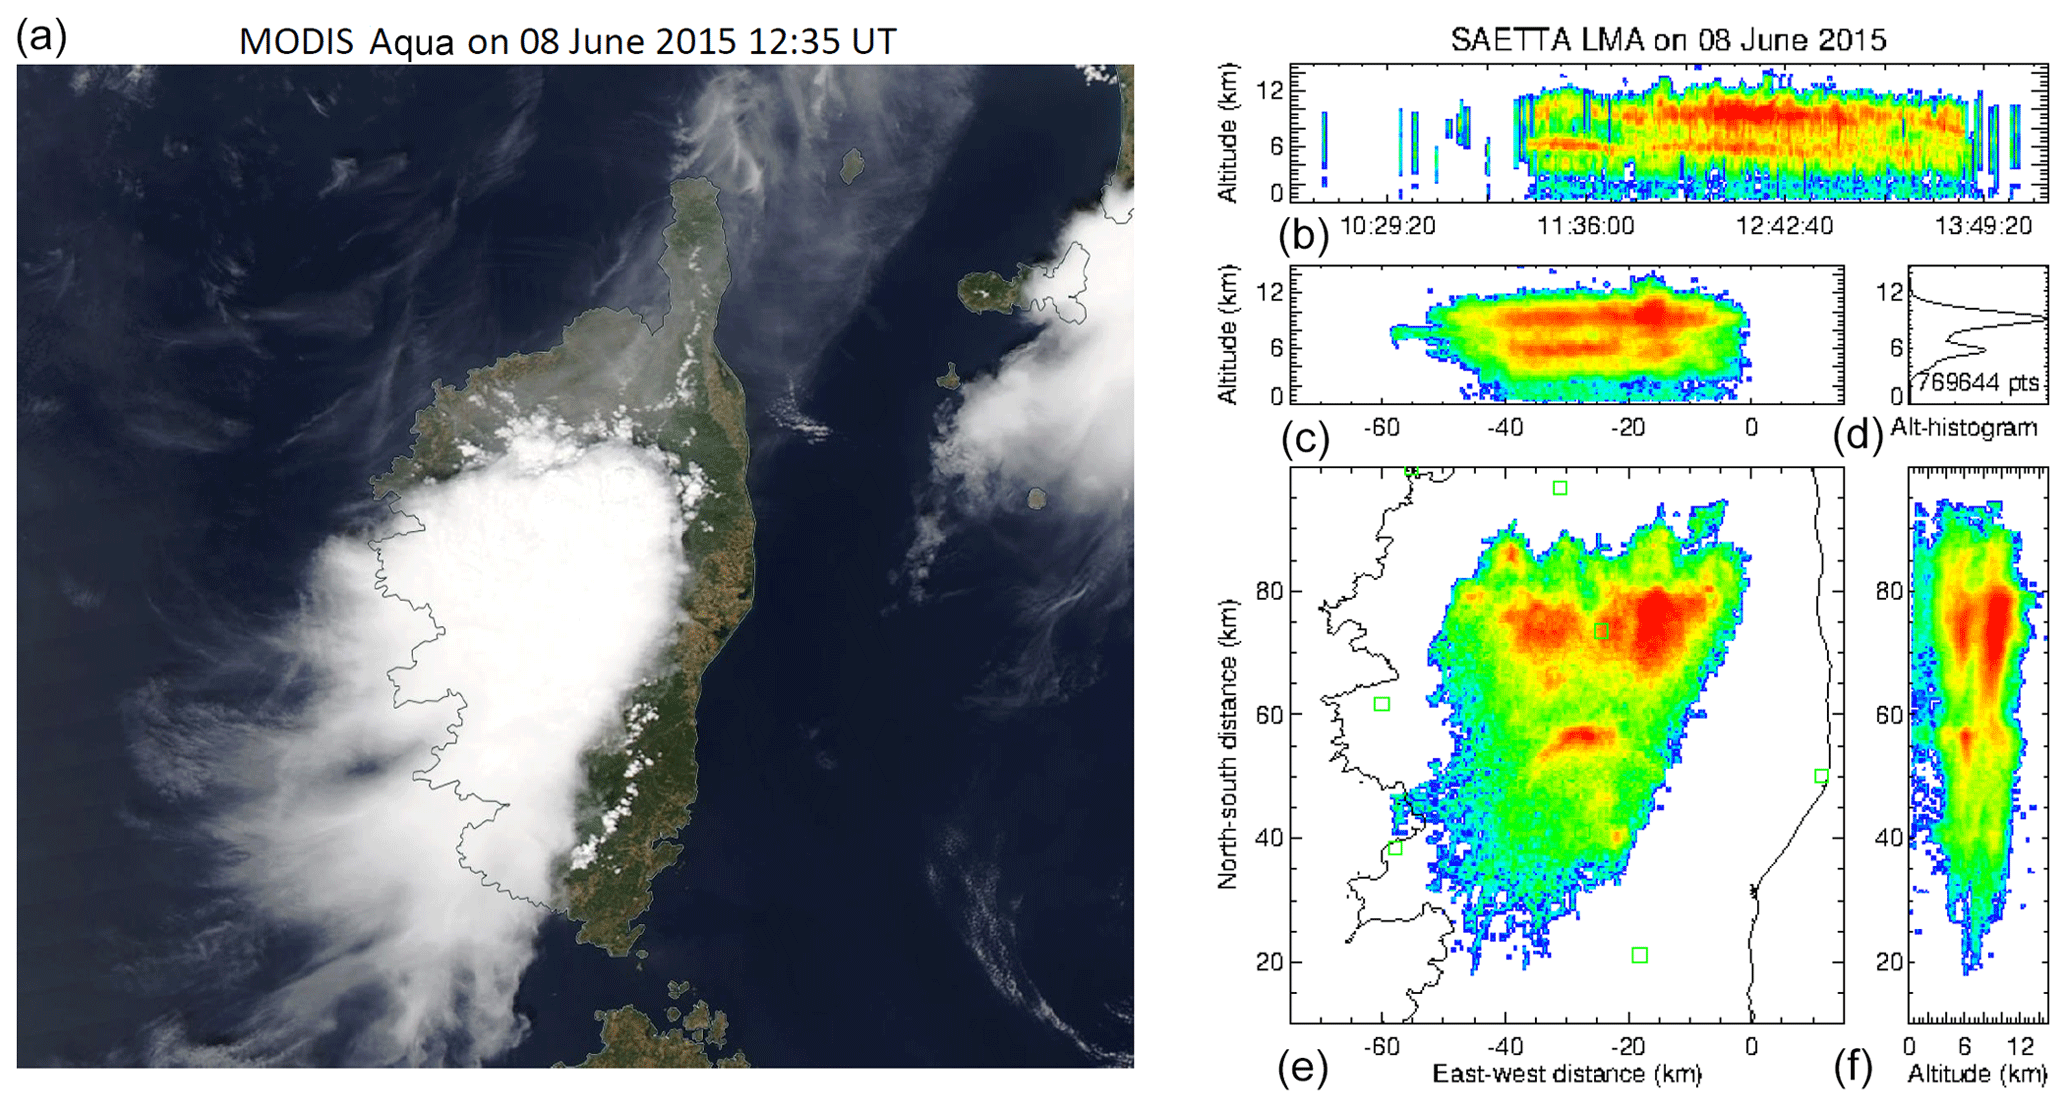
Figure 10Cloud cover observed around 12:35 UT during the 8 June 2015 storm event by the MODIS Aqua satellite in the visible wavelength range (NASA WorldView application https://worldview.earthdata.nasa.gov, last access: 23 October 2019, a), and VHF source density of the event observed by SAETTA (b–f). Station locations are indicated by green squares.
4.1 Event of 8 June 2015: convective surges
Let us focus on the 8 June event, which presents more specific discharges at high altitude than the other similar events. The environmental wind pattern is constituted of sea and slope breezes on the ground, with a slight wind oriented toward the south appearing around the 700 hPa level and strengthening as it turns toward the southwest direction at higher levels. The cloud cover and the cumulative VHF source density are displayed in Fig. 10. The mesoscale convective system is composed of three main convective cores embedded in a southward trailing stratiform region. The first convective core no. 1 appears further south at the beginning of the event and lasts about 50 min from about 11:12 to 12:03 UT. It is centered on the point of coordinates x=27 and y=57 km and exhibits two main layers of strong VHF source densities located at altitudes of about 6 and 10 km. The analysis of the power with which the VHF sources are detected shows that this core and the event as a whole are of regular polarity, i.e., with upper positive charge and lower negative charge associated with those two layers of strong VHF source densities. The two other main convective cores centered on points of coordinates and y=75 km for the most easterly one no. 2 and and y=75 km for the most westerly one no. 3 start at 11:44 and 11:52 UT, respectively, and last until about 13:00 UT by interacting. At the end of the period they are fed on the north side by a line of smaller zonally oriented cells. According to Stolzenburg and Marshall (2008), a mesoscale convective system is “characterized by a leading region of deep convective clouds forming a line or arc, followed by a broad area of deep nimbostratus clouds”. The present thunderstorm event matches this conceptual model with deep convective clouds no. 2 and no. 3, but exhibits a specific feature due to the presence of a decaying convective cell no. 1 embedded in the mesoscale convective system (MCS) leading region. This feature is often encountered in typical MCS stratiform cloud of Houze (1993) though.
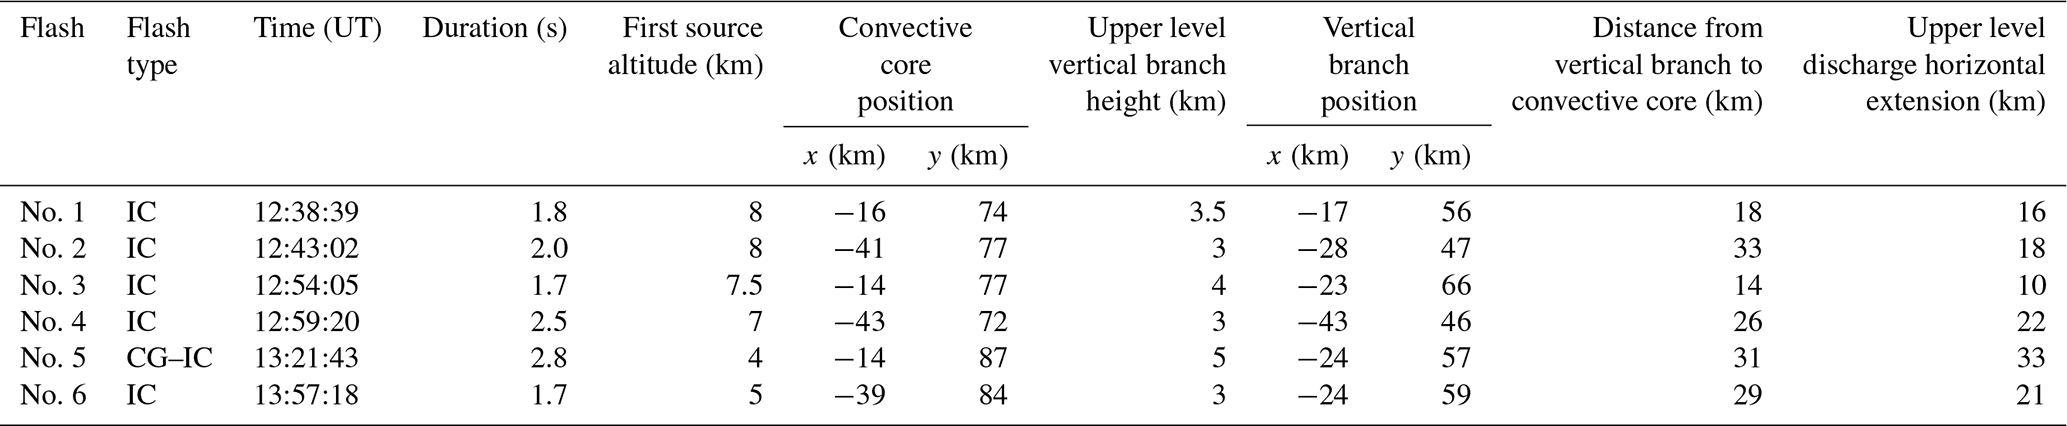
Table 2Serial number, time period, position, and maximum altitude of the VHF sources during the six convective surges.
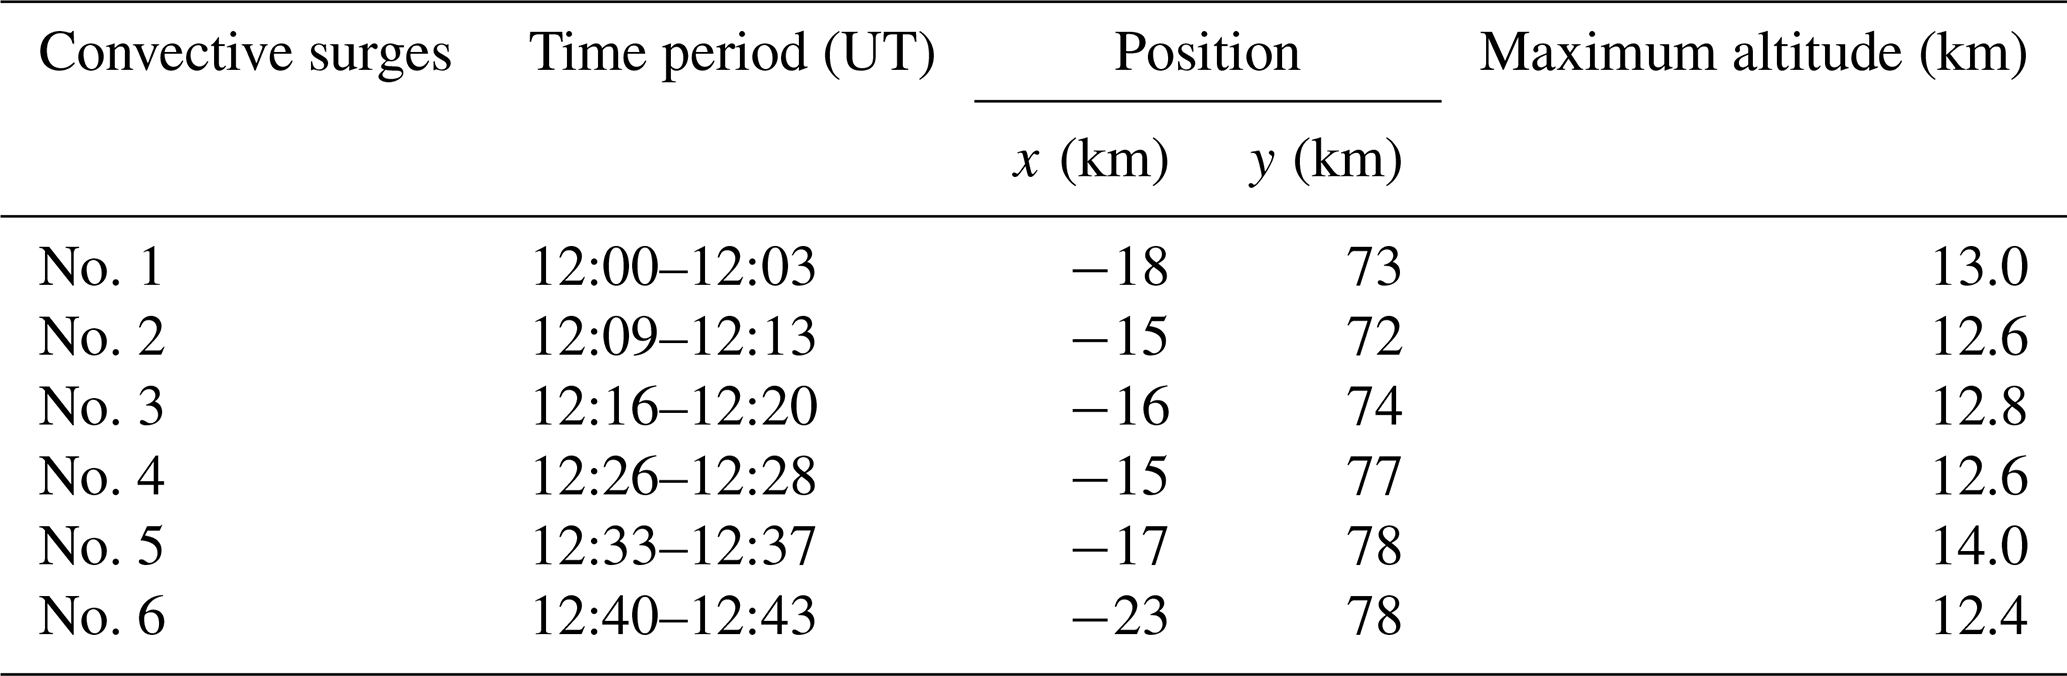
The event is characterized by six convective surges identified from SAETTA observations (see Table 2). They correspond to high-level updraft intensifications on top of a convective core for a few minutes, accompanied by upward developing discharges at altitudes that are higher than the whole storm electrical activity (see Krehbiel et al., 2002). All these surges are associated with the northeast main convective core no. 2 that is located the most windward and that undoubtedly benefits from richer low-level moist fluxes making it more vigorous. These surges have about the same characteristics as the most intense of them (no. 5), the VHF sources which are displayed in Fig. 11 versus altitude (left) and power of detection (right). These sources are located in a small perimeter of approximately 5 km by 5 km (red dots in the left panels of Fig. 11 dedicated to vertical projections) and are present up to 14 km altitude, while the surrounding VHF sources do not exceed 11.5 km altitude. The analysis of the power with which they are detected (Fig. 11 right) shows that the discharges are weakly radiating. Therefore they likely correspond to positive discharges; i.e., they propagate in a negative charge layer. This observation is in agreement with the conceptual model of Stolzenburg et al. (1998) and supports their idea that the upper negative charge layer is the typical uppermost charge region in MCS convection. Furthermore, the top left and top right panels in Fig. 11 (i.e., the altitude versus time windows) show that many small discharges appear quasi-continuously between 10 and 13 km altitude during this sequence. Their characteristics are markedly different from typical IC flashes because they are located in a relatively small cloud volume, seem to trigger at very high altitude, and therefore have a very limited vertical and horizontal extension.
Similar small high-altitude discharges were observed by Ushio et al. (2003), MacGorman et al. (2008), Emersic et al. (2011), Calhoun et al. (2013), or MacGorman et al. (2017). These discharges have unusual characteristics; i.e., the corresponding VHF source production is rather continuous, at low rates, with no clear structure, and independent of the flashes at lower altitudes (MacGorman et al., 2017). This behavior is well illustrated by the quasi-continuous small discharges that appear above 10 km altitude in both top panels of Fig. 11 (altitude versus time). Associated with so-called rising lightning bubbles (Ushio et al., 2003) or with overshooting tops (e.g., Calhoun et al., 2013; MacGorman et al., 2017), the high VHF source production localized on the top of the convective core is most often associated with a rapid vertical growth of the storm, i.e., with a convective surge. Calhoun et al. (2013) suggested that the decreasing electric threshold for discharge triggering with increasing altitude because of decreasing pressure on the one hand (see MacGorman and Rust, 1998) and the charge carried by hydrometeors transported aloft by the updraft and subsequently interacting with the screening layer of charge on the other hand contributed to this VHF emission production associated with overshooting regions. A comprehensive discussion about the hypotheses concerning charge regions producing such overshooting top discharges is proposed by MacGorman et al. (2017). Anyway, the small size of these discharges is probably due to the small spatial extent of charge regions in the overshooting top.
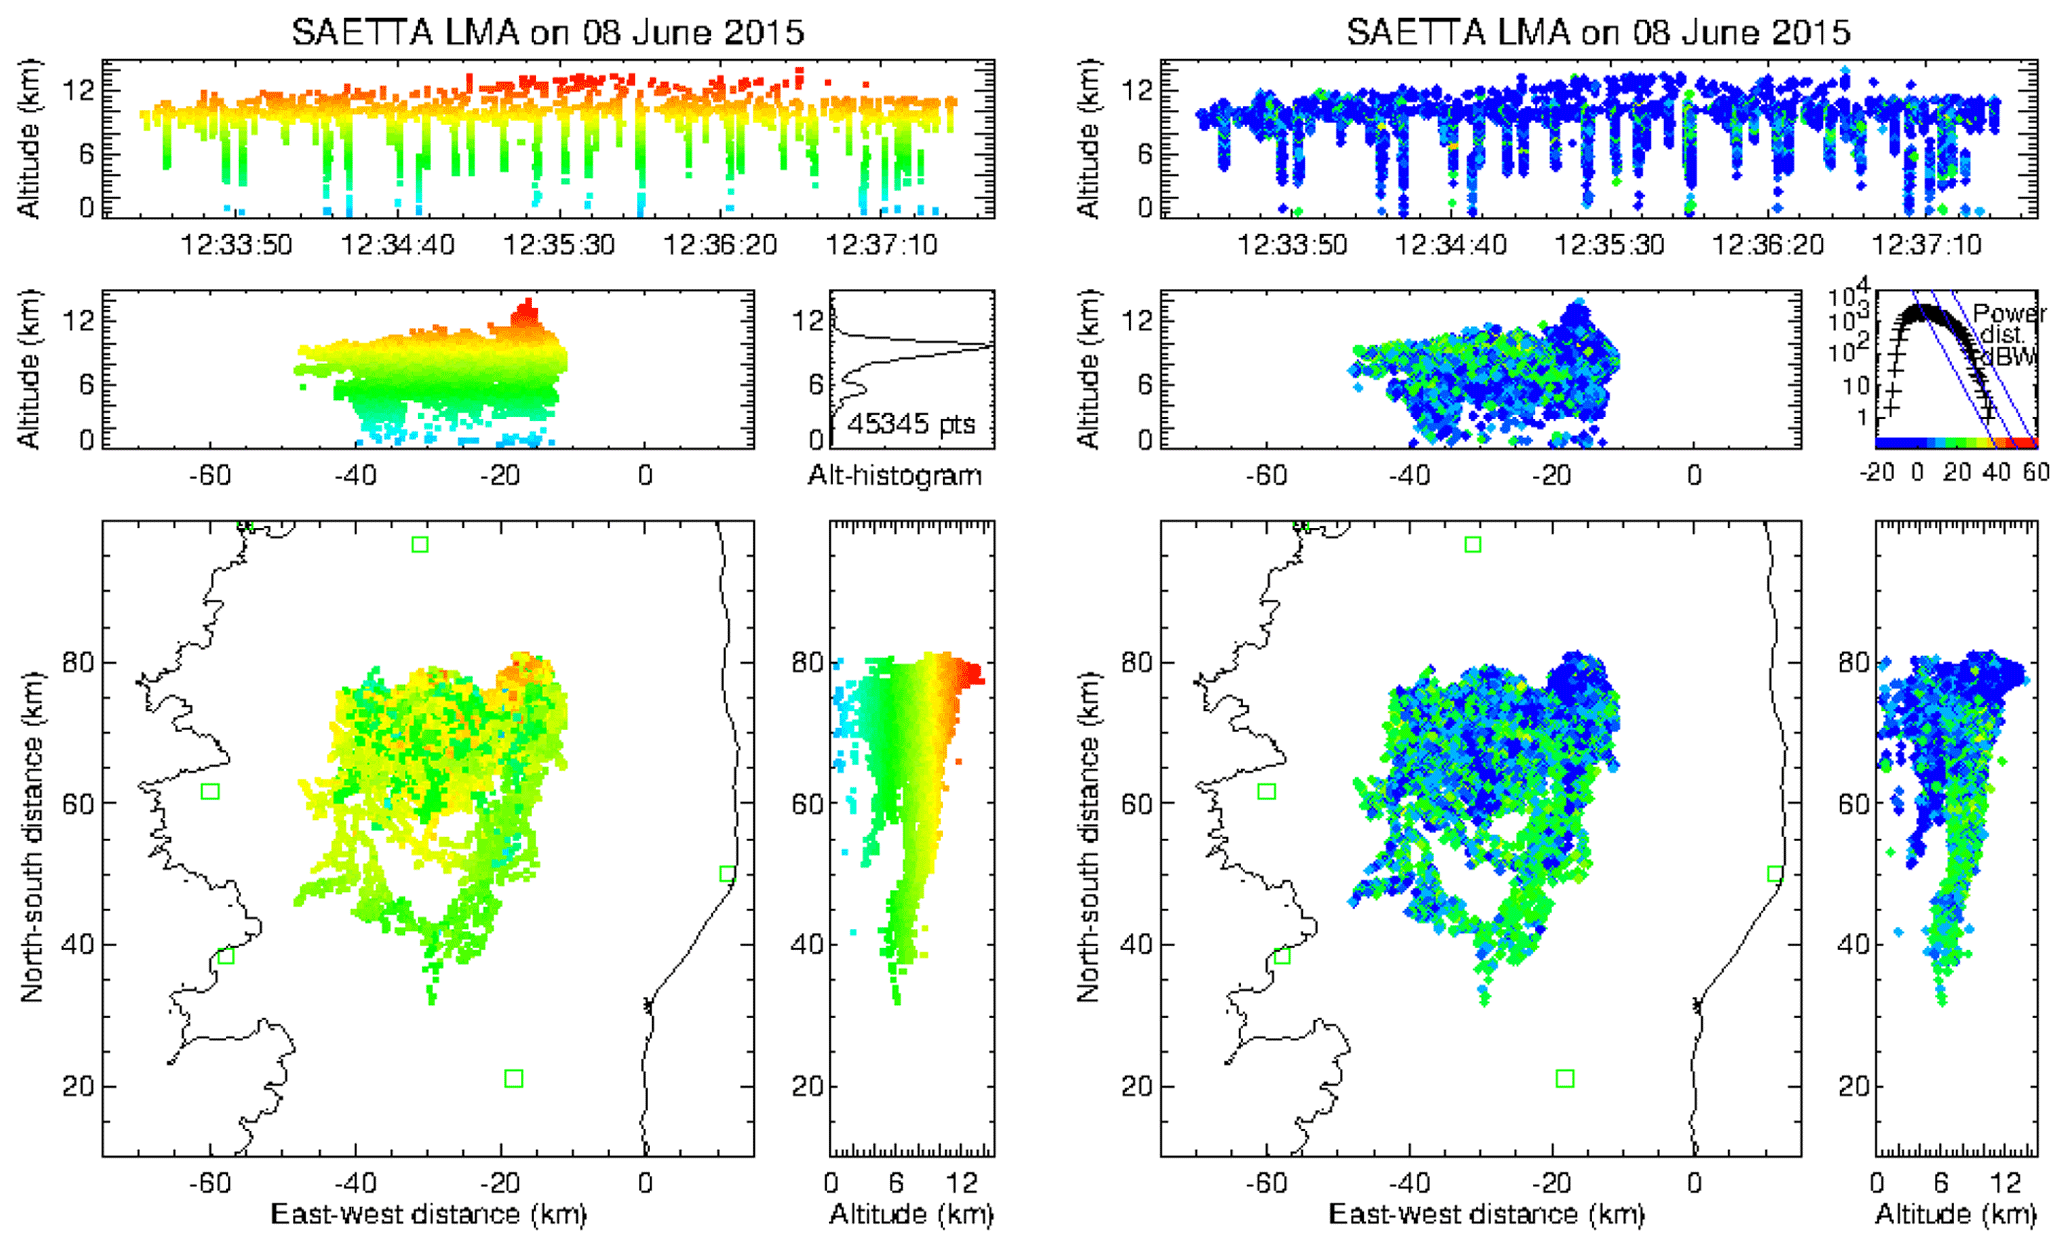
Figure 11High-altitude discharges in the convective zone during the MCS event of 8 June 2015 corresponding to the convective surge no. 5. VHF sources displayed by dots with the color scale corresponding to the altitude of the sources (left) and to the power with which they have been detected (right).
In order to characterize the flashes produced during such convective surges in terms of flash type, triggering altitude, and flash rate, a source-to-flash clustering of lightning was carried out via the XLMA flash algorithm (Thomas et al., 2003). Several algorithms of flash classification have been developed so far (MacGorman et al., 2008; McCaul et al., 2009; Fuchs et al., 2015) but none of them are ideal, especially when the lightning rate is high and the flashes are very close to each other or overlap. The present flash classification does not represent the truth, especially since the classification of small lightning can be affected by the filtering used (minimum number of stations or maximum χ2). But considered in a qualitative way, it makes it possible to characterize the types of lightning thus defined according to the evolution of the storm event. The classification criteria are as follows: (i) big flashes (75 or more points), (ii) medium flashes (11–74 points), (iii) small flashes (10 points or fewer and not isolated), (iv) small–isolated flashes (two to nine points in an active region and duration longer than 1 ms), and (v) short–isolated flashes (two to nine points in an active region and duration shorter than 1 ms). The flash algorithm options (spatial and temporal parameters) are mentioned in Appendix B. The location of the first sources is supposed to indicate the location of initialization of the lightning.
The lightning flash rate per minute, calculated for big, medium, and small flashes together, is displayed in Fig. 12c as a blue line. It remains rather weak with values lower than 10 min−1 until the end of the first main convective core no. 1 at about 12:00 UT. Then, it exhibits several peaks between 12:00 and 13:00 UT with maxima of 48 min−1 at 12:20 UT, 33 min−1 at 12:28 UT, 47 min−1 at 12:34 UT, and 33 min−1 at 12:42 UT. Each of them corresponds to one of the convective surges reported in Table 2. The flash rate corresponding to small–isolated and short–isolated flashes is also displayed in Fig. 12c as a red line for comparison. Its maxima, greater than those of big, medium, and small flashes considered together are also in phase with convective surges (see Table 2). The flash rate of small–isolated and short–isolated flashes seems to be a good proxy for the convective surges.
The first sources of flashes have also been extracted via the XLMA flash algorithm in order to identify the preferential altitudes where lightning flashes were triggered. The altitude of those first sources are displayed versus time in Fig. 12a for each kind of lightning flash. Additional information about the number of first sources by flash type is given in Fig. 12b that provides their altitude histogram with a 200 m vertical resolution. The big flashes are triggered from the very beginning of the event until the end (blue dots in Fig. 12a). During the first convective core no. 1 between about 11:10 and 12:00 UT the altitude of their first sources is distributed over three altitude levels (1.5, 3, and 5.5 km). The two lowest levels correspond mainly to cloud-to-ground flashes and the highest level to intra-cloud flashes. At 12:00 UT big flashes were suddenly triggered at a fourth altitude level between 8 and 10 km altitude until the end of the more intense convective phase, i.e., 13:40 UT. Note that during the same period from 12:00 to 12:40 UT the lowest first sources of big flashes (blue dots) were much less numerous, which corresponds well to the intensification of convection and to a reduction in cloud-to-ground flash activity. After 13:40 UT big flashes were again only triggered at three altitude levels (1, 4, and 6 km). As far as medium and small flashes are concerned, they were triggered at about all altitudes from 12:00 UT until the end of the event but much less frequently than big flashes, with however maxima at about 9.5 and 10.7 km, respectively (not clearly visible in Fig. 12a), during the phase of intense convection between 12:00 and 13:10 UT. During the same intensive period, numerous small–isolated and short–isolated flashes were triggered between 9 and 13 km altitude. The altitude histograms in Fig. 12b show that initiation of big flashes dominates at altitudes lower than 9 km with a maximum around 5500 m altitude. At higher levels corresponding to convective surge activity, big, medium, and small flashes exhibit maxima at about 9300, 9700, and 10 500 m altitude, respectively (the smaller the flash the higher the altitude at which it is triggered), while small–isolated flashes and especially short–isolated flashes exhibit higher maxima at 9900 and 10 300 m altitude, respectively. These results confirm the small-scale electrical activity on top of a convective core over small areas centered on convective surge positions indicated in Table 2. Furthermore, it seems that only small–isolated and short–isolated flashes are able to correctly account for this specific high-level electrical activity associated with the uppermost part of convective surges.

Figure 12Altitude versus time of the first VHF sources of each flash on 8 June 2015 MCS event (a), altitude histogram of these first VHF sources with a vertical resolution of 200 m (b), and 1 min flash rate versus time (c) for small–isolated and short–isolated flashes (red) and for big, medium, and small flashes (blue). Flash classification: big flashes (75 or more points), medium flashes (11–74 points), small flashes (10 points or less and not isolated), small–isolated flashes (two to nine points in an active region and duration longer than 1 ms), and short–isolated flashes (two to nine points in an active region and duration shorter than 1 ms).
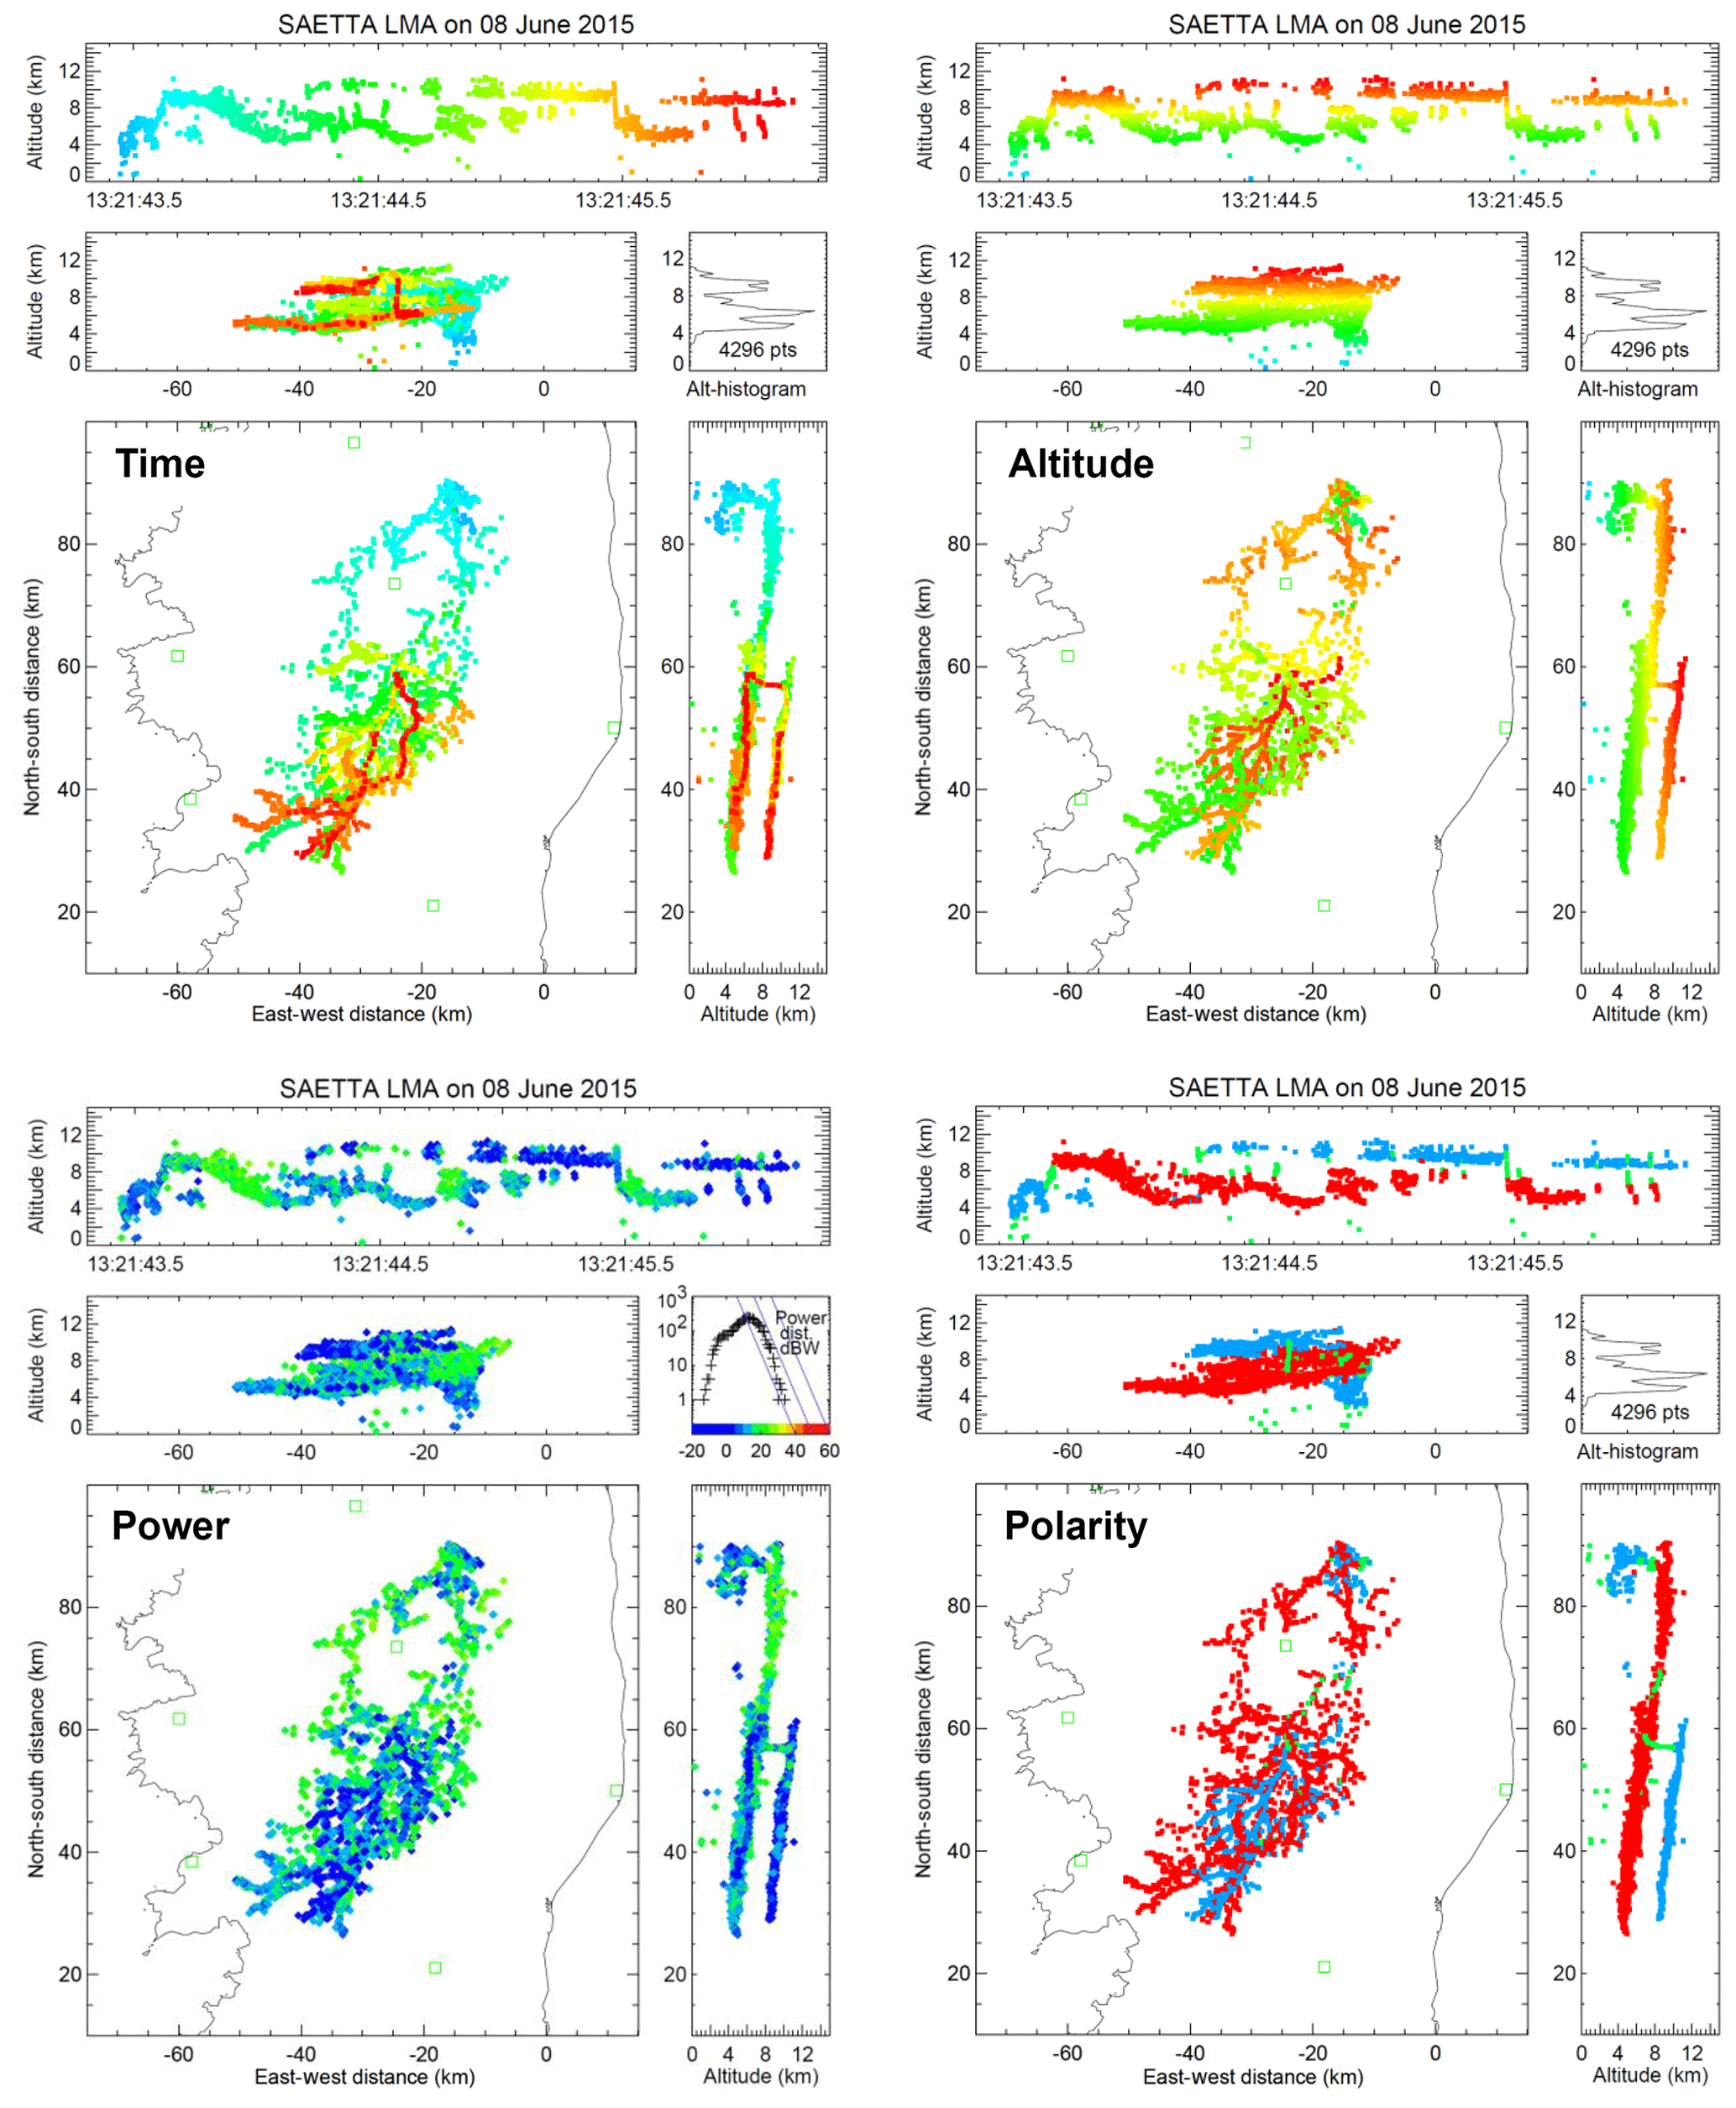
Figure 13High-altitude discharge in the stratiform region during the MCS event of 8 June 2015 at 13:21:43 UT. VHF sources displayed by dots with color scale corresponding to time (top left), altitude (top right), power (bottom left), and cloud charge polarity with positive in red and negative in blue (bottom right).
4.2 Event of 8 June 2015: upper-level discharges in the trailing stratiform region
During the same event of 8 June 2015, six uncommon flashes were detected by SAETTA in the trailing stratiform region of the mesoscale convective system (see Table 3 for detailed temporal and spatial characteristics); four of them were triggered during the second half of the phase of intense convection (between 12:00 and 13:10 UT; see Sect. 4.1), and the two others were triggered later during the decay phase. Those six flashes started like typical IC (or CG for one of them) via a bidirectional leader process (Kasemir, 1950; Israel, 1973; Mazur, 2002; Montanyà et al., 2015), the negative leader of which propagates upward until it reaches the upper positive charge of the regular dipole structure, and then propagates away from convective core no. 2 into the stratiform region with a low descent associated with the sedimentation of the charged ice particles as described by Ely et al. (2008). However, during the propagation phase through the stratiform region, an upward positive leader – probably issued from a bidirectional leader triggered just above the positive charge layer of the stratiform region – suddenly appears at a distance varying from 14 km (flash no. 3) to 33 km (flash no. 2) from convective core no. 2 and propagates upward over a vertical distance varying from 3 km (flashes no. 2 and no. 3) up to 5 km (flash no. 5). Then the positive leader spreads in a negative charge layer almost horizontal but with a tilt parallel to that of the positive charge layer below, at altitudes ranging from a maximum of about 12 km to a minimum of about 8 km, and at horizontal distances varying from 10 km (flash no. 3) to 33 km (flash no. 5), in several directions but mainly downwind.
Those uncommon flashes can be illustrated by flash no. 5 that appeared just before 13:21:43.5 UT. The corresponding VHF sources are displayed in Fig. 13 versus time (top left), altitude (top right), power (bottom left), and inferred cloud charge polarity (bottom right). The polarity of the VHF sources (selected by hand with the XLMA software) is deduced from the intensity of the power with which they are detected. Basically most powerful sources correspond to negative leaders that move through positively charged regions while less powerful sources correspond to positive leaders that move through negatively charged regions. More precisely, positive leaders could in fact be the signature of retrograde negative breakdowns located close to the tips of positive leaders. As analyzed by Edens et al. (2012) positive breakdowns do produce weak VHF emissions; however they may be masked by much stronger concurrent VHF emissions from negative breakdowns (see also van der Velde and Montanyà, 2013). But whatever positive leaders are directly or indirectly – via negative retrograde breakdowns at their tips – detected, this possibility does not question their presence and their location. This flash starts as a cloud-to-ground discharge that connects a negative charge layer located between about 4 and 6 km altitude to the ground around the position defined by and y=87 km, and shortly after develops as an intra-cloud discharge with an upward negative leader that rises up to 9 km at 13:21:43.6 where it spreads in a positive charge layer. The propagation of the positive leader into the lower negative charge appears only until 13:21:43.8 while the negative leader travels through the whole stratiform region in a slightly tilted positive charge layer until 13:21:44.7. Before that, a first upward positive leader appears at 13:21:44.2 on top of the positive charge layer at the position defined by and y=57 km. Only its upper end can be seen in green in the top panel of the bottom right graph in Fig. 13. This upward positive leader reaches the altitude of about 10 km and spreads horizontally. Probably three other upward leaders follow the same channel between 13:21:44.3 and 13:21:44.6. Later, three downward recoil discharges follow exactly the same path from the uppermost negative charge layer down to the positive charge layer of the stratiform region between about 13:21:45.5 and 13:21:46.1.
Similar flashes were previously reported in the literature but were not analyzed as specific flashes (see Fig. 15 in Lang et al., 2010; Fig. 1 in Lang et al., 2011; Fig. 7 in Weiss et al., 2012; Fig. 12 in Soula et al., 2015; Fig. 5 in Lang et al., 2016). They occurred in different storm organizations in the trailing stratiform region, or in the anvil in the case of a supercell storm: MCS (Lang et al., 2010, 2011; Soula et al., 2015), supercell (Weiss et al., 2012), or multicell (Lang et al., 2016). The upper-level discharge of the flash observed by Weiss et al. (2012) exhibits the typical structure of an intra-cloud flash in an inverted polarity thunderstorm, i.e., an upward-propagating positive leader that spreads aloft in a negative charge layer (in this case over about 25 km) with a shape that looks like an upward water jet. This feature is somewhat different from that of the flash displayed in Fig. 13 for which the upward positive leader spreads horizontally aloft over the same distance scale (35 km) but through a thin and very flat layer. The microphysical and dynamical processes must therefore be somewhat different in each of these two cases.
To further identify the discharge processes involved in that complex lightning flash, we performed the time–distance analysis proposed by van der Velde and Montanyà (2013). The calculated horizontal distance between the first source and each other source of the flash is displayed in Fig. 14 versus time as a function of the altitude of the sources (left) and also as a function of the cloud charge polarity in which the leaders propagate (right). In this way, one can easily refer to Fig. 13 (top right and bottom right) to identify the location of each discharge phase. The flash comprises three kinds of discharge processes according to the three kinds of slope that can be identified in Fig. 14. Note that positive slopes correspond to discharges propagating away from the first source. Meanwhile negative slopes correspond to discharge propagating toward the first source. One can first point out four main negative leaders (red lines in right graph) propagating away from the first sources in the stratiform region (increasing distance) and toward decreasing altitudes (color from orange to blue in left graph) with a radial speed of about 1.4×10⁵ m s−1 (from 0.2 to 0.75 s for the first one, from 1 to 1.3 s for the second one, from 1.3 to 1.45 s for the third one, and from 2 to 2.3 s for the fourth one), which is consistent with the measurements by van der Velde et al. (2014). Then, sources associated with the positive leader branch can be identified with a slower increasing distance with time mainly between 0.7 and 2.7 s in blue in the right graph and in orange and red in the left graph; i.e., they are localized at high altitude. The corresponding radial speed is about 1.7×10⁴ m s−1, which is 1 order of magnitude less than that of negative leaders. Those positive leaders correspond to the uncommon uppermost altitude discharges in the stratiform region. At last, one can identify very fast-propagating discharges corresponding to the almost vertical lines in Fig. 14 at about 0.8, 1.5, 2.4, 2.5, 2.6, and between 1.5 and 1.8 s, the radial speeds of which are about 106 m s−1 (between 8×10⁵ and 1.4×10⁶ m s−1). Similar almost vertical lines are visible in Fig. 2c and d of van der Velde and Montanyà (2013). Those fast-propagating discharges may be dart leaders or long recoil events according to van der Velde and Montanyà (2013). The latter can be distinguished at the end of the flash sequence in the top left graph of Fig. 13: the discharge propagates three times consecutively from the south tip of the uppermost layer of VHF sources, returns northward to the vertical channel of the initial ascending leader, descends along this channel, and propagates southward into the positive charge of the stratiform region (in orange and red). As a matter of fact, the successive passages of these events through the vertical channel can be illustrated by the green dots present in each of the almost vertical lines in the right graph of Fig. 14. All the radial speeds evaluated here are in good agreement with previous observational studies; see van der Velde and Montanyà (2013) for a review.
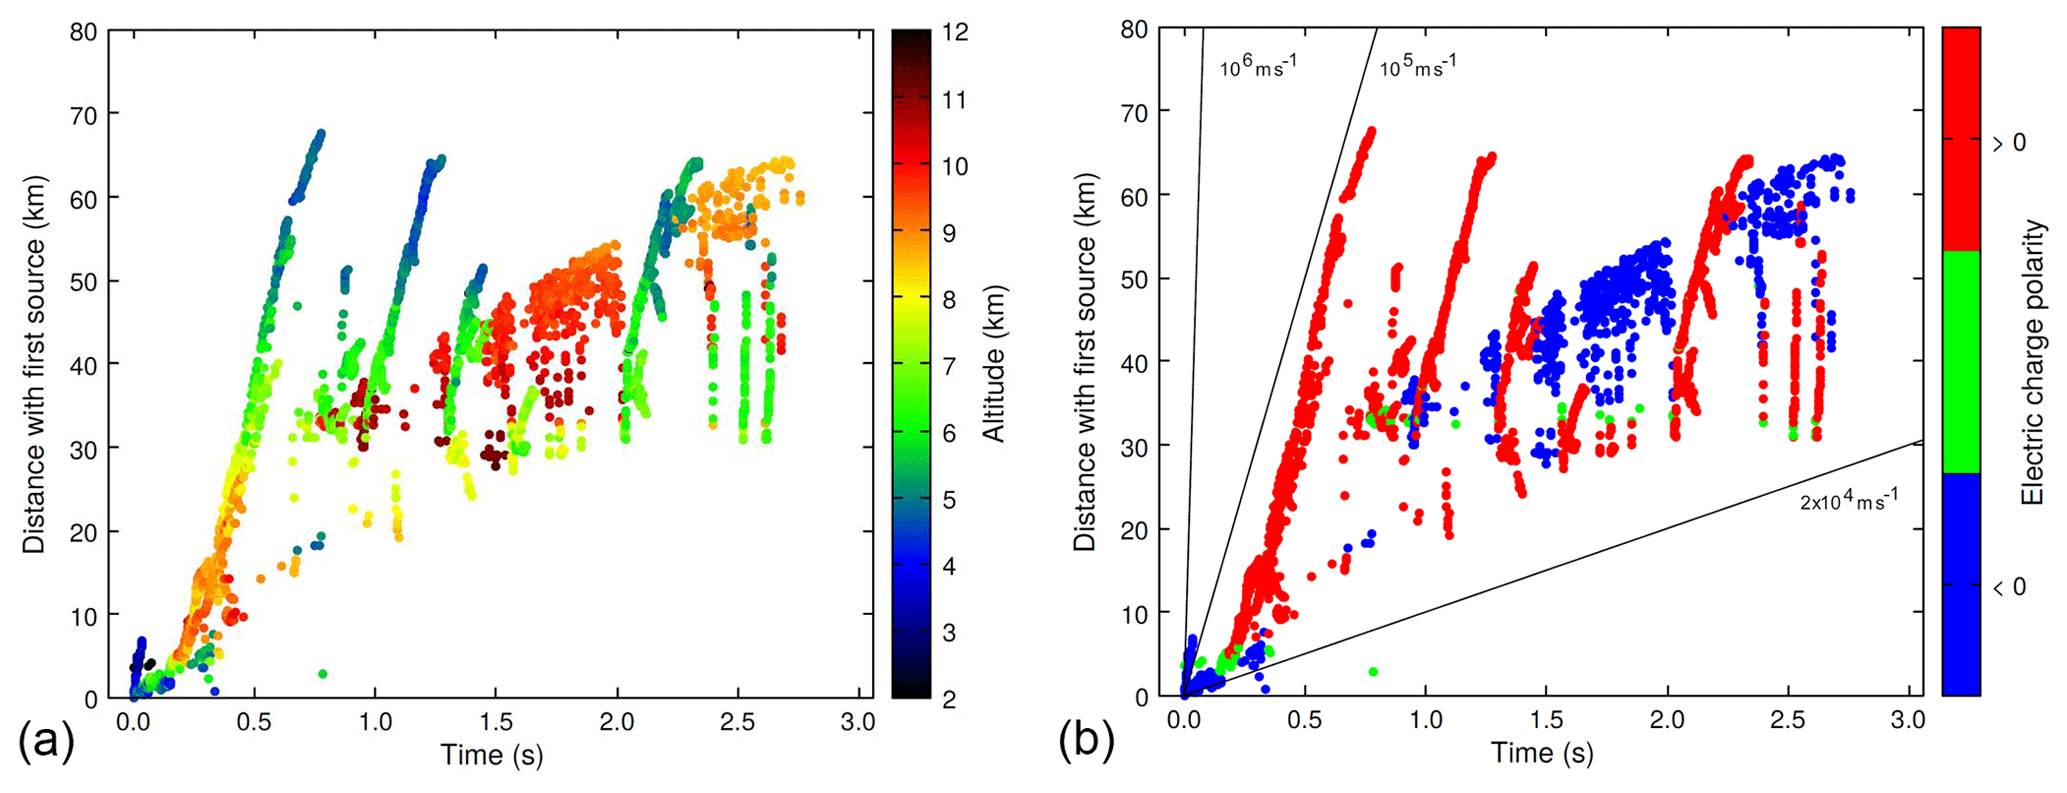
Figure 14High-altitude discharge in the stratiform region during the MCS event of 8 June 2015 at 13:21:43 UT. Horizontal distance between each VHF source and the first source versus time in function of altitude (a) and cloud charge polarity in which the leaders propagate (b). The time is indicated in seconds from the beginning of the flash. The thin black lines indicate slopes corresponding to speeds of 2×10⁴, 105, and 106 m s−1.
Several questions arise from the observation of such a complex lightning flash involving two vertically separated layers of charge in the trailing stratiform region. How can a positive leader propagate upward from the top of the main positive charge layer in that region? What are the mechanisms involved in the formation of the uppermost negative charge layer in that region? Why do not all MCSs exhibit such complex lightning flashes? One can refer to the review by Stolzenburg and Marshall (2008) on the charge layer structure in such convective systems, based on in situ balloon-borne measurements. As observed in the present study, lightning in convective systems is most often triggered in or near the convective cores (Ribaud et al., 2016) and can subsequently propagate horizontally into the anvil or into the trailing stratiform region (Carey et al., 2005; Dotzek et al., 2005; Tessendorf et al., 2007; MacGorman et al., 2008; Lang et al., 2010; van der Velde et al., 2014; Soula et al., 2015), following the path of charged ice particles that sediment (Carey et al., 2005; Ely et al., 2008). Kuhlman et al. (2009) reported observations of in-cloud development of lightning flashes in the anvils of two supercell storms. They showed that the convergence of the anvils with opposite polarities of charge at the same altitude could increase electric field magnitude and favor the initiation of distant anvil lightning. But lightning activity in anvils at earlier and later times was rather supposed to result from some charging mechanism that would be active in the anvil as suggested by Dye and Willett (2007), i.e., that anvil charge would not necessarily originate from transport from the convective core. They also made a comparison with the high electrification of stratiform precipitation regions of mesoscale convective systems where extensive lightning activity develops horizontally (Dotzek et al., 2005; MacGorman et al., 2008) as in the anvils they observed. Recently, Dye and Bansemer (2018, 2019) proposed a conceptual model of mesoscale updraft covering extensive and deep areas during long periods, with non-riming ice collisional charging at middle to upper levels in absence of supercooled liquid water (Luque et al., 2016), in which larger particles carrying one charge (here positive) fall relative to the smaller particles carrying the opposite charge (here negative). Reaching a balance level near the top of the cloud where the updraft has became weak, the small particles with low terminal velocities would accumulate at that level while larger particles with terminal velocities greater than the updraft would sediment downward in the cloud. This scenario would result in the presence of a narrow layer of charge (here negative) near the top of the cloud and a thicker layer of charge (here positive), in a 30 min time period.
Table 3Time and spatial characteristics of the six upper-level discharges observed by SAETTA in the stratiform region of the 8 June 2015 mesoscale convective system.
Observations of the 8 June 2015 mesoscale convective system show the presence of a narrow layer of negative charge near the top of the cloud and a thicker layer of positive charge about 4 km below, with a gap of about 2 to 3 km between them. These features apparently correspond to the conceptual model of Dye and Bansemer (2018, 2019) described above. The geometrical characteristics of the thin upper layer of negative charge must be confronted with a further analysis of the processes. For example, are (i) the horizontal extension (33 km) of this upper layer, (ii) the height (4 km) of the vertical channel through which the discharge connects the two layers, and (iii) the slope of the upper thin layer consistent with this model of mesoscale updraft? Could the thin upper layer of negative charge not originate from a screening effect by electrostatic influence from above the cloud (Marshall et al., 1989; Wiens et al., 2005)? All these questions remain open and could benefit from a modeling study with a mesoscale cloud-resolving model.
One may also wonder if the first convective core no. 1 that appeared between 11:12 and 12:03 UT about 20 km to the south of the two other main convective cores no. 2 and no. 3 could have played a part in the subsequent charge structure of the trailing stratiform region in which it was embedded. Actually it was still active when cores no. 2 and no. 3 developed (11:44 and 11:52 UT). These cores produced their first long-range lightning that propagated in their common stratiform region at 12:09:56 UT, i.e., only 7 min after the end of the electrical activity of the first convective core no. 1, and produced their first uncommon high-altitude discharge (flash no. 1 in Table 3) at 12:38:39, i.e., about 30 min later. Therefore, the interaction of this first convective core no. 1 with the subsequent common trailing stratiform region of the two other cores no. 2 and no. 3 should be further explored. Similarly, one could also consider the interaction between both trailing stratiform regions associated with each of the two main convective cores no. 2 and no. 3.
Corsica is a very suitable place to study convection in a mountainous maritime environment and to observe the climate trend of convection in a Mediterranean region identified as a climatic hot spot (Giorgi, 2006). In 2014, 12 LMA stations constituting the SAETTA network were deployed there to carry out the monitoring of the total lightning activity at high spatial and temporal resolutions. The network has been operational since the summer of 2014, with winter interruptions in the first 2 years and then permanent operation since April 2016, with the goal of operating in the long term to try to observe climatic trends. As far as we know, SAETTA is the first LMA network deployed on such a rough terrain with a range of altitude of about 2000 m.
In order to explore the geometric performance of SAETTA we evaluated its line-of-sight visibility by at least six stations considering the mask effect of the relief. This is the first time such an exercise has been performed for a network of LMA stations. We found that in the range of about 120 km from the center of Corsica, the minimum altitude above which a VHF source can be detected is less than 2 km on average, except in some sectors in the south and southeast of Corsica where this altitude can rise 4 to 5 km beyond about 100 km from the center of the island. This geometric performance logically deteriorates when the three highest stations are off for wintering from December to March, with a southwest region very poorly documented beyond 100 km from the center of the island (minimum altitude greater than 6–9 km). We also evaluated its location accuracy by means of the geometric model of Thomas et al. (2004) and we compared the results with those concerning the STEPS network (Lang et al., 2004; Thomas et al., 2004). The performance seems very similar (and even better for the slant range), albeit the SAETTA network is much more geographically extended for the same number of stations. The contribution of the vertical baseline of this mountainous network compared to a totally flat network also shows that the vertical accuracy is significantly improved for sources beyond 150 km. A more comprehensive assessment of SAETTA's performance could undoubtedly benefit from comparisons with trajectories of airliners that can be detected by the network. We plan to perform this kind of comparison with GPS data of commercial flights.
Combining observations from the years 2014 to 2016, we have elaborated a preliminary climatology of total lightning activity on Corsica, which has never been done so far, in a 240 km × 240 km domain. The number of lightning days per square kilometer is dominated by daytime convection over the relief from June to July, with a local maximum at the north center of the island produced in July between 11:00 and 14:00 UT. Tidiga et al. (2018) showed – via a numerical study using the cloud-resolving model Meso-NH at high resolution – that in absence of synoptic forcing this local maximum is likely due to the low-level convergence of moist air fluxes originating from sea breezes channeled through three main valleys that converge towards each other at this location. Subsequent studies envisaged should analyze the fine-scale impact of synoptic forcing on this scenario. Additionally, the monthly number of lightning days undergoes two maxima: (i) one in June due to daytime convection in phase with the maximum of solar flux at the summer solstice and (ii) one in September associated with numerous small storms over the sea or with some high-precipitation events. Those last events may be associated with high precipitation and flash floods (Scheffknecht et al., 2016) and are the focus of the HyMeX program (Ducrocq et al., 2014).
The present paper also reports unusual lightning events that occurred in a mesoscale convective system on 8 June 2015. Produced during convective surges, the first type of lightning events consisted of numerous VHF sources concentrated on a small perimeter (5 km by 5 km) and protruding from the top of the cloud located at about 11.5 km, up to 14 km from altitude. They correspond to a quasi-continuous activity of positive leaders of very limited vertical and horizontal extension reaching an upper layer of negative charge, i.e., probably the typical uppermost charge region in MCS structure (Stolzenburg et al., 1998). The implementation of the XLMA flash algorithm of Thomas et al. (2003) shows that most of this lightning activity consisted of small–isolated and especially short–isolated flashes, which are most commonly disregarded in flash classification. The second type of lightning events concerns uncommon high-altitude discharges in the trailing stratiform region of the mesoscale convective system. A focused analysis is made on one of them that started as a cloud-to-ground flash, propagated upward with a negative leader reaching the upper positive charge of the cloud, and then propagated away from convective core no. 2 into the stratiform region with a modest descent. At this time a positive leader rose vertically over 5 km and 31 km away from convective core no. 2 to reach an uppermost thin layer of likely negative charge, with multiple subsequent recoil phases between this uppermost charge layer and the lower main positive charge layer. Such a complex flash has seldom been observed and published before (best examples in Weiss et al., 2012, and in Lang et al., 2016) and was almost never analyzed as a specific flash type that provides information on the upper positive charge layer in the stratiform zone of a MCS. Interestingly, this type of flash may confirm the recent conceptual model of Dye and Bansemer (2018, 2019) that explains such an upper-level layer of charge in the stratiform region by the action of a non-riming ice collisional charging in a mesoscale updraft. A more detailed assessment of the multiple simultaneous nearby cells is required in order to confirm this cause.
SAETTA is now a high-performance lightning 3-D imager that can serve as a reference for electrical schemes of the Meso-NH cloud resolving model (Barthe et al., 2012; Pinty et al., 2013), for operational LF–VLF lightning location systems in this region, for measurement campaigns such as EXAEDRE (https://www.hymex.org/exaedre/, last access: 23 October 2019) that took place on Corsica in September and October 2018, and also for the calibration–validation phases of the future observations performed by the optical lightning imager LI on the Meteosat Third Generation geostationary platform (EUMETSAT) that will be launched in the forthcoming years.
SAETTA data are available to members of HyMeX on the HyMeX website and can be provided on demand. They are also available on the AERIS/SEDOO/HyMeX database (https://www.aeris-data.fr/, last access: 23 October 2019).
In this appendix we describe the geometric method used to estimate the minimum altitude at which a VHF source can be detected by the SAETTA network in a 240 km × 240 km square area centered on Corsica, with a 5 km horizontal resolution (48×48 pixels). All altitudes here are considered above mean sea level (a.m.s.l.) and the Earth radius RE is assumed uniform on the domain. For simplicity, the atmospheric refraction is not taken into account. Therefore the altitudes calculated here overestimate the real minimum altitudes of VHF source detection since electromagnetic waves propagating in the clear sky are actually deflected downwards because of the refractive index gradient that is most often directed downward. The location of SAETTA stations is provided by their GPS; their altitude is derived from the data set of the National Institute of Geographical and Forest Information (IGN) via the Géoportail website (https://www.geoportail.gouv.fr/, last access: 23 October 2019). All geographic positions are converted to Cartesian coordinates using Lambert's conformal conic projection for France (Duquenne et al., 2005). The relief of Corsica is obtained by interpolation – by the Cressmann method with a horizontal resolution of 100 m – of the SRTM digital elevation data (SRTM 90 m Digital Elevation Database v4.1) of the Consortium for Spatial Information CGIAR-CSI (http://www.cgiar-csi.org/data, last access: 23 October 2019).
The algorithm implemented for this calculation is as follows (see Fig. A1 to identify the different variables named hereafter): (i) a point Px at an altitude zPx above the center of a given pixel is considered; (ii) one looks at whether the direct line of sight between this point Px and each of the SAETTA stations (point St of altitude zSt) intersects the terrain of altitude zr or not (for that the altitude zP of each point P distributed every 1 km along each line of sight is compared to zr); (iii) if the considered point is visible by fewer than six SAETTA stations, its altitude is increased (increment of 500 m); (iv) the sequence (iii) is repeated as long as the considered point is visible by fewer than six stations; (v) when the considered point is visible by at least six stations, its altitude zPx is the solution for the given pixel and one moves to another pixel.
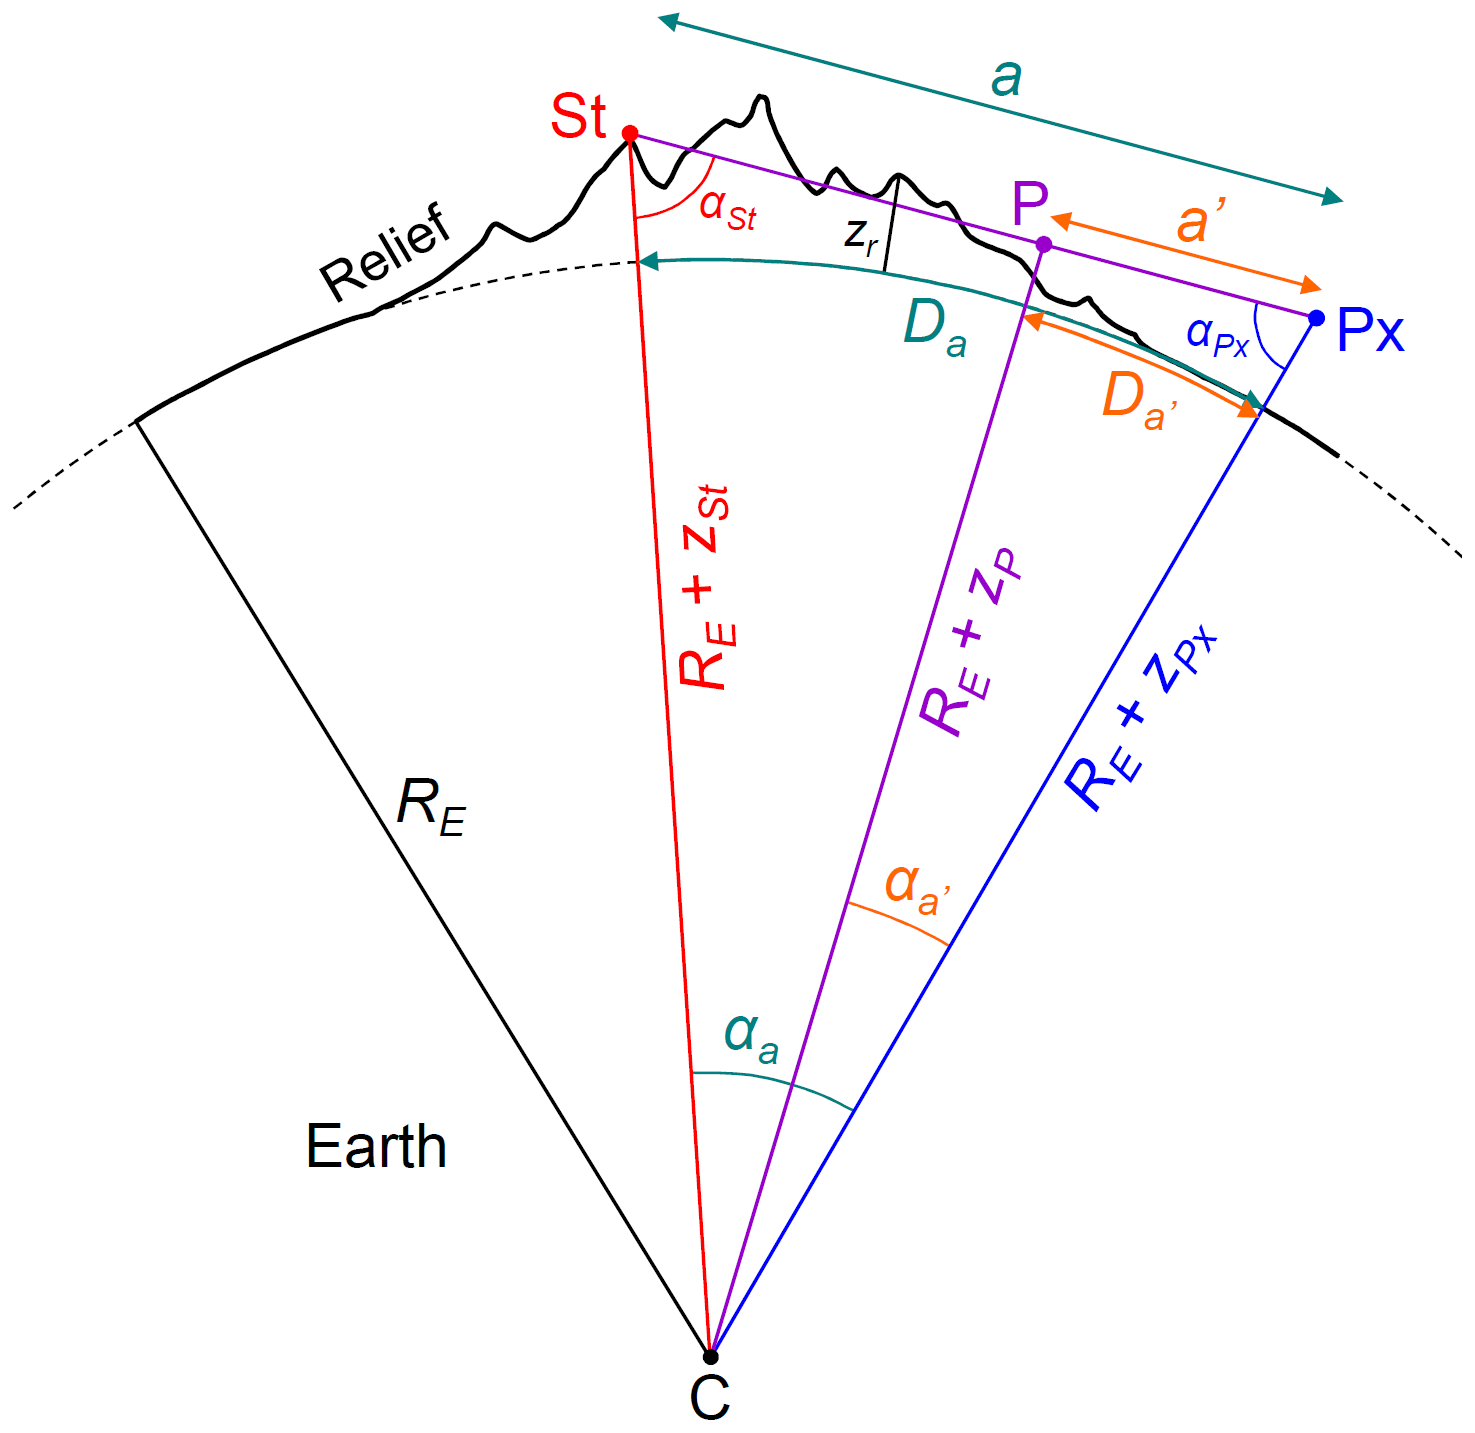
Figure A1Geometry used in the calculations carried out to evaluate the geometric potential of VHF source detection by the SAETTA network.
The main difficulty that arises in this calculation is to determine the altitude zP of each point P along the direct line of sight (Px, St) by taking account of the roundness of the Earth, the center of which is the point C. Here is how the calculation was conducted. According to Fig. A1, Da stands for the known geographic distance between the pixel and the station, and stands for the known geographic distance between the pixel and the point P along the line of sight. Assuming the Earth curvature is uniform on the domain, one can deduce the corresponding angles αa and :
and
Then, the distance a between the points St and Px is deduced from the generalized Pythagorean theorem applied to the triangle (C, St, Px) according to the following expression.
Using the law of sines in that triangle (C, St, Px),
we can deduce the angles αSt and αPx:
and
Using the law of sines in the triangle (C, St, P) gives
Using the law of sines in the triangle (C, P, Px) gives
By isolating a′ in Eq. (A6) and returning its expression in Eq. (A5), we obtain the unknown zP that we are looking for.
Figure A2 illustrates the determination of the minimum altitude at which a considered point (here the southwest corner of the domain corresponding to the zero abscissa) can be seen from one SAETTA station (here the Aléria station located on the east coast). The red lines correspond to lines of sight that intersect the relief. Meanwhile the blue line corresponds to the first altitude (here 12 500 m) at which the considered point can be seen by the SAETTA station. The curvature of the lines illustrates the influence of the roundness of the Earth. This approach was used to produce the results shown in Fig. (A2).
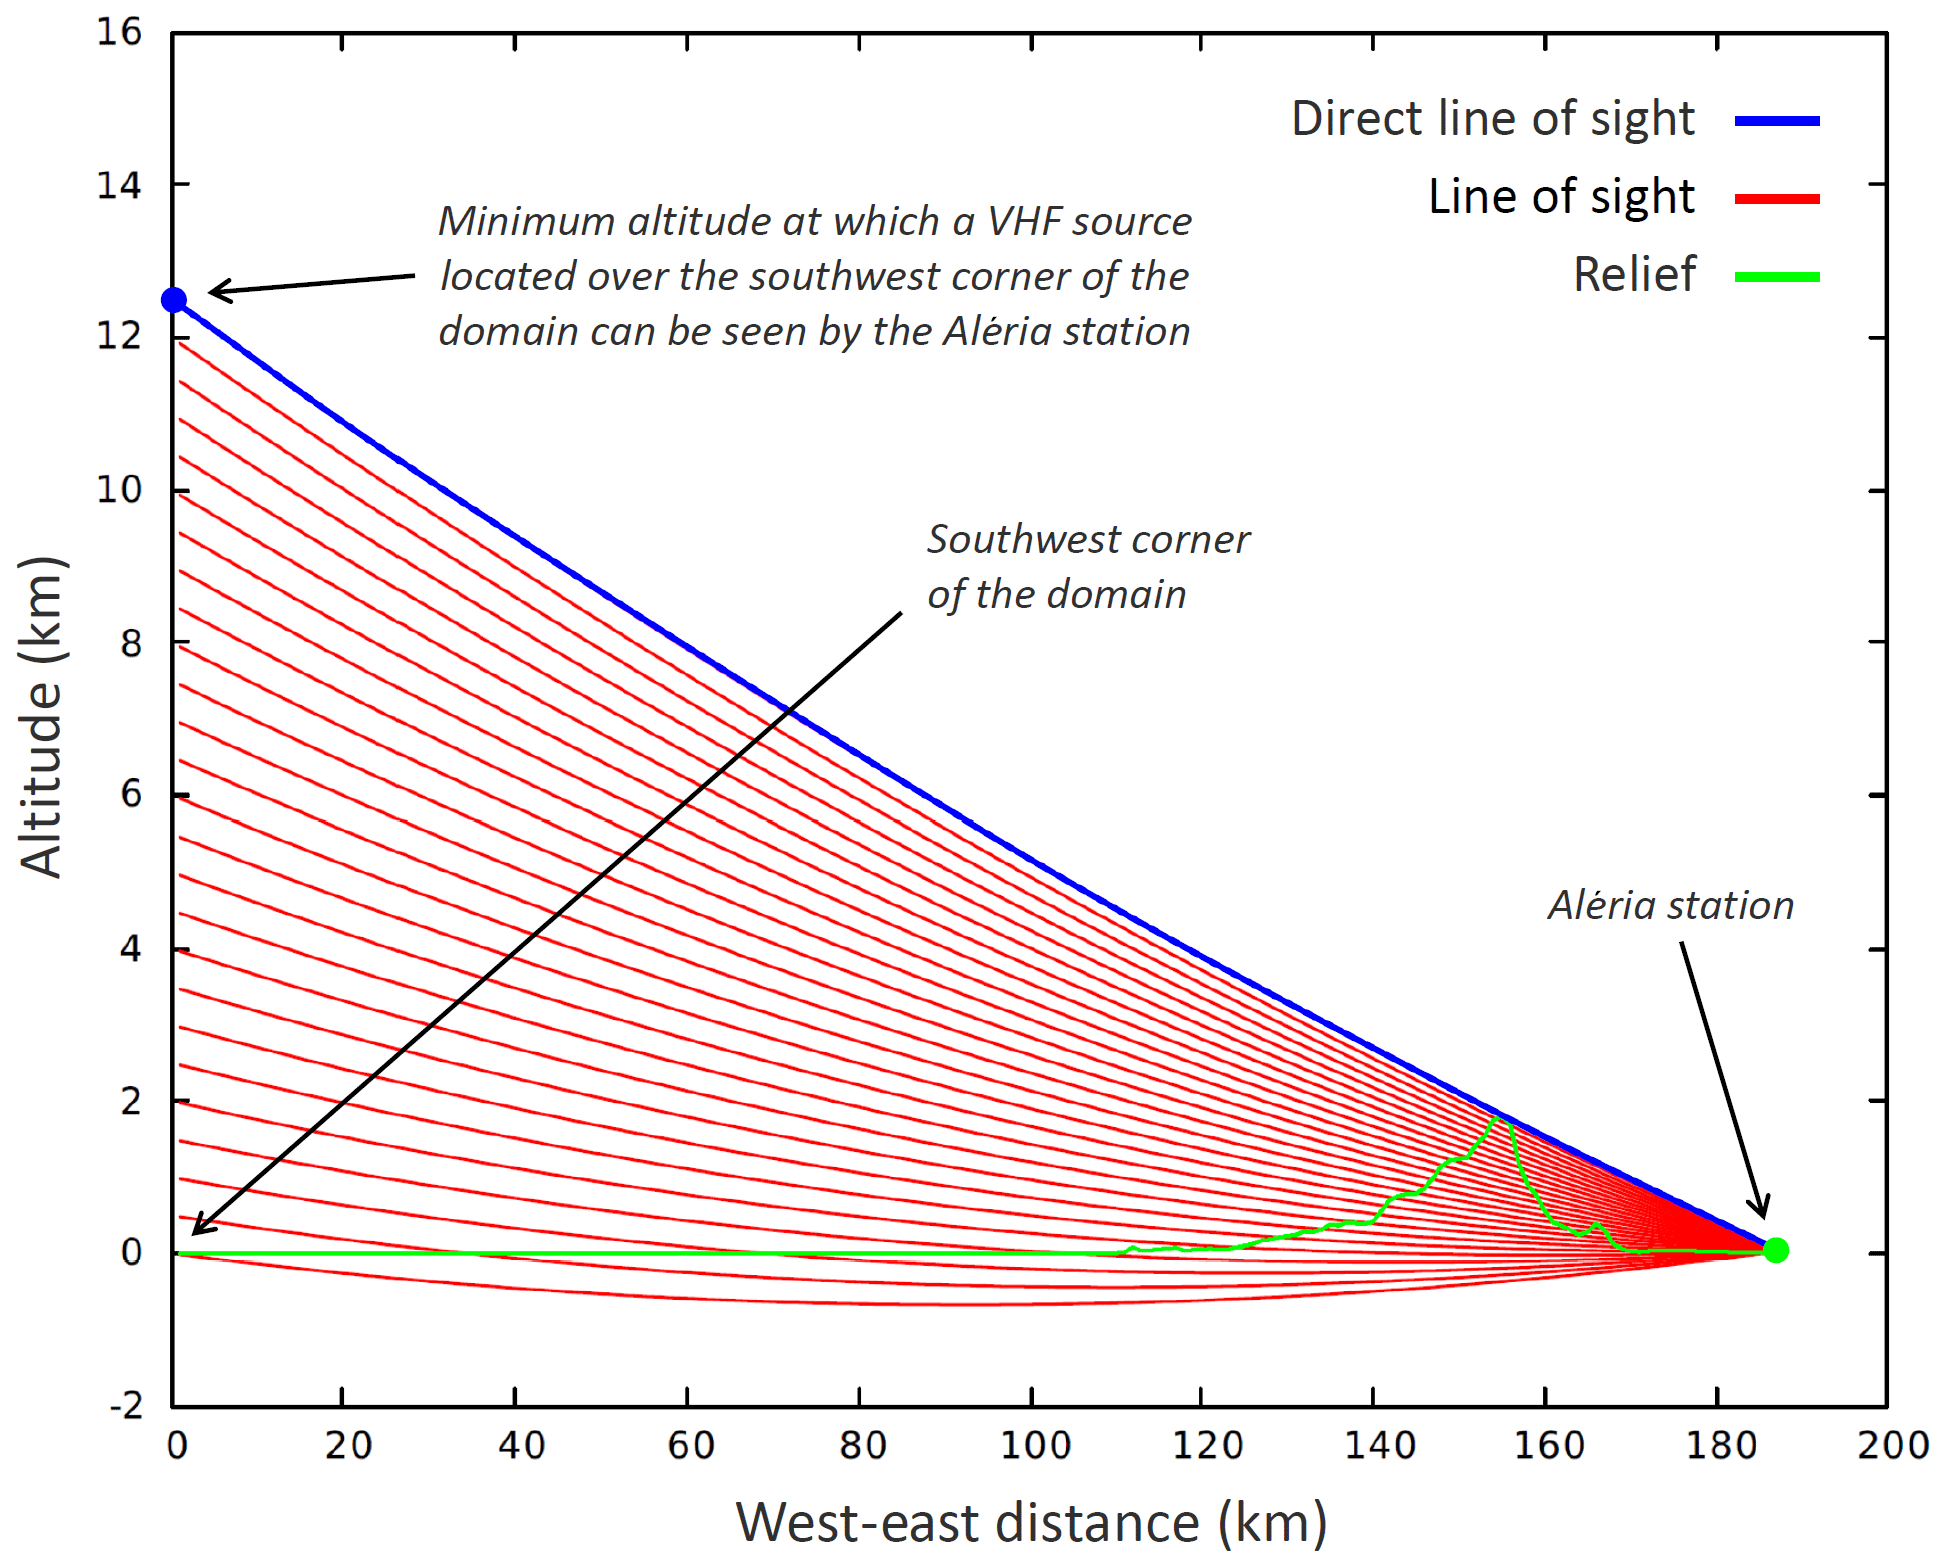
Figure A2Illustration of the search algorithm for the minimum altitude of direct vision between a pixel and a station (e.g., here between the southwest corner of the domain and the Aléria station on the east coast) taking into account the earth's roundness.
| Max spatial separation for points in a flash (m) | 3000.0 |
| Max altitude separation for points in a flash (m) | 5000.0 |
| Max time separation for points in a flash (s) | 0.15 |
| Max allowable flash length (s) | 3.0 |
| Min acceptable vertical velocity (m s−1) | 20 000.0 |
| Max number of points in a flash group | 50 000.0 |
| Lat–long pixel size for density ratios and size | 0.01 |
| Max number of points to be a small flash | 10 |
| Point division between medium and big flashes | 75 |
| Max number of points in a flash fragment or noise | 3 |
| Ratio of number of points between parent and fragment | 15 |
| Max difference in azimuth between parent and fragment (rad) | 0.05 |
| Fraction of spatial separation for sparse connection | 0.50 |
| Min number of points in a sparse connection | 3 |
| Max score for noise | 2 |
| Normal IC altitude (m) divider (75 % must be greater than) | 5500.0 |
| Low flash altitude (m) divider (75 % must be less than) | 7000.0 |
| Rejoin flashes? | yes |
SC, ED, PdG, DL, JPP, VP, and SP deployed the SAETTA network and are involved in the field maintenance. RJT, PRK, and WRi provided their scientific and technical expertise. RJT performed the theoretical error calculations and provided the corresponding figures. SC is in charge of the reconstructed data quality control and of the production of annual catalogs of stormy events. ED is in charge of the raw and reconstructed data quality control and provided his scientific expertise. SP is in charge of the technological development, of the development and maintenance of the web site, of the production of reconstructed data, and of the real-time management. PdG is involved in the technical development and in the technological watch. DL is in charge of the regional funding and contacts. SC conducted the study and wrote the paper. All authors contributed to revisions of the paper.
The authors declare that they have no conflict of interest.
This article is part of the special issue “Hydrological cycle in the Mediterranean (ACP/AMT/GMD/HESS/NHESS/OS inter-journal SI)”. It is not associated with a conference.
Acknowledgements are addressed to SAETTA main sponsors: Collectivité Territoriale de Corse through the Fonds Européen de Développement Régional of the European Operational Program 2007–2013 and the Contrat de Plan Etat Région that funded the CORSiCA project; Collectivité de Corse through the CORSiCA 2017–2019 project; CNRS-INSU through the HyMeX/MISTRALS program; ANR IODA-MED; CNES through the SOLID project; UPS/Observatoire Midi-Pyrénées; and Laboratoire d'Aérologie. We also sincerely thank the many individuals and regional institutions in Corsica (including the Conservatoire du Littoral, Qualitair Corse, and INRA San Giuliano), who host the 12 stations of the network, who helped us to find sites, or who bring us assistance for the logistics during missions in the field. We acknowledge the use of imagery from the NASA WorldView application (https://worldview.earthdata.nasa.gov, last access: 23 October 2019), part of the NASA Earth Observing System Data and Information System (EOSDIS). We thank both reviewers for their constructive comments and suggestions that helped us to improve the paper.
This research has been supported by the Collectivité Territoriale de Corse (FEDER 2007–2013 CPER CORSiCA grant), the ANR (grant no. IODA-MED ANR-11-BS56-0005), the MISTRALS/HyMeX (grant no. TS4a), the CNES (SOLID grant), and the Collectivité de Corse (CORSiCA 2017–2019 grant).
This paper was edited by Christian Barthlott and reviewed by two anonymous referees.
Adler, B., Kalthoff, N., Kohler, M., Handwerker, J., Wieser, A., Corsmeier, U., Kottmeier, C., Lambert, D., and Bock, O.: The variability of water vapour and pre-convective conditions over the mountainous island of Corsica, Q. J. Roy. Meteorol. Soc., 142, 335–346, https://doi.org/10.1002/qj.2545, 2016.
Barthe, C., Chong, M., Pinty, J.-P., Bovalo, C., and Escobar, J.: CELLS v1.0: updated and parallelized version of an electrical scheme to simulate multiple electrified clouds and flashes over large domains, Geosci. Model Dev., 5, 167–184, https://doi.org/10.5194/gmd-5-167-2012, 2012.
Barthlott, C. and Kirshbaum, D. J.: Sensitivity of deep convection to terrain forcing over Mediterranean islands, Q. J. Roy. Meteorol. Soc., 139, 1762–1779, https://doi.org/10.1002/qj.2089, 2013.
Barthlott, C., Adler, B., Kalthoff, N., Handwerker, J., Kohler, M., and Wieser, A.: The role of Corsica in initiating nocturnal offshore convection, Q. J. Roy. Meteorol. Soc., 142, 222–237, https://doi.org/10.1002/qj.2415, 2016.
Calhoun, K. M., MacGorman, D. R., Ziegler, C. L., and Biggerstaff, M. I.: Evolution of lightning activity and storm charge relative to dual-Doppler analysis of a high-precipitation supercell storm, Mon. Weather Rev., 141, 2199–2223, https://doi.org/10.1175/MWR-D-12-00258.1, 2013.
Carey, L. D., Murphy, M. J., McCormick, T. L., and Demetriades, N. W. S.: Lightning location relative to storm structure in a leading-line, trailing-stratiform mesoscale convective system, J. Geophys. Res., 110, D03105, https://doi.org/10.1029/2003JD004371, 2005.
Chmielewski, V. C. and Bruning, E. C.: Lightning Mapping Array flash detection performance with variable receiver thresholds, J. Geophys. Res.-Atmos., 121, 8600–8614, https://doi.org/10.1002/2016JD025159, 2016.
Dotzek, N., Rabin, R. M., Carey, L. D., MacGorman, D. R., McCormick, T. L., Demetriades, N. W., Murphy, M. J., and Holle, R. L.: Lightning activity related to satellite and radar observations of a mesoscale convective system over Texas on 7–8 April 2002, Atmos. Res., 76, 127–166, https://doi.org/10.1016/j.atmosres.2004.11.020, 2005.
Ducrocq, V., Nuissier, O., Ricard, D., Lebeaupin, C., and Thouvenin, T.: A numerical study of three catastrophic precipitating events over southern France, II: Mesoscale triggering and stationarity factors, Q. J. Roy. Meteorol. Soc., 134, 131–145, https://doi.org/10.1002/qj.199, 2008.
Ducrocq, V., Belamari, S., Boudevillain, B., Bousquet, O., Cocquerez, P., Doerenbecher, A., Drobinski, P., Flamant, C., Labatut, L., Lambert, D., Nuret, M., Richard, E., Roussot, O., Testor, P., Arbogast, P., Ayral, P.-A., Van Baelen, J., Basdevant, C., Boichard, J.-L., Bourras, D., Bouvier, C., Bouin, M.-N., Bock, O., Braud, I., Champollion, C., Coppola, L., Coquillat, S., Defer, E., Delanoë, J., Delrieu, G., Didon-Lescot, J.-F., Durand, P., Estournel, C., Fourrié, N., Garrouste, O., Giordani, H., Le Coz, J., Michel, Y., Nuissier, O., Roberts, G., Saïd, F., Schwarzenboeck, A., Sellegri, K., Taupier-Letage, I., and Vandervaere, J.-P.: HyMeX, les campagnes de mesures: focus sur les événements extrêmes en Méditerranée (in French), La Météorologie, 37–47, no 80, février, 2013.
Ducrocq, V., Braud, I., Davolio, S., Ferretti, R., Flamant, C., Jansa, A., Kalthoff, N., Richard, E., Taupier-Letage, I., Ayral, P.-A., Belamari, S., Berne, A., Borga, M., Boudevillain, B., Bock, O., Boichard, J.-L., Bouin, M.-N., Bousquet, O., Bouvier, C., Chiggiato, J., Cimini, D., Corsmeier, U., Coppola, L., Cocquerez, P.,Defer, E., Delanoë, J., Di Girolamo, P., Doerenbecher, A., Drobinski, P., Dufournet, Y., Fourrié, N., Gourley, J. J., Labatut, L., Lambert, D., Le Coz, J., Marzano, F. S., Molinié, G., Montani, A., Nord, G., Nuret, M., Ramage, K., Rison, W., Roussot, O., Said, F., Schwarzenboeck, A., Testor, P., Van Baelen, J., Vincendon, B., Aran, M., and Tamayo, J.: HYMEX-SOP1 The Field Campaign Dedicated to Heavy Precipitation and Flash Flooding in the Northwestern Mediterranean, B. Am. Meteorol. Soc., July 2014, 1083–1100, https://doi.org/10.1175/BAMS-D-12-00244.1, 2014.
Duquenne, F., Botton, S., Peyret, F., Betaille, D., and Willis, P.: GPS, Localisation et Navigation par Satellite, 2nd edn., Hermes Sciences, Lavoisier, 2005.
Dye, J. E. and Bansemer, A.: Observations of electrification in deep, precipitating stratiform clouds, Proc. of the 16th Int. Conf. on Atmospheric Electricity, 17–22 June, Nara, Japan, 1–10, 2018.
Dye, J. E. and Bansemer, A.: Electrification in mesoscale updrafts of deep stratiform and anvil clouds in Florida, J. Geophys. Res.-Atmos., 124, 1021–1049, https://doi.org/10.1029/2018JD029130, 2019.
Dye, J. E. and Willett, J. C.: Observed enhancement of reflectivity and electric field in long-lived Florida anvils, Mon. Weather Rev., 135, 3362–3380, https://doi.org/10.1175/MWR3484.1, 2007.
Edens, H. E., Eack, K. B., Eastvedt, E. M., Trueblood, J. J., Winn, W. P., Krehbiel, P. R., Aulich, G. D., Hunyady, S. J., Murray, W. C., Rison, W., Behnke, S. A., and Thomas, R. J.: VHF lightning mapping observations of a triggered lightning flash, Geophys. Res. Lett., 39, L19807, https://doi.org/10.1029/2012GL053666, 2012.
Ely, B. L., Orville, R. E., Carey, L. D., and Hodapp, C. L.: Evolution of the total lightning structure in a leading-line, trailing-stratiform mesoscale convective system over Houston, Texas, J. Geophys. Res., 113, D08114, https://doi.org/10.1029/2007JD008445, 2008.
Emersic, C., Heinselman, P. L., MacGorman, D. R., and Bruning, E. C.: Lightning activity in a hail producing storm observed with phased array radar, Mon. Weather Rev., 139, 1809–1825, https://doi.org/10.1175/2010MWR3574.1, 2011.
Fuchs, B. R., Rutledge, S. A., Bruning, E. C., Pierce, J. R., Kodros, J. K., Lang, T. J., MacGorman, D. R., Krehbiel, P. R., and Rison, W.: Environmental controls on storm intensity and charge structure in multiple regions of the continental United States, J. Geophys. Res.-Atmos., 120, 6575–6596, https://doi.org/10.1002/2015JD023271, 2015.
Giorgi, F.: Climate change hot-spots, Geophys. Res. Lett., 33, L08707, https://doi.org/10.1029/2006GL025734, 2006.
Houze Jr., R. A.: Cloud Dynamics, Academic, San Diego, p. 573, 1993.
Israel, H.: Atmospheric Electricity, Vol. II (translated from German), published by the National Science Foundation, Washington, DC by the Israel Program for Scientific Translations, 1973.
Kasemir, H. W.: Qualitative Ubersicht uber Potential-, Feld- und Ladungsverhaltnisse bei einer Blitzentladung in der Gewitterwolke (Qualitative Survey of the Potential, Field and Charge Conditions during a Lightning discharge in the Thunderstorm Cloud), in: Das Gewitter, Leipzig, edited by: Israel, H., Akademische Verlagsgesellschaft Geest und Portig, Leipzig, 112–125, 1950.
Koshak, W. J., Solakiewicz, R. J., Blakeslee, R. J., Goodman, S. J., Christian, H. J., Hall, J. M., Bailey, J. C., Krider, E. P., Bateman, M. G., Boccippio, D. J., Mach, D. M., McCaul, E. W., Stewart, M. F., Buechler, D. E., Petersen, W. A., and Cecil, D. J.: North Alabama Lightning Mapping Array (LMA): VHF source retrieval algorithm and error analyses, J. Atmos. Ocean. Tech., 21, 543–558, 2004.
Krehbiel, P., Hamlin, T., Zhang, Y., Harlin, J., Thomas, R., and Rison, W.: Three-dimensional total lightning observations with the lightning mapping array, 2002 International Lightning Detection Conference, Tucson, AZ, 16–18 October, 2002.
Kuhlman, K. M., MacGorman, D. R., Biggerstaff, M. I., and Krehbiel, P. R.: Lightning initiation in the anvils of two supercell storms, Geophys. Res. Lett., 36, L07802, https://doi.org/10.1029/2008GL036650, 2009.
Lambert, D. and Argence, S.: Preliminary study of an intense rainfall episode in Corsica, 14 September 2006, Adv. Geosci., 16, 125–129, https://doi.org/10.5194/adgeo-16-125-2008, 2008.
Lang, T., Miller, L. J., Weisman, M., Rutledge, S. A., Barker III, L. J., Bringi, V. N., Chandrasekar, V., Detwiler, A., Doesken, N., Helsdon, J., Knight, C., Krehbiel, P., Lyons, W., MacGorman, D., Rasmussen, E., Rison, W., Rust, W. D., and Thomas, R. J.: The Severe Thunderstorm Electrification and Precipitation Study (STEPS), B. Am. Meteorol. Soc., 85, 1107–1125, 2004.
Lang, T. J., Lyons, W. A., Rutledge, S. A., Meyer, J. D., MacGorman, D. R., and Cummer, S. A.: Transient luminous events above two mesoscale convective systems: Storm structure and evolution, J. Geophys. Res., 115, A00E22, https://doi.org/10.1029/2009JA014500, 2010.
Lang, T. J., Li, J., Lyons, W. A., Cummer, S. A., Rutledge, S. A., and MacGorman, D. R.: Transient luminous events above two mesoscale convective systems: Charge moment change analysis, J. Geophys. Res., 116, A10306, https://doi.org/10.1029/2011JA016758, 2011.
Lang, T. J., Lyons, W. A., Cummer, S. A., Fuchs, B. R., Dolan, B., Rutledge, S. A., Krehbiel, P., Rison, W., Stanley, M., and Ashcraft, T.: Observations of two sprite producing storms in Colorado, J. Geophys. Res.-Atmos., 121, 9675–9695, https://doi.org/10.1002/2016JD025299, 2016.
Luque, M. Y., Bürgesser, R., and Ávila, E.: Thunderstorm graupel charging in the absence of supercooled water droplets, Q. J. Roy. Meteorol. Soc., 142, 2418–2423, https://doi.org/10.1002/qj.2834, 2016.
MacGorman, D. R. and Rust, W. D.: The Electrical Nature of Storms, 422 pp., Oxford Univ. Press, New York, 1998.
MacGorman, D. R., Rust, W. D., Schuur, T. J., Biggerstaff, M. I., Straka, J. M., Ziegler, C. L., Mansell, E. R., Bruning, E. C., Kuhlman, K. M., Lund, N. R., Biermann, N. S., Payne, C., Carey, L. D., Krehbiel, P. R., Rison, W., Eack, K. B., and Beasley, W. H.: TELEX: The Thunderstorm Electrification and Lightning Experiment, B. Am. Meteorol. Soc., 89, 997–1013, https://doi.org/10.1175/2007BAMS2352.1, 2008.
MacGorman, D. R., Elliott, M. S., and DiGangi, E.: Electrical discharges in the overshooting tops of thunderstorms, J. Geophys. Res.-Atmos., 122, 2929–2957, https://doi.org/10.1002/2016JD025933, 2017.
McCaul, E. W., Goodman, S. J., LaCasse, K. M., and Cecil, D. J.: Forecasting lightning threat using cloud-resolving model simulations, Weather Forecast., 24, 709–729, https://doi.org/10.1175/2008WAF2222152.1, 2009.
Marshall, T. C., Rust, W. D., Winn, W. P., and Gilbert, K. E.: Electrical structure in two thunderstorm anvil clouds, J. Geophys. Res., 94, 2171, https://doi.org/10.1029/JD094iD02p02171, 1989.
Mazur, V.: Physical processes during development of lightning flashes, C. R. Physique, 3, 1393–1409, 2002.
Montanyà, J., van der Velde, O., and Williams, E. R.: The start of lightning: Evidence of bidirectional lightning initiation, Sci. Rep., 5, 15180, https://doi.org/10.1038/srep15180, 2015.
Nuissier, O., Joly, B., Ducrocq, V., Joly, A., and Arbogast, P.: A statistical downscaling to identify the large scale circulation patterns associated to heavy precipitation events over southern France, Q. J. Roy. Meteorol. Soc., 137, 1812–1827, https://doi.org/10.1002/qj.866, 2011.
Pinty, J.-P., Barthe, C., Defer, E., Richard, E., and Chong, M.: Explicit simulation of electrified clouds: From idealized to real case studies, Atmos. Res., 123, 82–92, https://doi.org/10.1016/j.atmosres.2012.04.008, 2013.
Ribaud, J.-F., Bousquet, O., and Coquillat, S.: Relationships between total lightning activity, microphysics and kinematics during the 24 September 2012 HyMeX bow-echo system, Q. J. Roy. Meteorol. Soc., 142, 298–309, https://doi.org/10.1002/qj.2756, 2016.
Saunders, C. P. R.: Charge separation mechanisms in clouds, Space Sci. Rev., 137, 335–353, https://doi.org/10.1007/s11214-008-9345-0, 2008.
Scheffknecht, P., Richard, E., and Lambert, D.: A highly localized high-precipitation event over Corsica, Q. J. Roy. Meteorol. Soc., 142, 206–221, https://doi.org/10.1002/qj.2795, 2016.
Scheffknecht, P., Richard, E., and Lambert, D.: Climatology of heavy precipitation over Corsica in the period 1985–2015, Q. J. Roy. Meteorol. Soc., 143, 2987–2998, https://doi.org/10.1002/qj.3140, 2017.
Soula, S., Defer, E., Füllekrug, M., van der Velde, O., Montanya, J., Bousquet, O., Mlynarczyk, J., Coquillat, S., Pinty, J.-P., Rison, W., Krehbiel, P. R., Thomas, R., and Pédeboy, S.: Time and space correlation between sprites and their parent lightning flashes for a thunderstorm observed during the HyMeX campaign, J. Geophys. Res.-Atmos., 120, 11552–11574, https://doi.org/10.1002/2015JD023894, 2015.
Stolzenburg, M. and Marshall, T. C.: Charge structure and dynamics in thunderstorms, Space Sci. Rev., 137, 355–372, https://doi.org/10.1007/s11214-008-9338-z, 2008.
Stolzenburg, M., Rust, W. D., Smull, B. F., and Marshall, T. C.: Electrical structure in thunderstorms convective regions: 1. Mesoscale convective systems, J. Geophys. Res., 103, 14059–14078, 1998.
Tessendorf, S. A., Rutledge, S. A., and Wiens, K. C.: Radar and Lightning Observations of Normal and Inverted Polarity Multicellular Storms from STEPS, Mon. Weather Rev., 135, 3682–3706, 2007.
Thomas, R. J., Krehbiel, P. R., Rison, W., Harlin, J., Hamlin, T., and Campbell, N.: The LMA flash algorithm, Proceedings of the 12th International Conference on Atmospheric Electricity, 489–492, Versailles, 9–12 June, 2003.
Thomas, R. J., Krehbiel, P. R., Rison, W., Hunyady, S. J., Winn, W. P., Hamlin, T., and Harlin, J.: Accuracy of the Lightning Mapping Array, J. Geophys. Res., 109, D14207, https://doi.org/10.1029/2004JD004549, 2004.
Tidiga, M., Coquillat, S., Ricard, D., Defer, E., De Guibert, P., Lambert, D., Pinty, J.-P., Pont, V., and Prieur, S.: Daytime convection in Corsica in absence of synoptic forcing: fine-scale analysis of the relief and coastal breezes influence using lightning observation (SAETTA) and high-resolution numerical simulation (Meso-NH), 11th HyMeX Workshop, 29 May–2 June, Lecce, Italie, 2018.
Ushio, T., Heckman, S. J., Christian, H. J., and Kawasaki, Z. I.: Vertical development of lightning activity observed by the LDAR system: Lightning bubbles, J. Appl. Meteor., 42, 165–174, 2003.
van der Velde, O. A. and Montanyà, J.: Asymmetries in bidirectional leader development of lightning flashes, J. Geophys. Res.-Atmos., 118, 1–16, https://doi.org/10.1002/2013JD020257, 2013.
van der Velde, O. A., Montanyà, J., Soula, S., Pineda, N., and Mlynarczyk, J.: Bidirectional leader development in sprite-producing positive cloud-to-ground flashes: Origins and characteristics of positive and negative leaders, J. Geophys. Res.-Atmos., 119, 12755–12779, https://doi.org/10.1002/2013JD021291, 2014.
Weiss, S., MacGorman, D. R., and Calhoun, K. M.: Lightning in the Anvils of Supercell Thunderstorms, Mon. Weather Rev., 40, 2064–2079, https://doi.org/10.1175/MWR-D-11-00312.1, 2012.
Wiens, K. C., Rutledge, S. A., and Tessendorf, S. A.: The 29 June 2000 Supercell Observed during STEPS. Part II: Lightning and Charge Structure, J. Atmos. Sci., 62, 4151–4177, 2005.
- Abstract
- Introduction
- The SAETTA network
- Overall observation from 2014 to 2016
- Specific event report: high-altitude discharges
- Conclusion and perspectives
- Data availability
- Appendix A: Geometric capability of VHF source detection by SAETTA
- Appendix B: XLMA flash algorithm options
- Author contributions
- Competing interests
- Special issue statement
- Acknowledgements
- Financial support
- Review statement
- References