the Creative Commons Attribution 4.0 License.
the Creative Commons Attribution 4.0 License.
 | 30 Jan 2019
Technical note: Absorption aerosol optical depth components from AERONET observations of mixed dust plumes
Sung-Kyun Shin
Matthias Tesche
Youngmin Noh
Absorption aerosol optical depth (AAOD) as obtained from sun–sky photometer measurements provides a measure of the light-absorbing properties of the columnar aerosol loading. However, it is not an unambiguous aerosol-type-specific parameter, particularly if several types of absorbing aerosols, for instance black carbon (BC) and mineral dust, are present in a mixed aerosol plume. The contribution of mineral dust to total aerosol light absorption is particularly important at UV wavelengths. In this study we refine a lidar-based technique applied to the separation of dust and non-dust aerosol types for the use with Aerosol Robotic Network (AERONET) direct sun and inversion products. We extend the methodology to retrieve AAOD related to non-dust aerosol (AAODnd) and BC (AAODBC). We test the method at selected AERONET sites that are frequently affected by aerosol plumes that contain a mixture of Saharan or Asian mineral dust and biomass-burning smoke or anthropogenic pollution, respectively. We find that aerosol optical depth (AOD) related to mineral dust as obtained with our methodology is frequently smaller than coarse-mode AOD. This suggests that the latter is not an ideal proxy for estimating the contribution of mineral dust to mixed dust plumes. We present the results of the AAODBC retrieval for the selected AERONET sites and compare them to coincident values provided in the Copernicus Atmosphere Monitoring System aerosol reanalysis. We find that modelled and AERONET AAODBC are most consistent for Asian sites or at Saharan sites with strong local anthropogenic sources.


Atmospheric aerosols have a strong impact on the Earth's radiation budget and climate (Stocker et al., 2013). The main interactions between atmospheric particles and the climate system are through scattering and absorption of radiation (direct effect) and through modification of the microphysical properties of clouds (indirect effect). Estimates of the aerosol radiative forcing, i.e. of the perturbation of radiant fluxes by aerosol particles, require information on aerosol loading as well as on aerosol's optical and microphysical properties (Bellouin et al., 2013). Aerosol optical depth (AOD) is the height integral of the aerosol extinction coefficient. It provides a measure of the columnar aerosol loading and is routinely obtained from ground-based and spaceborne remote-sensing observations. Despite the unprecedented global coverage of atmospheric aerosol information, it is still challenging to assess the aerosol radiative effect accurately. Not only are the sources of aerosols, their lifetime, and the processes that affect their optical and microphysical characteristics highly inhomogeneous in space and time (Stocker et al., 2013), but aerosol particles from different natural and anthropogenic sources also often mix with each other and undergo aging processes, which reflects in the optical and microphysical properties of the bulk aerosol. Better estimates of the aerosol radiative forcing require an improved consideration of the properties and contributions of the different aerosol types in mixed aerosol plumes.
Remote sensing measurements are an important way to obtain insight into optical and microphysical aerosol properties. For instance, ground-based AErosol RObotic NETwork (AERONET, Holben et al., 1998, 2001) sun–sky radiometers provide long-term observations of aerosol products including spectral AOD, particle size distribution, and complex refractive index for the atmospheric column even at remote locations. AERONET also provides absorption aerosol optical depth (AAOD), which is a measure of the column aerosol loading of light-absorbing particles such as black carbon (BC), carbonaceous aerosols, or mineral dust. However, AAOD becomes ambiguous if several types of absorbing aerosols are present in a mixed aerosol plume.
In dust-free conditions, BC as emitted from incomplete combustion involved in anthropogenic activities or biomass burning is generally considered the main light absorber among atmospheric aerosols (Bond and Bergstrom, 2006; Bond et al., 2013; Russell et al., 2010) and thus the main contributor to non-dust AAOD. The term BC refers to carbon particles with the morphological and chemical properties typical of soot particles from combustion including a black, blackish, or brown substance formed by combustion (Andreae and Gelencsér, 2006). We point out that the contribution of brown carbon (BrC) to aerosol absorption can also be significant. However, we opt for a single absorbing aerosol component as it allows us to present the general idea of our new methodology in a straightforward manner.
Schuster et al. (2005) inferred columnar BC concentrations based on the Maxwell Garnett effective medium approximation with AERONET-retrieved complex refractive indices. Koven and Fung (2006) separated the absorption properties of BC from the absorption of dust by exploiting the spectral absorption properties that can be inferred from the AERONET inversion. Russell et al. (2010) utilized AERONET-retrieved single-scattering albedo (SSA or ω), AAOD, and absorption Ångström exponent (AAE) as indicators to classify observations with respect to the contributions of BC, organic matter (OM), and mineral dust to the absorbing aerosol fraction.
Passive remote-sensing techniques can only provide the properties of the total aerosol mixture. Determining the optical properties of a certain aerosol type in a mixed aerosol plume requires additional information. For instance, the Ångström exponent (AE or å; Ångström, 1964) as inferred from spectral AOD measurements gives qualitative information on aerosol size that can be used for aerosol-type classification; values greater than 2 indicate small particles such as biomass-burning smoke, while values smaller than 1 indicate large particles like sea salt and mineral dust. Schuster et al. (2006) found that the variation of the Ångström exponent is associated with bimodal aerosol size distributions. The authors focused on the fine or coarse fraction of aerosols. More detailed and quantitative information can be obtained from active aerosol remote sensing with lidar. In particular, the particle linear depolarization ratio (PLDR or δ) is an intensive parameter that is very sensitive to particle shape. It can be used to obtain the contribution of dust and non-dust particles to the optical properties of a mixed aerosol plume under the assumption that this plume consists of only those two aerosol types in an external mixture (Shimizu et al., 2004; Tesche et al., 2009b). Burton et al. (2014) developed a generalized version of the methodology to separate contributions to mixtures of two aerosol types, while Mamouri and Ansmann (2014) further refined it to also separate between the contribution of fine and coarse dust particles.
In this study, we use AERONET version 3 level 2.0 products to refine the lidar-based aerosol-type separation methodology to resolve the contributions of dust and non-dust aerosol to the total and absorbing fractions of AOD. This is most useful over and downwind of deserts where mineral dust can contribute significantly to AAOD – particularly at short wavelengths. We also propose a method to obtain the fraction of BC-related absorption to the non-dust AAOD. We describe our methodology in Sect. 2. In Sect. 3, we present and discuss our results. We summarize our findings and provide concluding remarks in Sect. 4.
2.1 AERONET sun–sky radiometer observations
AERONET (https://aeronet.gsfc.nasa.gov, last access: 17 January 2019, Holben et al., 1998, 2001) operates automatic sun–sky radiometers for direct sun–sky radiation observation at sites all over the globe. AERONET instruments measure AOD at wavelengths from 340 to 1640 nm, always including observations at 440, 670, 870, and 1020 nm. The AOD uncertainty is estimated as 0.01 to 0.02 depending on wavelength in the absence of cloud contamination. The calibrated sky radiance measurements typically have uncertainties below 5 %. The Ångström exponent and the fine-mode fraction (FMF; O'Neill et al., 2003) are obtained from the spectral AOD measurements. The level 2.0 product available from the AERONET portal includes inversion results for measurements with a 440 nm AOD larger than 0.4 (Dubovik et al., 2006). The AERONET inversion uses direct-sun and sky-radiance measurements at 440, 675, 870, and 1020 nm to infer columnar particle properties such as the volume size distribution, the complex refractive index, and the SSA. The uncertainty in SSA is expected to be of the order of 0.03 (Dubovik et al., 2000). Knowledge of SSA is used to determine the fraction of AOD related to light absorption, referred to as absorption aerosol optical depth, as
Detailed descriptions of the instrumentation, calibration, methodology, data processing, and data quality assurance are provided in Holben et al. (1998, 2001), Dubovik et al. (2002, 2006), Eck et al. (2005), and Giles et al. (2018). The recently released version 3 of the AERONET aerosol retrieval added spectral PLDRs and lidar ratios (S) to the list of inversion products. The representativeness of these values for pure mineral dust conditions has recently been discussed by Shin et al. (2018). Noh et al. (2017) investigated the reliability of the PLDR retrieved from AERONET sun–sky radiometer observations and found the strongest correlation between the 1020 nm PLDR inferred from AERONET data and the 532 nm PLDR from lidar observations. In this contribution we use AERONET version 3 level 2.0 inversion products inferred from observations of mineral dust downwind of the Saharan and Asian deserts.
2.2 AOD and AAOD components in mixed dust plumes
In order to retrieve the AOD and AAOD for non-dust aerosols in mixed dust plumes, the optical properties of the mixture need to be separated according to the contributions of dust and non-dust particles, respectively. This is possible by using lidar measurements of the PLDR δ, which depends mainly on the shape of the particles and their size with respect to the measurement wavelength. The PLDR is zero for spheres and increases with an increasing particle non-sphericity. Tesche et al. (2009b) presented a method to separate mixtures of Saharan dust and biomass burning particles while Shimizu et al. (2004) retrieved the contribution of dust and non-dust particles in plumes of Asian dust mixed with spherical particles. Noh (2014) expanded these methods to retrieve the fractional contribution of the different aerosol types in the mixture to the bulk measurements of SSA as well as the SSA for dust (ωd) and non-dust (ωnd) particles.
While δ is measured directly with lidar, it can also be computed from AERONET data and has been included as a standard product in version 3 of the AERONET retrieval. For an external aerosol mixture, this parameter is used to calculate the contribution of dust (Rd) and non-dust (Rnd) to the particle backscatter coefficient following Shimizu et al. (2004) and Tesche et al. (2009b) as
and
Here, δd and δnd indicate δ of dust and non-dust particles, respectively. Their values can be determined from lidar measurements (Burton et al., 2014; Freudenthaler et al., 2009) or from AERONET observations representative for pure mineral dust (Shin et al., 2018). At the standard lidar wavelength of 532 nm, typical values are δd=0.31 and δnd=0.02 (Freudenthaler et al., 2009; Burton et al., 2014). Shin et al. (2018) recently discussed AERONET-derived δd for mineral dust from different source regions. The authors conclude that in general, values of δ at 870 and 1020 nm from the AERONET version 3 inversion product seem to be most reliable. Their finding is based on values found in literature that reports on lidar observations of mineral dust. We consequently apply the aerosol-type separation procedure to AERONET measurements at 1020 nm. We used values of δd=0.30 (δd=0.31) for mixed Asian (Saharan) dust plumes (Shin et al., 2018) and δnd=0.02. The latter value has been obtained from the analysis of δ derived at AERONET stations dominated by biomass-burning aerosols, analogous to the dust-focused study of Shin et al. (2018). When δ was lower than δnd or higher than δd, Rd was set to 0 or 1, respectively.
The ratios Rd and Rnd obtained from using δ refer to the lidar measurements in the backscatter direction (i.e. the scattering angle of 180∘) and allow for inferring the dust-related backscatter coefficient βd as
This approach needs to be refined so that it can be also applied to sun–sky photometer measurements which provide information on total light extinction; i.e. AOD is the height integral of the extinction coefficient α, rather than the backscatter coefficient. For a single aerosol layer of depth h, it can be expressed as AOD =αh. The extinction coefficient is connected to β through the lidar ratio . Consequently, dust AOD can be expressed as
The use of Eq. (5) for the total aerosol and the dust fraction together with Eq. (4) leads to the dust and non-dust AOD as
and
AOD and S are the total AOD and lidar ratio of the aerosol mixture as provided by AERONET, respectively. The Sd is the AERONET-derived lidar ratio of pure dust particles. The lidar ratio varies according to the desert source and can cover a wide range even for pure dust. We take the mean values of 44 and 54 sr for Asian and Saharan dust, respectively, from the AERONET-based study of Shin et al. (2018). As before, values at 1020 nm are used in the calculation.
To convert the 1020 nm AOD to other wavelengths λ, we use the Ångström exponent åd=0.06 for pure Saharan dust (Tesche et al., 2009a). We obtain
and
The contributions of dust and non-dust aerosols to the total AOD can now be described by the extinction-related dust ratio χ as
and
This means that the contribution of mineral dust to the extinction coefficient decreases (increases) with respect to the contribution to the backscatter coefficient (i.e. to Rd) if the second aerosol type in the mixture has a lidar ratio larger (smaller) than that of mineral dust. Mixtures with absorbing aerosols will show total lidar ratios larger than that of pure dust, which means that in the cases considered here, χd is generally smaller than Rd. The total SSA of the mixed dust and pollution plume that is provided by individual AERONET measurements can be calculated according to the following mixing rule:
Rearranging Eq. (12) gives the SSA related to non-dust particles:
The spectral SSA for pure dust particles is taken from the literature (see Table 1). The non-dust fraction to AAOD can now be derived as
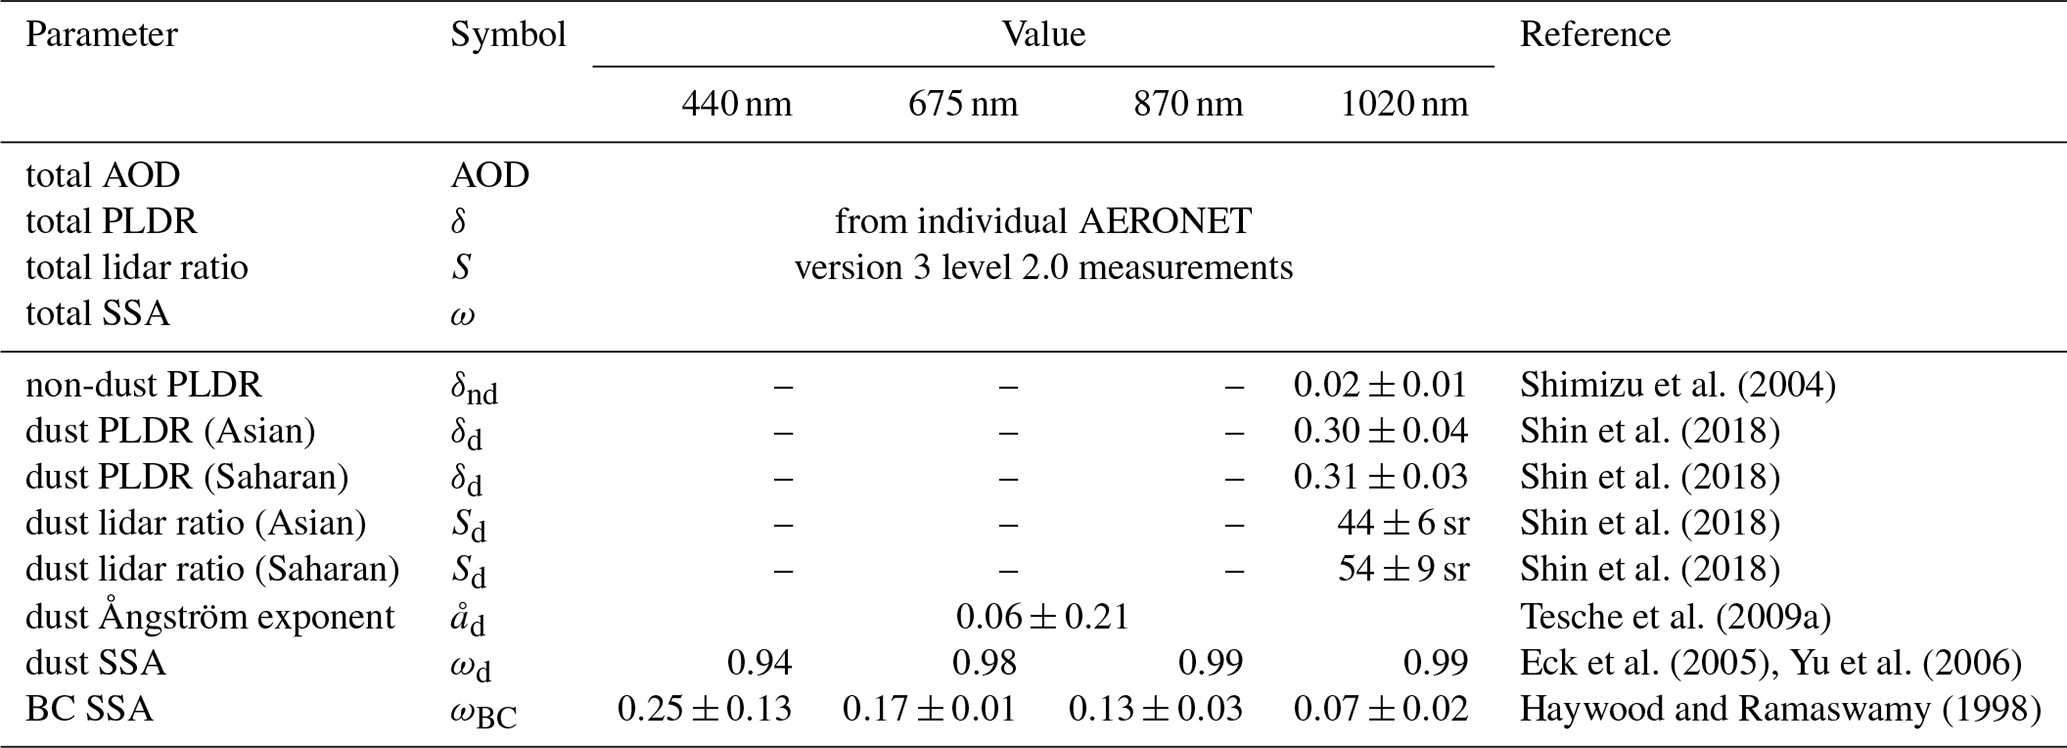
Table 1List of input parameters used for the retrieval of AAODnd and AAODBC in this study. Values of δ at 1020 nm are used for the separation of optical properties of dust and non-dust particles. The dust-related Ångström exponent is needed to transform findings at 1020 nm to other wavelengths. The values of ωd and ωBC are used to retrieve AAODnd and AAODBC, respectively.
We can assume that the light-absorbing features of the non-dust part of the aerosol plume are caused primarily by BC. It has been shown that BC is not an ideal light absorber, i.e. , (Bond and Bergstrom, 2006; Bond et al., 2013). Thus, we need to account for the SSA of BC to obtain the BC-related AAOD as
Bond and Bergstrom (2006) reported on single-scattering albedos of 0.10 to 0.28 for fresh BC. Similar values for fresh BC have also been reported by Khalizov et al. (2009) and Cross et al. (2010). Here, we use values of ωBC, λ from Haywood and Ramaswamy (1998). These values are provided together with the other input parameters in Table 1.
2.3 Connection between AAOD, AAODnd, and AAODBC
Inserting Eq. (12) into Eq. (1) leads to the equation for the AAOD (of dusty mixtures) that accounts for the contribution of the different components as
The connection between total and non-dust AAOD for non-dust components with different values of ωnd between 0.90 and 0.96, an ωd of 0.98, and a total AOD of unity is presented in Fig. 1. In the case of χd=1, all absorption is caused by mineral dust. As the contribution of dust to the mixture decreases, the overall AAOD increases as a result of the stronger absorption of the non-dust particles. The ratio between AAODnd and total AAOD in Fig. 1 changes linearly with χd in case of equal values of ωnd and ωd. The relation becomes increasingly non-linear with increasing difference in the absorbing properties of the dust and non-dust particles. This means that total AAOD as provided by AERONET for dusty mixtures is likely to represent the non-dust component at larger wavelengths, where dust is less absorbing, while its interpretation is less ambiguous at shorter wavelengths.
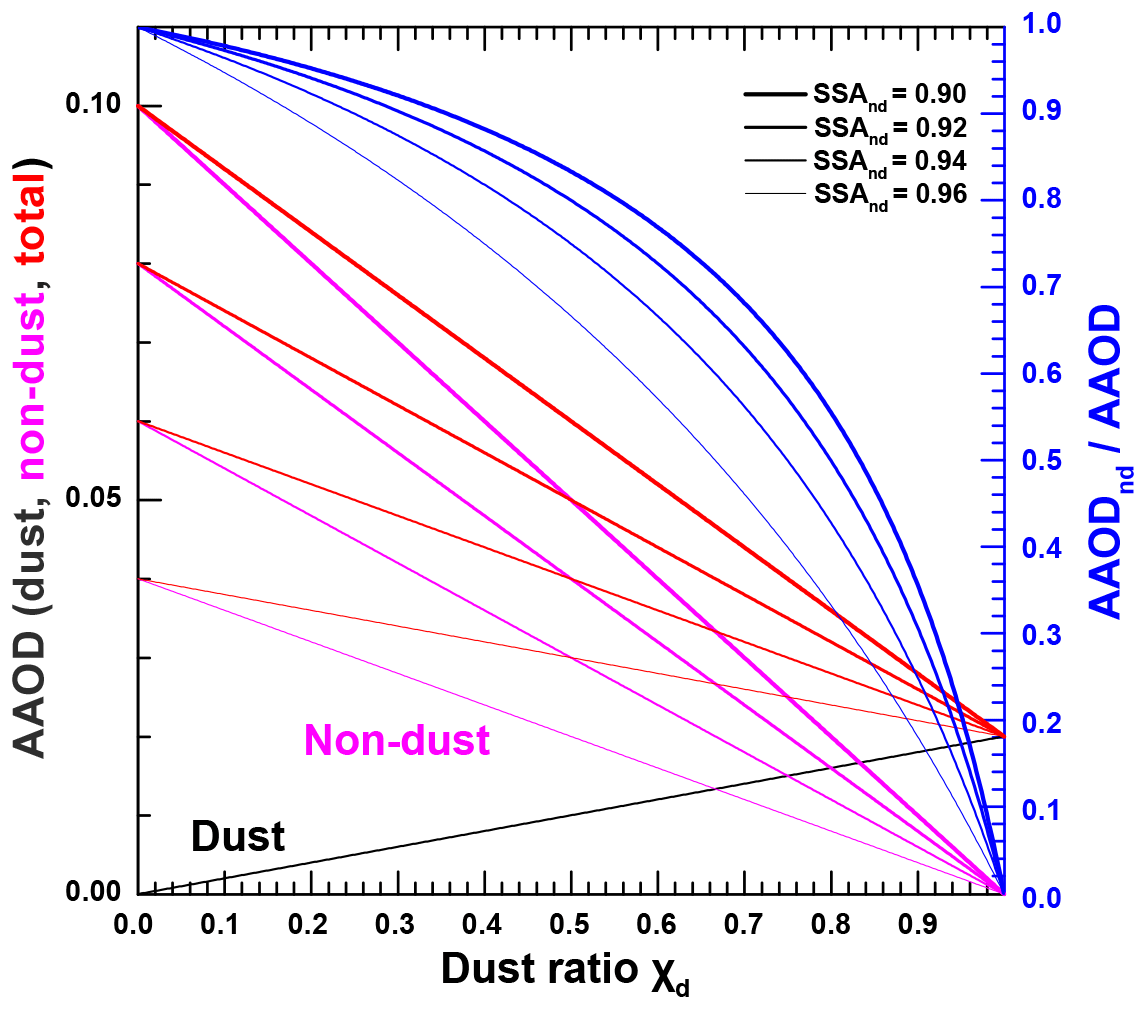
Figure 1Change in AAOD (red), AAODd (black), and AAODnd (magenta) with dust ratio χd for an aerosol mixture of dust (ωd=0.98) and non-dust () and an AOD of unity. The blue lines mark the contribution of non-dust aerosol to AAOD for different values of ωnd.
The approach described above assumes that BC is the major absorber in mixtures of non-dust aerosols. Because ωBC is not zero, it is obvious from Eq. (15) that AAODBC is always smaller than AAOD and vanishes as AAODnd disappears, i.e. for χd=1.
2.4 CAMS aerosol reanalysis
We use the European Centre for Medium-Range Weather Forecasts (ECMWF) Copernicus Atmosphere Monitoring Service (CAMS) aerosol reanalysis data (Inness et al., 2013) to assess the results of the AAODBC retrieval methodology. The CAMS reanalysis assimilates satellite data into a data assimilation system and global model to correct for model departures from observational data (Bellouin et al., 2013; Inness et al., 2013). The reanalysis data provide not only total AOD at 469, 550, 670, 865, and 1240 nm but also the AOD of five aerosol species at 550 nm: mineral dust, sea salt, sulfate, BC, and OM. Mineral dust and sea salt are separated into three different size classes each, and BC and OM are distinguishable according to their hydrophilic and hydrophobic properties (Bellouin et al., 2013).
3.1 AERONET statistics
For this study, we selected AERONET sites downwind of the major dust sources in Africa and Asia. We will refer to the two regions as Saharan and Asian for the remainder of this work. Details on the stations are provided in Table 2. An overview of the mean AOD and PLDR at 1020 nm as well as the FMF for the two regions are provided in the histograms in Fig. 2 and in Table 2. While both regions show comparably similar features in the histograms of AOD (with larger mean values for Saharan stations), there is a clear difference in the distribution and mean values of PLDRs: Saharan stations most of the time show values above 0.25, while values below 0.15 form the majority of observations at Asian stations. The latter also show a considerable number of cases (30 %) with δ1020<0.02, for which we assume that dust is completely absent. The distribution of δ1020 is directly related to the contribution of mineral dust at the respective sites, which is also reflected in the FMF. Most observations at Saharan sites show FMF <0.2 with highest values of 0.4, while the observations at Asian sites show a broad distribution across all possible values, with peaks at 0.3 and 0.5. Overall, the two regions allow for assessing the methodology proposed here in situations dominated by mineral dust (Saharan) as well as in dusty mixtures with a broad range of dust–non-dust mixing ratios (Saharan and Asian).
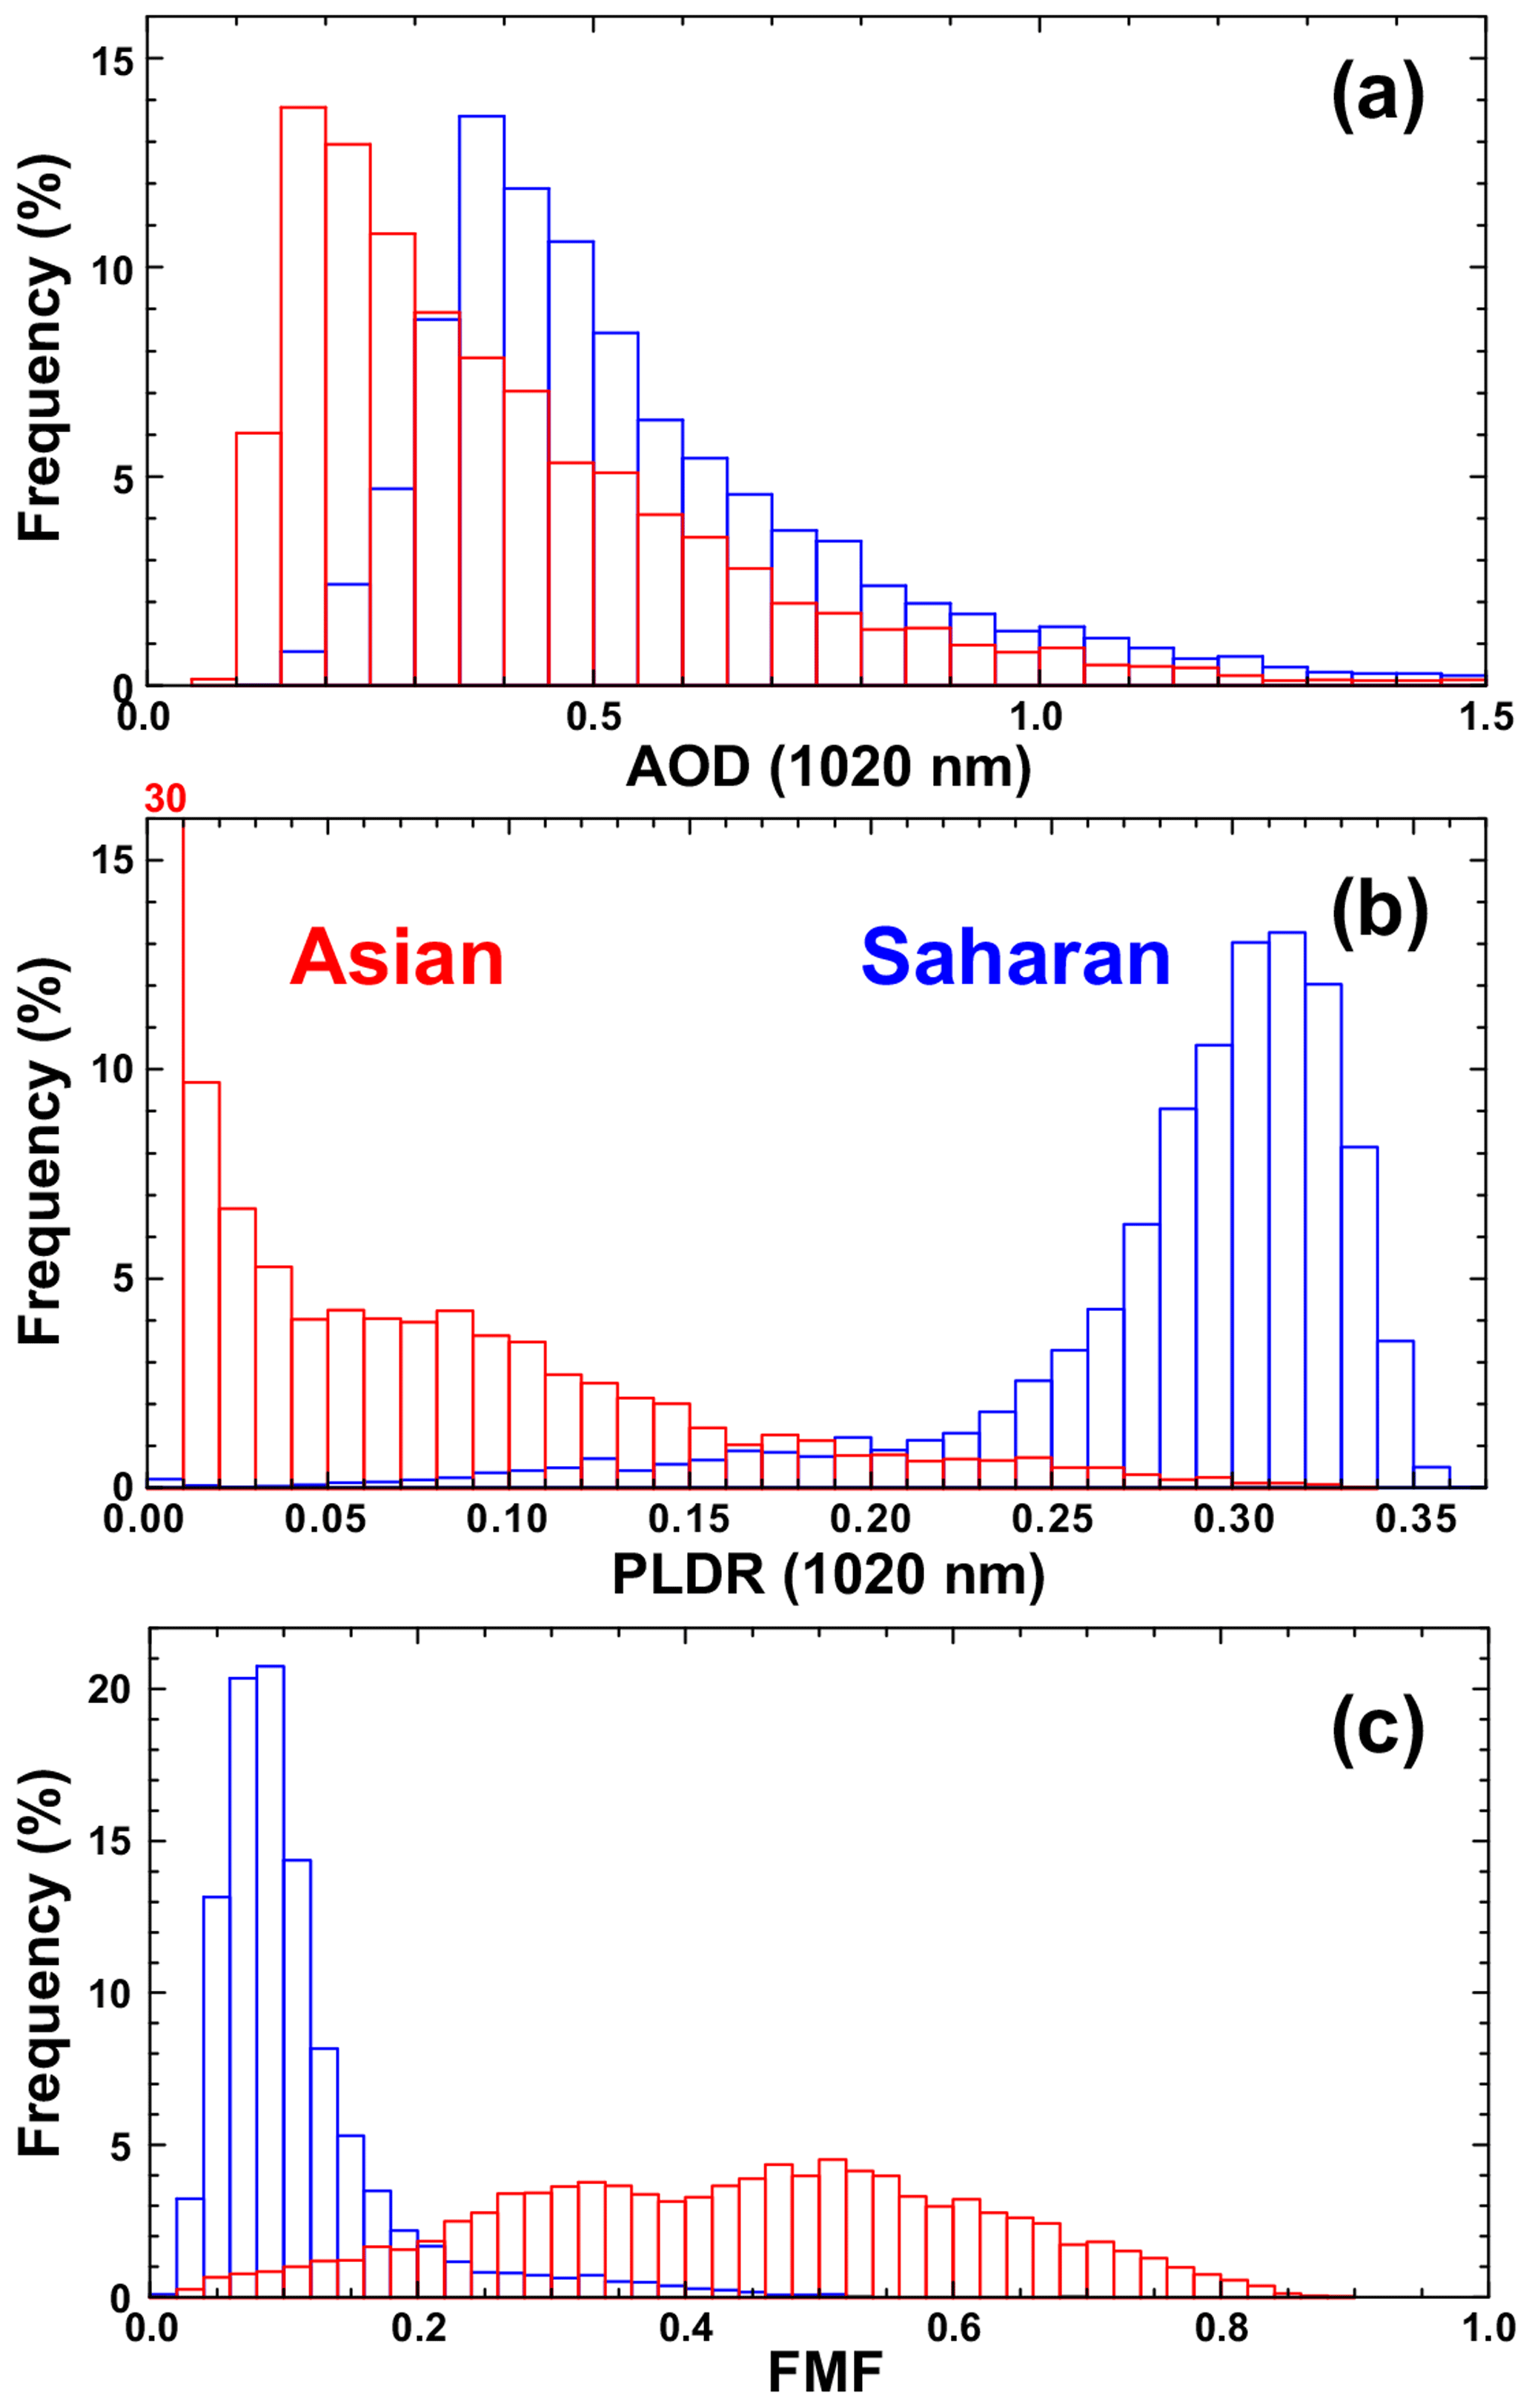
Figure 2Histograms of the 1020 nm AOD (a), 1020 nm PLDR (b), and FMF (c) for the considered AERONET stations affected by Saharan (blue) and Asian dust (red). The coloured number provides the value for the bar that exceeds the scale. Details on the considered AERONET stations and mean values are provided in Table 2.
Table 2Overview of the AERONET sites included in this study in terms of location, length of time series, and number of available version 3 level 2.0 data points. The last three columns refer to mean values and standard deviation of AOD1020, δ1020, and FMF for the respective sites and regions. The figures in this work refer to the combined Asian and Saharan data sets.

Figure 3 shows the effect of the different dust contributions in the histograms of extinction and absorption Ångström exponents for the two regions. An absorption Ångström exponent close to unity is the theoretical value for black carbon (Bergstrom, 1973; Bohren and Huffman, 1983), while higher values of 1.5 have been associated with biomass burning, and those exceeding 2.0 represent an increasing contribution of mineral dust (Bond et al., 2013). Due to the dominance of mineral dust, Saharan observations show a weak spectral dependence of AOD, while a broad range of values between 1 and 4 is found for the absorbing Ångström exponent (see Fig. 3b). Similar values between 1.5 and 3.5 have been reported by Russell et al. (2010) for Arabian and Saharan dust. The large absorbing Ångström exponents result from the strong spectral dependence of the absorbing properties of mineral dust (Müller et al., 2009; Petzold et al., 2009). This effect is also reflected in the spectral variation of the single-scattering albedo (not shown). The observations at Asian sites show a higher extinction Ångström exponent that peaks at 1.0 to 1.25 and a lower absorption Ångström exponent with a maximum between 1.0 and 1.5. Consequently, this leads to a less-pronounced spectral dependence of the single-scattering albedo (not shown). Figure 3 confirms the first impression provided by Fig. 2 regarding the different contributions of mineral dust to the total AOD in the two regions.
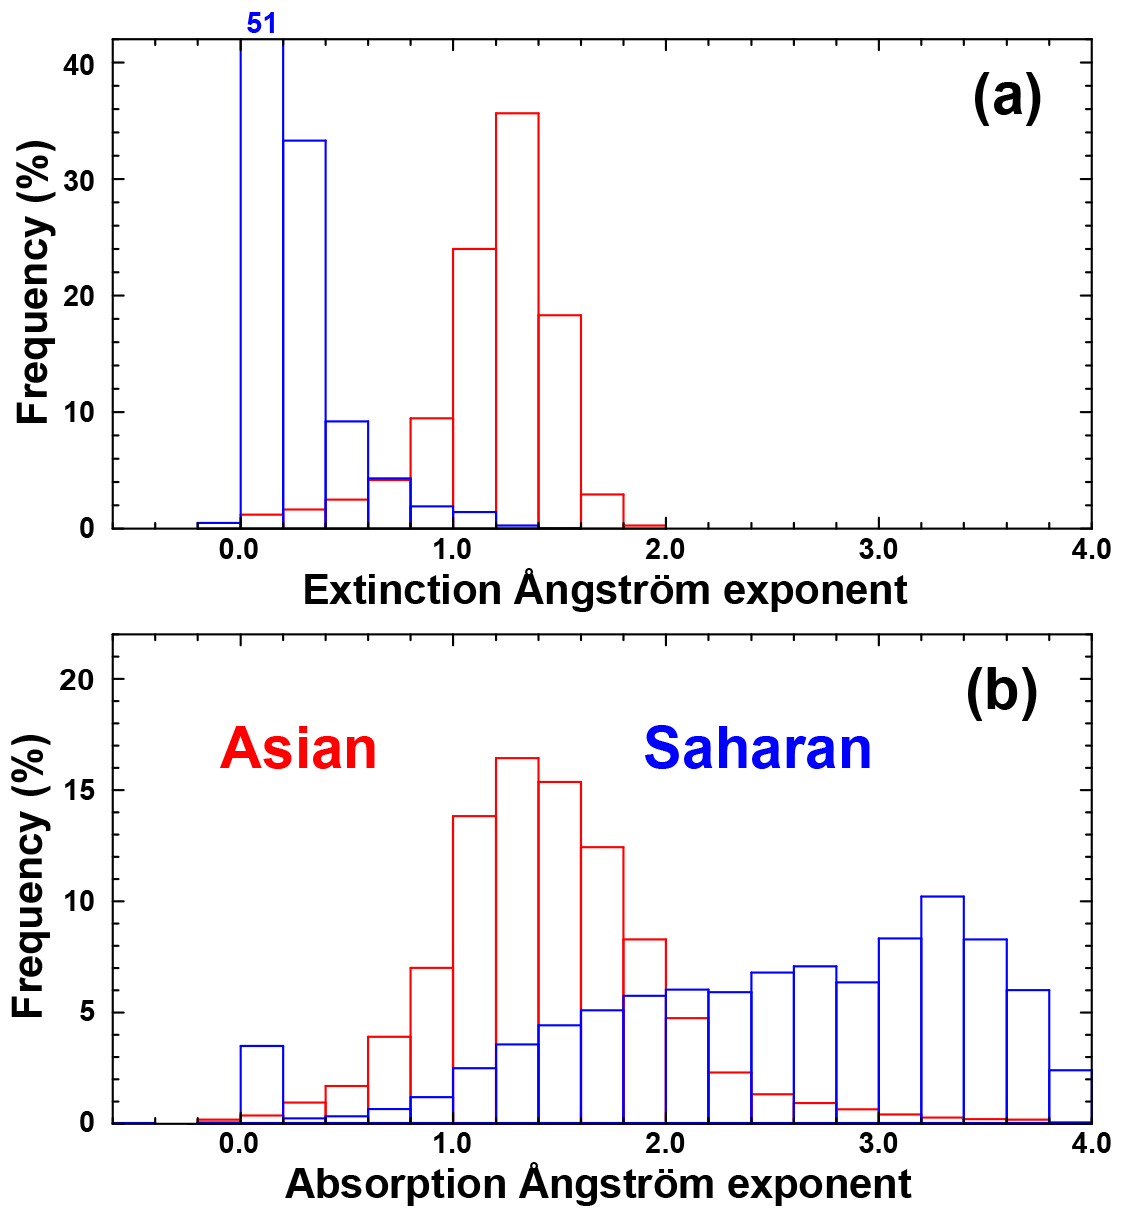
Figure 3Histograms of the 440–870 nm extinction (a) and absorption (b) Ångström exponents for the considered AERONET stations affected by Saharan (blue) and Asian dust (red). The coloured number provides the value for the bar that exceeds the scale. Details on the considered AERONET stations are presented in Table 2.
The dust ratio χd as derived using Eq. (10) for the observations in the two regions is presented in Fig. 4. The general shape of the histograms of χd resembles that of δ1020 in Fig. 2b. The crucial difference is that PLDR marks a proxy of the contribution of mineral dust to the lidar measurement of the backscatter coefficient, while χd quantifies the contribution of mineral dust to the AERONET sun–sky photometer measurement of columnar AOD. The large occurrence rate of χd of zero and unity refers to observations of δ1020 below and above the thresholds for non-dust and dust particles, respectively. Figure 4 reveals an occurrence rate of 47 % and 4 % for pure dust conditions for Saharan and Asian sites, respectively, when considering cases with χd>0.9 as pure dust. It also shows that situations with dust contributions below 50 % are rare for the Saharan stations, while they are most common for the Asian sites. This suggests that the selected data set includes a wide spread of situations for testing the methodology proposed here.
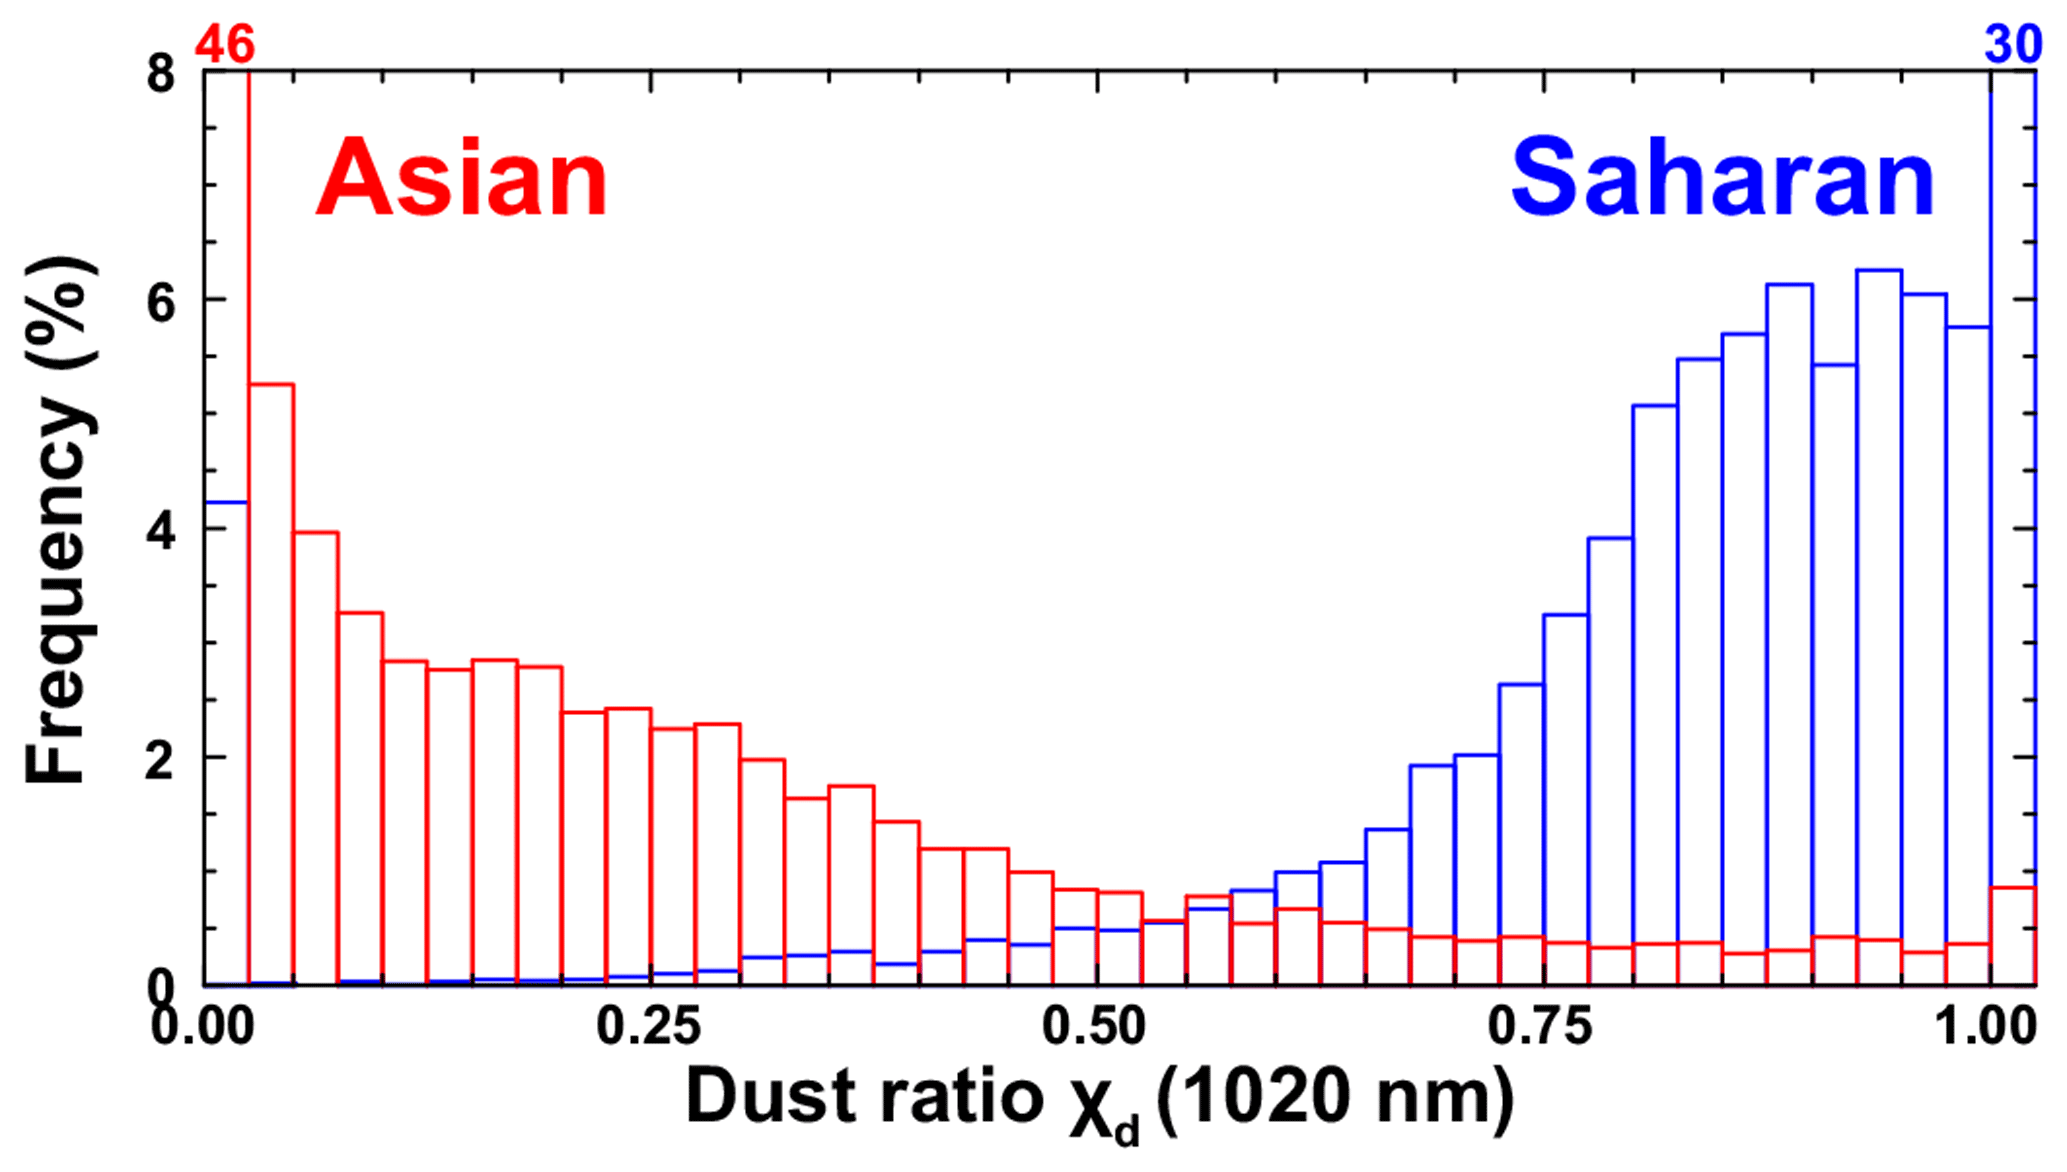
Figure 4Histograms of χd for the considered AERONET stations affected by Saharan (blue) and Asian dust (red). The coloured numbers provide the values for bars that exceed the scale.
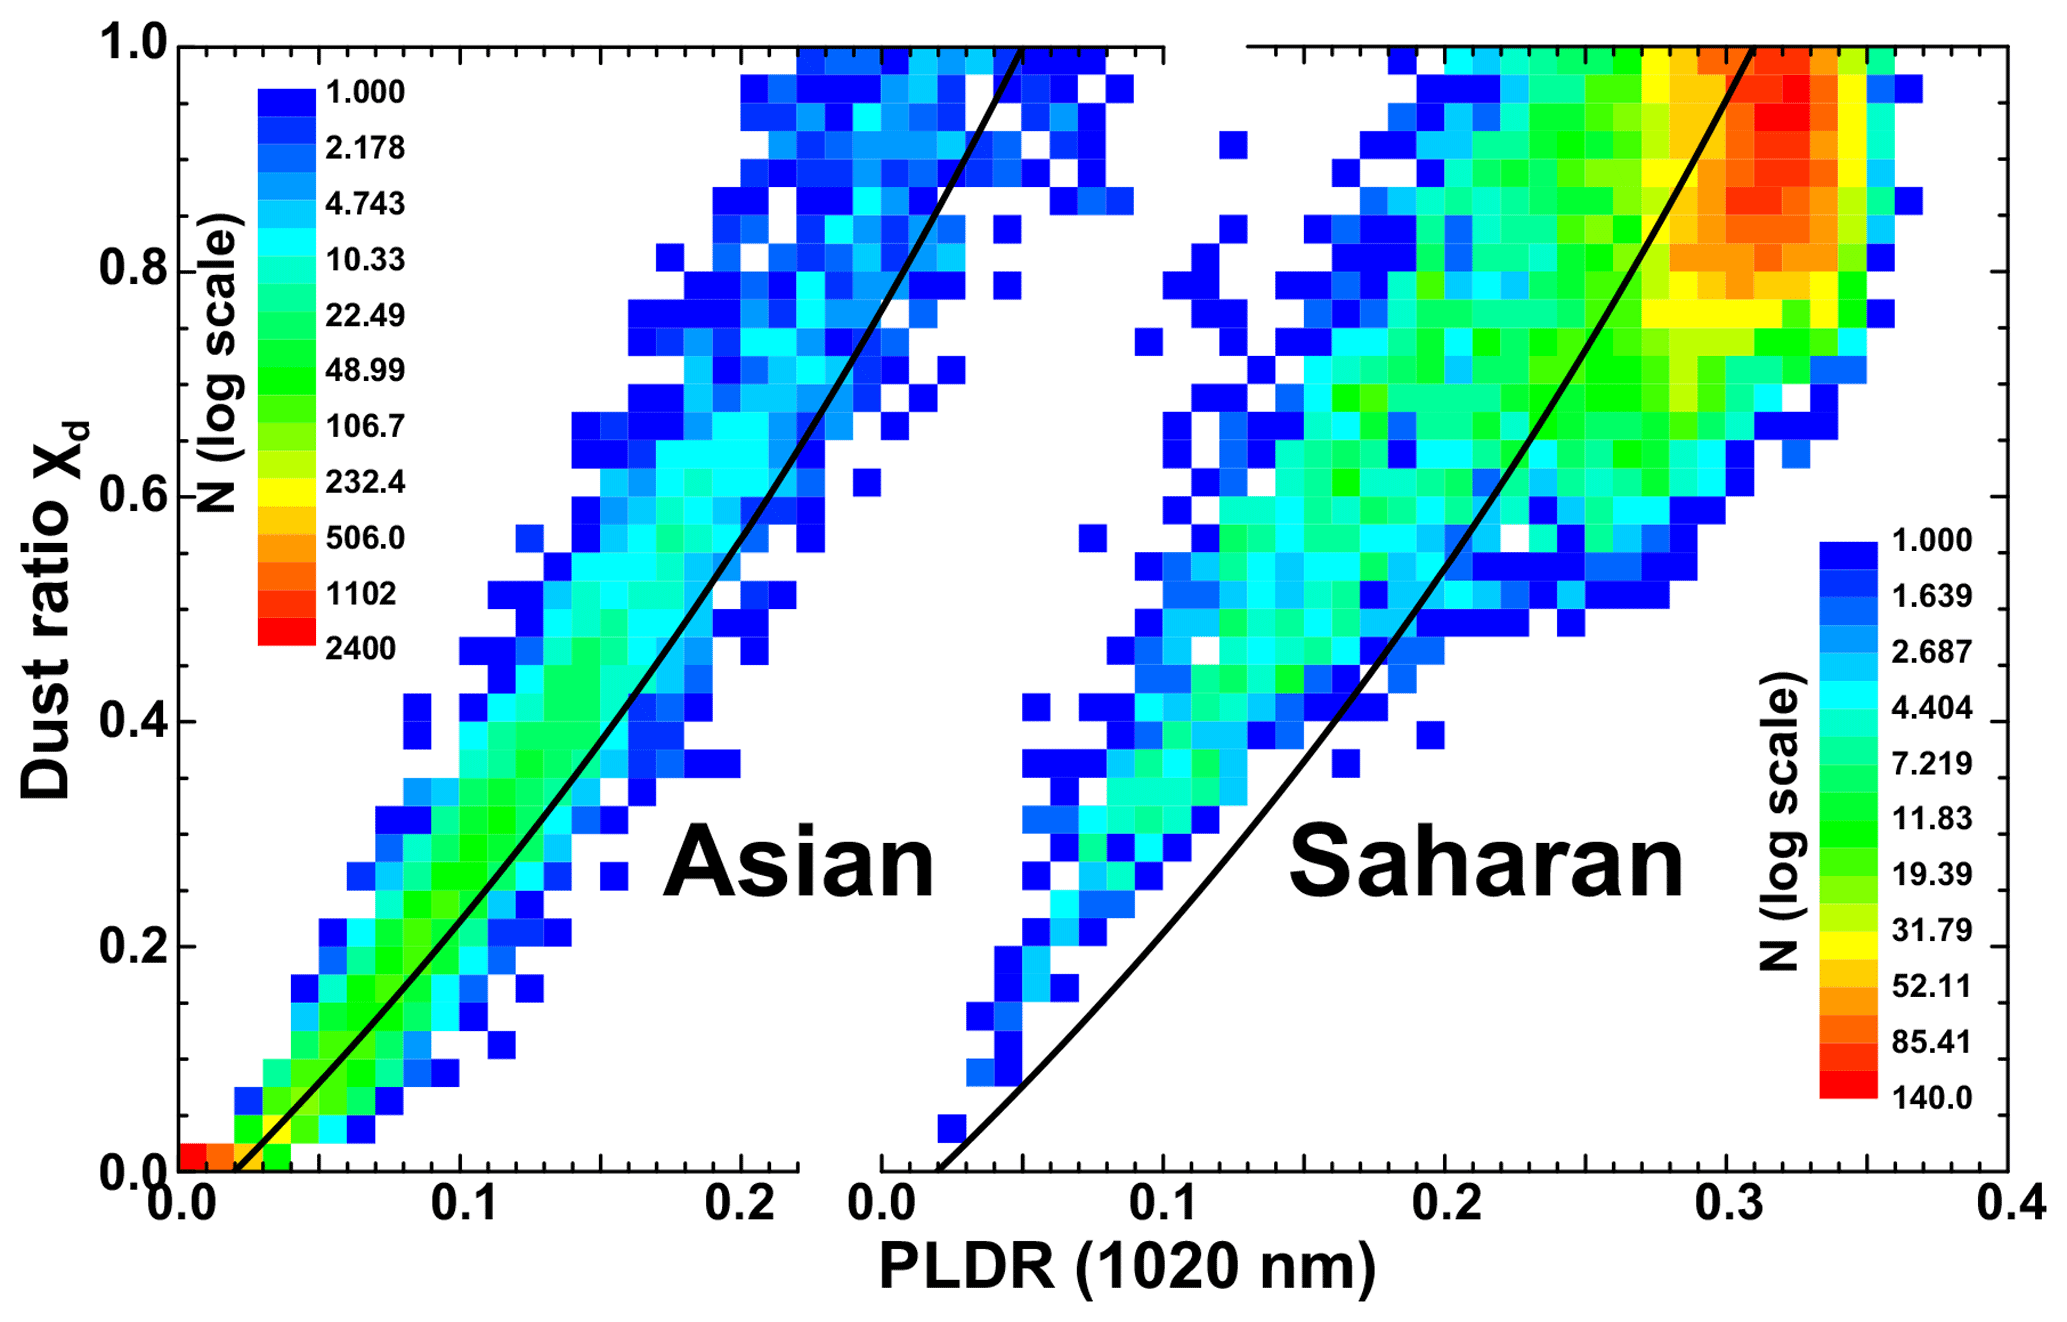
Figure 5Two-dimensional histograms of 1020 nm PLDR and χd for the considered AERONET stations affected by Asian (a) and Saharan dust (b). The black lines refer to the backscatter-related dust ratio Rd.
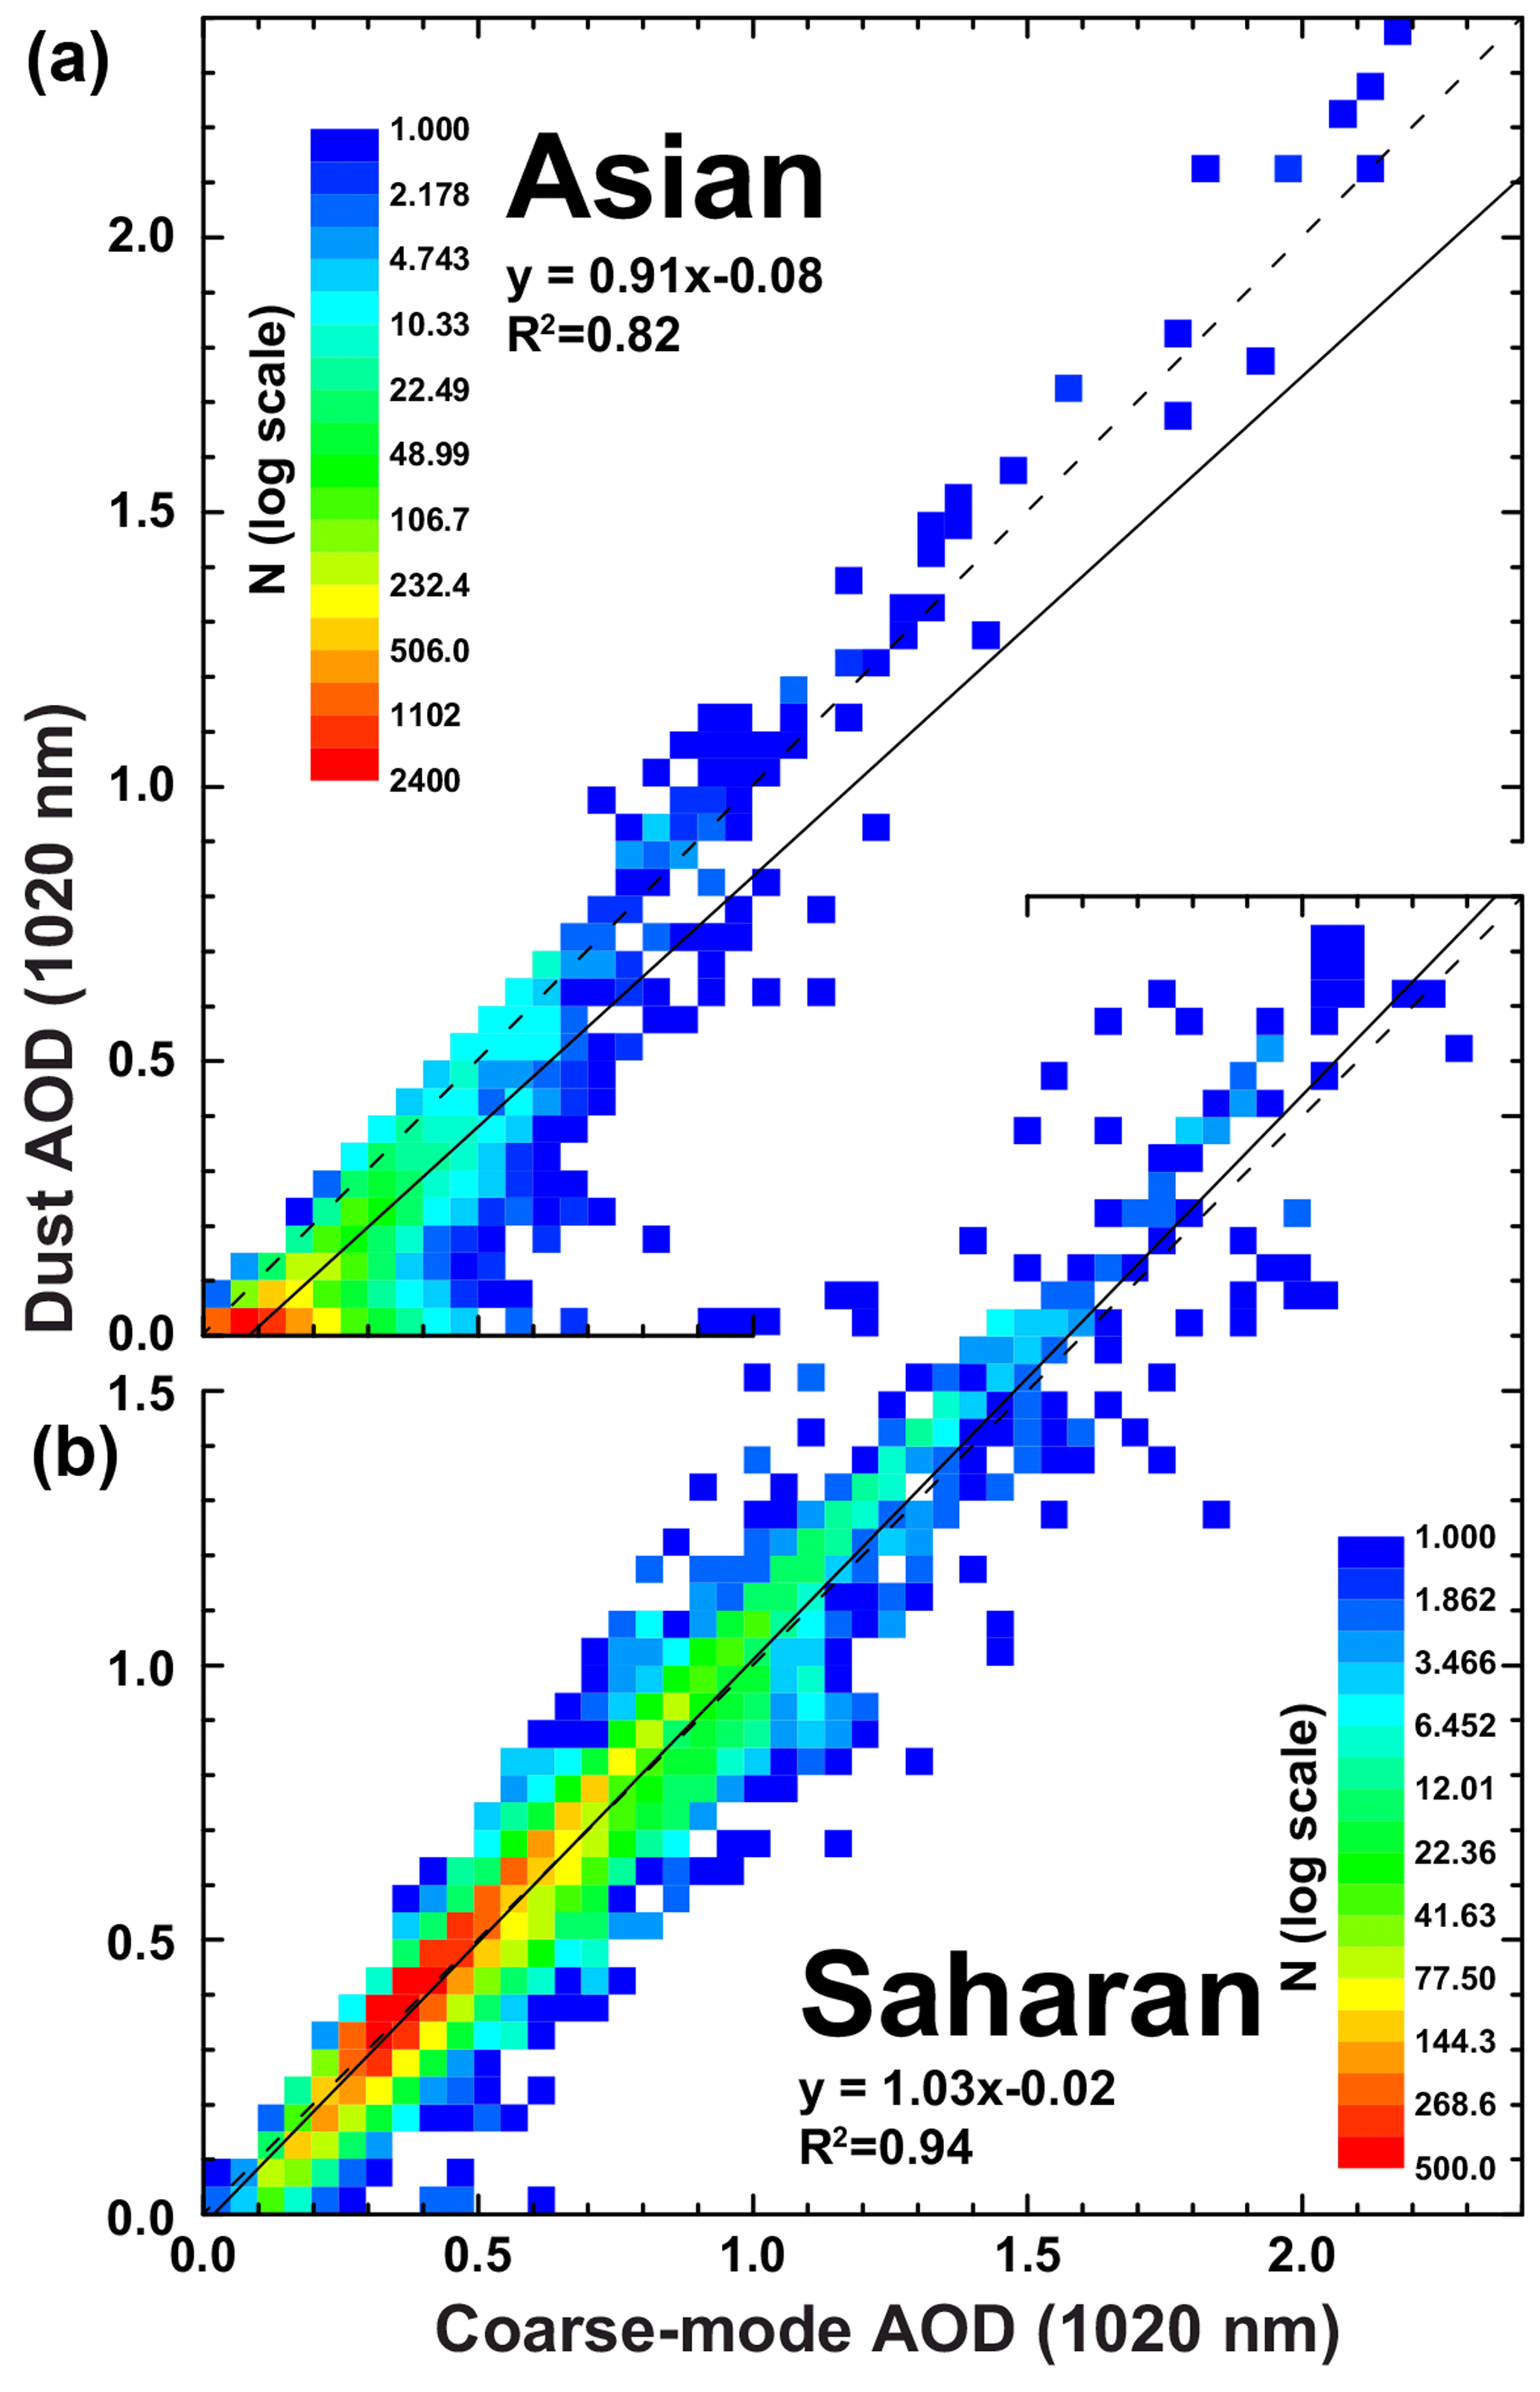
Figure 6Two-dimensional histograms of 1020 nm coarse-mode AOD and dust-related 1020 nm AOD for the considered AERONET stations affected by Asian (a) and Saharan dust (b).
A closer view on the relationship between δ1020 and χd is provided in Fig. 5. The figure shows the spread of χd that is introduced when transforming the simple theoretical relationship of Eq. (2) for lidar backscatter measurements (Shimizu et al., 2004; Tesche et al., 2009b) to extinction data by means of Eq. (10). Depending on the value of the total lidar ratio for the aerosol mixture with respect to the reference value for pure dust conditions (Table 1), χd is either increased or decreased with respect to Rd. Figure 5 shows that χd is almost exclusively larger than Rd for observations at Asian sites as the majority of AERONET-derived values of S are smaller than the reference value for Asian dust (see Shin et al., 2018; not shown). The same is the case for the Saharan observations with δ1020<0.2; while above that value, χd is spread evenly to both sides of Rd. The latter feature is related to the fact that the frequency distribution of S for the Saharan observations peaks around the value for pure Saharan dust of 54 sr (not shown) and the generally larger occurrence rate of pure-dust cases used to define the reference value in Shin et al. (2018). When considering the effect of FMF (not shown), we find that low values of FMF are generally linked to higher values of δ1020 for both Asian and Saharan sites. However, there are occasional cases for which low FMF can be found for low values of δ1020. Such cases might introduce artefacts when using FMF as a means for separating dusty from dust-free aerosol conditions.
3.2 Coarse-mode AOD versus dust AOD
A comparison of the coarse-mode AOD as provided by AERONET to the dust AOD obtained using Eqs. (6) and (7), respectively, is presented in Fig. 6. Unsurprisingly, we find that lower coarse-mode and dust AODs are related to lower coarse-mode volume concentrations (not shown). For the Asian stations, we find that coarse-mode AOD tends to overestimate the contribution of mineral dust to AOD. The effect is particularly pronounced at AODs below 0.5 at 1020 nm and coarse-mode volume concentrations below 0.5. This means that other coarse particles, such as marine aerosols, are likely to be present under these conditions. As a consequence, fine-mode AOD, if used as a proxy for non-dust aerosols, would lead to a systematic underestimation of the contribution of non-dust aerosol to total AOD. For the Saharan stations, coarse-mode AOD is found to be a suitable proxy for dust AOD. However, coarse-mode AOD shows few values below 0.1 while dust AOD can be as low as zero. Because the concentration of fine-mode aerosol is generally small at the selected Saharan sites, any comparison to non-dust AOD is inconclusive. In contrast to the Asian sites, the AOD related to fine-mode or non-dust particles is generally much lower than that of coarse-mode or dust particles, respectively (not shown).
We conclude that coarse-mode AOD and dust AOD cannot necessarily be considered synonymous. This needs to be kept in mind when using AERONET observations in the calibration and validation of spaceborne remote-sensing observations and aerosol transport modelling – particularly for locations with a high occurrence rate of complex aerosol mixtures.
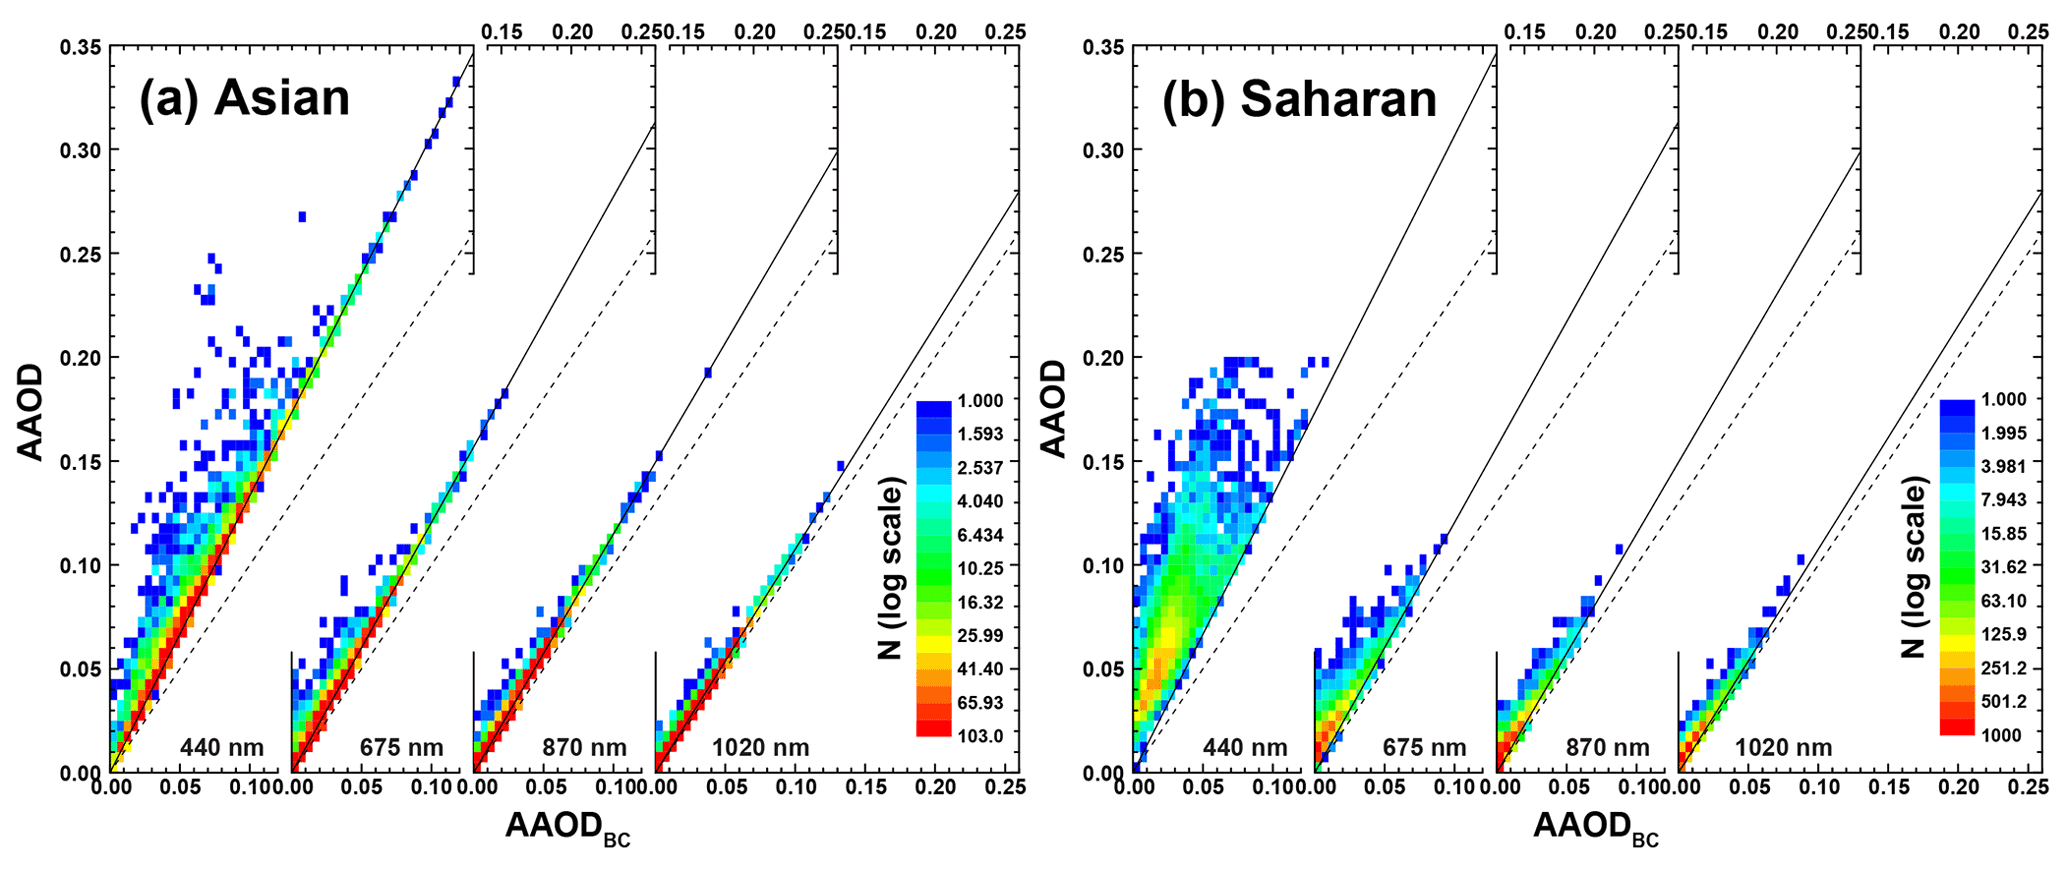
Figure 7Two-dimensional histograms of AAOD and AAODBC at the four AERONET standard wavelengths for the Asian (a) and Saharan (b) stations considered in this study. Solid lines refer to the theoretical values of AAODBC (using Eq. 15 and the values in Table 1) in the absence of mineral dust. Dashed lines mark the 1 : 1 line. Observations would follow this slope only if BC was a perfect absorber, i.e. if all absorption in the non-dust fraction was caused by BC or ωBC=0.
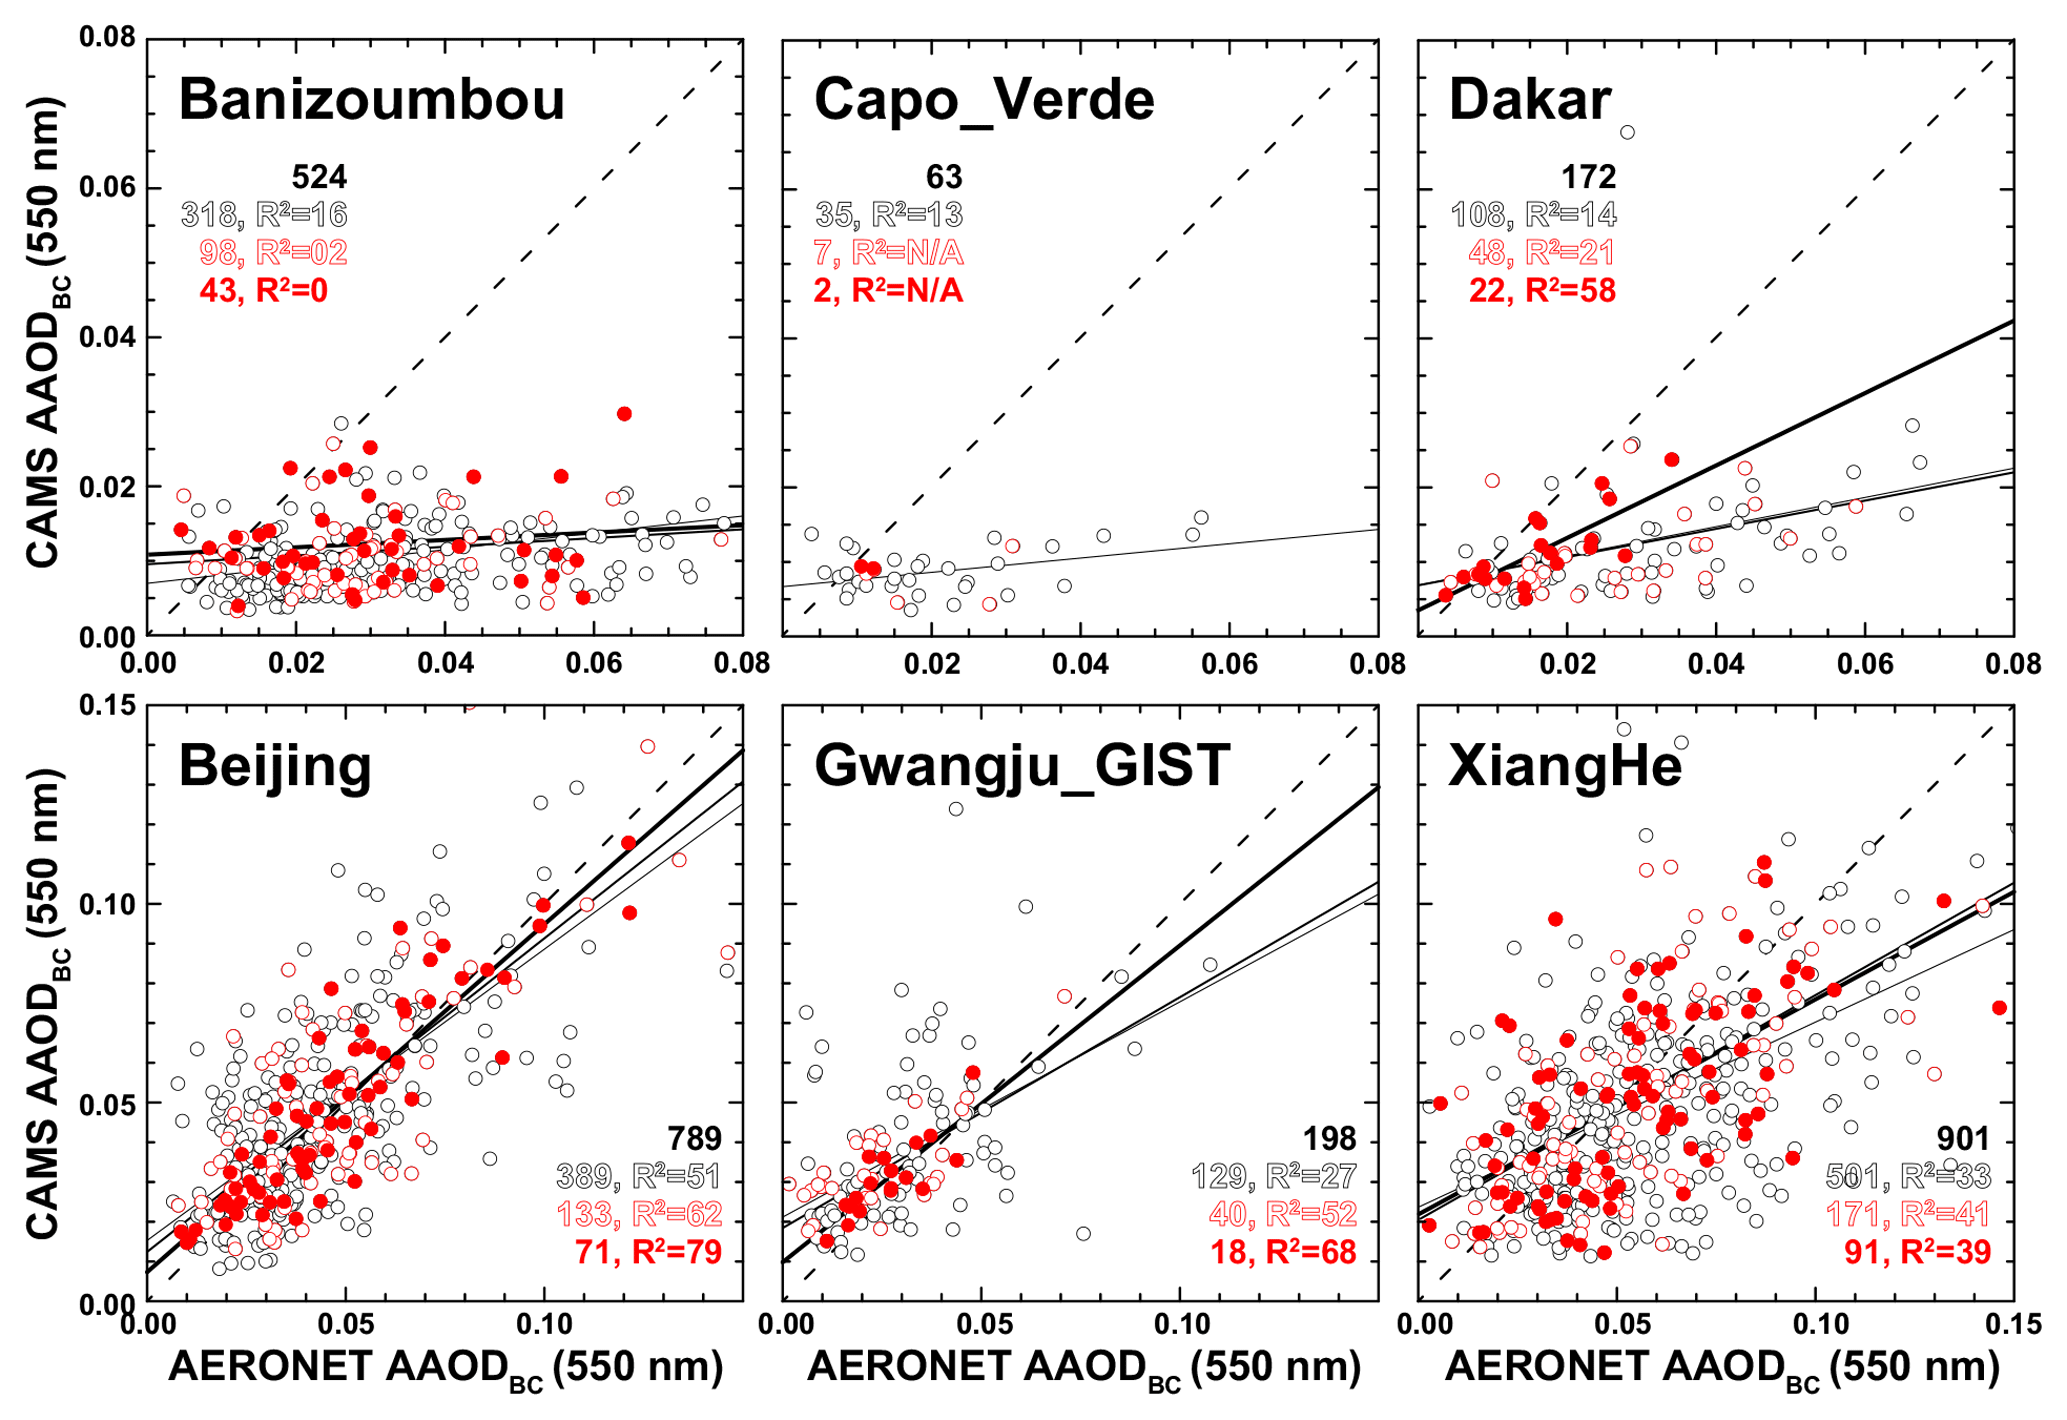
Figure 8Comparison of AERONET-derived AAODBC with CAMS model estimates for the sites listed in Table 2 for cases in which the total AOD from CAMS and AERONET agrees within 30 % (black circles, thin lines), 10 % (red circles, medium lines), and 5 % (red dots, bold lines). Numbers in the plots refer to the total number of collocated points and the number of matches with the given AOD agreement. Dashed lines mark the 1 : 1 line. Solid lines are linear fits of the data. Numbers in the plots refer to the number of collocations and squared correlation coefficients for all cases (solid black) and those with an AOD agreement within 30 % (open black), 10 % (open red), and 5 % (solid red).
3.3 AERONET-derived AAODBC and model assessment
Figure 7 presents the connection between AAOD and AAODBC at the standard AERONET wavelengths for observations at the Asian and Saharan sites. AAODBC has been obtained from the non-dust AAOD following Eq. (15). Absolute values of AAOD are generally larger for Asian compared to Saharan sites, and the contribution of mineral dust to aerosol absorption at all wavelengths is generally larger at Saharan compared to Asian sites. A majority of AAODBC values at Asian sites follow the theoretical curve for dust-free situations (i.e. with χdust=0), and the connection between AAOD and AAODBC is almost linear – particularly at longer wavelengths and larger AAODBC. For the same AAOD, a larger dust ratio χdust leads to a smaller AAODBC, and its corresponding observation is located further away from the solid line (not shown). The abundance of pure dust conditions at the Saharan sites therefore leads to the larger spread of AAODBC in Fig. 7, and this feature is particularly pronounced at 440 nm.
To evaluate the quality of the methodology that is used for retrieving AAODBC, we compared AERONET-derived values to the ones provided by CAMS aerosol reanalysis data for the sites considered in this study. We investigated cases in which total AOD from AERONET and CAMS agree within 30 %, 10 %, and 5 % of each other. We used these thresholds as a crude measure that allowed us to introduce levels of consistency between the two data sets and to assure that we consider cases in which the modelled aerosol situation is most likely resembling observations. The plots in Fig. 8 show a very different situation for the Asian and Saharan sites; the former show correlated results and slopes of the linear fit that are reasonably close to the 1 : 1 line (particularly when requiring less than 5 % difference in measured and modelled AOD), while the latter suggest that the CAMS AAODBC is strongly underestimating the contribution of BC to light absorption in mixed Saharan dust plumes. The best model resemblance of AAODBC is found for Dakar, where local pollution has a much stronger effect on aerosol composition than at the other Saharan sites (Petzold et al., 2011). This suggests that AAODBC as derived here from AERONET observations is more likely to describe aerosol absorption in anthropogenic pollution than in biomass burning.
We have presented a very selective analysis of AERONET observations as a proof of concept of the proposed methodology. More conclusive findings will require a thorough investigation of observations at a much larger set of AERONET sites.
We have presented a methodology to separate the contribution of dust and non-dust aerosol to total AOD measured with AERONET instruments based on lidar parameters provided in the version 3 level 2.0 inversion product. We showed how to derive the AAOD related to the non-dust component as well as to the BC fraction. We have analysed AERONET time series at six sites that are frequently affected by Asian or Saharan dust, respectively. We found that coarse- and fine-mode AOD cannot always be considered synonymous with the AOD related to dust and non-dust aerosol, respectively. We note that our methodology is the first attempt to enable such a differentiation solely on products provided by AERONET. We compared retrieved values of AAODBC to collocated model results provided by the CAMS aerosol reanalysis. This comparison has been restricted to only those AERONET–CAMS matches for which total AOD agrees within 30 % or better. We find that our methodology for obtaining AAODBC from AERONET provides values that resemble CAMS aerosol modelling for Asian sites. Little correlation was found for Saharan sites that are not frequently affected by a considerable contribution of anthropogenic pollution. This suggests that AAODBC as derived here is less useful for observations of biomass-burning smoke – though the currently investigated data set has been far too small to draw a robust conclusion.
We consider the presented methodology as a useful tool for a more detailed calibration and validation of spaceborne remote-sensing observations and aerosol dispersion modelling with AERONET measurements. It will be particularly valuable at locations that show a frequent occurrence of complex mixtures of mineral dust and anthropogenic pollution, e.g. east Asia or southern Europe but also individual highly polluted big cities downwind from major deserts.
The data used in this work are freely available through the AERONET portal at https://aeronet.gsfc.nasa.gov/ (last access: 17 January 2019).
SKS, MT, and DM had the idea for this study. SKS and MT performed the data analysis and prepared the figures. All authors contributed to the discussion of the findings and the preparation of the manuscript.
The authors declare that they have no conflict of interest.
We thank the PIs of the AERONET site used in this study for maintaining their
instruments and providing their data to the community. We also would like to
thank AERONET for their continuous efforts in providing high-quality
measurements and derivative products. All data used in this work can be
accessed through the AERONET web page: http://aeronet.gsfc.nasa.gov/.
This work was supported by the Korea Meteorological Administration Research
and Development programme under grant KMI (2018-04010).
Edited by: Alexander Kokhanovsky
Reviewed by: Alexei Lyapustin and five anonymous referees
Andreae, M. O. and Gelencsér, A.: Black carbon or brown carbon? The nature of light-absorbing carbonaceous aerosols, Atmos. Chem. Phys., 6, 3131—3148, https://doi.org/10.5194/acp-6-3131-2006, 2006. a
Ångström, A.: The parameters of atmospheric turbidity, Tellus, 16, 64–75, https://doi.org/10.1111/j.2153-3490.1964.tb00144.x, 1964. a
Bellouin, N., Quaas, J., Morcrette, J.-J., and Boucher, O.: Estimates of aerosol radiative forcing from the MACC re-analysis, Atmos. Chem. Phys., 13, 2045–2062, https://doi.org/10.5194/acp-13-2045-2013, 2013. a, b, c
Bergstrom, R. W.: Extinction and absorption coefficients of the atmospheric aerosol as a function of particle size, Contributions to Atmospheric Physics, 46, 223–234, 1973. a
Bohren, C. F. and Huffman, D. R.: Absorbing and scattering of light by small particles, Wiley, Weinheim, https://doi.org/10.1002/9783527618156, 1983. a
Bond, T. C. and Bergstrom, R. W.: Light absorption by carbonaceous particles: An investigative review, Aerosol Sci. Tech., 40, 27–67, https://doi.org/10.1080/02786820500421521, 2006. a, b, c
Bond, T. C., Doherty, S. J., Fahey, D. W., Forster, P. M., Berntsen, T., DeAngelo, B. J., Flanner, M. G., Ghan, S., Kärcher, B., Koch, D., Kinne, S., Kondo, Y., Quinn, P. K., Sarofim, M. C., Schultz, M. G., Schulz, M., Venkataraman, C., Zhang, H., Zhang, S., Bellouin, N., Guttikunda, S. K., Hopke, P. K., Jacobson, M. Z., Kaiser, J. W., Klimont, Z., Lohmann, U., Schwarz, J. P., Shindell, D., Storelvmo, T., Warren, S. G., and Zender, C. S.: Bounding the role of black carbon in the climate system: A scientific assessment, J. Geophys. Res., 118, 5380–5552, https://doi.org/10.1002/jgrd.50171, 2013. a, b, c
Burton, S. P., Vaughan, M. A., Ferrare, R. A., and Hostetler, C. A.: Separating mixtures of aerosol types in airborne High Spectral Resolution Lidar data, Atmos. Meas. Tech., 7, 419–436, https://doi.org/10.5194/amt-7-419-2014, 2014. a, b, c
Cross, E. S., Onasch, T. B., Ahern, A., Wrobel, W., Slowik, J. G., Olfert, J., Lack, D. A., Massoli, P., Cappa, C. D., Schwarz, J. P., and Spackman, J. R.: Soot particle studies–instrument inter-comparison–project overview, Aerosol Sci. Tech., 44, 592–611, https://doi.org/10.1080/02786826.2010.482113, 2010. a
Dubovik, O., Smirnov, A., Holben, B., King, M. D., Kaufman, Y. J., Eck, T. F., and Slutsker, I.: Accuracy assessments of aerosol optical properties retrieved from Aerosol Robotic Network (AERONET) Sun and sky radiance measurements, J. Geophys. Res., 105, 9791–9806, https://doi.org/10.1029/2000JD900040, 2000. a
Dubovik, O., Holben, B., Eck, T. F., Smirnov, A., Kaufman, Y. J., King, M. D., Tanré, D., and Slutsker, I.: Variability of absorption and optical properties of key aerosol types observed in worldwide locations, J. Atmos. Sci., 59, 590–608, https://doi.org/10.1175/1520-0469(2002)059<0590:VOAAOP>2.0.CO;2, 2002. a
Dubovik, O., Sinyuk, A., Lapyonok, T., Holben, B. N., Mishchenko, M., Yang, P., Eck, T. F., Volten, H., Muñoz, O., and Veihelmann, B.: Application of spheroid models to account for aerosol particle nonsphericity in remote sensing of desert dust, J. Geophys. Res., 111, D11208, https://doi.org/10.1029/2005JD006619, 2006. a, b
Eck, T., Holben, B., Dubovik, O., Smirnov, A., Goloub, P., Chen, H., Chatenet, B., Gomes, L., Zhang, X. Y., and Tsay, S. C.: Columnar aerosol optical properties at AERONET sites in central eastern Asia and aerosol transport to the tropical mid-Pacific, J. Geophys. Res., 110, D06202, https://doi.org/10.1029/2004JD005274, 2005. a, b
Freudenthaler, V., Esselborn, M., Wiegner, M., Heese, B., Tesche, M., Ansmann, A., Müller, D., Althausen, D., Wirth, M., and Fix, A.: Depolarization ratio profiling at several wavelengths in pure Saharan dust during SAMUM 2006, Tellus B, 61, 165–179, https://doi.org/10.1111/j.1600-0889.2008.00396.x, 2009. a, b
Giles, D. M., Sinyuk, A., Sorokin, M. S., Schafer, J. S., Smirnov, A., Slutsker, I., Eck, T. F., Holben, B. N., Lewis, J., Campbell, J., Welton, E. J., Korkin, S., and Lyapustin, A.: Advancements in the Aerosol Robotic Network (AERONET) Version 3 Database – Automated Near Real-Time Quality Control Algorithm with Improved Cloud Screening for Sun Photometer Aerosol Optical Depth (AOD) Measurements, Atmos. Meas. Tech. Discuss., https://doi.org/10.5194/amt-2018-272, in review, 2018. a
Haywood, J. M. and Ramaswamy, V.: Global sensitivity studies of the direct radiative forcing due to anthropogenic sulfate and black carbon aerosols, J. Geophys. Res., 103, 6043–6058, https://doi.org/10.1029/97JD03426, 1998. a, b
Holben, B. N., Eck, T. F., Slutsker, I., Tanré, D., Buis, J., Setzer, A., Vermote, E., Reagan, J., Kaufman, Y. J., and Nakajima, T.: AERONET – A federated instrument network and data archive for aerosol characterization, Remote Sens. Environ., 66, 1–16, https://doi.org/10.1016/S0034-4257(98)00031-5, 1998. a, b, c
Holben, B. N., Tanré, D., Smirnov, A., Eck, T., Slutsker, I., Abuhassan, N., Newcomb, W., Schafer, J., Chatenet, B., Lavenu, F., Kaufman, Y. J., Vande Castle, J., Setzer, A., Markham, B., Clark, D., Frouin, R., Halthore, R., Karneli, A., O'Neill, N. T., Pietras, C., Pinker, R. T., Voss, K., and Zibordi, G.: An emerging ground-based aerosol climatology: Aerosol optical depth from AERONET, J. Geophys. Res., 106, 12067–12097, https://doi.org/10.1029/2001JD900014, 2001. a, b, c
Inness, A., Baier, F., Benedetti, A., Bouarar, I., Chabrillat, S., Clark, H., Clerbaux, C., Coheur, P., Engelen, R. J., Errera, Q., Flemming, J., George, M., Granier, C., Hadji-Lazaro, J., Huijnen, V., Hurtmans, D., Jones, L., Kaiser, J. W., Kapsomenakis, J., Lefever, K., Leitão, J., Razinger, M., Richter, A., Schultz, M. G., Simmons, A. J., Suttie, M., Stein, O., Thépaut, J.-N., Thouret, V., Vrekoussis, M., Zerefos, C., and the MACC team: The MACC reanalysis: an 8 yr data set of atmospheric composition, Atmos. Chem. Phys., 13, 4073–4109, https://doi.org/10.5194/acp-13-4073-2013, 2013. a, b
Khalizov, A. F., Xue, H. X., Wang, L., Zheng, J., and Zhang, R. Y.: Enhanced light absorption and scattering by carbon soot aerosol internally mixed with sulfuric acid, J. Phys. Chem. A, 113, 1066–1074, https://doi.org/10.1021/jp807531n, 2009. a
Koven, C. D. and Fung, I.: Inferring dust composition from wavelength-dependent absorption in Aerosol Robotic Network (AERONET) data, J. Geophys. Res., 111, D14205, https://doi.org/10.1029/2005JD006678, 2006. a
Mamouri, R. E. and Ansmann, A.: Fine and coarse dust separation with polarization lidar, Atmos. Meas. Tech., 7, 3717–3735, https://doi.org/10.5194/amt-7-3717-2014, 2014. a
Müller, T., Schladitz, A., Massling, A., Kaaden, N., Kandler, K., and Wiedensohler, A.: Spectral absorption coefficients and imaginary parts of refractive indices of Saharan dust during SAMUM-1, Tellus B, 61, 79–95, https://doi.org/10.1111/j.1600-0889.2008.00399.x, 2009. a
Noh, Y., Müller, D., Lee, K., Kim, K., Lee, K., Shimizu, A., Sano, I., and Park, C. B.: Depolarization ratios retrieved by AERONET sun–sky radiometer data and comparison to depolarization ratios measured with lidar, Atmos. Chem. Phys., 17, 6271–6290, https://doi.org/10.5194/acp-17-6271-2017, 2017. a
Noh, Y. M.: Single-scattering albedo profiling of mixed Asian dust plumes with multiwavelength Raman lidar, Atmos. Environ., 95, 305–317, https://doi.org/10.1016/j.atmosenv.2014.06.028, 2014. a
O'Neill, N., Eck, T., Smirnov, A., Holben, B., and Thulasiraman, S.: Spectral discrimination of coarse and fine mode optical depth, J. Geophys. Res., 108, 4559, https://doi.org/10.1029/2002JD002975, 2003. a
Petzold, A., Rasp, K., Weinzierl, B., Esselborn, M., Hamburger, T., Dörnbrack, A., Kandler, K., Schütz, L., Knippertz, P., Fiebig, M., and Virkkula, A.: Saharan dust absorption and refractive index from aircraft-based observations during SAMUM 2006, Tellus B, 61, 118–130, https://doi.org/10.1111/j.1600-0889.2008.00383.x, 2009. a
Petzold, A., Veira, A., Mund, S., Esselborn, M., Kiemle, C., Weinzierl, B., Hamburger, T., Ehret, G., Lieke, K., and Kandler, K.: Mixing of mineral dust with urban pollution aerosol over Dakar (Senegal): impact on dust physico-chemical and radiative properties, Tellus B, 63, 619–634, https://doi.org/10.1111/j.1600-0889.2011.00547.x, 2011. a
Russell, P. B., Bergstrom, R. W., Shinozuka, Y., Clarke, A. D., DeCarlo, P. F., Jimenez, J. L., Livingston, J. M., Redemann, J., Dubovik, O., and Strawa, A.: Absorption Angstrom Exponent in AERONET and related data as an indicator of aerosol composition, Atmos. Chem. Phys., 10, 1155–1169, https://doi.org/10.5194/acp-10-1155-2010, 2010. a, b, c
Schuster, G. L., Dubovik, O., Holben, B. N., and Clothiaux, E. E.: Inferring black carbon content and specific absorption from Aerosol Robotic Network (AERONET) aerosol retrievals, J. Geophys. Res., 110, D10S17, https://doi.org/10.1029/2004JD004548, 2005. a
Schuster, G. L., Dubovik, O., and Holben, B. N.: Angstrom exponent and bimodal aerosol size distributions, J. Geophys. Res., 111, D07207, https://doi.org/10.1029/2005JD006328, 2006. a
Shimizu, A., Sugimoto, N., Matsui, I., Arao, K., Uno, I., Murayama, T., Kagawa, N., Aoki, K., Uchiyama, A., and Yamazaki, A.: Continuous observations of Asian dust and other aerosols by polarization lidars in China and Japan during ACE-Asia, J. Geophys. Res., 109, D19S17, https://doi.org/10.1029/2002JD003253, 2004. a, b, c, d, e
Shin, S.-K., Tesche, M., Kim, K., Kezoudi, M., Tatarov, B., Müller, D., and Noh, Y.: On the spectral depolarisation and lidar ratio of mineral dust provided in the AERONET version 3 inversion product, Atmos. Chem. Phys., 18, 12735–12746, https://doi.org/10.5194/acp-18-12735-2018, 2018. a, b, c, d, e, f, g, h, i, j, k, l
Stocker, T. F., Qin, D., Plattner, G.-K., Tignor, M., Allen, S. K., Boschung, J., Nauels, A., Xia, Y., Bex, V., and Midgley, P. M.: Climate Change 2013: The Physical Science Basis. Contribution of Working Group I to the Fifth Assessment Report of the Intergovernmental Panel on Climate Change, Cambridge Univ. Press, Cambridge, UK, and New York, 1535 pp., 2013. a, b
Tesche, M., Ansmann, A., Müller, D., Althausen, D., Mattis, I., Heese, B., Freudenthaler, V.,Wiegner, M., Esselborn, M., Pisani, G., and Knippertz, P.: Vertical profiling of Saharan dust with Raman lidars and airborne HSRL in southern Morocco during SAMUM, Tellus B, 61, 144–164, https://doi.org/10.1111/j.1600-0889.2008.00390.x, 2009a. a, b
Tesche, M., Ansmann, A., Müller, D., Althausen, D., Engelmann, R., Freudenthaler, V., and Groß, S.: Vertically resolved separation of dust and smoke over Cape Verde using multiwavelength Raman and polarization lidars during Saharan Mineral Dust Experiment 2008, J. Geophys. Res., 114, D13202, https://doi.org/10.1029/2009JD011862, 2009b. a, b, c, d
Yu, X., Cheng, T., Chen, J., and Liu, Y.: A comparison of dust properties between China continent and Korea, Japan in East Asia, Atmos. Environ., 40, 5787–5797, https://doi.org/10.1016/j.atmosenv.2006.05.013, 2006. a