the Creative Commons Attribution 4.0 License.
the Creative Commons Attribution 4.0 License.
 | 08 Feb 2019
Measurements of hydroperoxy radicals (HO2) at atmospheric concentrations using bromide chemical ionisation mass spectrometry
Sascha R. Albrecht
Anna Novelli
Andreas Hofzumahaus
Sungah Kang
Yare Baker
Thomas Mentel
Andreas Wahner
Hendrik Fuchs
Hydroxyl and hydroperoxy radicals are key species for the understanding of atmospheric oxidation processes. Their measurement is challenging due to their high reactivity; therefore, very sensitive detection methods are needed. Within this study, the measurement of hydroperoxy radicals (HO2) using chemical ionisation combined with a high-resolution time-of-flight mass spectrometer (Aerodyne Research Inc.) employing bromide as the primary ion is presented. The sensitivity reached is equal to 0.005×10⁸ HO2 cm−3 for 106 cps of bromide and 60 s of integration time, which is below typical HO2 concentrations found in the atmosphere. The detection sensitivity of the instrument is affected by the presence of water vapour. Therefore, a water-vapour-dependent calibration factor that decreases approximately by a factor of 2 if the water vapour mixing ratio increases from 0.1 % to 1.0 % needs to be applied. An instrumental background, most likely generated by the ion source that is equivalent to a HO2 concentration of molecules cm−3, is subtracted to derive atmospheric HO2 concentrations. This background can be determined by overflowing the inlet with zero air. Several experiments were performed in the atmospheric simulation chamber SAPHIR at the Forschungszentrum Jülich to test the instrument performance in comparison to the well-established laser-induced fluorescence (LIF) technique for measurements of HO2. A highly linear correlation coefficient of R2=0.87 is achieved. The slope of the linear regression of 1.07 demonstrates the good absolute agreement of both measurements. Chemical conditions during experiments allowed for testing the instrument's behaviour in the presence of atmospheric concentrations of H2O, NOx, and O3. No significant interferences from these species were observed. All of these facts demonstrate a reliable measurement of HO2 by the chemical ionisation mass spectrometer presented.
- Article
(3983 KB) - Full-text XML
-
Supplement
(3577 KB) - BibTeX
- EndNote


Understanding of the oxidation processes in the atmosphere requires sensitive measurements of the radical species involved. Hydroxyl radicals (OH) are the most important oxidative species and are highly reactive to most of the inorganic and organic pollutants in the atmosphere. The primary sources of OH radicals are mainly due to ozone photolysis and, in polluted environments, nitrous acid (HONO) photolysis can also be of importance. Organic pollutants are oxidised by OH to produce organic peroxy radical species (RO2) and hydroperoxy radicals (HO2). OH and HO2 radicals are closely interconnected by a radical chain reaction, in which OH is reformed by the reaction of HO2 with nitric oxide (NO):
As the atmospheric lifetime of HO2 radicals is typically up to a factor of 10 longer than that of OH radicals, HO2 can be regarded as an important chemical reservoir for hydroxyl radical (OH). Atmospheric NO concentrations are often sufficiently high to maintain an efficient OH production through the reaction of HO2 with NO, so that Reaction (R1) provides a large portion of the total OH production. Measurements of both species are needed to analyse the OH radical's budget.
The majority of the techniques currently applied to measure atmospheric concentrations of HO2 radicals use chemical conversion, which is an indirect measurement. In chemical amplifying systems, a radical reaction cycle between OH and HO2 is established by adding two reactants. The concentration of the product species is therefore amplified compared to the small, initial HO2 concentration in the sampled air.
PEroxy RadiCal Amplification (PERCA) instruments make use of NO and CO for the conversion of HO2 to OH and OH to HO2, respectively. One NO2 molecule is produced in each reaction cycle so that the initially small HO2 concentration is amplified as NO2, which is then detected by a luminol detector, fluorescence, or absorption methods. Because RO2 is also converted to HO2 in the reaction with NO, these instruments measure the sum of RO2 and HO2. Typically, an amplification of roughly a factor of 100 is achieved to produce a measurable amount of NO2 (Cantrell et al., 1984; Hastie et al., 1991; Clemitshaw et al., 1997; Burkert et al., 2001; Wood et al., 2017; Sadanaga et al., 2004; Mihele and Hastie, 2000; Green et al., 2006; Andrés-Hernández et al., 2010).
Alternatively to CO, SO2 can be used in the chemical amplifier system (Reiner et al., 1997; Hanke et al., 2002; Edwards et al., 2003; Hornbrook et al., 2011). The high sensitivity of chemical ionisation mass spectrometer (CIMS) measurements using nitrate () as the primary ion allows for the detection sulfuric acid (H2SO4) produced in the reaction of SO2 with OH. Amplification factors of approximately 10 are sufficient in this case. Like in the PERCA instrument, RO2 is also converted to HO2 in the reaction with NO in these instruments. However, Hornbrook et al. (2011) developed a method to distinguish between HO2 and RO2 by operating the instrument in different chemical conditions (varying NO, SO2, and O2 concentrations), thereby changing the relative sensitivities for HO2 and RO2.
Laser-induced fluorescence (LIF) is a sensitive technique for OH radical measurements and it is used for the indirect detection of HO2 by its conversion into OH after reaction with NO. The concurrent conversion of some specific RO2 radicals can contribute to the HO2 signal (Fuchs et al., 2011; Whalley et al., 2013; Lew et al., 2018). This can be minimised by reducing the NO concentration added to the sampled air for the conversion of HO2 to OH, but at the cost of a reduced sensitivity. A comparison of three LIF instruments in 2010 before the RO2 interference was discovered showed significant differences in measured HO2 concentration in experiments in the SAPHIR chamber (Fuchs et al., 2010). This could have been partly due to interferences from RO2, but measurements also differed depending on the water-vapour concentration.
Several drawbacks are connected with existing HO2 detection methods. The PERCA systems exhibit a strong water vapour dependence on the amplification factor. In addition, chemical conversion of HO2 through the reaction with NO used in all instruments can lead to the concurrent conversion of RO2.
Previous work by Veres et al. (2015) showed that HO2 radicals can be detected with a CIMS instrument using iodide as the primary ion. Sanchez et al. (2016) demonstrated for the first time that this approach can also be used with Br−. HO2 radicals are directly measured by a mass spectrometer as an ion cluster formed with bromide ions. Sanchez et al. (2016) demonstrated that the most promising ionisation technique is the detection of the bromide cluster with HO2. In their work they showed that a sufficient sensitivity for atmospheric measurements can be achieved and no significant interference from NOx, HCHO, SO2, or O3 is present.
Following the concept of Sanchez et al. (2016), a bromide chemical ionisation mass spectrometer with improved sensitivity was developed in this work. An optimised ionisation flow tube was custom-built and mounted on top of a commercial, high-resolution time-of-flight mass spectrometer (TOF-MS, Aerodyne Res.). In addition to laboratory characterisation experiments that mostly confirmed results reported in Sanchez et al. (2016), the performance of the instrument was quantitatively assessed in a comparison of HO2 concentrations with measurements from an established HO2 instrument using laser-induced fluorescence. Experiments in the atmospheric simulation chamber SAPHIR were performed at atmospheric gas mixtures and radical concentrations.
2.1 Chemical ionisation mass spectrometry technique
The instrument used for the detection of the cluster consists of a custom-built ion flow tube (Fig. 1) that is mounted upstream of a TOF-MS. Losses in inlets can play a significant role in the detection of reactive HO2 radicals. As radical species are easily lost through contact on walls, the inlet of the instrument is designed to sample air directly into the ion flow tube without additional inlet lines. The TOF-MS is equipped with an atmospheric pressure ionisation (APi) transfer stage providing the ion transfer from the ion flow tube to the detector. The TOF mass analyser (Tofwerk AG, Switzerland) has a mass resolution better than 2000.
Ambient air containing HO2 (flow rate 3.4 slm; slm means litres at standard conditions, T=0 ∘C and p=1013 hPa) is sampled through a 0.7 mm skimmer nozzle and is mixed with the bromide ions in the ion flow tube shown in Fig. 1. The ion flow tube has an inner diameter of 22 mm and a length of 130 mm. The distance between the ion source and the nozzle downstream is 100 mm. The ion flow tube is kept at a constant pressure of 120 hPa using a butterfly control valve upstream of a scroll pump. Assuming that 5.4 slm of gas is passing through the ion flow tube, the mean residence time is 240 ms assuming plug–flow conditions. Longer versions of the ion flow tube of up to twice its size were tested, but a reduced sensitivity for HO2 was found. Downstream of the ion flow tube, the sampled air enters a commercially available transfer stage (CI-API transfer stage, Aerodyne Research Inc.) through a nozzle with a 0.5 mm diameter. The transfer stage consists of two quadrupoles and direct current transfer optics that guide the ions to the TOF analyser. Laboratory experiments were performed at 25 to 30 ∘C.
Bromide ions easily clusters with polar species, e.g. acids (Caldwell et al., 1989). This enables their detection in the gas phase, including HO2, which is a relatively strong acid (the binding energy is 353 kcal mol−1 Harrison, 1992). In order to produce Br− ions, a gas flow of 2 slm nitrogen is mixed with 10 sccm of a 0.4 % mixture of CF3Br in nitrogen (Air Liquide Deutschland GmbH, N2 99.9999 % purity). The resulting gas mixture of approximately 20 ppmv CF3Br in nitrogen is supplied to the 370 MBq 210Po ion source (Type P-2021-5000, NDR Static Control LLC, USA) to generate bromide ions, resulting in an ion count rate of 1×10⁵ cps.
The isotopic pattern of bromide (approx. 179Br:181Br) provides additional information if a signal detected at a certain mass contains a cluster with bromide, because similar signals need to be contained at two masses (m∕z and ). Therefore, is detected on masses 112 and 114 with similar intensities. Both signals can be used for the data evaluation in order to improve the signal-to-noise ratio.
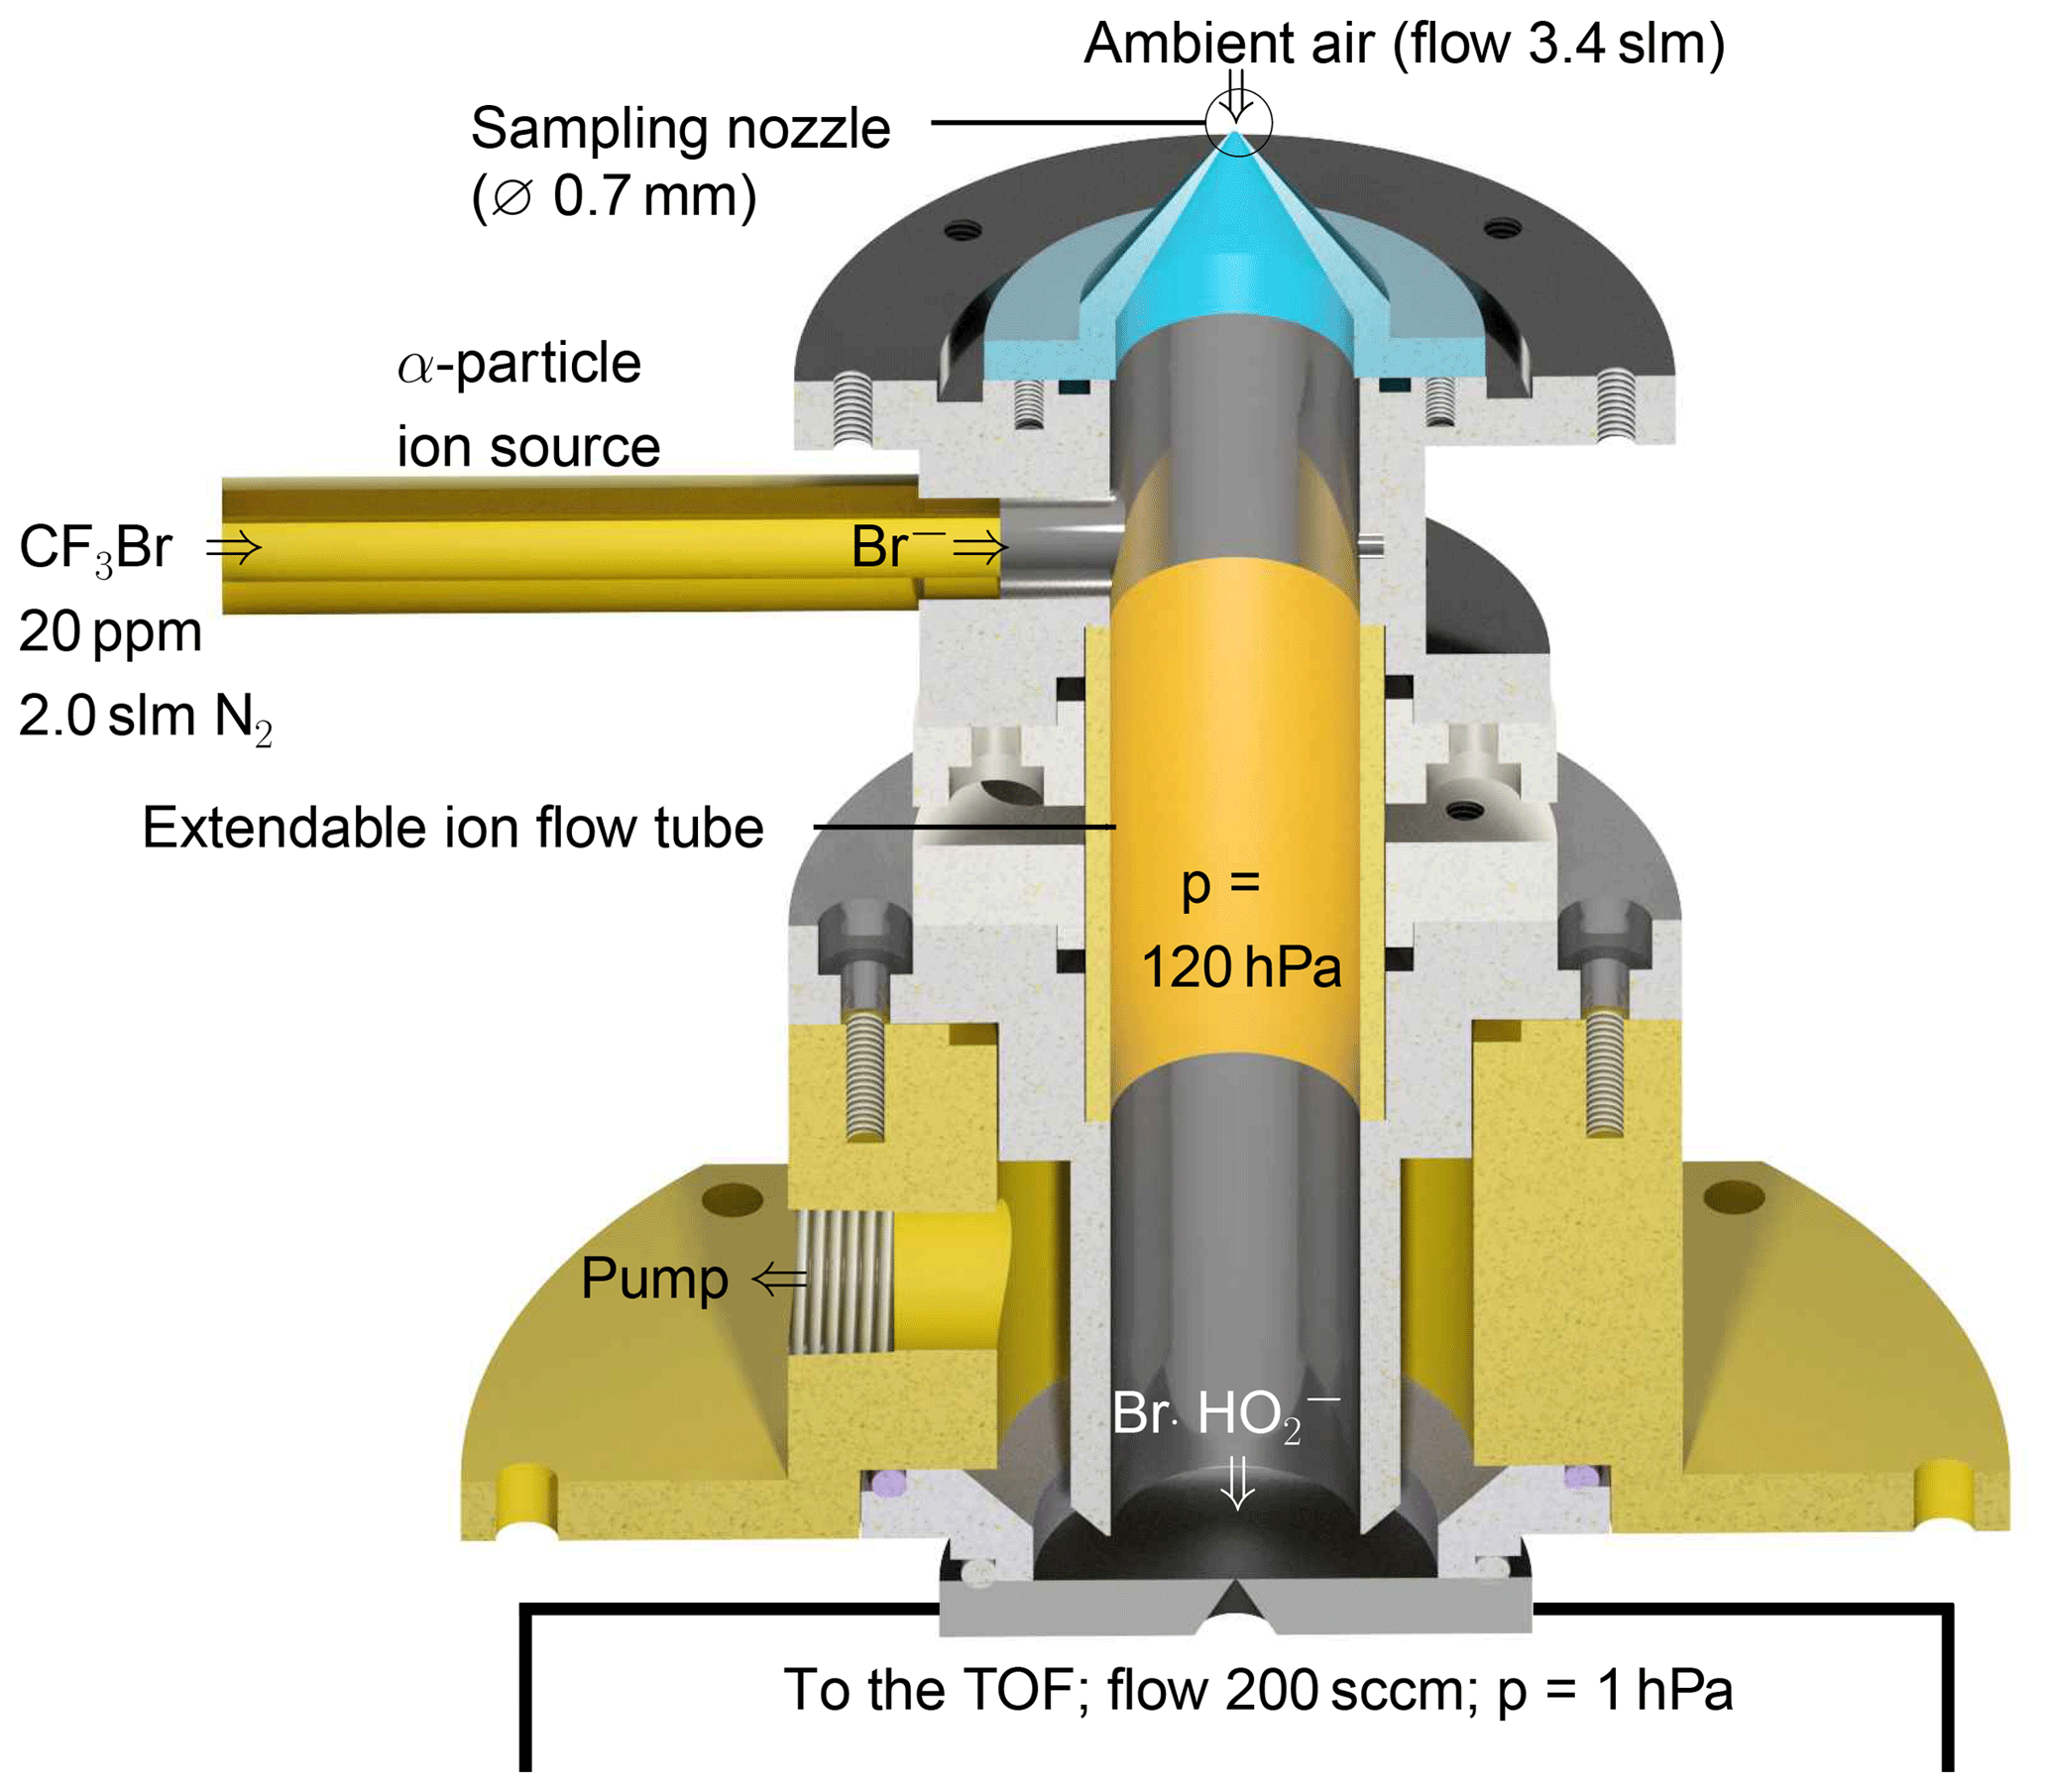
Figure 1Schematic drawing of the ion flow tube, where HO2 clusters with Br− are formed. The ion flow tube is mounted upstream of an Aerodyne time-of-flight mass spectrometer.
The data are analysed using the following procedure. A total of 30 mass spectra measured with a time resolution of 2 s are summed up to improve the signal-to-noise ratio (cf. Sect. 3.3). A mass spectrum, including the mass peaks used, is shown in the Supplement. The ion cluster ion count rate (m∕z 112) is normalised to the count rate of the primary ion (m∕z 79). The isotopic signal at a mass-to-charge ratio of 114 / 81 is treated in the same way. The signal at both isotopic masses of the ion cluster are compared to check for possible interference from ions not containing a bromide molecule. In the following step, a water-vapour-dependent sensitivity is applied to convert the signal to a HO2 concentration. Details about the water-vapour-dependent sensitivity are presented in Sect. 3.2. Finally, a constant background is subtracted from the data. No difference in the isotopic signals was observed, showing that no other molecule (not containing bromide) is interfering. In this study, only data from one of the two isotopes (m∕z 112 and 79) are discussed for simplicity.
2.2 HO2 detection by laser-induced fluorescence
The LIF instrument uses two detection channels to simultaneously detect OH and HO2. The LIF instrument has been described in detail by Holland et al. (2003), Fuchs et al. (2011), and Tan et al. (2017).
For the HO2 measurement, a gas stream of ambient air is expanded into the fluorescence cell at 4 hPa. NO is added to the sampled air for the conversion of HO2 to OH (Reaction R1). The NO concentration is adjusted to provide a HO2 conversion efficiency of approximately 10 %, in order to minimise concurrent RO2 conversion (Fuchs et al., 2011). The OH radicals are excited by a laser pulse at 308 nm, provided by a dye laser system. Ozone can be photolysed at 308 nm, which can lead to a small interference from ozone that is subtracted from the measured signal. For the experiments discussed here, 50 ppbv O3 gave a signal that is equivalent to a HO2 concentration of 3×106 cm−3. The sensitivity of the HO2 LIF detection is water vapour dependent due to the quenching of the OH fluorescence by water. The change in the sensitivity is calculated from quenching constants. Both corrections are taken into account in the data presented here. The accuracy of the LIF HO2 measurement is ±10 % due to the uncertainty of the calibration. The typical precision of measurements gives an limit of detection of 1×10⁷ mol cm−3 (2σ) for an 80 s measurement (Tan et al., 2017).
2.3 SAPHIR
SAPHIR is an atmospheric simulation chamber at Forschungszentrum Jülich. The chamber has been described in detail by Rohrer et al. (2005). It consists of a double-wall FEP film of cylindrical shape (length of 18 m, diameter of 5 m, volume of 270 m3). It is equipped with a shutter system that can be opened to expose the chamber air to natural sunlight. Synthetic air used in the experiments is produced from liquid nitrogen and oxygen of the highest purity (Linde, purity <99.9999 %). A combination of sensitive measurement instruments allows for studying chemical systems under well-defined atmospheric conditions and trace-gas concentrations. SAPHIR has proven to be a valuable tool for inter-comparisons of different measurement techniques (Fuchs et al., 2010, 2012; Dorn et al., 2013; Apel et al., 2008), as it is ensured that all instruments sample the same air composition.
For this study, measurements were performed during a series of experiments in the SAPHIR chamber in May and June 2017. The focus of the experiments was to study the chemistry of two classes of oxidation products of isoprene: isoprene hydroxyhydroperoxides (ISOPOOH) and isoprene epoxydiols (IEPOX). In addition, reference experiments without addition of volatile organic compounds (VOCs), as well as experiments with isoprene, were performed. These experiments were used to compare the performance of the CIMS and the LIF instrument at atmospheric HO2 concentrations, testing various conditions, e.g. presence of ozone, NOx species, and different water-vapour concentrations.
The CIMS was mounted underneath the chamber floor, 4 m away from the LIF instrument. The ion flow tube set-up shown in Fig. 1 was directly connected to the chamber, so that the sampling nozzle was sticking into the chamber.
Data from the following instruments are used for the data evaluation and interpretation: the humidity was measured using a Picarro cavity ring-down instrument (G2401 analyser), NO and NO2 were monitored by an Eco Physics chemiluminescence instrument (TR780), and ozone was detected by a UV photometer (41M, Ansyco).
Measurements in the chamber were performed at daytime temperatures of roughly 20 to 30 ∘C. Additionally, the instrument itself was temperature stabilised to (25±5) ∘C to prevent temperature effects.
2.4 Calibration source
For calibrating the HO2-CIMS instrument's sensitivity, the same radical source is used as for the calibration of the LIF instrument that is in operation at Forschungszentrum Jülich (Fuchs et al., 2011). This is possible because the designs of the inlet nozzle and flow rates of both instruments are similar. The LIF instrument is sampled at 1.0 slm and the CIMS instrument samples at 3.4 slm. Both flows are much smaller than the total flow through the calibration source. The calibration source provides a laminar gas stream of humidified synthetic air at a flow rate of 20 slm. The gas supply device for the calibration source allows for systematic variation of the water-vapour concentration. During calibrations, the water-vapour concentration is altered from 0.1 % to 1.6 %, in order to determine the humidity dependence of the instrument's sensitivity. Water vapour is photolysed at 185 nm at atmospheric pressure using a pen-ray lamp, leading to the production of equal concentrations of OH and HO2 radicals (Fuchs et al., 2011). The radical concentration that is provided by the calibration source is calculated from the UV intensity that is monitored by a phototube detector, the flow rate, and water-vapour concentration. The phototube signal is calibrated against ozone that is concurrently produced from oxygen photolysis by the 185 nm radiation. An absorption cell in between the UV lamp and the photolysis region can be filled with a N2O∕N2 mixture to vary the UV intensity, as N2O is a strong absorber at this wavelength. If excess CO is added to the synthetic air provided to the calibration source, OH is converted to HO2, so that the HO2 concentration is doubled compared to the operation without CO. Typically, the calibration is performed at HO2 concentrations between 5×10⁸ and 1×10¹⁰ molecules cm−3.
3.1 Linearity of measurements
In general, the conversion of ion count rates measured by a CIMS instrument to concentrations of the detected molecule requires regular calibrations of the sensitivity. For calibrating the HO2 sensitivity, a radical source was utilised as described in Sect. 2.4. Figure 2 shows the measured, normalised ion count rates measured by the CIMS, when the calibration source was operated at a constant water vapour mixing ratio of 1.0 %. The HO2 concentration was altered by changing the UV radiation intensity through variation of the N2O concentration in the absorption cell of the calibration source. A linear behaviour for the normalised count rate measured by the CIMS instrument is observed in the tested range of 3.0×10⁸ to 1.3×10⁹ HO2 molecules cm−3. The slope of the linear regression gives the calibration factor of cm3. The intercept of of the linear fit indicates a HO2 background signal that was not corrected in Fig. 2.
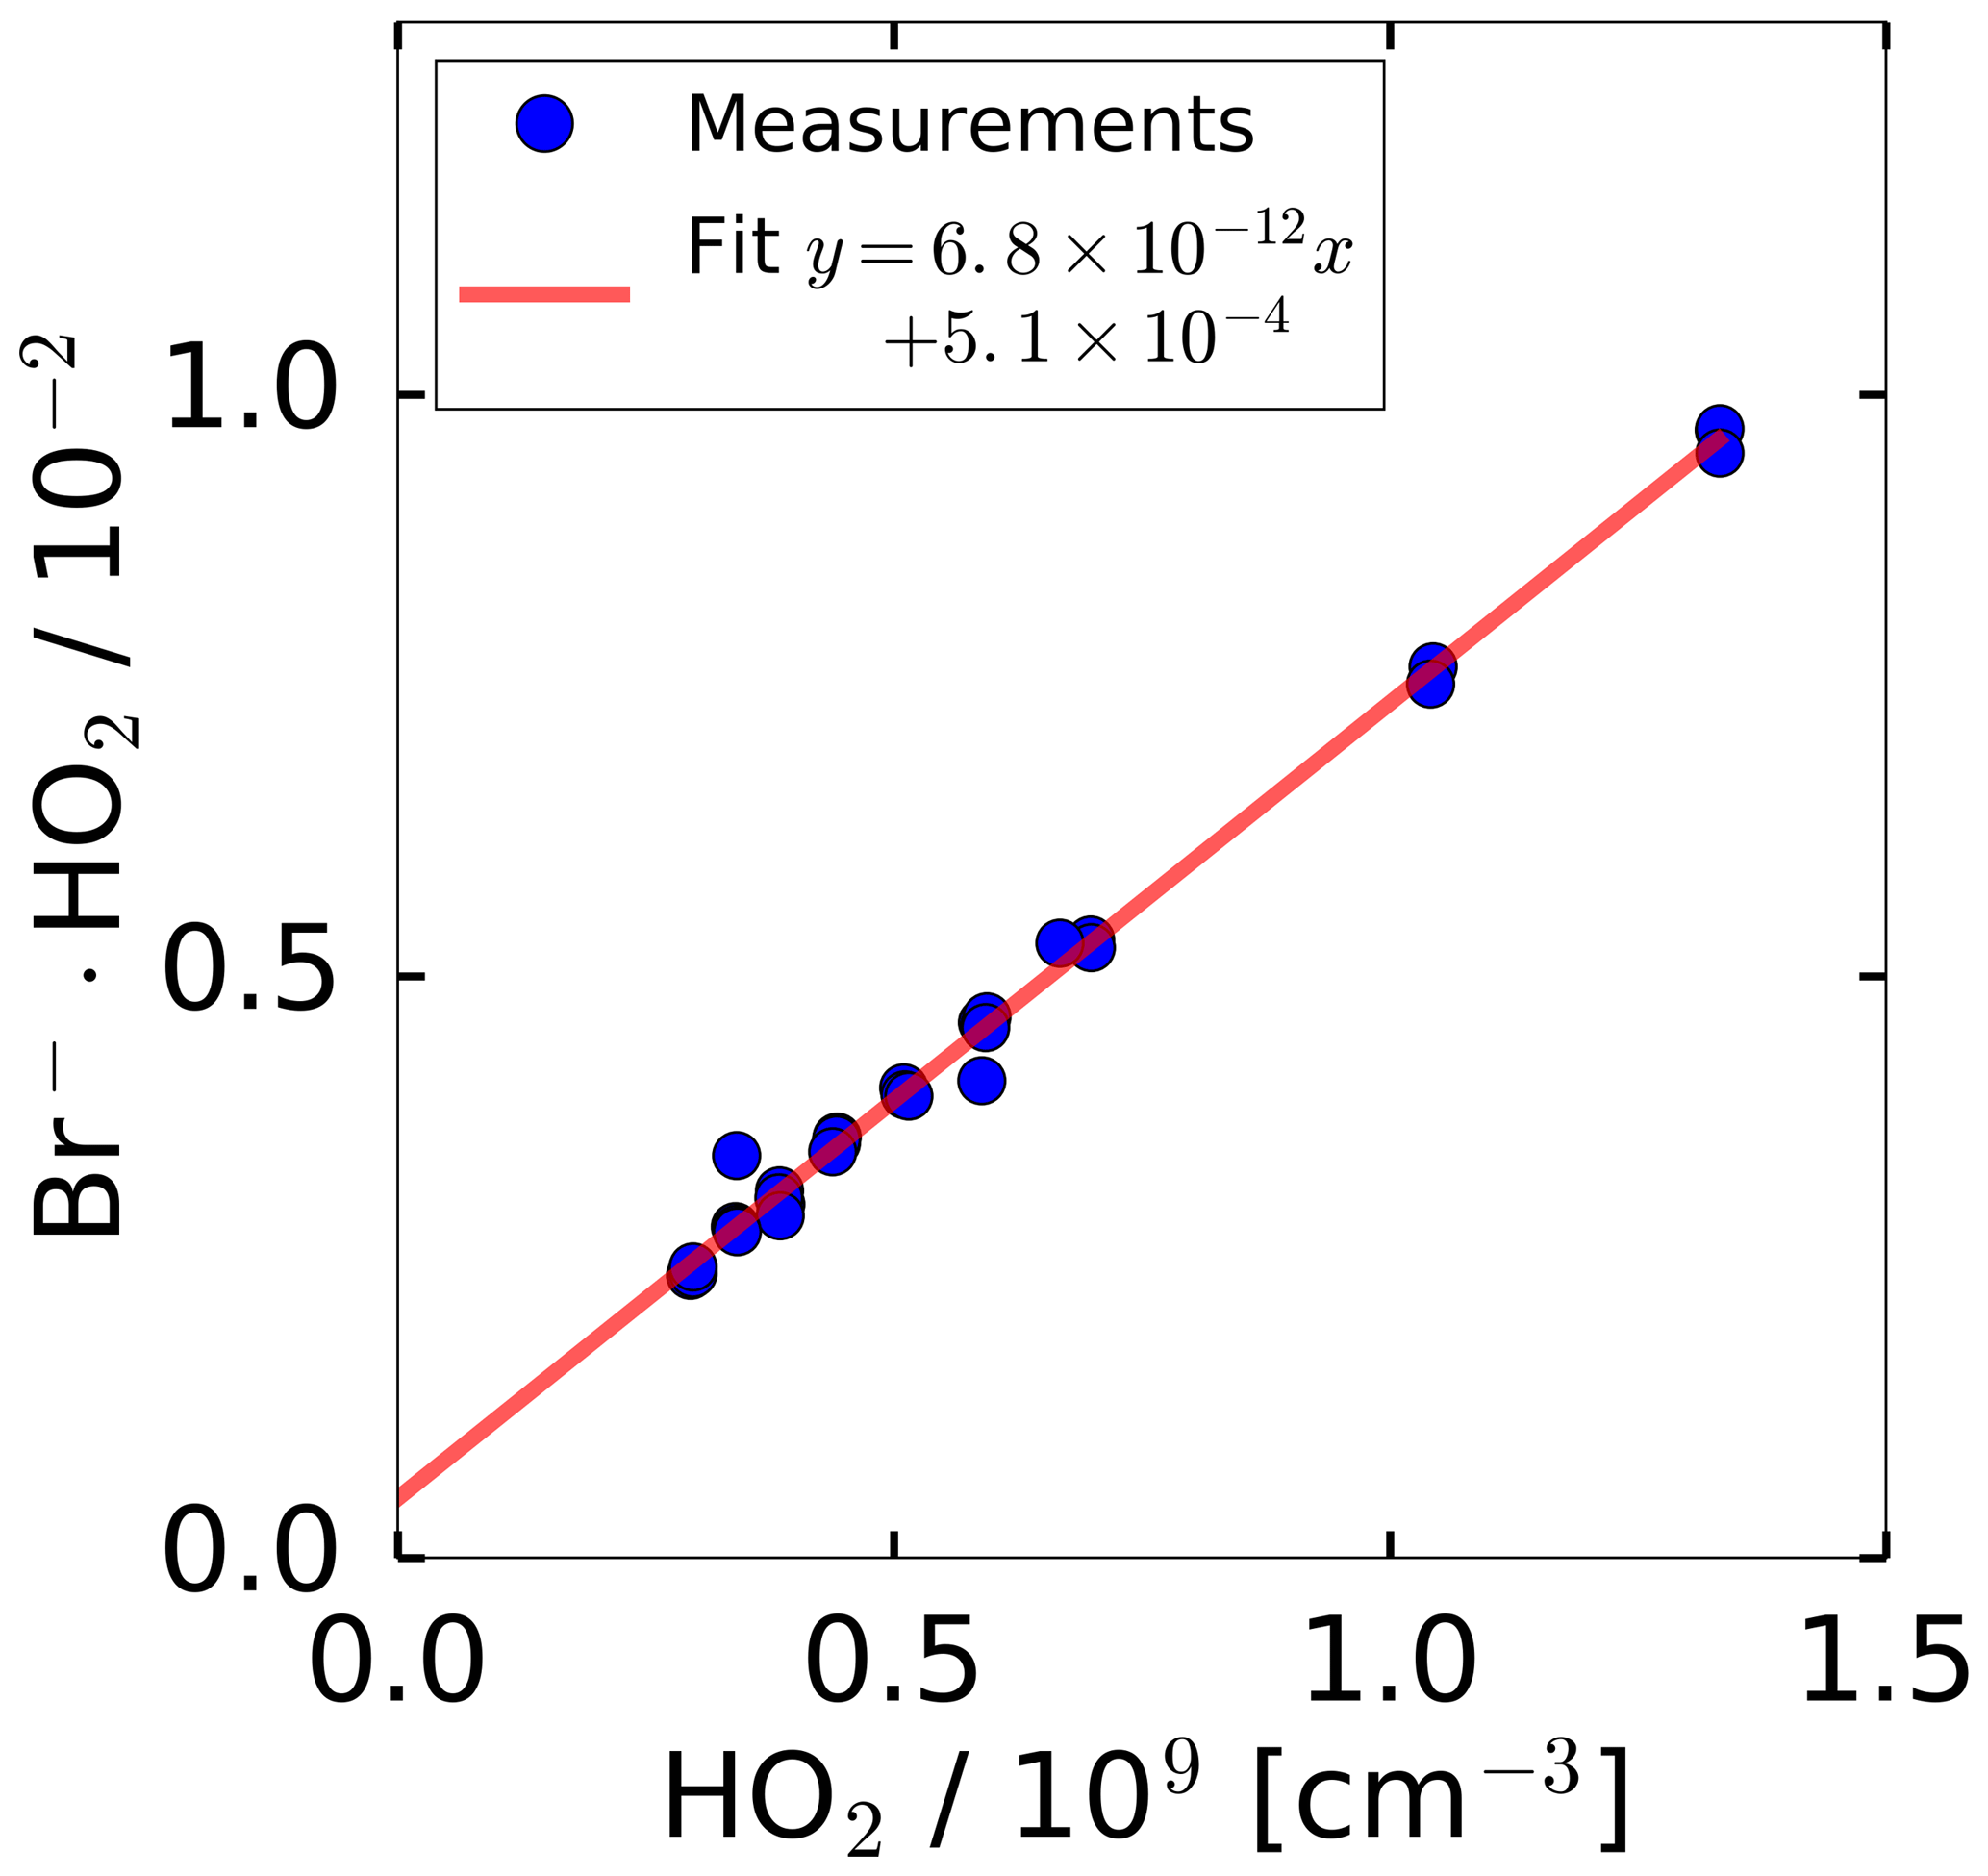
Figure 2Count rate of ion cluster (m∕z 112) normalised to the primary ion Br− (m∕z 79) during sampling from the HO2 calibration source. The HO2 concentration provided by the source was varied by attenuating the radiation of the 185 nm radiation used to photolyse water. The water vapour mixing ratio was kept constant. The error bars are smaller than the symbols in the figure.
3.2 Instrument sensitivity
The possible dependence of the HO2 detection sensitivity on the concentration of the gaseous water vapour mixing ratio was studied using two different radical sources. The water-dependent calibration factor is defined by Eq. (1), where c represents the instrument sensitivity that depends on the water concentration.
One of the radical sources is described in Sect. 2.4. Keeping the UV flux of the photolysis lamp constant, different HO2 concentrations were produced by varying the water-vapour mixing ratio between 0.1 % and 1.2 %. As the HO2 concentration provided by the calibration can be accurately calculated for different water mixing ratios, the influence of water on the HO2 detection sensitivity could be investigated. Measurements under dry conditions were not possible, because the calibration source needs water to generate HO2.
For low water-vapour concentrations, ozonolysis of 2,3-dimethyl-2-butene was used as a radical source. For that purpose, the alkene was added in a concentration of 30 ppbv to a mix of synthetic air and 200 ppbv ozone. The radical source (with photolysis lamp switched off) was used as a flow tube to overflow the inlet of the instrument with this gas mixture. A total of 0.2 % CO was added to scavenge OH radicals produced from the ozonolysis reaction by a fast conversion of OH to HO2. The water mixing ratio was altered during the ozonolysis experiment from 0.0 % to 0.6 %. Assuming that the HO2 concentration from the ozonolysis is constant, the relative change in the signal gives the relative change of the instrument sensitivity. Absolute sensitivities were derived by scaling the HO2 signals from the ozonolysis experiment to the concentration derived by the water-dependent calibration from the radical source by multiplication with a constant factor.

Figure 3Measured HO2 sensitivity as a function of the water mixing ratio in two experiments. For the calibration, HO2 was produced by the radical source while varying the water-vapour concentration which causes a change in the HO2 radical concentration. During the ozonolysis experiment, HO2 was produced from the ozonolysis of 2,3-dimethyl-2-butene, which is independent of the water vapour mixing ratio. The red line shows a third-order polynomial fit applied to the calibration data for the range of water vapour mixing ratios higher than 0.1 %.
Figure 3 shows the sensitivity determined for each water vapour mixing ratio, showing a decreasing sensitivity with increasing water vapour mixing ratio for atmospheric relevant water mixing ratios higher than 0.1 %. The water-dependent decrease in sensitivity is nearly linear for this range of water vapour mixing ratios. For water vapour mixing ratios of less than 0.1 %, the sensitivity drops quickly by a factor of 7 under dry conditions compared to the maximum sensitivity at a 0.1 % water vapour mixing ratio.
Two effects contribute to the water dependence: the initial increase of sensitivity (below 0.1 % H2O) comes from the stabilising effect of H2O. Br− adds H2O, forming a loosely bound complex of ; then, the complex reacts with HO2 according to the forward Reaction (R2). The steady decrease of sensitivity by a factor of 2 when the H2O mixing ratio is further increased to 1.2 % comes from the back reaction of Reaction (R2).
The water vapour dependence of the sensitivity can be parameterised by a third-order polynomial (Eq. 2) for water vapour mixing ratios higher than 0.1 %. This is typically sufficient for atmospheric conditions. At lower water vapour mixing ratios the parameterisation in Eq. (3) provides a good approximation. Such low water vapour mixing ratios were present in the chamber experiments after flushing the chamber before an experiment started.
S is the signal normalised by the primary ion, a, b, c, d are the fit parameters, and H2O is the absolute water vapour mixing ratio. During the series of chamber experiments presented in Sect. 3.5, calibrations were done in between the experiments. In the middle of the series of experiments (6 June), settings of the instrument were tuned, changing the sensitivity of the instrument. In total six calibrations were performed.
To gain sensitivity, the wall contact was reduced by directly sampling via a nozzle into the ion flow tube in the instrument used here. The ion flow tube was further optimised for length and pressure to improve the sensitivity for HO2. Basically, the ion flow tube used during this study (130 mm length) was compared to a similar ion flow tube with a length of 200 mm. However, this resulted in 50 % less sensitivity at 120 hPa, which has been identified as the optimal pressure in terms of sensitivity. Finally, the flows were optimised to gain the maximum amount of sensitivity. Further sensitivity can be gained by combining both isotopic signals for the data analysis, as already mentioned by Sanchez et al. (2016).
For the chamber experiments, the chamber air was humidified at the beginning of each experiment. At that time, no HO2 is expected to be present in the chamber. Therefore, the signal caused by the constant HO2 background changes with the water vapour dependence of the instrument sensitivity (see next section) and could be used to determine the relative change of the sensitivity of water vapour for an individual experiment during this measurement campaign. All HO2 data from the chamber experiments shown in Sect. 3.5 were evaluated by applying this procedure.
As shown in Fig. 3, the instrument response to the change of the water-vapour concentration is similar to both methods of radical production. In addition, the instrument's sensitivity under dry conditions could be tested in the ozonolysis case showing that the instrument sensitivity drops by nearly an order of magnitude in the absence of water vapour. Because of the fast drop of the instrument's sensitivity for water vapour mixing ratios below 0.1 %, it is beneficial to add water vapour to the ion flow tube under very dry conditions of sampled air to maintain a high instrument sensitivity.
Sanchez et al. (2016) used a similar approach to calibrate their instrument via photolysis of water, but they used water mixing ratios in the pptv range to keep HO2 concentrations in an atmospheric range. They used purified air for the calibration source. This study uses synthetic air (purity 99.9999 %).
Sanchez et al. (2016) found a constant sensitivity for water vapour mixing ratios between 0.2 % and 0.8 %, whereas a 30 % decrease is observed here. Only for one sensitivity measurement at a 0.06 % water mixing ratio is an increased sensitivity of approximately 50 % reported by Sanchez et al. (2016). The reason for this different behaviour is not clear, but one may speculate that the design of the ion flow tube and inlet nozzle might impact the collision probability of ion clusters. The relative change of the instrument's sensitivity as conditions become drier is not reported in Sanchez et al. (2016), so it is not clear if the sensitivity drops for dry conditions in their instruments as observed here.
3.3 Precision and uncertainty of the HO2 measurement
To determine the instrument's limit of detection, the Allan deviation was calculated from 2 h of measurements, when no HO2 was present. The signals of both masses at which HO2 is detected (112 and 114) were taken into account for this analysis. The background signal was equivalent to 1×10⁸ molecules cm−3 and the count rate of the primary Br ion was 1×10⁵ counts s−1. The sensitivity during the measurement was cm3, giving a count rate of 80 counts s−1 (=4800 counts min−1) for the background signal. Poisson statistics predict a noise that correlates to the square root of the counts, which fits well with the results of the Allan division plot shown in Fig. 4. This correlates to a signal with an expected noise of 70 counts that gives a 1σ limit of detection of 0.015×10⁸ molecules cm−3 for 60 s integration time. This is slightly better than the 1σ level of detection of 0.06×10⁸ molecules cm−3 reported for the instrument in Sanchez et al. (2016).

Figure 4Allan deviation plot derived from sampling a constant HO2 concentration of 1×10⁸ HO2 molecules cm−3 over 5 h. The Allan deviation demonstrates the precision of measurements depending on the integration time. The red line indicates the behaviour of the Allan deviation if the noise is only limited by Gaussian noise.
Uncertainties are caused by the calibration, which makes the major contribution of the measurement uncertainty with ±10 % (1σ) (Holland et al., 2003). The stability of the background signal in the measurements taken here was ±12 %, giving an upper limit to the additional uncertainty from the stability of the subtracted background signal. Similar uncertainties are obtained by Sanchez et al. (2016).
3.4 Instrumental background
The instrumental background was characterised in experiments where the inlet was overflowed with humidified synthetic air. This was done either using the radical source as a flow tube when the UV lamp was off or during experiments in SAPHIR when only humidified synthetic air was present in the chamber. As shown in Fig. 5, the background signal changes in a similar way with water vapour for both experimental conditions. The shape of the water vapour dependence is consistent with the assumption that a constant HO2 concentration ( molecules cm−3) is internally produced in the instrument, which is detected according to the water vapour dependence of the instrument sensitivity discussed above. Nevertheless, Fig. 5 shows that the background was up to 20 % lower in the laboratory measurement and the measured background shows a better linearity compared to the chamber measurements. Both backgrounds were calibrated using a water-dependent calibration.
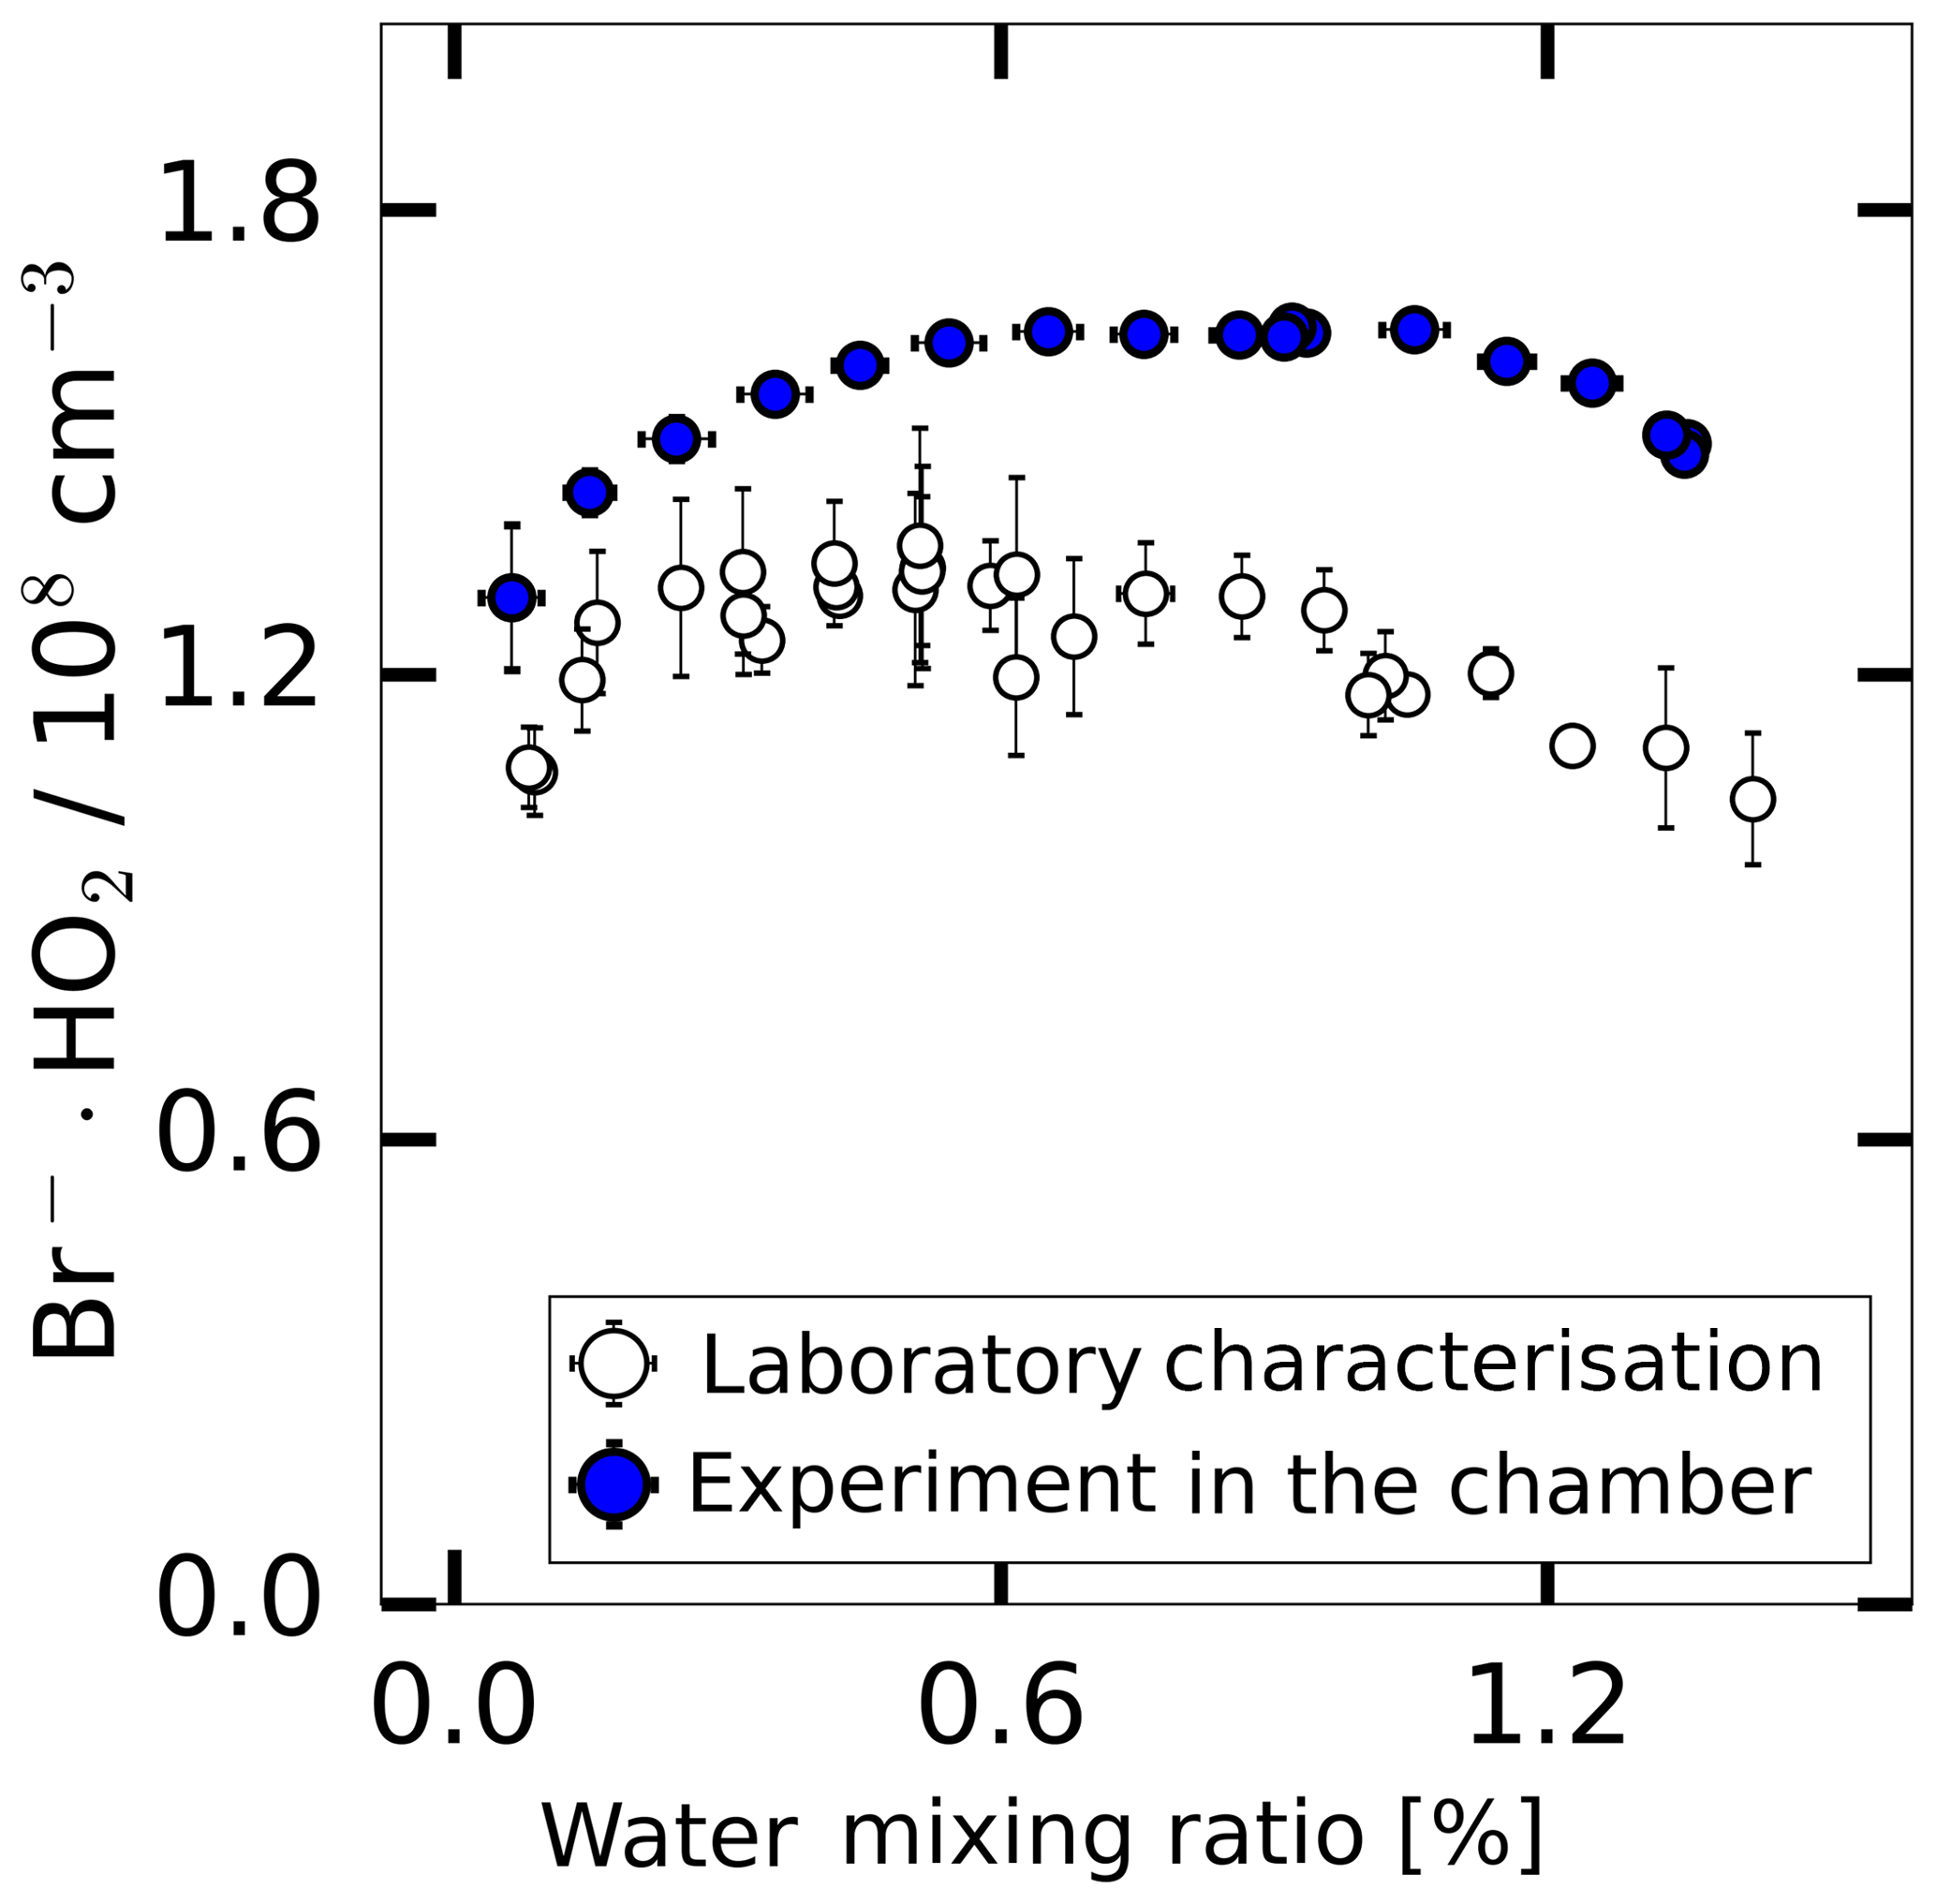
Figure 5The background HO2 measurement in the SAPHIR chamber derived during the humidification of the clean chamber and the background measured during the laboratory calibration supplied with humidified synthetic air.
The background can be subtracted from the measured HO2 concentration after applying the water-vapour-dependent calibration factor. The value of the background needs to be regularly determined. As reported by other CIMS instruments that detect radicals (Berresheim et al., 2000; Sanchez et al., 2016), the radicals can be produced by the ion source. Therefore, this is the likely reason for the observed background signal. For chamber experiments reported here, the background signal was measured in the clean dark chamber at the start of each experiment. No trend of the background signal over a period of 2 months was observed. The day-to-day variability of the background (in total 16 experiments) was within a range of ±12 % during 2 months of measurements at the chamber.
Sanchez et al. (2016) also described a constant HO2 source which causes a background. A HO2 titration experiment (Sanchez et al., 2016) confirmed that HO2 is internally produced, which has been discussed for other radical measurements using a CIMS approach (Berresheim et al., 2000). Sanchez et al. (2016) determined an instrument background of at least 4 pptv HO2, which compares well with the background of 6 pptv HO2 that has been found during the experiments in the SAPHIR chamber.
Potential interference from ozone
Ozone is known to be an interference in some HO2 LIF instruments due to the photolysis of O3 by the 308 nm excitation laser (Holland et al., 2003). In order to test whether ozone can also cause an interference in the CIMS detection of HO2, laboratory experiments were performed. Ozone was added to humidified synthetic air (water vapour mixing ratios 0.3 % and 2.6 %). For both conditions no increase of the CIMS background signal could be observed for ozone mixing ratios of up to 400 ppbv. Details of the experiment are shown in the Supplement. Results are consistent with the laboratory characterisation experiments performed by Sanchez et al. (2016) for their Br− CIMS instrument.
During experiments in the SAPHIR chamber, instrument background effects can only be determined for periods of the experiments without the presence of reactants, when no HO2 was present. A time series for a typical experiment is shown in Fig. 6. Typically, ozone was added in a concentration of 100 to 200 ppbv. Although no artefacts were found in the laboratory characterisation, an increase in the background upon ozone addition was observed in 2 of the 12 experiments in SAPHIR. For these two experiments, the chamber was first humidified and ozone was added afterwards. The increased background appears as an increased intercept of 2.3×10⁸ and 1.0×10⁸ HO2 molecules cm−3 in the linear regression between LIF and CIMS HO2 data for the experiments of 21 and 26 June (Fig. 7), respectively. The data from the LIF instrument were corrected for a maximum ozone interference of 0.05×10⁸ and 0.15×10⁸ HO2 molecules cm−3 on these days, respectively. This correction is much smaller than the HO2 concentration observed by the CIMS instrument, so it can be discounted that the differences are due to systematic errors in the data of the LIF instrument.
In the correlation plot (Fig. 8), which includes all experiments, this additional background was subtracted. The increased background due to the ozone addition will be investigated in further chamber experiments. Because no direct connection between the occurrence of this interference and chemical conditions in the experiments is observed, it might be related to instrumental effects that could vary with time, such as the cleanness of the ion flow tube walls. This indicates that regular checks of the background signal are needed to take an appropriate background correction into account.
3.5 Comparison of CIMS and LIF HO2 measurements
The HO2 production was initiated with the injection of ozone and the opening of the chamber roof providing UV light to the chamber, as shown in the time series in Fig. 6. An addition of CO further boosted the HO2 production, which dropped upon the closing of the roof. After the injection of water, the CIMS shows a stable signal with a small offset. During the experiment, the LIF and CIMS data reveal a good correlation. This experiment was performed without the addition of a VOC, as well as two other experiments marked with “None” in Fig. 7. Nevertheless, HO2 is produced in these experiments, because OH and NO are produced from the photolysis of HONO released from the Teflon chamber walls in the sunlit chamber (Rohrer et al., 2005). The reaction of small concentrations of OH reactants formed under these conditions in the chamber leads to the formation of HO2 (Rohrer et al., 2005).
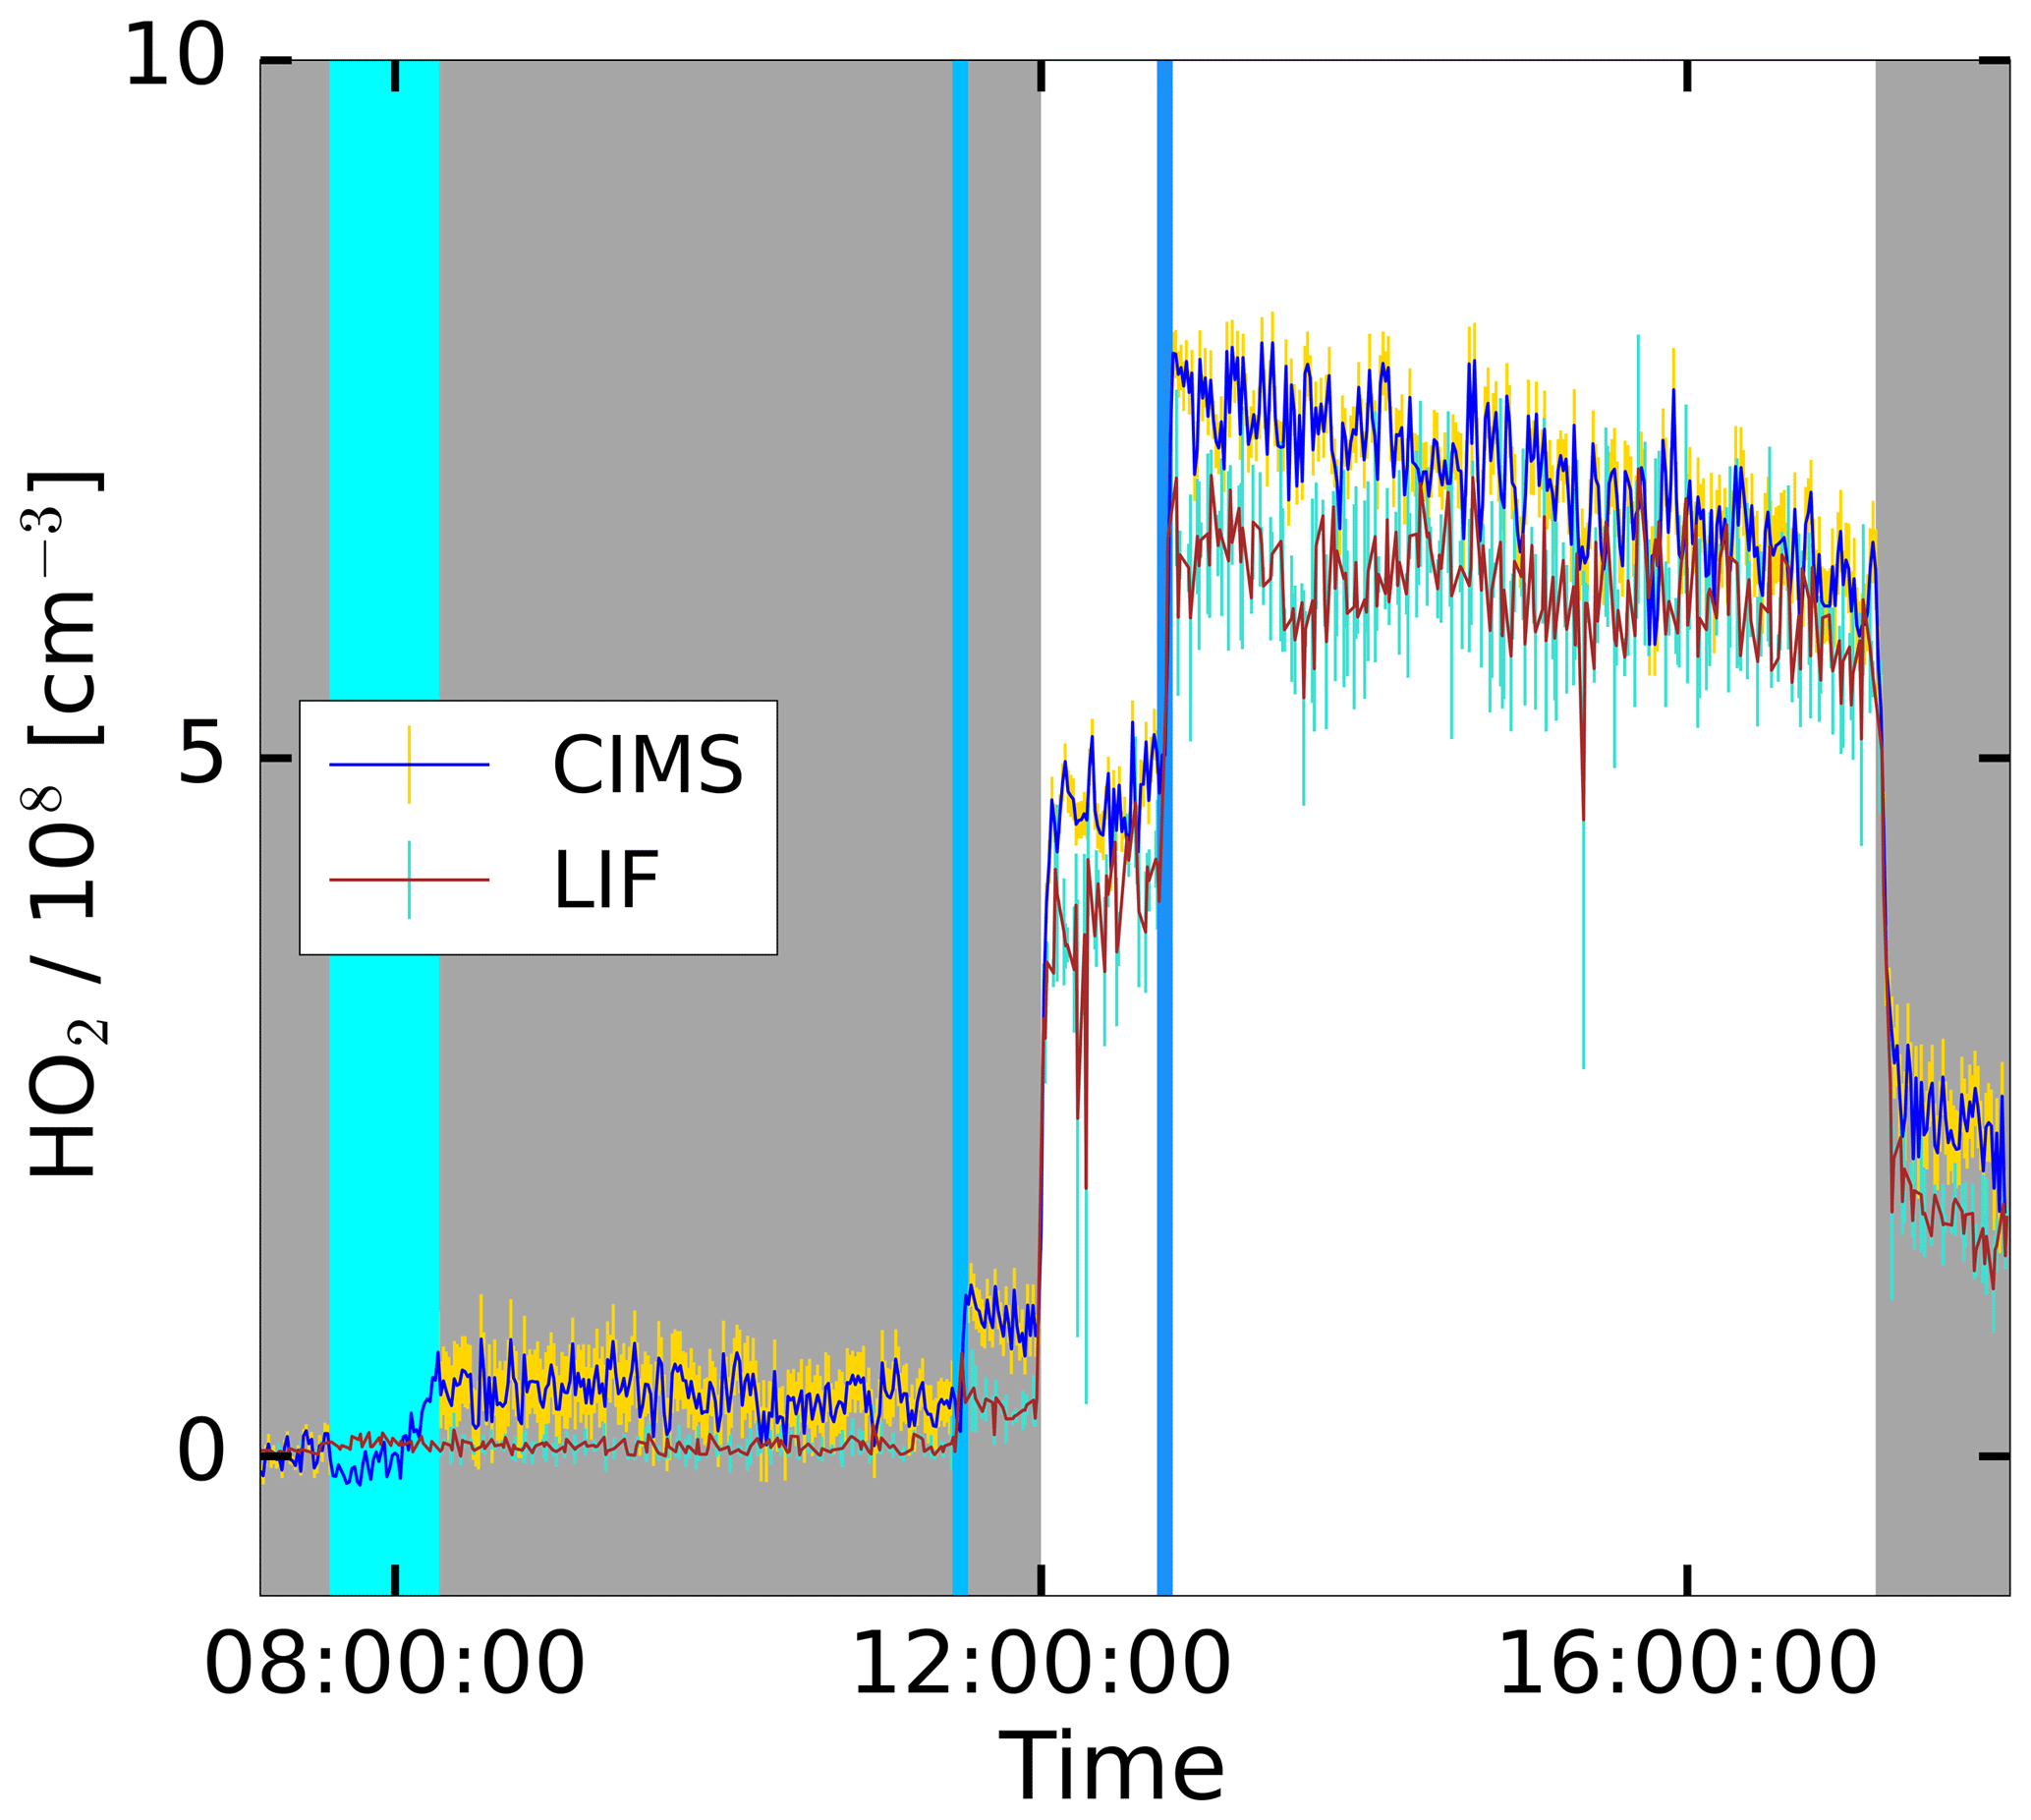
Figure 6Time series plot for the HO2 concentrations measured by the CIMS and the LIF instrument during the photo-oxidation experiment on 19 June 2017 in the SAPHIR chamber. The grey shaded area indicates that the chamber roof was closed. The vertical lines show the injection time of additional reactants in cases involving water the injection took longer, indicated by a broader line.
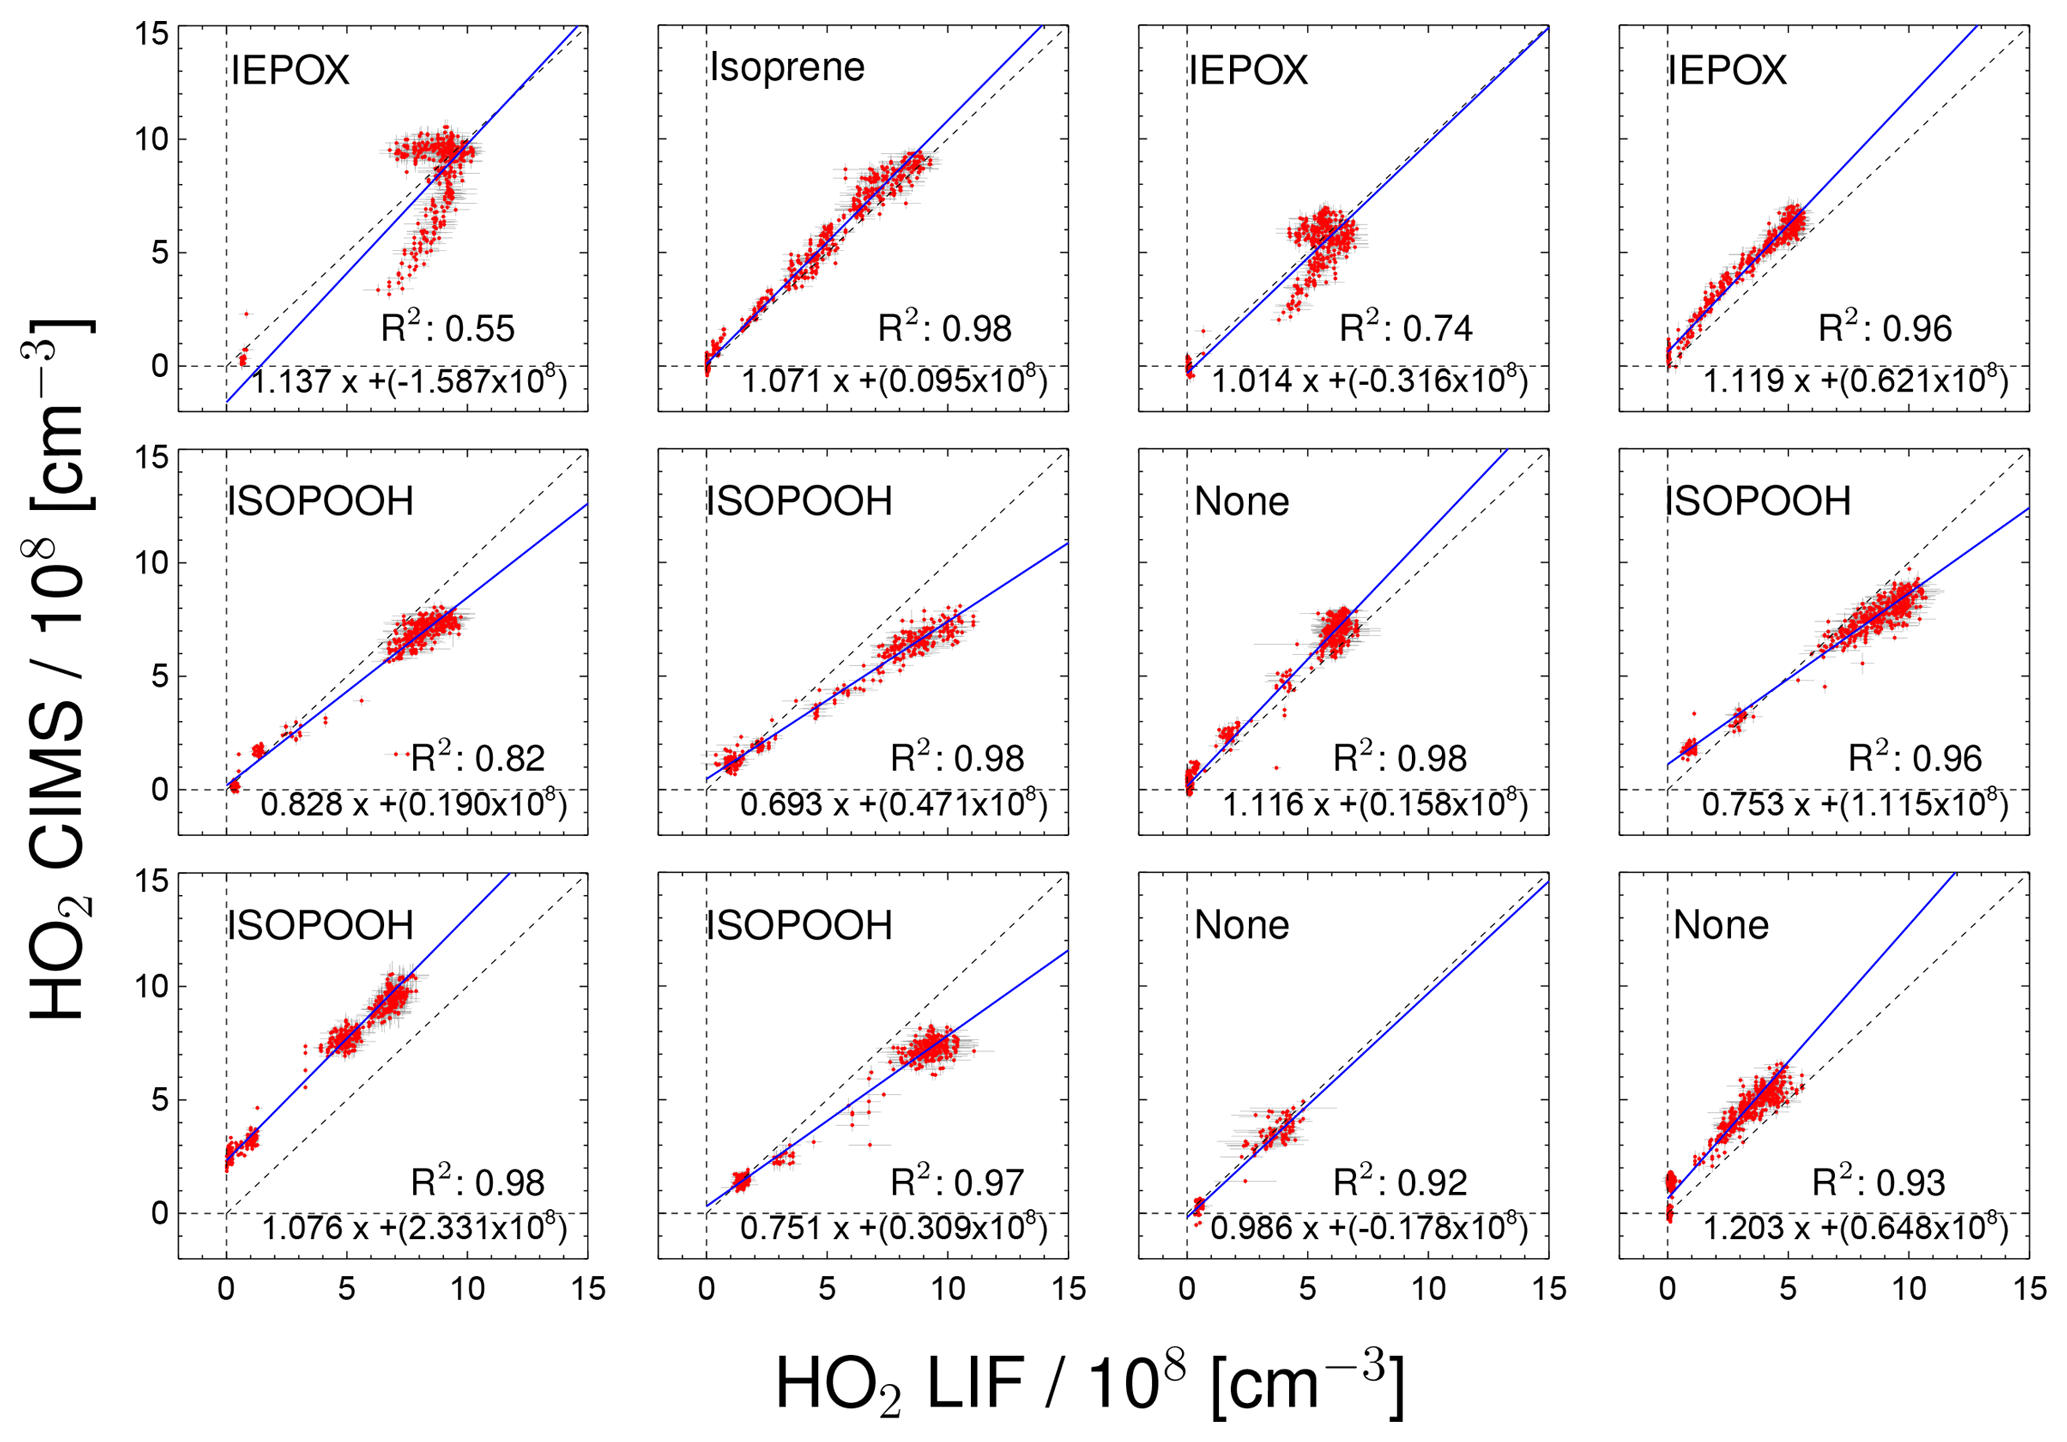
Figure 7Correlation between HO2 measurements taken by the CIMS and LIF instruments for individual chamber experiments. Labels in the plots indicate the specific VOC injected into the chamber. For the regression line shown in blue a least-squares fit was performed.
Figure 7 displays the correlation between HO2 measurements by the CIMS and the LIF instrument for all of the day-long photo-oxidation experiments in the SAPHIR chamber performed in this study. The results of a linear regression analysis are given in Fig. 7, which takes errors in both HO2 measurements into account (Press et al., 1992). The chemical composition was varied between experiments by changing, for example, the NO mixing ratio. The different chemical conditions during the experiments allow for checking for potential interferences. High NO concentrations of up to 3 ppbv were reached by injecting NO to the chamber air on 31 May and 2 June, and up to 80 ppbv NO2 was added on 23 June. The NO2 interference test was performed by injecting NO2 in the dark, dry chamber. No further photochemistry experiments were done on that particular day. No systematic change in the relation between HO2 related to the presence of NO or NO2 from the two instruments is observed in these cases (Fig. 7), which is in agreement with the results of Sanchez et al. (2016). In general, no interference from VOCs (Isoprene, ISOPOOH and reaction products) is observed, except for experiments with IEPOX injections. IEPOX was detected on m∕z 197 as a ion cluster, but the instrument was not calibrated for IEPOX. Nevertheless, this mass trace can be used to correct the HO2 measurement for the interference from IEPOX; the correction is shown in the Supplement. The correlation plots shown in Fig. 7 are corrected for the IEPOX interference. The HO2 signal observed during the injection of IEPOX can be attributed to the interference from IEPOX, because IEPOX was injected in the dark chamber so that no HO2 is expected to be present. This gives the relationship between the signal observed at the IEPOX mass (m∕z 197) and the interference signal from IEPOX at the HO2 mass (m∕z 112). During the photo-oxidation of IEPOX, when HO2 is also present, the interference signal can be subtracted from the signal at the HO2 mass by scaling the initial interference signal by the relative change on m∕z 197. The correction improves the correlation of the CIMS and the LIF, but the absolute agreement is still not as good (slope of the regression 0.93; coefficient of determination 0.79) compared to the other experiments. The corrections are on the order of or smaller than the HO2 measurements, and works best for the experiment with the lowest IEPOX concentration. A plausible reason for the IEPOX interference found seems to be a fragmentation of the cluster ion in the transfer stage of the instrument. The fragmentation could be initiated by acceleration of the ions in the electrostatic field causing collisions with other molecules. It is worth noting that IEPOX concentrations were at least 10 times higher than typically found in the atmosphere. Kaiser et al. (2016) found IEPOX concentrations of 1 ppbv during a campaign in a forest in the south-eastern US where isoprene, the precursor of IEPOX, was the dominant organic species. Therefore, no significant interference for atmospheric measurements by the CIMS instrument is expected from IEPOX.
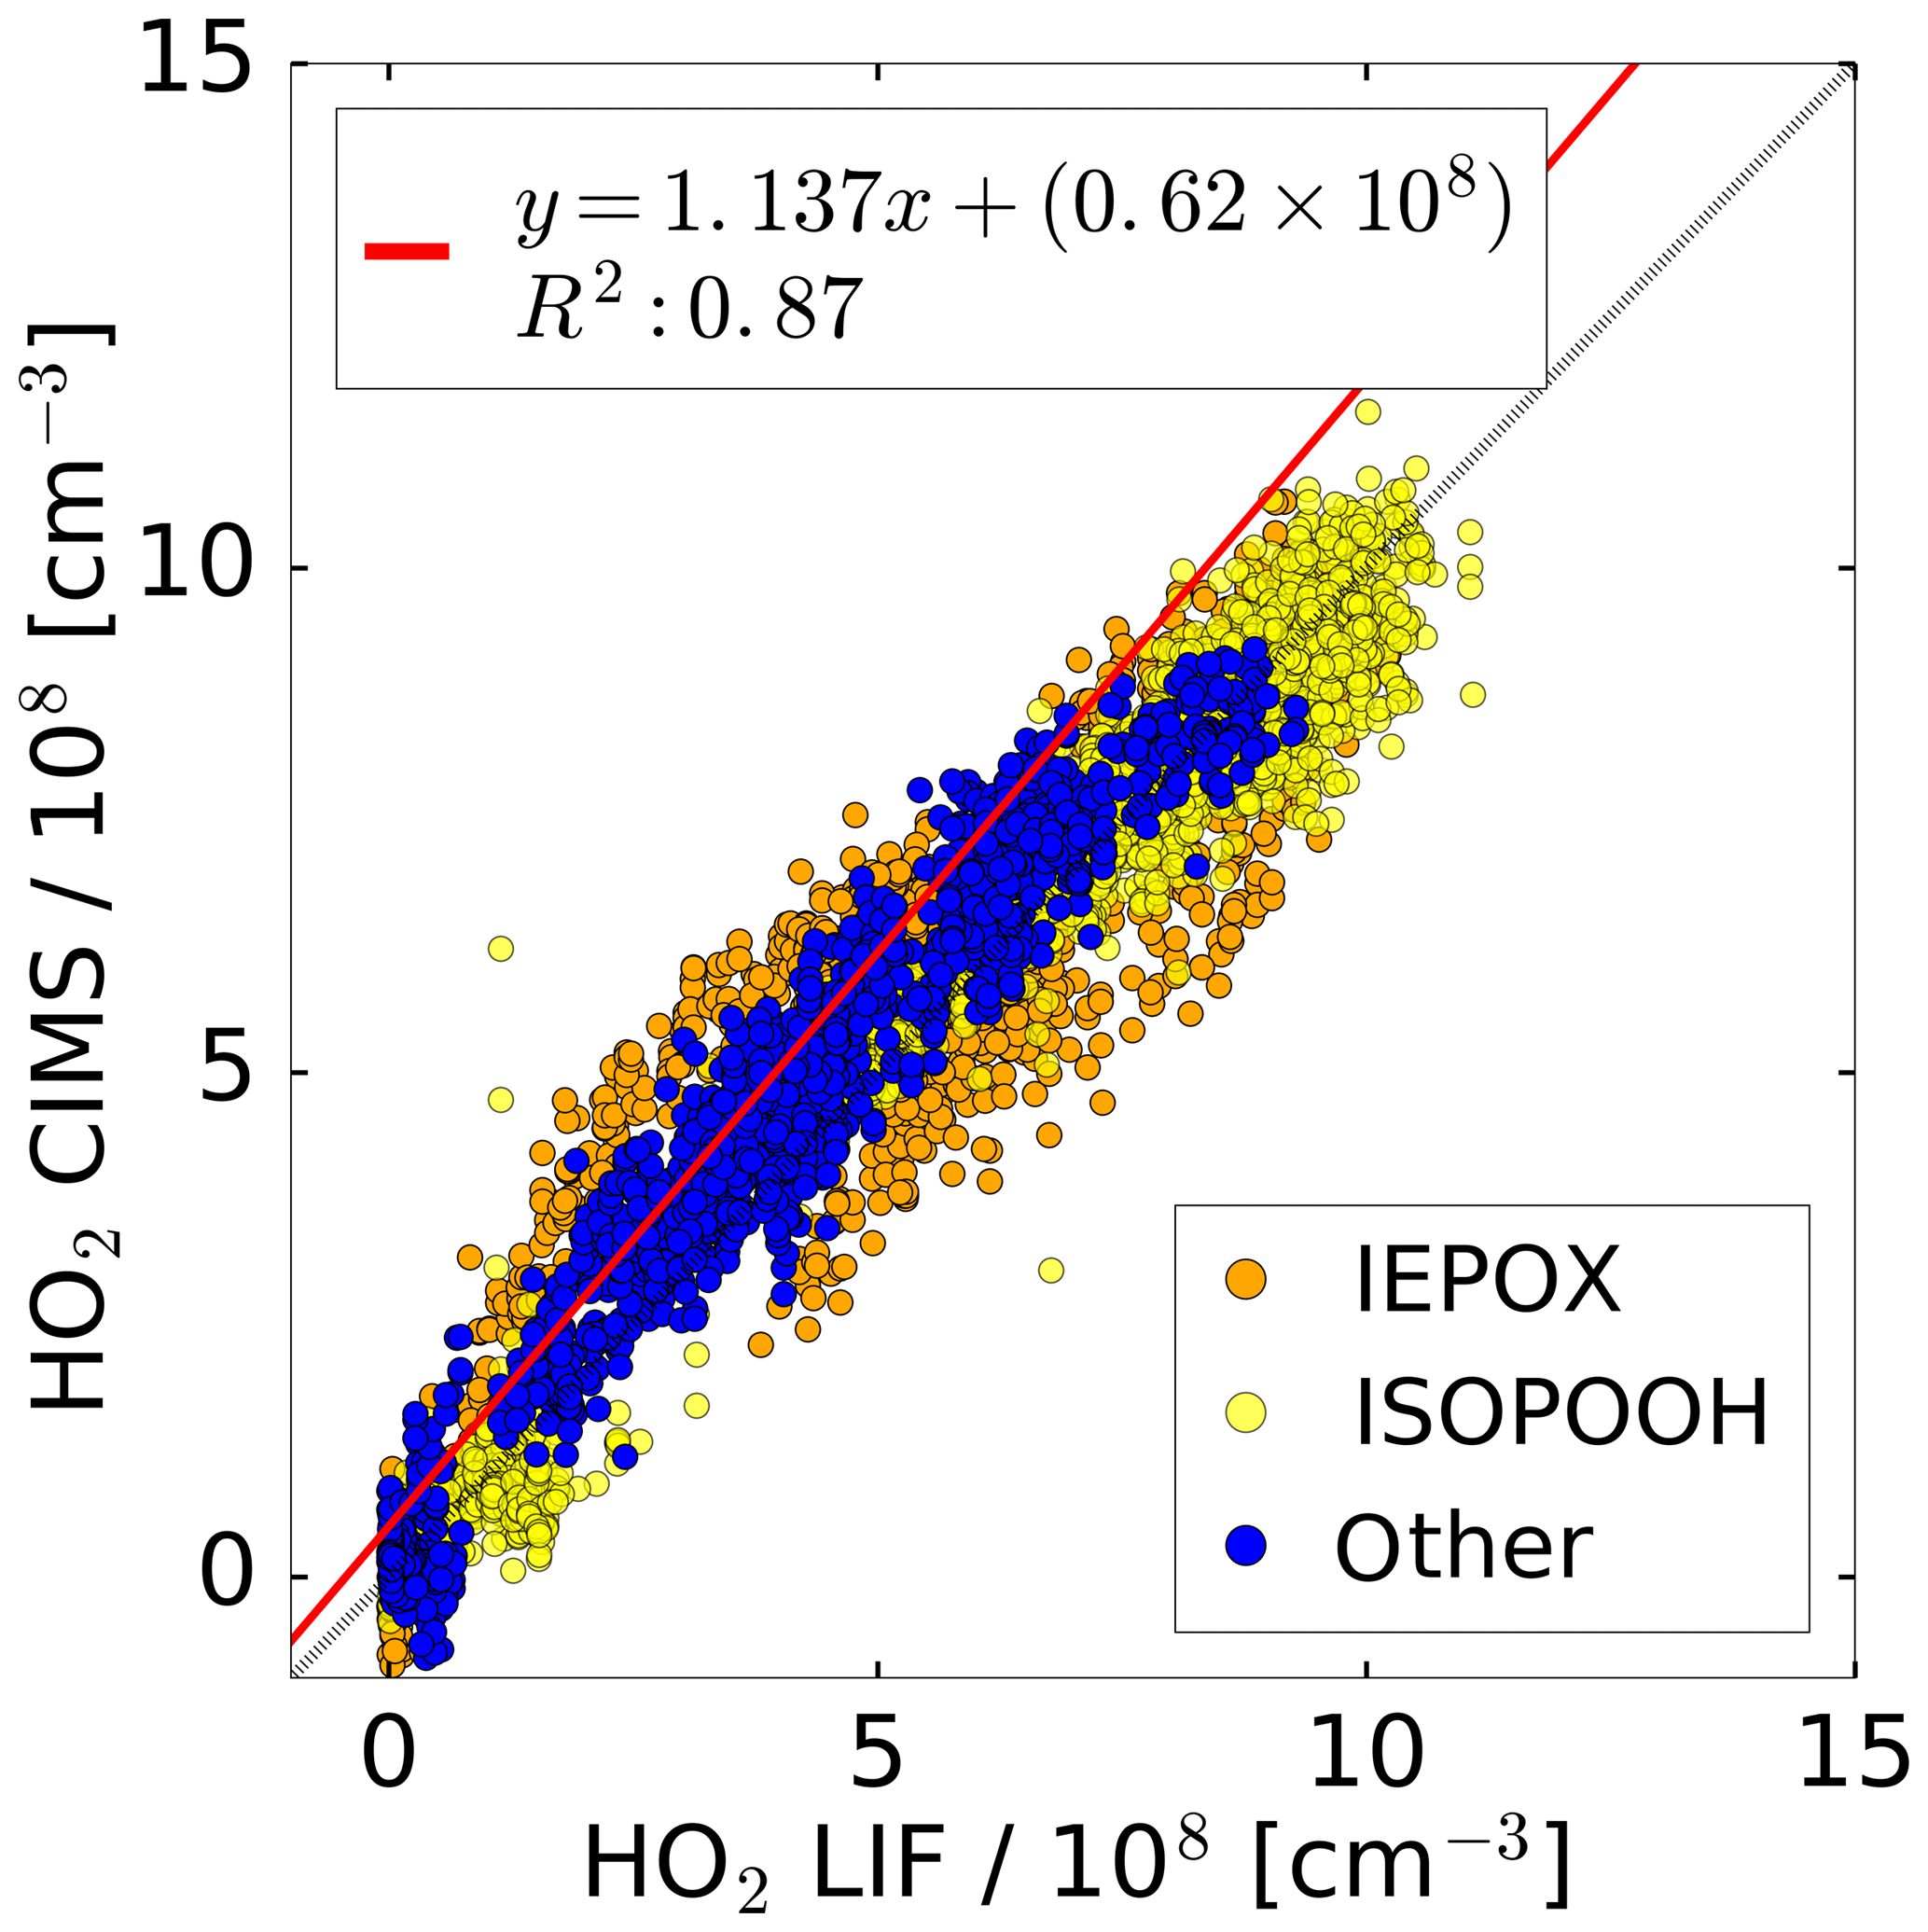
Figure 8Correlation plot for the HO2 concentrations measured by the CIMS and the LIF instrument of all photo-oxidation experiments in the SAPHIR chamber. A linear fit is applied to the subset of data excluding experiments with IEPOX and ISOPOOH.
During experiments with ISOPOOH, HO2 measurements by the LIF instrument showed higher values than HO2 measured by the CIMS instrument (slope of the linear regression of 0.88; coefficient of correlation R2=0.68). Further experiments will be needed to investigate if ISOPOOH could cause an interference in the LIF instrument. Like in the case of IEPOX, ISOPOOH concentrations were much higher (several ppbv) than typically found in the atmosphere (less than 1 ppbv Kaiser et al., 2016), so no significant impact for atmospheric conditions is expected.
All concurrent measurements of the two instruments for HO2 by CIMS and LIF in the photo-oxidation experiments are summarised in the correlation plot shown in Fig. 8. In general, the correlation fit shows that there is an excellent agreement of both instruments giving a slope of linear regression of 1.14 and the linear correlation coefficient R2 is 0.87. Experiments investigating the photo-oxidation of IEPOX and ISOPOOH are colour-coded and are excluded from the correlation fit. However, using all data for the correlation fit leads to a similar result (slope of linear regression of 0.86; coefficient of correlation R2=0.89).
Correlation of individual experiments (Fig. 7, e.g. 21 and 26 June) gives partly significant offsets in the regression analysis of up to 2.3×108 cm−3 HO2. One possible reason could be the procedure of how the water vapour dependence of the instrument sensitivity was derived. This was done by using the measured signal at the mass during the humidification process of the clean chamber air, when no HO2 was present. However, the chamber air might not be perfectly mixed during the humidification, because water vapour from boiling water is introduced at one location in the chamber together with a high flow of synthetic air. Because the water measurement in the chamber used for the determination of the CIMS background signal and the CIMS inlet are at different locations in the chamber, the water measurement is potentially not accurate for the water vapour sampled by the CIMS for these conditions, meaning that small systematic errors in the background determination cannot be excluded. In the future, the water vapour dependence of the background will be determined independently from the chamber experiment, so that it can be expected that such effects will not be relevant.
Chemical ionisation was applied to measure atmospheric HO2 concentrations using bromide ions as a reagent. Laboratory characterisation experiments and measurements in the atmospheric simulation chamber SAPHIR in Jülich were used to check the instrument's applicability for atmospheric measurements.
The performance of the CIMS instrument is comparable with measurements from a laser-induced fluorescence instrument. A water vapour dependence of the instrument sensitivity needs to be taken into account in the evaluation of data because the sensitivity of the instrument changes by roughly a factor of 2 for atmospheric water-vapour concentrations between 0.2 % and 1.4 %. A water-vapour-dependent background signal is also observed. The change of the background signal with increasing water vapour, however, is explained by the water vapour dependence of the sensitivity. Therefore, the assumption is that the background consists of constant HO2 production in the instrument. This background was stable within ±12 % during 2 months of measurements and no further trend was identified. The background signal and the instrument detection sensitivity needs to be quantified on a daily basis.
No significant interference from trace gases NO, NO2, O3, CO, isoprene, and ISOPOOH were found for atmospheric conditions. Only non-atmospheric high IEPOX concentrations of several ppbv artificial signals were found that scaled with the IEPOX concentration. The HO2 measurements correlate well with the LIF measurements. A slope of the linear regression of 1.07 was determined and a linear correlation coefficient (R2) of 0.87 was found.
HO2 was directly sampled through a nozzle into a custom-built ion flow tube which was optimised for sensitivity. The sensitivity reached is equal to 0.005×10⁸ HO2 cm−3 for 106 cps of bromide and 60 s of integration time, which is approximately 3 times higher than the sensitivity for a similar instrument by Sanchez et al. (2016). Therefore, the instrument is suitable for measuring typical HO2 concentrations in the atmosphere. Furthermore, the Allan deviation shows that the instrument follows Gaussian noise allowing an integration time of up to 500 s.
Chemical conditions in the chamber experiments were close to atmospheric conditions regarding the most important constituents of the atmosphere such as NOx, ozone and water vapour showing the applicability of the instrument under these conditions. First, future deployment in field experiments will be done with concurrent HO2 measurements by the LIF instrument, so that so far unrecognised potential interference can be identified.
For the future application of the instrument in field and chamber experiments, various modifications of the instrument will be tested to improve the sensitivity and minimise the background signal: a sheath flow of pure nitrogen in the ion flow tube could help to prevent wall contact of radicals in the ion flow tube. Further, the sheath flow could be humidified to prevent sensitivity loss for measurements performed in dry conditions. Additionally, an automated calibration will be installed to perform daily calibration and background measurements. An important benefit of the instrument is that the bromide ion chemistry can also detect organic compounds, specifically oxygenated organic compounds and acids. Therefore, the technique provides a valuable tool for future field and simulation experiments.
Data from the experiments in the SAPHIR chamber used in this work are available on the EUROCHAMP data home page (https://data.eurochamp.org/, Fuchs, 2018).
The supplement related to this article is available online at: https://doi.org/10.5194/amt-12-891-2019-supplement.
The authors declare that they have no conflict of interest.
This project has received funding from the European Research Council (ERC) (SARLEP grant agreement no. 681529) and from
the European Research Council (EC) under the European Union's Horizon 2020 research and innovation programme (Eurochamp 2020 grant agreement no. 730997).
Thanks to Patrick Veres from NOAA for the discussion and first ideas regarding the HO2 CIMS detection.
We like to acknowledge Jean Rivera-Ros from the Harvard University and David Reimer from our institute for the
synthesis of the VOCs used for this study.
Thanks to Martin Breitenlechner, Alexander Zaytsev, and Frank N. Keutsch from the School of Engineering and Applied
Sciences and Department of Chemistry and Chemical Biology, Harvard University,
Cambridge, MA, USA, for the PTR measurements performed.
The article processing charges for this open-access
publication were covered by a
Research
Centre of the Helmholtz Association.
Edited by: Lisa Whalley
Reviewed by: two anonymous referees
Andrés-Hernández, M. D., Stone, D., Brookes, D. M., Commane, R., Reeves, C. E., Huntrieser, H., Heard, D. E., Monks, P. S., Burrows, J. P., Schlager, H., Kartal, D., Evans, M. J., Floquet, C. F. A., Ingham, T., Methven, J., and Parker, A. E.: Peroxy radical partitioning during the AMMA radical intercomparison exercise, Atmos. Chem. Phys., 10, 10621–10638, https://doi.org/10.5194/acp-10-10621-2010, 2010. a
Apel, E. C., Brauers, T., Koppmann, R., Bandowe, B., Boßmeyer, J., Holzke, C., Tillmann, R., Wahner, A., Wegener, R., Brunner, A., Jocher, M., Ruuskanen, T., Spirig, C., Steigner, D., Steinbrecher, R., Gomez Alvarez, E., Müller, K., Burrows, J. P., Schade, G., Solomon, S. J., Ladstätter-Weißenmayer, A., Simmonds, P., Young, D., Hopkins, J. R., Lewis, A. C., Legreid, G., Reimann, S., Hansel, A., Wisthaler, A., Blake, R. S., Ellis, A. M., Monks, P. S., and Wyche, K. P.: Intercomparison of oxygenated volatile organic compound measurements at the SAPHIR atmosphere simulation chamber, J. Geophys. Res.-Atmos., 113, D20307, https://doi.org/10.1029/2008JD009865, 2008. a
Berresheim, H., Elste, T., Plass-Dülmer, C., Eiseleb, F., and Tannerb, D.: Chemical ionization mass spectrometer for long-term measurements of atmospheric OH and H2SO4, Int. J. Mass Spectrom., 202, 91–109, https://doi.org/10.1016/S1387-3806(00)00233-5, 2000. a, b
Burkert, J., Andrés-Hernández, M.-D., Stöbener, D., Burrows, J. P., Weissenmayer, M., and Kraus, A.: Peroxy radical and related trace gas measurements in the boundary layer above the Atlantic Ocean, J. Geophys. Res.-Atmos., 106, 5457–5477, https://doi.org/10.1029/2000jd900613, 2001. a
Caldwell, G., Masucci, J., and Ikonomou, M.: Negative ion chemical ionization mass spectrometry-binding of molecules to bromide and iodide anions, J. Mass Spectrom., 24, 8–14, https://doi.org/10.1002/oms.1210240103, 1989. a
Cantrell, C. A., Stedman, D. H., and Wendel, G. J.: Measurement of atmospheric peroxy radicals by chemical amplification, Anal. Chem., 56, 1496–1502, https://doi.org/10.1021/ac00272a065, 1984. a
Clemitshaw, K. C., Carpenter, L. J., Penkett, S. A., and Jenkin, M. E.: A calibrated peroxy radical chemical amplifier for ground-based tropospheric measurements, J. Geophys. Res.-Atmos., 102, 25405–25416, https://doi.org/10.1029/97jd01902, 1997. a
Dorn, H.-P., Apodaca, R. L., Ball, S. M., Brauers, T., Brown, S. S., Crowley, J. N., Dubé, W. P., Fuchs, H., Häseler, R., Heitmann, U., Jones, R. L., Kiendler-Scharr, A., Labazan, I., Langridge, J. M., Meinen, J., Mentel, T. F., Platt, U., Pöhler, D., Rohrer, F., Ruth, A. A., Schlosser, E., Schuster, G., Shillings, A. J. L., Simpson, W. R., Thieser, J., Tillmann, R., Varma, R., Venables, D. S., and Wahner, A.: Intercomparison of NO3 radical detection instruments in the atmosphere simulation chamber SAPHIR, Atmos. Meas. Tech., 6, 1111–1140, https://doi.org/10.5194/amt-6-1111-2013, 2013. a
Edwards, G. D., Cantrell, C. A., Stephens, S., Hill, B., Goyea, O., Shetter, R. E., Mauldin, R. L., Kosciuch, E., Tanner, D. J., and Eisele, F. L.: Chemical ionization mass spectrometer instrument for the measurement of tropospheric HO2 and RO2, Anal. Chem., 75, 5317–5327, https://doi.org/10.1021/ac034402b, 2003. a
Fuchs, H.: Eurochamp Database of Atmospheric Simulation Chamber Studies, available at: https://data.eurochamp.org/, last access: June 2018. a
Fuchs, H., Brauers, T., Dorn, H.-P., Harder, H., Häseler, R., Hofzumahaus, A., Holland, F., Kanaya, Y., Kajii, Y., Kubistin, D., Lou, S., Martinez, M., Miyamoto, K., Nishida, S., Rudolf, M., Schlosser, E., Wahner, A., Yoshino, A., and Schurath, U.: Technical Note: Formal blind intercomparison of HO2 measurements in the atmosphere simulation chamber SAPHIR during the HOxComp campaign, Atmos. Chem. Phys., 10, 12233–12250, https://doi.org/10.5194/acp-10-12233-2010, 2010. a, b
Fuchs, H., Bohn, B., Hofzumahaus, A., Holland, F., Lu, K. D., Nehr, S., Rohrer, F., and Wahner, A.: Detection of HO2 by laser-induced fluorescence: calibration and interferences from RO2 radicals, Atmos. Meas. Tech., 4, 1209–1225, https://doi.org/10.5194/amt-4-1209-2011, 2011. a, b, c, d, e
Fuchs, H., Dorn, H.-P., Bachner, M., Bohn, B., Brauers, T., Gomm, S., Hofzumahaus, A., Holland, F., Nehr, S., Rohrer, F., Tillmann, R., and Wahner, A.: Comparison of OH concentration measurements by DOAS and LIF during SAPHIR chamber experiments at high OH reactivity and low NO concentration, Atmos. Meas. Tech., 5, 1611–1626, https://doi.org/10.5194/amt-5-1611-2012, 2012. a
Green, T. J., Reeves, C. E., Fleming, Z. L., Brough, N., Rickard, A. R., Bandy, B. J., Monks, P. S., and Penkett, S. A.: An improved dual channel PERCA instrument for atmospheric measurements of peroxy radicals, J. Environ. Monitor., 8, 530–536, https://doi.org/10.1039/b514630e, 2006. a
Hanke, M., Uecker, J., Reiner, T., and Arnold, F.: Atmospheric peroxy radicals: ROXMAS, a new mass-spectrometric methodology for speciated measurements of HO2 and RO2 and first results, Int. J. Mass Spectrom., 213, 91–99, https://doi.org/10.1016/S1387-3806(01)00548-6, 2002. a
Harrison, A. G.: Chemical ionization mass spectrometry, CRC press, Boca Raton, 2nd edn., https://doi.org/10.1006/rwsp.2000.0357, 1992. a
Hastie, D. R., Weissenmayer, M., Burrows, J. P., and Harris, G. W.: Calibrated chemical amplifier for atmospheric ROx measurements, Anal. Chem., 63, 2048–2057, https://doi.org/10.1021/ac00018a029, 1991. a
Holland, F., Hofzumahaus, A., Schäfer, J., Kraus, A., and Pätz, H.-W.: Measurements of OH and HO2 radical concentrations and photolysis frequencies during BERLIOZ, J. Geophys. Res.-Atmos., 108, 8246, https://doi.org/10.1029/2001jd001393, 2003. a, b, c
Hornbrook, R. S., Crawford, J. H., Edwards, G. D., Goyea, O., Mauldin III, R. L., Olson, J. S., and Cantrell, C. A.: Measurements of tropospheric HO2 and RO2 by oxygen dilution modulation and chemical ionization mass spectrometry, Atmos. Meas. Tech., 4, 735–756, https://doi.org/10.5194/amt-4-735-2011, 2011. a, b
Kaiser, J., Skog, K. M., Baumann, K., Bertman, S. B., Brown, S. B., Brune, W. H., Crounse, J. D., de Gouw, J. A., Edgerton, E. S., Feiner, P. A., Goldstein, A. H., Koss, A., Misztal, P. K., Nguyen, T. B., Olson, K. F., St. Clair, J. M., Teng, A. P., Toma, S., Wennberg, P. O., Wild, R. J., Zhang, L., and Keutsch, F. N.: Speciation of OH reactivity above the canopy of an isoprene-dominated forest, Atmos. Chem. Phys., 16, 9349–9359, https://doi.org/10.5194/acp-16-9349-2016, 2016. a, b
Lew, M. M., Dusanter, S., and Stevens, P. S.: Measurement of interferences associated with the detection of the hydroperoxy radical in the atmosphere using laser-induced fluorescence, Atmos. Meas. Tech., 11, 95–109, https://doi.org/10.5194/amt-11-95-2018, 2018. a
Mihele, C. M. and Hastie, D. R.: Optimized Operation and Calibration Procedures for Radical Amplifier-Type Detectors, J. Atmos. Ocean. Tech., 17, 788–794, https://doi.org/10.1175/1520-0426(2000)017<0788:OOACPF>2.0.CO;2, 2000. a
Press, W. H., Teukolsky, S. A., Vetterling, W. T., and Flannery, B. P.: Numerical recipes in C, Cambridge Univ. Press, 2nd edn., 1992. a
Reiner, T., Hanke, M., and Arnold, F.: Atmospheric peroxy radical measurements by ion molecule reaction mass spectrometry: A novel analytical method using amplifying chemical conversion to sulfuric acid, J. Geophys. Res.-Atmos., 102, 1311–1326, https://doi.org/10.1029/96JD02963, 1997. a
Rohrer, F., Bohn, B., Brauers, T., Brüning, D., Johnen, F.-J., Wahner, A., and Kleffmann, J.: Characterisation of the photolytic HONO-source in the atmosphere simulation chamber SAPHIR, Atmos. Chem. Phys., 5, 2189–2201, https://doi.org/10.5194/acp-5-2189-2005, 2005. a, b, c
Sadanaga, Y., Matsumoto, J., Sakurai, K.-i., Isozaki, R., Kato, S., Nomaguchi, T., Bandow, H., and Kajii, Y.: Development of a measurement system of peroxy radicals using a chemical amplification/laser-induced fluorescence technique, Rev. Sci. Instrum., 75, 864–872, https://doi.org/10.1063/1.1666985, 2004. a
Sanchez, J., Tanner, D. J., Chen, D., Huey, L. G., and Ng, N. L.: A new technique for the direct detection of HO2 radicals using bromide chemical ionization mass spectrometry (Br-CIMS): initial characterization, Atmos. Meas. Tech., 9, 3851–3861, https://doi.org/10.5194/amt-9-3851-2016, 2016. a, b, c, d, e, f, g, h, i, j, k, l, m, n, o, p, q, r
Tan, Z., Fuchs, H., Lu, K., Hofzumahaus, A., Bohn, B., Broch, S., Dong, H., Gomm, S., Häseler, R., He, L., Holland, F., Li, X., Liu, Y., Lu, S., Rohrer, F., Shao, M., Wang, B., Wang, M., Wu, Y., Zeng, L., Zhang, Y., Wahner, A., and Zhang, Y.: Radical chemistry at a rural site (Wangdu) in the North China Plain: observation and model calculations of OH, HO2 and RO2 radicals, Atmos. Chem. Phys., 17, 663–690, https://doi.org/10.5194/acp-17-663-2017, 2017. a, b
Veres, P. R., Roberts, J. M., Wild, R. J., Edwards, P. M., Brown, S. S., Bates, T. S., Quinn, P. K., Johnson, J. E., Zamora, R. J., and de Gouw, J.: Peroxynitric acid (HO2NO2) measurements during the UBWOS 2013 and 2014 studies using iodide ion chemical ionization mass spectrometry, Atmos. Chem. Phys., 15, 8101–8114, https://doi.org/10.5194/acp-15-8101-2015, 2015. a
Whalley, L. K., Blitz, M. A., Desservettaz, M., Seakins, P. W., and Heard, D. E.: Reporting the sensitivity of laser-induced fluorescence instruments used for HO2 detection to an interference from RO2 radicals and introducing a novel approach that enables HO2 and certain RO2 types to be selectively measured, Atmos. Meas. Tech., 6, 3425–3440, https://doi.org/10.5194/amt-6-3425-2013, 2013. a
Wood, E. C., Deming, B. L., and Kundu, S.: Ethane-based chemical amplification measurement technique for atmospheric peroxy radicals, Environ. Sci. Tech. Let., 4, 15–19, https://doi.org/10.1021/acs.estlett.6b00438, 2017. a