the Creative Commons Attribution 4.0 License.
the Creative Commons Attribution 4.0 License.
 | 13 Feb 2019
Possible errors in flux measurements due to limited digitalization
Thomas Foken
Wolfgang Babel
Christoph Thomas
Recently reported trends of carbon dioxide uptake pose the question of whether trends may be the result of the limited digitalization of gas analysers and sonic anemometers used in the 1990s. Modifying a 12 bit digitalization and the instrument error reported for the Gill R2 and R3 sonic anemometers found elsewhere, the influence of these deficits in comparison to the now commonly used 16 bit digitalization were quantified. Both issues have an effect only on trace gas fluxes of small magnitude, mainly for the carbon dioxide rather than for the water vapour fluxes. The influence on the annual net ecosystem exchange is negligible, because other errors resulting from gap filling routines, for example, are much larger.


Nowadays, data sets from FLUXNET sites are available and many papers have been published which analyse and compare these data and link them to ecosystems, phenology, regions, and climate (Baldocchi, 2008; Williams et al., 2012; Keenan et al., 2013, 2014; Kutsch and Kolari, 2015; Baldocchi et al., 2016; Babel et al., 2017). Among the factors, which possibly influence the resulting budgets, is the quantification (digitalization) error (Ifeachor and Jervis, 2002), arising from the use of a limited 12 bit digitalization of turbulence data which was the state of the art about 15–20 years ago (Vickers and Mahrt, 1997). This error could introduce spurious trends (Foken, 2017a) and has, up to now, not been investigated thoroughly. The influence of the digitalization error on flux calculations is the topic of this short note. An impact similar to the effect of the digitalization error could have been caused by the instrument error reported for the formerly used Gill R2 and R3 sonic anemometers (now Gill Instruments Ltd, Lymington, UK) before the year 2003 (Foken et al., 2004, found by Christoph Thomas, University of Bayreuth, 2002). The problem was identified when deploying these sonic anemometers for a relaxed eddy accumulation (REA) system, where the vertical wind velocity close to 0.00 m s−1 must be measured accurately to actuate solenoids correctly. The problem was reported to the manufacturer and the firmware was updated. For this study a data set output with 16 bit digitalization will be compared to the same data modified into a 12 bit digitalization.
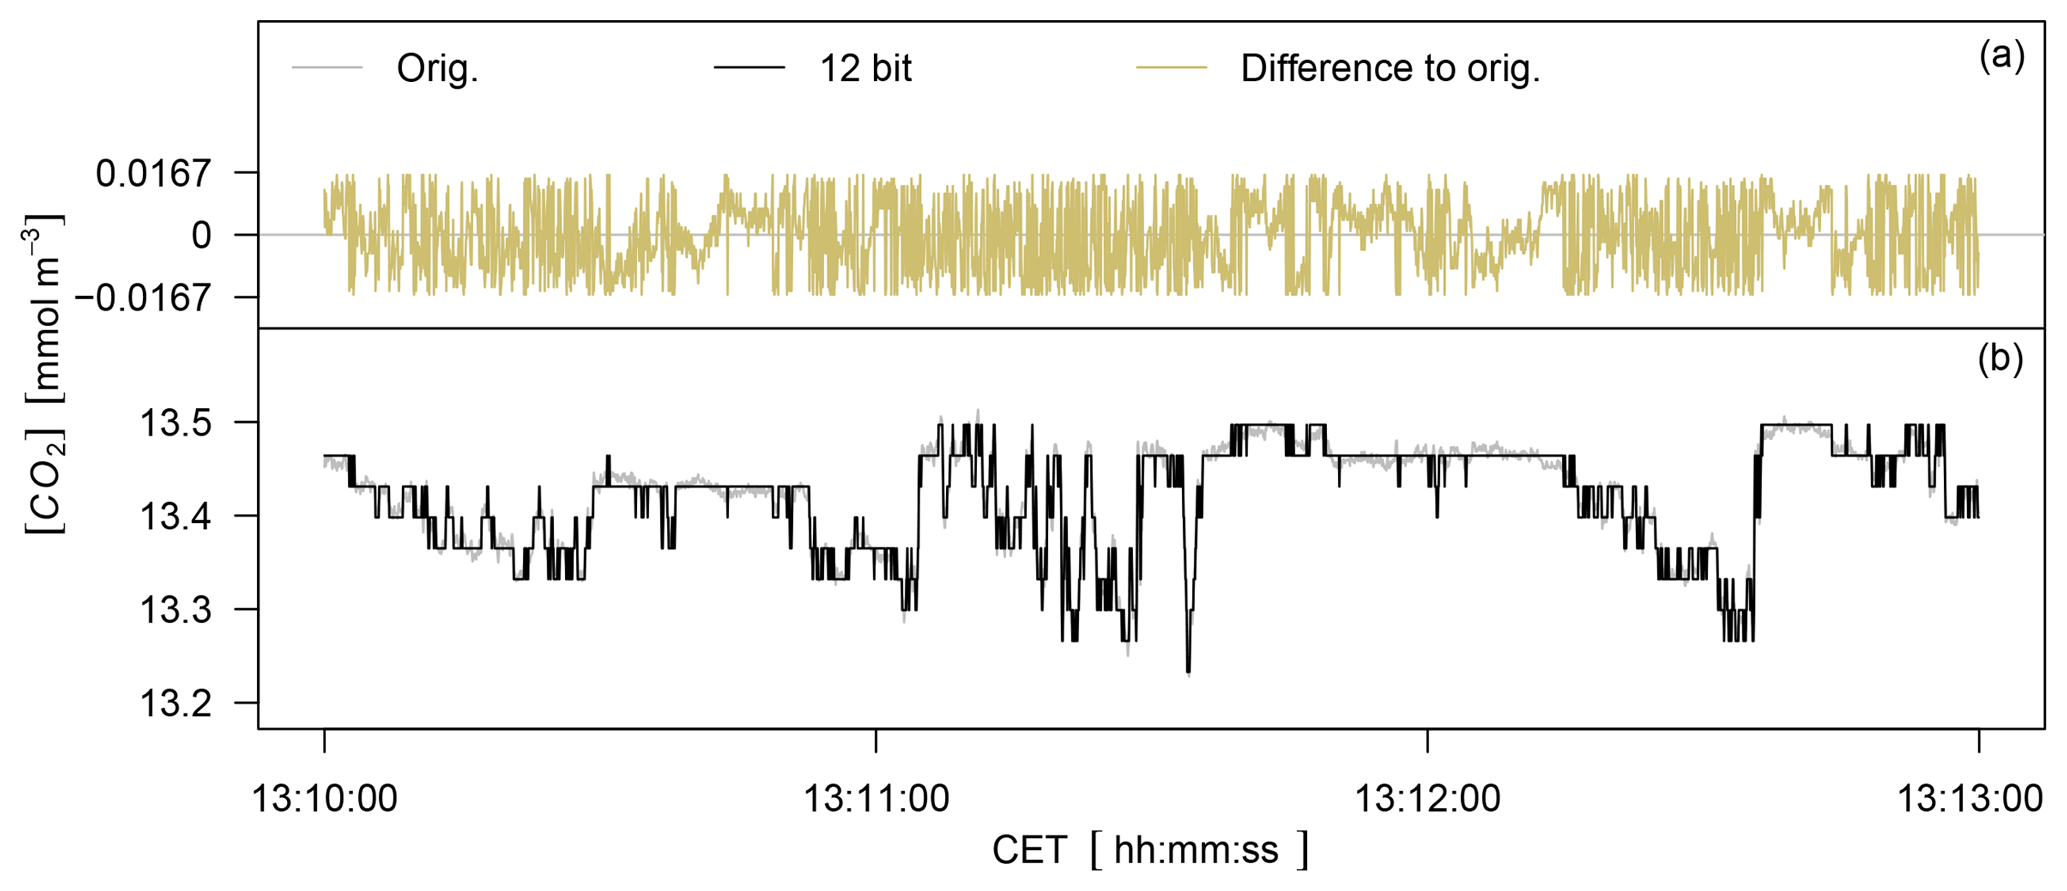
Figure 1Carbon dioxide concentration on 2 August 2012 measured with the LiCor 7500 (orig.) and reduced to 12 bit resolution. The difference between both signals is shown in (a) and both signals show the typical ramp structures above the spruce forest are shown in (b).
2.1 Data sets for the analysis
The data used in this study were collected at the FLUXNET site (DE-Bay) Waldstein-Weidenbrunnen (50∘08′31′′ N, 11∘52′01′′ E, 775 m a.s.l.), which is located in the Fichtelgebirge in the northeast of Bavaria (Germany), where Norway spruce (Picea abies) forests dominate. Measurements of energy and carbon dioxide fluxes started in 1996 on the top of a 32 m high walk-up scaffolding tower. Possibly affected time series are the measurements made with the R2 and R3 sonic anemometer from 1997 to 2006 and the LiCor 6262 gas analyser (LI-COR Inc., Lincoln, NE, USA) from 1997 to 2002. The complete data set was analysed by Babel et al. (2017).
The instrumentation not only at the Waldstein-Weidenbrunnen site, but at all FLUXNET sites, has changed dramatically starting around the year 2000. At this time, the first commercial open-path instruments for carbon dioxide and water vapour concentration measurements became available. Before 2000 only the LiCor 6262 closed-path instruments mainly in combination with Gill R2 and later R3 sonic anemometers (Moncrieff et al., 1997) were used, which only offered a 12 bit signal digitalization, while later devices featured 16 bit digitalization or higher. The digital signal of the LiCor 6262 can be connected to the serial input of a PC or the analog output of the LiCor 6262 can be connected to the input multiplexer of a sonic anemometer (at this time sonic anemometer had a 12 bit digitalization). The latter version was used by Moncrieff et al. (1997) and a simplified electronic circuit is shown therein. The comprehensive electronic circuit of a multiplexer system is shown, for example, in Foken (2017b) and Harrison (2015). The signal resolution of both systems is identical.
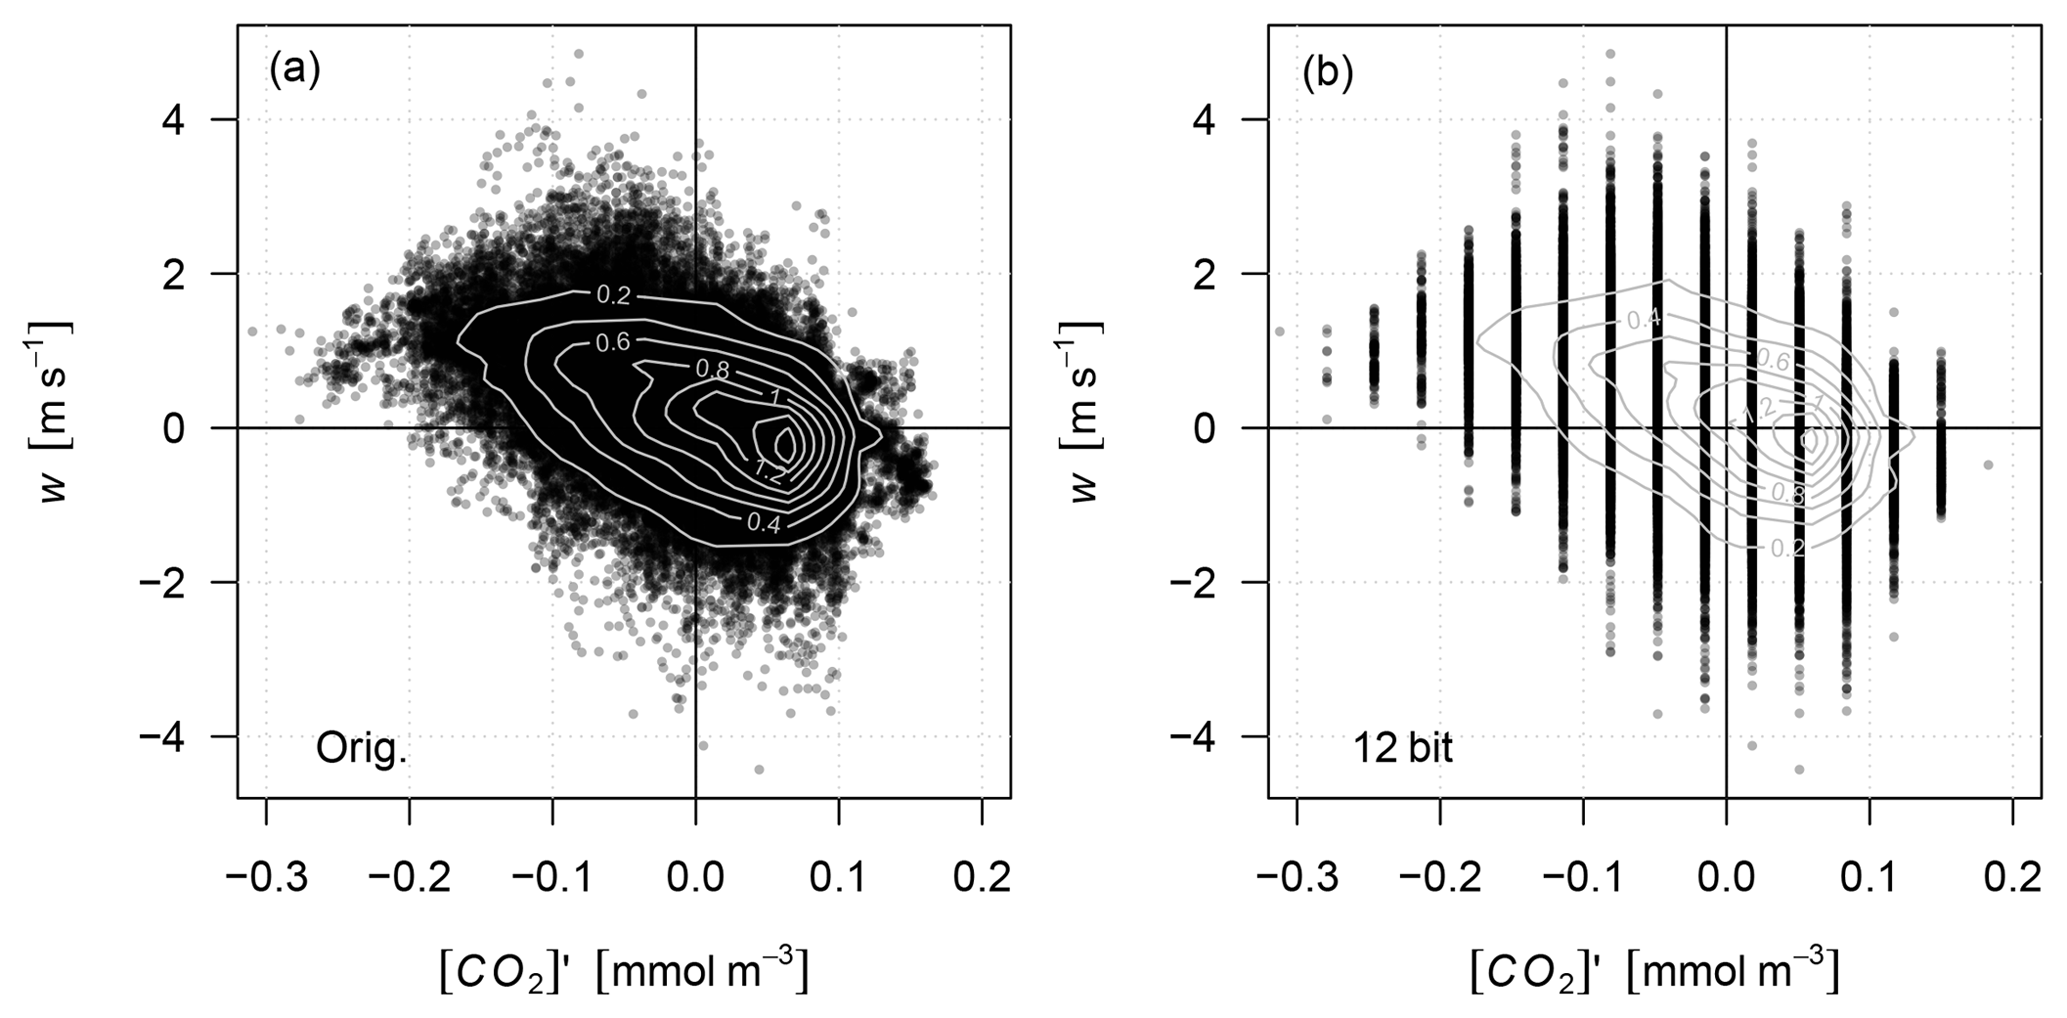
Figure 2Quadrant (hole) analysis of all data points (20 Hz sampling rate) of the vertical wind velocity and the carbon dioxide concentration for 1 h (summer at noon) with 16 bit digitalization (a) and reduced to 12 bit digitalization (b). A normalized density distribution in form of isopleths is included in both figures.
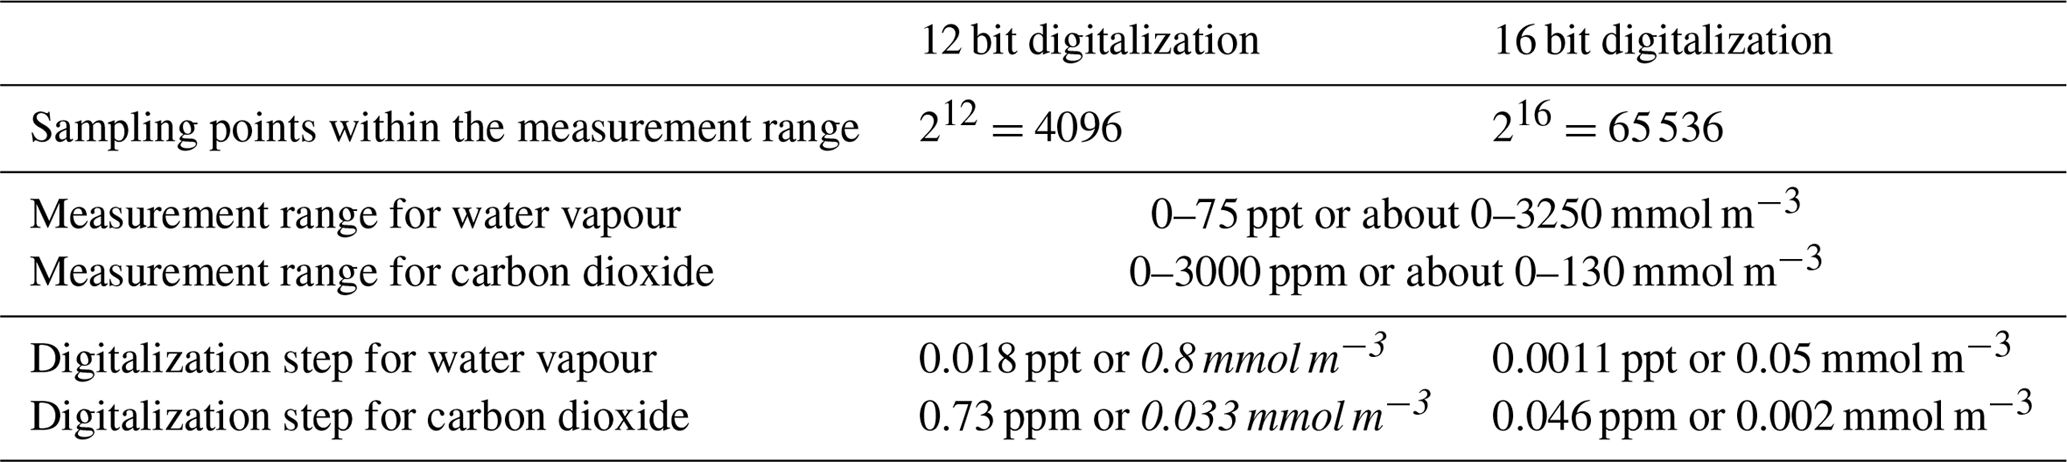
The root mean square noise (possible resolution) of the carbon dioxide channel of LiCor 6262 is about 0.2 ppm and the digitalization step for 12 bit digitalization is much larger with 0.73 ppm (see Table 1). The calculations in this table were done for the full range of the measurement signal which is equivalent to 0–5 V. A reduction in the measurement range could reduce possible errors; however, for some very stable atmospheric stratifications very high carbon dioxide concentrations are possible that can only be measured if the full range is available. For the more modern LiCor 7500 instrument the 16 bit digitalization step is equal to 0.046 ppm (see Table 1), which is only about half of the root mean square noise of about 0.1 ppm. Therefore the digitalization has had no influence on the data since the year 2000.
Table 1Characteristic resolutions for water vapour and carbon dioxide concentrations with 12 bit and 16 bit digitalization. Data in italics were used for the calculation. Parts per thousand is denoted by “ppt”.
1 year of measurements collected during 2012 from the METEK sonic anemometer USA-1 (METEK GmbH Elmshorn, Germany) and the LiCor 7500 gas analyser were used for this study. Turbulent fluxes of carbon dioxide and water vapour were calculated using the internationally tested software package TK3 (Mauder et al., 2008; Fratini and Mauder, 2014; Mauder and Foken, 2015). All necessary corrections and quality checks were applied according to micrometeorological standards (Foken et al., 2012). Coordinate rotation was carried out using the planar-fit method (Wilczak et al., 2001) for each month separately following (Siebicke et al., 2012). The net ecosystem exchange (NEE) is defined as the sum of the vertical eddy-covariance carbon dioxide flux and the change in storage term of the air column below the sensor.
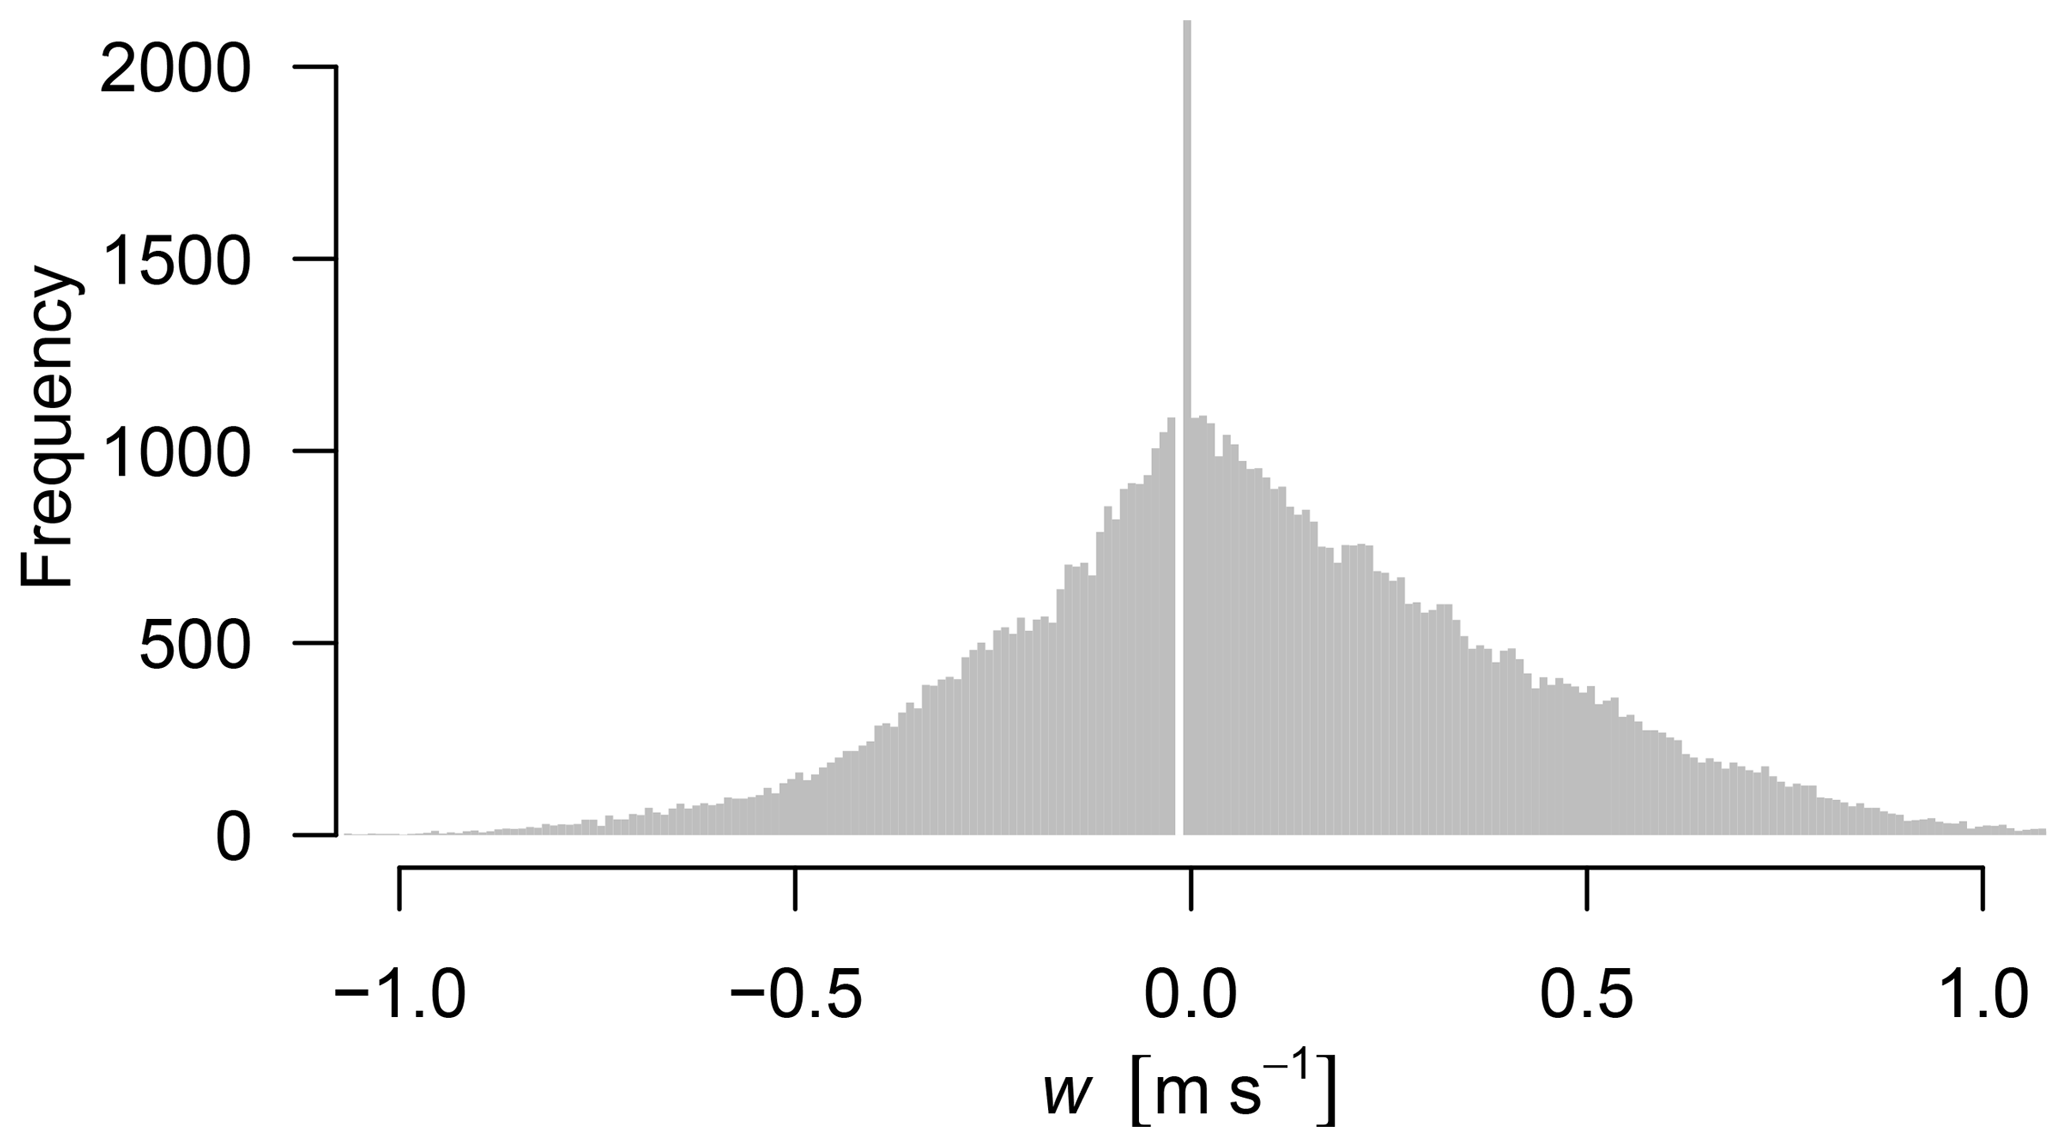
Figure 3Probability density plot of the vertical wind velocity for 1 h (summer at noon) with the manipulated instrumental error of the R2 sonic anemometer.
2.2 12 bit digitalization
The effect of limited amplitude resolution of fluxes of small magnitude was already discussed by Vickers and Mahrt (1997) and is illustrated in a time series of the carbon dioxide concentration in Fig. 1.
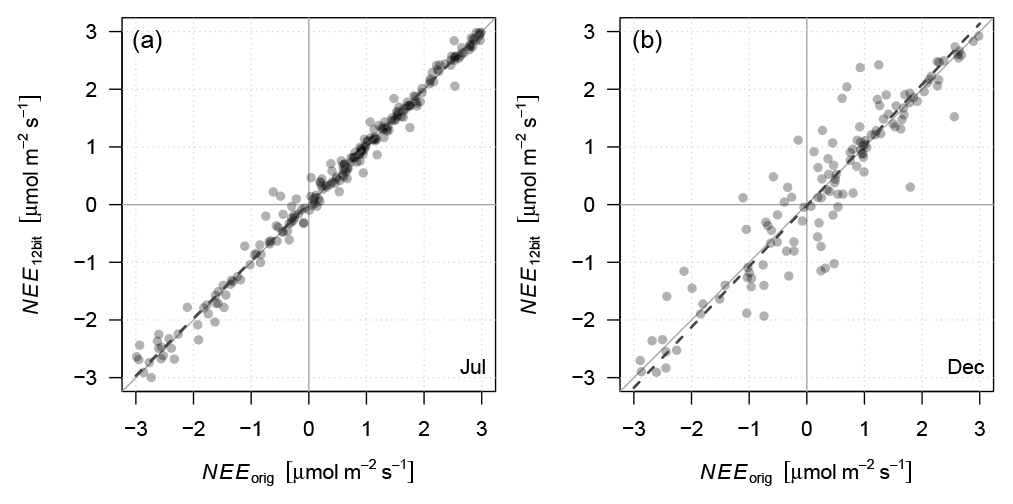
Figure 4Comparison of the original NEE measurements at Waldstein-Weidenbrunnen site in 2012 (original 16 bit digitalization) with calculations using data with 12 bit resolution for the gas analyser in summer (July, a, NEE12 bit=0.995 NEEorg, R2=0.99, N=219) and winter (December, b, NEE12 bit=1.052 NEEorg, R2=0.87, N=129). Only data smaller than are shown.
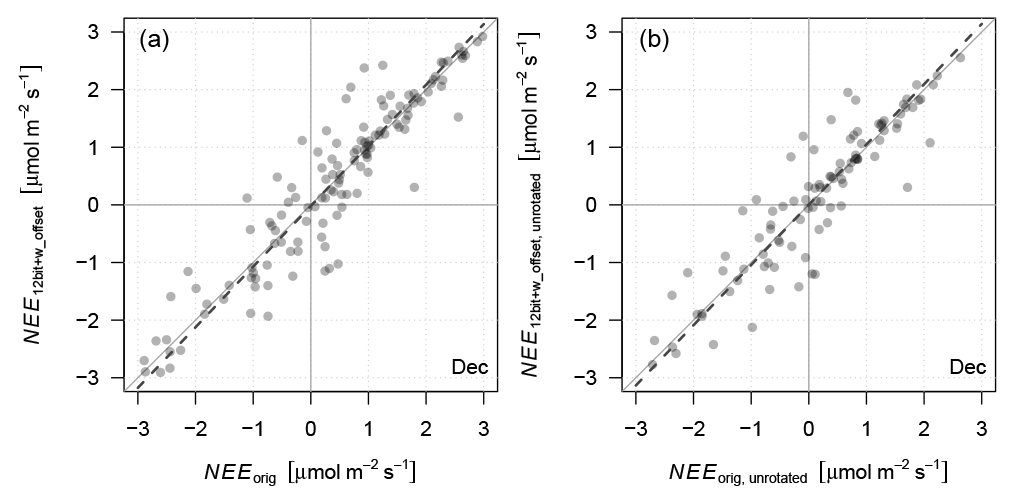
Figure 5Comparison of the original NEE measurements at the Waldstein-Weidenbrunnen site in December 2012 (original 16 bit digitalization) with synthetic data with 12 bit digitalization for the gas analyser and the instrument error (w offset) of the sonic anemometer R2. (a) The data were rotated (compare with Fig. 4b, NEE12 bit_w_offset=1.052 NEEorg, R2=0.87, N=129) and in (b) were not (NEE12 bit_w_offset_unrotated=1.045 NEEorg_unrotated, R2=0.83, N=97). Only data smaller than are shown.
The typical characteristics of 12 bit and 16 bit digitalization are shown in Table 1. The problem is more significant for carbon dioxide than for water vapour because the magnitude of carbon dioxide fluctuations is much smaller in relation to measurement ranges than those of water vapour. The output resolution of all current sonic anemometers equal to least 0.01 m s−1 and is not affected by any digitalization error. A quadrant (hole) analysis of all data points (20 Hz sampling rate) for 1 h of the vertical wind velocity and the carbon dioxide concentration is shown in Fig. 2. The included density distributions show only small differences between the 12 bit and 16 bit digitalizations and are not significantly affected by the binned concentration data, which explains the small impact of the digitalization error on the computed flux.
2.3 Instrument error of R2 and R3 sonic anemometer
Up to the year 2003 the Gill R2 and R3 sonic anemometers suffered from instrument error (Foken et al., 2004): in the case of R2, the instrument would not output vertical wind velocities of m s−1, but added these values to the digitalization step 0.00 m s−1 (Fig. 3). In the case of the R3 a similar pattern was found at a spacing of 0.07 m s−1 for negative w values and at a spacing of 0.14 m s−1 for positive w values.
3.1 Effect of 12 bit digitalization
From a theoretical point of view the digitalization error should only impact small magnitude fluxes found mainly in winter due to small magnitude of perturbations. If the fluctuations are on the order of the digitalization step the signal becomes constant or changes are limited to a few decimal places only. In Fig. 4 only fluxes smaller than are shown. In summer, even for small net fluxes, the amplitude of the turbulent fluctuations is high and no effect on the fluxes can be seen. In winter the data are much more scattered and the respiration fluxes may be overestimated by approximately 5 %; however, the slope does not significantly differ from unity (confidence interval based on the standard error of the linear regression slope). Similar effects on cumulative fluxes could also be shown for incorrectly applied correction under these conditions (Oechel et al., 2014).
3.2 Effect of instrumental errors of the sonic anemometers R2 and R3
The original data of the vertical wind velocity collected from the USA-1 sonic anemometer not suffering from errors were replaced by data simulating the instrument error of the R2 sonic anemometer. The simulated errors had no significant impact on the results (Fig. 5a, compare with Fig. 4b). To isolate the effect of the coordinate rotation from that of the instrument error on to the fluxes the analysis was repeated with unrotated data in which the digitalization step 0.00 m s−1 bin was empty. As shown in Fig. 5b, the effect of the sampling error of the R2 instrument is negligible, even for low fluxes and vertical wind velocities in the relevant range. Identical results were obtained when simulating the R3 sonic anemometer error (produced before 2003).
3.3 Influence on longer time series
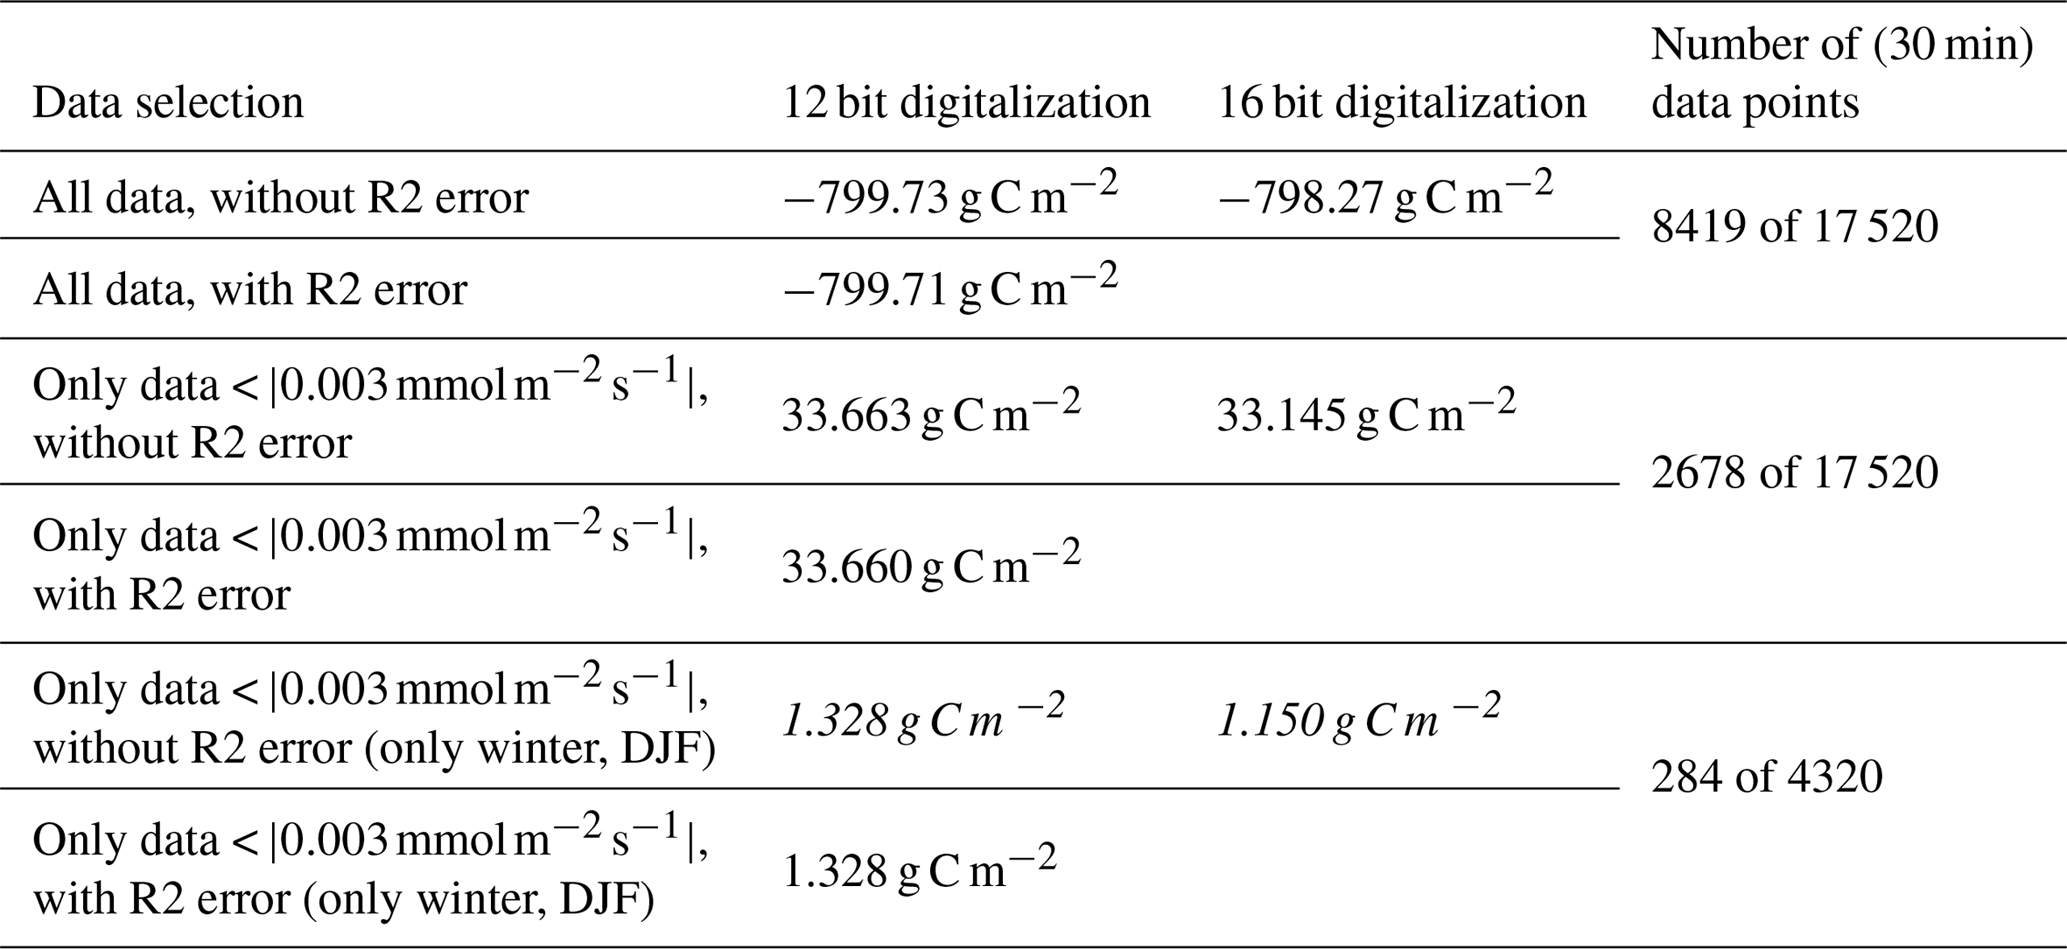
To investigate the influence of digitalization errors on annual sums of the NEE the data of 2012 were analysed and the results are shown in Table 2. The time series was not gap-filled, and therefore respiration data are partly missing and NEE is larger than expected for this ecosystem. The simulated 12 bit digitalization error has no significant impact on the annual carbon budget, except for the impact described above resulting in a reduction in the respiration for fluxes smaller in winter (DJF). The simulated R2-error has no influence on the results.
Table 2Annual sum of NEE with 12 bit and 16 bit digitalization and with and without R2 instrumental error (the data were not gap-filled, and therefore the sum is larger than expected; relevant differences are in italics).
Since long time series of carbon exchange may contain important information about ecosystem dynamics, investigations of older data sets should be undertaken with care since the results could possibly suffer from artifacts resulting from changes in instrumentation and data handling. The present study showed that the impacts of the limited 12 bit digitalization of the gas analyser LiCor 6262 and that of the instrument error of the sonic anemometers R2 and R3 have negligible effects on summer and annual carbon budgets. Only data of small magnitude fluxes show increased scatter and deviations of approximately 5 % due to the digitalization error – mainly in wintertime. The effect of the R2 and R3 instrument error was negligible. Measured low fluxes and fluxes in wintertime are often discarded by quality routines and subsequently gap-filled. Because of general low wintertime fluxes across ecosystems, the findings can be universally applied to carbon flux measurement sites. In comparison, errors resulting from the gap filling (Moffat et al., 2007) are much larger than the errors reported here.
An overview of the instrumentation and important measurement data at the Waldstein-Weidenbrunnen sites is provided by T. Foken, available at https://doi.org/10.1007/978-3-319-49389-3 (13 Februar 2019), 2017a. Code and data of the simulation are available from Wolfgang Babel (wolfgang.babel@uni-bayreuth.de) on request.
Concept and first draft were created by TF. CT discovered hardware digitalization defects and computed first statistics. All calculations and figures were done by WB. After the discussion of the results, TF, WB, and CT completed the paper.
The authors declare that they have no conflict of interest.
This publication was funded by the German Research Foundation (DFG) and the
University of Bayreuth in the funding programme Open Access
Publishing.
Edited by: Ad Stoffelen
Reviewed by: two anonymous referees
Babel, W., Lüers, J., Hübner, J., Rebmann, C., Wichura, B., Thomas, C. K., Serafimovich, A., and Foken, T.: Long-term carbon and water vapour fluxes, in: Energy and Matter Fluxes of a Spruce Forest Ecosystem, Ecological Studies, Vol. 229, edited by: Foken, T., Springer, Cham, 73–96, https://doi.org/10.1007/978-3-319-49389-3_4, 2017.
Baldocchi, D.: `Breathing' of the terrestrial biosphere: lessons learned from a global network of carbon dioxide flux measurement systems, Aust. J. Botany, 56, 1–26, https://doi.org/10.1071/BT07151, 2008.
Baldocchi, D., Ryu, Y., and Keenan, T.: Terrestrial Carbon Cycle Variability [version 1; referees: 2 approved], F1000Research, 5(F1000 Faculty Rev), 2371, https://doi.org/10.12688/f1000research.8962.1, 2016.
Foken, T.: Energy and Matter Fluxes of a Spruce Forest Ecosystem, Ecological Studies, Vol. 229, Springer Cham, XV, 532 pp., https://doi.org/10.1007/978-3-319-49389-3, 2017a.
Foken, T.: Micrometeorology, 2nd ed., Springer, Berlin, Heidelberg, 362 pp., https://doi.org/10.1007/978-3-642-25440-6, 2017b.
Foken, T., Göckede, M., Mauder, M., Mahrt, L., Amiro, B. D., and Munger, J. W.: Post-field data quality control, in: Handbook of Micrometeorology: A Guide for Surface Flux Measurement and Analysis, edited by: Lee, X., Massman, W. J. and Law, B., Kluwer, Dordrecht, 181–208, 2004.
Foken, T., Leuning, R., Oncley, S. P., Mauder, M., and Aubinet, M.: Corrections and data quality in: Eddy Covariance: A Practical Guide to Measurement and Data Analysis, edited by: Aubinet, M., Vesala, T., and Papale, D., Springer, Dordrecht, Heidelberg, London, New York, 85–131, https://doi.org/10.1007/978-94-007-2351-1_4, 2012.
Fratini, G. and Mauder, M.: Towards a consistent eddy-covariance processing: an intercomparison of EddyPro and TK3, Atmos. Meas. Tech., 7, 2273–2281, https://doi.org/10.5194/amt-7-2273-2014, 2014.
Harrison, G. R.: Meteorological Measurements and Instrumentations, John Wiley and Sons, Chichester, 257 pp., 2015.
Ifeachor, E. C. and Jervis, B. W.: Digital Signal Processing – A Practical Approach, Addison-Wesley Publishing Company, Wokingham, 968 pp., 2002.
Keenan, T. F., Hollinger, D. Y., Bohrer, G., Dragoni, D., Munger, J. W., Schmid, H. P., and Richardson, A. D.: Increase in forest water-use efficiency as atmospheric carbon dioxide concentrations rise, Nature, 499, 324–327, https://doi.org/10.1038/nature12291, 2013.
Keenan, T. F., Gray, J., Friedl, M. A., Toomey, M., Bohrer, G., Hollinger, D. Y., Munger, J. W., O'Keefe, J., Schmid, H. P., Wing, I. S., Yang, B., and Richardson, A. D.: Net carbon uptake has increased through warming-induced changes in temperate forest phenology, Nat. Clim. Change, 4, 598–604, https://doi.org/10.1038/nclimate2253, 2014.
Kutsch, W. L. and Kolari, P.: Data quality and the role of nutrients in forest carbon-use efficiency, Nat. Clim. Change, 5, 959–960, https://doi.org/10.1038/nclimate2793, 2015.
Mauder, M., Foken, T., Clement, R., Elbers, J. A., Eugster, W., Grü nwald, T., Heusinkveld, B., and Kolle, O.: Quality control of CarboEurope flux data – Part 2: Inter-comparison of eddy-covariance software, Biogeosciences, 5, 451–462, https://doi.org/10.5194/bg-5-451-2008, 2008.
Mauder, M. and Foken, T.: Eddy-Covariance software TK3, Zenodo, https://doi.org/10.5281/zenodo.20349, 2015.
Moffat, A. M., Papale, D., Reichstein, M., Barr, A. G., Beckstein, C., Braswell, B. H., Churkina, G., Desai, A., Falge, E., Gove, J. H., Heimann, M., Hollinger, D. Y., Hui, D., Jarvis, A. J., Kattge, J., Noormets, A., Richardson, A. D., and Stauch, V. J.: Comprehensive comparison of gap filling techniques for eddy covariance net carbon fluxes, Agr. Forest Meteorol., 47, 209–232, https://doi.org/10.1016/j.agrformet.2007.08.011, 2007.
Moncrieff, J. B., Massheder, J. M., DeBruin, H., Elbers, J., Friborg, T., Heusinkveld, B., Kabat, P., Scott, S., Søgaard, H., and Verhoef, A.: A system to measure surface fluxes of momentum, sensible heat, water vapor and carbon dioxide, J. Hydrol., 188–189, 589–611, https://doi.org/10.1016/S0022-1694(96)03194-0, 1997.
Oechel, W. C., Laskowski, C. A., Burba, G., Gioli, B., and Kalhori, A. A. M.: Annual patterns and budget of CO2 flux in an Arctic tussock tundra ecosystem, J. Geophys. Res.-Biogeo., 119, 323–339, https://doi.org/10.1002/2013JG002431, 2014.
Siebicke, L., Hunner, M., and Foken, T.: Aspects of CO2-advection measurements, Theor. Appl. Climatol., 109, 109–131, https://doi.org/10.1007/s00704-011-0552-3, 2012.
Vickers, D. and Mahrt, L.: Quality control and flux sampling problems for tower and aircraft data, J. Atmos. Ocean. Tech., 14, 512–526, https://doi.org/10.1175/1520-0426(1997)014<0512:QCAFSP>2.0.CO;2, 1997.
Wilczak, J. M., Oncley, S. P., and Stage, S. A.: Sonic anemometer tilt correction algorithms, Bound.-Lay. Meteorol., 99, 127–150, https://doi.org/10.1023/A:1018966204465, 2001.
Williams, C. A., Reichstein, M., Buchmann, N., Baldocchi, D. D., Beer, C., Schwalm, C., Wohlfahrt, G., Hasler, N., Bernhofer, C., Foken, T., Papale, D., Schymanski, S., and Schaefer, K.: Climate and vegetation controls on the surface water balance: Synthesis of evapotranspiration measured across a global network of flux towers, Water Resour. Res., 48, W06523, https://doi.org/10.1029/2011WR011586, 2012.