the Creative Commons Attribution 4.0 License.
the Creative Commons Attribution 4.0 License.
 | 09 Mar 2020
Scanning polarization lidar LOSA-M3: opportunity for research of crystalline particle orientation in the ice clouds
Grigorii P. Kokhanenko
Yurii S. Balin
Marina G. Klemasheva
Sergei V. Nasonov
Mikhail M. Novoselov
Iogannes E. Penner
Svetlana V. Samoilova
The article describes a scanning polarization lidar, LOSA-M3, developed at the V. E. Zuev Institute of Atmospheric Optics, the Siberian Branch of the Russian Academy of Sciences (IAO SB RAS), as part of the common use center “Atmosphere”. The first results of studying the crystalline particle orientation by means of this lidar are presented herein. The main features of the LOSA-M3 lidar are the following: (1) an automatic scanning device, which allows changing the sensing direction in the upper hemisphere at the speed up to 1.5∘ s−1 with the accuracy of the angle measurement setting of at least 1 arcmin, (2) separation of the polarization components of the received radiation that is carried out directly behind the receiving telescope without installing the elements distorting polarization, such as dichroic mirrors and beam splitters, and (3) continuous alternation of the initial polarization state (linear–circular) from pulse to pulse that makes it possible to evaluate some elements of the scattering matrix.
For testing lidar performance several series of measurements of the ice cloud structure in the zenith scan mode were carried out in Tomsk in April–June 2018. The results show that the degree of horizontal orientation of particles can vary significantly in different parts of the cloud. The dependence of signal intensity on the tilt angle reflects the distribution of particle deflection relative to the horizontal plane and is well described by the exponential dependence. The values of the cross-polarized component in most cases show a weak decline of intensity with the angle. However, these variations are smaller than the measurement errors. We can conclude that they are practically independent of the tilt angle. In most cases the scattering intensity at the wavelength of 532 nm has a wider distribution than at 1064 nm.


Cirrus clouds cover a significant part of the earth's surface. Thus, they have a significant impact on the radiation balance and climate, primarily due to the effects of radiation attenuation and reflection (Liou, 1986; Sassen et al., 1989). In many cases, crystalline particles of cirrus clouds have a pronounced orientation in space. This leads to optical anisotropy, manifested in various forms of the solar halo. Anisotropy affects the passage and reflection of radiation from clouds and, for example, leads to dependence of reflectivity on the zenith angle of the sun (Klotzsche and Macke, 2006; Lavigne et al., 2008).
The most well-known phenomenon is a predominant orientation of crystals in the horizontal plane. It can be caused by aerodynamic forces arising from the free fall of particles (Kaul and Samokhvalov, 2005). Sections with the horizontal orientation of particles manifest in occurrence of sun glare when observing cloud cover from space (Chepfer et al., 1999; Masuda and Ishimoto, 2004). Analysis of the glare width shows the correspondence to the Gaussian distribution of crystal inclination with the half-width of about 0.4∘ (Breon and Dubrulle, 2004; Lavigne et al., 2008). The presence of horizontally oriented crystals is also detected when observing specular spots from the spotlight on the clouds (Borovoi et al., 2008); flutter width is also estimated to be 0.4∘. Lidar observations of the ice clouds provide the basic information about particle orientation (Platt et al., 1978; Chen et al., 2002; Noel and Sassen, 2005).
Unlike water clouds, ice clouds cause greater depolarization of backscattered radiation (Sassen and Benson, 2001). Most often, the depolarization ratio is within δ=0.3–0.6 in the cloud areas with randomly oriented particles (Noel et al., 2002; You et al., 2006). The magnitude of depolarization is undoubtedly related to the shape of particles and the phase composition of cloud, which are taken into account when analyzing the observations of cirrus clouds (Noel et al., 2002; Hoareau et al., 2013; Campbell et al., 2015; Haarig et al., 2016; Stillwell et al., 2018).
Starting from the works of Sassen (1977) and Platt et al. (1978), numerous observations show that with a vertical orientation of the lidar, the horizontally oriented particles cause a specular reflection, manifested in the absence of depolarization and increased backscattering (Platt, 1978; Thomas et al., 1990; Sassen, 1991; Sassen and Benson, 2001). Data analysis of the polarization lidar in the CALIPSO experiment (Cho et al., 2008; Noel and Chepfer, 2010; Yoshida et al., 2010) shows that a significant fraction of horizontally oriented particles in the midlatitudes is observed in the temperature range from −35 to −5 ∘C. Deviation of the lidar from the vertical position eliminates the effect of mirror reflection. For example, the CALIPSO lidar is 3∘ deviated from the nadir to eliminate this effect (Hunt et al., 2009). The angular dependence of depolarization may vary for clouds with different temperatures (Sassen and Benson, 2001; Noel and Sassen, 2005). According to data from these works, the dependence of signal amplitude on the lidar tilt angle corresponds to the Gaussian distribution.
Another effect caused by the horizontally oriented plates and columns is the corner reflection. It appears when the lidar is tilted at a significant angle. Depolarization of backscattered radiation has a maximum at a lidar tilt of 30∘ for oriented plates and about 60∘ for columns (Borovoi et al., 2000). More detailed simulations show that when angular reflection is taken into account, the element a44 of the light backscattering phase matrix (BSPM) is most informative in determining the flutter (Konoshonkin, 2016). For the plates, an abrupt change in the a44 occurs at a tilt angle of 30∘, while for the columns this element begins to grow smoothly at 30∘ and reaches a maximum at 60∘ (Konoshonkin et al., 2016). Some experiments with tilted lidars were carried out (Del Guasta et al., 2006; Hayman et al., 2012, 2014; Neely et al., 2013; Veselovskii et al., 2017) and showed a high probability of the presence of oriented particles.
Particle orientations are promoted not only by aerodynamic forces but also by forces of a different nature, such as wind shifts and electric fields. Kaul (2000) supposed that in such conditions, crystalline particles can have a preferential orientation in the horizontal plane (azimuthal orientation). It is obvious that the direction of preferential orientation is connected with the direction of action of these forces. The basis for such a conclusion is the observed non-invariance of the BSPM with respect to rotation of the coordinate system (Kaul, 2000; Kaul et al., 2004; Hayman et al., 2014; Samokhvalov et al., 2014). If we use linear polarized radiation and rotate the lidar around a vertical axis, signal energy depends on the angle of lidar rotation relative to the plane of preferential orientation of the particles if m12≠0 (Kokhanenko et al., 2018). According to a large array of experimentally measured BSPM, the distribution of relative frequencies for m12 shows that the value of m12 lies in the interval with the probability about 30 % (Kaul et al., 2004; Balin et al., 2009). Therefore we would have to observe the modulation of the signal very often. However, we did not find references to such direct experiments in the literature.
It should be mentioned that most of the works used the 532 nm wavelength for measurements. Due to technical difficulties, only a small number of works use the first harmonic of the Nd:YAG laser (1064 nm) that is optimal for recording aerosol layers (McGill et al., 2002; Burton et al., 2015; Haarig et al., 2016, 2017; Veselovskii et al., 2017). The assumption of independence of the crystalline particle scattering of the wavelength is not always justified (Tao et al., 2008; Vaughan et al., 2010; Borovoi et al., 2014). Therefore, a comparison of the polarization and amplitude (color ratio) of signals at two wavelengths can provide the additional information about properties of crystalline particles.
The optical properties of ice clouds, including their effect on the radiation balance, are determined by both the microphysical properties of crystalline particles and the presence of their orientation. These properties are in turn determined by complex meteorological processes in the clouds. Therefore, the study of the orientation of crystalline particles provides significant information about these processes. The article describes a scanning polarization lidar LOSA-M3, developed at the IAO SB RAS (V. E. Zuev Institute of Atmospheric Optics, the Siberian Branch of the Russian Academy of Sciences). The first results of studying the crystalline particle orientation by means of this lidar are given herein. The main purpose of this lidar is to study the optical characteristics of the mid- and high-level ice clouds at two wavelengths – 532 and 1064 nm. The design, optical scheme and principle of operation of the scanning polarization lidar are described in Sect. 2. Methods of instrument setup and calibration of the polarization channels are described in Sect. 3. Examples of observations of horizontally oriented particles in the cirrus clouds are given in Sect. 4.
The scanning polarizing lidar LOSA-M3 is a continuation of a series of small-size lidars LOSA-MS and LOSA-M2 (Bairashin et al., 2005, 2011), developed and operated in the IAO SB RAS in the Laboratory of Optical Sensing of the Atmosphere (LOSA). All of these lidars are intended primarily for use in field conditions, which impose certain restrictions on the weight-dimensional characteristics and the energy potential of the device. The main features of the LOSA-M3 lidar are the following: (1) an automatic scanning device, which allows changing the direction of sensing within the upper hemisphere at the speed of up to 1.5∘ s−1 with an accuracy of the angle measurement setting of at least 1 arcmin, (2) separation of the polarization components of the received radiation – Ico, which coincides with the original radiation, and the component Icros orthogonal to it, being carried out directly behind the receiving telescope without installing the elements distorting polarization, such as dichroic mirrors and beam splitters, and (3) continuous alternation of the initial polarization state (linear–circular) from pulse to pulse that makes it possible to detect the deviations of BSPM from the diagonal shape (Balin et al., 2011). A photograph of the lidar system is shown in Fig. 1.
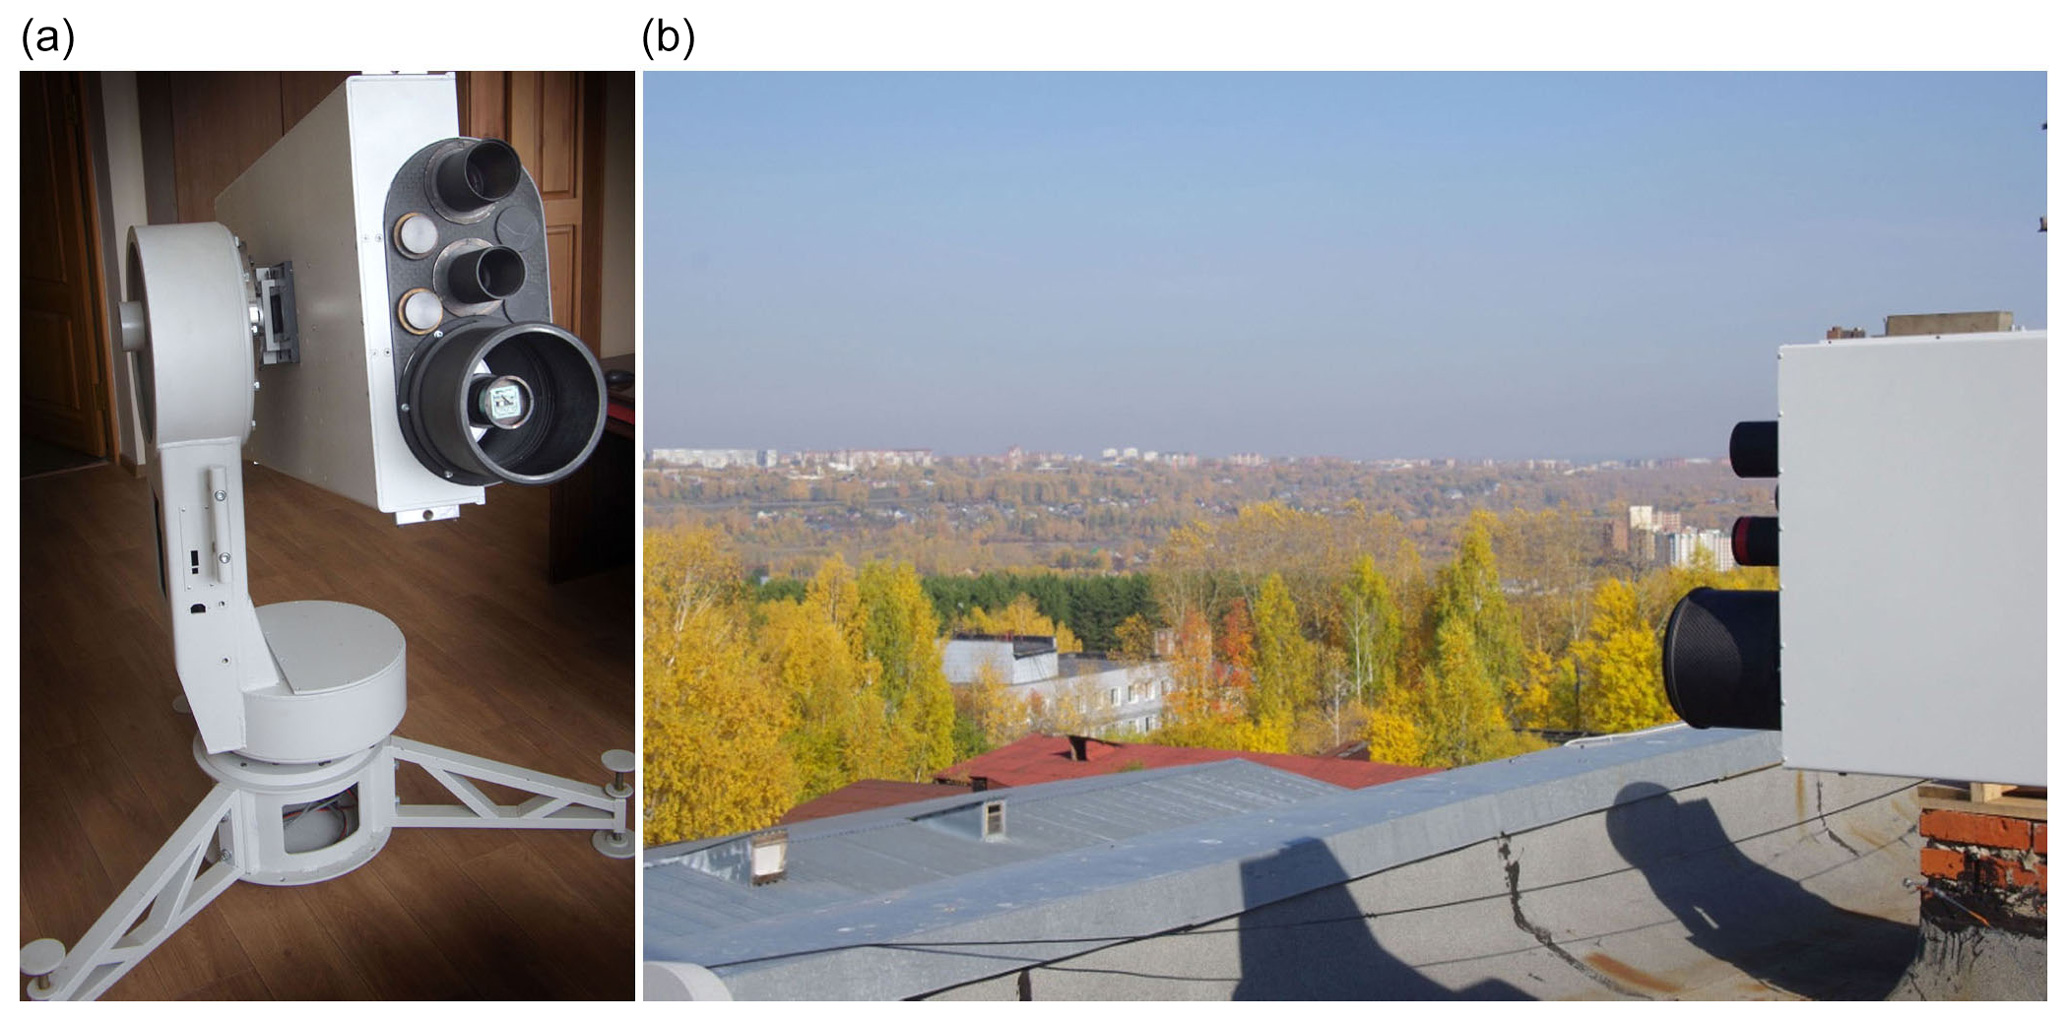
Figure 1Photographs of the lidar on a rotary column in the laboratory room (a) and on the institute building roof (b).
The optical scheme of the lidar is shown in Fig. 2. The Q-smart 850 (Quantel) laser with a fundamental harmonic energy of 850 mJ is used with the repetition frequency of 10 Hz (externally triggered). Radiation is linearly polarized, but the polarization plane of the second harmonic (532 nm) is rotated by 45∘ relative to the first. For coincidence of the polarization planes, the phase plate PP1 with the phase shift of 20 wavelengths for λ=532 nm and 9.5 wavelengths for λ=1064 nm is installed. The rotation of this plate causes the rotation of the polarization plane for 1064 nm but does not affect the polarization of 532 nm. Turning the plate helps achieve the coincidence of the polarization planes for two harmonics. The Glan prism (GP) improves the polarization contrast of radiation. The quarter-wave λ∕4 phase plate PP2 serves to transform the polarization state (linear–circular).
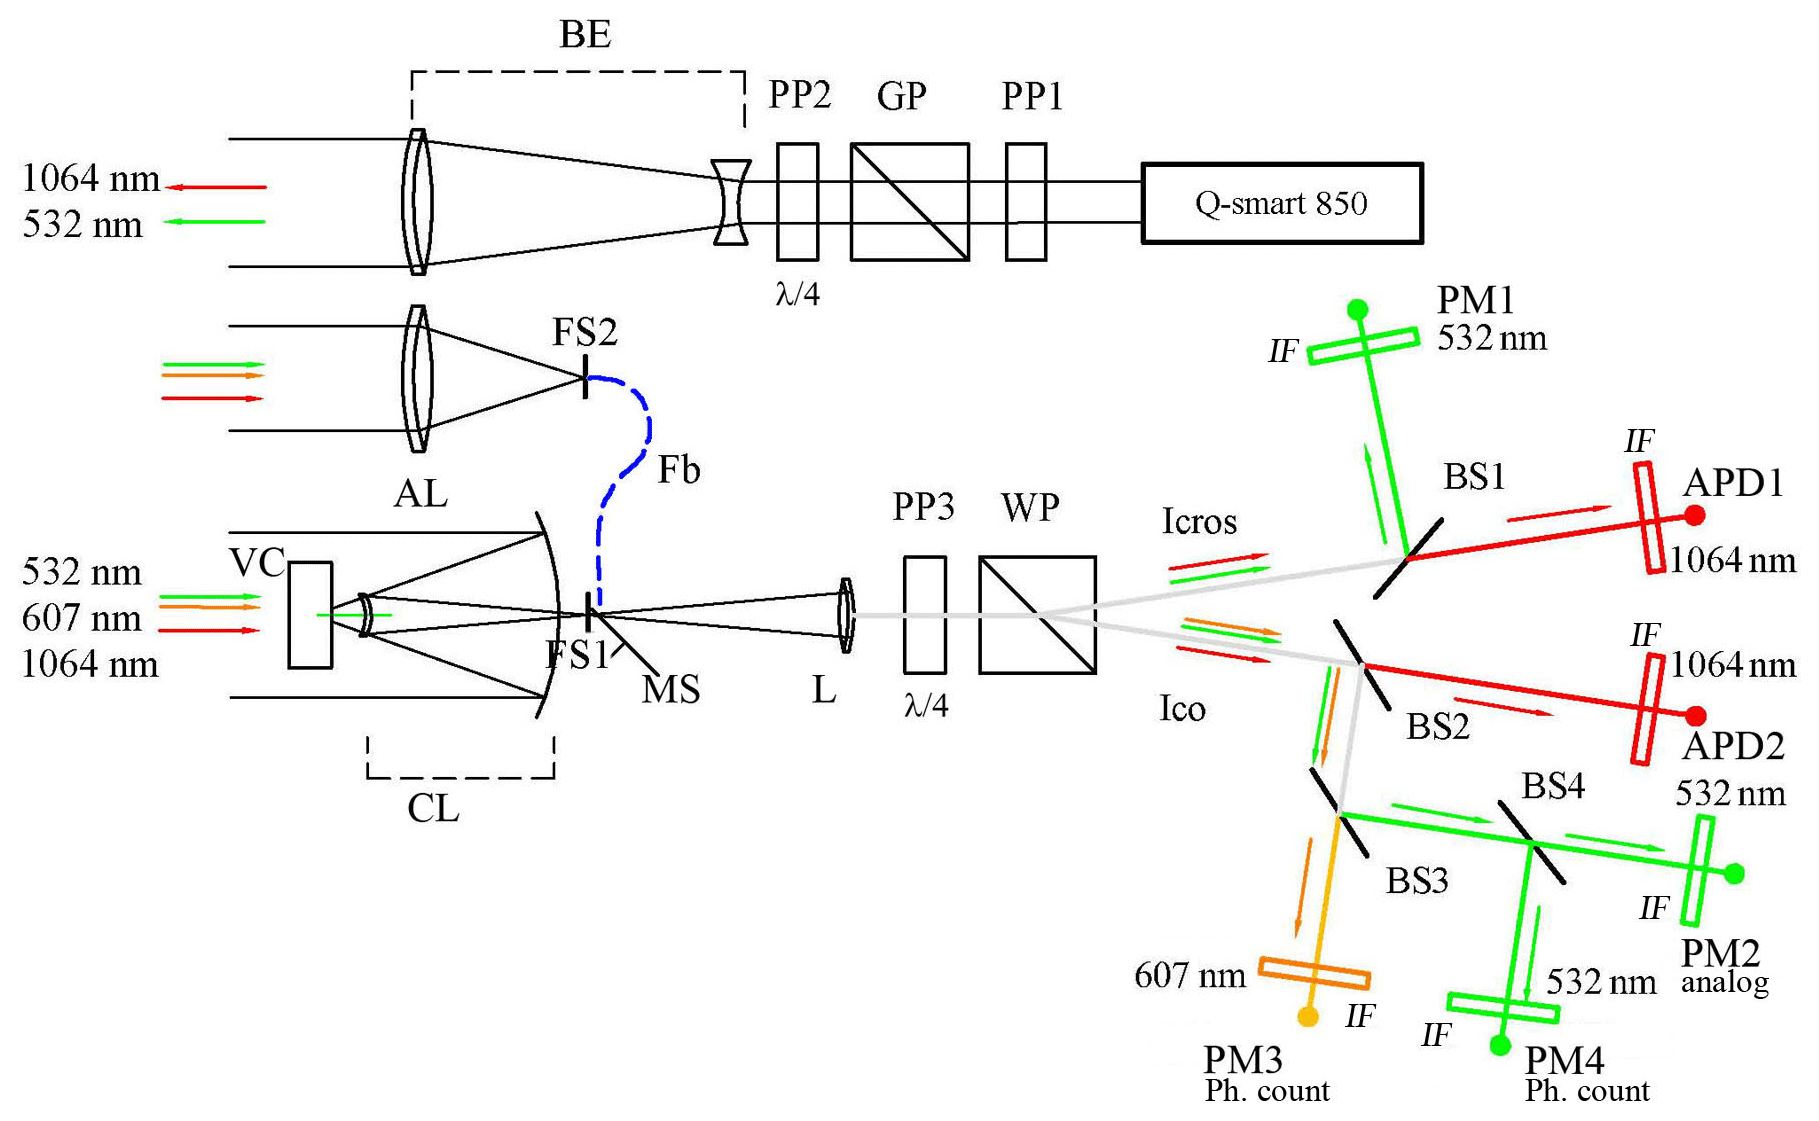
Figure 2Optical circuit of the LOSA-M3 lidar. PP: phase plate. GP: Glan prism. BE: achromatic beam expander. AL: achromatic lens with 40 mm diameter. CL: Cassegrain mirror lens with 200 mm diameter. VC: video camera. FS1 and FS2: iris diaphragms. Fb: optic fiber. MS: mirror shutter. L: lens. WP: Wollaston prism. BS: beam splitter. APD: avalanche photodiode. PMT: photomultiplier tube.
Rotation of the phase plates (the analogous plate – PP3 – is placed in front of the analyzer) is performed by means of the rotating platform 8RU-M (Standa) in synchronism with the laser pulse frequency. Thus, the phase plate can rotate by 45∘ between pulses; at the same time, the state of polarization will consistently change from linear to circular and vice versa. Lidar signals are separately recorded for each position of the plates PP2 and PP3 and can be summed up (accumulated) in further processing for a certain period of time. Usually it takes from 10 s to 1 min. Thus, a synchronous rotation of two plates – PP2 in the transmission channel and PP3 in the receiver – allows measuring the polarization characteristics (e.g., depolarization ratio ) simultaneously for both linear and circular polarizations.
We have two sets of quarter-wave plates. One set is designed for 532 nm, and another set is designed for 1064 nm. For the wavelength of installed plates (below are the results only for installed 1064 nm plates) we can investigate both linear and circular polarizations. For the second wavelength (532 nm), the polarization state when turning 45∘ is not determined. However, in the position where the axis of the rotating phase plate coincides with the plane of polarization of the transmitter, the radiation remains linearly polarized for any wavelength. So the measurements for the wavelength of λ=532 nm were carried out only for linear polarization of radiation. Of course, in our lidar we can use a quarter-wave plates for 532 nm if such experiments were planned. A plate rotation algorithm is discussed in more detail below, in Sect. 3.2.
The beam is collimated by the 7-fold achromatic expander BE, designed at the IAO SB RAS (Kochanenko et al., 2012). Two receivers are used – an achromatic lens (AL) with a 40 mm diameter and 200 mm focus for the near range and a Cassegrain mirror lens (CL) with a 200 mm diameter and 1000 mm focus for the far range. The iris diaphragms FS1 and FS2 in the focal plane of each lens determine the telescope field of view. A special feature of the Cassegrain lens design is installation of a video camera (VC) behind the secondary mirror, which receives radiation through an annular diaphragm in the outer area of the secondary mirror (Simonova et al., 2015). The camera has a global shutter and is synchronized along with laser pulses. This camera setup allows observing the image of the laser spot on the objects around without parallax. It is especially important for setting the lidar field of view and for excluding the possibility of lidar orientation towards residential buildings.
The signal from the receiver of the near range through the optic fiber (Fb) is fed to the mirror shutter (aluminum-coated obturator; MS) by means of which the signals of the near and far ranges are alternately switched. The near-range radiation is reflected from the mirror obturator, and the far-zone radiation passes directly with the open position of the obturator. The small receiver is closer to the transmitter, so the transition to the range-square mode starts earlier (80–100 m) than that for the large receiver (800–900 m). During data processing signals from the near range (50–1200 m) and far range (400 m–15 km) fit together at a distance of 800–900 m when the range-square mode for the large receiver starts. Of course, the silica optical fiber (1 mm diameter) destroys the polarization state of the signal, so near-range data cannot be used for polarization analysis.
The shutter controller sets the obturator rotation frequency, and the rotation speed of the phase plates and externally triggers the laser. So laser pulse frequency is about 10 pulses per second, but its exact value is synchronized with the rotation of the mirror obturator and platforms with phase plates.
There may be times when we are only interested in distant objects, such as high-level clouds. In this case, the obturator's rotation speed doubles, and the laser only starts when the shutter is open. The frequency of the laser pulses remains the same (10 Hz), but only far-range signals are recorded.
The lens L forms a quasi-parallel beam that enters through the phase plate PP3 (similar to the plate PP2) into the Wollaston prism (WP). The prism divides the beam into two components with orthogonal polarization, which are further divided along the wavelengths by dichroic beam splitters. Unlike the schemes in which the wavelength division is carried out before separation of polarization components, there is no distortion of the polarization state when reflected from dichroic elements, and there is no need to apply laborious calculations of the instrument vector and correction of the measured polarization (Di et al., 2016).
The beam splitter BS1 (Di-757, Semrock) is placed in the cross-polarization channel, transmitting radiation of 1064 nm and reflecting 532 nm. In the channel, corresponding to initial polarization, beam splitters BS2 (transmitting 1064 nm) and BS3 (reflecting 532 nm and transmitting 607 nm) are installed. The radiation is detected by photodetectors in the analog mode: the avalanche photodiodes APD1 and APD2 for 1064 nm (C30956EH-TC PerkinElmer, 3 mm diameter of the receiving area) and photoelectric multipliers PM1 and PM2 (H11506 Hamamatsu) for 532 nm. Weak signals of Raman scattering at 607 nm are recorded with the photomultiplier PM3 (H11706P Hamamatsu) in the photon-counting mode. Part of 532 nm radiation is removed by the glass plate BS4 on the photomultiplier PM4 (H11706P), operating in the photon-counting mode, which allows comparing the signals at 607 and 532 nm within one dynamic range. Interference filters (IFs) with a bandwidth of about 1 nm are placed in front of the detectors.
The signals from photodetectors are processed by 12 bit analog-to-digital converters (LA-n12USB; Rudnev-Shilyaev) in case of analog signals or by a 200 MHz photon counter (IOA SB RAS) for Raman signals and input to the computer. The peculiarity of the lidar is the alternation of the transceiver parameters from pulse to pulse: the changing of signals from the near and far ranges, the angle of the phase plates' rotation, and the rotation angle of the lidar during scanning. This eliminates the possibility of accumulating signals directly after digitizing. In our case, each signal is assigned a digital code, corresponding to the position of lidar elements, and the signals are sorted during computer processing.
3.1 Coinciding polarization planes
One of the main sources of errors in polarization measurements is a discrepancy between the polarization planes of the emitting and receiving channels. The Glan prism (GP in Fig. 2) is installed in a rotating frame and allows aligning the planes of emitter and receiver. The accuracy of installation angle is rad. Figure 3 shows the measured value of the cross-polarized component (equal to 1 when normalized to the minimum), depending on the angle of the prism rotation. A signal from a uniform aerosol layer with a constant value of δ∼1 % was recorded, with averaging over the 4.2–5 km range and a 3 min interval.
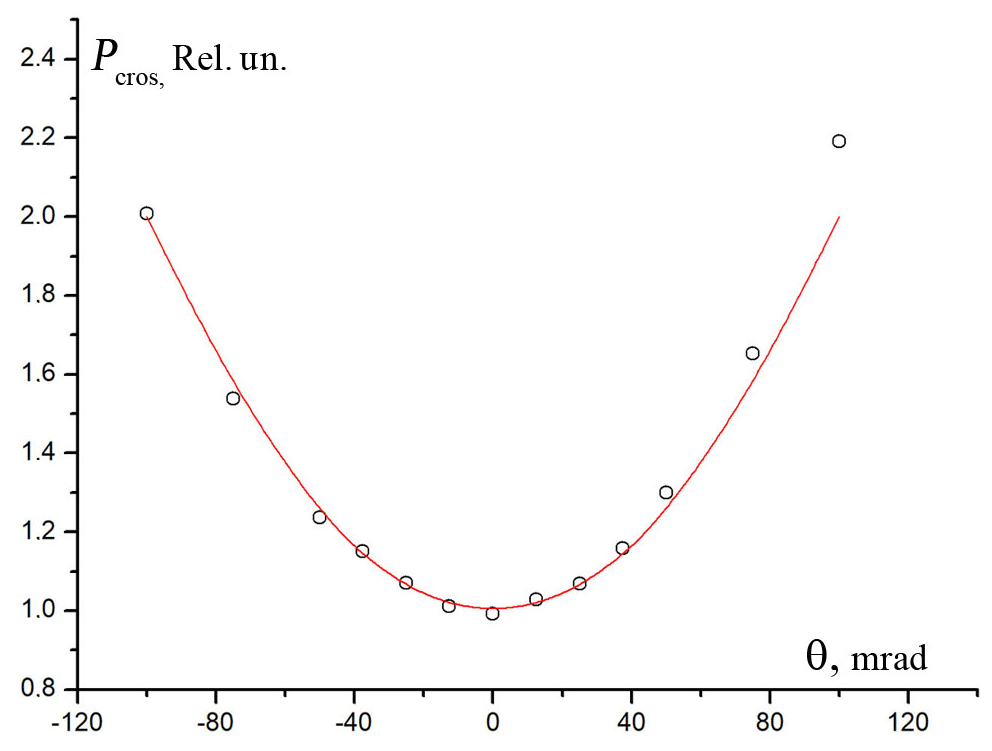
Figure 3Adjusting the position of the Glan prism. The dependence of the cross-polarized component Pcros (normalized to the minimum is 1) on the angle θ of the prism rotation is shown. Measured values Pcros (circles) and fitting curve (red line).
Let us use the signal components P∥ and P⊥ and a true depolarization ratio . The signal at the cross-polarization receiver, when the prism position is inaccurate, will be (θ is a small setting angle error). Hence, the measured depolarization ratio will be , and the error of the measured depolarization ratio (due to the inaccurate prism position) is %.
3.2 Phase plate setup
Phase quarter-wave plates are mounted on a rotating platform driven by a stepper motor, working 1200 steps per revolution. One step of the platform is 0.3∘ and takes 0.68 ms of time, which allows the plate to rotate 45∘ in the time period between two laser pulses (about 100 ms). During one revolution of the platform, eight laser shots are taken. Positions of the plates A (transmitter) and B (receiver) for four consecutive pulses are shown in Fig. 4. The bold line shows the direction of a fast axis of the plates. With such an arrangement of axes, the signals of the cross-polarized component with both linear and circular polarization are recorded by the same photodetector.

Figure 4Diagram of the rotation of the phase plates. Plate mounting angles for the four consecutive laser pulses are shown. The bold line shows the direction of a fast axis of the plates.
The rotation angle setting is monitored by the zero position sensors of platforms. When installing the plates in the platform frame, the plate axis can be shifted relative to the sensor at a certain angle, which is initially unknown. However, a laser pulse must be produced at the moment when the axis of the plates coincides with the reference plane of the lidar. The exact positions of the plates in the frame are set separately for plate A and B. We set one plate (e.g., plate B) in its channel (receiver for plate B) and turn on the rotation. A section of a homogeneous atmosphere with small aerosol content is selected. Figure 5a shows the lidar signals from two photodetectors (Pco and Pcros), summarized over all positions of plate B (red and green lines). A height range from 6 to 9 km was chosen, on which the depolarization ratio (blue line) is constant.
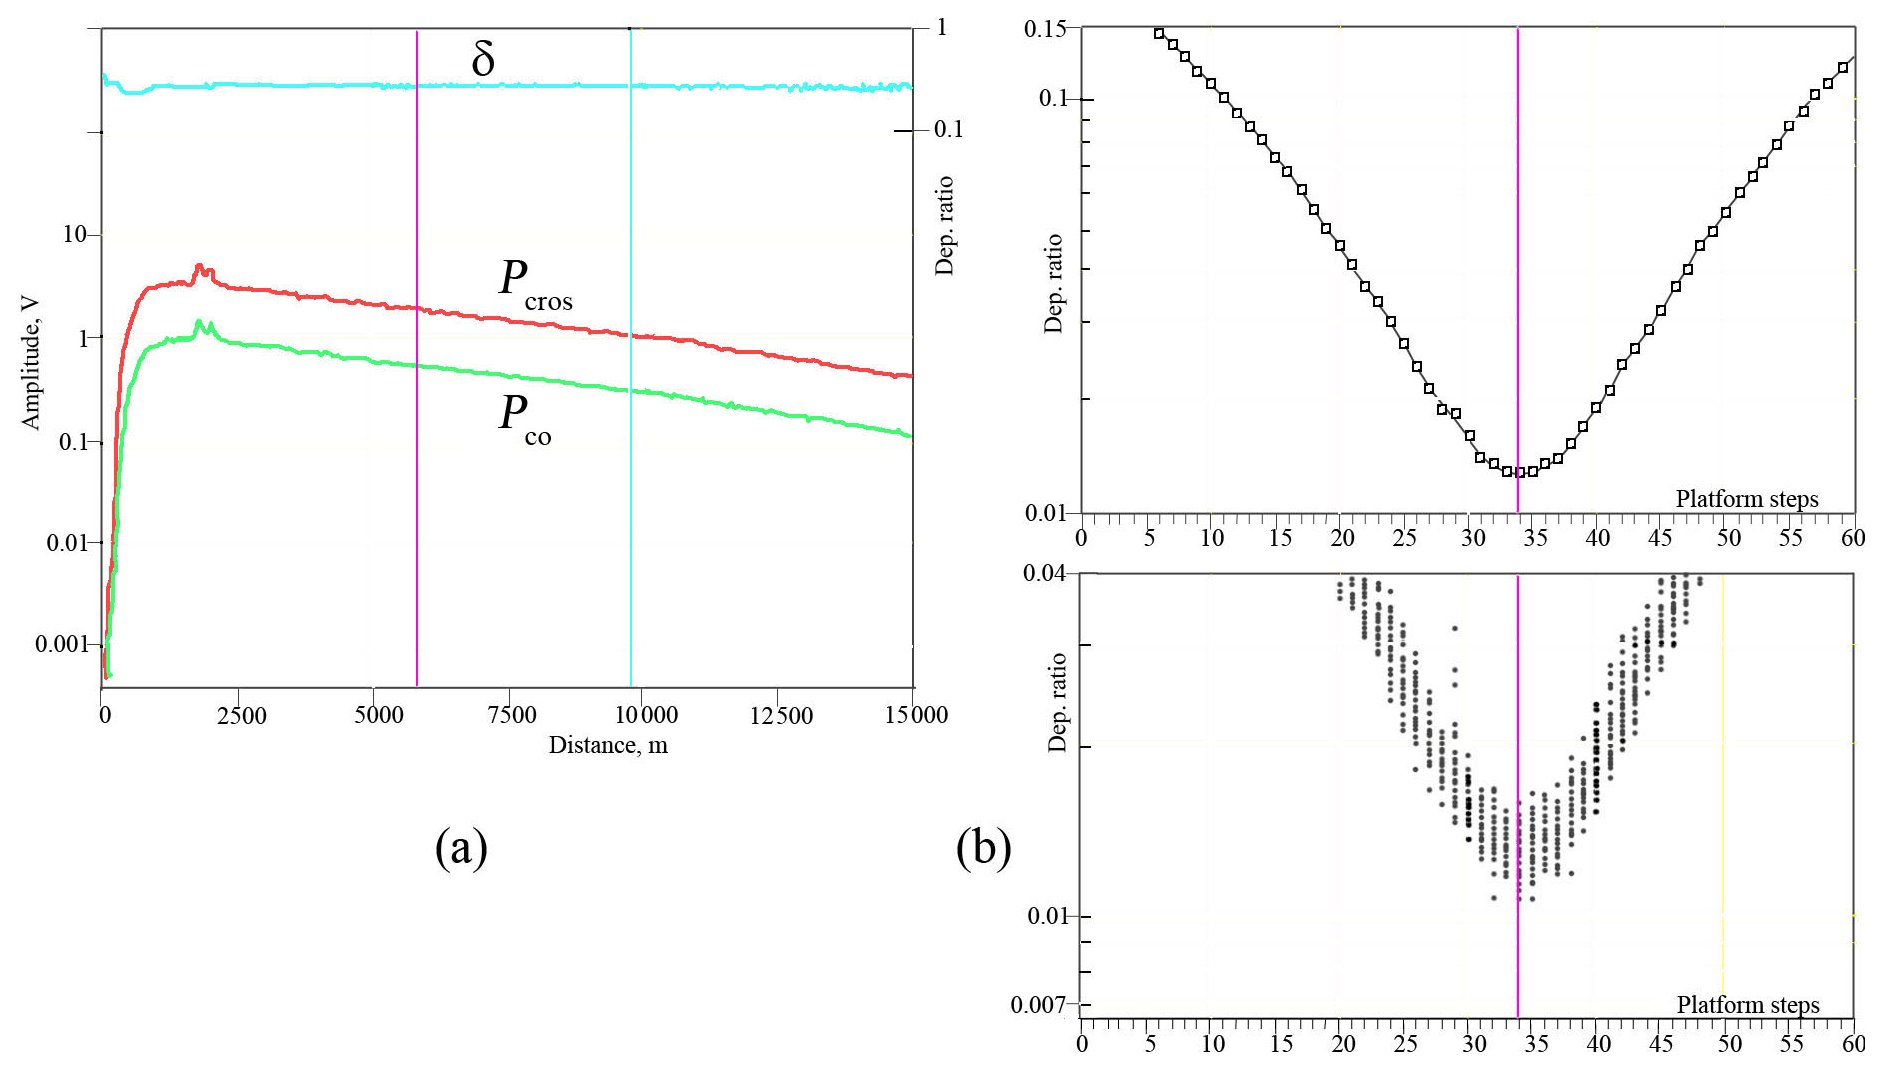
Figure 5(a) Lidar signals from two photodetectors (Pco and Pcros), summarized over all positions of plate B (red and green lines). A height range of 6–9 km with constant depolarization ratio (blue line) is chosen to adjust the plates. (b) Depolarization ratio for each pulse (bottom) and averaged over a 30 min record (top).
For each pulse, the rotation angle of the plate was recorded and the average value of the depolarization ratio over the range of 6–9 km was calculated. These values are shown in Fig. 5b (bottom frame). The dependence averaged over 30 min is shown in the upper frame in Fig. 5b. Minimal depolarization is observed at the 34th step of the platform. The accuracy of platform setting is ±1 step, which corresponds to 0.03 % error with respect to depolarization ratio. A similar adjustment of the plate A gives an exact position at the 45th platform step.
A timing diagram in Fig. 6 shows the position of the laser pulses relative to the zero position of the plates. A 31 ms interval (45 steps) for plate A and 23 ms interval (34 steps) for plate B pass before the first laser pulse. The situation repeats every eight pulses. As already mentioned, the frequency of laser pulses is strictly synchronized with the rotation of the plates.
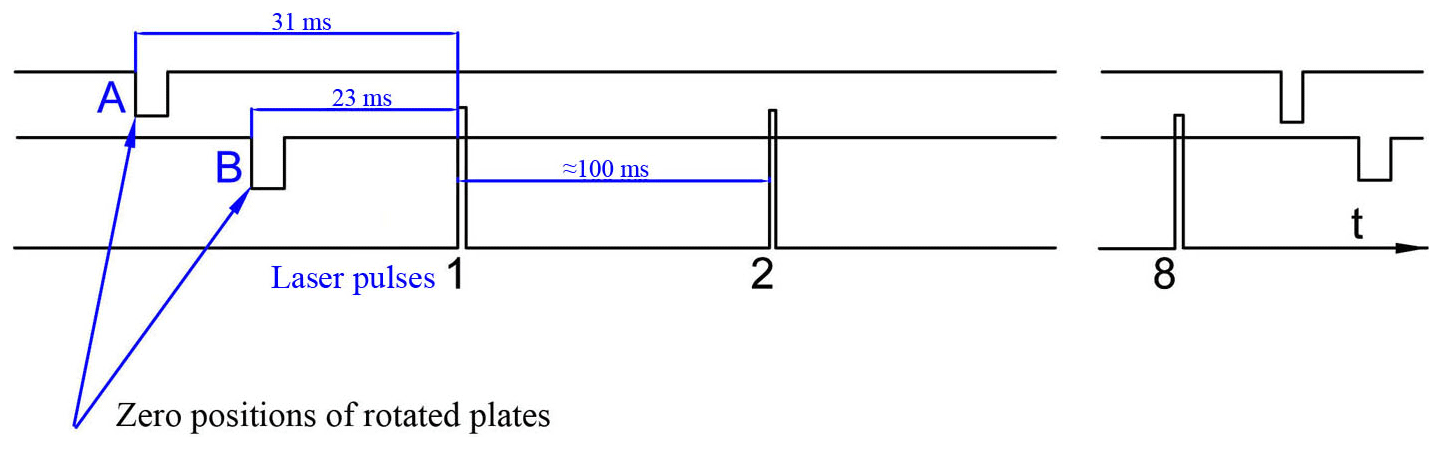
Figure 6Time positions of the laser pulses relative to the zero positions of the plates. The situation repeats every eight pulses.
The diagrams indicated in Figs. 4 and 6 refer to the cases of registration for only the far-range signals. If we register both near- and far-range signals, the plates rotate through the angle 22.5∘ between laser pulses. Intermediate positions correspond to the near-range signals and have an undefined polarization.
3.3 Calibration of the polarization channels
Measurements of the polarization of backscattered radiation require careful consideration of polarization distortions in the receiving paths and sensitivity of photodetectors in the channels of original and cross polarization (Freudenthaler, 2016; Belegante et al., 2018; McCullough et al., 2018). The task of observations in lidar networks is to monitor the optical and microphysical properties of aerosol, which requires restoring not only the backscattering coefficient but also the lidar ratio and attenuation. Therefore, a large number of lidars are designed as aerosol-Raman (Althausen et al., 2000; Whiteman et al., 2007; Reichardt et al., 2012; Groß et al., 2015; Haarig et al., 2017; Madonna et al., 2018) or multiwave high-spectral-resolution lidars (HSRLs; Eloranta, 2005; Burton et al., 2015). Most of these lidars use dichroic beam splitters as wavelength dividers, and polarizing elements (film polarizers) are installed after the beam splitters and deflecting mirrors (Nott et al., 2012; Engelmann et al., 2016; McCullough et al., 2018). This leads to distortions in recording polarization components, which require complex procedures for determining the eigenvectors of polarization of the lidar and taking them into account when restoring the polarization state of scattered radiation (Alvarez et al., 2006; Haymann et al., 2012; Freudenthaler et al., 2009; Bravo-Aranda et al., 2016; Di et al., 2016; Freudenthaler, 2016).
Measurements of polarization characteristics of backscattered radiation were carried out, simultaneously for several wavelengths, by different groups: 347+697 nm (Pal and Carswell, 1978), 355+532 nm (Althausen et al., 2000; Summa et al., 2013; Groß et al., 2015; Engelmann et al., 2016) and nm (Burton et al., 2015; Haarig et al., 2017; Hu et al., 2019). The LOSA-M3 lidar measures polarization components at wavelengths of 532 and 1064 nm. At the same time, the polarization components are separated directly behind the receiving telescope, before the radiation is separated according to wavelength. This scheme has no distortions of the polarization state from dichroic mirrors reflection; therefore, there is no need to use laborious calculations for the instrumental vector of the transmitting-receiving channel and correction of the measured polarization. In this case, it is sufficient to determine the relative sensitivity of detectors in both lidar channels to measure the magnitude of the depolarization ratio. The channel calibration problem is solved in most devices for polarization measurements. An exception is devices where signals of different polarization are sequentially directed to one photodetector (Platt, 1977; Eloranta and Piironen, 1994; McCullough et al., 2017).
The relative sensitivity of photodetectors can be determined by observing the source with known polarization – it can be a non-polarized source (Sassen and Benson, 2001) or an atmospheric layer with purely molecular scattering (Biele et al., 2000; Noel et al., 2002; Volkov et al., 2002; Kaul et al., 2004; Noel and Sassen, 2005). However, the depolarization ratio for molecular scattering depends significantly on the bandwidth of interference filter used, since rotational Raman lines can contribute to the signal (Young, 1980; She, 2001). For pure Rayleigh scattering, the depolarization ratio is δ=0.00365, with a wide filter, δ=0.015. This leads to an ambiguous lidar calibration.
The most common calibration is associated with rotation of the separation plane for polarization components by 90∘ (Freudenthaler, 2016). In this case, the photodetectors change places with respect to the polarization components. Turning by 90∘ can be carried out physically by rotating the entire photodetector unit (Yoshida et al., 2010; Strawbridge, 2013) or by rotating the half-wave phase plate, which can be installed both in the transmitter channel (Spinhirne et al., 1982) and the receiver (McGill et al., 2002; Reichardt et al., 2012). In previous lidars of the LOSA series (Balin et al., 2009), mechanical rotation of the photodetector unit by 90∘ was used. The intensity ratios in both channels were taken into account and made it possible to eliminate possible changes in the object brightness during turning. When calibrating with this method, you can choose any stable aerosol-cloud formation as a scattering object, which is characterized by a noticeable (>10 %) and constant depolarization ratio during the measurement period.
To measure the depolarization ratio of backscattered radiation, the relative sensitivity of detectors must be known. Thus, in our lidar we offer a new method for a continuous rotation of the λ∕2 phase plate, temporarily installed in the receiver module instead of the λ∕4 plate PP3 in Fig. 2. For the light backscattering phase matrix (BSPM), we take a 4×4 matrix M relating the Stokes vectors of radiation scattered in the direction toward the source with the Stokes vector S0 of radiation, incident on an ensemble of particles. Polarization components are expressed as , . Let us assume that laser radiation is linearly polarized (the initial vector is ). Then the scattered Stokes vector is . If we install the λ∕2 phase plate with matrix
before the polarization prism in the receiver, where ϕ is the rotation angle, the Stokes vector will be
where C4=cos 4ϕ and S4=sin 4ϕ. Polarization components I∥ and I⊥ are different: (the upper sign is for I∥, and the lower sign is for I⊥). However, the integral for a complete turn of the plate over the angle is the same for each polarization component, regardless of the values of matrix elements. The ratio of measured values of the integral for two components gives us the value of relative sensitivity of the polarization channels.
The calibration procedure is done separately for 532 and 1064 nm. The method works for any initial state of polarization and for any BSPM of aerosol layer. Unlike the Δ90 method, there is no need to ensure extremely accurate setting of the plate rotation angle, but during the plate turning (about 20 s), the change in the scattering properties of the object should be minimal. Figure 7 shows one of calibration records made on 7 May 2017, demonstrating the errors of the applied method. The upper part (Fig. 7a) shows the record of a signal (1064 nm) integrated by the plate rotation angle, with components I∥ (green) and I⊥ (red). Integration was carried out during four revolutions of the plate. Figure 7b shows the value of calibration constant K, calculated in the height range of 1800–8000 m. In this case, the mean value is K=1.91. Similar calibration procedures were carried out before each measurement in April and June 2018. All values of K did not deviate by more than ±0.05.
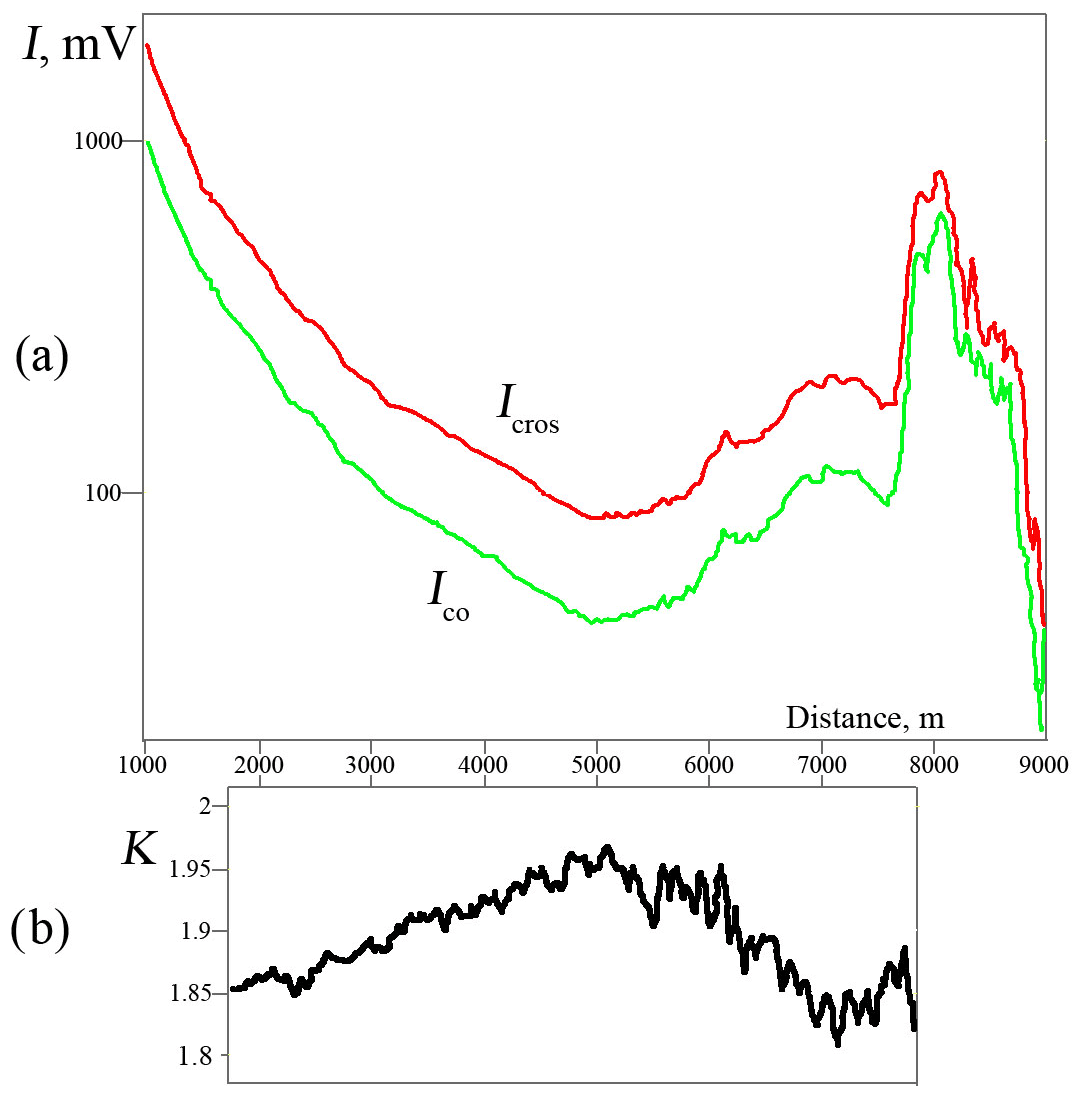
Figure 7Channel calibration procedure. (a) The record of a signal (1064 nm) integrated by the plate rotation angle, with components Ico (green) and Icros (red). Integration was carried out during four revolutions of the plate. (b) The value of calibration constant K, calculated in the height range of 1800–8000 m. The mean value is K=1.91.
In this paper we present the results of observations of the ice cloud cover under the lidar zenith scanning. Measurements were made in Tomsk (56∘28′ N, 85∘ E) in April–June 2018. Scanning was carried out at the rate of 0.5∘ s−1, which corresponds to a 3 arcmin shift of the sensing direction between laser pulses. The angle is measured from the vertical position of the radiation beam, which was set with an error of ±5 arcmin. Moreover, in some cases the scanning was carried out with the lidar axis passing through the zenith (ranging from −1 to +4∘), which made it possible to control the accuracy of the lidar vertical setting. The measurement data array is not large and is mainly used here for testing the lidar performance.
4.1 Zenith scanning at 1064 nm wavelength
Below we present the data for polarized components at 1064 nm related to radiation with initial circular polarization. The depolarization of linearly polarized radiation is generally less than that of circularly polarized radiation. For randomly distributed particles, the linear depolarization is 2 times less than that for the circular depolarization (Mishchenko and Hovenier, 1995; Gimmestad, 2008). For oriented particles the difference is smaller, since the BSPM element m12 is not equal to zero (Balin et al., 2011). The low value of depolarization results in the cross-polarized component very often not standing out against the background of the photodetector noise in the specular reflection. Therefore, the dependences of polarized components for 1064 nm are presented for initial circular polarization of the laser beam. Dependences Ico(α) for linear and circular polarizations for scan angles 0–4∘ do not differ within the error limits.
Figure 8 shows the lidar data observed on 6 April 2018. The recording starts at 10:25 LT (UTC+7), and the time from the start is shown on x axis. Figure 8a gives the component (signal intensity; mV), Fig. 8b gives the depolarization ratio (%), Fig. 8d gives the zenith scanning angle (arcmin), and the time axis is aligned with Fig. 8a and b. Data of weather sounding (Fig. 8c) are taken from the site of the University of Wyoming (http://weather.uwyo.edu/upperair/sounding.html, last access: 20 February 2020). Radiosonde sounding was carried out at the Novosibirsk station, about 250 km from Tomsk to the SW; two records were made at 07:00 and 19:00 LT. Of course, due to the distant location of the station and the rare launches of probes (once every 12 h), these data do not describe the fine structure of the ice cloud.
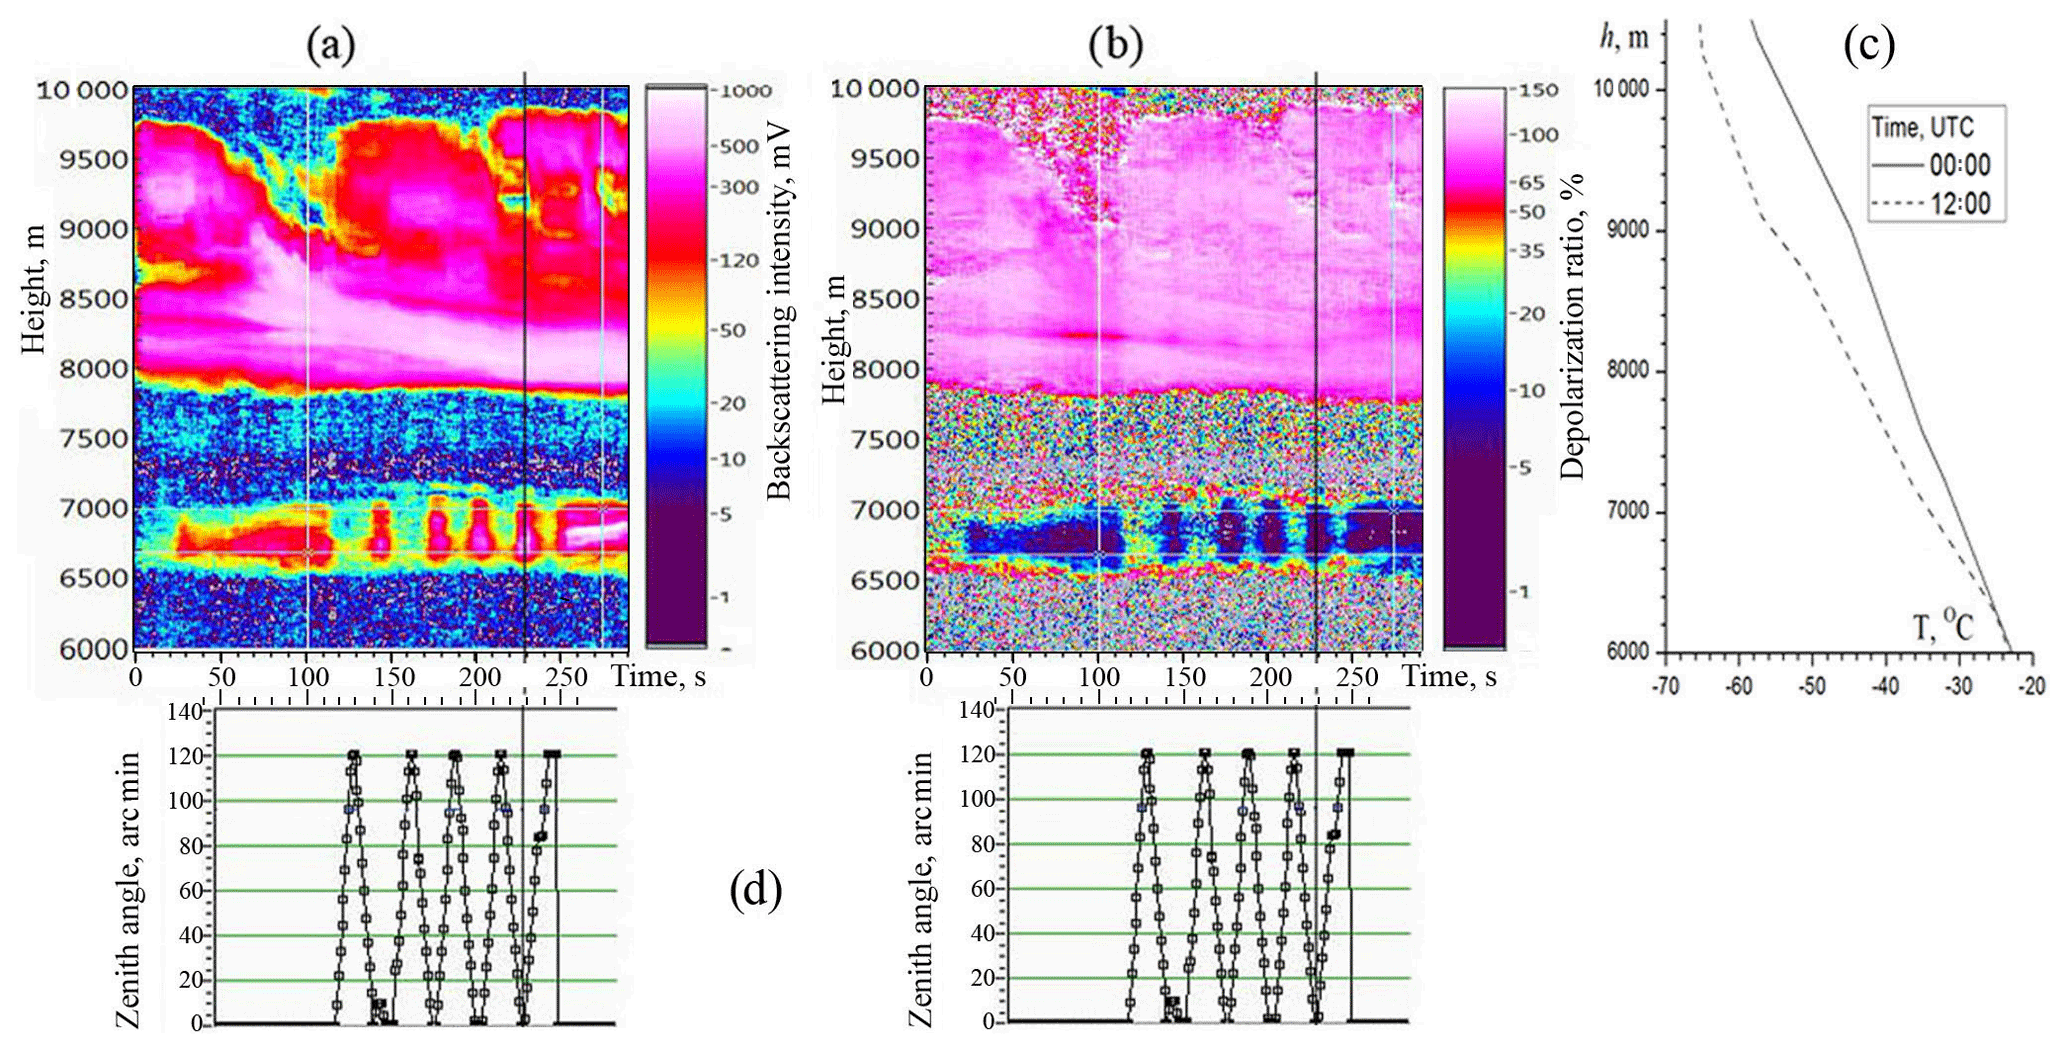
Figure 8Lidar data on 6 April 2018 at 10:25 LT (UTC+7) for the initial circular polarization. (a) Intensity of component. (b) Depolarization ratio . (c) Weather sounding data (Novosibirsk station at 07:00 and 19:00 LT). (d) Zenith tilt angle (arcmin); time axis is aligned with (a, b).
The duration of recording is 300 s. In the interval from 120 to 250 s, scanning was carried out in the range from 0 to 2∘. A high-level cloud consists of two layers. The thin bottom layer (6600–7000 m) has a temperature of −26 to −31 ∘C, and the top layer (7800–9800 m) temperature is −37 to −52 ∘C . The behavior of these layers is significantly different. Characteristics of the top layer do not change when scanning, which indicates the chaotic orientation of particles in the cloud. In the bottom layer a pronounced modulation of signal intensity and polarization is observed, characteristic of a predominantly horizontal orientation of particles. The maximum intensity of the signal with the vertical sensing direction corresponds to the minimum of the depolarization ratio. An extremely low value δcirc in the zenith direction –5 % corresponds to the specular reflection.
The other situation is observed on 2 June 2018 at 09:55 LT (Fig. 9). The duration of this recording is 550 s. The maximum inclination was 4∘, and the beam passed through the vertical by 1∘ while scanning. In Fig. 8a we saw clearly expressed the single line of the maximum signal because the vertical position was the edge position when scanning. When we scan our lidar from 4 to −1∘ and back, vertical positions (0∘) are close to each other. So in Fig. 9a two lines of maximum signals are close to each other and look like a double line.
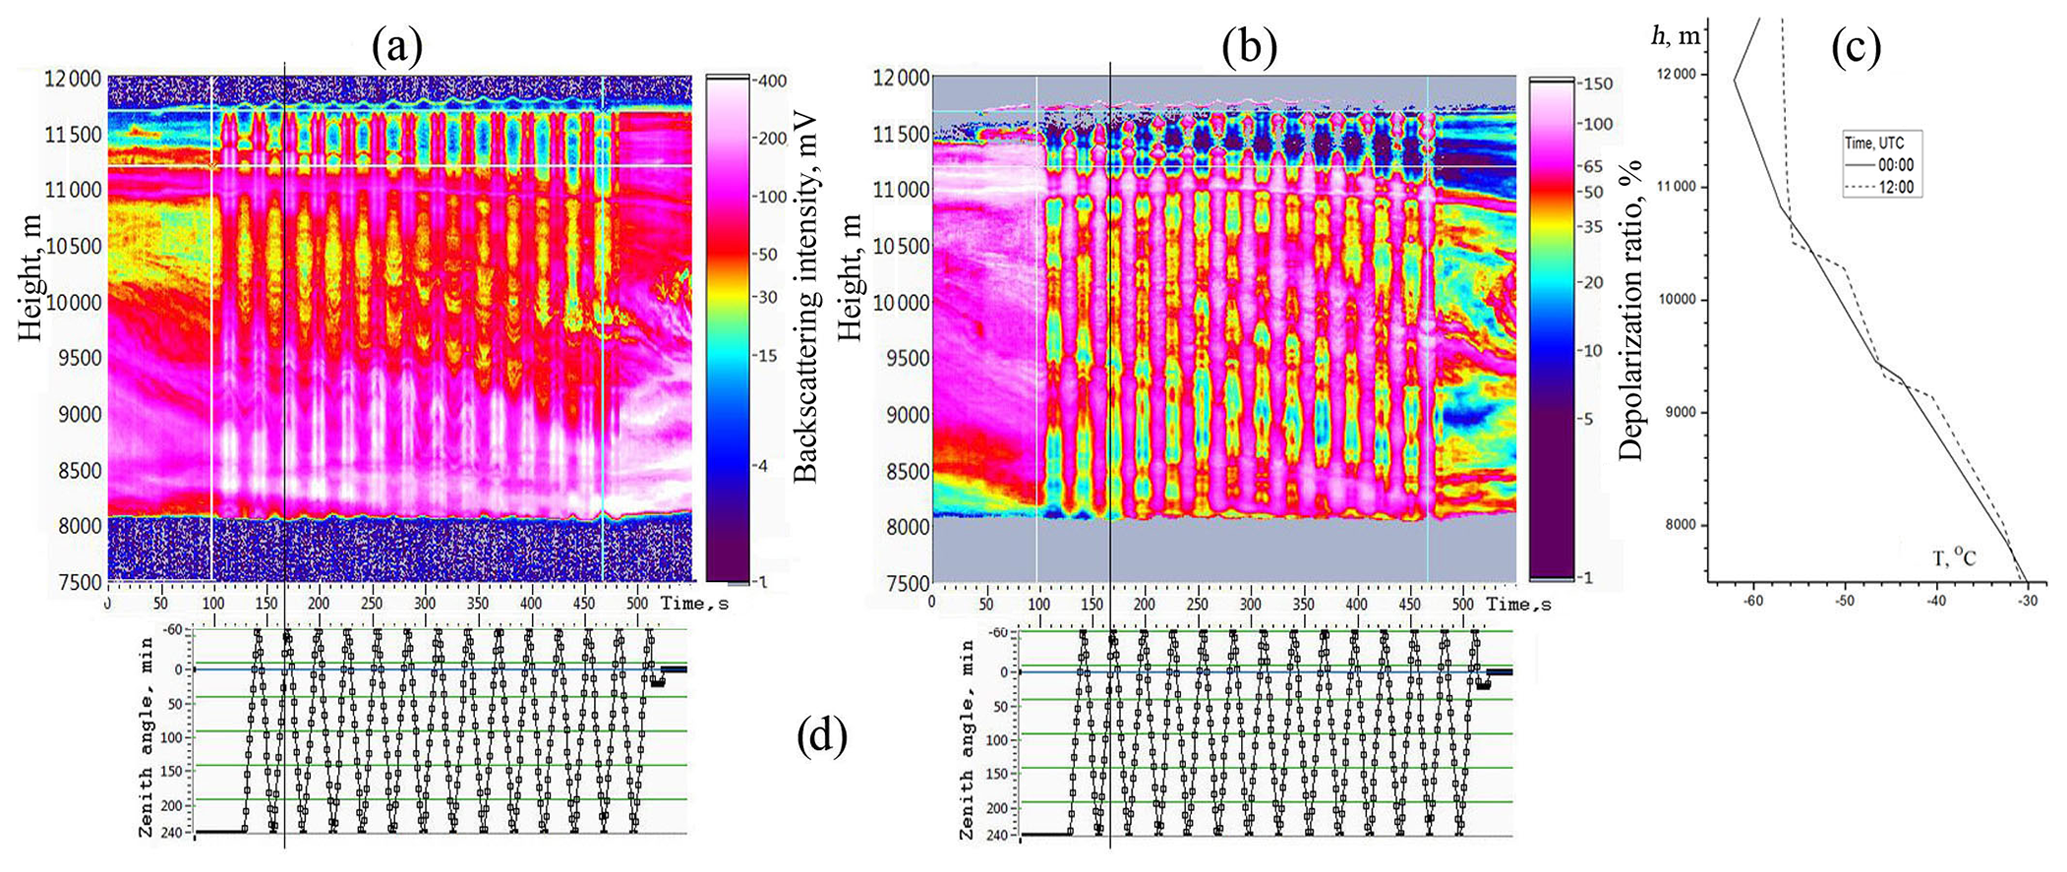
A cirrus cloud with a complex structure extends in a layer of 8–11.7 km. The temperature in the cloud varies from −34 to −60 ∘C. Pronounced modulation of the signal intensity and depolarization ratio is observed throughout the entire height of the cloud. As in the previous case, the maximum intensity of the signal corresponds to the minimum of depolarization ratio. However, the minimum values differ significantly in various parts of the cloud. In the lower part of the cloud, the value indicates the predominance of chaotically oriented particles and a small proportion of horizontally oriented particles. In the upper part (11.2–11.7 km) % is characteristic of mirror reflection and indicates a pronounced horizontal orientation of particles in this part of the cloud. Values of δcirc outside the vertical are close to 100 % throughout the entire cloud thickness. This suggests that particles in the cloud differ only in the degree of their horizontal orientation.
4.2 Dependence of the signal intensity on the lidar tilt angle
The ice clouds never constitute a formation uniform in height and constant in time. Pronounced layers with the thickness of hundreds of meters are regularly observed in the structure of ice clouds. They differ in the state of depolarization and signal intensity from the higher and lower regions and are supposedly homogeneous in composition and degree of particle orientation. However, the signal intensity and the depolarization ratio do not remain constant but vary with time rather quickly. The height of layers also varies. Weak values of the backscatter signals lead to the need of averaging the signals over the height of the selected layer and over about 3–5 min. As a result, it is necessary to preselect sections of the cloud, characterized by an approximately constant value of intensity and depolarization ratio and lasting for several scan cycles, to measure the dependence of echo signal characteristics on the tilt angle. An example of such a procedure for selecting the cloud sections to be studied is shown in Fig. 10.
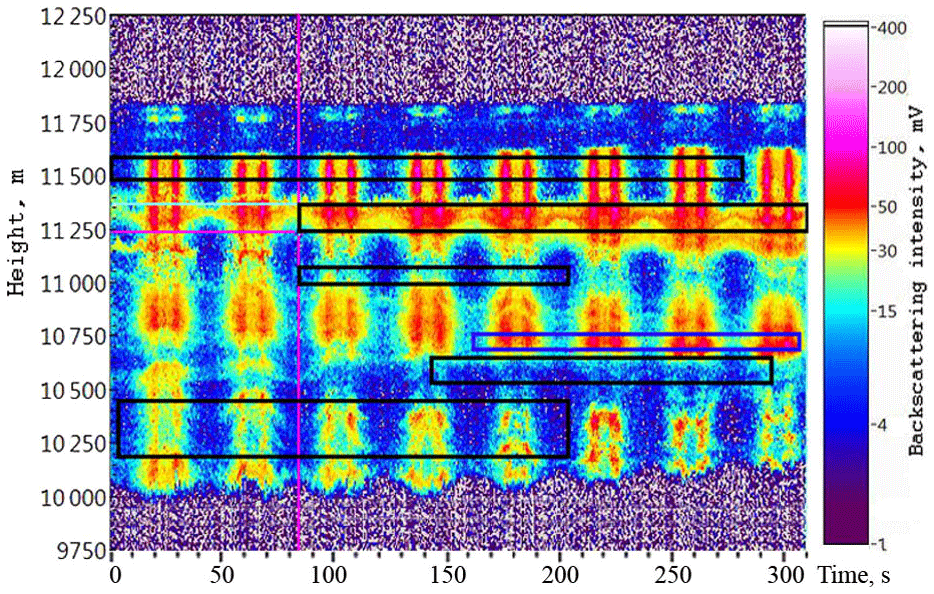
Figure 10Selection of cloud sections for further processing. Recorded on 2 June 2018 at 12:00–12:05 LT. Rectangles highlight areas which have a pronounced dependence on the tilt angle, and there is no signal overflow when the lidar is oriented to zenith.
In the given 5 min recording, six sections were selected (marked with rectangles), with the duration from three to seven scan cycles. The rest of cloud portions were not analyzed on this record. In total, about 20 records were selected during observations on 2 June 2018, which have a pronounced dependence on the tilt angle, and there is no signal overflow when the lidar is oriented to the zenith.
Figure 11 indicates the typical dependences of signal intensities of parallel (circular initial polarization) and cross-polarized components on the tilt angle α. The record shown in Fig. 11a was registered at 12:00 LT, with averaging of characteristics over the layer from 11 470 to 11 600 m. The record shown in Fig. 11b was made at 10:00 LT, with averaging of characteristics over the layer from 10 980 to 11 270 m. The signal was accumulated during 10 min. These measurements and all data, obtained in June 2018, are described satisfactorily by the following exponential dependence (red line in Fig. 11):
where I is the signal intensity, I0 is the offset of dependence determined by a signal without the specular component, A is the constant, depending on the contribution of specular reflection in total intensity, α is the tilt angle, w determines the width of distribution and α0 indicates the error of lidar targeting to the vertical. For Fig. 11a, w=42 arcmin, and for Fig. 11b, . The Gaussian function used in Noel and Sassen (2005; blue line in Fig. 1 is noticeably wider and poorly describes the observed distribution, perhaps because it does not take the intensity peak at α=0∘ into consideration).
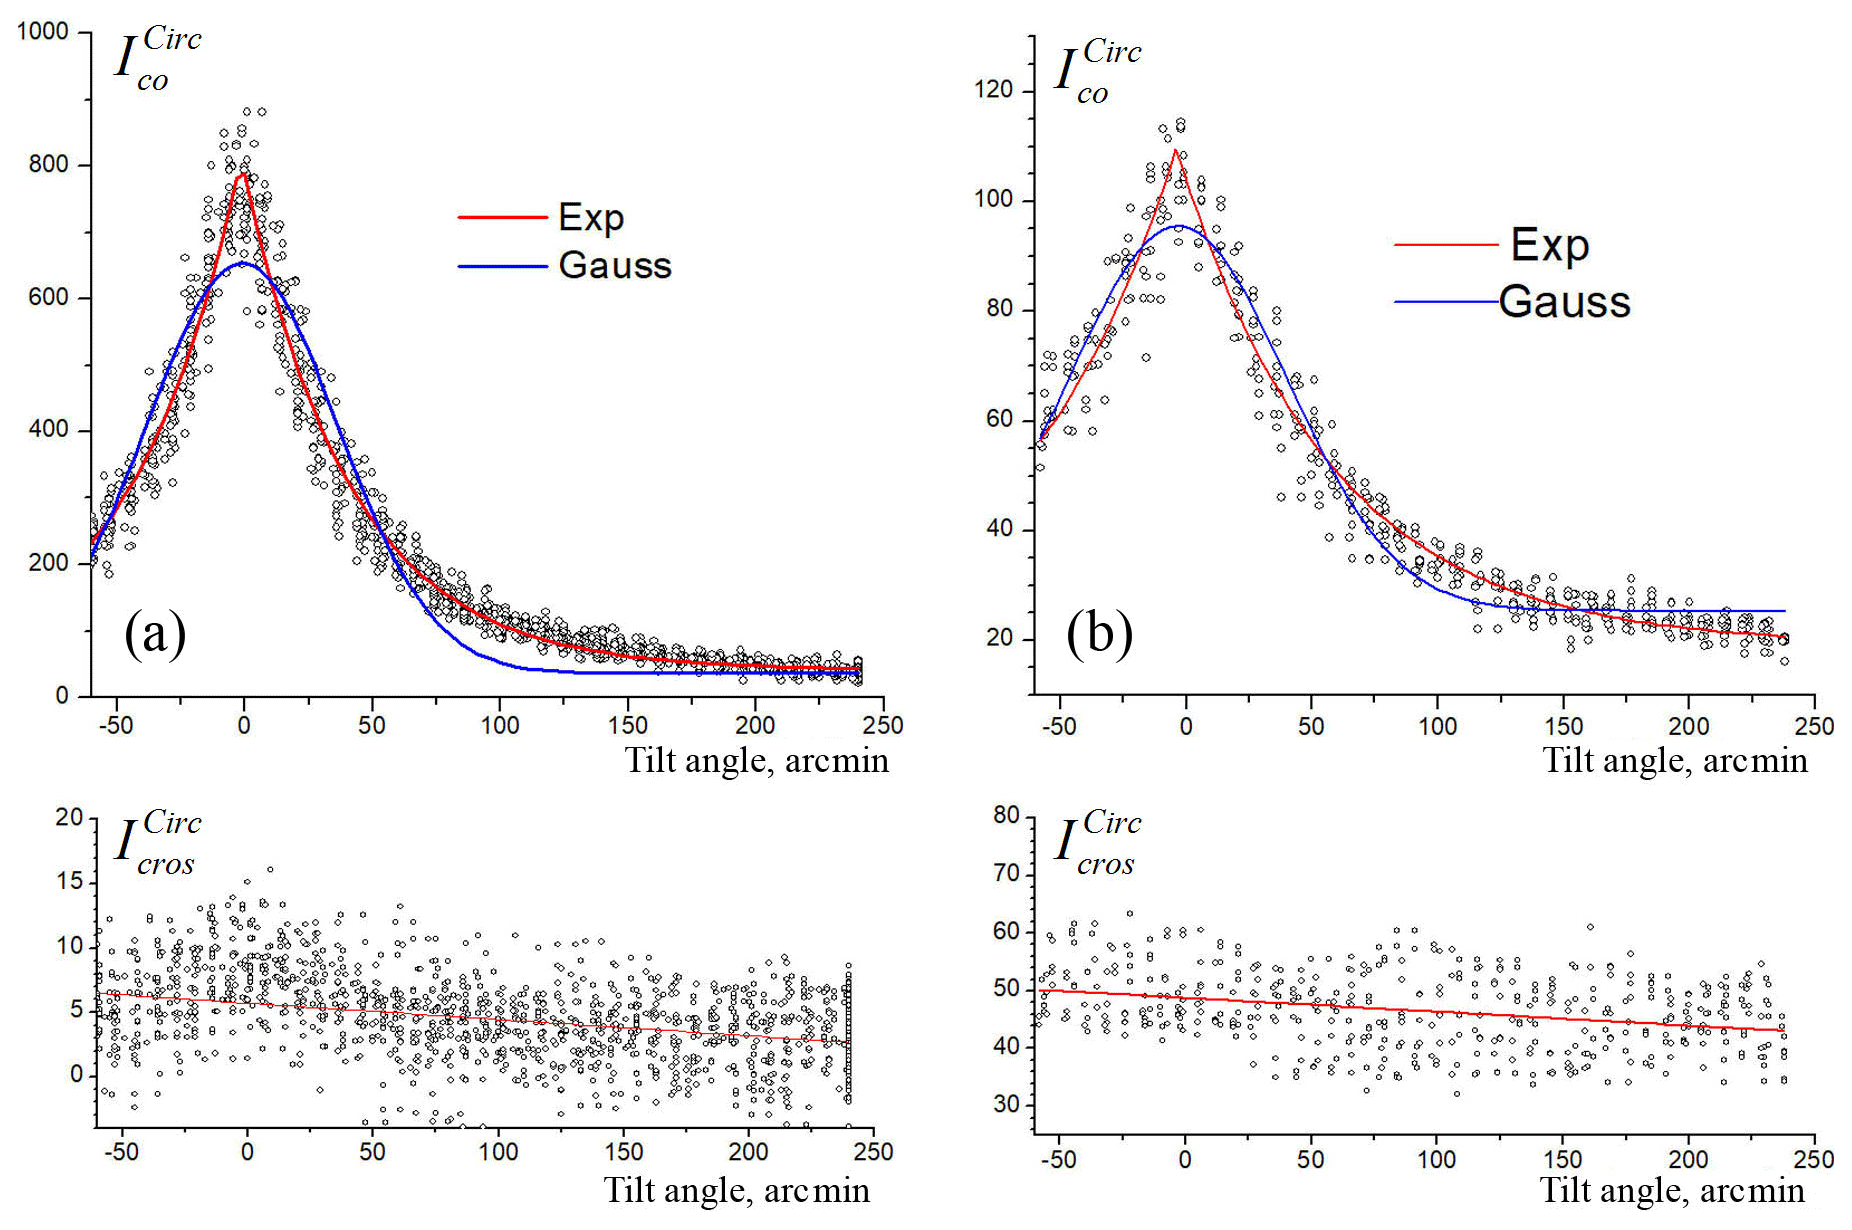
Figure 11Typical angular dependences of the intensity of polarization components on 2 June 2018. Top frames: co-polarized components . Bottom frames: . (a) Averaging over the layer from 11 470 to 11 600 m at 12:00 LT. (b) The layer 10 980–11 270 m at 10:00 LT. The record (a) shows low depolarization ratio and narrow (w=42 arcmin) distribution. The record (b) has a wider distribution (w=82 arcmin) and large depolarization.
Cross-polarized signals have random variations from pulse to pulse that are comparable with the average value. In most cases the values of show a weak decline of intensity with the angle, but these variations do not exceed instrumental errors (about 1 % for depolarization ratio). Figure 11a shows the variations even less than 0.5 %. Moreover, a slightly noticeable maximum at looks like signal penetration from the parallel to perpendicular channel. Therefore, we think that the linear trend is not statistically reliable. We can conclude that is practically independent of the tilt angle.
Figure 12 gives some selected dependences of intensity angle distributions for component . We did not find any correlation of the distribution parameters (A, I0, w) with the height of the selected area inside the cloud. Thus the selection of cloud portions presented in Fig. 12 is rather subjective. The only requirement is that these portions must have a pronounced dependence on the tilt angle, and there is no signal overflow when the lidar is oriented to the zenith. The dependences are normalized to the value I0 obtained by fitting according to the Eq. (1). Squares indicate the tilt angles, corresponding to the distribution width w. For all measurements the value w is within 40–160 arcmin. The shift α0 of the curve maximum from 0∘ is less than 2 min, which indicates a good lidar orientation to the zenith. Since the signal intensity offset I0 is determined by particles with any orientation (both random and horizontal), the ratio may reflect the contribution of mirror particles to the lidar signal. The left frame shows cases of a fairly narrow distribution, and w is within 40–75 arcmin. The ratio is less then 1.1. The right frame shows cases with ; among these cases there are distributions with a large (up to 159 arcmin) width.
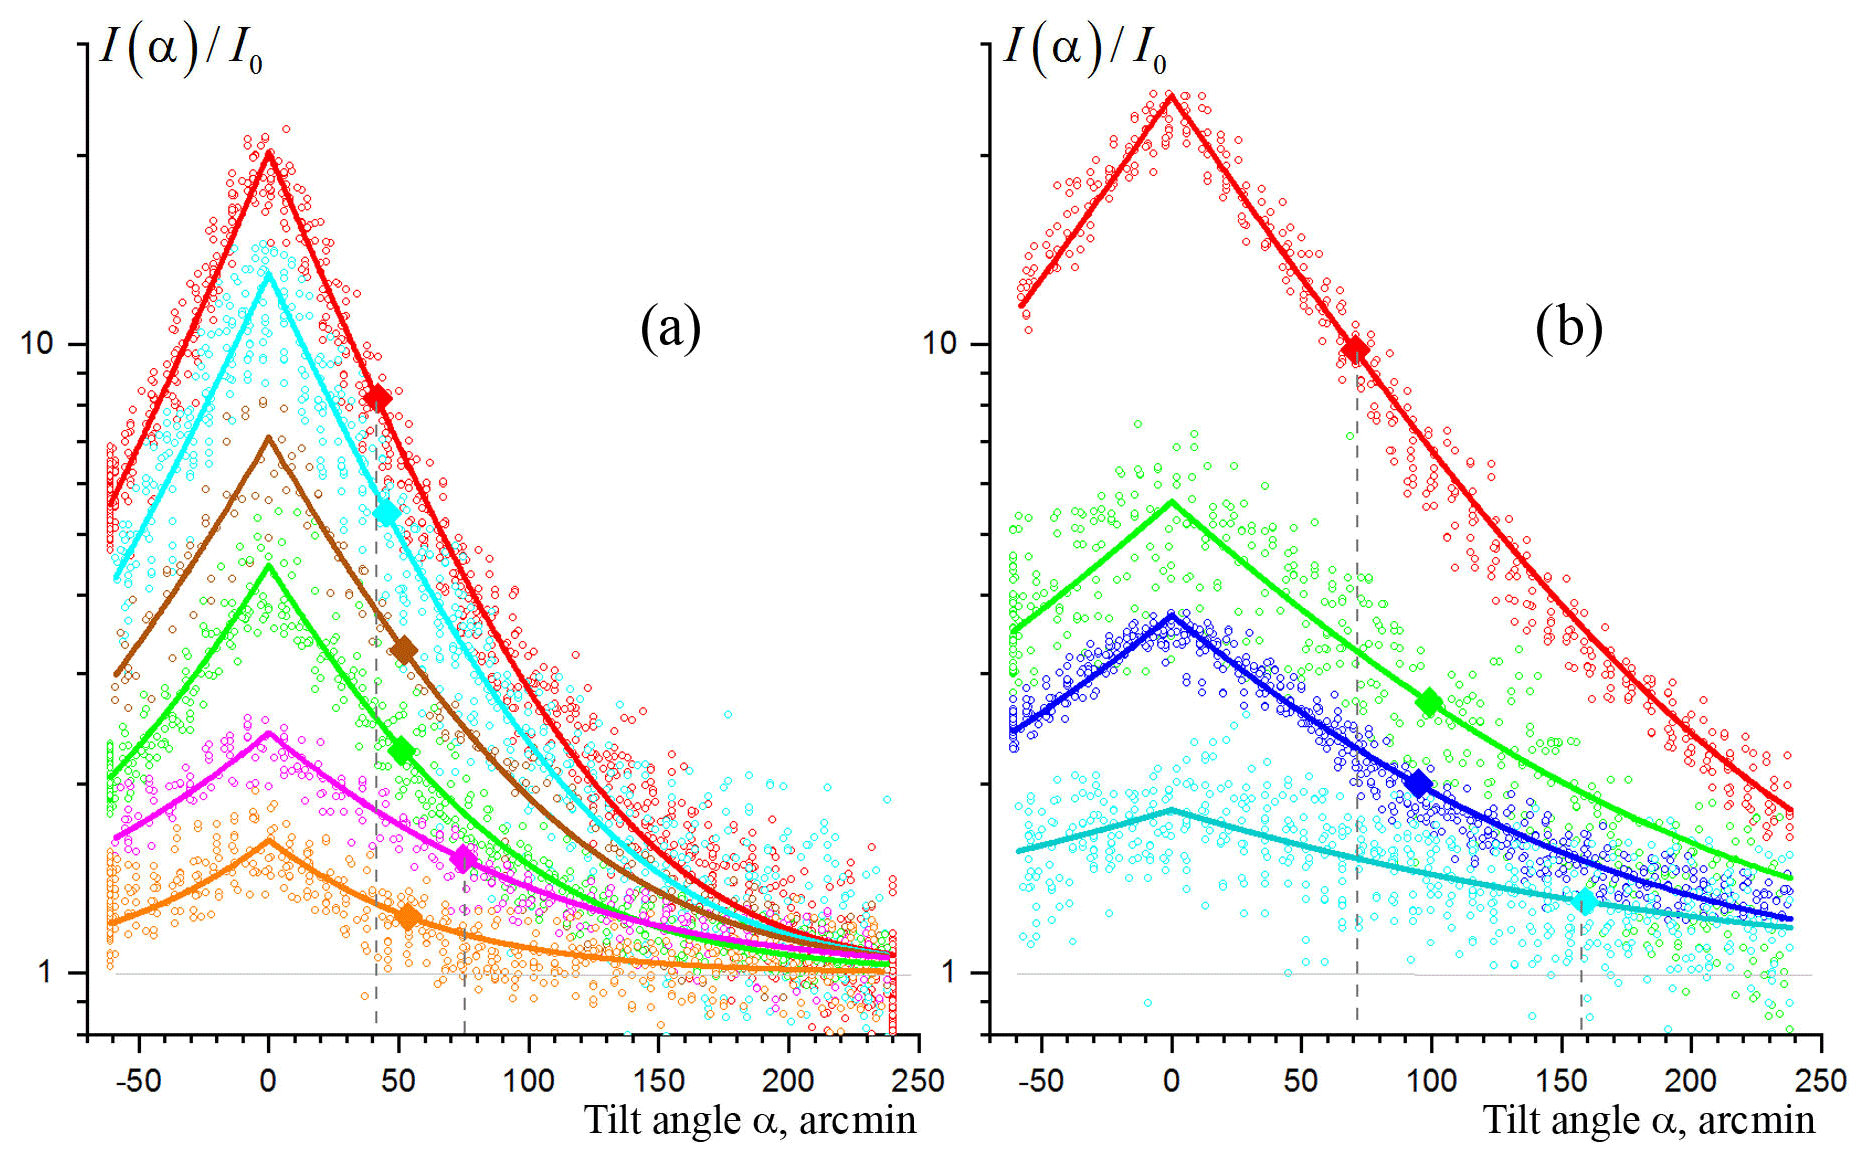
Figure 12Selected cases of observed distributions . For all curves the values of intensity are normalized to the values I0, obtained by fitting according to Eq. (1). Squares indicate the tilt angles, corresponding to the distribution width w. Panel (a) shows cases of a fairly narrow distribution; w is within 40–75 arcmin. The ratio is less then 1.1. Panel (b) shows cases with ; among these cases there are distributions with a large (up to 159 arcmin) width.
4.3 Angular distributions for green and infrared wavelengths
The obtained dependence Ico(α) in general terms should correspond to the distribution of specularly reflecting particles along the angles of deviation from the horizontal plane (flutter). However, due to the phenomenon of backscattered radiation diffraction on the particle's contour (Borovoi et al., 2008), the distribution is wider than the distribution of particles along the angles of inclination. In addition, the ratio of backscattering coefficients (color ratio) for (and for randomly oriented particles in any direction) is not equal to unity (Tao et al., 2008; Vaughan et al., 2010; Borovoi et al., 2014). Therefore, the distribution Ico(α) may depend on the radiation wavelength.
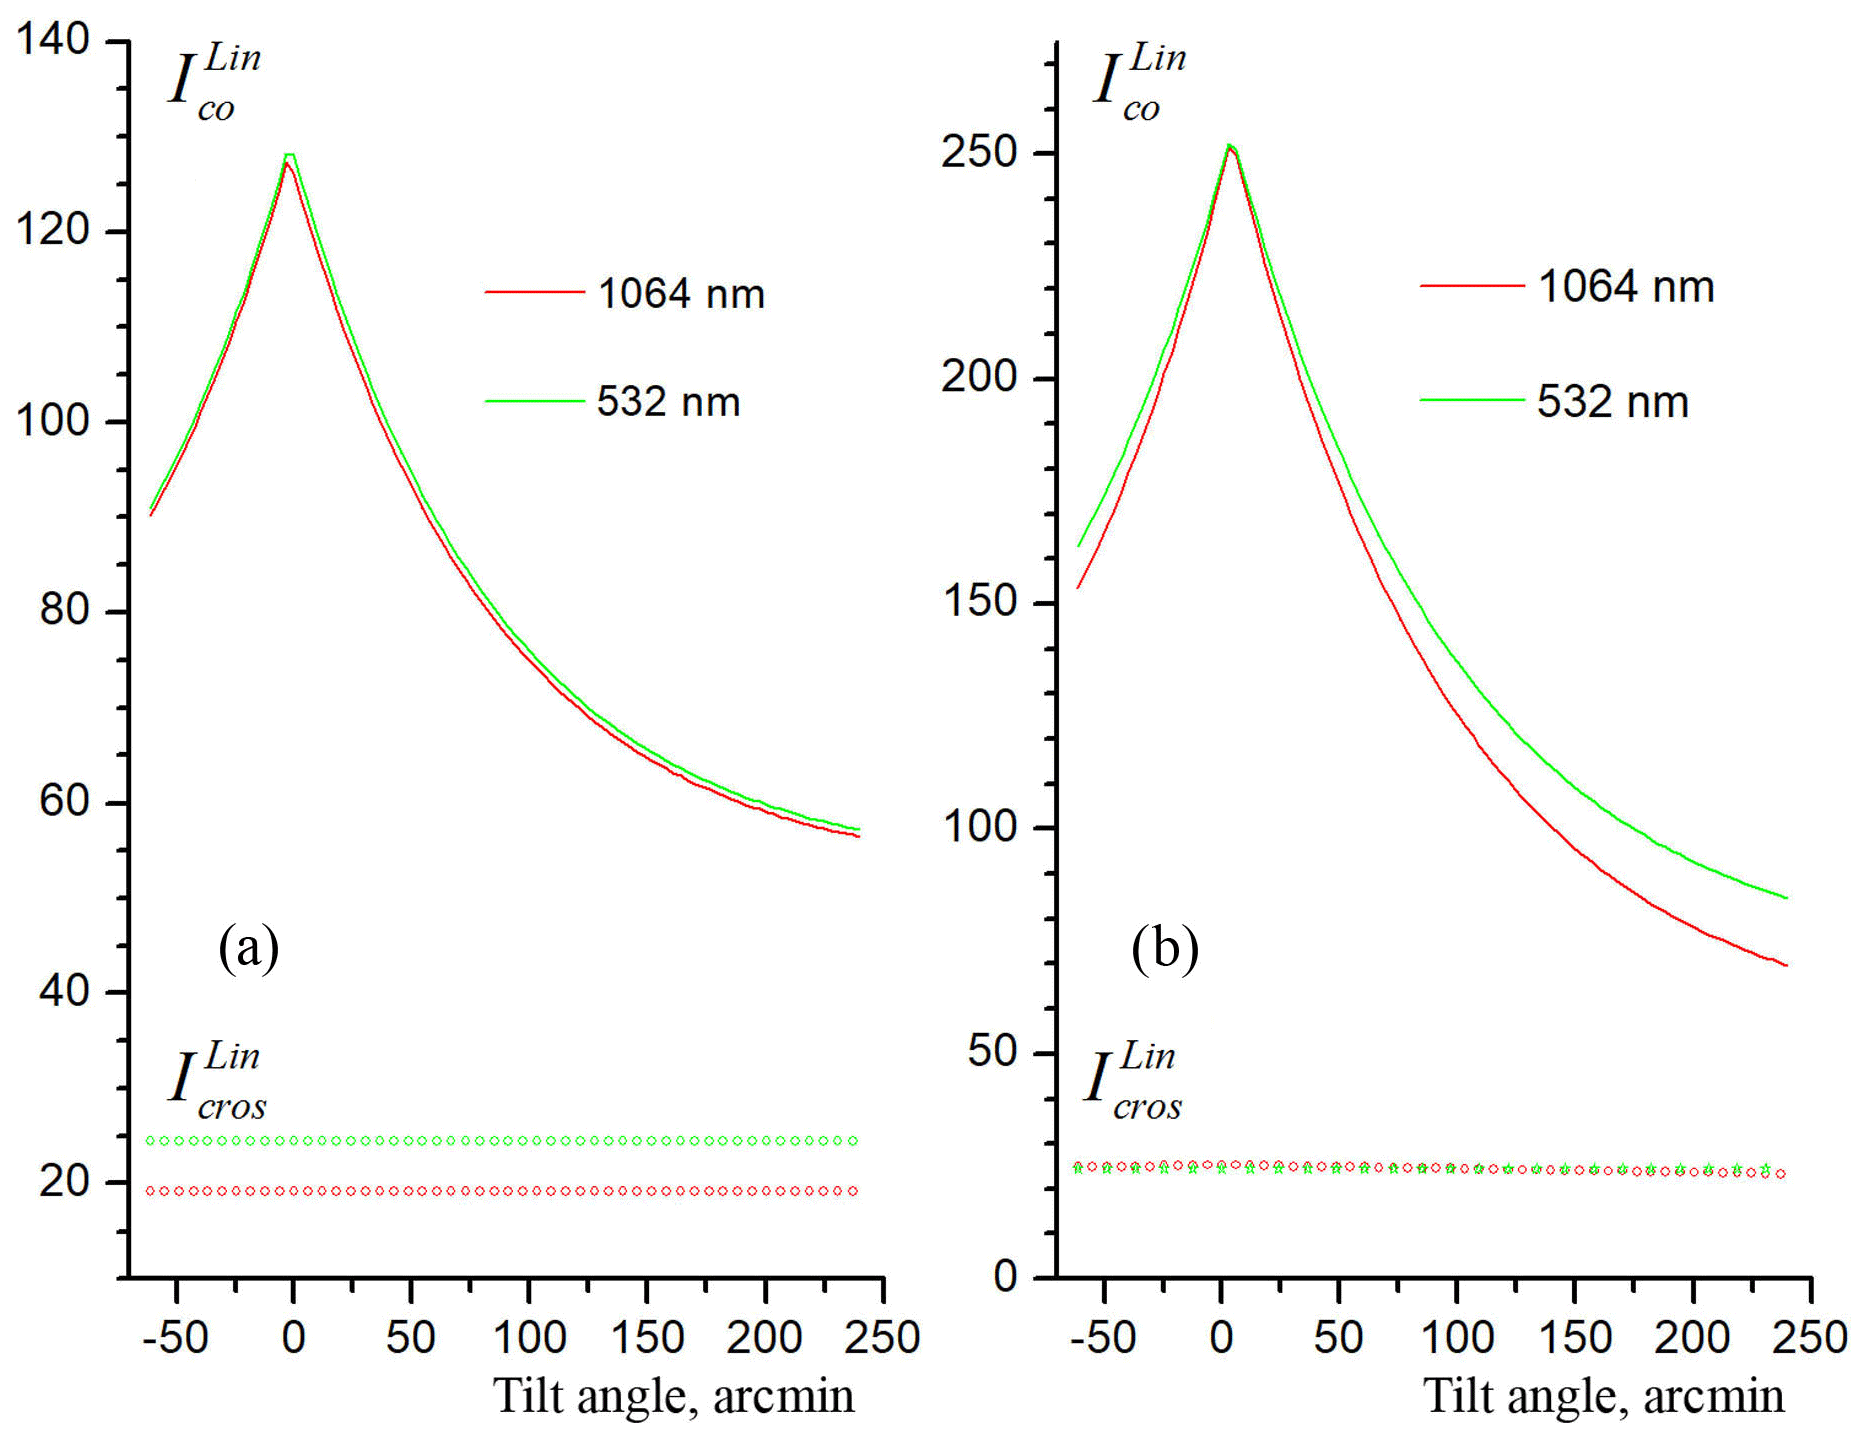
Figure 13Angular dependencies of polarization components for 532 nm (green) and 1064 nm (red). Two cases with the maximum angular differences are shown. In all other cases the distribution width w for 532 nm is equal to or bigger than that for 1064 nm.
As mentioned in the Sect. 2 the measurements for the wavelength of λ=532 nm were carried out only for linear polarization of radiation, as we used the quarter-wave plates in the transceiver for the wavelength λ=1064 nm. Two cases with the maximum angular differences are shown in Fig. 13. The relative sensitivity of photodetectors at 532 and 1064 nm was not calibrated. Therefore the intensities of polarization components for 532 nm (both and ) were normalized so that the intensity maximum of (0∘) in the vertical position coincided with (0∘) for 1064 nm. In Fig. 13a the angle distributions are the same, and in Fig. 13b the distribution for 532 nm is much wider (. In all other cases we have intermediate states: the distribution width w for 532 nm is equal to or bigger than that for 1064 nm. The reason for such behavior of dependences is not yet clear for the authors.
The scanning polarizing lidar LOSA-M3 is developed and operated in the Laboratory of Optical Sensing of the Atmosphere (LOSA) at the IAO SB RAS. The main purpose of this lidar is to study the optical characteristics of the mid- and high-level ice clouds at two wavelengths – 532 and 1064 nm. The lidar allows a smooth change of the tilt angle from the vertical with simultaneous conical (azimuthal) scanning. Such a measurement scheme makes it possible to study the preferential orientation of ice crystals in the clouds in detail. The lidar simultaneously measures the polarization characteristics of signals for linear and circular initial polarizations, which allows obtaining additional information about the anisotropy of scattering particles. Since the circular polarization signal does not depend on the rotation of the lidar relative to the direction of particle orientation, this polarization can be used as a reference for investigating the azimuthal orientation of the particles. At the same time, the lidar, like all of the LOSA aerosol-Raman lidars, has a Raman scattering channel (607 nm band, for night observations) and a system for combining near and far ranges, which allows it to be used for observing aerosol fields in the troposphere distances of 50 m–15 km.
During 2018, several series of measurements of the structure of the ice clouds in the zenith scan mode were carried out. The results show that the contribution of horizontally oriented particles, giving a specular reflection, can vary significantly in different parts of the cloud. The dependence of signal intensity on the tilt angle reflects the distribution of the particles deviation relative to the horizontal plane and is well described by the exponential dependence. The cross-polarized component in most cases shows a weak decline with the angle, but its variations are smaller than the measurement errors. We can conclude that is practically independent of the tilt angle. The angle distribution of the radiation for 532 nm in all experiments is equal to or wider than that for 1064 nm. The reason for such behavior of dependences is not yet clear to the authors.
Data used in this study are available upon request from the corresponding author (kokh@iao.ru).
GK and IP designed the lidar. MN and MK developed the software. GK, YuB and SN carried out the lidar measurements. SN and SS carried out the data analysis. GK prepared the paper, with contributions from all co-authors.
The authors declare that they have no conflict of interest.
The authors are grateful to Anatoli Borovoi and Alexander Konoshonkin for the fruitful discussion during the preparation of the article.
The development of the lidar LOSA-M3 was supported by the Russian Foundation for Basic Research (grant no. 18-55-81001). Measuring campaign and data proceedings were carried out with the financial support of the Ministry of Science and Higher Education of the Russian Federation (project no. AAAA-A17-117021310142-5).
This paper was edited by Ulla Wandinger and reviewed by four anonymous referees.
Althausen, D., Müller, D., Ansmann, A., Wandinger, U., Hube, H., Clauder, E., and Zörner, S.: Scanning sixwavelength eleven channel aerosol lidar, J. Atmos. Ocean. Tech., 17, 1469–1482, 2000.
Alvarez, J. M., Vaughan, M. A., Hostetler, C. A., Hunt, W. H., and Winker, D. M.: Calibration Technique for polarization-sensitive lidars, J. Atmos. Ocean. Tech., 23, 683–699, 2006.
Bairashin, G. S., Balin, Yu. S., Ershov, A. D., Kokhanenko, G. P., and Penner, I. E.: Lidar LOZA-MS for investigation of aerosol fields in troposphere, Opt. Eng., 44, 071209-1–071209-7, 2005.
Bairashin, G. S., Balin, Yu. S., Klemasheva, M. G., Kokhanenko, G. P., Penner, I. E., and Samoilova, S. V.: Aerosol-Raman lidar LOSA-M2, Quantum Electron+, 41, 945–949, 2011.
Balin, Yu., Kaul, B., Kokhanenko, G., and Winker, D.: Application of circularly polarized laser radiation for sensing of crystal clouds, Opt. Express, 17, 6849–6859, 2009.
Balin, Yu. S., Kaul, B. V., Kokhanenko, G. P., and Penner, I. E.: Observations of specular reflective particles and layers in crystal clouds, Opt. Express, 19, 6209–6214, 2011.
Belegante, L., Bravo-Aranda, J. A., Freudenthaler, V., Nicolae, D., Nemuc, A., Ene, D., Alados-Arboledas, L., Amodeo, A., Pappalardo, G., D'Amico, G., Amato, F., Engelmann, R., Baars, H., Wandinger, U., Papayannis, A., Kokkalis, P., and Pereira, S. N.: Experimental techniques for the calibration of lidar depolarization channels in EARLINET, Atmos. Meas. Tech., 11, 1119–1141, https://doi.org/10.5194/amt-11-1119-2018, 2018.
Biele, J., Beyerle, G., and Baumgarten, G.: Polarization lidar: Corrections of instrumental effects, Opt. Express, 7, 427–435, 2000.
Borovoi, A., Grishin, I., Naats, E., and Oppel, U.: Backscattering peak of hexagonal ice columns and plates, Opt. Lett., 25, 1388–1390, 2000.
Borovoi, A., Galileiskii, V., Morozov, A., and Cohen, A.: Detection of ice crystal particles preferably oriented in the atmosphere by use of the specular component of scattered light, Opt. Express, 16, 7625–7633, 2008.
Borovoi, A., Balin, Yu., Kokhanenko, G., Penner, I.; Konoshonkin, A., and Kustova, N.: Layers of quasi-horizontally oriented ice crystals in cirrus clouds observed by a two-wavelength polarization lidar, Opt. Express, 22, 24566–24573, 2014.
Bravo-Aranda, J. A., Belegante, L., Freudenthaler, V., Alados-Arboledas, L., Nicolae, D., Granados-Muñoz, M. J., Guerrero-Rascado, J. L., Amodeo, A., D'Amico, G., Engelmann, R., Pappalardo, G., Kokkalis, P., Mamouri, R., Papayannis, A., Navas-Guzmán, F., Olmo, F. J., Wandinger, U., Amato, F., and Haeffelin, M.: Assessment of lidar depolarization uncertainty by means of a polarimetric lidar simulator, Atmos. Meas. Tech., 9, 4935–4953, https://doi.org/10.5194/amt-9-4935-2016, 2016.
Breon, F.-M. and Dubrulle, B.: Horizontally oriented plates in clouds, J. Atmos. Sci., 61, 2888–2898, 2004.
Burton, S. P., Hair, J. W., Kahnert, M., Ferrare, R. A., Hostetler, C. A., Cook, A. L., Harper, D. B., Berkoff, T. A., Seaman, S. T., Collins, J. E., Fenn, M. A., and Rogers, R. R.: Observations of the spectral dependence of linear particle depolarization ratio of aerosols using NASA Langley airborne High Spectral Resolution Lidar, Atmos. Chem. Phys., 15, 13453–13473, https://doi.org/10.5194/acp-15-13453-2015, 2015.
Campbell, J. R., Vaughan, M. A., Oo, M., Holz, R. E., Lewis, J. R., and Welton, E. J.: Distinguishing cirrus cloud presence in autonomous lidar measurements, Atmos. Meas. Tech., 8, 435–449, https://doi.org/10.5194/amt-8-435-2015, 2015.
Chen, W. N., Chiang, C. W., and Nee, J. B.: Lidar ratio and depolarization ratio for cirrus clouds, Appl. Optics., 41, 6470–6476, 2002.
Chepfer, H., Brogniez, G., Goloub, P., Breon, F. M., and Flamant, P. H.: Observations of horizontally oriented ice crystals in cirrus clouds with POLDER-1/ADEOS-1, J. Quant. Spectrosc. Ra., 63, 521–543, 1999.
Cho, H. M., Yang, P., Kattawar, G. W., Nasiri, S. L., Hu, Y., Minnis, P., Trepte, C., and Winker, D.: Depolarization ratio and attenuated backscatter for nine cloud types: analyses based on collocated CALIPSO lidar and MODIS measurements, Opt. Express, 16, 3931–3948, 2008.
Del Guasta, M., Vallar, E., Riviere, O., Castagnoli, F., Venturi, V., and Morandi, M.: Use of polarimetric lidar for the study of oriented ice plates in clouds, Appl. Optics., 45, 4878–4887, 2006.
Di, H. G., Hua, H. B., Cui, Y., Hua, D. X., Li, B., and Song, Y. H.: Correction technology of a polarization lidar with a complex optical system, J. Opt. Soc. Am. A, 33, 1488–1494, 2016.
Eloranta, E.: High Spectral Resolution Lidar, in: Lidar: Range-Resolved Optical Remote Sensing of the Atmosphere, edited by: Weitkamp, C., Springer, New York, 2005.
Eloranta, E. W. and Piironen, P.: Depolarization measurements with the high spectral resolution lidar, Abstracts 17th Int. Laser Radar Conf., Sendai, Japan, 127–128, 1994.
Engelmann, R., Kanitz, T., Baars, H., Heese, B., Althausen, D., Skupin, A., Wandinger, U., Komppula, M., Stachlewska, I. S., Amiridis, V., Marinou, E., Mattis, I., Linné, H., and Ansmann, A.: The automated multiwavelength Raman polarization and water-vapor lidar PollyXT: the neXT generation, Atmos. Meas. Tech., 9, 1767–1784, https://doi.org/10.5194/amt-9-1767-2016, 2016.
Freudenthaler, V.: About the effects of polarising optics on lidar signals and the Δ90 calibration, Atmos. Meas. Tech., 9, 4181–4255, https://doi.org/10.5194/amt-9-4181-2016, 2016.
Freudenthaler, V., Esselborn, M., Wiegner, M., Heese, B., Tesche, M., Ansmann, A., Müller, D., Althausen, D., Wirth, M., Fix, A., Ehret, G., Knippertz, P., Toledano, C., Gasteiger, J., Garhammer, M., and Seefeldner, M.: Depolarization ratio profiling at several wavelengths in pure Saharan dust during SAMUM 2006, Tellus B, 61, 165–179, 2009.
Gimmestad, G. G.: Reexamination of depolarization in lidar measurements, Appl. Optics., 47, 3795–3802, 2008.
Groß, S., Freudenthaler, V., Schepanski, K., Toledano, C., Schäfler, A., Ansmann, A., and Weinzierl, B.: Optical properties of long-range transported Saharan dust over Barbados as measured by dual-wavelength depolarization Raman lidar measurements, Atmos. Chem. Phys., 15, 11067–11080, https://doi.org/10.5194/acp-15-11067-2015, 2015.
Haarig, M., Engelmann, R., Ansmann, A., Veselovskii, I., Whiteman, D. N., and Althausen, D.: 1064 nm rotational Raman lidar for particle extinction and lidar-ratio profiling: cirrus case study, Atmos. Meas. Tech., 9, 4269–4278, https://doi.org/10.5194/amt-9-4269-2016, 2016.
Haarig, M., Ansmann, A., Althausen, D., Klepel, A., Groß, S., Freudenthaler, V., Toledano, C., Mamouri, R.-E., Farrell, D. A., Prescod, D. A., Marinou, E., Burton, S. P., Gasteiger, J., Engelmann, R., and Baars, H.: Triple-wavelength depolarization-ratio profiling of Saharan dust over Barbados during SALTRACE in 2013 and 2014, Atmos. Chem. Phys., 17, 10767–10794, https://doi.org/10.5194/acp-17-10767-2017, 2017.
Hayman, M., Spuler, S., Morley, B., and VanAndel, J.: Polarization lidar operation for measuring backscatter phase matrices of oriented scatterers, Opt. Express, 20, 29553–29567, 2012.
Hayman, M., Spuler, S., and Morley, B.: Polarization lidar observations of backscatter phase matrices from oriented ice crystals and rain, Opt. Express, 22, 16976–16990, 2014.
Hoareau, C., Keckhut, P., Noel, V., Chepfer, H., and Baray, J.-L.: A decadal cirrus clouds climatology from ground-based and spaceborne lidars above the south of France (43.9∘ N–5.7∘ E), Atmos. Chem. Phys., 13, 6951–6963, https://doi.org/10.5194/acp-13-6951-2013, 2013.
Hu, Q., Goloub, P., Veselovskii, I., Bravo-Aranda, J.-A., Popovici, I. E., Podvin, T., Haeffelin, M., Lopatin, A., Dubovik, O., Pietras, C., Huang, X., Torres, B., and Chen, C.: Long-range-transported Canadian smoke plumes in the lower stratosphere over northern France, Atmos. Chem. Phys., 19, 1173–1193, https://doi.org/10.5194/acp-19-1173-2019, 2019.
Hunt, W. H., Winker, D. M., Vaughan, M. A., Powell, K. A., Lucker, P. L., and Weimer, C.: CALIPSO lidar description and performance assessment, J. Atmos. Ocean. Techn., 26, 1214–1228, 2009.
Kaul, B. V.: Symmetry of light backscattering matrices related to orientation of nonspherical aerosol particles, Atmospheric and Oceanic Optics, 13, 829–833, 2000.
Kaul, B. V. and Samokhvalov, I. V.: Orientation of particles in Ci crystal clouds. Part 1. Orientation at gravitational sedimentation, Atmospheric and Oceanic Optics, 18, 866–870, 2005.
Kaul, B. V., Samokhvalov, I. V., and Volkov, S. N.: Investigating of particle orientation in cirrus clouds by measuring backscattering phase matrices with lidar, Appl. Optics., 43, 6620–6628, 2004.
Klotzsche, S. and Macke, A.: Influence of crystal tilt on solar irradiance of cirrus clouds, Appl. Optics., 45 1034–1040, 2006.
Kochanenko, G. P., Simonova, G. V., Makogon, M. M., Ponomarev, Yu. N., and Rynkov, O. A.: Designing a beam expander for dual-wave laser fluorescence lidar, J. Opt. Technol., 79, 217–219, 2012.
Kokhanenko, G. P., Balin, Yu. S., Borovoi, A. G., Klemasheva, M. G., Nasonov, S. V., Novoselov, M. M., Penner, I. E., and Samoilova, S. V.: Investigations of the crystalline particle orientation in high-level clouds with a scanning lidar, in: Proc. SPIE 10833, 24th International Symposium on Atmospheric and Ocean Optics: Atmospheric Physics, Tomsk, 1083347, 13 December 2018, https://doi.org/10.1117/12.2504129, 2018.
Konoshonkin, A. V.: Simulation of the scanning lidar signals for a cloud of monodisperse quasi-horizontal oriented particle, Optika Atmosfery i Okeana, 29, 1053–1060, 2016 (in Russian).
Konoshonkin, A., Wang, Zh., Borovoi, A., Kustova, N., Liu, D., and Xie, Ch.: Backscatter by azimuthally oriented ice crystals of cirrus clouds, Opt. Express, 24, A1257–A1268, 2016.
Lavigne, C., Roblin, A., and Chervet, P.: Solar glint from oriented crystals in cirrus clouds, Appl. Optics., 47, 6266–6276, 2008.
Liou, K. N.: Influence of cirrus clouds on weather and climate processes: a global perspective, J. Geophys. Res., 103, 1799–1805, 1986.
Madonna, F., Rosoldi, M., Lolli, S., Amato, F., Vande Hey, J., Dhillon, R., Zheng, Y., Brettle, M., and Pappalardo, G.: Intercomparison of aerosol measurements performed with multi-wavelength Raman lidars, automatic lidars and ceilometers in the framework of INTERACT-II campaign, Atmos. Meas. Tech., 11, 2459–2475, https://doi.org/10.5194/amt-11-2459-2018, 2018.
Masuda, K. and Ishimoto, H.: Influence of particle orientation on retrieving cirrus cloud properties by use of total and polarized reflectances from satellite measurements, J. Quant. Spectrosc. Ra., 85, 183–193, 2004.
McCullough, E. M., Sica, R. J., Drummond, J. R., Nott, G., Perro, C., Thackray, C. P., Hopper, J., Doyle, J., Duck, T. J., and Walker, K. A.: Depolarization calibration and measurements using the CANDAC Rayleigh–Mie–Raman lidar at Eureka, Canada, Atmos. Meas. Tech., 10, 4253–4277, https://doi.org/10.5194/amt-10-4253-2017, 2017.
McCullough, E. M., Sica, R. J., Drummond, J. R., Nott, G. J., Perro, C., and Duck, T. J.: Three-channel single-wavelength lidar depolarization calibration, Atmos. Meas. Tech., 11, 861–879, https://doi.org/10.5194/amt-11-861-2018, 2018.
McGill, M. J., Hlavka, D. L., Hart, W. D., Spinhirne, J. D., Scott, V. S., and Schmid, B.: The Cloud Physics Lidar: Instrument description and initial measurement results, Appl. Optics., 41, 3725–3734, 2002.
Mishchenko, M. I. and Hovenier, J. W.: Depolarization of light backscattered by randomly oriented nonspherical particles, Opt. Lett., 20, 1356–1358, 1995.
Neely, R. R., Hayman, M., Stillwell, R. A., Thayer, J. P., Hardesty, R. M., O'Neill, M., Shupe, M. D., and Alvarez, C.: Polarization Lidar at Summit, Greenland for the Detection of Cloud Phase and Particle Orientation, J. Atmos. Ocean. Tech., 30, 1635–1655, 2013.
Noel, V. and Chepfer, H.: A global view of horizontally oriented crystals in ice clouds from Cloud-Aerosol Lidar and Infrared Pathfinder Satellite Observation (CALIPSO), J. Geophys. Res., 115, D00H23, https://doi.org/10.1029/2009JD012365, 2010.
Noel, V. and Sassen, K.: Study of ice crystal orientation in ice clouds from scanning polarization lidar observations, J. Appl. Meteorol., 44, 653–664, 2005.
Noel, V., Chepfer, H., Ledanois, G., Delaval, A., and Flamant, P. H.: Classification of particle effective shape ratios in cirrus clouds based on the lidar depolarization ratio, Appl. Optics., 41, 4245–4257, 2002.
Nott, G., Duck, T., Doyle, J., Coffin, M., Perro, C., Thackray, C., Drummond, J., Fogal, P., McCullough, E., and Sica, R.: A remotely operated lidar for aerosol, temperature, and water vapor profiling in the High Arctic, J. Atmos. Ocean. Tech., 29, 221–234, 2012.
Pal, S. R. and Carswell, A. I.: Polarization properties of lidar scattering from clouds at 347 nm and 694 nm, Appl. Optics., 17, 2321–2328, 1978.
Platt, C. M. R.: Lidar observations of a mixed-phase altostratus cloud, J. Appl. Meteorol., 16, 339–345, 1977.
Platt, C. M. R.: Lidar backscatter from horizontal ice crystal plates, J. Appl. Meteorol., 17, 482–488, 1978.
Platt, C. M. R., Abshire, N. L., and McNice, G. T.: Some Microphysical Properties of an Ice Cloud from Lidar Observation of Horizontally Oriented Crystals, J. Appl. Meteorol., 17, 1220–1224, 1978.
Reichardt, J., Wandinger, U., Klein, V., Mattis, I., Hilber, B., and Begbie, R.: RAMSES: German Meteorological Service autonomous Raman lidar for water vapor, temperature, aerosol, and cloud measurements, Appl. Optics., 51, 8111–8131, 2012.
Samokhvalov, I. V., Nasonov, S. V., Stykon, A. P., Bryukhanov, I. D., Borovoi, A. G., Volkov, S. N., Kustova, N. V., and Konoshonkin, A. V.: Investigation of phase matrices of cirrus containing ensembles of oriented ice particles, in: Proc. SPIE 9292, 20th International Symposium on Atmospheric and Ocean Optics: Atmospheric Physics, Novosibirsk, 92922M, 25 November 2014, https://doi.org/10.1117/12.2075562, 2014.
Sassen, K.: Ice crystal habit discrimination with the optical backscatter depolarization technique, J. Appl. Meteorol., 16, 425–431, 1977.
Sassen, K.: Corona-produsing cirrus cloud properties derived from polarization lidar and photographic analyses, Appl. Optics., 30, 3421–3428, 1991.
Sassen, K. and Benson, S.: A midlatitude cirrus cloud climatology from the Facility for Atmospheric Remote Sensing: II. Microphysical properties derived from lidar depolarization, J. Atmos. Sci., 58, 2103–2112, 2001.
Sassen, K., Griffin, M. K., and Dodd, G. C.: Optical scattering and microphysical properties of subvisual cirrus clouds, and climatic implications, J. Appl. Meteorol., 28, 91–98, 1989.
She, C.-Y.: Spectral structure of laser light scattering revisited: Bandwidths of nonresonant scattering lidars, Appl. Optics., 40, 4875–4884, 2001.
Simonova, G. V., Balin, Yu. S., Kokhanenko, G. P., Ponomarev, Yu. N., and Rynkov, O. A.: Scanning multi-wave lidar for atmosphere objects sensing, Invention patent of Russian Federation, No. 2593524, available at: https://patentdb.ru/patent/2593524 (last access: 20 February 2020), 2015 (in Russsian).
Spinhirne, J. D., Hansen, M. Z., and Caudill, L. O.: Cloud top remote sensing by airborne lidar, Appl. Optics., 21, 1564–1571, 1982.
Stillwell, R. A., Neely III, R. R., Thayer, J. P., Shupe, M. D., and Turner, D. D.: Improved cloud-phase determination of low-level liquid and mixed-phase clouds by enhanced polarimetric lidar, Atmos. Meas. Tech., 11, 835–859, https://doi.org/10.5194/amt-11-835-2018, 2018.
Strawbridge, K. B.: Developing a portable, autonomous aerosol backscatter lidar for network or remote operations, Atmos. Meas. Tech., 6, 801–816, https://doi.org/10.5194/amt-6-801-2013, 2013.
Summa, D., Di Girolamo, P., Stelitano, D., and Cacciani, M.: Characterization of the planetary boundary layer height and structure by Raman lidar: comparison of different approaches, Atmos. Meas. Tech., 6, 3515–3525, https://doi.org/10.5194/amt-6-3515-2013, 2013.
Tao, Z., McCormick, M. P., Wu, D., Liu, Z., and Vaughan, M. A.: Measurements of cirrus cloud backscatter color ratio with a two-wavelength lidar, Appl. Optics., 47, 1478–1485, 2008.
Thomas, L., Cartwright, J. C., and Wareing, D. P.: Lidar observation of the horizontal orientation of ice crystals in cirrus clouds, Tellus B, 42, 211–216, 1990.
Vaughan, M. A., Liu, Z., McGill, M. J., Hu, Y., and Obland, M. D.: On the spectral dependence of backscatter from cirrus clouds: Assessing CALIOP's 1064 nm calibration assumptions using cloud physics lidar measurements, J. Geophys. Res., 115, D14206, https://doi.org/10.1029/2009JD013086, 2010.
Veselovskii, I., Goloub, P., Podvin, T., Tanre, D., Ansmann, A., Korenskiy, M., Borovoi, A., Hu, Q., and Whiteman, D. N.: Spectral dependence of backscattering coefficient of mixed phase clouds over West Africa measured with two-wavelength Raman polarization lidar: Features attributed to ice-crystals corner reflection, J. Quant. Spectrosc. Ra., 202, 74–80, 2017.
Volkov, S. N., Kaul, B. V., and Samokhvalov, I. V.: A technique for processing of lidar measurements of backscattering matrices, Atmospheric and Oceanic Optics, 15, 891–895, 2002.
Whiteman, D. N., Veselovskii, I., Cadirola, M., Rush, K., Comer, J., Potter, J., and Tola, R.: Demonstration Measurements of Water Vapor, Cirrus Clouds, and Carbon Dioxide Using a High-Performance Raman Lidar, J. Atmos. Ocean. Tech., 24, 1377–1388, 2007.
Yoshida, R., Okamoto, H., Hagihara, Y., and Ishimoto, H.: Global analysis of cloud phase and ice crystal orientation from Cloud-Aerosol Lidar and Infrared Pathfinder Satellite Observation (CALIPSO) data using attenuated backscattering and depolarization ratio, J. Geophys. Res., 115, D00H32, https://doi.org/10.1029/2009JD012334, 2010.
You, Y., Kattawar, G. W., Yang, P., Hu, Y. X., and Baum, B. A.: Sensitivity of depolarized lidar signals to cloud and aerosol particle properties, J. Quant. Spectrosc. Ra., 100, 470–482, 2006.
Young, A. T.: Revised depolarization corrections for atmospheric extinction, Appl. Optics., 19, 3427–3428, 1980.