the Creative Commons Attribution 4.0 License.
the Creative Commons Attribution 4.0 License.
 | 31 Mar 2020
Real-time pollen monitoring using digital holography
Eric Sauvageat
Yanick Zeder
Kevin Auderset
Bertrand Calpini
Bernard Clot
Benoît Crouzy
Thomas Konzelmann
Gian Lieberherr
Fiona Tummon
Konstantina Vasilatou
We present the first validation of the Swisens Poleno, currently the only operational automatic pollen monitoring system based on digital holography. The device provides in-flight images of all coarse aerosols, and here we develop a two-step classification algorithm that uses these images to identify a range of pollen taxa. Deterministic criteria based on the shape of the particle are applied to initially distinguish between intact pollen grains and other coarse particulate matter. This first level of discrimination identifies pollen with an accuracy of 96 %. Thereafter, individual pollen taxa are recognized using supervised learning techniques. The algorithm is trained using data obtained by inserting known pollen types into the device, and out of eight pollen taxa six can be identified with an accuracy of above 90 %. In addition to the ability to correctly identify aerosols, an automatic pollen monitoring system needs to be able to correctly determine particle concentrations. To further verify the device, controlled chamber experiments using polystyrene latex beads were performed. This provided reference aerosols with traceable particle size and number concentrations in order to ensure particle size and sampling volume were correctly characterized.
Please read the corrigendum first before continuing.
-
Notice on corrigendum
The requested paper has a corresponding corrigendum published. Please read the corrigendum first before downloading the article.
-
Article
(3753 KB)
-
The requested paper has a corresponding corrigendum published. Please read the corrigendum first before downloading the article.
- Article
(3753 KB) - Full-text XML
- Corrigendum
- BibTeX
- EndNote


The incidence of pollinosis and related diseases has increased considerably over the past decades, sparking growing research interest into aeroallergens and pollen monitoring. Among aeroallergens, pollen is the most important impacting approximately 20 % of the population in Switzerland and other high-income countries (D'Amato et al., 2007; Wüthrich et al., 1995; Ring et al., 2001). Most often, sensitized patients exposed to allergenic pollen experience symptoms of allergic rhinitis or hay fever, but exposure to pollen has also been shown to exacerbate the development of more severe diseases like asthma, all of which have significant effects on public health and the economy (Greiner et al., 2012; Gamble et al., 2008).
Beyond the issue of public health, the airborne transport of pollen plays a key role in ecosystem dynamics, with important implications for agriculture, forestry, and the geographic dispersion of plants (Garzia-Mozo, 2011; Oteros et al., 2014). The relevance of pollen and other bioaerosols for atmospheric chemistry and physics has also been increasingly acknowledged since they represent a significant fraction of atmospheric particulate matter and have been shown to influence cloud formation and precipitation (Jaenicke, 2005; Pöschl, 2005; Möhler et al., 2007; Deguillaume et al., 2008; Pope, 2010). Furthermore, in the context of climate change, pollen concentrations undergo fluctuations in terms of taxa, abundance, and seasonal trends. Pollen monitoring thus provides valuable information about the evolution of the local biosphere and its response to anthropogenic forcings such as pollutant emission or intensive urbanization. While still uncertain, some evidence shows that the combination of a globally warming climate and the perpetuation of contemporary human lifestyle is very likely to increase the prevalence, intensity, and related costs of pollen-related allergenic diseases in the coming decades (Ring et al., 2001; D'Amato et al., 2001, 2016; Beggs, 2016).
Airborne pollen has been monitored since the mid-twentieth century in Switzerland and elsewhere in Europe (Clot, 2003; Spieksma, 1990), most commonly with Hirst-type samplers (Hirst, 1952). These instruments continuously collect airborne particles on a rotating cylinder tape, which is then collected, and pollen particles are manually identified and counted using optical microscopy, typically on a weekly basis. Because this is such a time- and labour-intensive method, the spatial and temporal resolution of the measurements is severely limited. Another drawback of this type of sampler is the inevitable delay between the observations and their analysis (up to 9 d), which has important implications in terms of pollen forecasts. In particular, the availability of real-time data with high temporal resolution is a key step (Sofiev, 2019) in the development of accurate forecasting models for atmospheric pollen transport (Pasken and Pietrowicz, 2005; Schueler et al., 2006; Sofiev et al., 2006; Vogel et al., 2008; Zink et al., 2013; Sofiev, 2017). More accurate predictions would represent a tremendous asset for both the scheduling of patients' activities and the planning of their medical treatment.
To respond to the need for real-time pollen information, numerous partly or fully automated monitoring systems have been developed and investigated over the past decade, with some recently having reached an operational level. Among the existing devices on the market, two main categories of instruments can be identified in terms of the different techniques utilized, either microscope-based or in situ measurements (Kawashima et al., 2007; Perring et al., 2015; Oteros et al., 2015; Crouzy et al., 2016; Šauliene et al., 2019). The former aim to automatize the microscopic analysis process, while the latter make use of air-flow cytometry measurements, avoiding the collection step and performing real-time particle-by-particle identification. In the category of air-flow cytometers, most existing devices rely on fluorescence and elastic light-scattering measurements combined with machine-learning algorithms to identify and quantify airborne pollen concentrations. Some of these systems have already shown promising results and are currently tested in different European countries (Crouzy et al., 2016; Šauliene et al., 2019; Chappuis et al., 2019). Automatic pollen monitoring is part of a broader field of research on automatic bioaerosol monitoring (Kawashima et al., 2017; Calvo et al., 2018; O'Connor et al., 2015; Savage et al., 2017), which was the object of a recent review article (Huffman et al., 2019).
In this paper we evaluated a new automated pollen monitoring system based on air-flow cytometry, the Swisens Poleno. This device captures holographic images of each airborne particle in addition to measurements of optical properties such as fluorescence intensity, lifetime, and elastic light scattering. Here, we focus on the use of digital holography for online pollen monitoring since this technique allows a certain degree of visual identification of pollen taxa. We use a combination of classical image analysis and a neural network algorithm to assess the performance of the instrument in terms of pollen identification compared to manually classified calibration sets. Aerosol sampling, particle sizing, and counting performance are evaluated using a reference particle counter at the Swiss Federal Institute of Metrology, METAS (Horender et al., 2019).
In the following section, the Swisens Poleno air-flow cytometer is presented as well as the methodology used for the data analysis. Thereafter, the performance achieved in pollen identification and counting using holographic images from the device is shown. Although the focus of the present paper is on the use of digital holography to identify pollen grains, a validation of the output of the fluorescence using standard particles is also performed. Finally, the significance of the results for pollen monitoring are discussed, and an overview of the future perspectives for this new technology is provided.
2.1 Swisens Poleno
We used the first unit of the commercially available Poleno device developed by Swisens AG (Switzerland). The device provides in-flight measurement of particle shape, size, and fluorescence using various light sources and detectors. The schematic structure of the device is presented in Fig. 1. Laser light scattering triggers the measurement, together with providing a first estimation of particle size, velocity, and alignment by combining the information of two trigger lasers. Following the trigger, two focused images at 90 ∘ from each other are reconstructed using digital holography as in Berg and Videen (2011), and UV-induced fluorescence produces information regarding the particle composition. UV-induced fluorescence lifetime and spectra are measured at three different excitation wavelengths (280, 365, and 405 nm) using five measurement emission windows between 320 and 720 nm. Finally, a measurement of the time-resolved optical polarization characteristics of the particle is acquired before it exits the device.

Figure 1Measurement principle of the Swisens Poleno (courtesy Swisens AG).
Since atmospheric pollen concentrations are typically low compared to other aerosols (on the order of 10–10 000 pollen grains per cubic metre), a high sampling rate is necessary to sample pollen effectively. This is all the more relevant since the threshold for allergic response is typically even lower, varying depending on the taxa, from just a few grains to a few tens of grains per cubic metre. In the Swisens Poleno, this level of sampling is achieved using a concentrator based on the principle of a virtual impactor that enables an effective flow rate of 40 L min−1. An hourly time resolution providing concentrations relevant for pollen exposure thresholds can thus easily be achieved with this sampling rate. The drawback, however, is that the saturation level occurs at coarse particle (>10 µm) concentrations above 30 000 particles per cubic metre. Note that size-dependent particle loss occurs in the concentrator; corrected concentration factors were determined from the controlled chamber experiments presented at the end of the paper. A Sigma-2 inlet was chosen to protect the device from precipitation as its sampling, in particular the role of wind speed and particle size, has been documented in detail (Verein Deutscher Ingenieure, 2013).
2.2 Calibration dataset
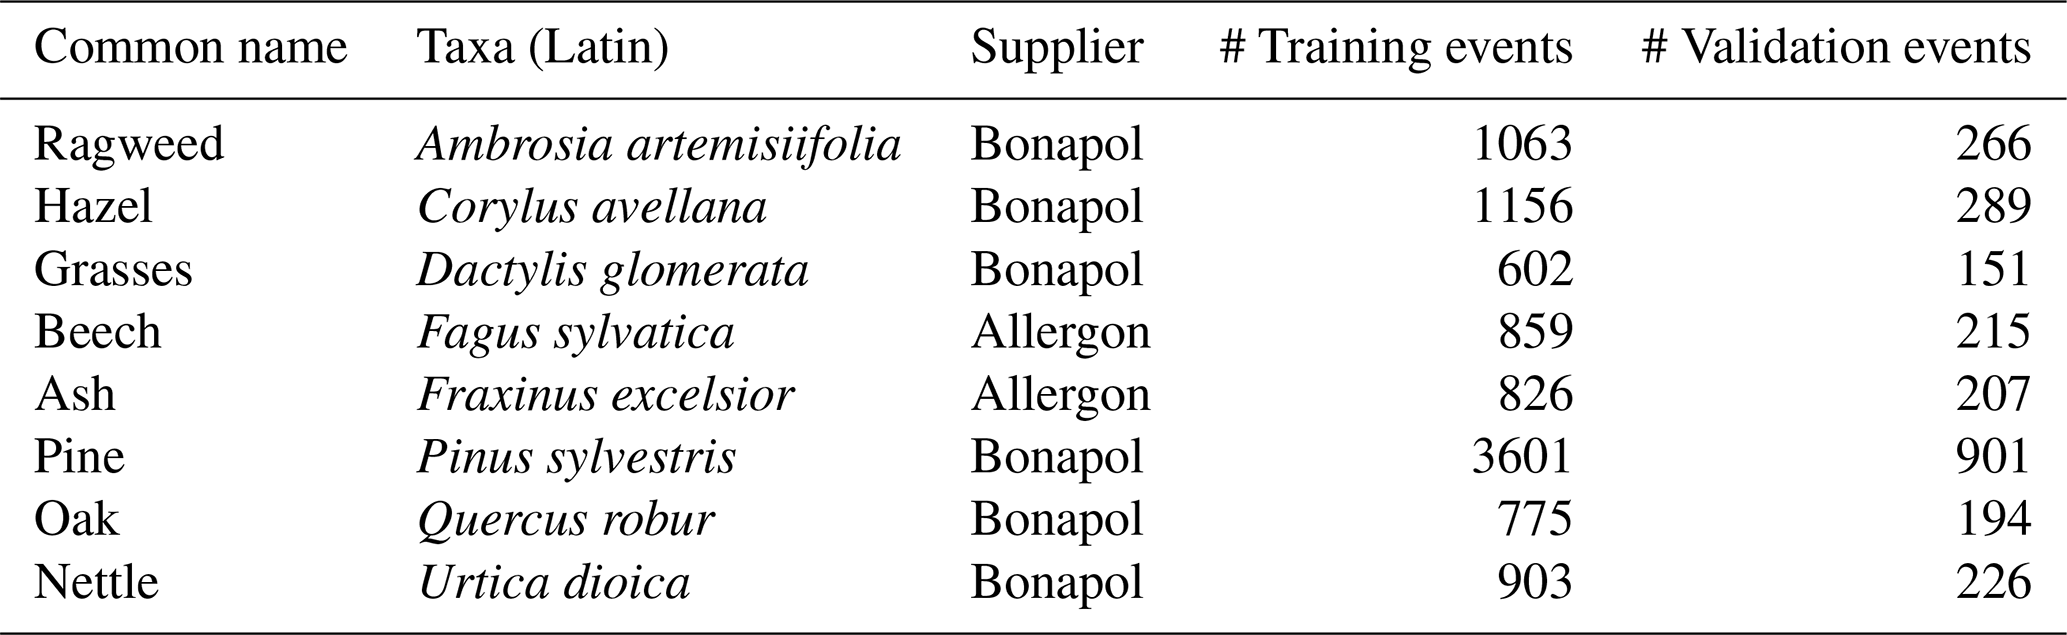
A large (>750 particles per pollen taxon) calibration dataset was collected for eight different pollen taxa using online measurements from the Swisens Poleno device. The taxa were chosen to present a good range of particle size – from small nettle pollen grains through to large pine pollen grains – and morphology. Note that the list includes taxa relevant for pollen allergies such as two different Betulaceae, Dactylis glomerata as a proxy for grasses, and ash. These samples were used to train a machine learning algorithm applied to identify the different pollen taxa. Only one particle type was calibrated at a time, allowing the data points to be labelled directly, although dirt, debris, and agglomerates needed to be eliminated from the dataset manually through visual inspection of the holographic images. To generate a large number of events without saturating the detector, pollen samples were continuously aerosolized using sound waves in a closed chamber around the detector inlet. Figure 2 shows examples of the reconstructed images generated for the calibration dataset. The pollen identification presented here is based just on these reconstructed images since they are expected to contain enough relevant morphological information to permit sufficient identification of the taxa of interest. Fluorescence and lifetime measurements are expected to be pertinent for extending the scope of the device to characterize other bioaerosols (e.g. spores) and pollutants. The dataset obtained includes 12 234 pollen grains (two images per grain) and is summarized in Table 1; 80 % of this dataset was used for algorithm calibration and 20 % for validation purposes. The images are greyscale and have a resolution of 200 pixels × 200 pixels. Each pixel represents a 0.56 µm by 0.56 µm physical domain.
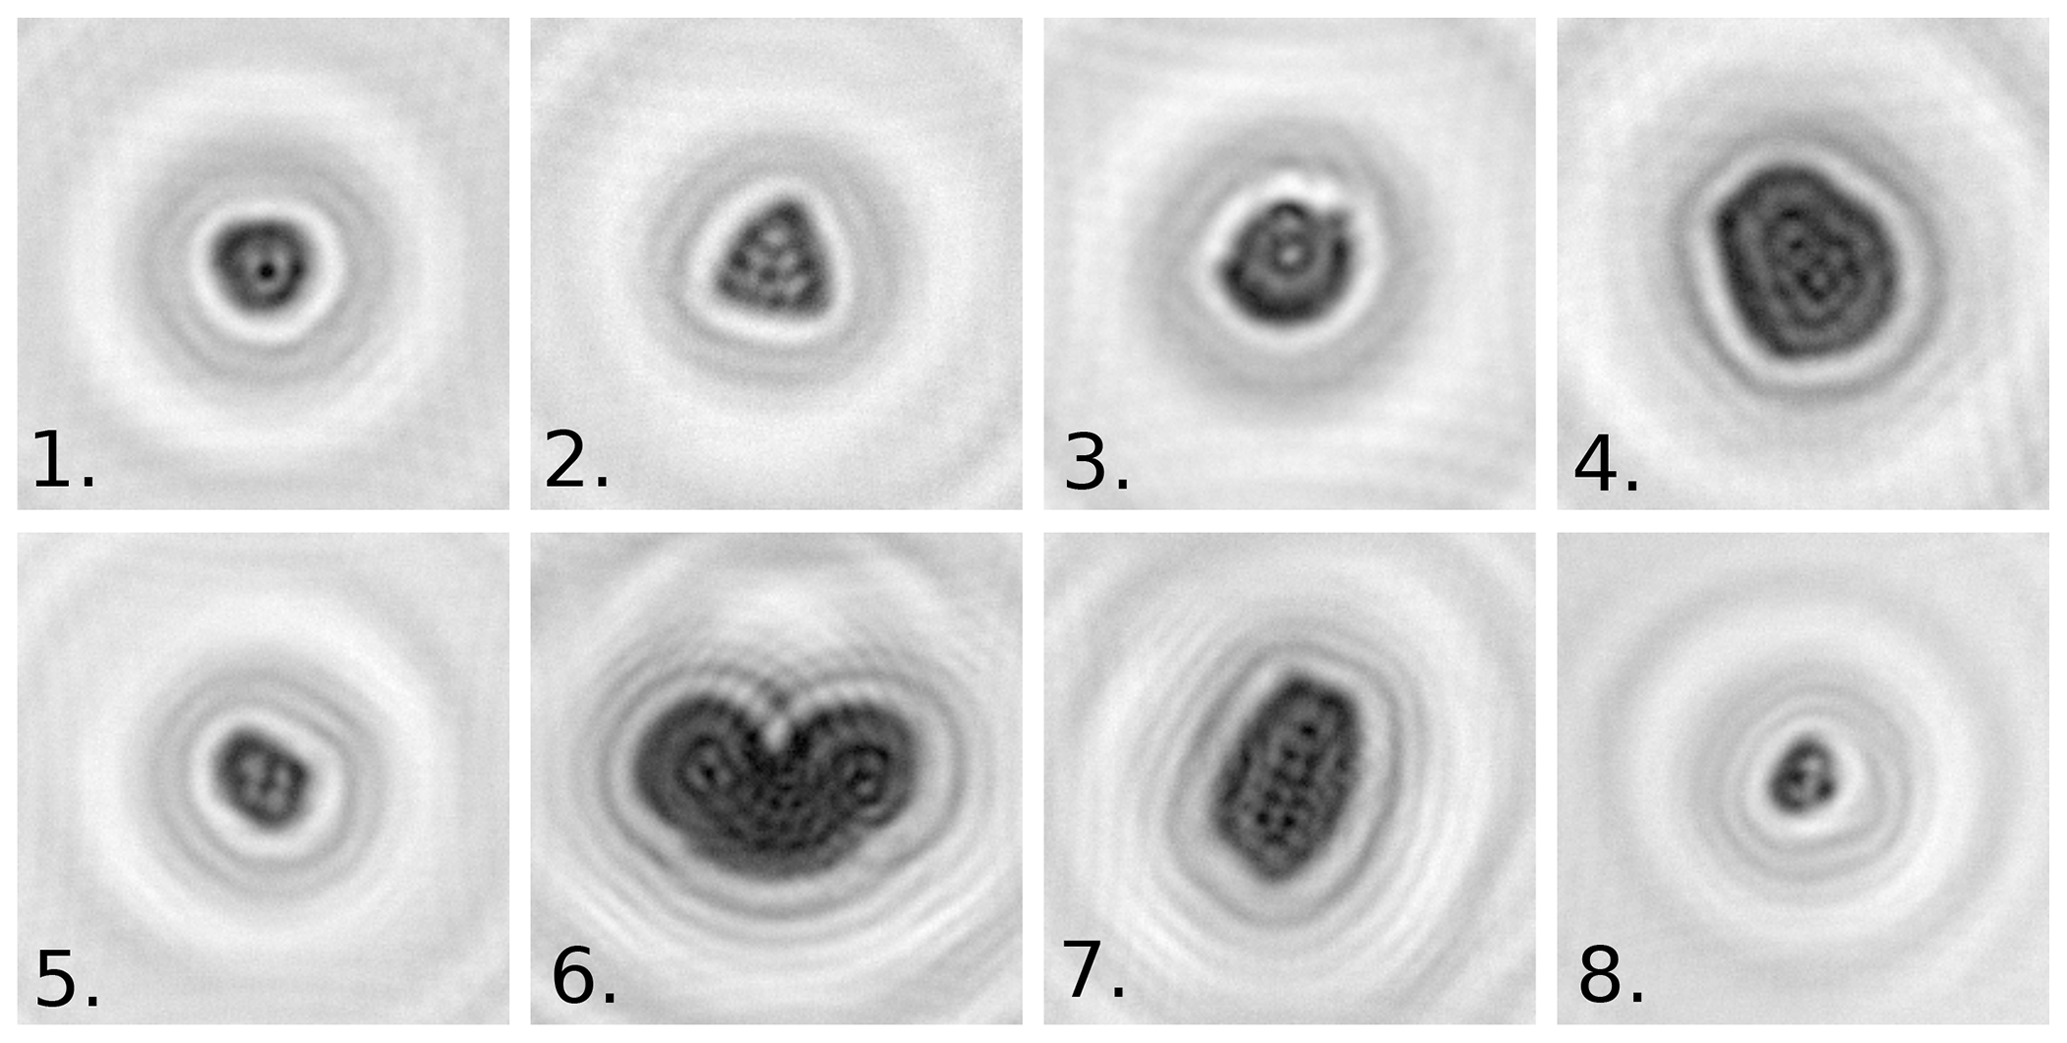
Figure 2Reconstructed holographic images from the Swisens Poleno for different pollen taxa: 1. Ambrosia artemisiifolia, 2. Corylus avellana, 3. Dactylis glomerata, 4. Fagus sylvatica, 5. Fraxinus excelsior, 6. Pinus sylvestris, 7. Quercus robur, and 8. Urtica dioica.
Table 1List of pollen taxa used to train the classification algorithm, including the number of events used for training and validation of the machine learning algorithm for each taxa. Note that all pollen were in a dry state.
2.3 Shape analysis for pollen detection
A large range of coarse aerosol particles were seen in the events recorded by the Swisens Poleno. To provide a clean dataset to the pollen classification algorithm, the pollen particles needed to be discriminated from all others. In principle this can be done by applying thresholds to the confidence estimates provided by deep-learning pollen-classification algorithms; however, this simple method did not yield the required level of accuracy. An additional step was therefore implemented in the algorithm (thus becoming a two-step classifier), using shape analysis to discriminate between pollen and non-pollen particles prior to applying the full pollen classification.
In general, unbroken biological particles tend to have a smooth, convex shape, while dust, debris, or other nonbiological particles have rougher, more chaotic shapes (see, for example, Fig. 3). Two deterministic image analysis routines were developed and evaluated to select the best available method for distinguishing pollen from other detected particles. Both use the contour of each particle, which is extracted from the reconstructed holographic images in three steps: (1) pixels are separated into two classes using the Otsu binarization algorithm (Otsu, 1979), which is based on a dynamic intensity threshold; (2) the largest cluster corresponding to the particle of interest is then identified; and (3) a convolution operation extracts the contour of the particle.
The first routine for biological particle identification uses the OpenCV2 library (Bradski, 2000) to fit (in a least-squares sense) an ellipse to each contour (Fitzgibbon et al., 1999). As a feature for biological particle identification the fraction fc of the contour located further than a certain distance from the fitted ellipse is considered (red pixels in Fig. 3). For pollen grains, this value is typically low, while for more fragmented particles this fraction can reach up to 60 % of the contour (0 % and 46 % respectively for the examples shown in Fig. 3).
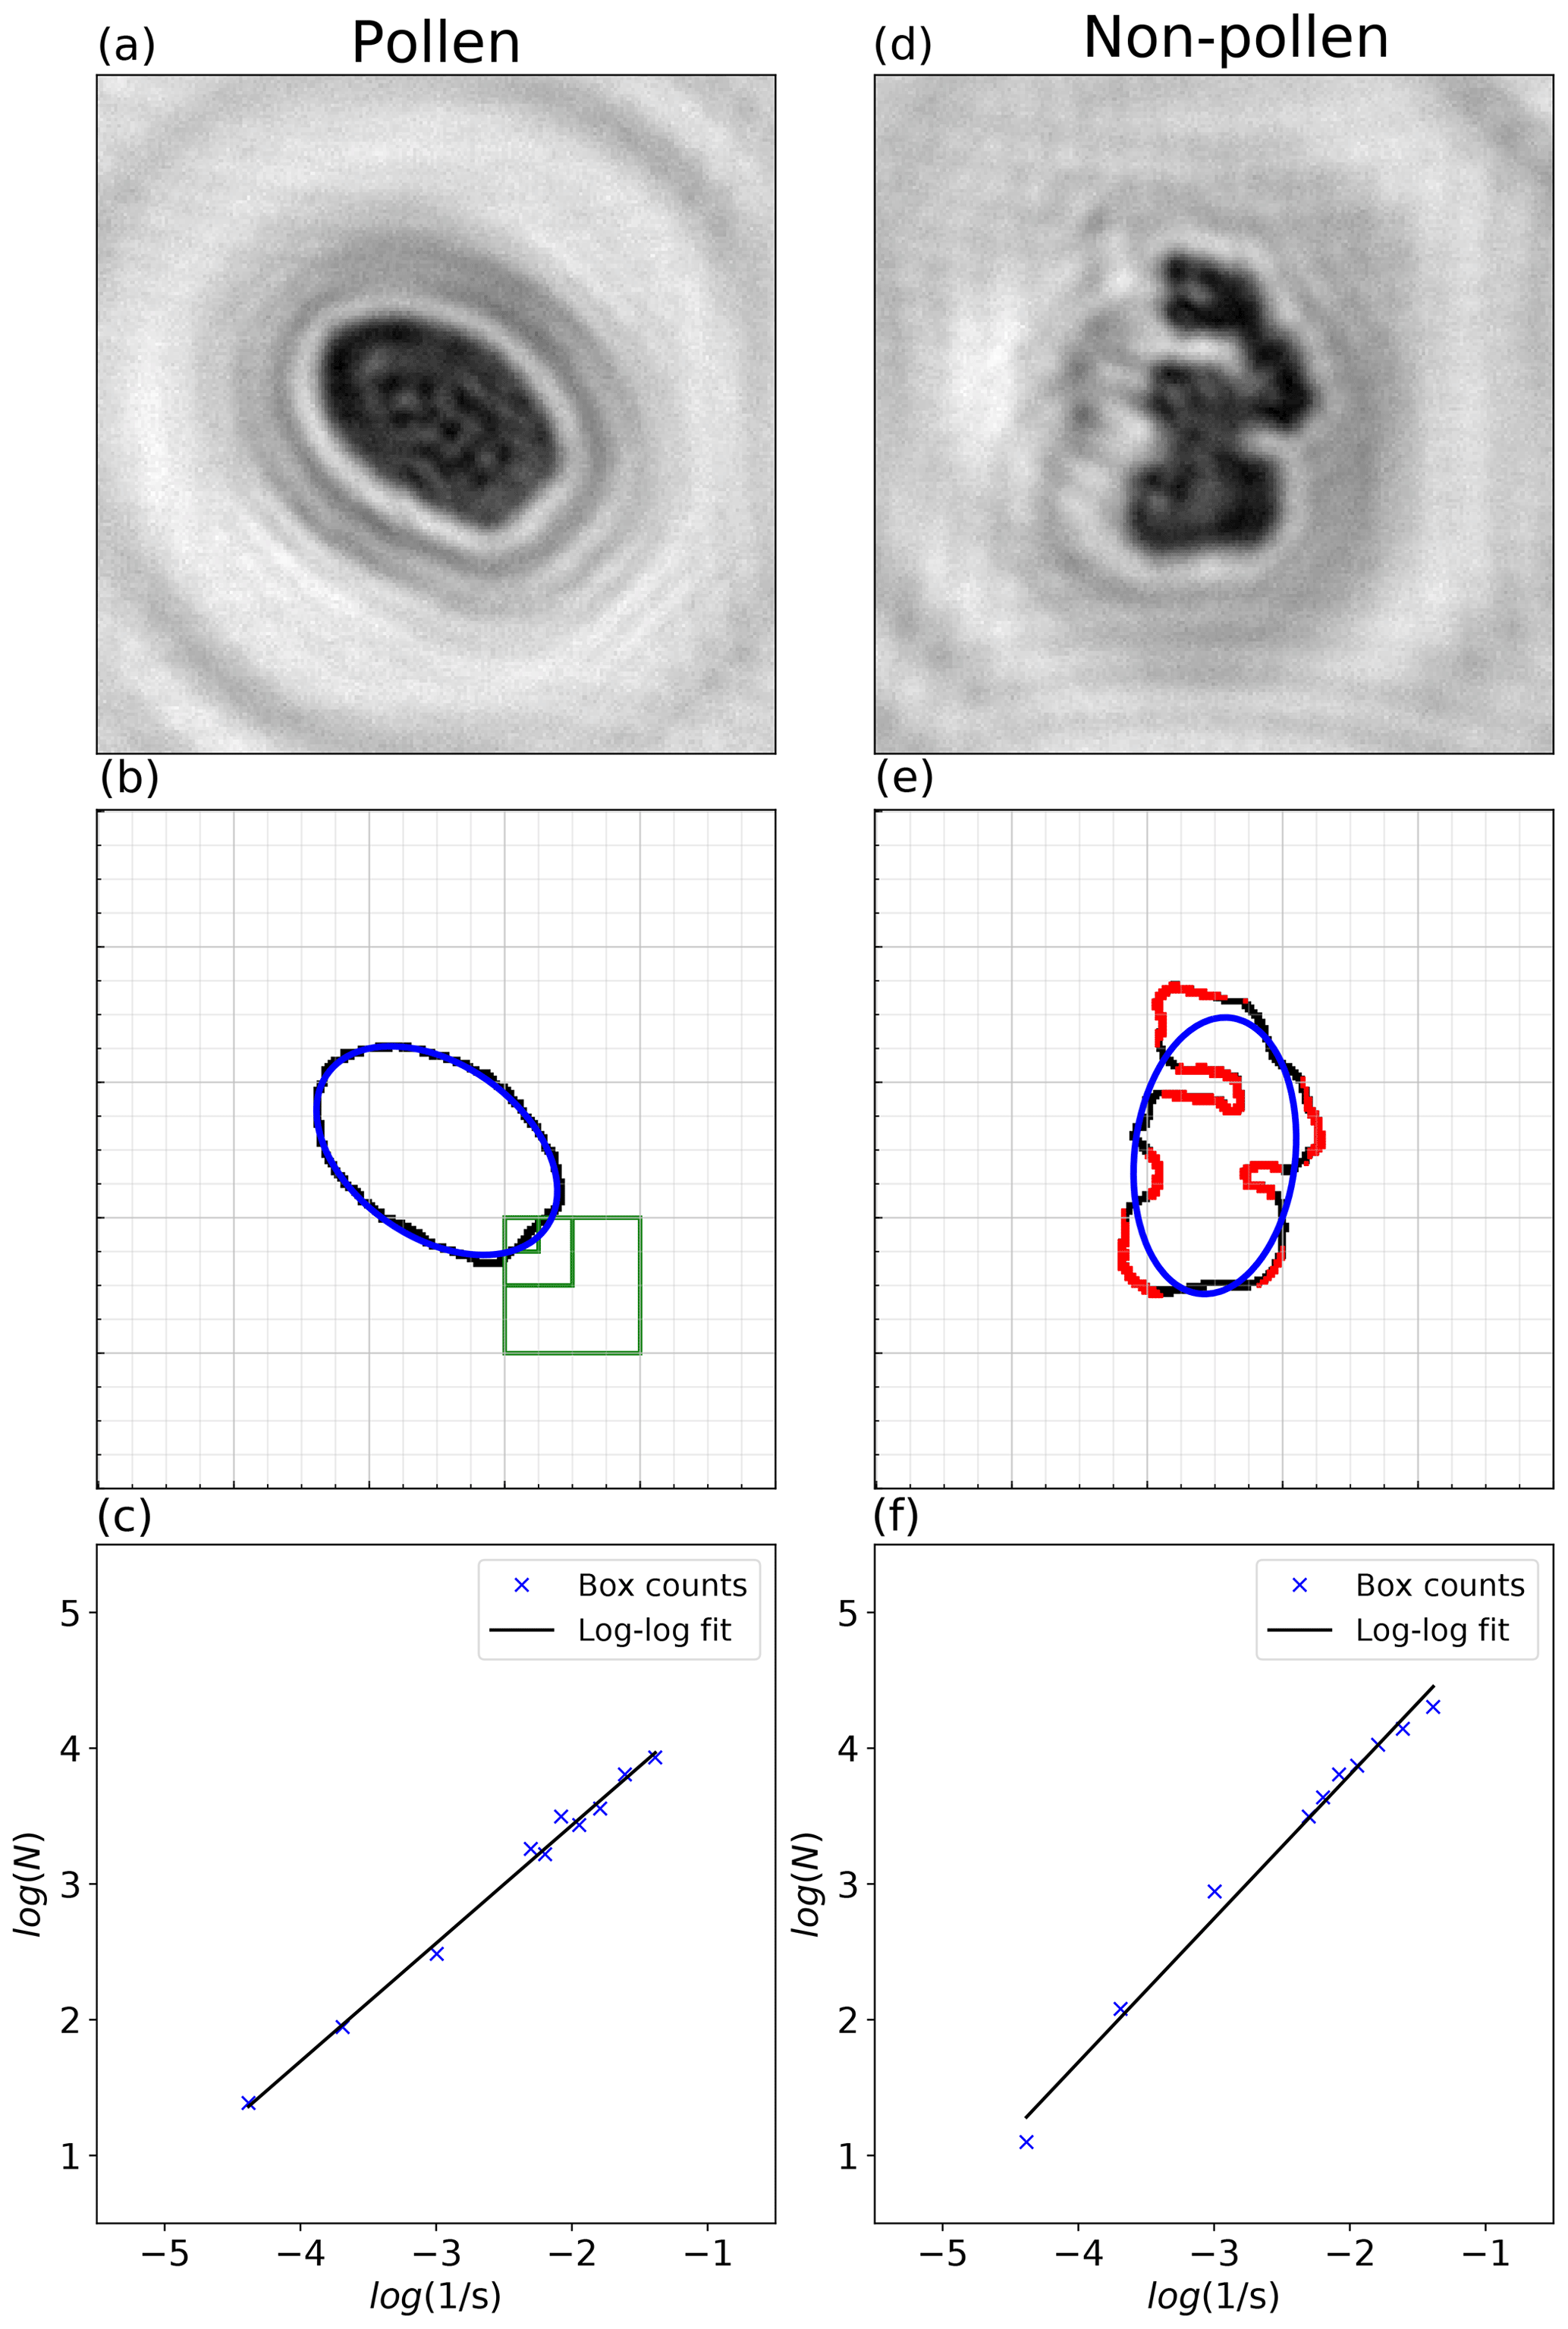
Figure 3Illustration of the image analysis routines applied to (a–c) a pollen grain (Quercus robur) and (d–f) coarse particulate matter.
The second method is based on the fractal dimension, which characterizes the state of self-similarity or roughness, and is also estimated from the particle contour. Such analysis of natural objects was first introduced by Mandelbrot (1983) and is now widely used in a variety of applications, such as plant leaf or sediment identification (Backes et al., 2009; Orford and Whalley, 1983). We make use of the so-called box-counting algorithm to estimate the fractal dimension of the holographic images because of its computational simplicity (Theiler, 1990). This method consists of splitting each image into grid boxes and counting the number of boxes N(s) that contain a fragment of the perimeter of the particle, where s is the box size. By repeating the procedure for decreasing values of s, the fractal dimension is then estimated by computing the slope of log(N(s)) over (see Fig. 3c).
The performance of these two methods (ellipse fitting and fractal dimension) is compared using the reference dataset, which contains images from all calibrated pollen taxa (1640 particles) and manually selected coarse aerosols (1554 non-pollen particles), measured during late spring and summer 2018 in Payerne, Switzerland. Smaller particles were filtered out prior to this comparison to keep only particles roughly in the pollen size range (10 to 200 µm). Note that only a reduced subset of pollen calibrations was used to keep a balanced dataset with respect to the non-pollen category.
Using manually labelled data to verify the output of the classification algorithm, we performed a grid optimization to find the set of parameters that best discriminates between pollen and other airborne particles; that is, a filter that simultaneously provides sufficient recall (ensuring that most pollen grains are classified as pollen) and precision (ensuring that only pollen grains are classified as pollen).
2.4 Pollen classification using deep learning
Developments in computer hardware have made it possible to perform efficient training of complex artificial, or “deep”, neural networks; their use in image recognition problems is the iconic application of deep learning. Mimicking the visual cortex, a series of so-called convolutional layers identify relevant patterns and concentrate the information diluted over a large image. Extracted features are then used as input for fully connected layers of artificial neurons, which combine the features to determine associated labels for each image. This technique is part of the family of supervised-learning algorithms; networks need to be trained using images for which the label is known. We used the open-source software library Keras (Chollet, 2015) with TensorFlow (Abadi et al., 2015) as computational back end to implement the pollen identification algorithm.
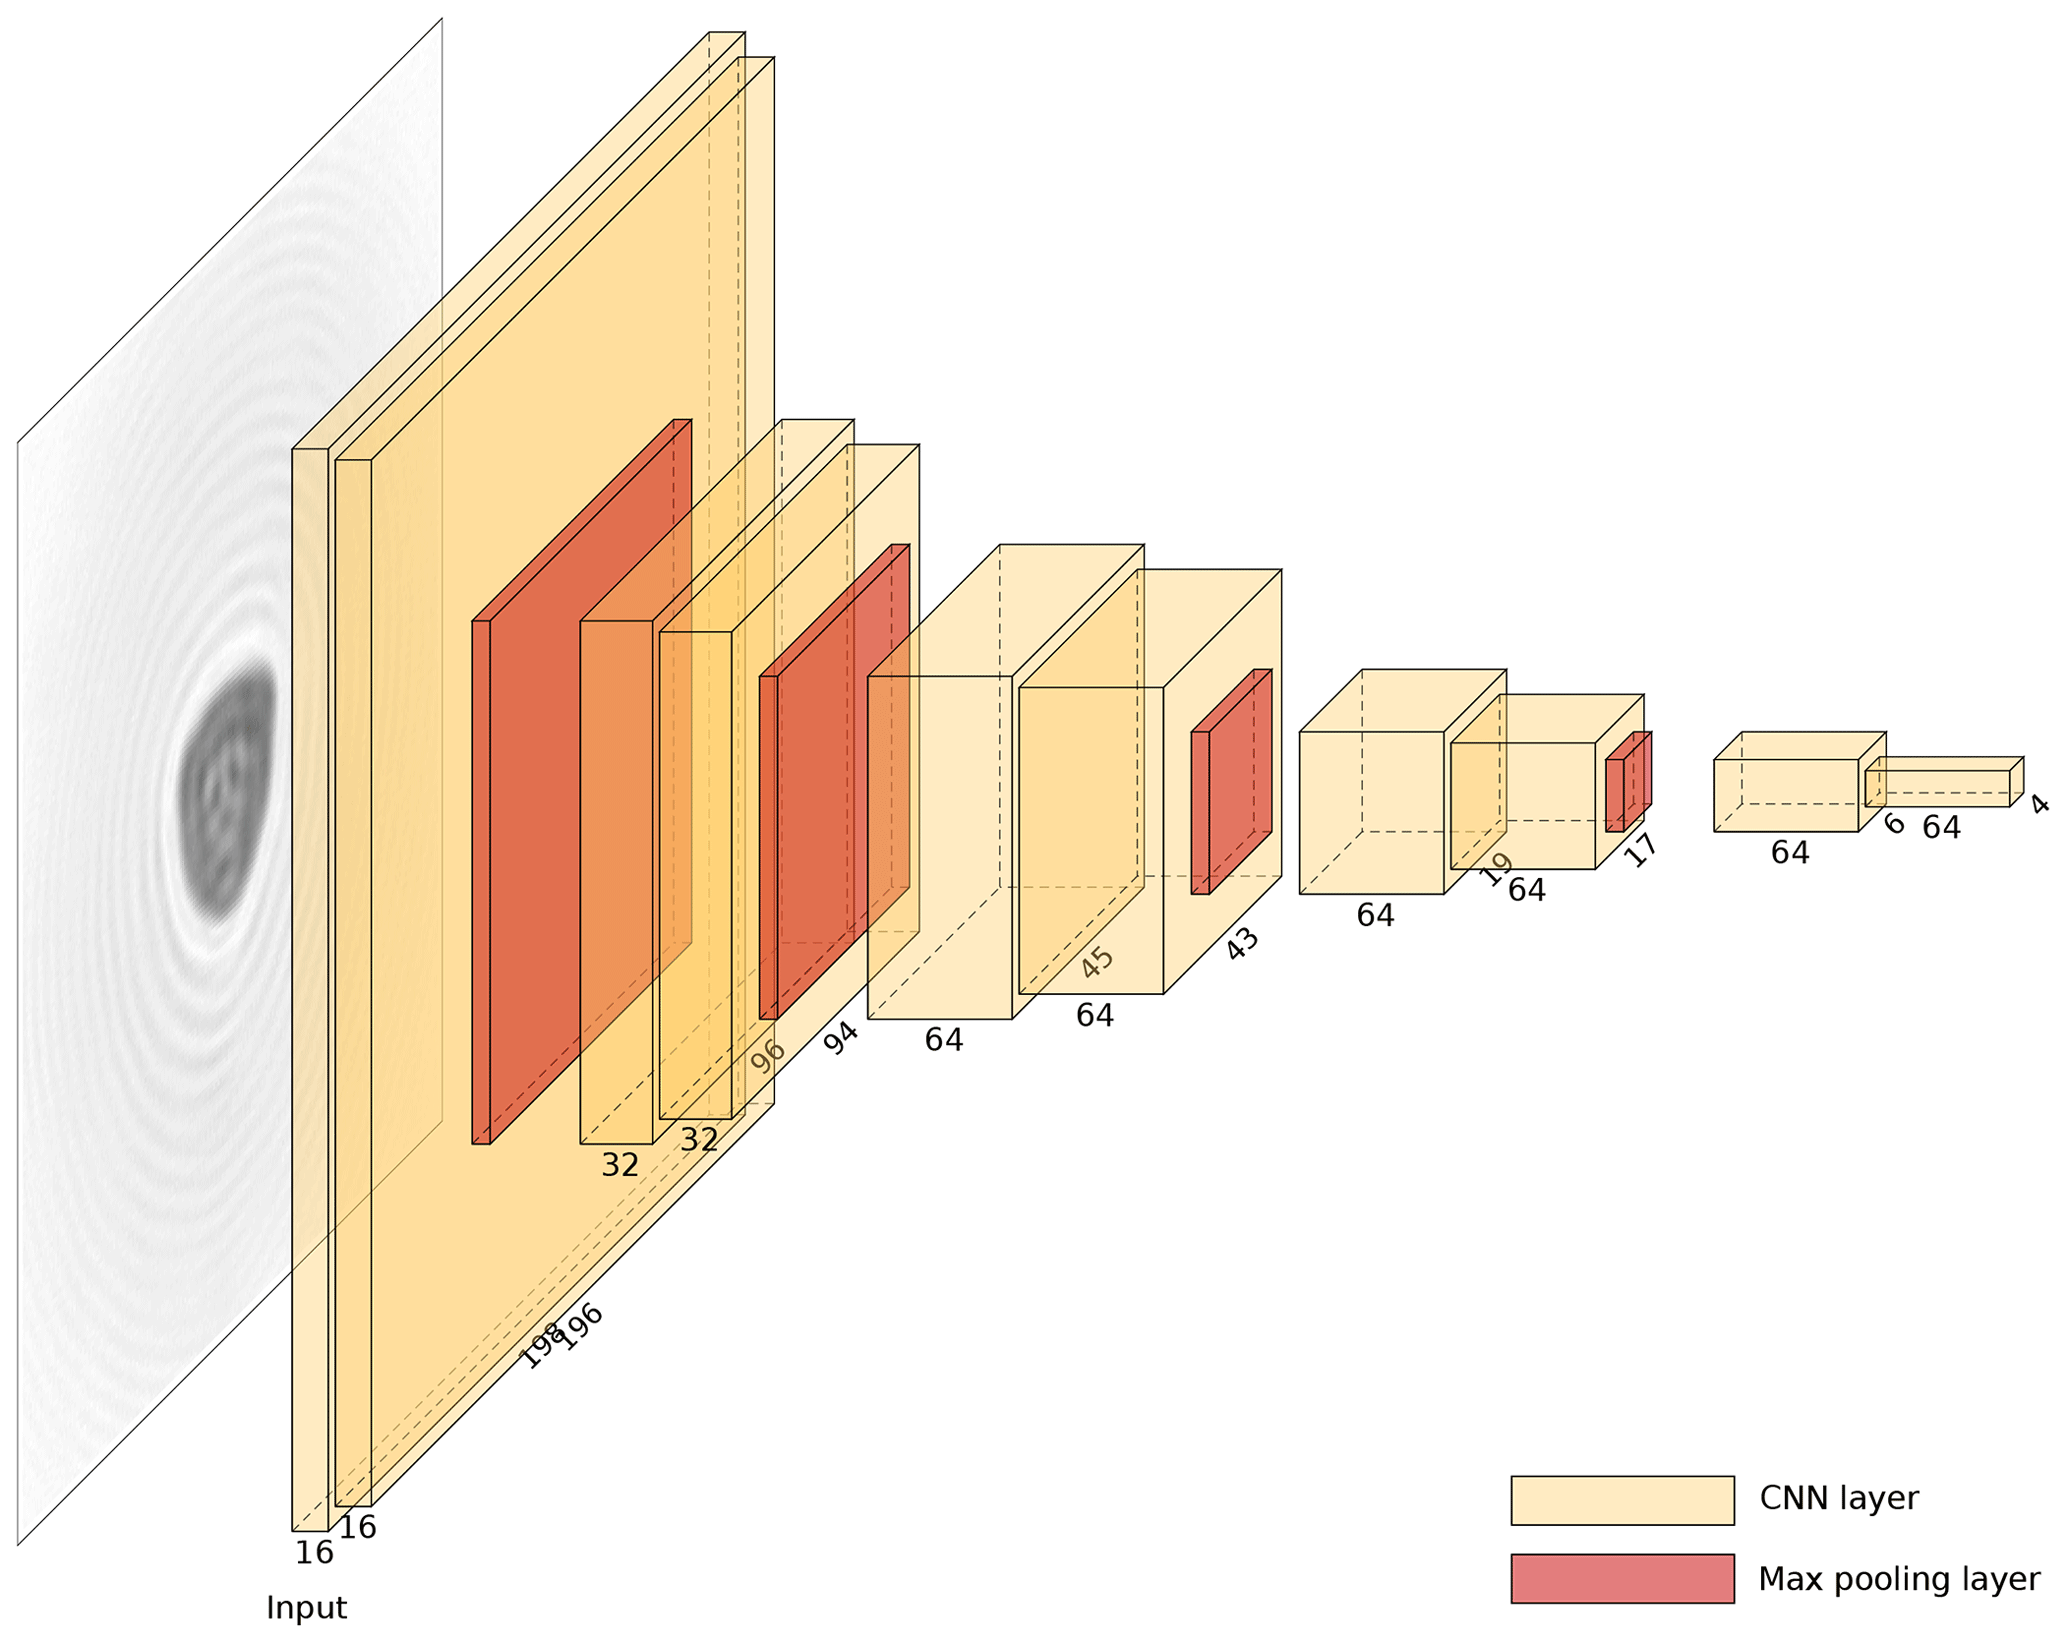
Figure 4Vision model based on the VGG16 architecture (Simonyan and Zisserman, 2014) as used here for pollen classification.
The model used to classify pollen grains is based on the VGG16 architecture (Simonyan and Zisserman, 2014), which has successfully been applied to a wide range of different image classification problems (Russakovsky et al., 2015). The basic model is shown in Fig. 4, with the vision model being applied separately to the two orthogonal images and the output then being processed with two fully connected layers. This ensures that the model is able to use the information from both images. For the final layer, softmax activation is used to map the network output to a probability distribution (Chollet, 2015). The predicted pollen label is determined by taking the most probable class. Note that probability information is also useful since the plausibility of the final classifications can be easily verified (Crouzy et al., 2016; Šauliene et al., 2019). Furthermore, although not carried out here, a threshold could be applied to the classification when performing operational measurements to retain only the pollen grains classified above a sufficient confidence level.
3.1 Pollen identification
The discrimination between pollen and other coarse aerosols is evaluated in Fig. 5 in the form of a normalized confusion matrix for each of the two image analysis algorithms. Each line in Fig. 5 is normalized to 1 and the values along the diagonal provide the recall for each category.
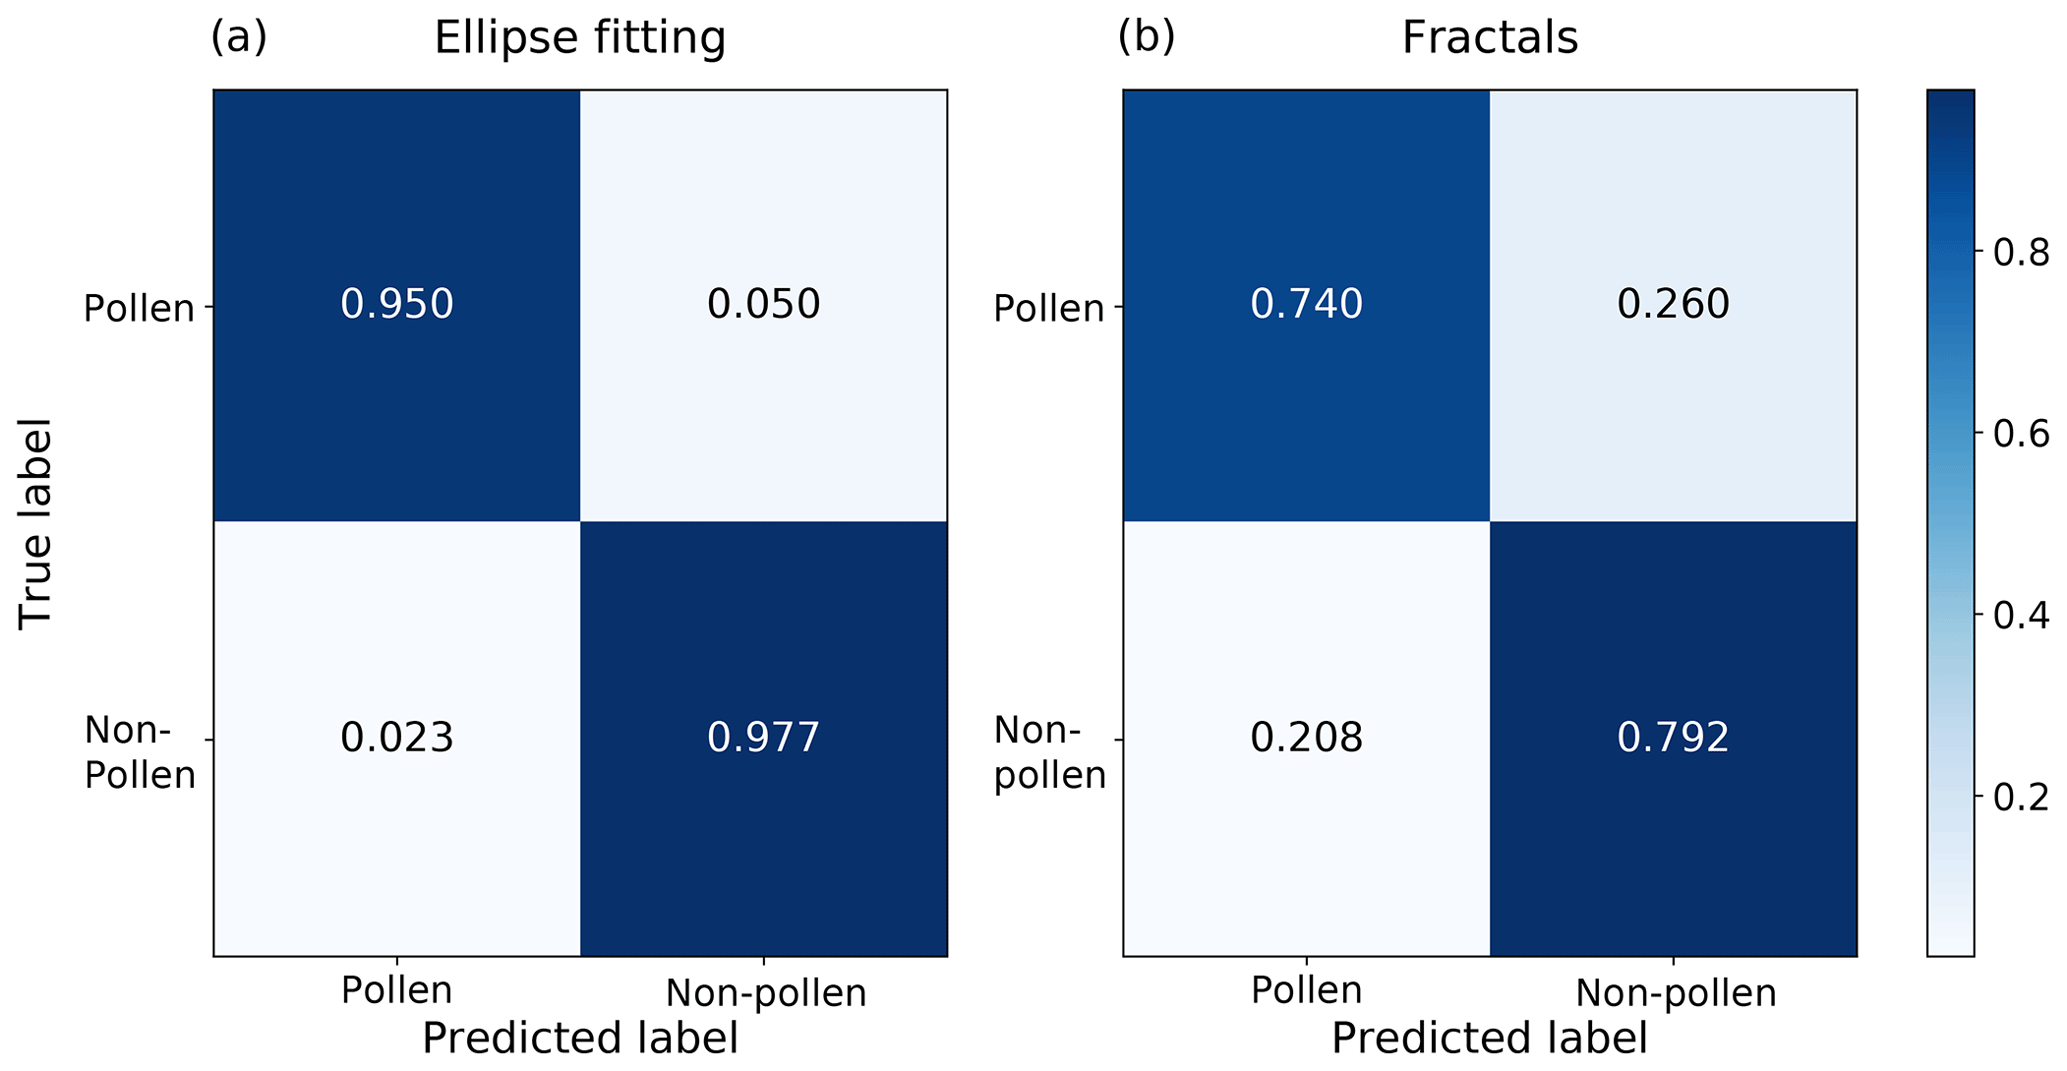
Figure 5Normalized confusion matrix summarizing the performance of (a) the ellipse-based classifier and (b) fractal-based classifier. “Pollen” refers to a mix of different pollen taxa, while “Non-pollen” encompasses all other coarse aerosols.
The convexity hypothesis for unbroken biological particles seems to hold particularly well for pollen grains. Indeed, in nearly all cases one of the two images has an almost perfect elliptical fit for pollen particles, which translates into only a very small fraction of contour pixels that strongly deviates from the optimal ellipse, i.e. fc≈0. Other particles most often present values of fc≥20 % for both images. Good precision can be obtained by using a low fc threshold, albeit at the expense of recall. The best results (achieving both good precision and recall) were obtained by imposing different thresholds on the two images: at least one of the two images needs to satisfy a hard condition on the value of fc, while the other should not present excessive deviation from its fitted ellipse. When using optimal values of the two fc thresholds, an overall accuracy of 96 % was achieved for the discrimination of pollen from other particles.
Visually, the contours of pollen grains clearly exhibit smoother shapes than non-pollen particles. However, it can be noted from Fig. 5 that the fractal dimension method did not function as well as the ellipse fitting one. While an overall accuracy of 77 % is reached, the number of non-pollen particles classified as pollen (false positives) is still too high to ensure a satisfactory classification in the second step of the deep-learning algorithm. Note that the ellipse fitting algorithm alone performs better than any combination of the two methods (not shown here).
Estimating the fractal dimension of an object from a holographic image is sensitive to the image resolution, which is thought to have a significant influence on the determination of the fractal dimension (see Baveye et al., 1998). Indeed, more detailed images tend to improve the estimation of the fractal dimension of an object as more details of the contour become apparent. Furthermore, the binarization process (i.e. reducing the greyscale holographic image to black and white) may also affect the box-counting calculation. Should higher-resolution images be available in future versions of the Poleno, the fractal dimension method may be worth implementing. At this point, given the better accuracy of the ellipse-fitting technique, we utilize this method in the final algorithm.
3.2 Pollen classification
Once a particle has been identified as a pollen grain it needs to be classified into the right taxa. Using the convolutional neural network (CNN) described in Sect. 2.4, each airborne particle is assigned a taxa with a corresponding confidence level of prediction. Results from the classification model are presented as a normalized confusion matrix in Fig. 6. The sum of each line is normalized to 1, and the diagonal values indicate the recall for the different pollen taxa.
Overall the classification algorithm performs very well, with six of the eight pollen taxa being classified with an accuracy of over 90 %. The exceptions are Corylus, which is confused in 10 % of cases with Fraxinus, and Dactylis, which is confused 22 % of the time with Corylus. Note that in this regard the problem presented to the algorithm is somewhat artificial; Corylus and grass pollen are not likely to be simultaneously present in the atmosphere in concentrations relevant for pollen allergies. Nevertheless, a larger mix of pollen taxa is likely to be observed in reality, highlighting the need for further developments to the classification algorithm using a larger number of species and including fresh pollen. In this line, it will be essential to include birch in the identification algorithm. This may, however, prove to be challenging given the morphological similarities of the members of the Betulaceae family.
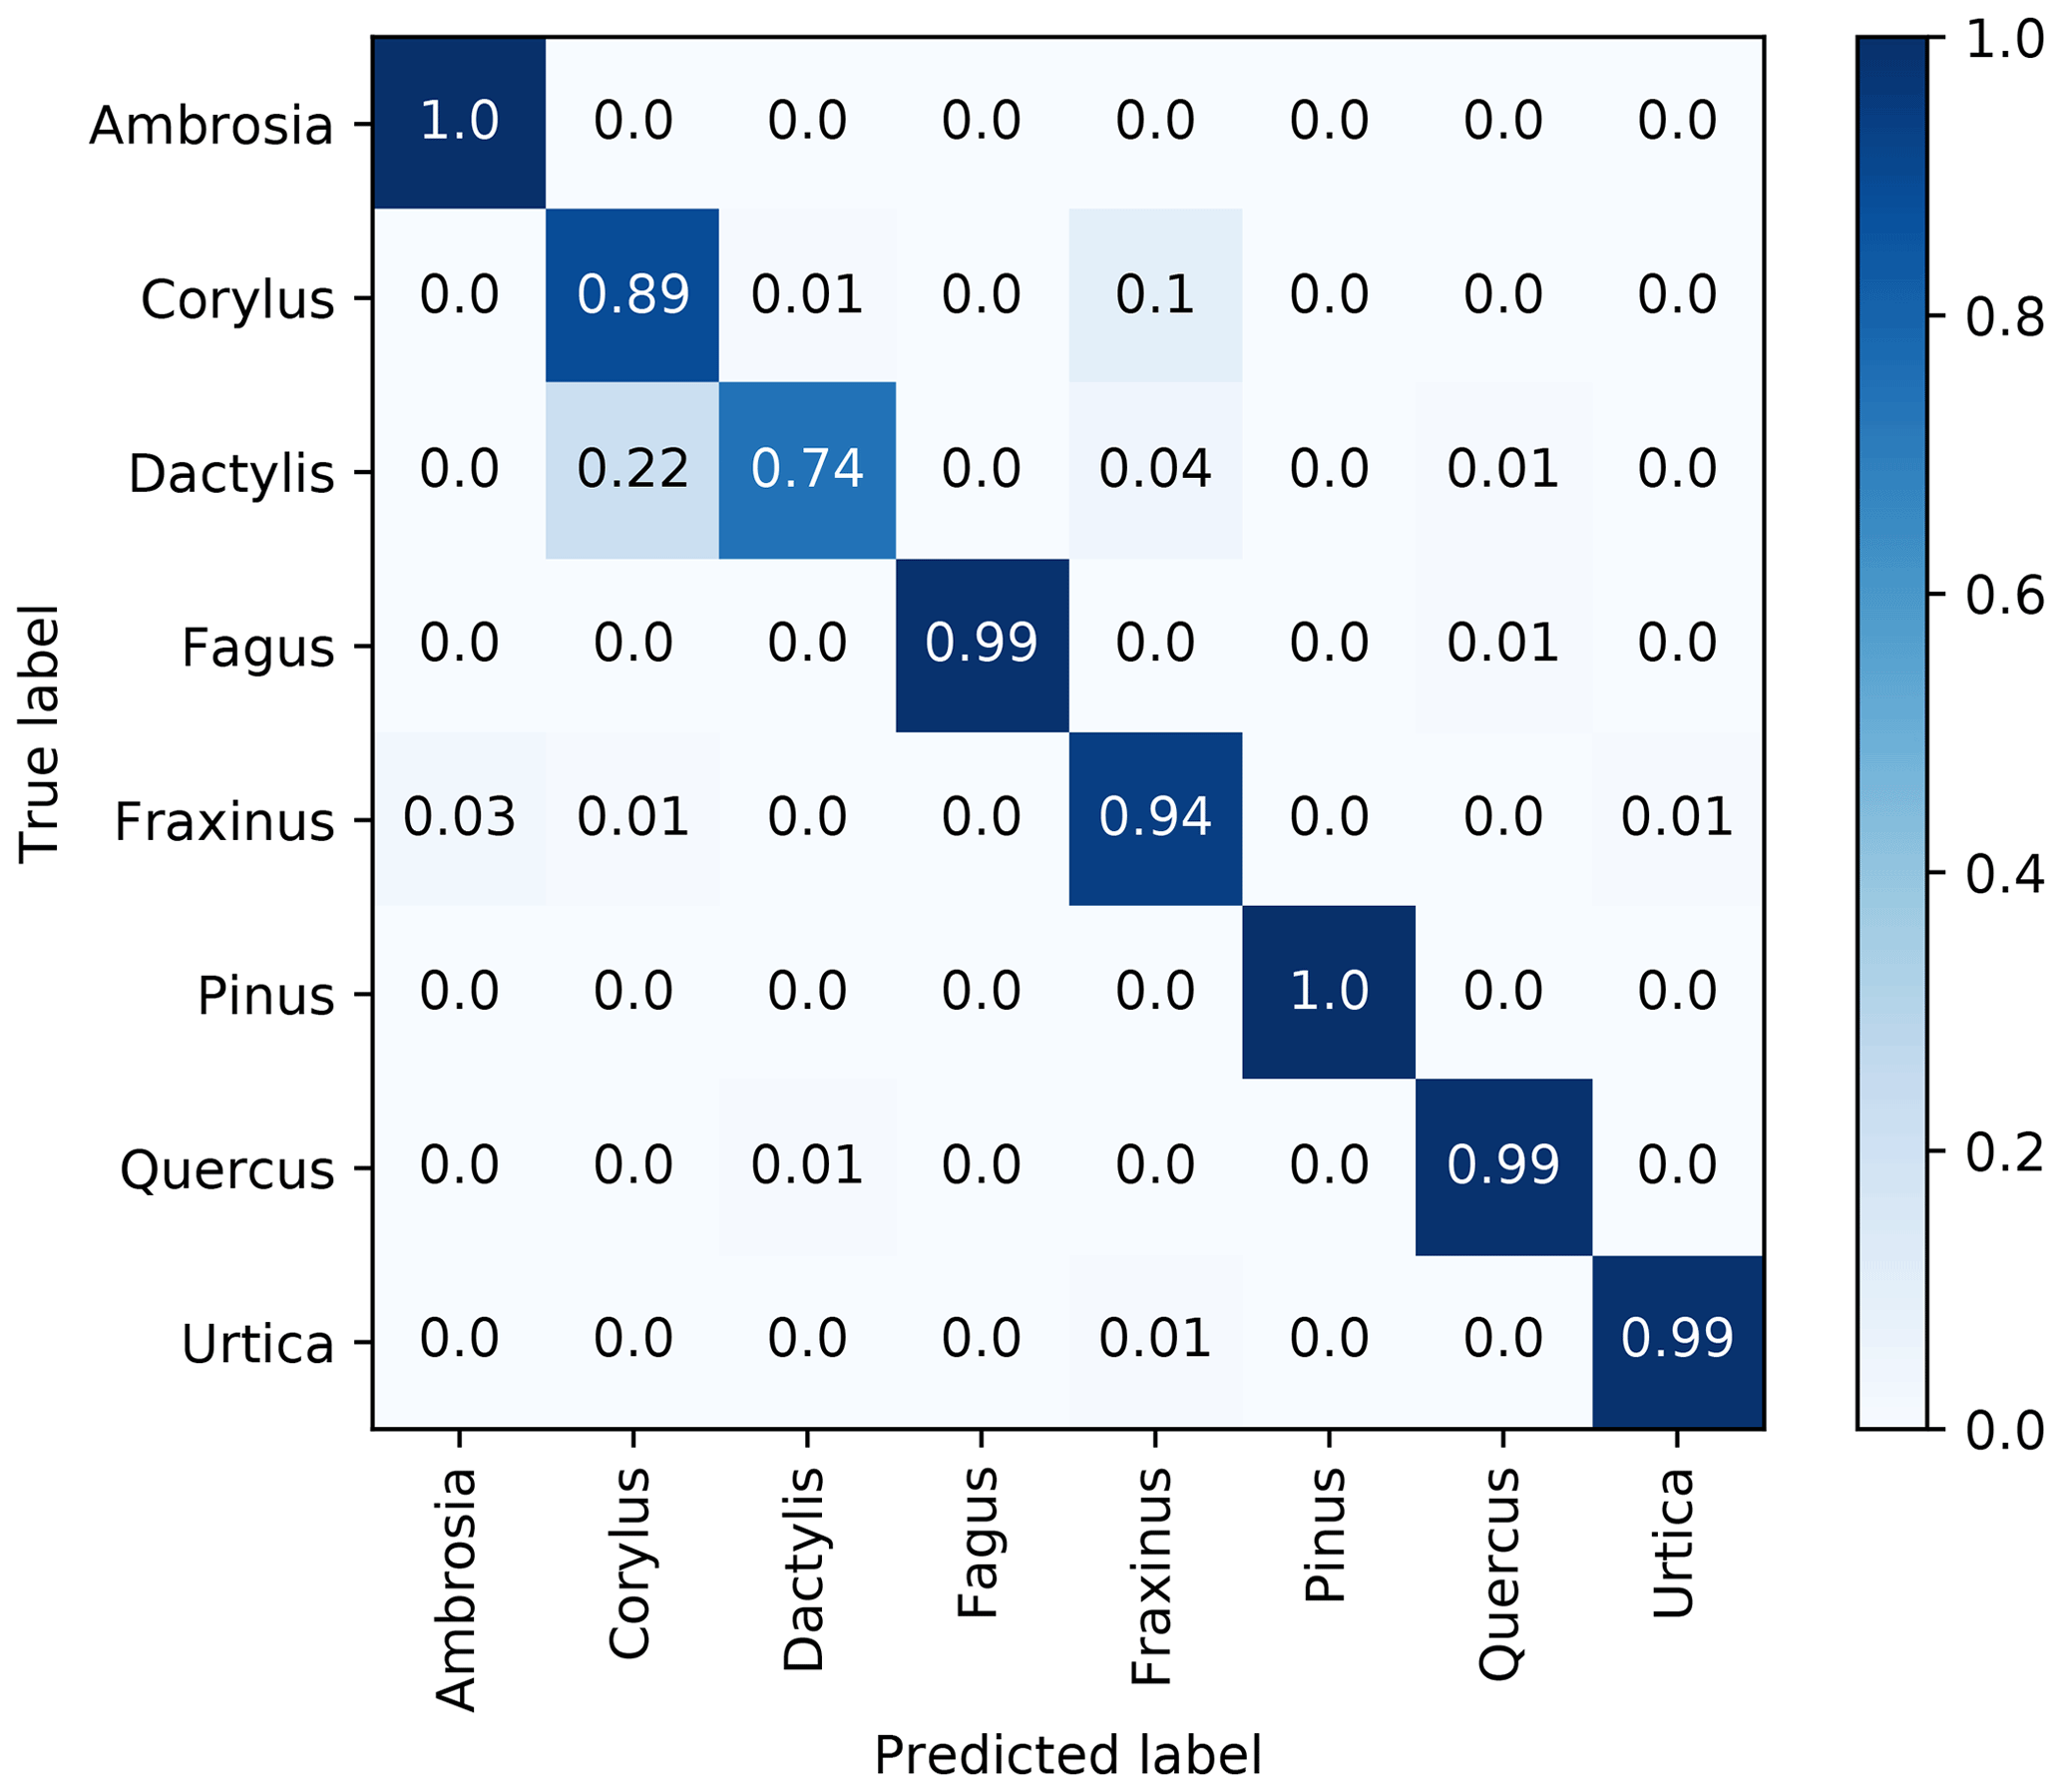
Figure 6Normalized confusion matrix for the pollen taxa identification, the second step of the classification algorithm.
To better understand the functioning of the neural network, Fig. 7 presents activation heat maps (Kotikalapudi and contributors, 2017) of pollen particles. These show which parts of the image the network focuses on to make the taxa prediction; in our case, strongly on the particle shape. This is apparent in the heat maps (Fig. 7), as the highest activation regions follow the outline of the pollen grains. This may appear to be an obvious result but confirms the validity of the CNN step of the classification algorithm and indicates that the predictions are based on a physical feature of the particle and not on some other information embedded in the images. This verification is essential, as differences in light intensity or the presence of dust on lenses could lead to discrimination between calibrations not based on pollen morphology but on artefacts.
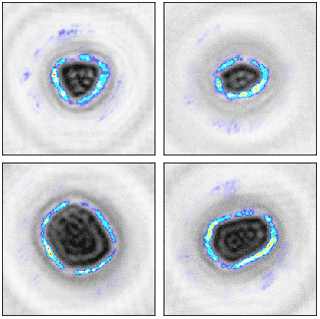
Figure 7Visualization of the areas on which the convolutional neural network for pollen classification focuses.
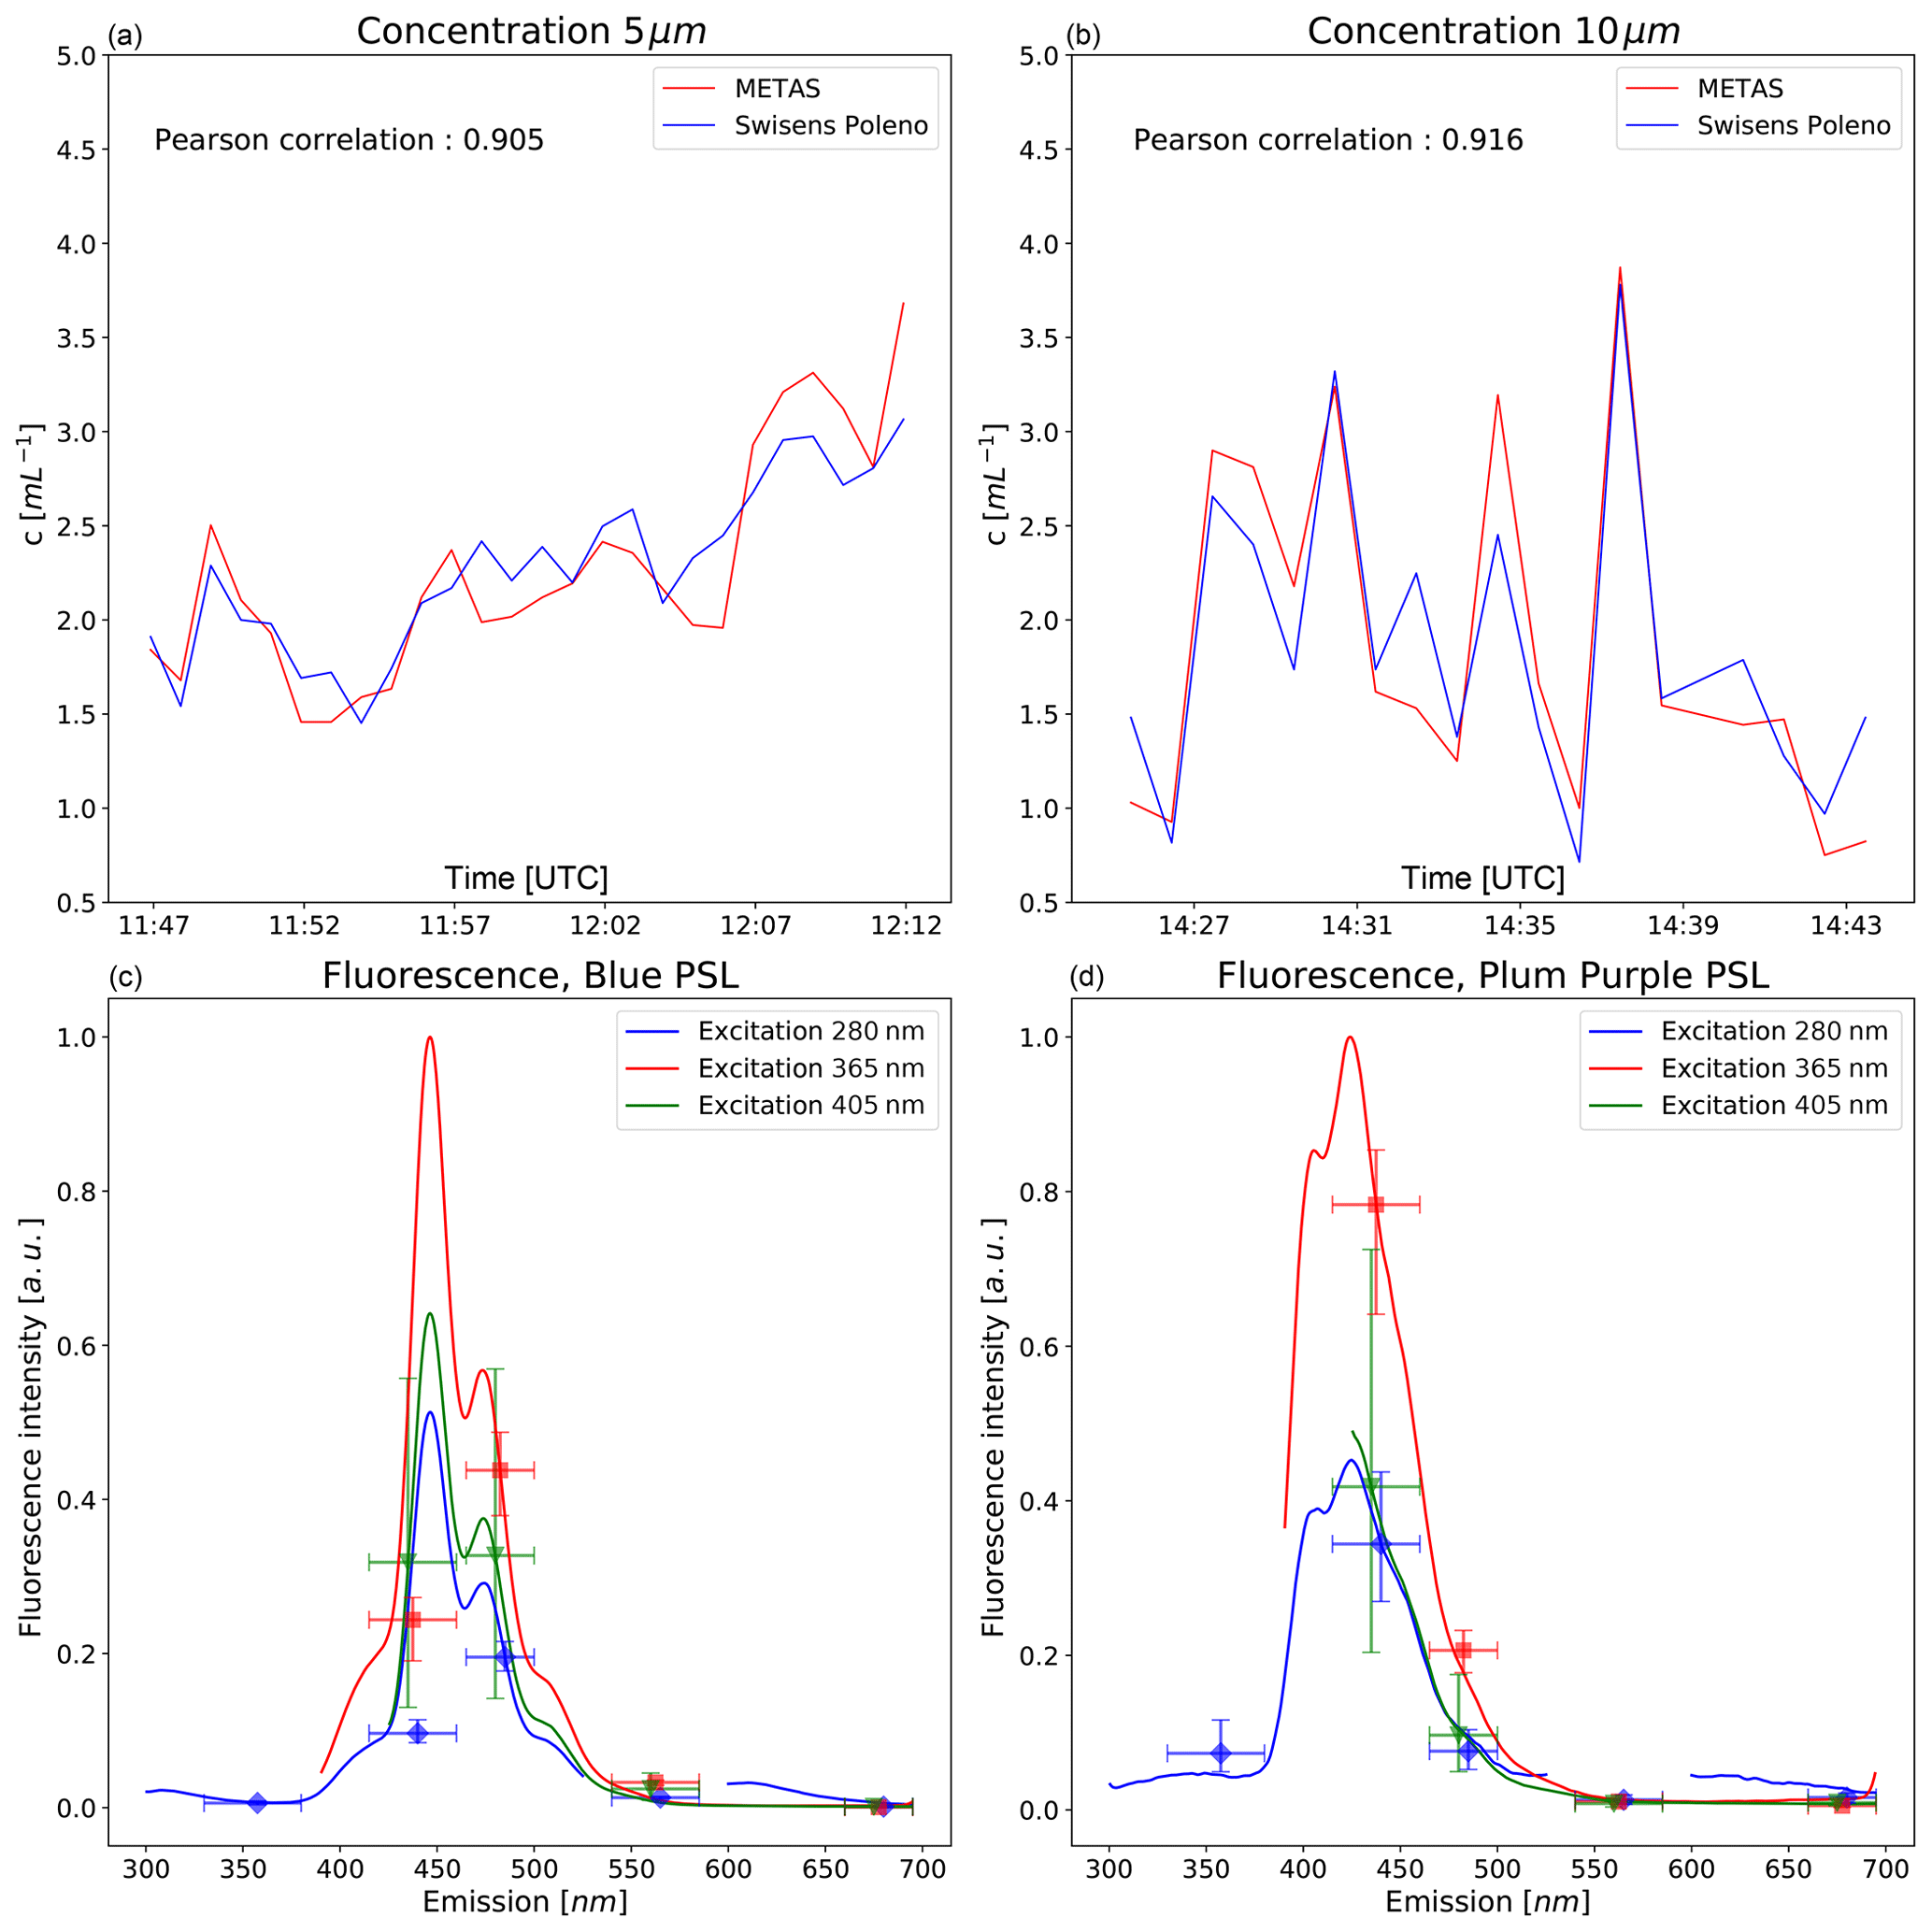
Figure 8(a, b) Concentrations (5 and 10 µm PSL spheres) scaled to the METAS reference measurements in UTC. (c, d) Comparison of fluorescence measurements. Solid lines are the reference fluorescence intensities measured by the Max Planck Institute of Chemistry presented in Könemann et al. (2018). Median measurements from the Poleno are shown with error bars (interquartile range). Each excitation wavelength is scaled individually (see text for details).
Although there are some limitations to the use of dry pollen for model training purposes, the performance obtained suggests that holography alone is sufficient to distinguish between different pollen taxon. Combined with the results of the previous section on pollen identification, we propose a two-step approach for operational pollen monitoring using digital holography, first applying classical image analysis to identify pollen and subsequently using deep learning to classify these particles into individual pollen taxa. As mentioned in Sect. 2.4, the identification algorithm provides a measure of confidence in addition to the predicted label. Note that raw results are presented in the confusion matrix (Fig. 6); in an operational setup confidence thresholds could be used to increase precision further. Due to the large sampling of such an automatic system, a certain loss of particles from introducing confidence thresholds can be accepted without losing statistical significance of the sampling.
3.3 Reference particle counts and fluorescence observations
The focus of this study was to assess the performance of the Swisens Poleno in terms of pollen identification. While this is key, it is equally as important to accurately quantify airborne pollen concentrations. At present, this remains a difficult task since no method, standardized or other, exists to aerosolize a known quantity of a known pollen taxa. Pollen grains are both considerably larger than other, nonbiological aerosol particles and relatively fragile, so producing homogenized airborne concentrations is currently not possible with conventional techniques.
To assess the accuracy of the particle concentrations obtained with the Swisens Poleno, a measurement campaign was carried out at the Swiss Federal Institute of Metrology (METAS). The custom-made facility at METAS has been described in detail in Horender et al. (2019). The aim was to compare the Poleno device with reference particle concentrations and fluorescence observations in a controlled calibration chamber using polystyrene latex (PSL) spheres. Different sizes, ranging from 0.5–20 µm, were tested along with three types of fluorescent PSL (blue 2.07 µm, plum purple 2.07 µm, and red 2.07 µm) to provide a first insight into the quality of the fluorescence measurements. For each size, the concentrations measured by the Poleno were compared to the reference concentrations for approximately 20 min. The fluorescent PSL used here have been fully characterized by the Max Planck Institute for Chemistry (MPIC) (Könemann et al., 2018) for a large range of excitation wavelengths. Those corresponding to the Poleno excitation wavelengths have been reproduced in Fig. 8 and serve as a reference for the fluorescence measurements. Since fluorescence intensity is measured in arbitrary units (), the fluorescence measured by the Poleno (filled dots) is scaled to the MPIC reference values (solid lines) using the maximum for each of the five emission windows located between 335 and 700 nm.
The results presented here are encouraging, both in terms of particle concentration and fluorescence measurements. The Poleno seems to follow the fluctuations in terms of particle concentration very well, with Pearson correlation values of 0.905 and 0.916 for the 5 and 10 µm sizes respectively (see Fig. 8). Similar results are observed for the other particle sizes tested (not shown), indicating that the Poleno measures the size of the certified PSL particles correctly. It is important to note, however, that the Poleno values have been scaled to the METAS values since the particle concentrator is size selective, with larger particles being better sampled. Once a size-scaling curve has been established it can be effectively applied to all future measurements, which is a significant improvement compared to the current practice of deriving scaling factors for automatic pollen monitors from Hirst-type measurements (Crouzy et al., 2016; Šauliene et al., 2019). The systematic analysis of the efficiency of the concentrator goes beyond the scope of this paper but will be described in future work. The reproducibility of the scaling factors obtained was verified by repeating the experiments with the 2 µm particles three times.
Despite the fact that the Poleno does not measure a continuous fluorescence emission spectrum, Fig. 8 confirms that it already provides an insight into the shape of the spectra for the different excitation wavelengths. The Poleno fluorescence signals agree well with the offline reference measurements performed at MPIC (Könemann et al., 2018) for all five emission windows and combined with the holographic images, potentially provide the opportunity to extend the number of particle types that can be recognized (e.g. further pollen taxa, spores, or pollutants).
The focus of this study was to assess the performance of the Swisens Poleno, the first operational automatic pollen monitoring system based on digital holography. The potential of using these in-flight images to classify pollen particles in real-time was shown for eight pollen taxa using a two-step classification algorithm. The first step distinguishes intact pollen grains from other coarse aerosol particles using a deterministic ellipse-fitting method, providing a 96 % discrimination accuracy for pollen. Thereafter, individual pollen taxa are recognized using supervised learning techniques. The algorithm is trained using data obtained by inserting known pollen types into the device, and six out of eight pollen taxa can be identified with an accuracy of above 90 %.
The ability of the device to accurately count particles was tested against reference measurements in controlled chamber experiments using polystyrene latex spheres. This is a key aspect for any monitoring device that is to be used operationally and to date has not been accurately assessed. These tests, together with validation of the fluorescence measurements carried out in the same chamber, provide very promising results.
The holographic images open the possibility for a human expert to perform online training and improve the model through a feedback loop. This effectively means that falsely classified pollen are identified manually and put into the correct class, for the model to use in the next training phase. The same principle could potentially be applied when the device is deployed in a new region with different pollen taxa by creating new pollen classes. Since the Swisens Poleno measures 1 m3 of air every 25 min, such new datasets can be created relatively quickly.
Finally, while not included in this study, the use of the fluorescence observations may allow the identification of particles other than pollen, for example, spores or other pollutants. Although the use of holography is a clear novelty of the present work, development of the method to additionally include florescence would build upon pioneering work performed using other devices (Toprak and Schnaiter, 2013; Hernandez et al., 2016; Savage et al., 2017). This could lead to synergies with air pollution monitoring networks and be of significant benefit to other sectors, such as agriculture and forestry, where real-time information concerning the distribution of spores could lead to better crop management practices. Future work in this direction is being continued, as is the development of the machine learning algorithm to identify further pollen taxa.
All data and algorithms presented in the paper are experimental and subject to further development. They are available for research purposes on request to the authors of the paper. Work is in progress to harmonize the algorithms and make them public together with the data via open-software and data repositories.
BCl, BCr, ES, and YZ designed the study. BCr, KV, KA, and FT carried out the METAS campaign. ES and YZ analysed all available data. ES, YZ, BCr, and FT prepared the paper with contributions from all other authors.
The authors declare that they have no conflict of interest. At the time of writing YZ was affiliated with the Lucerne University of Applied Sciences and Arts but has since been hired by Swisens, AG. In no way did this affect this publication.
METAS has received funding from the EMPIR Projects 16ENV07-Aeromet and 19ENV08-Aeromet II. The EMPIR programme is co-financed by the participating states and from the European Commission Horizon 2020 research and innovation programme. This work also contributes to the EUMETNET AutoPollen Programme.
The experiments carried out at the METAS were performed with funding from the EMPIR projects (grant nos. 16ENV-07-Aeromet and 19ENV-08-Aeromet II).
This paper was edited by Francis Pope and reviewed by two anonymous referees.
Abadi, M., Agarwal, A., Barham, P., Brevdo, E., Chen, Z., Citro, C., Corrado, G. S., Davis, A., Dean, J., Devin, M., Ghemawat, S., Goodfellow, I., Harp, A., Irving, G., Isard, M., Jia, Y., Jozefowicz, R., Kaiser, L., Kudlur, M., Levenberg, J., Mané, D., Monga, R., Moore, S., Murray, D., Olah, C., Schuster, M., Shlens, J., Steiner, B., Sutskever, I., Talwar, K., Tucker, P., Vanhoucke, V., Vasudevan, V., Viégas, F., Vinyals, O., Warden, P., Wattenberg, M., Wicke, M., Yu, Y., and Zheng, X.: TensorFlow: Large-Scale Machine Learning on Heterogeneous Systems, available at: http://tensorflow.org/ (last access: 31 October 2019), software available at: http://tensorflow.org (last access: 31 October 2019), 2015. a
Backes, A. R., Casanova, D., and Bruno, O. M.: Plant leaf identification based on volumetric fractal dimension, Int. J. Pattern Recogn., 23, 1145–1160, 2009. a
Baveye, P., Boast, C. W., Ogawa, S., Parlange, J.-Y., and Steenhuis, T.: Influence of image resolution and thresholding on the apparent mass fractal characteristics of preferential flow patterns in field soils, Water Resour. Res., 34, 2783–2796, 1998. a
Beggs, P. J.: Impacts of Climate Change on Allergens and Allergic Diseases, Cambridge University Press, Cambridge, UK, 2016. a
Berg, M. J., and Videen, G.: Digital holographic imaging of aerosol particles in flight, J. Quant. Spectrosc. Ra., 112, 1776–1783, https://doi.org/10.1016/j.jqsrt.2011.01.013, 2011. a
Bradski, G.: The OpenCV Library, Dr. Dobb's Journal of Software Tools, 120, 122–125, 2000. a
Calvo, A., Baumgardner, D., Castro, A., Fernández-González, D., Vega-Maray, A., Valencia-Barrera, R., Oduber, F., Blanco-Alegre, C., and Fraile, R.: Daily behavior of urban Fluorescing Aerosol Particles in northwest Spain, Atmos. Environ., 184, 262–277, https://doi.org/10.1016/j.atmosenv.2018.04.027, 2018. a
Chappuis, C. M., Tummon, F., Clot, B., Konzelmann, T., Calpini, B., and Crouzy, B.: Automatic pollen monitoring: first insights from hourly data, Aerobiologia, 1–12, https://doi.org/10.1007/s10453-019-09619-6, 2019. a
Chollet, F.: Keras, available at: https://github.com/fchollet/keras (last access: 24 September 2019), 2015. a, b
Clot, B.: Trends in airborne pollen: an overview of 21 years of data in Neuchâtel (Switzerland), Aerobiologia, 19, 227–234, 2003. a
Crouzy, B., Stella, M., Konzelmann, T., Calpini, B., and Clot, B.: All-optical automatic pollen indentification: Towards an operational system, Atmos. Environ., 140, 202–212, 2016. a, b, c, d
D'Amato, G., Liccardi, G., D'Amato, M., and Cazzola, M.: The role of outdoor air pollution and climatic changes on the rising trends in respiratory allergy, Resp. Med., 95, 606–611, https://doi.org/10.1053/rmed.2001.1112, 2001. a
D'Amato, G., Cecchi, L., Bonini, S., Nunes, C., Annesi-Maesano, I., Behrendt, H., Liccardi, G., Popov, T., and Van Cauwenberge, P.: Allergenic pollen and pollen allergy in Europe, Allergy, 62, 976–990, https://doi.org/10.1111/j.1398-9995.2007.01393.x, 2007. a
D'Amato, G., Pawankar, R., Vitale, C., Lanza, M., Molino, A., Stanziola, A., Sanduzzi, A., Vatrella, A., and D'Amato, M.: Climate change and air pollution: effects on respiratory allergy, Allergy Asthma Immunol. Res., 8, 391–395, 2016. a
Deguillaume, L., Leriche, M., Amato, P., Ariya, P. A., Delort, A.-M., Pöschl, U., Chaumerliac, N., Bauer, H., Flossmann, A. I., and Morris, C. E.: Microbiology and atmospheric processes: chemical interactions of primary biological aerosols, Biogeosciences, 5, 1073–1084, https://doi.org/10.5194/bg-5-1073-2008, 2008. a
Fitzgibbon, A., Pilu, M., and Fisher, R. B.: Direct least square fitting of ellipses, IEEE T. Pattern Anal., 21, 476–480, 1999. a
Gamble, J. L., Reid, C., Post, E., and Sacks, J.: A review of the impacts of climate variability and change on aeroallergens and their associated effects, Global Change Research Program, Washington, 2008. a
Garzia-Mozo, H.: The use of aerobiological data on agronomical studies, Ann. Agr. Env. Med., 1–6, 18, 2011. a
Greiner, A. N., Hellings, P. W., Rotiroti, G., and Scadding, G. K.: Allergic rhinitis, The Lancet, 378, 2112–2122, https://doi.org/10.1016/S0140-6736(11)60130-X, 2012. a
Hernandez, M., Perring, A. E., McCabe, K., Kok, G., Granger, G., and Baumgardner, D.: Chamber catalogues of optical and fluorescent signatures distinguish bioaerosol classes, Atmos. Meas. Tech., 9, 3283–3292, https://doi.org/10.5194/amt-9-3283-2016, 2016. a
Hirst, J. M.: An automatic volumetric spore trap, Ann. Appl. Biol., 39, 257–265, https://doi.org/10.1111/j.1744-7348.1952.tb00904.x, 1952. a
Horender, S., Auderset, K., and Vasilatou, K.: Facility for calibration of optical and condensation particle counters based on a turbulent aerosol mixing tube and a reference optical particle counter, Rev. Sci. Instrum., 90, 075111, https://doi.org/10.1063/1.5095853, 2019. a, b
Huffman, J. A., Perring, A. E., Savage, N. J., Clot, B., Crouzy, B., Tummon, F., Shoshanim, O., Damit, B., Schneider, J., Sivaprakasam, V., Zawadowicz, M. A., Crawford, I., Gallagher, M., Topping, D., Doughty, D. C., Hill, S. C., and Pan, Y.: Real-time sensing of bioaerosols: Review and current perspectives, Aerosol Sci. Tech., 0, 1–31, https://doi.org/10.1080/02786826.2019.1664724, 2019. a
Jaenicke, R.: Abundance of cellular material and proteins in the atmosphere, Science, 308, 73–73, 2005. a
Kawashima, S., Clot, B., Fujita, T., Takahashi, Y., and Nakamura, K.: An algorithm and a device for counting airborne pollen automatically using laser optics, Atmos. Environ., 41, 7987–7993, https://doi.org/10.1016/j.atmosenv.2007.09.019, 2007. a
Kawashima, S., Thibaudon, M., Matsuda, S., Fujita, T., Lemonis, N., Clot, B., and Oliver, G.: Automated pollen monitoring system using laser optics for observing seasonal changes in the concentration of total airborne pollen, Aerobiologia, 33, 351–362, https://doi.org/10.1007/s10453-017-9474-6, 2017. a
Könemann, T., Savage, N. J., Huffman, J. A., and Pöhlker, C.: Characterization of steady-state fluorescence properties of polystyrene latex spheres using off- and online spectroscopic methods, Atmos. Meas. Tech., 11, 3987–4003, https://doi.org/10.5194/amt-11-3987-2018, 2018. a, b, c
Kotikalapudi, R. and contributors: keras-vis, available at: https://github.com/raghakot/keras-vis (last access: 31 October 2019), 2017. a
Mandelbrot, B. B.: The fractal geometry of nature, vol. 173, WH Freeman, New York, 1983. a
Möhler, O., DeMott, P. J., Vali, G., and Levin, Z.: Microbiology and atmospheric processes: the role of biological particles in cloud physics, Biogeosciences, 4, 1059–1071, https://doi.org/10.5194/bg-4-1059-2007, 2007. a
O'Connor, D. J., Daly, S. M., and Sodeau, J. R.: On-line monitoring of airborne bioaerosols released from a composting/green waste site, Waste Manage., 42, 23–30, https://doi.org/10.1016/j.wasman.2015.04.015, 2015. a
Orford, J. and Whalley, W.: The use of the fractal dimension to quantify the morphology of irregular-shaped particles, Sedimentology, 30, 655–668, 1983. a
Oteros, J., Orlandi, F., García-Mozo, H., Aguilera, F., Dhiab, A. B., Bonofiglio, T., Abichou, M., Ruiz-Valenzuela, L., del Trigo, M. M., Díaz de la Guardia, C., Domínguez-Vilches, E., Msallem, M., Fornaciari, M., and Galán, C.: Better prediction of Mediterranean olive production using pollen-based models, Agron. Sustain. Dev., 34, 685–694, https://doi.org/10.1007/s13593-013-0198-x, 2014. a
Oteros, J., Pusch, G., Weichenmeier, I., Heimann, U., Möller, R., Röseler, S., Traidl-Hoffmann, C., Schmidt-Weber, C., and Buters, J. T. M.: Automatic and Online Pollen Monitoring, Int. Arch. Allergy Imm., 167, 158–166, http://www.karger.com/DOI/10.1159/000436968, 2015. a
Otsu, N.: A threshold selection method from gray-level histograms, IEEE T. Syst. Man Cyb., 9, 62–66, 1979. a
Pasken, R. and Pietrowicz, J. A.: Using dispersion and mesoscale meteorological models to forecast pollen concentrations, Atmos. Environ., 39, 7689–7701, https://doi.org/10.1016/j.atmosenv.2005.04.043, 2005. a
Perring, A. E., Schwarz, J. P., Baumgardner, D., Hernandez, M. T., Spracklen, D. V., Heald, C. L., Gao, R. S., Kok, G., McMeeking, G. R., McQuaid, J. B., and Fahey, D. W.: Airborne observations of regional variation in fluorescent aerosol across the United States, J. Geophys. Res.-Atmos., 120, 1153–1170, https://doi.org/10.1002/2014JD022495, 2015. a
Pope, F.: Pollen grains are efficient cloud condensation nuclei, Environ. Res. Lett., 5, 044015, https://doi.org/10.1088/1748-9326/5/4/044015, 2010. a
Pöschl, U.: Atmospheric Aerosols: Composition, Transformation, Climate and Health Effects, Angew. Chem. Int. Edit., 44, 7520–7540, https://doi.org/10.1002/anie.200501122, 2005. a
Ring, J., Krämer, U., Schäfer, T., and Behrent, H.: Why are allergies increasing?, Curr. Opin. Immunol., 13, 701–708, https://doi.org/10.1016/S0952-7915(01)00282-5, 2001. a, b
Russakovsky, O., Deng, J., Su, H., Krause, J., Satheesh, S., Ma, S., Huang, Z., Karpathy, A., Khosla, A., Bernstein, M., Berg, A. C., and Fei-Fei, L.: ImageNet Large Scale Visual Recognition Challenge, Int. J. Comput. Vision, 115, 211–252, https://doi.org/10.1007/s11263-015-0816-y, 2015. a
Šaulienė, I., Šukienė, L., Daunys, G., Valiulis, G., Vaitkevičius, L., Matavulj, P., Brdar, S., Panic, M., Sikoparija, B., Clot, B., Crouzy, B., and Sofiev, M.: Automatic pollen recognition with the Rapid-E particle counter: the first-level procedure, experience and next steps, Atmos. Meas. Tech., 12, 3435–3452, https://doi.org/10.5194/amt-12-3435-2019, 2019. a, b, c, d
Savage, N. J., Krentz, C. E., Könemann, T., Han, T. T., Mainelis, G., Pöhlker, C., and Huffman, J. A.: Systematic characterization and fluorescence threshold strategies for the wideband integrated bioaerosol sensor (WIBS) using size-resolved biological and interfering particles, Atmos. Meas. Tech., 10, 4279–4302, https://doi.org/10.5194/amt-10-4279-2017, 2017. a, b
Schueler, S., Schlünzen, and Heinke, K.: Modeling of oak pollen dispersal on the landscape level with a mesoscale atmospheric model, Environ. Model. Assess., 11, 179, https://doi.org/10.1007/s10666-006-9044-8, 2006. a
Simonyan, K. and Zisserman, A.: Very Deep Convolutional Networks for Large-Scale Image Recognition, arXiv 1409.1556, 2014. a, b
Sofiev, M.: On impact of transport conditions on variability of the seasonal pollen index, Aerobiologia, 33, 167–179, https://doi.org/10.1007/s10453-016-9459-x, 2017. a
Sofiev, M.: On possibilities of assimilation of near-real-time pollen data by atmospheric composition models, Aerobiologia, 35, 523–531, https://doi.org/10.1007/s10453-019-09583-1, 2019. a
Sofiev, M., Siljamo, P., Ranta, H., and Rantio-Lehtimäki, A.: Towards numerical forecasting of long-range air transport of birch pollen: theoretical considerations and a feasibility study, Int. J. Biometeorol., 50, 392, https://doi.org/10.1007/s00484-006-0027-x, 2006. a
Spieksma, F. T. M.: Pollinosis in Europe: new observations and developments, Rev. Palaeobot. Palyno., 64, 35–40, 1990. a
Theiler, J.: Estimating fractal dimension, J. Opt. Soc. Am. A A, 7, 1055–1073, 1990. a
Toprak, E. and Schnaiter, M.: Fluorescent biological aerosol particles measured with the Waveband Integrated Bioaerosol Sensor WIBS-4: laboratory tests combined with a one year field study, Atmos. Chem. Phys., 13, 225–243, https://doi.org/10.5194/acp-13-225-2013, 2013. a
Verein Deutscher Ingenieure: VDI 2119, techreport, VDI/DIN-Kommission Reinhaltung der Luft (KRdL) – Normenausschuss, Berlin, Germany, 2013. a
Vogel, H., Pauling, A., and Vogel, B.: Numerical simulation of birch pollen dispersion with an operational weather forecast system, Int. J. Biometeorol., 52, 805–814, https://doi.org/10.1007/s00484-008-0174-3, 2008. a
Wüthrich, B., Schindler, C., Leuenberger, P., and Ackermann-Liebrich, U.: Prevalence of atopy and pollinosis in the adult population of Switzerland (SAPALDIA study), Int. Arch. Allergy Imm., 106, 149–156, 1995. a
Zink, K., Pauling, A., Rotach, M. W., Vogel, H., Kaufmann, P., and Clot, B.: EMPOL 1.0: a new parameterization of pollen emission in numerical weather prediction models, Geosci. Model Dev., 6, 1961–1975, https://doi.org/10.5194/gmd-6-1961-2013, 2013. a
The requested paper has a corresponding corrigendum published. Please read the corrigendum first before downloading the article.
- Article
(3753 KB) - Full-text XML