the Creative Commons Attribution 4.0 License.
the Creative Commons Attribution 4.0 License.
 | 16 Apr 2020
Issues related to the retrieval of stratospheric-aerosol particle size information based on optical measurements
Christian von Savigny
Christoph G. Hoffmann
Stratospheric-sulfate aerosols play an important role in the physics and chemistry of the atmosphere. The radiative and chemical effects of stratospheric-sulfate aerosols depend critically on the aerosol particle size distribution and its variability. Despite extensive research spanning several decades, the scientific understanding of the particle size distribution of stratospheric aerosols is still incomplete. Particle size estimates (often represented by the median radius of an assumed monomodal log-normal distribution with a fixed width or by the effective radius) reported in different studies cover a wide range, even under background stratospheric conditions, and particle size estimates retrieved from satellite solar-occultation measurements in the optical spectral range show a tendency to be systematically larger than retrievals based on other optical methods. In this contribution we suggest a potential reason for these systematic differences. Differences between the actual aerosol particle size distribution and the size distribution function assumed for aerosol size retrievals may lead to systematic differences in retrieved aerosol size estimates. We demonstrate that these systematic differences may differ significantly for different measurement techniques, which is related to the different sensitivities of these measurement techniques to specific parts of the aerosol particle population. In particular, stratospheric-aerosol size retrievals based on solar-occultation observations may yield systematically larger particle size estimates (median or effective radii) compared to, e.g., lidar backscatter measurements. Aerosol concentration, on the other hand, may be systematically smaller in retrievals based on occultation measurements compared to lidar measurements. The results indicate that stratospheric-aerosol size retrievals based on occultation or lidar measurements have to be interpreted with caution, as long as the actual aerosol particle size distribution is not well known.


According to Robock (2015) the variation of the stratospheric-aerosol particle size as a consequence of volcanic injections into the stratosphere is one of the key open science questions of current stratospheric-aerosol research. Considering the relatively large differences between stratospheric-aerosol particle size estimates reported in the limited number of available studies (McLinden et al., 1999; Bingen et al., 2003, 2004a, b; Deshler et al., 2003; Bourassa et al., 2008; Deshler, 2008; Malinina et al., 2018; Ugolnikov et al., 2018; Zalach et al., 2019), it appears fair to state that particle size parameters of stratospheric aerosols even under background conditions are not well established. For example, stratospheric-aerosol particle size retrievals – for volcanically quiescent periods – from satellite occultation measurements tend to yield relatively large median radii of up to several hundred nanometers (e.g., Bingen et al., 2003, 2004a, b; Wrana, 2019; Wrana et al., 2020), whereas retrievals based on several other measurement techniques typically lead to significantly smaller median radii (e.g., McLinden et al., 1999; Bourassa et al., 2008; Malinina et al., 2018; Ugolnikov et al., 2018; Zalach et al., 2019).
One of the main issues of optical techniques to investigate the size of aerosol particles is the strong dependence of the aerosol scattering cross section on particle radius. In the Rayleigh limit (i.e., Mie size parameters of α≪1), the scattering cross section scales with the 6th power of the particle radius. For larger Mie size parameters, the dependence is weaker. Still, the signal observed by optical instruments (which may, e.g., take measurements of aerosol extinction in transmission or aerosol scattering in the case of satellite limb-scatter or ground-based lidar measurements) will only be weakly affected by the smaller particles. This effect is well known. Wurl et al. (2010) attempted to address this “blind spot issue” by adding a priori information on the population of small particles contributing very little to the measured optical signal.
The differences in retrieved stratospheric-aerosol particle size estimates between the different observation techniques and the relatively large size estimates routinely retrieved from solar-occultation measurements may have different reasons. They could be related to measurement errors or to atmospheric variability. Both explanations, however, appear implausible. The first one is because particle size retrievals from measurements with different solar-occultation instruments (SAGE – Stratospheric Aerosol and Gas Experiment – II, SAGE III/Meteor-3M and SAGE III on ISS – International Space Station) yield similar results (Bingen et al., 2003; Wrana, 2019; Wrana et al., 2020). The second explanation can be excluded by analyzing large data sets. The differences may also be caused by erroneous assumptions made in the retrievals in combination with different intrinsic sensitivities of the different measurement techniques to different fractions of the aerosol particle population. This potential reason is the topic of the current study. In this context the following aspects are important: (a) stratospheric-aerosol particle size retrievals from satellite transmission or scattering measurements are typically based on a monomodal log-normal particle size distribution and (b) balloon-borne in situ particle size measurements (e.g., Deshler et al., 2003; Deshler, 2008) usually yield bimodal particle size distributions with a main mode with a median radius on the order of 80–100 nm and a larger mode at median radii typically of about 400 nm. The larger mode is enhanced during periods with volcanically elevated stratospheric-aerosol levels but is also present during volcanically quiescent periods.
The main idea behind the present study is to simulate lidar backscatter and solar-occultation measurements for a bimodal aerosol particle size distribution and to retrieve particle size information assuming a monomodal log-normal size distribution with a fixed width parameter. This is done in order to investigate potential intrinsic differences in systematic retrieval errors between different measurement geometries.
Note that we do not claim that the actual particle size distribution of stratospheric aerosols is a bimodal log-normal distribution. This is an assumption, but it is an assumption based on several decades of in situ particle size measurements (e.g., Deshler et al., 2003; Deshler, 2008).
Aerosol particle size information can in principle be obtained based on measurements of (a) the spectral dependence of the aerosol extinction or scattering coefficients (e.g., Yue and Deepak, 1983; Bingen et al., 2003), (b) the spectral dependence of radiance, e.g., in limb geometry (e.g., Rieger et al., 2014; Malinina et al., 2018), (c) the scattering phase function (e.g., Gumbel et al., 2001; Renard et al., 2008) or (d) the polarization of the radiation scattered by aerosols (e.g., McLinden et al., 1999). In the present study the spectral method (a) is applied to forward simulations with a Mie scattering code for different observation geometries, frequently used to remotely sense stratospheric aerosols, i.e., satellite-based occultation (stellar, lunar or solar) measurements and lidar measurements.
Although satellite occultation instruments and ground-based lidar instruments typically take measurements at different wavelengths – e.g., 1020, 525 and 385 nm for SAGE II (Mauldin et al., 1985) compared to 1064, 532 and 355 nm for the ALOMAR (Arctic Lidar Observatory for Middle Atmosphere Research) Rayleigh–Mie–Raman lidar (Langenbach et al., 2019; Zalach et al., 2019) – we assume for simplicity the same pair of wavelengths for all observation geometries studied here, i.e., λ1=1064 and λ2=532 nm.
The particle size distribution of stratospheric aerosols is often assumed to be well represented by a monomodal log-normal distribution.
where d corresponds to the number of particles in the radius range per unit volume, S represents the geometric standard deviation (distribution width), rm is the median radius and N is the total particle concentration.
The basic idea behind the current study is to simulate the spectral dependence of stratospheric-aerosol extinction and backscatter assuming a bimodal log-normal distribution and based on Mie scattering calculations for pure sulfate aerosol particles. These forward simulations are then used to retrieve aerosol particle size information assuming a monomodal log-normal particle size distribution based on the spectral approach (a) mentioned above.
The existence of non-sulfate components of stratospheric aerosols is well established (e.g., Murphy et al., 1998; Curtius et al., 2005; Renard et al., 2008), but these particles are assumed to be of negligible impact in the current study.
For the occultation geometry, the color ratio Cocc employed for the size retrievals is simply given by the ratio of the simulated Mie extinction cross sections at the two wavelengths.
For the lidar geometry, the color ratio Clid is given by the ratio of the differential Mie scattering cross sections. The differential scattering cross section is given by product of the scattering cross section and the phase function Φ(π) for a scattering angle of Θ=π. Note that the imaginary part of the extinction cross section for stratospheric-sulfate aerosols can be neglected, implying .
The color ratio Clid is then given by
Stratospheric-aerosol particle size information is also retrieved from limb-scatter measurements with the OSIRIS (Optical Spectrograph and InfraRed Imager System; e.g., Bourassa et al., 2008) and SCIAMACHY (Scanning Imaging Absorption Spectrometer for Atmospheric Chartography; e.g., Malinina et al., 2018) instruments. The limb-scatter geometry is not considered in the present study, because it requires accurate treatment of surface reflection and multiple scattering, which is beyond the scope of the treatment used here. The effects studied here should, however, also be investigated for aerosol size retrievals from limb-scatter measurements in future studies. We would like to point out that different aspects of the sensitivity of satellite limb-scatter measurements on the stratospheric-aerosol particle size distribution have been already investigated in the studies by Rieger et al. (2014) and Malinina et al. (2019).
In the Rayleigh limit, i.e., for very small particles, the scattering cross section scales with the 6th power of the particle radius. For larger particle sizes the scaling occurs with a smaller power. This is illustrated in Fig. 1. The top panel of the figure shows the dependence of the Mie extinction cross section (solid lines) on the median radius of a monomodal log-normal particle size distribution with a width of S=1.4 and N=1 at 532 and 1064 nm wavelengths. Also shown (dashed lines) is the radius dependence of the differential scattering cross section for a lidar backscatter geometry, i.e., a scattering angle of Θ=π. The bottom panel of Fig. 1 displays the exponent κ of the power law, with which the extinction cross section scales, i.e., . The exponent κ was determined using the following relation:
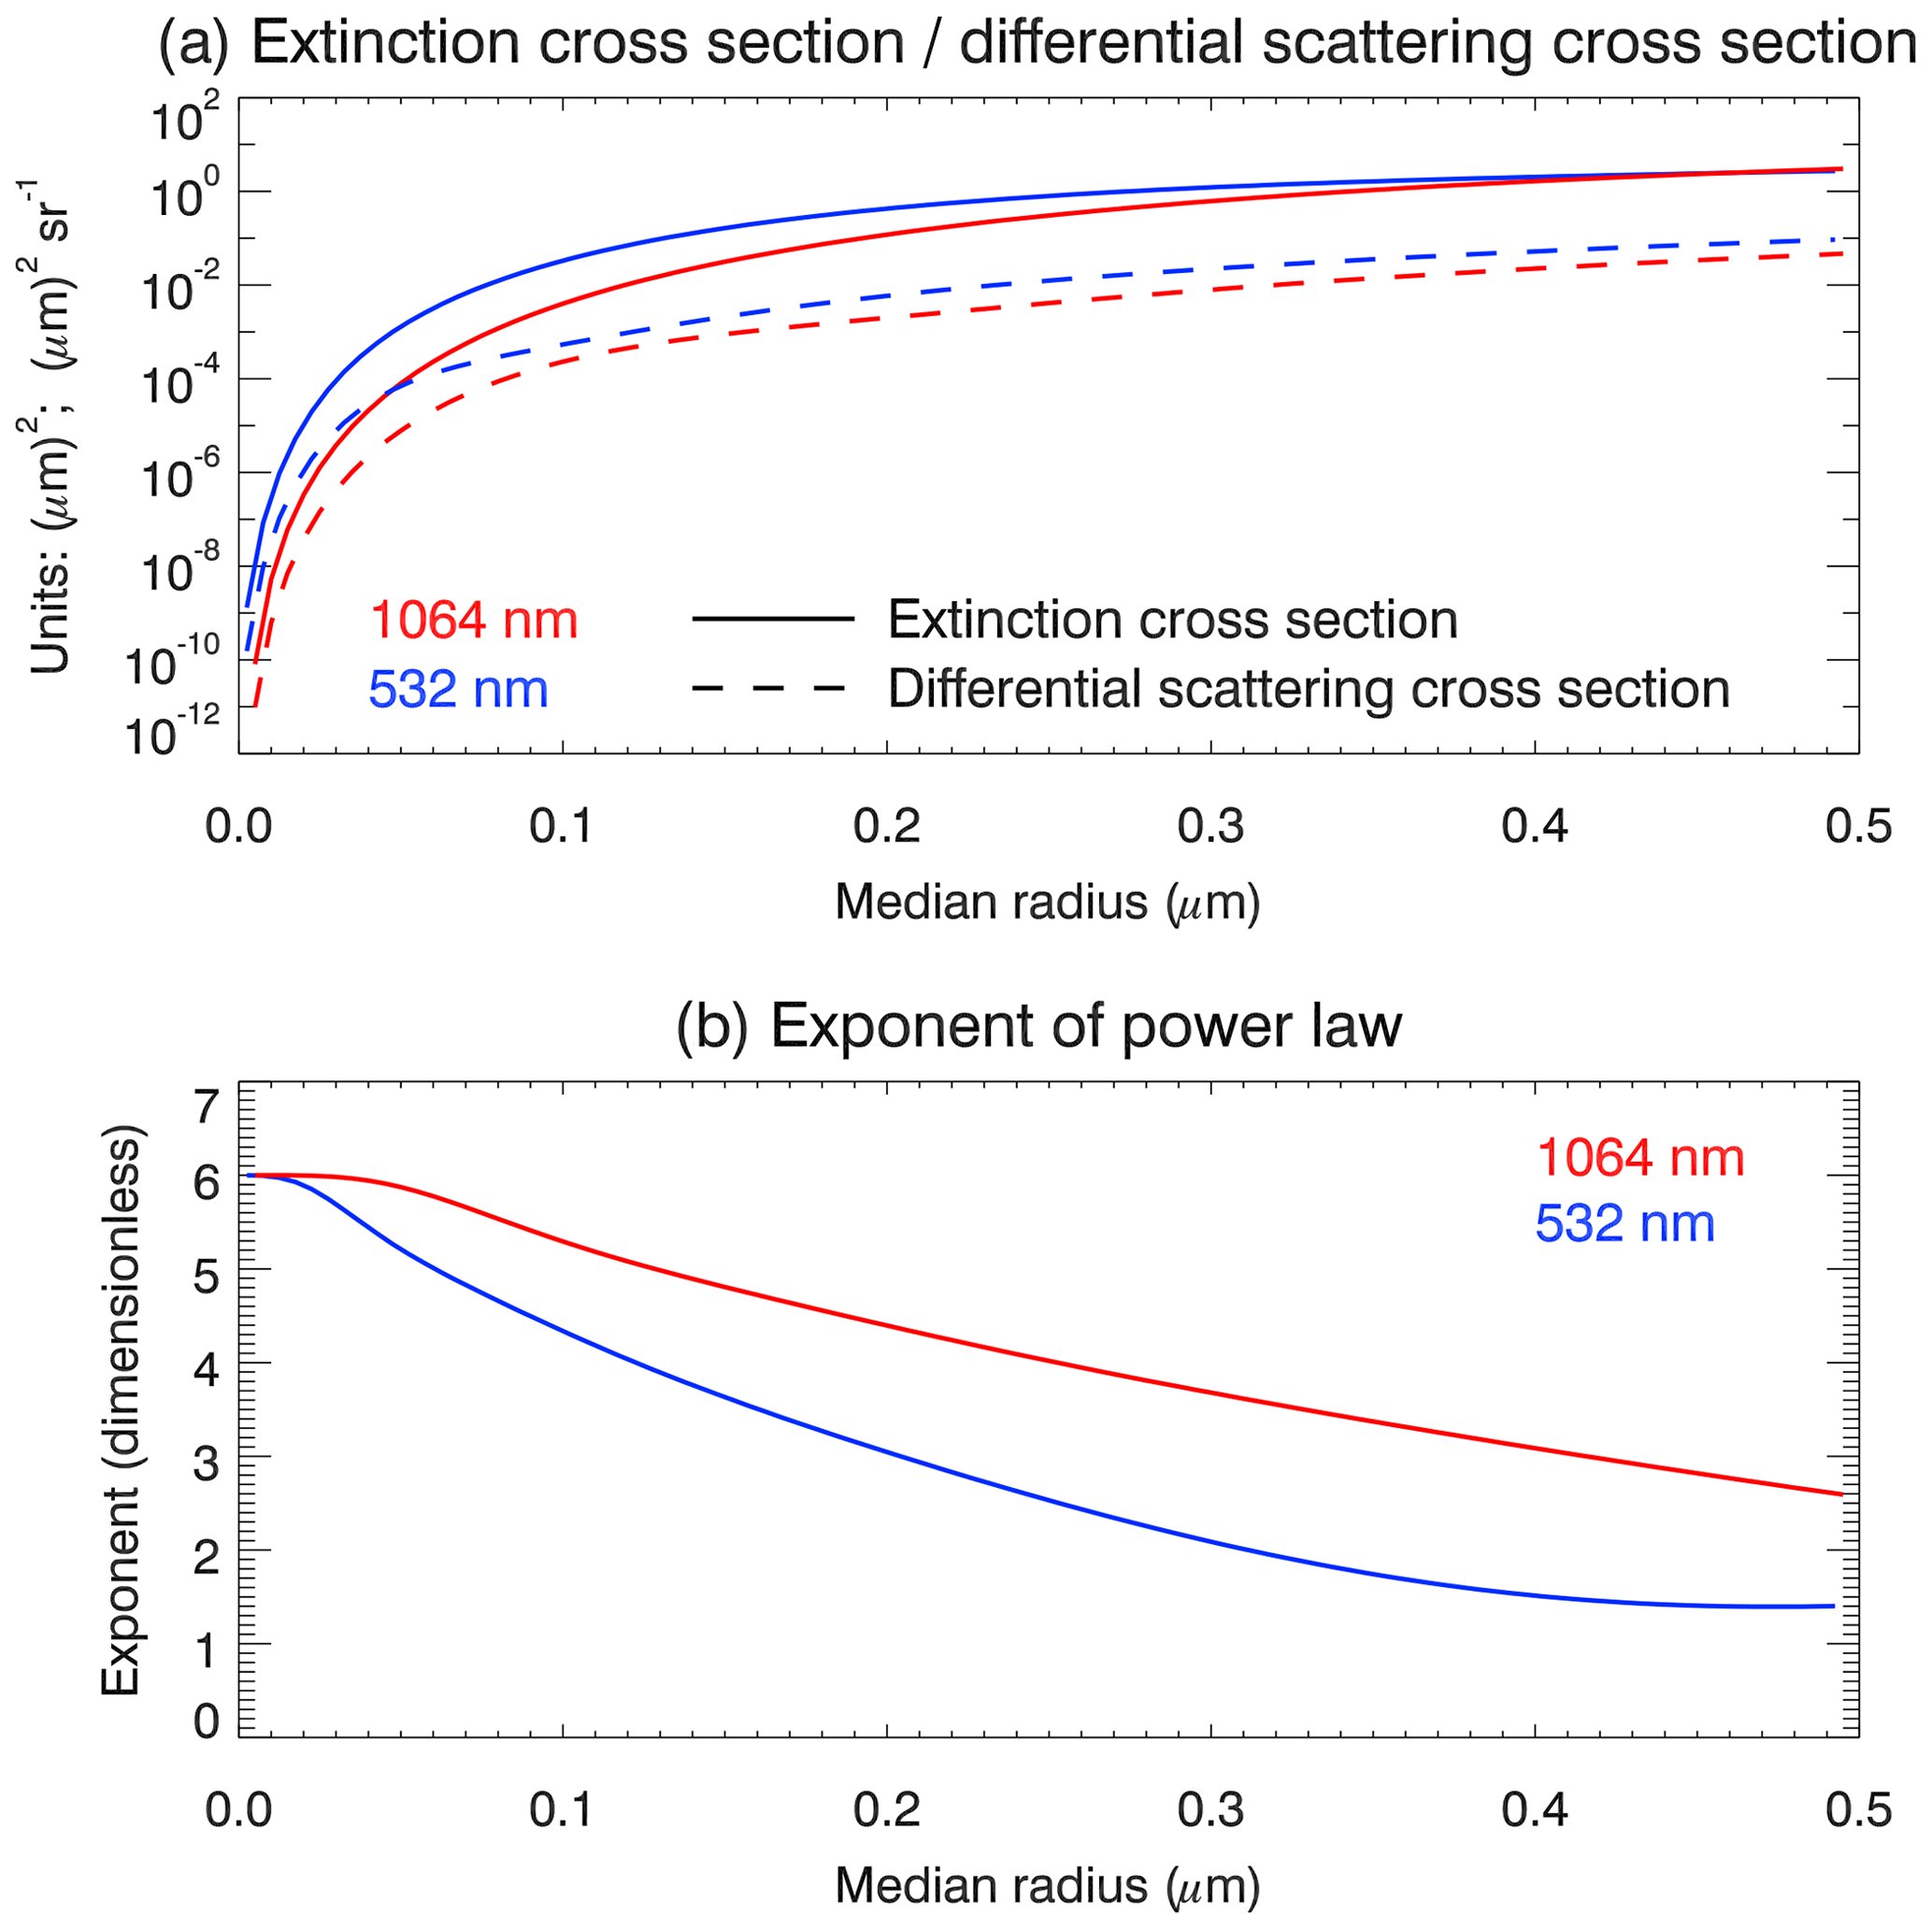
Figure 1(a) The solid lines correspond to the median radius dependence of the Mie extinction cross section at 1064 nm (red line) and 532 nm (blue line) for a monomodal log-normal particle size distribution with S=1.4. The dashed lines display the median radius dependence of the differential scattering cross section for a lidar backscatter geometry. (b) Dependence of the power law exponent (see Eq. 4) of the dependence of the aerosol extinction cross section on the median radius.
According to Fig. 1 the extinction cross section scales with the 4th to 5th power of the median radius for typical median radii of about 100 nm.
The Laramie in situ measurements (e.g., Deshler et al., 2003; Deshler, 2008) typically indicate a bimodal particle size distribution with a small mode with median radii on the order of 100 nm and a larger mode with median radii of several hundred nanometers. In the following we will model a bimodal stratospheric-aerosol size distribution by superposing two monomodal log-normal distributions with different median radii and different width parameters:
where χ is the so-called coarse-mode fraction (CMF).
Figure 2 shows the bimodal particle size distribution (black solid line) with two log-normal modes and the following size parameters: r1=80 nm, S1=1.6, N1=1, r2=400 nm, S2=1.15, N2=1 and a coarse-mode fraction of . These values are approximately consistent with the available in situ measurements (Deshler et al., 2003; Deshler, 2008). The red dashed line displays the particle size distribution multiplied by the Mie extinction cross section σext(λ,r) and describes the contribution of the different aerosol sizes to the overall extinction seen by an occultation instrument. Apparently, the importance of the second mode is enhanced, and also for the main mode it is obvious that the larger particles contribute more to the overall extinction compared to the smaller particles. The blue dash-dotted line corresponds to the particle size distribution multiplied by the differential scattering cross section for a lidar backscatter geometry, i.e., a scattering angle of Θ=π. Apparently, aerosol particles with sizes close to the main mode contribute most to the backscatter signal measured by a lidar. Figure 2 illustrates qualitatively that occultation measurements will be more sensitive to larger particles of the aerosol population than the lidar backscatter measurements. This already suggests that size retrievals based on occultation measurements may lead to larger estimates of the aerosol size if a wrong size distribution function is assumed. We note that, in order to illustrate the effect more clearly, the width of the small mode of the bimodal size distribution has been chosen larger than for the simulations described below.

Figure 2The black line shows the assumed bimodal particle size distribution with two log-normal modes and the following parameters: r1=80 nm, S1=1.6, r2=400 nm, S2=1.15 and a coarse-mode fraction of . The red dashed line corresponds to the particle size distribution multiplied by the Mie extinction cross section . The blue dash-dotted line corresponds to the particle size distribution multiplied by the differential scattering cross section for a lidar backscatter geometry and also for a wavelength of 532 nm. Note that all functions are normalized.
The basic procedure used here is to simulate the color ratios for the different observation geometries (see Eqs. 2 and 3), assuming the bimodal log-normal particle size distribution, followed by the retrieval of the median radius of an assumed monomodal log-normal size distribution with a fixed geometric width S. Note that we also discuss results for the retrieval of the effective radius below (see Sect. 3.1). For the size retrievals, precalculated look-up tables (LUT) of the color ratios as a function of median radius are employed. The retrieved median radii are determined from the forward simulated color ratios by linear interpolation using the LUTs. The following parameters are assumed for the forward simulations: r1=80 nm, S1=1.4, N1=1, r2=400 nm, S2=1.15 and N2=1, guided by the available in situ measurements (Deshler et al., 2003; Deshler, 2008). Note that the exact values of the assumed bimodal size distribution parameters are not important for the main conclusion of the present study. It is also important to mention that the size retrieval based on multicolor lidar measurements does not necessarily yield a unique solution. This aspect was discussed in detail by Zalach et al. (2019) and does not affect the main conclusions of the current investigation. For the size retrievals performed here, the geometric width of the log-normal distribution was chosen to be identical to the geometric width of the main mode of the bimodal particle size distribution used for the forward simulations. For the analysis of observational data sets, the correct value of the distribution width is certainly not available, but this assumption does not affect the main conclusions of the present study either.
3.1 Particle size retrievals
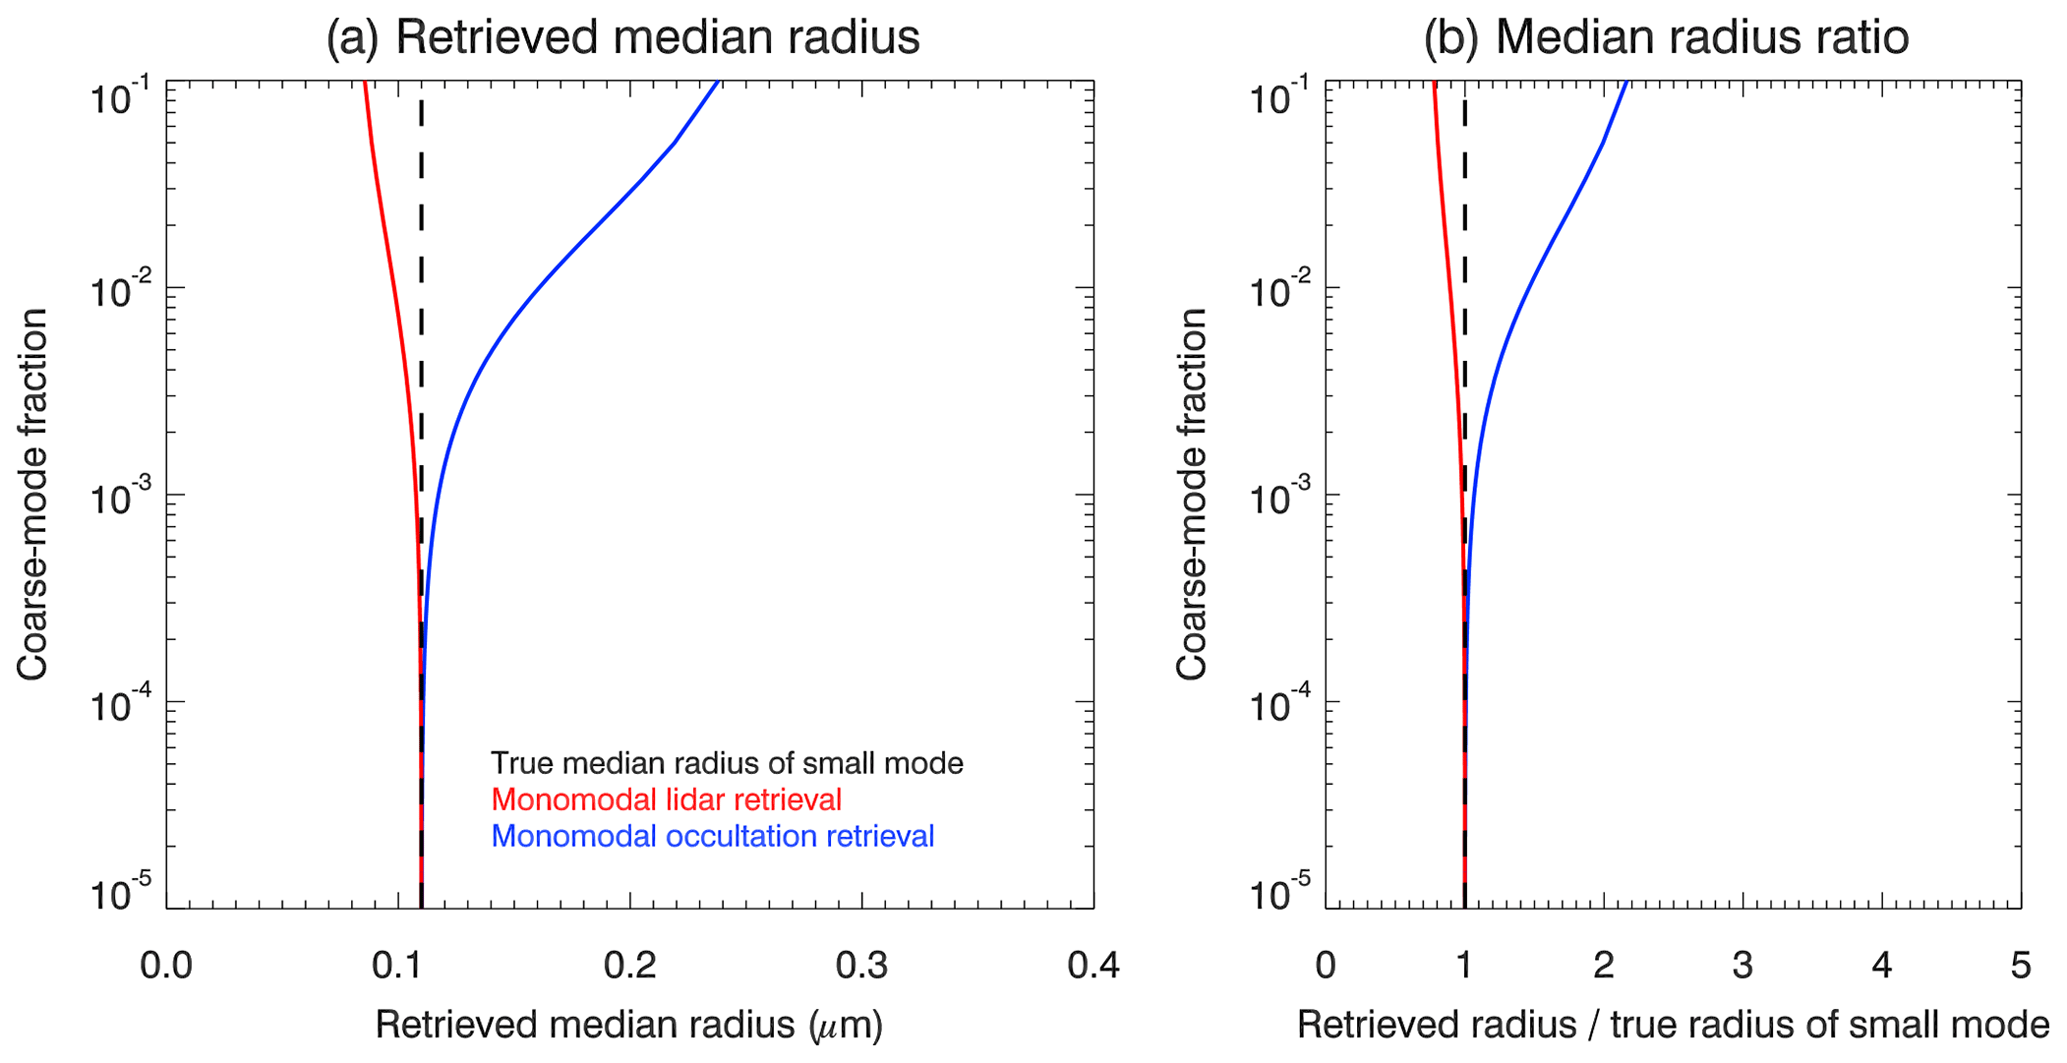
We first discuss results for the retrieval of the median radius of the assumed monomodal log-normal particle size distribution, followed by a discussion of the effects on the retrieval of the effective radius. Figure 3 displays the dependence of the retrieved median radius for the lidar (red line) and occultation geometries (blue line) as a function of the coarse-mode fraction χ. For very small coarse-mode fractions (i.e., ) the retrieved median radii are in good agreement with the median radius of the main mode if the correct width of the particle size distribution is assumed. For increasing values of the coarse-mode fraction, the median radius based on the occultation measurements increases significantly and reaches about 3.5 times the median radius of the main mode for a coarse-mode fraction of . This strong overestimation of the retrieved size for occultation measurements relative to the lidar retrievals is directly related to the higher sensitivity of the occultation measurements to the larger particles (see Fig. 2), compared to the lidar measurements, in combination with neglecting the second mode for the retrievals.

Figure 3(a) The coarse-mode fraction dependence of retrieved stratospheric-aerosol median radius rm is shown for an assumed monomodal log-normal particle size distribution with S=1.4 based on simulated lidar (red line) and satellite occultation (blue line) measurements. The actual aerosol particle size distribution is a bimodal log-normal distribution. The black dashed line corresponds to the true median radius of the small mode. Note that the distribution width of the monomodal distribution assumed for the retrievals was chosen to be identical to the width of the main mode of the bimodal log-normal distribution used for the forward simulations. For the smallest coarse-mode fractions, the median radius of the small mode can be well retrieved for all measurement geometries, as expected. (b) Ratio of the retrieved radii and the true median radius of the small mode of the bimodal log-normal distribution.
The coarse-mode fractions reported in different studies are on the order of , corresponding to median radii retrieved from occultation measurements of up to about 300 nm according to Fig. 3. In other words, the simulated size retrievals described above not only qualitatively reproduce the larger stratospheric-aerosol particle sizes frequently reported in studies based on occultation measurements, the sizes are also reproduced quantitatively, based on bimodal particle size distribution parameters reported in previous studies.
Next we test how retrievals of the effective radius for the lidar and occultation measurement geometries depend on the coarse-mode fraction of the bimodal particle size distribution. The results for the effective radius are shown in Fig. 4 in a similar way as for the median radius in Fig. 3. The effective radii for the lidar (red solid line) and occultation (blue solid line) retrievals were determined from the median radii and the assumed distribution width using the following relationship (Grainger, 2017):
The effective radius of the bimodal log-normal distribution (black dashed line in Fig. 4) was determined by numerical integration. For the parameters considered here, the maximum overestimation of the effective radius of the occultation retrievals, relative to the true effective radius, occurs for a coarse-mode fraction of about . For this coarse-mode fraction, the effective radius retrieved from the simulated occultation measurements is about a factor of 2 larger than the true value and a factor of 3 larger than the value retrieved from the simulated lidar backscatter measurements.
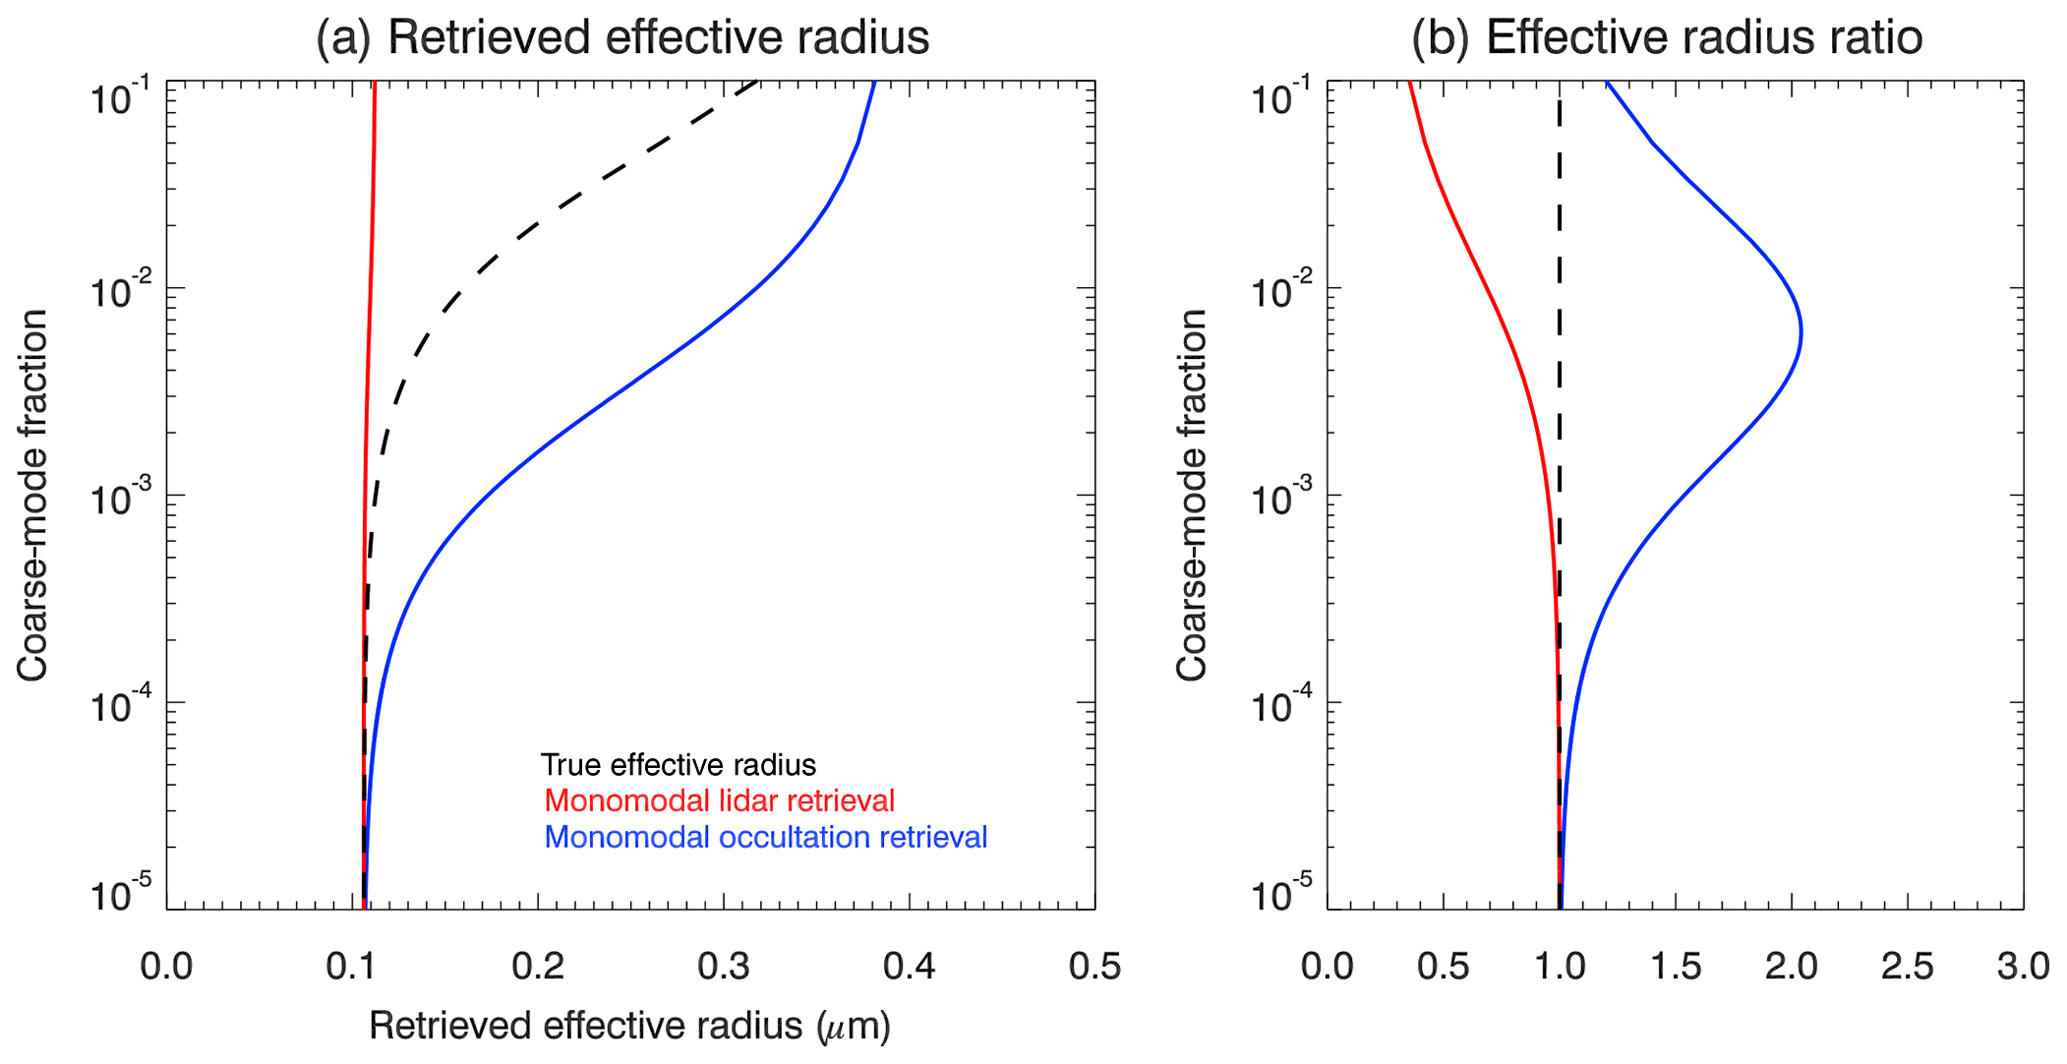
Figure 4(a) The coarse-mode fraction dependence of retrieved effective radius reff is shown for an assumed monomodal log-normal particle size distribution with S=1.4 based on simulated lidar (red line) and satellite occultation (blue line) measurements. The black dashed line corresponds to the true effective radius of the bimodal particle size distribution assumed for the forward simulations. (b) Ratio of the retrieved effective radii and the true effective radius of the bimodal log-normal distribution.
Another important parameter in aerosol research is the Ångström exponent or spectral exponent α, which corresponds to the exponent of a power law used to approximate the spectral dependence of the aerosol extinction cross section: . Based on the simulated aerosol extinction cross sections, the Ångström exponent is easily determined using the following relationship: , with λ1=1064 and λ2=532 nm in this study. The dependence of α on the coarse-mode fraction of the assumed bimodal log-normal distribution is shown in Fig. 5. As expected, α is smaller for larger coarse-mode fractions and asymptotically approaches a larger value for decreasing coarse-mode fractions. The exact dependence of α on the coarse-mode fraction certainly depends on the specific parameters of the assumed bimodal particle size distribution, but the overall effect is similar.

Figure 5Shown is the dependence of the Ångström exponent α, which is determined from the simulated extinction cross sections, on the coarse-mode fraction of the assumed bimodal particle size distribution.
3.2 Aerosol number density retrievals
In a way similar to that for the retrieved aerosol median radius, we tested the dependence of the retrieved aerosol number density on the coarse-mode fraction of the assumed bimodal log-normal particle size distribution if only a single mode is considered in the retrievals. It is to be expected that the lidar retrievals will overestimate the aerosol number density and the occultation retrievals will tend to underestimate it. Figure 6 displays the dependence of the retrieved aerosol number densities as a function of the coarse-mode fraction χ. For the smallest coarse-mode fractions, the true aerosol number density can be retrieved accurately, as expected. For an increasing coarse-mode fraction, the aerosol density retrieved for the occultation geometry deviates significantly from the true value, and for the retrieved number density is only about 5 % of the true value. At a typical coarse-mode fraction value of , the ratio of the aerosol densities retrieved from the lidar and occultation measurements is roughly 50.
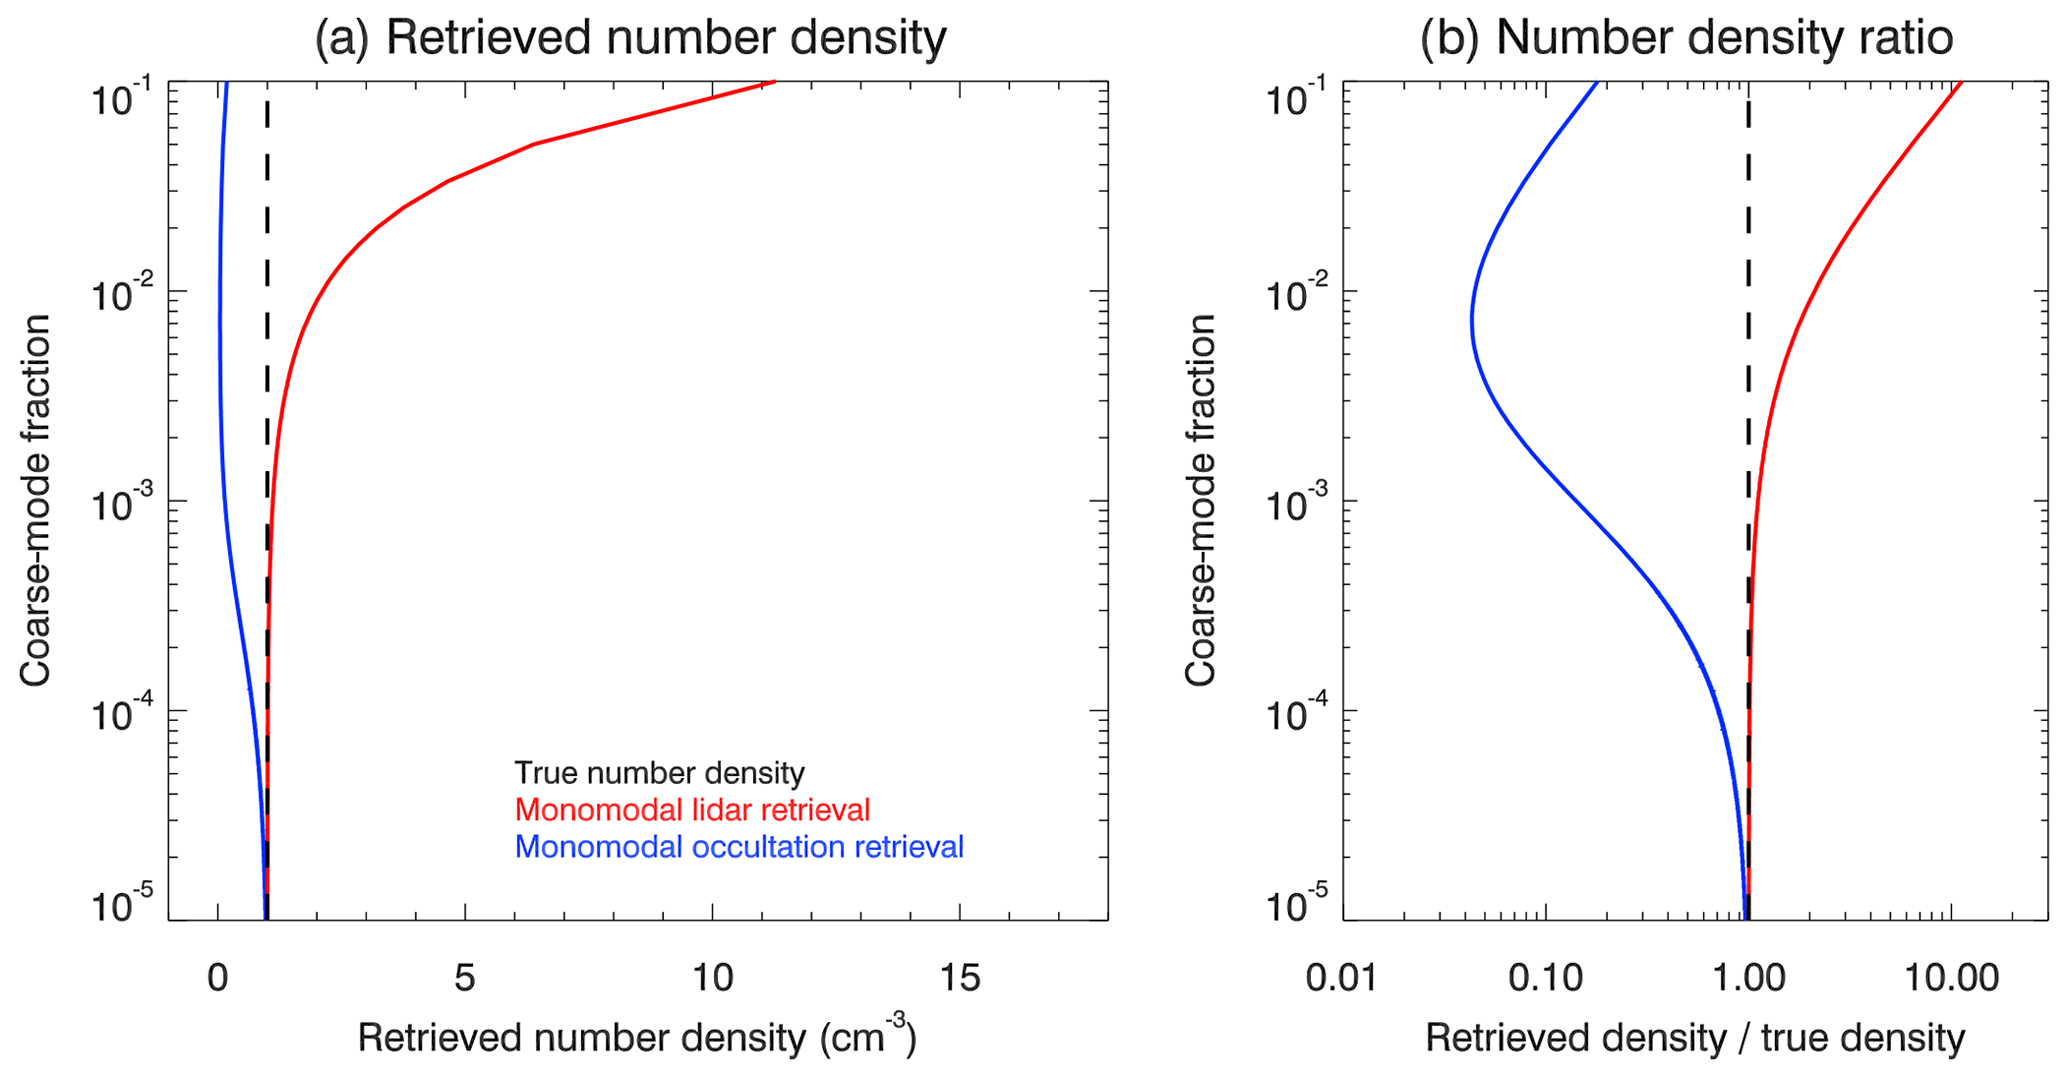
The results clearly show that substantial errors in retrieved aerosol number density have to be expected if the assumed aerosol particle size distribution differs from the actual distribution. This is expected and not surprising. The important point is that number density retrievals based on solar-occultation measurements may systematically underestimate the aerosol number density, while lidar measurements may lead to a systematic overestimation. For the range of coarse-mode fractions reported in the literature (e.g., Deshler, 2008; Chen et al., 2018), the number densities retrieved from occultation and lidar measurements may differ by more than one order of magnitude. Results published in earlier studies are qualitatively and semiquantitatively consistent with these conclusions (compare, e.g., the aerosol number densities retrieved from occultation measurements in Bingen et al., 2003, with the ones retrieved from lidar measurements by Zalach et al., 2019).
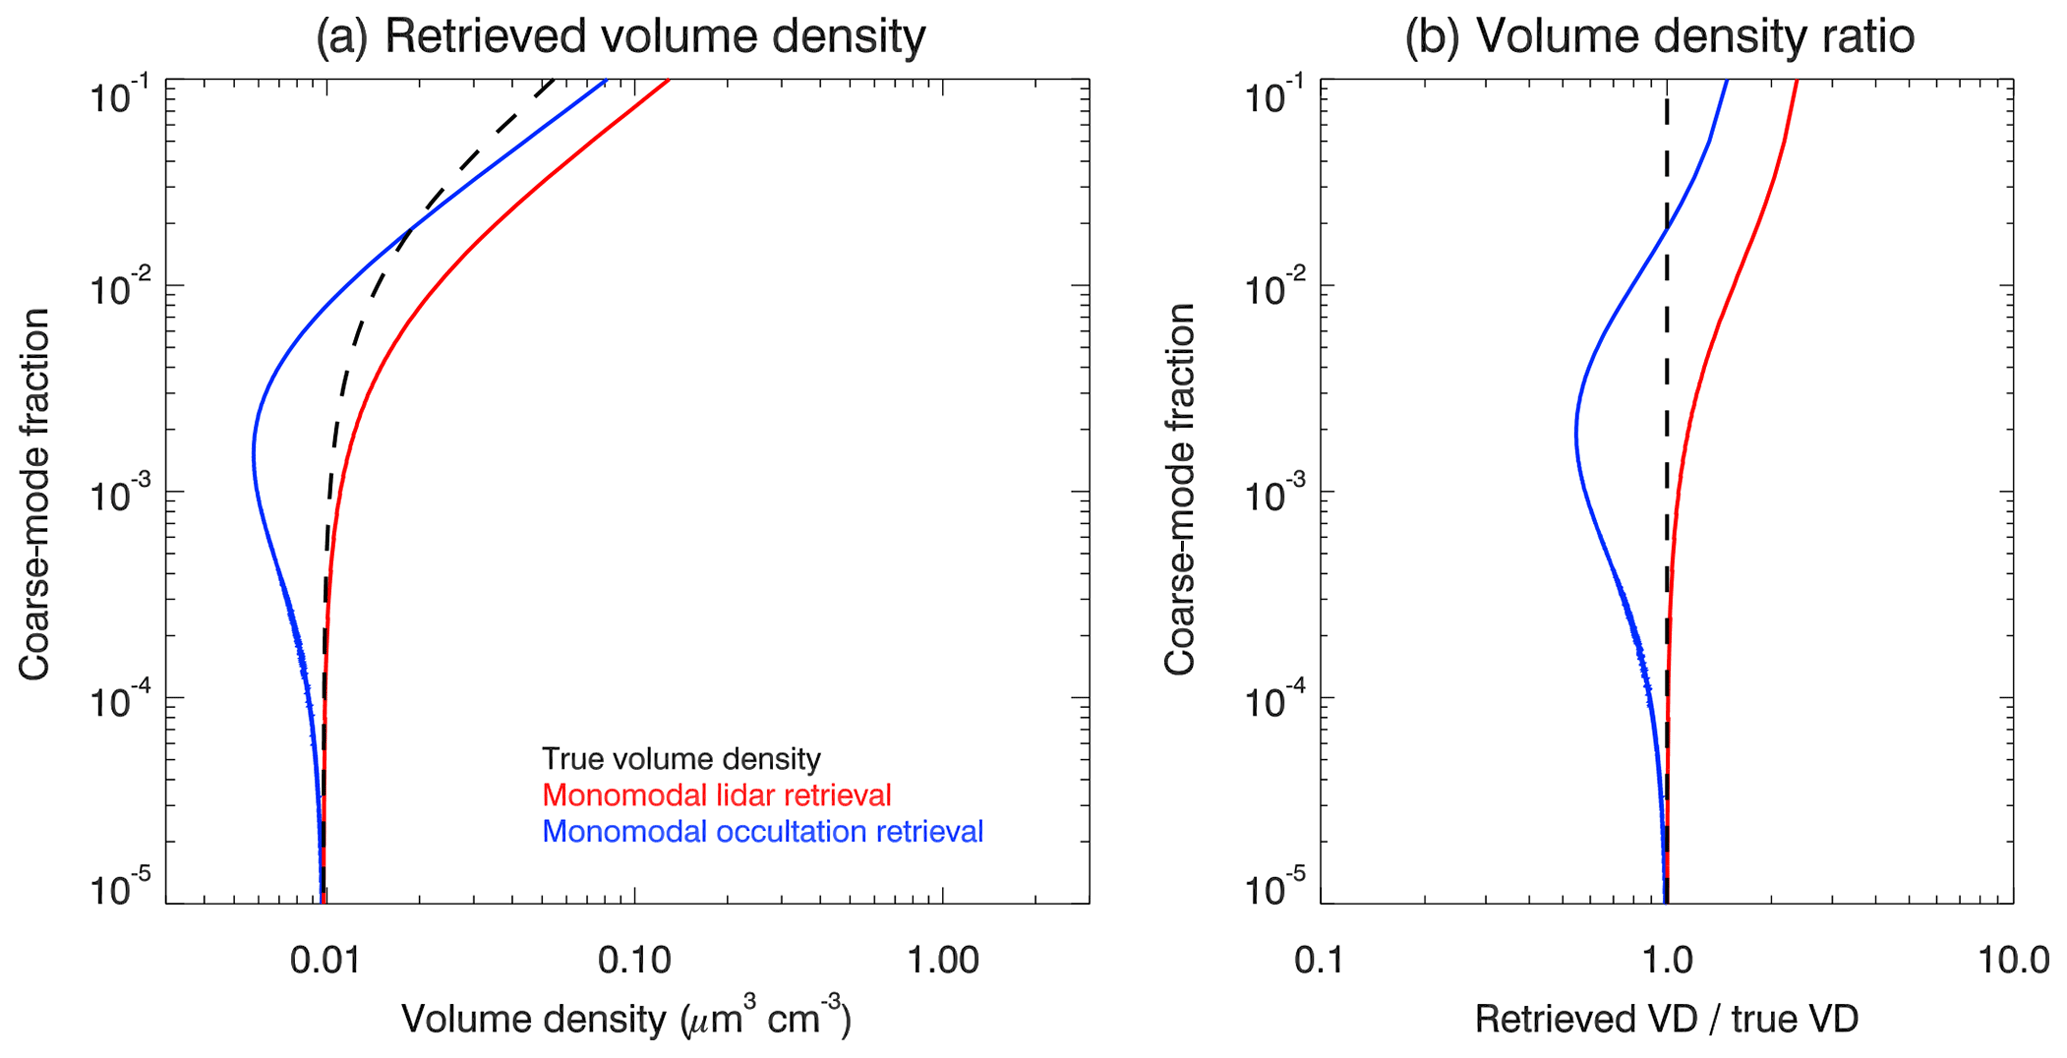
3.3 Surface area and volume density
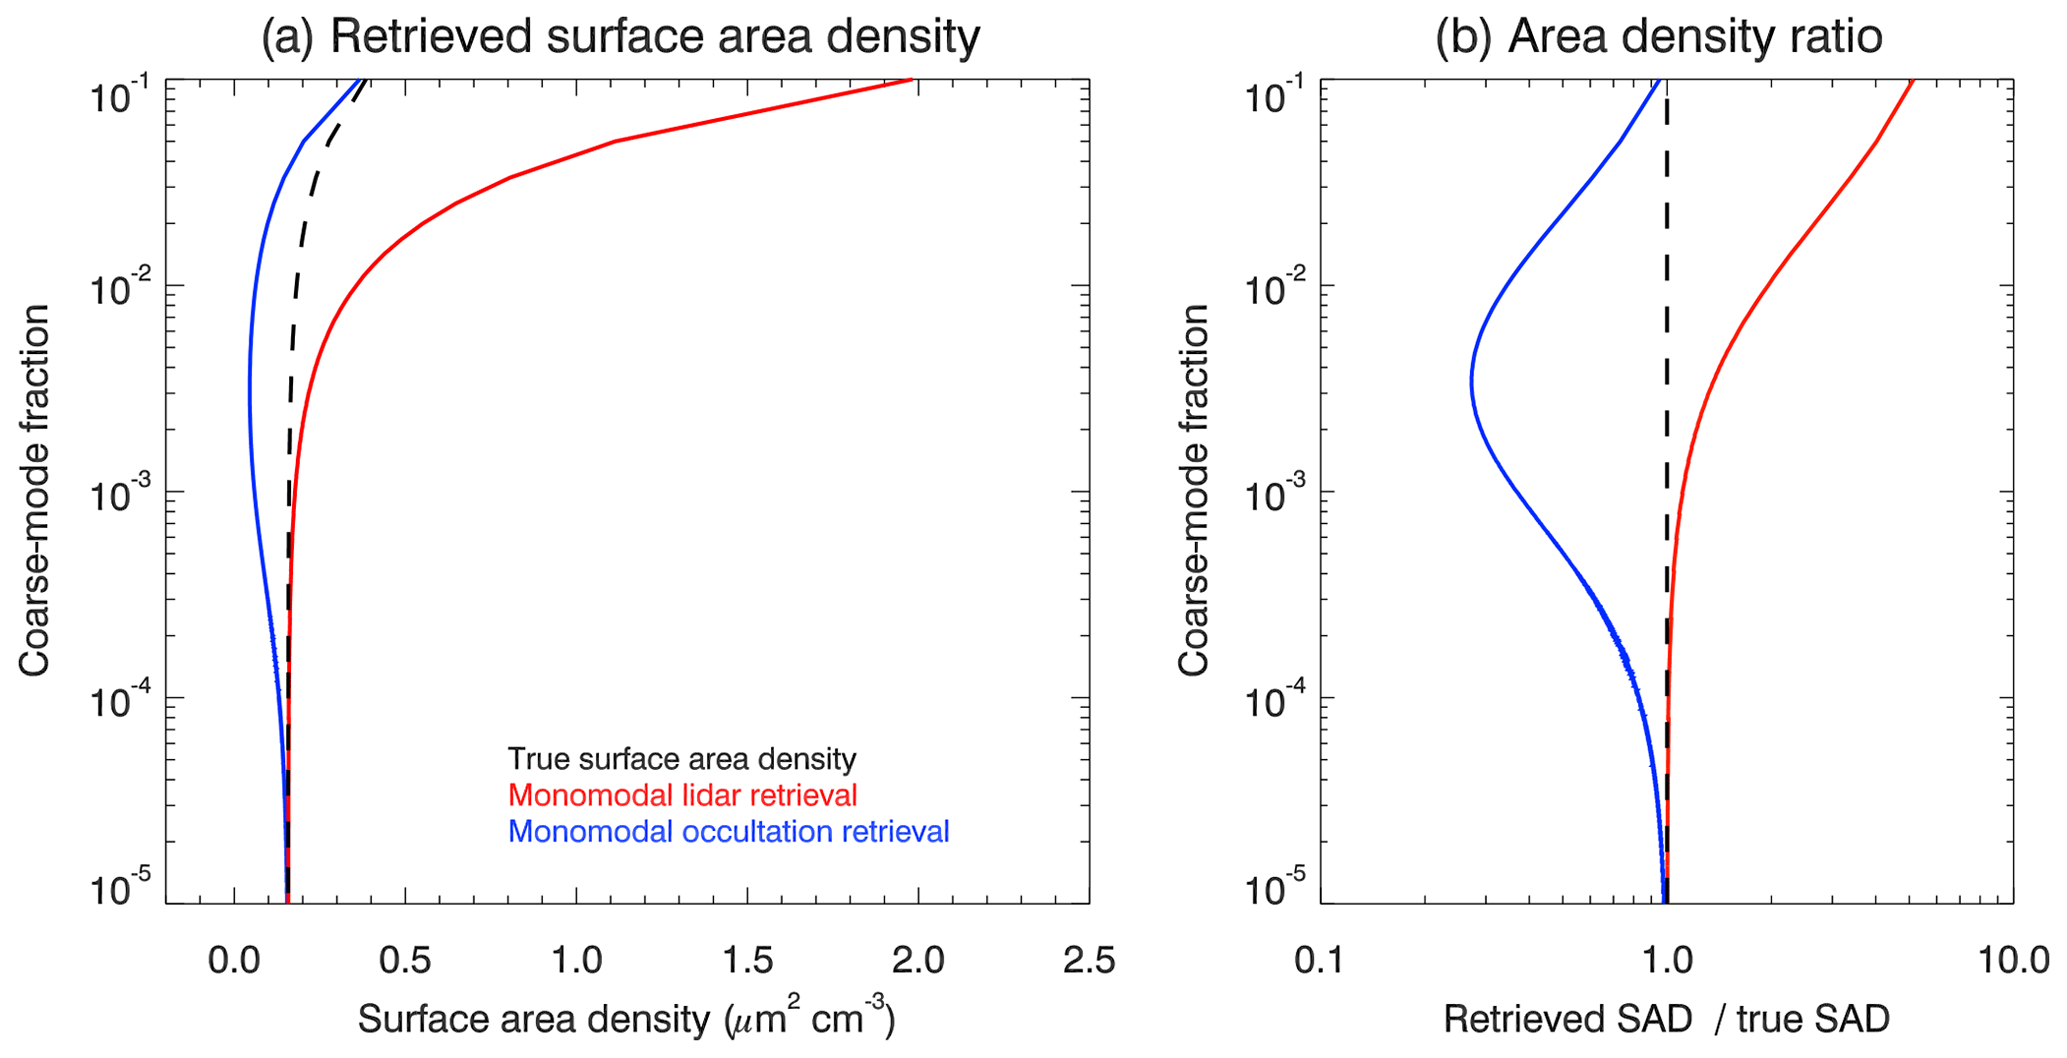
For monomodal log-normal distributions, surface area density (SAD) and volume density (VD) can be determined via the following analytical formulae (see, e.g., Grainger, 2017):
The variables in Eqs. (7) and (8) are the same as in Eq. (1). The surface area and volume densities are determined using the retrieved median radius and number density for each of the considered observation geometries. The resulting surface area and volume densities are compared in Figs. 7a and 8a, respectively. The black dashed lines in these panels correspond to the true values – as a function of coarse-mode fraction – based on the assumed bimodal log-normal particle size distribution. Shown in Figs. 7b and 8b are the ratios of the retrieved values to the true value. For both quantities, the correct values can essentially be retrieved for the smallest coarse-mode fractions if the correct width of the particle size distribution is assumed. For coarse-mode fractions between 10−2 and 10−1, the relative differences between the retrieved SADs and the true values can reach a factor of about 4, and the ratio between the SAD retrieved from lidar measurements and the one retrieved from occultation measurements reaches 1 order of magnitude. The differences are slightly smaller for the volume density (see Fig. 8b). Considering Eqs. (7) and (8), this behavior is consistent with the coarse-mode fraction dependence of median radius (see Fig. 3) and aerosol number density (see Fig. 6). Note that the relative retrieval errors are smaller for surface area density and volume density compared to the median radius or aerosol number density. This is because the retrieval errors in median radius and number density partially compensate each other when calculating surface area density and volume density.
3.4 Extinction retrievals from lidar measurements
Finally we discuss the effects on aerosol extinction coefficients retrieved from the simulated lidar backscatter measurements. Since the imaginary part of the refractive index of the stratospheric aerosols is assumed to be zero, scattering and extinction coefficients are identical. The extinction coefficient retrieved from the simulated lidar measurements is easily determined based on the retrieved aerosol median radius, which is employed to calculate the extinction cross section using the Mie routine, and the number density determined above. Figure 9 shows the dependence of the ratio of the retrieved and true extinction coefficient on the coarse-mode fraction for the two wavelengths considered, i.e., 532 and 1064 nm. For small coarse-mode fractions, the true extinction coefficient can be retrieved very well, as expected. However, as the coarse-mode fraction increases, the retrieved extinction coefficient systematically underestimates the true value for both wavelengths. This behavior is to be expected because of the lower sensitivity of the lidar measurements to the larger particles compared to the smaller particles of the assumed bimodal particle size distribution (see Fig. 2). As Fig. 9 shows, the low bias of the retrieved extinction coefficient compared to the true value is larger for the longer wavelength. At a wavelength of 1064 nm, the retrieved extinction is only about 20 % of the true value for a coarse-mode fraction of – the largest value considered here. For 532 nm the retrieved extinction is about 80 % of the true value for a coarse-mode fraction of . The larger bias of the extinction at the longer wavelength is consistent with the underestimation of the effective radius (Fig. 4), which is associated with a stronger wavelength dependence of the extinction coefficient.
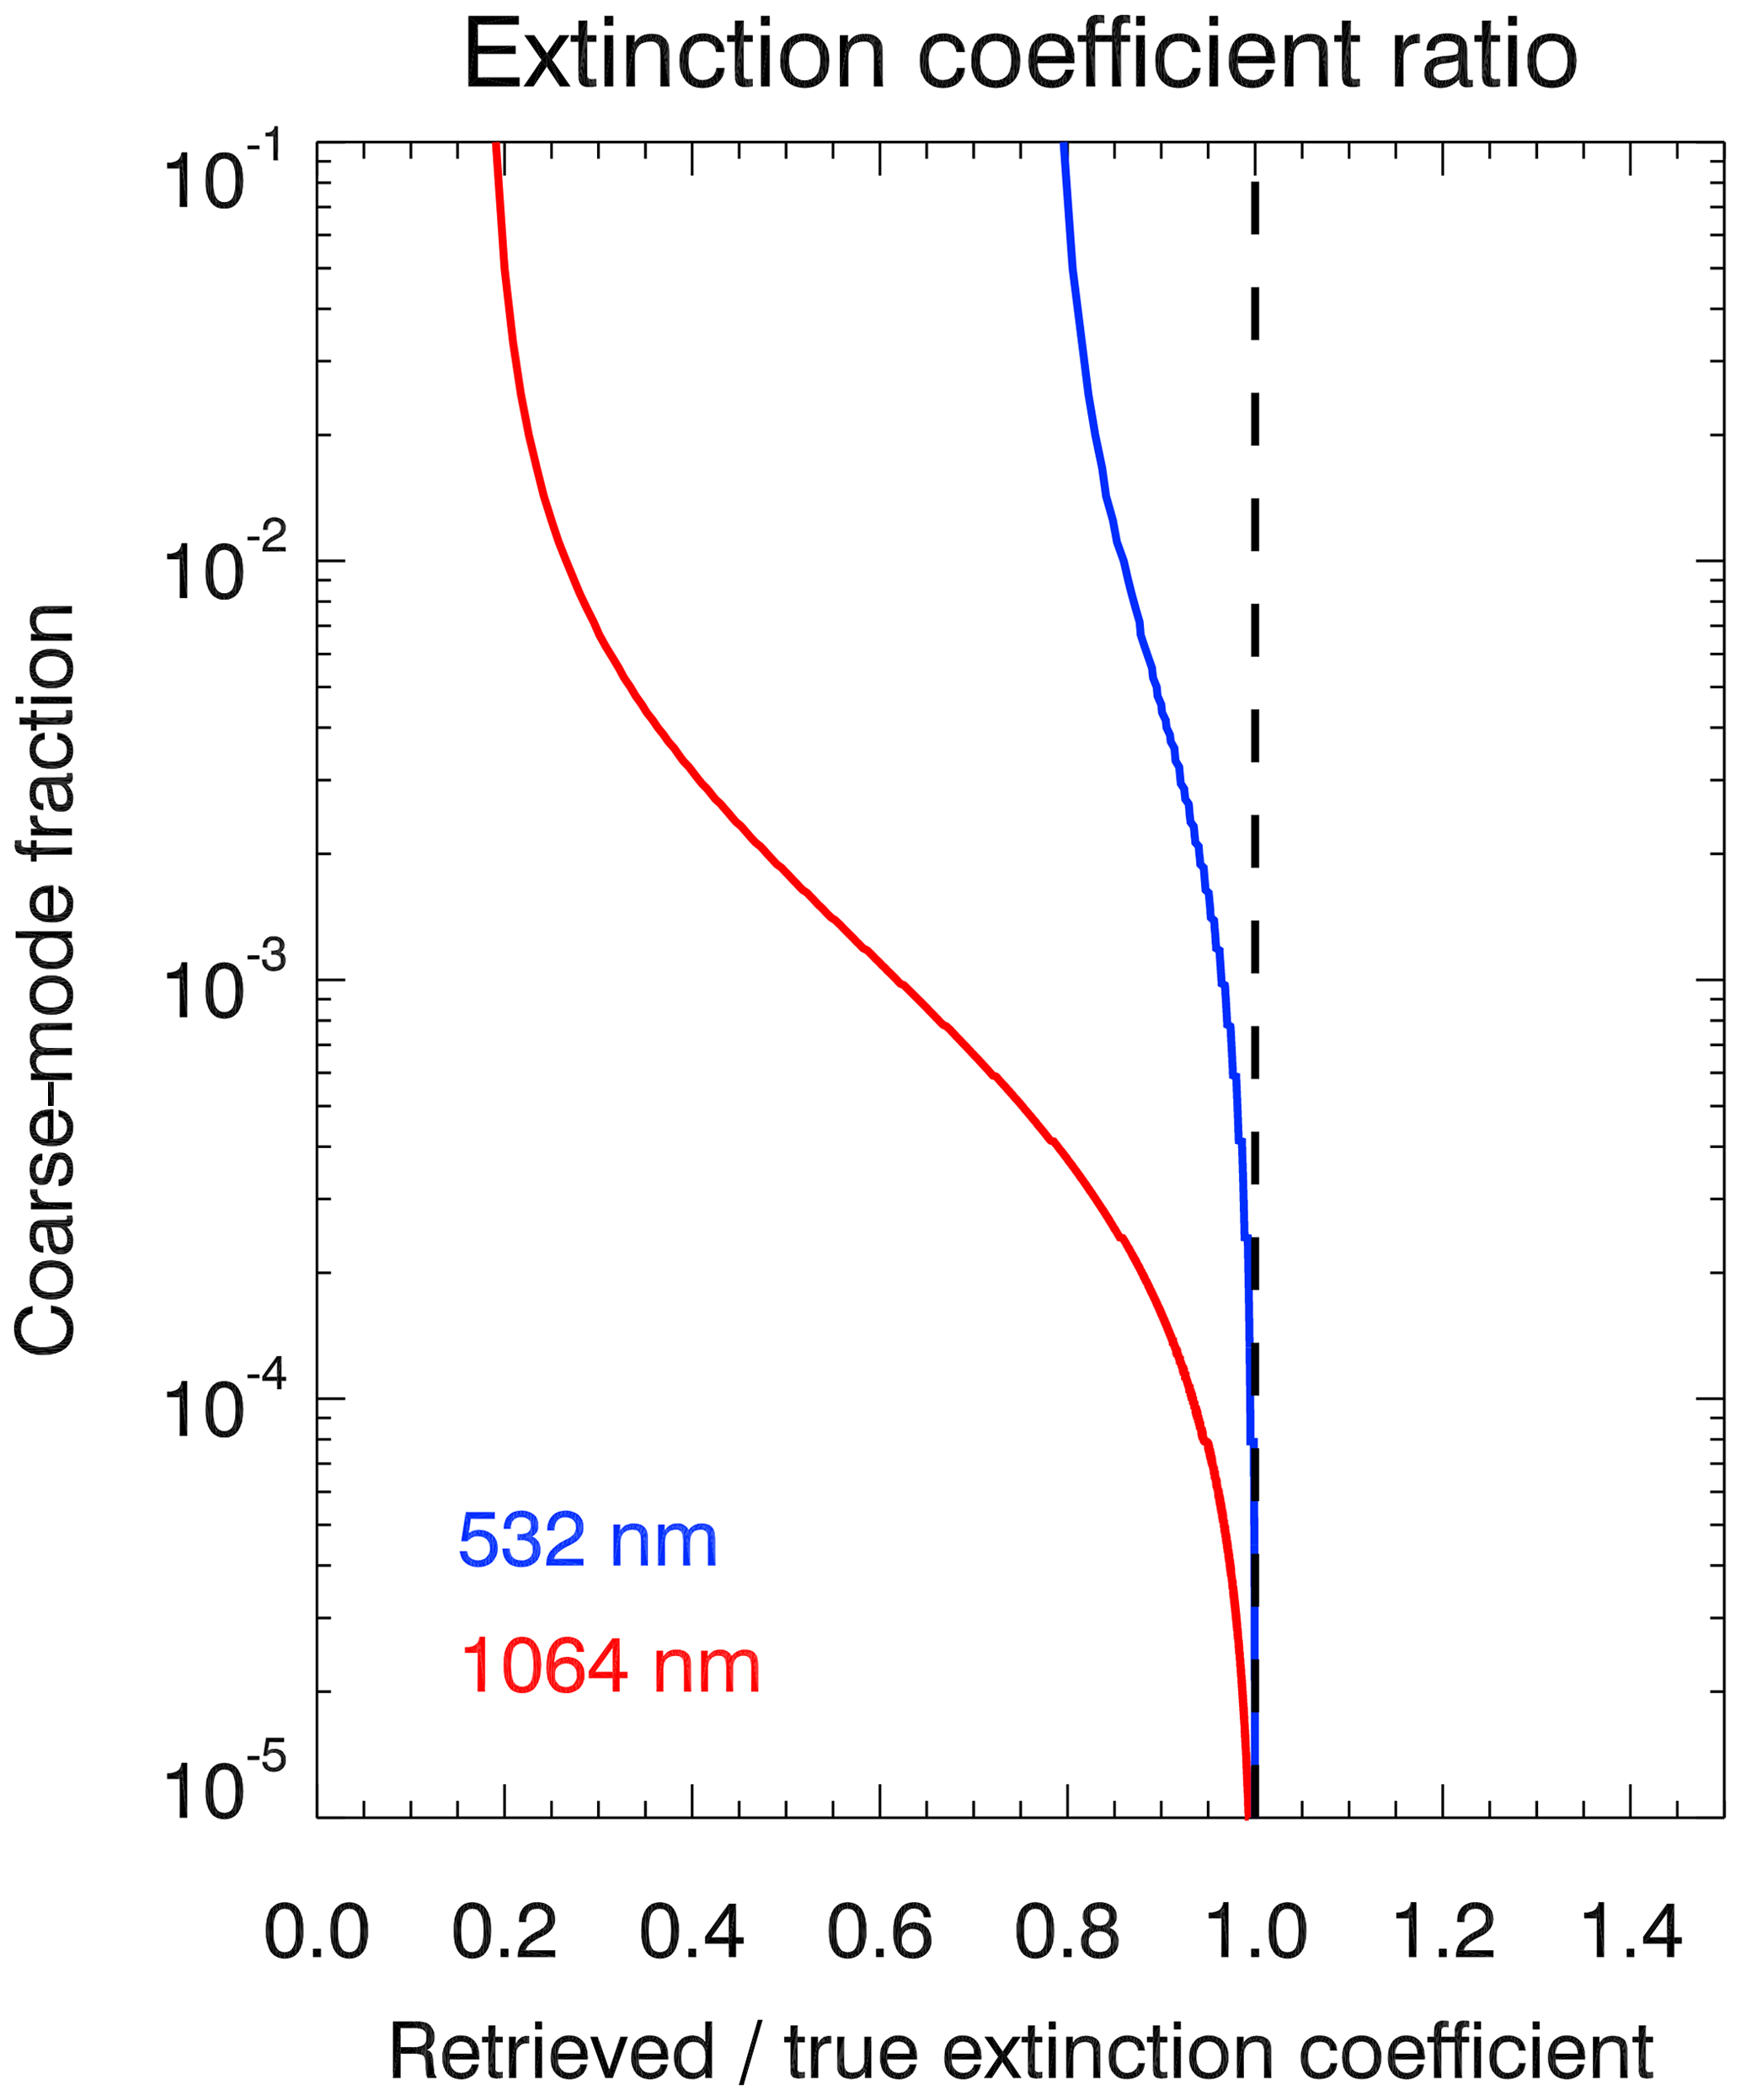
Figure 9Shown is the ratio of the extinction coefficient retrieved from the simulated lidar measurements and the true extinction coefficient as a function of the coarse-mode fraction of the bimodal particle size distribution and for the two wavelengths considered. For decreasing coarse-mode fractions, the ratio asymptotically approaches 1 as expected.
3.5 Discussion
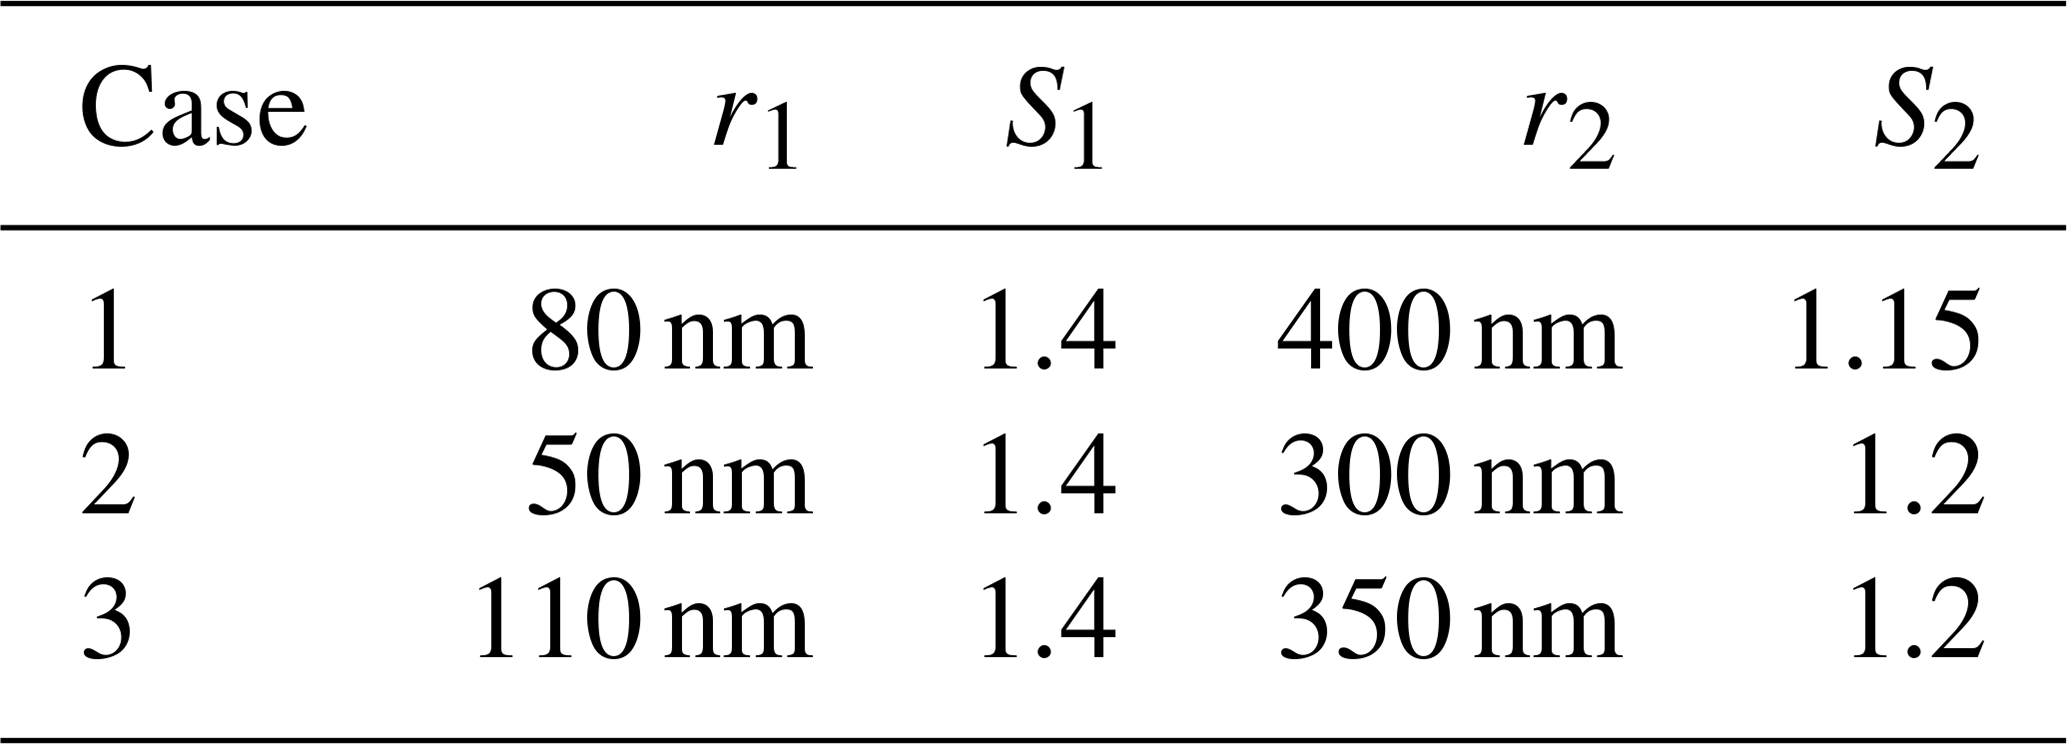
The results presented above are based on specific parameters of the assumed bimodal particle size distribution. The question arises as to how the results depend on the specific assumptions made. In order to test this, we performed forward simulations and retrievals based on different parameters of the bimodal particle size distribution. For illustration, we show particle size retrieval results for two different sets of the parameters r1, S1, r2 and S2 of the bimodal particle size distributions. Table 1 lists the parameters of these additional two cases (cases 2 and 3) together with the parameters used above (case 1).
Figure 10 shows the coarse-mode fraction dependence of the retrieved median radius for case 2 and Fig. 11 for case 3. The retrieval results certainly depend to some extent on the specific assumptions made, but the overall conclusions are not affected. We note again that the main aspect of this study does not lie in the specific values of aerosol particle size information retrieved for specific assumptions. The main aspect is that size retrievals based on different measurement techniques may lead to different results due to the different intrinsic sensitivities of these techniques.
Table 1Overview of parameters of the bimodal particle size distributions assumed for the forward simulations.

Most likely the actual particle size distribution of stratospheric aerosols is highly variable in space and time (see, e.g., the highly structured patterns in lidar volume backscatter coefficients in Langenbach et al., 2019). In addition, not only bimodal distributions but a variety of distributions deviating from a monomodal log-normal distribution have to be expected. Based on the results presented here, one cannot expect that particle size retrievals based on simplified assumptions will yield the true values. In addition, size retrievals based on different measurement techniques will be affected by different systematic errors because of the different sensitivities to certain parts of the particle population.
In addition to the interpretation of solar-occultation and multicolor lidar measurements, the results presented here are also of relevance for stratospheric aerosol extinction profile retrievals from single-wavelength lidar measurements and from satellite limb-scatter measurements. In both cases assumptions regarding the aerosol particle size distribution have to made. For single-color lidar measurements, knowledge about the particle size distribution is required in order to determine the lidar ratio and subsequently convert lidar backscatter measurements to aerosol extinction coefficients (e.g., Khaykin et al., 2017). For limb-scatter measurements, the particle size distribution is required to translate the measured limb-scatter signal to the aerosol extinction (e.g., von Savigny et al., 2015; Chen et al., 2018).
Stratospheric-aerosol particle size retrievals from satellite limb-scatter measurements may be affected by issues similar to those of the occultation and lidar retrievals described here. Limb-scatter measurements were not discussed here in detail, because these particle size retrievals require correct treatment of the much more complicated radiative transfer (considering surface reflection and multiple scattering). Simplified tests using Eq. (3) as a forward model for scattering angles different from π showed that results for the quantities analyzed here (median radius, effective radius, number density, surface area density and volume density) roughly fall in the range between the results for occultation and lidar measurements (results not shown). The underlying assumption behind these simplified retrievals is that only singly scattered photons are considered. As mentioned above, additional investigations are required to quantify the effects discussed here for the limb-scatter geometry.
It is to be expected that the systematic differences in retrieved aerosol size parameters for lidar and occultation retrievals will increase after major volcanic eruptions (e.g., Pinatubo) because then the second particle mode at radii of several hundred nanometers will be enhanced (e.g., Deshler, 2008). For smaller eruptions there is evidence of a temporal decrease in aerosol effective radius (Larry Thomason, personal communication, 2020; Wrana et al., 2020), which may lead to smaller differences between aerosol size parameters retrieved from lidar and occultation measurements.
Despite the described limitations of aerosol particle size retrievals from different types of measurements, we strongly believe that particle size retrievals are still useful, as long as all underlying assumptions are clearly stated. Limitations of the retrievals should be transparently and explicitly discussed. Accurate in situ measurements of the particle size distribution of stratospheric aerosols with a high size-resolving capability in the sub-100 nm size range are urgently needed (a) for a better general understanding of the nature of the particle size distribution and (b) to improve the capabilities to remotely sense stratospheric-aerosol size information and aerosol extinction using optical measurements.
We would like to point out again that we do not claim that the actual particle size distribution of stratospheric aerosols is a bimodal log-normal distribution. This study simply tests the effects of assuming a monomodal log-normal particle size distribution on the retrievals if the actual distribution is a bimodal log-normal distribution.
It is also important to note that the correct particle size parameters can in principle be retrieved from measurements in lidar backscatter or occultation observation geometry using the color ratio approach employed here (neglecting issues related to potential nonuniqueness of the solutions) if the assumption of a monomodal log-normal particle size distribution is correct and one of the size parameters, e.g., the width σ, is known. This is also illustrated in Figs. 3 and 6 for the median radii and aerosol number densities and in Figs. 7 and 8 for surface area and volume densities, respectively. The figures show that if the coarse-mode fraction becomes very small, the retrieved values will approach the true values. In addition, it should be pointed out that the nonuniqueness of the solution is a potential problem with aerosol size information retrievals based on color ratios, which has to be kept in mind when interpreting retrievals.
The results presented here are also of importance for model simulations of stratospheric aerosols – some of which model aerosol growth processes more or less explicitly (e.g., Kokkola et al., 2009) – because stratospheric-aerosol particle size information retrieved from solar-occultation measurements is used in several studies for comparison with the model results (e.g., Hommel, 2008).
A fundamental intrinsic difficulty in retrieving particle size information of stratospheric-sulfate aerosols from remote sensing measurements in the optical spectral range was investigated. Size retrievals are usually based on a monomodal log-normal particle size distribution, while the actual size distribution may be different, e.g., a bimodal log-normal distribution. In this study we investigated how aerosol size retrievals – assuming a monomodal particle size distribution – are affected if the actual distribution is bimodal. Simulations were carried out for satellite occultation measurements and lidar backscatter measurements. Due to the different sensitivities of the different observation techniques to different parts of the particle population, the size retrievals from simulated occultation and lidar measurements behave quite differently. The occultation retrievals yield substantially larger median radii than the lidar retrievals, by up to a factor or 3 for the assumed scenarios, while the retrieved aerosol number densities are systematically lower for occultation retrievals, by up to almost 2 orders of magnitude, compared to the lidar retrievals. These findings may be a reason for the relatively large stratospheric-aerosol particle size estimates usually retrieved from solar-occultation measurements. Based on realistic assumptions on the bimodal log-normal size distribution, we are able to reproduce differences between published lidar and occultation retrievals both in a qualitative and quantitative sense. The presented results challenge our current knowledge of the size distribution of stratospheric aerosols, which is mainly based on optical measurements. Stratospheric-aerosol size retrievals from occultation measurements are, however, still valuable in our opinion because they do contain information on aerosol size. Future studies should attempt exploiting simultaneous and co-located measurements of the same air volume with different measurement techniques in order to provide more pieces of information on the particle size distribution of stratospheric aerosols.
The data shown are relatively easily reproduced using the IDL Mie code provided by the department of Physics of the University of Oxford available at http://eodg.atm.ox.ac.uk/MIE/index.html (Mie scattering routines, 2018) and the descriptions in the paper. The data are also available upon request from csavigny@physik.uni-greifswald.de.
CvS outlined the project, implemented the method, and carried out the simulations and retrievals with assistance from CGH. All authors discussed, edited and proofread the paper.
The authors declare that they have no conflict of interest.
We also acknowledge support by the University of Greifswald and thank the Earth Observation Data Group at the University of Oxford for providing the IDL Mie routines used in this study.
This work was funded by the Deutsche Forschungsgemeinschaft (DFG; project LESAP, no. 312991878; project VolARC of the DFG research unit VolImpact FOR 2820, no. 398006378).
This paper was edited by Omar Torres and reviewed by two anonymous referees.
Bingen, C., Vanhellemont, F., and Fussen, D.: A new regularized inversion method for the retrieval of stratospheric aerosol size distributions applied to 16 years of SAGE II data (1984–2000): method, results and validation, Ann. Geophys., 21, 797–804, https://doi.org/10.5194/angeo-21-797-2003, 2003. a, b, c, d, e
Bingen, C., Fussen, D., and Vanhellemont, F.: A global climatology of stratospheric aerosol size distribution parameters derived from SAGE II data over the period 1984–2000: 1. Methodology and climatological observations, J. Geophys. Res., 109, D06201, https://doi.org/10.1029/2003JD003518, 2004a. a, b
Bingen, C., Fussen, D., and Vanhellemont, F.: A global climatology of stratospheric aerosol size distribution parameters derived from SAGE II data over the period 1984–2000: 2. Reference data, J. Geophys. Res., 109, D06202, https://doi.org/10.1029/2003JD003511, 2004b. a, b
Bourassa, A. E., Degenstein, D. A., and Llewellyn, E. J.: Retrieval of stratospheric aerosol size information from OSIRIS limb scattered sunlight spectra, Atmos. Chem. Phys., 8, 6375–6380, https://doi.org/10.5194/acp-8-6375-2008, 2008. a, b, c
Chen, Z., Bhartia, P. K., Loughman, R., Colarco, P., and DeLand, M.: Improvement of stratospheric aerosol extinction retrieval from OMPS/LP using a new aerosol model, Atmos. Meas. Tech., 11, 6495–6509, https://doi.org/10.5194/amt-11-6495-2018, 2018. a, b
Curtius, J., Weigel, R., Vössing, H.-J., Wernli, H., Werner, A., Volk, C.-M., Konopka, P., Krebsbach, M., Schiller, C., Roiger, A., Schlager, H., Dreiling, V., and Borrmann, S.: Observations of meteoric material and implications for aerosol nucleation in the winter Arctic lower stratosphere derived from in situ particle measurements, Atmos. Chem. Phys., 5, 3053–3069, https://doi.org/10.5194/acp-5-3053-2005, 2005. a
Deshler, T.: A review of global stratospheric aerosol: Measurement, importance, life cycle, and local stratospheric aerosol, Atmos. Res., 90, 223–232, https://doi.org/10.1016/j.atmosres.2008.03.016, 2008. a, b, c, d, e, f, g, h
Deshler, T., Hervig, M. E., Hofmann, D. J., Rosen, J. M., and Liley, J. B.: Thirty years of in situ stratospheric aerosol size distribution measurements from Laramie, Wyoming (41∘N), using balloon-borne instruments, J. Geophys. Res., 108, 4167, https://doi.org/10.1029/2002JD002514, 2003. a, b, c, d, e, f
Grainger, R. G.: Some Useful Formulae for Aerosol Size Distributions and Optical Properties, available at: http://eodg.atm.ox.ac.uk/user/grainger/research/aerosols.pdf (last access: 9 April 2020), 2017. a, b
Gumbel, J., Stegman, J., Murtagh, D. P., and Witt, G.: Scattering phase functions and particle sizes in noctilucent clouds, Geophys. Res. Lett., 28, 1415–1418, 2001. a
Hommel, R.: Die Variabilität von stratosphärischem Hintergrund-Aerosol. Eine Untersuchung mit dem globalen sektionalen Aerosolmodell MAECHAM5-SAM2, PhD thesis, Universität Hamburg, 2008. a
Khaykin, S. M., Godin-Beekmann, S., Keckhut, P., Hauchecorne, A., Jumelet, J., Vernier, J.-P., Bourassa, A., Degenstein, D. A., Rieger, L. A., Bingen, C., Vanhellemont, F., Robert, C., DeLand, M., and Bhartia, P. K.: Variability and evolution of the midlatitude stratospheric aerosol budget from 22 years of ground-based lidar and satellite observations, Atmos. Chem. Phys., 17, 1829–1845, https://doi.org/10.5194/acp-17-1829-2017, 2017. a
Kokkola, H., Hommel, R., Kazil, J., Niemeier, U., Partanen, A.-I., Feichter, J., and Timmreck, C.: Aerosol microphysics modules in the framework of the ECHAM5 climate model – intercomparison under stratospheric conditions, Geosci. Model Dev., 2, 97–112, https://doi.org/10.5194/gmd-2-97-2009, 2009. a
Langenbach, A., Baumgarten, G., Fiedler, J., Lübken, F.-J., von Savigny, C., and Zalach, J.: Year-round stratospheric aerosol backscatter ratios calculated from lidar measurements above northern Norway, Atmos. Meas. Tech., 12, 4065–4076, https://doi.org/10.5194/amt-12-4065-2019, 2019. a, b
Malinina, E., Rozanov, A., Rozanov, V., Liebing, P., Bovensmann, H., and Burrows, J. P.: Aerosol particle size distribution in the stratosphere retrieved from SCIAMACHY limb measurements, Atmos. Meas. Tech., 11, 2085–2100, https://doi.org/10.5194/amt-11-2085-2018, 2018. a, b, c, d
Malinina, E., Rozanov, A., Rieger, L., Bourassa, A., Bovensmann, H., Burrows, J. P., and Degenstein, D.: Stratospheric aerosol characteristics from space-borne observations: extinction coefficient and Ångström exponent, Atmos. Meas. Tech., 12, 3485–3502, https://doi.org/10.5194/amt-12-3485-2019, 2019. a
Mauldin, L. E., Zaun, N. H., McCormick, M. P., Guy, J. H., and Vaughn, W. R.: Stratospheric Aerosol and Gas Experiment II Instrument: A Functional Description, Opt. Eng., 24, 307–312, https://doi.org/10.1117/12.7973473, 1985. a
McLinden, C. A., McConnell, J. C., McElroy, C. T., and Griffioen, E.: Observations of stratospheric aerosol using CPFM polarized limb radiances, J. Atmos. Sci., 56, 233–240, 1999. a, b, c
Mie scattering routines: University of Oxford, Departement of Physics, available at: http://eodg.atm.ox.ac.uk/MIE/index.html, last access: 9 April 2020. a
Murphy, D. M., Thomson, D. S., and Mahoney, M. J.: In situ measurements of organics, meteoritic material, mercury, and other elements in aerosols at 5 to 19 kilometers, Science, 282, 1664–1669, 1998. a
Renard, J.-B., Brogniez, C., Berthet, G., Bourgeois, Q., Gaubicher, B., Chartier, M., Balois, J.-Y., Verwaerde, C., Auriol, F., Francois, P., Daugeron, D., and Engrand, C.: Vertical distribution of the different types of aerosols in the stratosphere: Detection of solid particles and analysis of their spatial variability, J. Geophys. Res., 113, D21303, https://doi.org/10.1029/2008JD010150, 2008. a, b
Rieger, L. A., Bourassa, A. E., and Degenstein, D. A.: Stratospheric aerosol particle size information in Odin-OSIRIS limb scatter spectra, Atmos. Meas. Tech., 7, 507–522, https://doi.org/10.5194/amt-7-507-2014, 2014. a, b
Robock, A.: Important research questions on volcanic eruptions and climate, Past Global Changes Magazine, 23, 68, 2015. a
Ugolnikov, O. S. and Maslov, I. A.: Investigations of the Background Stratospheric Aerosol Using Multicolor Wide-Angle Measurements of the Twilight Glow Background, Cosmic Research, 56, 85–93, https://doi.org/10.1134/S0010952518020119, 2018 (Original Russian Text, 2018, published in: Kosmicheskie Issledovaniya, 56, 95–102, 2018). a, b
von Savigny, C., Ernst, F., Rozanov, A., Hommel, R., Eichmann, K.-U., Rozanov, V., Burrows, J. P., and Thomason, L. W.: Improved stratospheric aerosol extinction profiles from SCIAMACHY: validation and sample results, Atmos. Meas. Tech., 8, 5223–5235, https://doi.org/10.5194/amt-8-5223-2015, 2015. a
Wrana, F.: Charakterisierung der Größenverteilung stratosphärischer Aerosole mittels multispektraler satellitengestützter Extinktionsmessungen, MSc thesis, Institute of Physics, University of Greifswald, 2019. a, b
Wrana, F., von Savigny, C., and Zalach, J.: Retrieval of stratospheric aerosol size distribution parameters using SAGE-III/ISS extinction measurements at three wavelengths, in preparation, Atmos. Meas. Techn. Discuss., 2020. a, b, c
Wurl, D., Grainger, R. G., McDonald, A. J., and Deshler, T.: Optimal estimation retrieval of aerosol microphysical properties from SAGE II satellite observations in the volcanically unperturbed lower stratosphere, Atmos. Chem. Phys., 10, 4295–4317, https://doi.org/10.5194/acp-10-4295-2010, 2010. a
Yue, G. K. and Deepak A.: Retrieval of stratospheric aerosol size distribution from atmospheric extinction of solar radiation at two wavelengths, Appl. Optics, 22, 1639–1645, 1983. a
Zalach, J., von Savigny, C., Langenbach, A., Baumgarten, G., Lübken, F.-J., and Bourassa, A.: Challenges in retrieving stratospheric aerosol extinction and particle size from ground-based RMR-LIDAR observations, Atmos. Meas. Tech. Discuss., https://doi.org/10.5194/amt-2019-267, 2019. a, b, c, d, e