the Creative Commons Attribution 4.0 License.
the Creative Commons Attribution 4.0 License.
 | 22 Apr 2020
High-humidity tandem differential mobility analyzer for accurate determination of aerosol hygroscopic growth, microstructure, and activity coefficients over a wide range of relative humidity
Eugene F. Mikhailov
Sergey S. Vlasenko
Interactions with water are crucial for the properties, transformation, and climate effects of atmospheric aerosols. Here we present the high-humidity tandem differential hygroscopicity analyzer (HHTDMA) and a new method to measure the hygroscopic growth of aerosol particles with in situ restructuring to minimize the influence of particle shape. With this approach, growth factors can be measured with an uncertainty of 0.3 %–0.9 % over a relative humidity (RH) range of 2 %–99.6 % and with an RH measurement accuracy better than 0.4 %.
The HHTDMA instrument can be used in hydration, dehydration, and restructuring modes of operation. The restructuring mode allows us to investigate the effects of drying conditions on the initial microstructure of aerosol particles and specifies the optimal parameters that provide their rearrangements into compact structures with a nearly spherical shape. These optimal parameters were used in hygroscopic growth experiments by combining the restructuring mode with a conventional hydration or dehydration mode. The tandem of two modes allowed us to measure the particle growth factors with high precision as well as to determine the thickness of the water adsorption layer on the surface of compact crystalline particles.
To verify the HHTDMA instrument we compared the measured ammonium sulfate growth factors with those obtained from the E-AIM-based Köhler model (E-AIM: Extended Aerosol Inorganics Model). Averaged over the range of 38 %–96 % RH, the mean relative deviations between measurements and model results is less than 0.5 %.
We demonstrate this precision by presenting data for glucose, for which bulk thermodynamic coefficients are available. The HHTDMA-derived activity coefficients of water and glucose were obtained for both dilute and supersaturated solutions and are in good agreement with those reported in the literature. The average deviation between the measured activity coefficients and those obtained by the bulk method is less than 4 %. For dilute solution in water with an activity range of 0.98–0.99, the hygroscopicity parameter of glucose and the molal osmotic coefficient were obtained with an uncertainty of 0.4 % and 2.5 %, respectively.
- Article
(4407 KB) -
Supplement
(271 KB) - BibTeX
- EndNote


The hygroscopic properties of atmospheric aerosol particles are vital for a proper description of their direct and indirect effect on the radiative budget of the Earth's atmosphere (Hänel, 1976; Rader and McMurry, 1986; Pöschl, 2005; McFiggans et al., 2006; Andreae and Rosenfeld, 2008; Swietlicki et al., 2008; Cheng et al., 2008; Zieger et al., 2013; Rastak et al., 2014, and references therein). The response of aerosol particles to changes in relative humidity (RH) can be obtained by determining the growth factor of aerosol particles under enhanced RH conditions. The latter is possible by means of a hygroscopicity tandem differential mobility analyzer (HTDMA). The principles of TDMA experiments were described 4 decades ago (Liu et al., 1978; Rader and McMurry, 1986), and a wide range of applications and modifications of this technique have been reported since then (e.g., Brechtel and Kreidenweis, 2000; Weingartner et al., 2002; Mikhailov et al., 2004; Biskos et al., 2006; Johnson et al., 2008; Nilsson et al., 2009; Duplissy et al., 2009; Lopez-Yglesias et al., 2014). Due to technical limitations, most of the traditional HTDMA studies have been conducted at RHs <95 %. At higher humidity the HTDMA setup becomes less reliable due to small variations in temperature in the second differential mobility analyzer (DMA2), resulting in large uncertainty in RH (Swietlicki et al., 2008; Duplissy et al., 2009; Massling et al., 2011; Lopez-Yglesias et al., 2014). Controlling RH accurately inside the second DMA is also challenging. At RH=95 % the most accurate chilled-mirror point hygrometer at typical accuracy with a dew point temperature of ∼0.1 ∘C leads to an uncertainty in RH of ∼0.6 %. Uncertainties in HTDMA-derived growth factors can also arise from size bin width in the DMA transfer function and from the offset in dry particle sizing between two DMAs (Swietlicki et al., 2008; Massling et al., 2011; Suda and Petters, 2013). The irregular structure of the initial dry particles, leading to discrepancy between the mobility equivalent and mass equivalent particle diameters, is an additional source of growth factor uncertainty (Mikhailov et al., 2004; Kreidenweis et al., 2005). The role of these sources of uncertainties increases significantly at RH>90 %.
The desire to expand the upper RH bound in HTDMA experiments is mainly to bridge the gap between subsaturation and supersaturation conditions to provide data on aerosol–water interaction through the full range of relevant atmospheric saturation ratios (Kreidenweis et al., 2005). Of particular interest is the nonideal behavior of aerosol aqueous solutions at RH approaching 100 % as well as water activity-dependent hygroscopicity (Petters et al., 2009; Wex et al., 2009; Mikhailov et al., 2013) and size-dependent partitioning effects between particle surface and volume (Ruehl et al., 2010). Understanding these phenomena and their quantification in nearly saturated air is relevant to aerosol–radiation and aerosol–cloud interactions (Pöschl, 2005; Andreae and Rosenfeld, 2008; Pajunoja et al., 2015).
Two high-humidity tandem differential mobility analyzers (HHTDMAs) with an increased upper limit in RH are described in the literature. The setup described by Hennig et al. (2005) allows for growth factor measurement up to 98 % RH. In their setup, the second DMA was submerged in a temperature-controlled water bath. As a result, the temperature gradient inside the column was smaller than ±0.1 ∘C. However, the resulting growth factor error at high humidity is significant since the RH was obtained using a dew point sensor. Thus, at RH=97.7 % the precision quoted by the authors in absolute units is ±1.2 %, and the particle growth factor uncertainty is 16.6 % (±0.46 at a growth factor value of 2.79). For 100 nm dry ammonium sulfate aerosol, these uncertainties result in ±121 % relative error in the retrieved hygroscopicity parameter (Suda and Petters, 2013).
The second HHTDMA setup was described by Suda and Petters (2013). This instrument allows for growth factor measurement up to 99 % RH. In their setup, the first DMA was neither insulated nor temperature-controlled. The second DMA was thermally insulated. The temperature gradient in DMA2 was estimated from column exterior temperatures and did not exceed ±0.02 ∘C.
At RH>90 % they used calibration scans with ammonium sulfate to convert measured growth factors into RH using the Extended Aerosol Inorganics Model (E-AIM) (Clegg et al., 1998; Wexler and Clegg, 2002). In this case, the precision in RH is ∼1 % at RH near 90 % and ∼0.1 % at RH of about 99 %. The resulting growth factor uncertainty associated with RH and instrumental errors is ∼2 %, which is propagated in hygroscopicity and activity coefficients of ±20 %.
In addition to the HTDMA methods, other techniques have been used to determine the aerosol hygroscopicity at high RH (Tang et al., 2019). Two of these methods are the Leipzig Aerosol Cloud Interaction Simulator (LACIS; Stratmann et al., 2004) and the inverted streamwise-gradient cloud condensation nuclei counter (Ruehl et al., 2010), which could be operated at RH over the range of 85.8 %–99.1 % and 99.4 %–99.9 %, respectively. Both methods have accurate humidity control, but the optical detectors used to determine the wet particle size distribution are subjected to limitations in accuracy resolution due to uncertainties in the refractive index and the conversion from optical to physical diameter. This leads to uncertainty in the measured growth factors of ∼4 % (Wex et al., 2005).
Mikhailov et al. (2011) developed a filter-based differential hygroscopicity analyzer (FDHA), which was employed as an offline method to investigate the hygroscopic properties of ambient aerosol particles (Mikhailov et al., 2013, 2015). An updated version of the instrument allows for measuring hygroscopic growth up to 99.6 % with an accuracy of ±0.1 % RH. The uncertainty in the determination of the mass growth factors was estimated to be ∼1 % at 30 % RH and ∼10 % at 99 % RH. The FDHA measures water mass absorbed by aerosol particles deposited on the filters. Due to mass conservation, this method is not influenced by the effects of capillary condensation and restructuring of porous and irregularly shaped particles that usually limit the applicability and precision of mobility-diameter-based HTDMA and CCNC (cloud condensation nuclei counter) experiments. Since the FDHA uses a katharometer-based technique, it takes an average of 2 d to measure one aerosol sample, which is a drawback of this instrument.
Here we introduce a new HHTDMA instrument designed to overcome the problems listed above such that the precision in growth factors in the 2 %–99.6 % RH range improved to ∼0.7 %, providing uncertainty in hygroscopicity and activity coefficients of less than 4 %. We demonstrate these uncertainties for glucose aerosol particles above and below water saturation.
Operating the HHTDMA at RHs above 99 % requires special operating procedures as well as temperature and humidity control systems. In this section, we describe the design of the various subsystems.
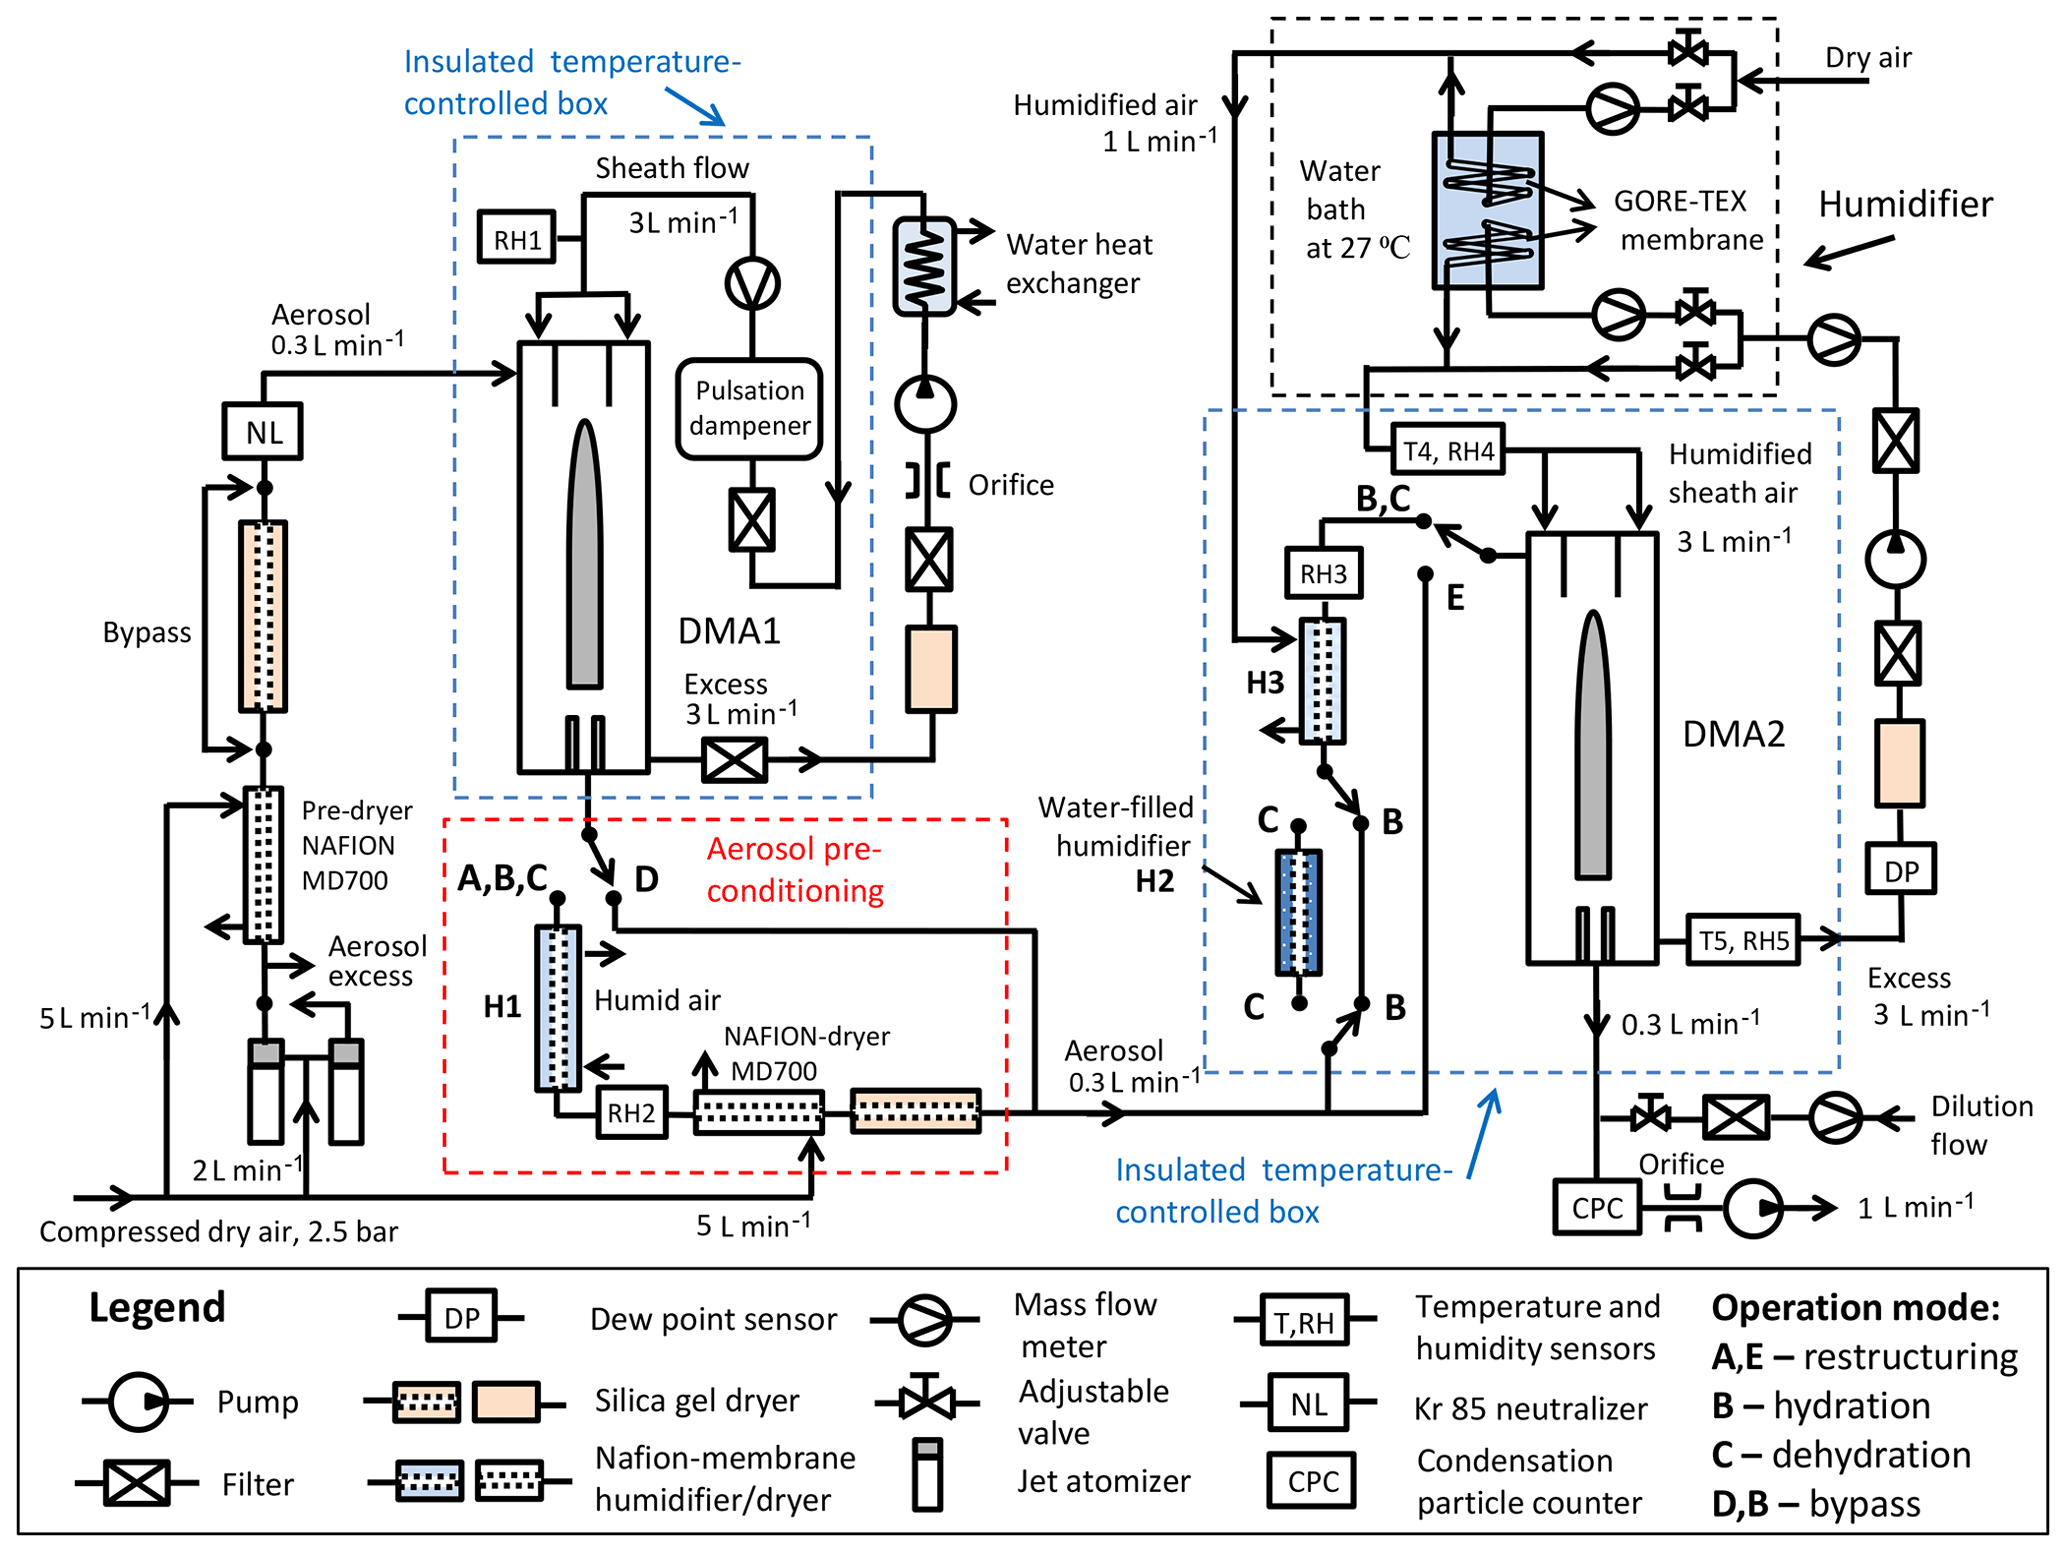
Figure 1Schematic design of the HHTDMA setup. RH–RH5: relative humidity sensors (Almemo, FHAD 46C41A); T4, T5: needle sensors (Pt100, 1/3, 300×1.5 mm, DOSTMANN electronic); DP: dew point sensor (Dew Master, Edgetech Instruments, remote D-probe SC); DMA1, DMA2: differential mobility analyzer (TSI 3081), mass flowmeter (TSI 4040), NAFION humidifier (Perma Pure; MD-110/P), jet atomizer (3076, TSI); CPC: condensation particle counter (3772, TSI).
2.1 HHTDMA setup and operation modes
Figure 1 shows a sketch of the HHTDMA setup. Similar to a conventional HTDMA system (Swietlicki et al., 2008; Duplissy et al., 2009), our setup consists of two DMAs (TSI 3081 type) connected in series with a humidity-conditioning section between them. Both DMAs are housed in aluminum boxes and thermally insulated with 20 mm polyethylene foam (Fig. S1.1 in the Supplement). The temperature inside each aluminum box is actively controlled using a circulation thermostat (Lab Companion, CW-05G) and two aluminum liquid heat exchangers (HRA120DR) with integrated fans. The DMA1 and DMA2 are operated at 26 and 25 ∘C, respectively. Two Pt100 needle sensors (uncertainty ±0.015 ∘C) are placed in the sheath and excess airlines in DMA2 (T4, T5; Fig. 1). The temperature difference between the sheath and excess flow is small enough, i.e., within the Pt100 sensor uncertainty. The DM1 and DMA2 are operated with a closed-loop sheath air setup. The sheath and aerosol flow rates in both DMAs were 3.0 and 0.3 L min−1, respectively.
The particle size distributions measured with the scanning mobility particle sizer (DMA2, SMPS TSI 3080, CPC TSI 3772, TSI AIM version 9.0.0.0; 11 November 2010) were fitted with a lognormal distribution function (Origin 9 software), and the modal diameter (Db) of the fit function was used for further data analysis.
In our setup, the RHs of the sheath and aerosol flow are separately adjusted. It is therefore possible to use three different modes of operation (Mikhailov et al., 2004, 2009).
-
The “hydration and dehydration” (H&D) mode (Mikhailov et al., 2004), or the restructuring mode (Gysel et al., 2004) (Fig. 1, red rectangle), provides information about structural changes as a function of the relative humidity experienced during a cycle of humidification and drying (variable X=RH2; RH3, RH4, and RH5<3 %). Here and below X represents the independent variable, i.e., the RH value taken for plotting and further analysis. The minimum mobility diameter observed in H&D mode (DH&D,min) was used to approximate the actual mass equivalent diameter of dry particles (Dm,s), which is a prerequisite for accurate Köhler model calculations.
-
The “hydration” HHTDMA mode provides information about deliquescence phase transitions of dry particles and the hygroscopic growth of deliquesced particles as a function of relative humidity (variable ; Fig. 1).
-
The “dehydration” HTDMA mode provides information about the efflorescence transition of deliquesced particles and the hysteresis loop between deliquescence and efflorescence transitions as a function of relative humidity upon particle sizing after conditioning and deliquescence at high RH. The water-filled pre-humidifier is set to a high RH (>96 %) (variable ; Fig. 1).
The mobility equivalent particle growth factor, gb, was calculated as the ratio of the mobility equivalent diameter, Db, measured after conditioning (hydration, dehydration) to the minimum mobility diameter observed in H&D mode: .
2.2 Aerosol generation
Aerosols are generated by nebulizing ammonium sulfate (99.9 % pure, ChemCruz) or d-glucose (99.55 % pure, Fisher) aqueous solution at ∼0.01 % and ∼0.1 % mass concentration, respectively.
Two separate atomizers operated with particle-free pressurized air (2.5 bar, 2 L min−1) are used. In the regular aerosol drying mode, the generated solution droplets are first dried to a relative humidity of ∼3 % in the Nafion MD-700 (L=60 cm) and then in the silica gel diffusion dryer (SDD; L=100 cm i.d.=2 cm, RT=62.8 s). The MD-700 dryer operated at a purge airflow of 5 L min−1 with input RH below 0.3 %. The residual relative humidity at the exit of the SDD is <2 % RH and close to that for sheath flow in DMA1 (RH1; Fig. 1). The dry aerosol (0.3 L min−1) is passed through a radioactive neutralizer (Kr85) to establish charge equilibrium and a differential mobility analyzer (DMA1) to select monodisperse particles. The two-stage drying system (pre-dryer + SDD) provides the same humidity profile inside the SDD throughout the HHTDMA experiment, which minimizes the effect of the drying conditions on the particle morphology and on the particle sizing as a consequence (Mikhailov et al., 2004, 2009; Wang et al., 2010).
2.3 Aerosol conditioning
The Nafion conditioning tube with an inner diameter of 2.2 mm was used for aerosol humidification in all HHTDMA operation modes. The length of H1, H2, and H3 Nafion conditioners is equal to 60, 120, and 240 cm, respectively (Fig. 1). In the case of the H1 and the H3 exchangers, a 1 L min−1 humidified airflow passed through the outer tube to adjust the RH between 3 % and 97 %. The humidity of the aerosol flow (RH3) and sheath air (RH4) in DMA2 is controlled by mixing water-saturated and dry airflows in a ratio that produced the desired RH. Saturated air is obtained by passing dry air through a Gore-Tex membrane tube submerged inside a temperature-controlled water bath (27.0±0.1 ∘C). Two separate 6 mm (i.d.) Gore-Tex tubes, 0.5 and 2 m long, are used for aerosol and sheath flow conditioning, respectively (humidifier; Fig. 1). For the H1 Nafion exchanger the humid air is prepared by bubbling air directly through water and then mixing with dry air to the required humidity (not shown in Fig. 1). The outer shell of the H2 Nafion tube is filled with pure water and thus set an RH greater than 96 %. For the efflorescence HHTDMA mode the H1 and H2 Nafion tubes are used in series (Fig. 1). In the H&D HHTDMA mode, aerosol in series flowed through a Nafion conditioner (H1, RT=0.5 s), Nafion MD-700 dryer (L=60 cm, RT=27.2 s), and SDD (RT=16 s) in which the RH of the aerosol is reduced to below 2 % (Fig. 1, aerosol preconditioning section, red rectangle). The residence time (RT) between the aerosol preconditioning system and DMA2 depends on the humidification mode; its minimum value is 6.5 s, which corresponds to RT in the hydration operation mode (Fig. 1). This is sufficient time to achieve an equal size at given RH, provided that there are no kinetic limitations to water uptake (Chuang, 2003; Mikhailov et al., 2004).

2.4 RH control
Relative humidity at several points throughout the apparatus is controlled by capacitive sensors (RH1–RH5; Fig. 1), supplemented with temperature (±0.2 ∘C) and atmospheric pressure sensors (±2.5 mbar). In addition, the RH inside the DMA2 is determined by combining the sheath air temperature and dew point temperature measured in the excess airline (Fig. 1). The accuracy of the dew point temperature is ±0.1 ∘C, which in particular at 98 % RH leads to an uncertainty of ±0.6 % RH. All RH sensors and the dew point mirror are periodically calibrated using the LI-610 dew point generator (LI-COR, USA). At RH >90 %, due to instrumental limitations the RH measurement accuracy by capacitive RH probes and a dew point sensor drops noticeably. To circumvent this problem we used ammonium sulfate particles as a calibration standard. Based on the Extended Aerosol Inorganics Model (E-AIM, model II) (Clegg et al., 1998; Wexler and Clegg, 2002), we converted the measured growth factors into RH (gb,E-AIM) (Rose et al., 2008; Suda and Petters, 2013; Rovelli et al., 2016). The uncertainty of water activity calculations with the E-AIM for aqueous solutions of ammonium sulfate above deliquescence relative humidity (DRH) (Clegg and Wexler, 2007) is better than 10−4 and is negligible relative to the uncertainties of the growth factor measurement. Figure 2 shows the measurement uncertainty in RH by various methods. One can see that over a range of humidity levels the sensitivity of the methods is noticeably different. Therefore, to minimize uncertainty in the RH determination we used a dew point probe and capacitive sensors (RH4, RH5; Fig. 1) in the RH range of 5 %–80 % and the HHTDMA-derived ammonium sulfate growth factors at RH above 80 %. Note that at RH below 80 % the E-AIM parameters are based on the fit of electrodynamic balance (EDB) measurements, for which the accuracy in relative humidity is ∼1 % RH, and in the mass fraction of solute it is about ∼1 % (Chan et al., 1992; Clegg et al., 1995). For these uncertainties, the propagated growth factor error is ∼1.0 %, which exceeds instrumental growth factor error by a factor of ∼5 (see next section). Consequently, below the deliquescence transition the RH accuracy was calculated by accounting for EDB-based growth factor error (Fig. 2, upper black curve), whereas above the deliquescence transition RH accuracy was obtained using instrumental growth factor uncertainty (Fig. 2, lower black curve).
2.5 Growth factor uncertainty
The instrumental growth factor error depends on uncertainty in particle sizing, which is a result of variations in the flow rate, voltage, temperature, and atmospheric pressure. Uncontrolled change in these parameters causes a drift in dry mobility diameter and measured growth factor as a consequence. Regarding the precision of particle sizing by DMA1, the voltage variation from the specified value is less than (HCE 7 −12 500, FuG Electronik), and the relative standard deviation of the sheath flow is 0.06 %. Unlike DMA1, for which the critical orifice maintains a constant sheath flow, in the DMA2 the sheath flow is monitored by a microprocessor using temperature and pressure sensors built into the mass flowmeter. Our test measurements showed that within 10 h, which is the typical timescale of HHTDMA measurements, no trend in dry mobility diameter was observed (Fig. S1.2). Over the entire period the statistical error of the selected dry mobility diameter of 99.31 nm was 0.16 nm (2×σs), which is propagated in the instrumental relative growth factor error of ±0.002 (σs is the standard deviation of selected dry mobility diameter). Nevertheless, to minimize systematic error caused by the casual drift of the initial dry mobility diameter its size was measured at the beginning and at the end of every experiment.
We checked the effect of the width of the DMA2 transfer function on the uncertainty in particle sizing by measuring the variability of the selected dry particles with diameters of 100, 200, and 300 nm. For these diameters based on six repeated measurements the relative uncertainty 2σs∕D was 0.0016, 0.0022, and 0.0015, respectively, indicating that the effect of transfer function broadening on the particle growth factor is negligibly small. However, variation in RH within DMA2 significantly affects the measurement precision of particle diameters, especially at high humidity. The RH-dependent measurement uncertainty in Db,RH was fitted by the three-parameter exponential function (Fig. S1.3):
Here, σb,RH and Db,RH are the standard deviation and particle mobility equivalent diameter at a given RH. The fit parameters (α, β, and ε) obtained for ammonium sulfate and glucose aerosol particles are listed in the Supplement (S1). Finally, HHTDMA-derived growth factor uncertainty was calculated as follows:
where the terms in square brackets describe the instrumental uncertainty of gb, and the next term accounts for the contribution of the RH sensor uncertainty to the particle growth factor. Note that when using Eq. (2) the dgb∕dRH was substituted by the measured Δgb∕ΔRH.
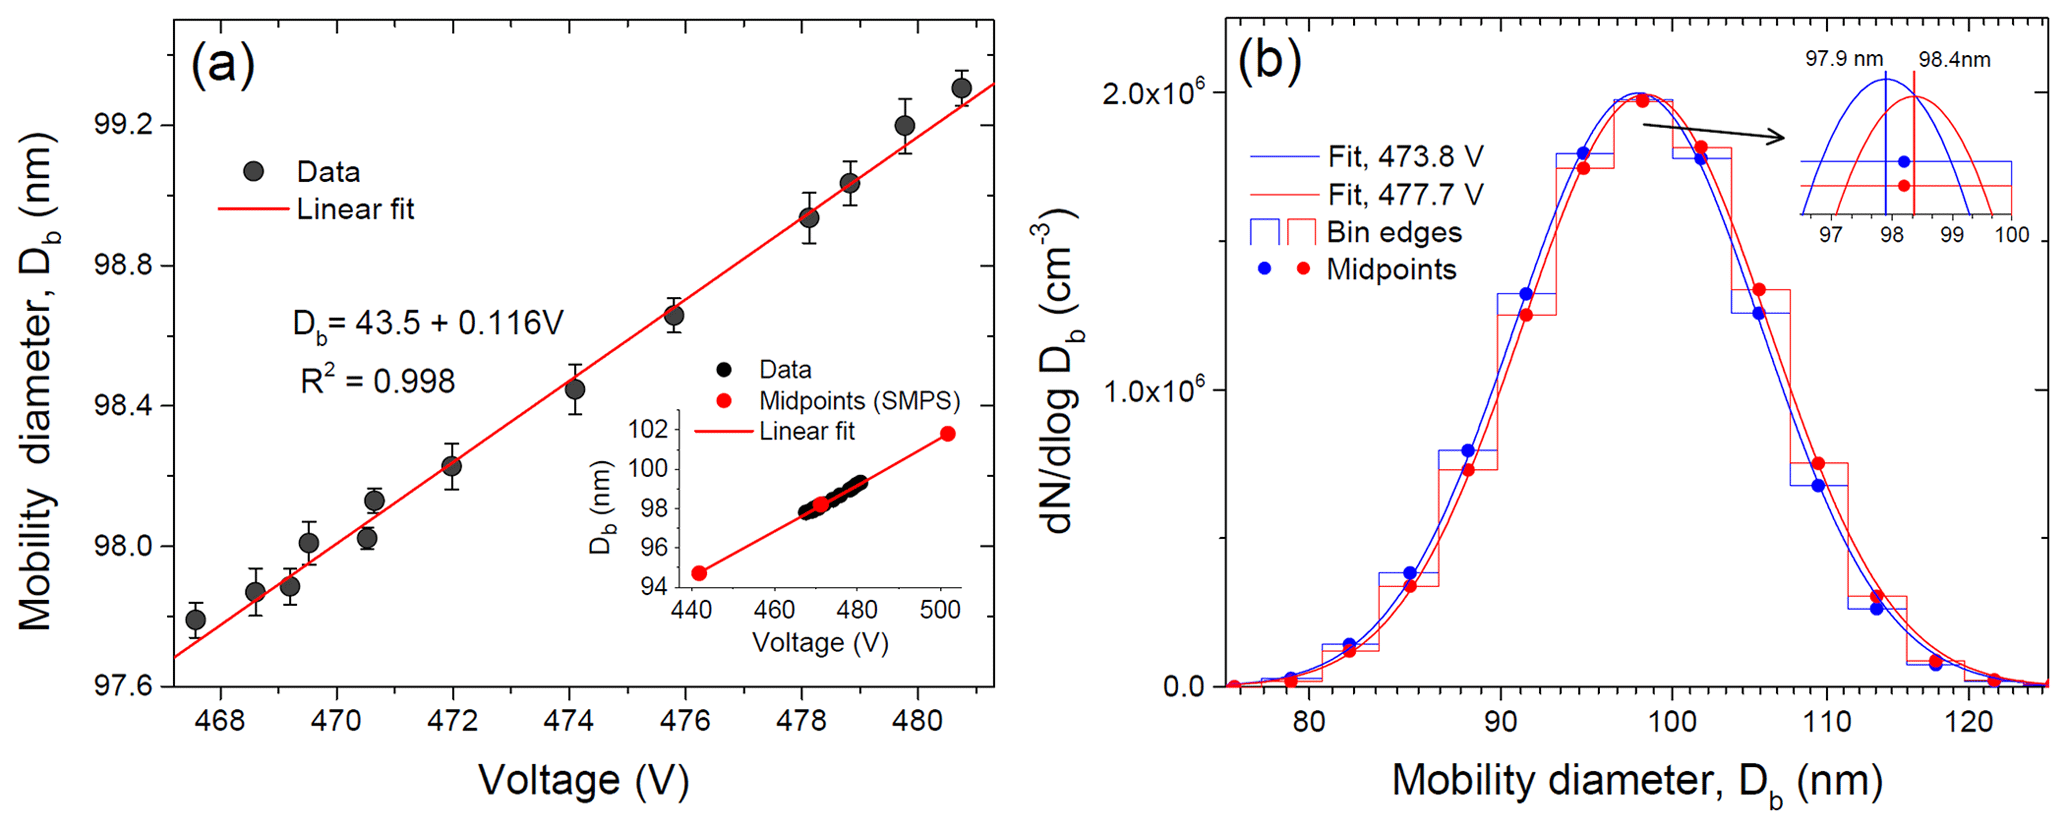
Figure 3Modal mobility equivalent diameters obtained by the lognormal fit of the SMPS size distribution (DMA2) as a function of the voltage applied to the DMA1 center rod (a) and histogram, together with the fit curve received for two selected voltages (b).
We also checked the sensitivity of the SMPS inversion algorithm and lognormal fit to the ammonium sulfate particle size variations exiting DMA1. Figure 3a shows the response of the SMPS classifier to a voltage (size) change in DMA1. It is seen that 1 V step causes a proportional displacement of the particle diameter by 0.12 nm (linear fit). The inset in Fig. 3a indicates that this resolution significantly exceeds the size of an individual bin (bin midpoints are shown). As an example Fig. 3b shows an SMPS histogram of the number particle distribution obtained for two DMA1-selected particles with Δ=3.9 V. It is seen that the voltage shift causes a change in particle concentration in each size bin, leading to a corresponding shift of the fitted size distribution and a change in modal particle diameter by 0.5 nm as a result (inset in Fig. 3b). Thus, the growth factor of nearly monodisperse particles can be determined with higher precision than the resolution of the size bins in the SMPS-derived histogram.
To eliminate the uncertainty in growth factors arising from the sizing offset between two DMAs (Massling et al., 2011), in our instrument the dry mobility diameter selected by DMA1 was measured by DMA2 on a par with the wet mobility diameter. However, additional uncertainty is introduced due to the particle shape factor. As will be shown below, we managed to minimize this uncertainty using the restructuring mode.
Inorganic and organic aerosol particles as well as their mixtures restructure upon humidification below deliquescence (Mikhailov et al., 2004, 2009; Biskos et al., 2006; Gysel et al., 2004). Irregular envelope shape and porous structure can cause a discrepancy between the mobility equivalent and mass equivalent particle diameters. To account for restructuring we use the minimum mobility particle diameter, , obtained in H&D HHTDMA mode as an approximation of the mass equivalent diameter of the dry solute particle, Dm,s, i.e., . Based on H&D HHTDMA measurements the dynamic shape factor, χ, of the dry initial particles can be estimated as follows (DeCarlo et al., 2004):
where Db,i is the initial mobility equivalent diameter selected by DMA1 and measured by DMA2, and ) and C(Db,i) are the Cunningham slip correction factors for the respective diameters and Db,i (Willeke and Baron, 1993). χ can be split into a component β, which describes the shape of the particle envelope, and a component δ, which is related to the particle porosity and allows for the calculation of the void fraction inside the particle envelope f (Brockmann and Rader, 1990).
4.1 Full Köhler model
In this study, we used the full Köhler model (Brechtel and Kreidenweis, 2000; Rose et al., 2008; Mikhailov et al., 2009) as a basis for HHTDMA calibration and for comparison to the measured growth factor RH dependences:
where aw is the water activity, σ is the surface tension of the solution droplet, is the partial molar volume of water in solution, R is the ideal gas constant, T is the droplet temperature, and Dm is the mass equivalent droplet diameter.
The partial molar volume of water in the droplet solution can be expressed by (Brechtel and Kreidenweis, 2000)
where Mw is the molecular weight of water, ρ is the density of the solution, and Xs is the mass fraction of solute in the droplet.
The ratio of the aqueous droplet diameter, Dm, to the mass equivalent diameter of a particle consisting of the dry solute, Dm,s, is defined as the mass equivalent growth factor, gm:
The concentration dependence of ρ for ammonium sulfate aqueous solution can be taken from elsewhere (Tang and Munkelwitz, 1994). The density for glucose solution was obtained by the second-order polynomial fit of the experimental data reported by Cerdeiriña et al. (1997) (Xs<0.5) and Taylor and Rowlinson (1955) (Xs<0.8):
where the standard deviation of the fit is 0.0021 g cm−3. The surface tension of the aqueous solution can be obtained using a simple linear approximation:
where σw=72.0 mN m−1 is the surface tension of pure water at 25 ∘C, and σconc accounts for the influence of the droplet composition and units of concentration. For ammonium sulfate mN kg mol−1 (molality-based) (Hänel, 1976) and for glucose solution mN L mol−1 (molarity-based) (Aumann and Hildemann, 2010). Solute molality, μs (mol kg−1), solute molarity, Cs (mol L−1), the molecular weight of a solid, Ms (g mol−1), solution density, ρ (g cm−3), the mole fraction of a solute, xs, the mole fraction of water, xw (), and the mass fraction of a solute, Xs, are related by
In the full Köhler model calculations aw of the ammonium sulfate particles were taken from the Extended Aerosol Inorganics Model (E-AIM; model II) (Clegg et al., 1998; Wexler and Clegg, 2002), and the corresponding molality μs was obtained. Alternatively, the water activity of the glucose solution droplets was obtained from relation
where the water activity coefficient, γw, is calculated from the two-suffix Margules equation (Taylor and Rowlinson, 1955):
with (±0.062). Note that there are also other theoretical equations such as the three-suffix Margules equation (DeCindio and Correra, 1995; Miyawaki et al., 1997), but the difference in the γw calculated values between Eq. (16) and more complicated expressions is negligibly small within ∼0.01 %. Equations (6)–(16) can be used to model the hygroscopic growth of aerosol particles, i.e., to calculate gm and Dm, respectively, as a function of Dm,s and RH.
4.2 Growth factor and hygroscopicity parameterization
As proposed by Kreidenweis et al. (2005), hygroscopic growth data points can be approximated with a polynomial three-parameter fit function of the following form.
Using Eq. (6) we convert the measured RH-based growth curves (gb vs. RH) into water activity growth curves (gb vs. aw) assuming that , and and σ are equal to the partial molar volume and surface tension of pure water, respectively. For pure glucose aerosol particles, the relative errors introduced by this simplifying assumption in the calculation of aw from Eq. (6) were less than 0.1 %.
According to Petters and Kreidenweis (2007), the hygroscopic properties of aerosol particles can be approximately described by a single hygroscopicity parameter, κ.
Under the assumption of volume additivity, Eq. (18) can be rewritten as
As a result, the hygroscopicity κ can be determined from each HHTDMA-measured data pair of gm vs. aw under the assumption gb=gm. For an ideal solution, Raoult κ, κR, can be calculated using known constants (Rose et al., 2008; Mikhailov et al., 2009):
where υs is the stoichiometric dissociation number of the solute.
4.3 Molal osmotic coefficient
According to Robinson and Stokes (1970) the molal osmotic coefficient of solute in aqueous solution, Φs, can be obtained from the relation
For hydrophilic nonelectrolytes (υs=1) nonideality is caused by the hydration of solutes. As proposed by Rudakov and Sergievskii (2009) for such aqueous solutions the activity coefficient of water can be estimated according to the equation
where h0 is the hydration number of the solute at xw=1. From Eqs. (15) and (22) it follows that
4.4 HHTDMA-derived activity coefficients
In a binary system at constant temperature and pressure, the activity coefficient of water, γw, and the activity coefficient of the solute, γs, are related by the Gibbs–Duhem equation:
xw can be obtained based on HHTDMA-derived aerosol particle growth factors. The first simple method is based on the volume additivity assumption when the volume of the solution droplet is given by the sum of the volumes of the dry solute and the pure water contained in the droplet (Mikhailov et al., 2009; Petters et al., 2009):
For many atmospheric aerosols, the concentration dependence of the aqueous solution density is not well defined. At the same time, for a number of model systems of interest, the aqueous solution density was measured in both unsaturated and supersaturated solutions. In this case xw can be obtained without the assumption of volume additivity by iteratively solving Eq. (8) with another equation, where ρ and the concentration are given explicitly. For example, Eq. (9) was used for glucose solution droplets. The mass fraction, Xs, calculated in this way for a given gm was then converted into xw using Eq. (13).
The activity coefficient, γs, of glucose in water solution was obtained by numerical integration of Eq. (24) using the EXPGro3 function (Origin 9 software) to fit and then integrate experimental dependence of xw∕xs vs. lnγw. The boundary conditions are based on an asymmetric reference system: at xs→0; γw→1, γs→1, i.e., at xs=0; ln γw=0 and lnγs=0. Integration yields
Using Eq. (15) the received γs can be easily converted into the solid activity, as. Thus, relying only on known solution density, the thermodynamic parameters xw, γw, and aw as well as xs, γs, as, and Φs can be obtained from the HHTDMA-measured gb(RH) dependence without the assumption of volume additivity. This is important for concentrated droplet solutions for which volume additivity does not always hold.
4.5 Surface adsorption
The amount of water adsorbed on the surface of crystalline aerosol particles prior to deliquescence can be described with surface coverage (Θ) (or the number of monolayers on the dry particle surface). Assuming that initial particles are compacted and spherical, the number of monolayers can be calculated from the ratio
where Dw is the diameter of the adsorbed water molecule (0.277 nm) (Yeşilbaş and Boily, 2016).
The FHH (Frenkel, Halsey, and Hill) model is frequently used to relate surface coverage to water activity:
where AFHH and BFHH are empirical fit parameters that describe the intermolecular interactions governing the adsorption potential. AFHH characterizes interactions between the surface and the first adsorbed water layer as well as interactions between adjacent molecules. BFHH describes the interactions between the surface and subsequent adsorbate layers. By inserting Eq. (28) into the Köhler model (Eq. 6), the parameters AFHH and BFHH can be estimated (Romakkaniemi et al., 2001; Sorjamaa and Laaksonen, 2007; Hatch et al., 2019).
5.1 Aerosol particle restructuring
The hydration and dehydration (H&D) HHTDMA operation mode was first used to study the effect of drying conditions on aerosol particle restructuring. Specifically, in the aerosol-generation section (Fig. 1) we alternatively used Nafion MD-700 dryers of various lengths, providing a residence time of the aerosol flow in the range of 27–62 s, solely the silica gel diffusion dryer (SDD) with RT=62 s, and a coupled drying system comprising the Nafion MD-700 dryers and SDDs. The dried aerosol particles selected by DMA1 entered the preconditioning section (Fig. 1, red rectangle), where during a cycle of humidification (H1, RT=0.5 s) and drying (Nafion MD 700, RT=27 s; SDD, RT=16 s) they underwent microstructural transformation, as previously described in Mikhailov et al. (2004, 2009).
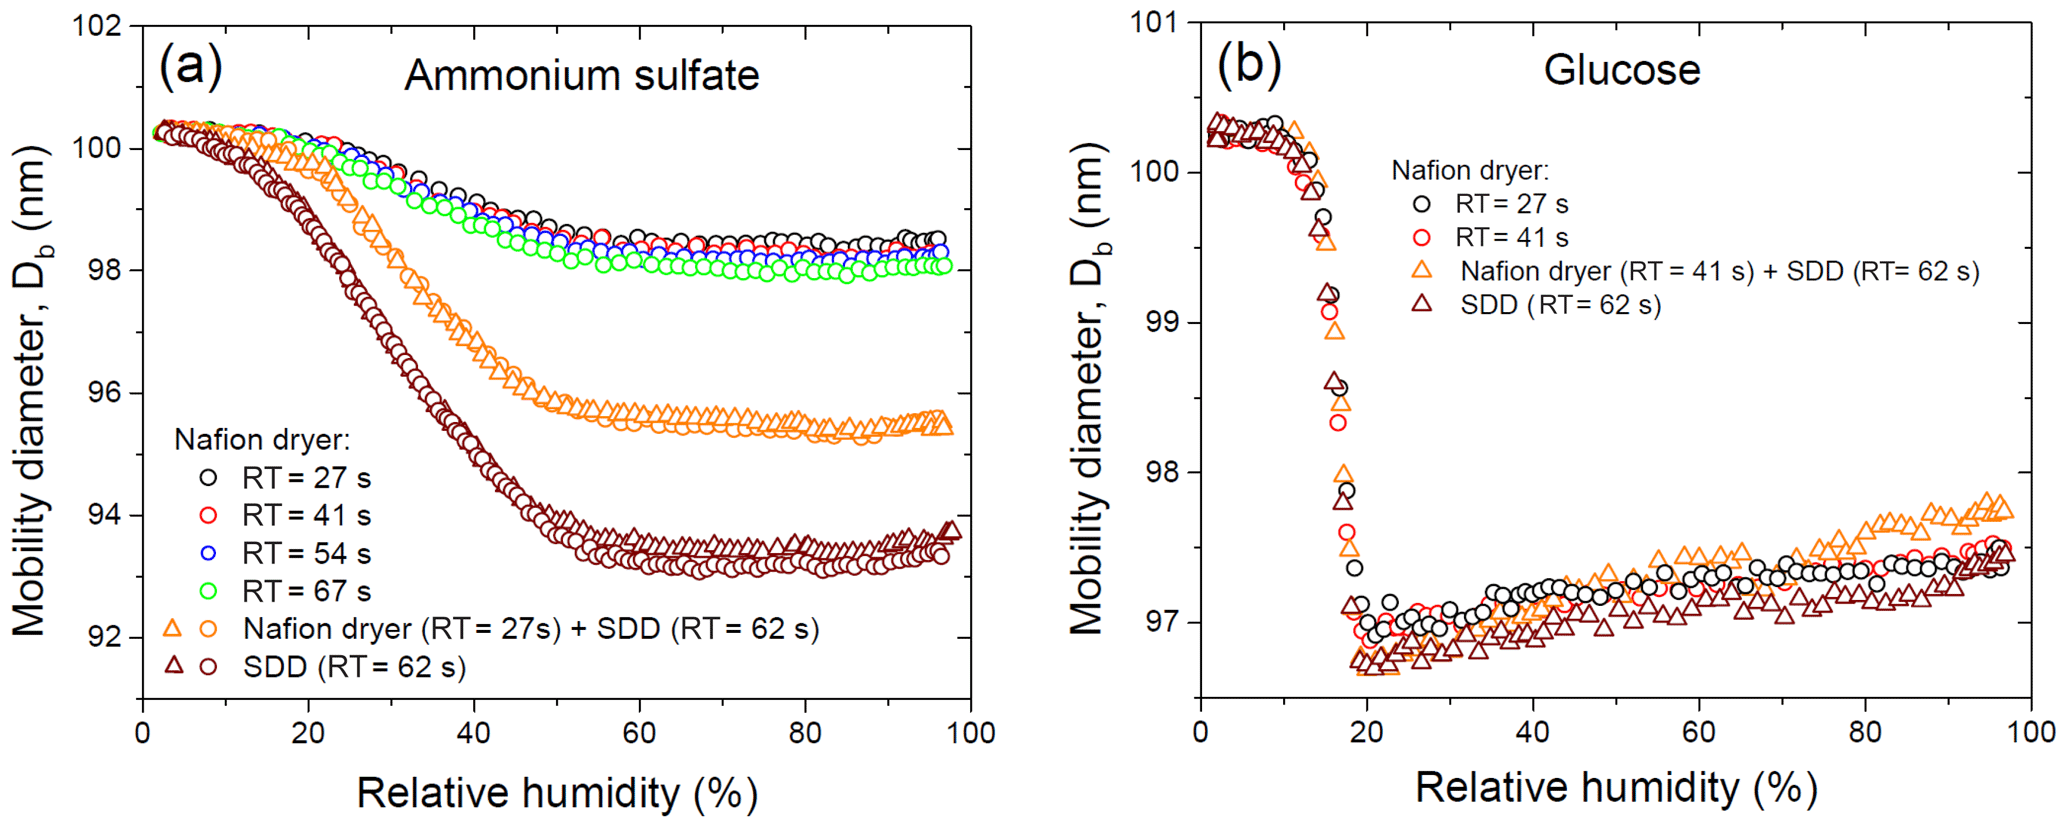
Figure 4Mobility equivalent diameters of ammonium sulfate (a) and glucose (b) with the initial dry mobility equivalent diameter, nm observed upon hydration and dehydration (H&D mode, RH2) depending on drying conditions. Different symbols are different experimental runs (a).
5.1.1 Ammonium sulfate particle
Figure 4a shows the change in the initial dry mobility diameter of 100.3 nm ammonium sulfate aerosol particles obtained at different drying conditions. In the range of 2 %–60 % RH the mobility diameter gradually decreases, and when RH is more than 70 % RH it becomes almost constant with observed at 80 %–90 % RH. The values obtained for all drying modes are shown in Table 1.
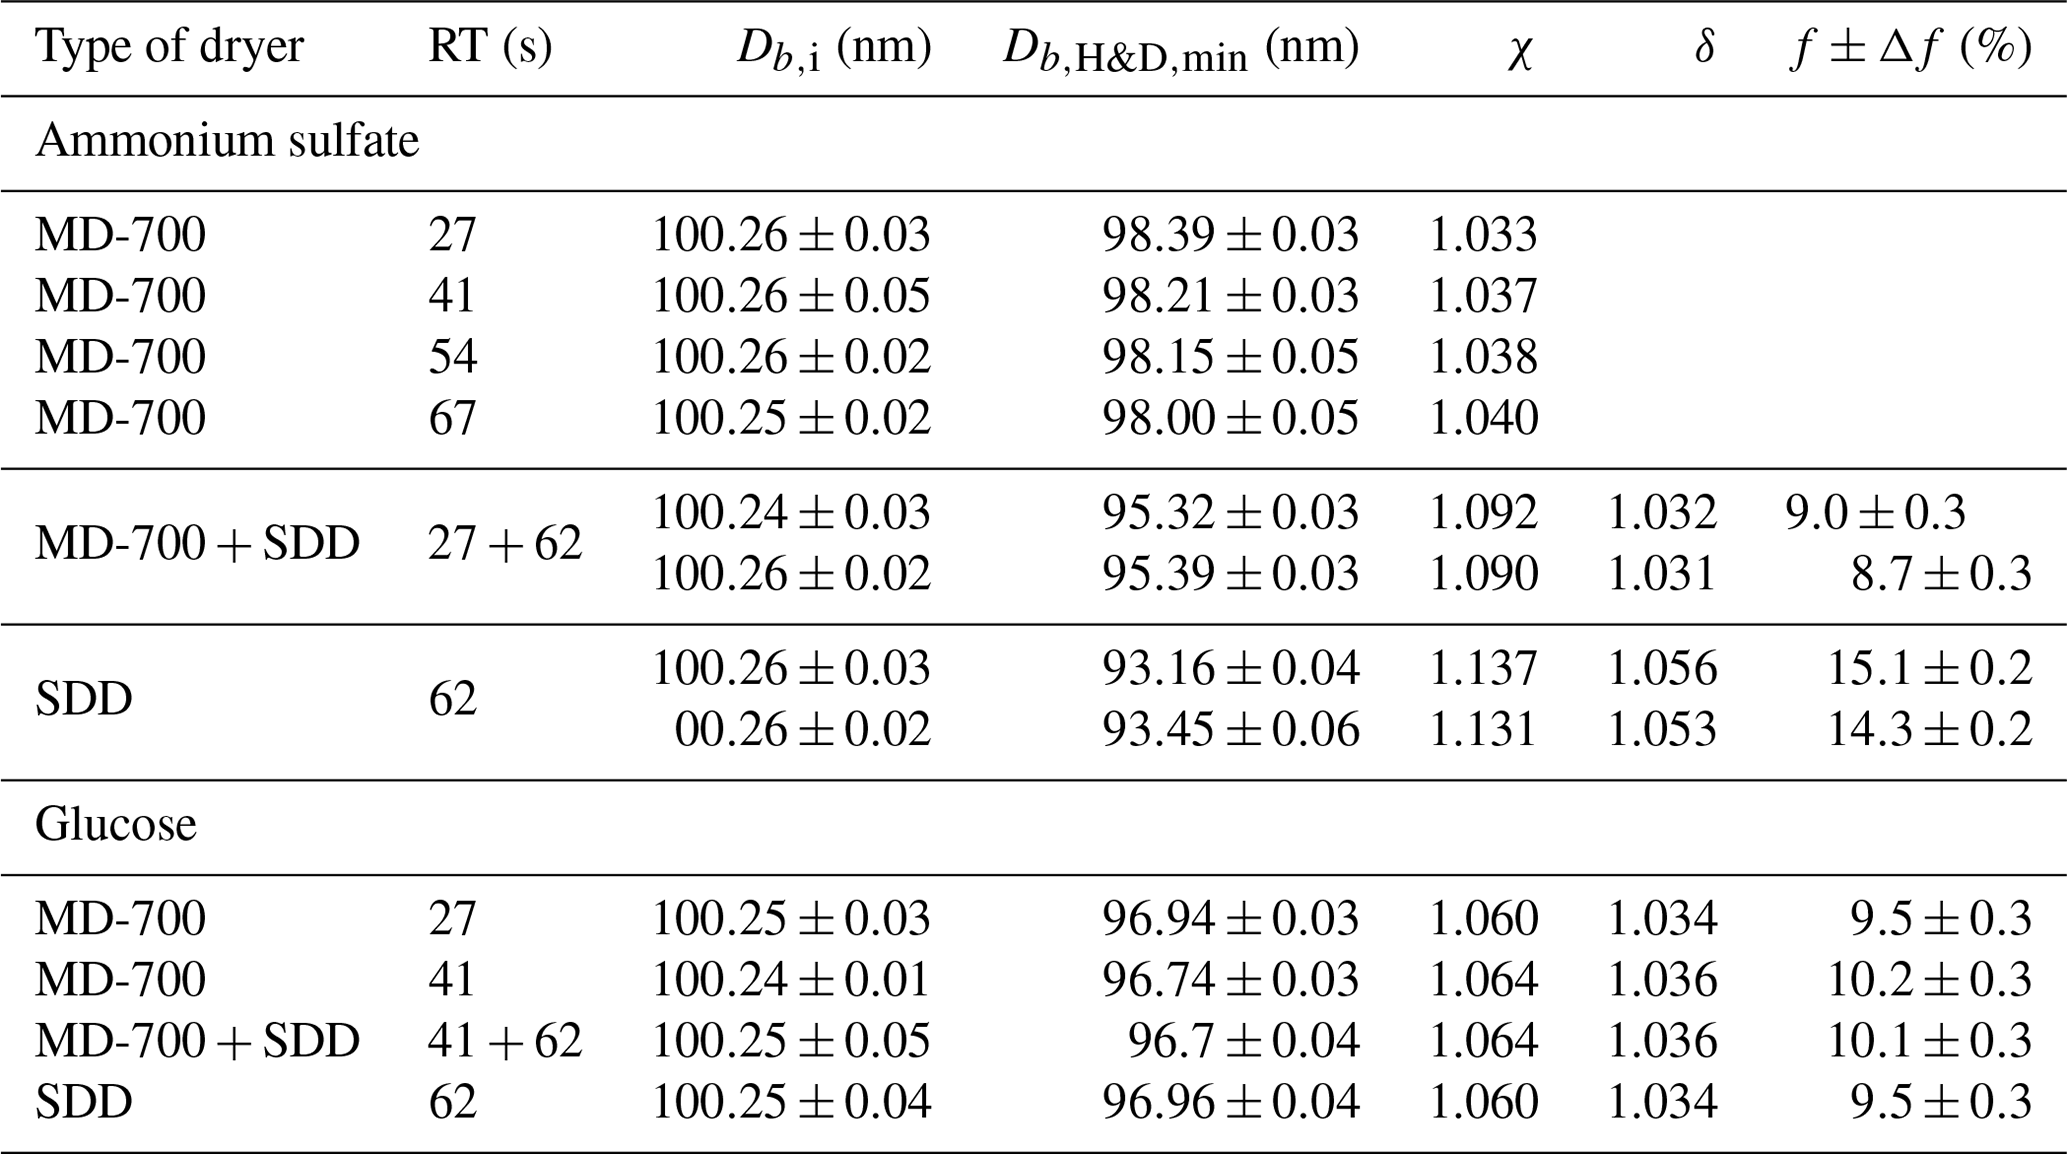
Table 1Microstructural rearrangement parameters for pure ammonium sulfate and glucose aerosol particles obtained in the H&D experiment for different drying conditions (Fig. 4a, b). Db,i and are the mean plus or minus the standard deviation of 7–10 data points. The dynamic shape factor, χ, porosity, δ, and void fraction, f, together with propagated error, Δf, are calculated from Eqs. (3), (4), and (5) respectively. RT is the residence time. The χ and δ propagated uncertainty is better than ±0.002.
Interestingly, when using only the MD-700 dryer the variation in the RT from 27 to 67 s leads to a decrease in the by only 0.4 nm (i.e., at RT=27 s, nm; at RT=67 s, nm). A sharp decrease in minimum mobility diameter by ∼3 nm ( nm) occurs when an SDD (RT=62 s) is added to the MD-700 membrane dryer (RT=27 s); that is, already effloresced aerosol particles (RH∼3 % at the outlet of the MD-700 dryer) underwent further microstructural changes inside the SDD. The maximum reduction (by ∼7 nm) of the initial DMA1 selected particles is observed when only SDD is used as a desiccant, for which and 93.5 nm (first and second run with the same SDD; Fig. 4a).
Multiple Köhler model calculations based on obtained in all drying modes used are in excellent agreement with the observed hygroscopic growth curves. These findings confirm the compactness and spherical shape of dry particles, despite the fact that the absolute values of are different and strongly depend on the drying conditions (Fig. 4a).
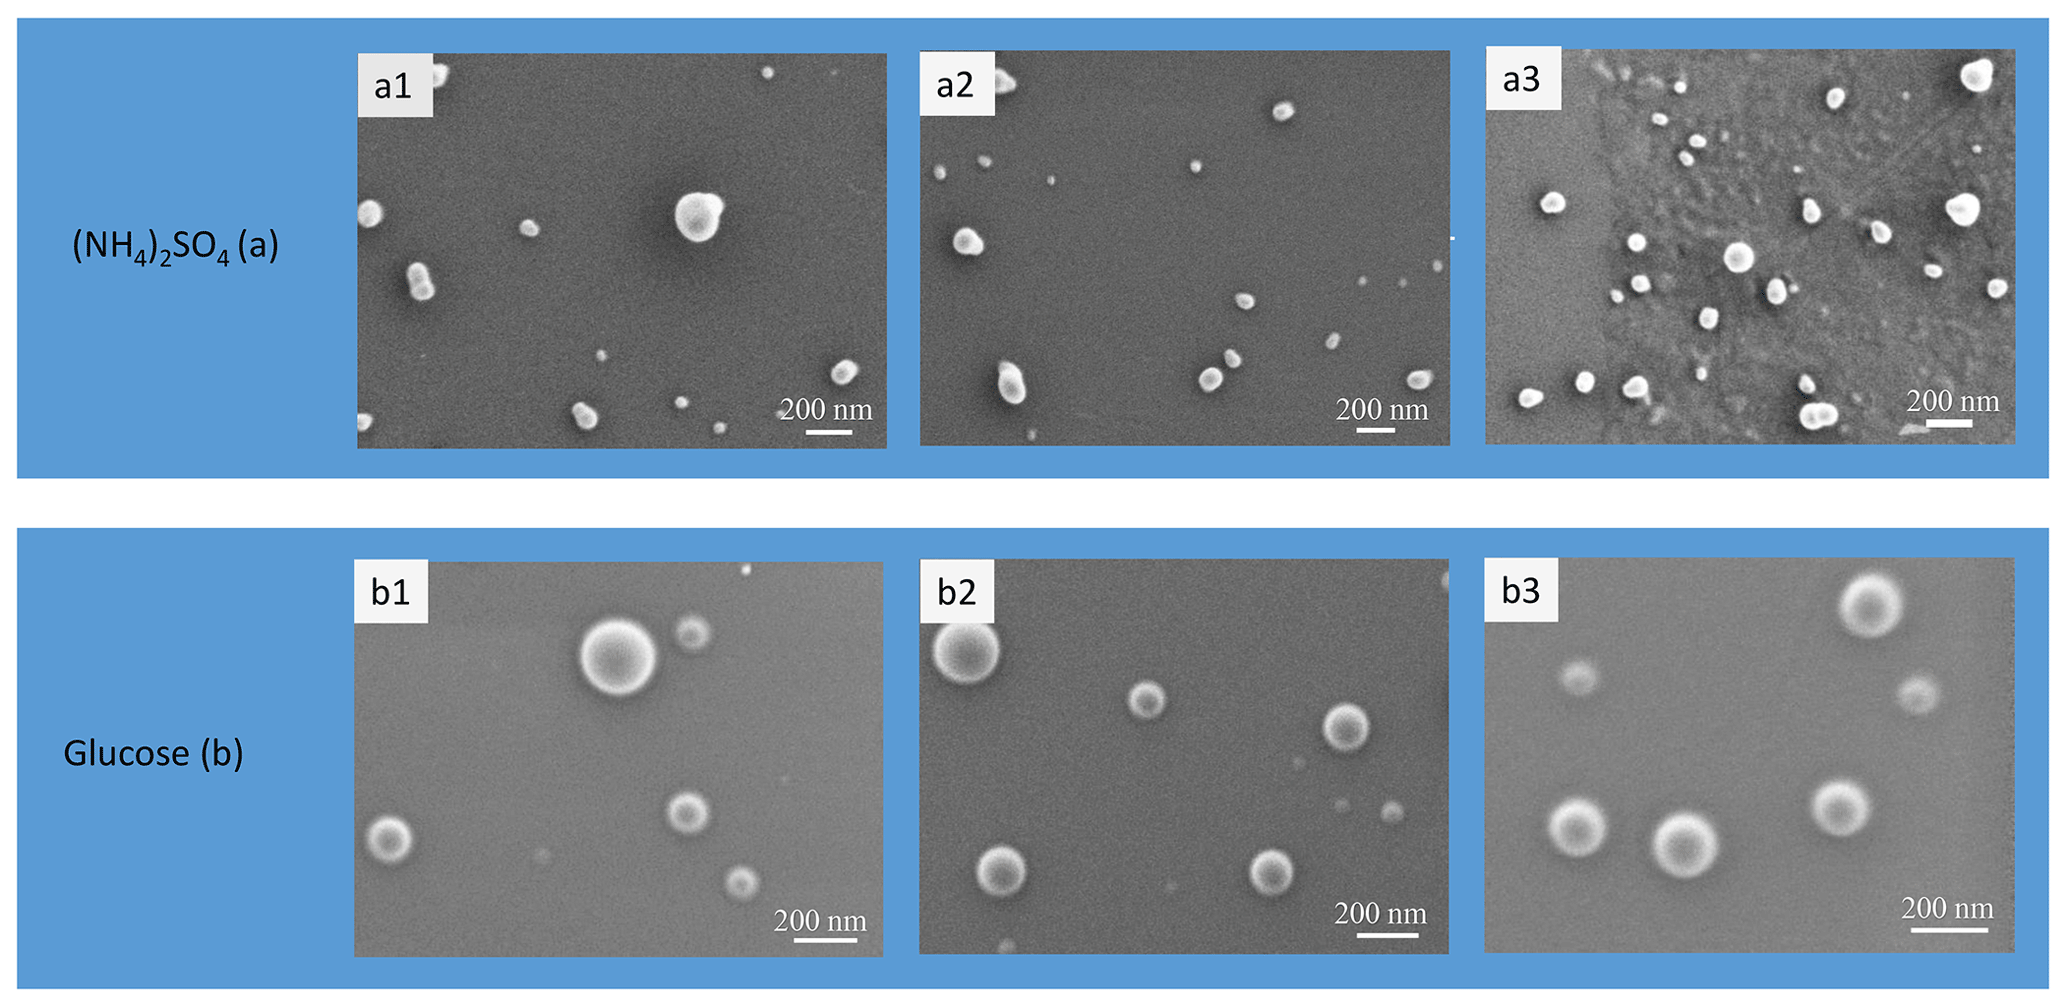
Figure 5SEM images of initial ammonium sulfate (a) and glucose (b) aerosol particles. The samples were investigated with a high-resolution SEM (Zeiss Merlin). Operation conditions: 0.4 kV accelerating voltage, 1.5 kV ESB grid voltage, 1.8 mm working distance. Particle samples were collected directly onto 3 mm TEM copper 300 mesh grids coated with a 30–60 nm thick formvar film.

Figure 6Possible structures of polycrystalline ammonium sulfate and amorphous glucose aerosol particles depending on drying conditions: (I) agglomerate of single crystals with fully and partly shielded cavities filled with liquid; (II, III) polycrystalline agglomerates with open and shielded cavities having a different void-to-solid ratio; (IV) amorphous glucose aerosol particle in a gel-like state. Other explanations are given in the text.
The different values of observed upon H&D mode are a result of the different microstructure of the initial dry particles having the same Db,i (Table 1). As previously noted the dry particle morphology depends on drying rate (Zelenyuk et al., 2006; Zhao et al., 2008; Mikhailov et al., 2009; Wang et al., 2010), since the solidification of aerosol droplets is mainly governed by kinetic rather than thermodynamic factors. Experiments with the MD-700 membrane dryer show that at the same drying rate, the residence time has little effect on ammonium sulfate particle morphology; i.e., with an increase in the RT from 27 to 67 s, the dynamic shape factor grows slightly from 1.033 to 1.040 (Table 1). The values obtained in this experiment are close to those reported by Kuwata and Kondo (2009), who used the combination of a DMA and an APM (aerosol particle mass analyzer) system. They estimated that χ of (NH4)2SO4 for 50–150 nm is 1.01–1.04. Zelenyuk et al. (2006), using DMA and single-particle laser ablation time-of-flight mass spectrometer (SPLAT) measurements, showed that χ is 1.03±0.01 at 160 nm. Biskos et al. (2006) estimated χ for 6–60 nm (NH4)2SO4 particles to be 1.02 based on the observed particle restructuring in the hydration HTDMA mode. Our χ values obtained with MD-700 membrane dryers and those preliminarily reported most likely reflect surface irregularities as observed by SEM (scanning electron microscope) (Fig. 5a) and TEM (transmission electronic microscope) (Dick et al., 1998; Zelenyuk et al., 2006). At the same time, an experiment with serially connected dryers (MD-700 + SDD) indicates that after the first dryer effloresced particles still contain liquid. The liquid could be located in cavities with various degrees of shielding (Cohen et al., 1987; Weis and Ewing, 1999; Colberg et al., 2004). Figure 6 outlines possible structures of aerosol particles and their microstructural rearrangements during the H&D experiment. Based on the experimental results considered above, we can assume that in membrane dryers (MD-700) the effloresced particles release surface water and water that is stored in relatively open cavities, providing an irregular aerosol particle envelope (Fig. 5a) (see also Dick et al., 1998, and Fig. 7). However, some of the liquid remains in either completely closed or partially shielded cavities. The latter can be pores, veins, and grain boundaries that retain water due to the inverse Kelvin effect on concave surfaces (Fig. 6, pattern I), thereby impeding exchange between the gas phase and the cavities. The fresh SDD added to the membrane dryer overcame the diffusion barrier created by capillary forces, most likely due to the drying rate in the SDD being much faster than that in the membrane dryer. As a result, some of partially shielded cavities released excess water. Note that this process is accompanied by further microstructural rearrangement, leading to the formation of porous aerosol particles (Fig. 6, pattern II) with smaller than that observed after the membrane dryer (∼95.3 nm vs. ∼98.4 nm; Table 1). Accordingly, the aerosol particle shape factor, χ, increases from ∼1.03 to ∼1.09 (Table 1). Finally, more porous particles are formed when solely a fresh SDD is used as a desiccant ( nm, χ=1.13; Table 1). As pointed out before (Mikhailov et al., 2009; Wang et al., 2010) excess charge and rate of drying are important for the microstructure of aerosol particles generated by the nebulization of aqueous solution. Most likely in the case of fresh SDD, the most porous and/or irregular particles (Fig. 6, pattern III) form due to strong kinetic limitations arising during sufficiently rapid drying inside the SDD. More pronounced multiple nucleation events could occur by increasing the number of polycrystals and accordingly the number and scale of cavities. As a result, at the same Db,i the observed of redried particles (H&D mode) is strongly dependent on the drying conditions (Fig. 6; Table 1, last column).
Assuming that the χ value obtained in the experiment with the membrane dryer accounts for the aerosol particle envelope, i.e., (Fig. 5a), and using Eqs. (4) and (5) we estimated the particle porosity, δ, and void fraction, f, respectively. The calculated values of the particle void fraction for the coupled (MD 700 + SDD) drying system and for the single SDD are ∼9 % and ∼14 %, respectively (Table 1). Obviously, this difference reflects the effect of drying conditions on particle morphology as discussed above. Since in the two-stage drying system, the microstructural rearrangement of particles inside the SDD occurs due to the remaining water, the obtained f≈9 % can be attributed to the volume fraction of water stored in pores and veins after first drying stage (Fig. 6, pattern I). In the mole fraction basis the water content in dry solid aerosols can be obtained from
According to Eq. (29) the H2O:(NH4)2SO4 molar ratio (nw∕ns) in the dry particles after the membrane dryer is ∼0.4 (0.41 and 0.39 for the first and second run). In case of one-stage aerosol drying when only the SDD is used, the volume fraction of ∼14 % corresponds to an H2O:(NH4)2SO4 molar ratio of ∼0.7 (0.69 and 0.73 for the first and second run). This value can be considered an upper limit of the water content, since it is assumed that all cavities are filled with water. The H2O:(NH4)2SO4 molar ratio range of 0.4–0.7 obtained in this study at RH<3 % is close to that reported by Weis and Ewing (1999) for submicron NaCl aerosol particles with a median diameter of 350 nm. In their FTIR spectroscopic flow tube experiment for RH of 15 %–5 %, the obtained H2O:NaCl molar ratio in the silica-gel-dried particles varies between 0.5 and 0.7. They suggest that during the crystallization process water is present in open and shielded pockets.
5.1.2 Glucose particles
Figure 4b shows the mobility equivalent diameter observed upon the H&D mode of glucose aerosol particles. Unlike ammonium sulfate (Fig. 4a), the minimum mobility diameter of the glucose aerosol particles is already observed at ∼20 % RH. Moreover, was practically independent of drying conditions. Accordingly, the shape factor calculated from Eq. (3) is also constant (χ=1.06; Table 1). SEM images (Fig. 5b) indicate that ∼100 nm glucose particles are perfect spheres; therefore, one can assume that β=1. From Eqs. (4) and (5) it follows that δ∼1.03 and f∼10 % (Table 1). The fact that particle restructuring does not depend on the residence time and type of dryer indicates a lower energy barrier to water transport from the cavities to ambient air compared to the ammonium sulfate particles. As will be shown below, glucose aerosol particles like other monosaccharides tend toward reversible water uptake starting at very low RH, which is typical for particles with an amorphous structure (Fig. 6, pattern IV) (Mikhailov et al., 2009; Koop et al., 2011). The absorbed water acts as a plasticizer, which softens the microstructural rearrangements inside swelling particles (Fig. 6). Moreover, at low RH water uptake is facilitated by the presence of alcohol functional groups within sugars that form hydrogen bonds with water. These effects can explain why, in contrast to ammonium sulfate, restructuring of the glucose aerosol particles starts at low humidity and is practically completed at ∼20 % RH. A slight increase in Db,H&D observed at RH above 20 % RH (Fig. 4b) is probably due to the high hygroscopicity of glucose and low diffusivity of water molecules through a (semi)solid matrix of the compacted particles (Fig. 6) (Shiraiwa et al., 2013). However, the fact that in the case of glucose aerosol particles the drying conditions do not have a significant effect on is not entirely clear. Further work is needed to clarify this effect.
One of the most important structural metrics of a porous material is the connectivity of the pore space, or the so-called pore network. This has bearing on the diffusive tortuosity and permeability of water. Most of the pores are connected to each other and to the surface via small throats (open pores), whereas some pores are shielded from the connected structure. According to estimates, the fractions of voids in the aerosol particles of ammonium sulfate and glucose obtained under the same drying conditions are comparable (Table 1). However, pore networks can be different. It is therefore possible that in amorphous glucose the pore network has more open pores than in the case of polycrystalline ammonium sulfate particles, leading to a more efficient exchange of water between filled cavities and the gas phase under the same drying conditions.
5.2 Hygroscopic growth
To avoid the uncertainties associated with the aerosol particle morphology, we combined the H&D mode with one of the hygroscopic growth modes. That is, before aerosol particle humidification (hydration, dehydration) the dry aerosol particles selected by DMA1 first entered the preconditioning (PC) section (Fig. 1, red rectangle) where they underwent microstructural rearrangements, forming more compact and nearly spherical particles. In the PC section, relative humidity (RH2; Fig. 1) was maintained in the range of 80 %–90 % and ∼20 % for ammonium sulfate and glucose aerosol particles, respectively. These RH values correspond to obtained in the H&D mode (Fig. 4), which is a good approximation of the mass equivalent diameter of dry particles.
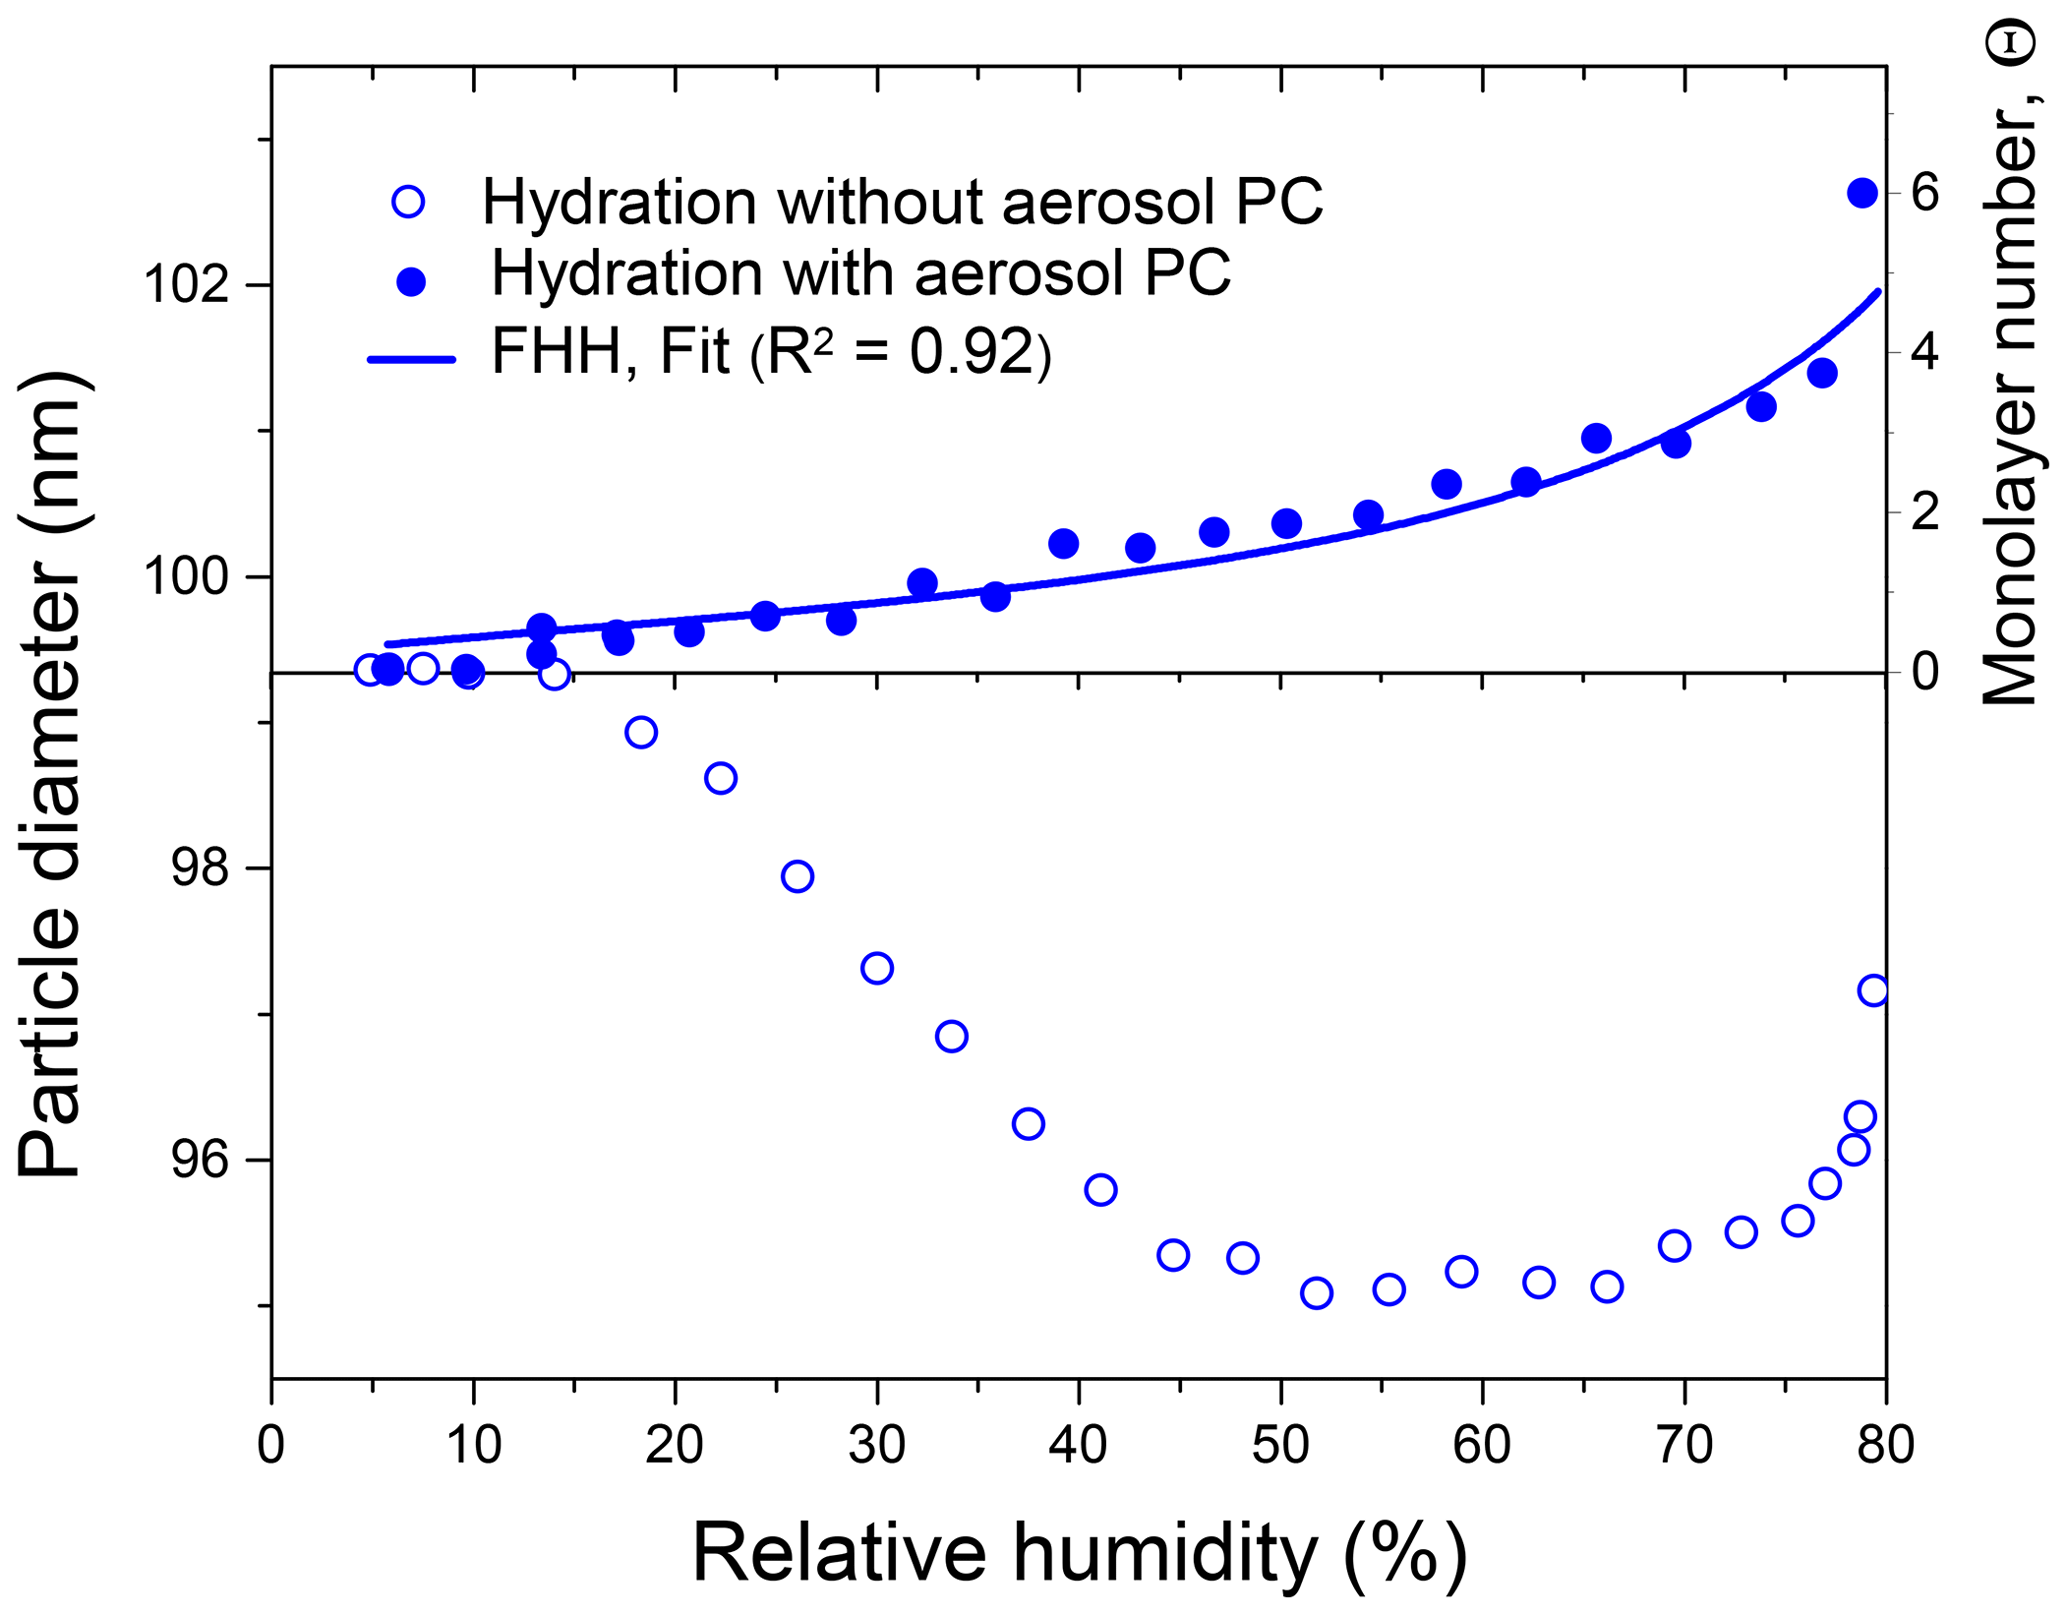
Figure 7Mobility equivalent diameters of ammonium sulfate particles observed in hydration experiments with and without preconditioning and an equivalent number of monomolecular layers. Θ was calculated from Eq. (27) assuming that nm, obtained with aerosol particle preconditioning. The line is the Köhler model fit (Eq. 6) with water activity from the FHH adsorption isotherm (Eq. 28).
5.2.1 Ammonium sulfate water uptake prior to deliquescence
Figure 7 shows the change in the initial mobility diameter of ammonium sulfate particles observed in hydration mode before deliquescence transition. It is seen that particles with and without preconditioning demonstrate different responses to changes in RH. The particles that bypass the preconditioning step due to irregular and/or porosity microstructure undergo a strong restructuring (Db,i decreased by 4.3 nm), while preconditioned particles (H&D mode) exhibit a small but continuous hygroscopic growth. Assuming that initial preconditioning particles are compact and spherical (i.e., ) and using Eq. (27) we have converted the difference between the mobility diameters observed in hydration mode into an equivalent number of monolayers. As illustrated in Fig. 7 we obtained nearly linear growth of Θ from ∼0 to 3.5 for the range of 5 %–75 % RH and a sharp increase up to Θ∼6 over the range of 75 %–79 % RH. The findings are consistent with our earlier HTDMA studies of water adsorption on ammonium sulfate particles (Mikhailov et al., 2009) and with the literature data considered therein. The obtained Θ (RH) dependence was fitted using Eq. (6) with water activity taken from FHH isotherm Eq. (28). Calculations were performed assuming that the σ and parameters are equal to those for pure water. The fit result is shown in Fig. 7 (solid line). The best-fit parameters are and . Romakkaniemi et al. (2001) also used HTDMA measurements with NaCl and (NH4)2SO4 particles between 8 and 15 nm to estimate Θ before deliquescence transition. For ammonium sulfate particles, the calculated parameters for the FHH isotherm are AFHH=0.68 and BFHH=0.93. The AFHH value obtained in our work is ∼40 % higher than that reported by Romakkaniemi et al. (2001). One possible explanation is that the surface coverage is lower on surfaces of nano-sized particles compared to flat surfaces (Müller at al., 1987). Another and perhaps more important reason is that Romakkaniemi et al. (2001) used the initial mobility diameter, Db,i, for Θ calculation without particle shape correction. Biskos et al. (2006) have shown that nano-sized ammonium sulfate particles in the range of 6–60 nm undergo a restructuring upon RH increasing. Thus, for 6–8 nm particles the minimum mobility diameter observed in the 30 %–60 % RH range is ∼2 % lower than the initial mobility diameter, which corresponds to uncertainty in Θ of about one monolayer of adsorbed water (see Eq. 27). This explains why the Romakkaniemi et al. (2001) values of Θ are lower than those obtained in this study.
The water uptake before particle deliquescence was detected in earlier studies (Weingartner et al., 2002; Gysel et al., 2002; Biskos et al., 2006), but it was observed mainly at RH>70 %. It is most likely that restructuring, which occurs upon particle hydration, masked water uptake at low RH. The experimental Db (RH) dependence obtained for non-preconditioning particles (Fig. 7, open circles) clearly demonstrates this effect. Alternatively, the hygroscopic growth data obtained for preconditioning particles with a compact structure (Fig. 7, closed circles) show that water adsorption on the surface of a solid particle already occurs at lower humidities ranging ∼15 % RH.

Figure 8Growth factors observed in the hydration and dehydration experiments for the preconditioned ammonium sulfate aerosol particles with nm compared with the full Köhler model: (a) growth factors as a function of relative humidity measured with a capacitive RH probe (RH4; Fig. 1); (b) RH values obtained from E-AIM using experimental growth factors. Insets in panel (a): the gray area denotes the growth factor uncertainty obtained from Eq. (2); the shaded area corresponds to the growth factor uncertainty of E-AIM below the DRH obtained from EDB experimental data. Whiskers show RH uncertainty (a, b).
5.2.2 Ammonium sulfate hydration and dehydration
Figure 8 shows the growth factors of the preconditioned ammonium sulfate particles with nm obtained upon the hydration and dehydration HHTDMA modes at 298 K. The observed efflorescence RH ( %) and deliquescence RH ( %) are within the literature data obtained for submicron ammonium sulfate particles (Mikhailov et al., 2009; Gao et al., 2006; Ciobanu et al., 2010, and references therein). The experimental growth factors are compared to a full Köhler model with water activity parameterization derived from the E-AIM II (Clegg et al., 1998; Wexler and Clegg, 2002). As illustrated in Fig. 8a, up to 97 % RH the HHTDMA experimental data are in very good agreement with model growth factors. The insets in Fig. 8a show the experimental growth factor uncertainties, which gradually go up due to the increase in RH uncertainty (Eq. 2, terms 2 and ΔRH(dgb∕dRH)). Averaged over the range of 38 %–96 % RH, the mean deviation between measurement and model results is <0.5 %. The good agreement between model and measurement results confirms that the ammonium sulfate particles with are compact and spherical (i.e., ). However, above ∼97 % RH due to the sharp growth of the ΔRH(dgb∕dRH) term in Eq. (2), the observed growth factors systematically deviate from the Köhler model. Thus, at ∼98 % RH this deviation is ∼7 %, and at 99.5 % RH it is already ∼15 % (inset in Fig. 8a).
Figure 8b shows the measured growth factors, which were converted into RH using E-AIM at RH above deliquescence transition. In this case, the RH accuracy is determined by the instrumental growth factor error (Eq. 2, terms in square brackets). The insets in Fig. 8b indicate that RH accuracy progressively improves with RH increasing. Thus, at 85 % RH absolute accuracy is ±0.3 %, while at 99.5 % RH it is only ±0.03 % (Fig. 2). Thus, using experimental ammonium sulfate growth factors, it is possible to eliminate the RH uncertainty generated by capacitive and dew point sensors at RH above 80 %.
Overall, the combination of two HHTDMA operation modes (H&D and hydration–dehydration) that eliminate the effect of the particle shape factor and the precise determination of RH using ammonium sulfate are prerequisites for the accurate determination of the thermodynamic parameters of aerosol particles in a wide range of RH. In the next section, we will show the effectiveness of this approach with the example of glucose aerosol particles.
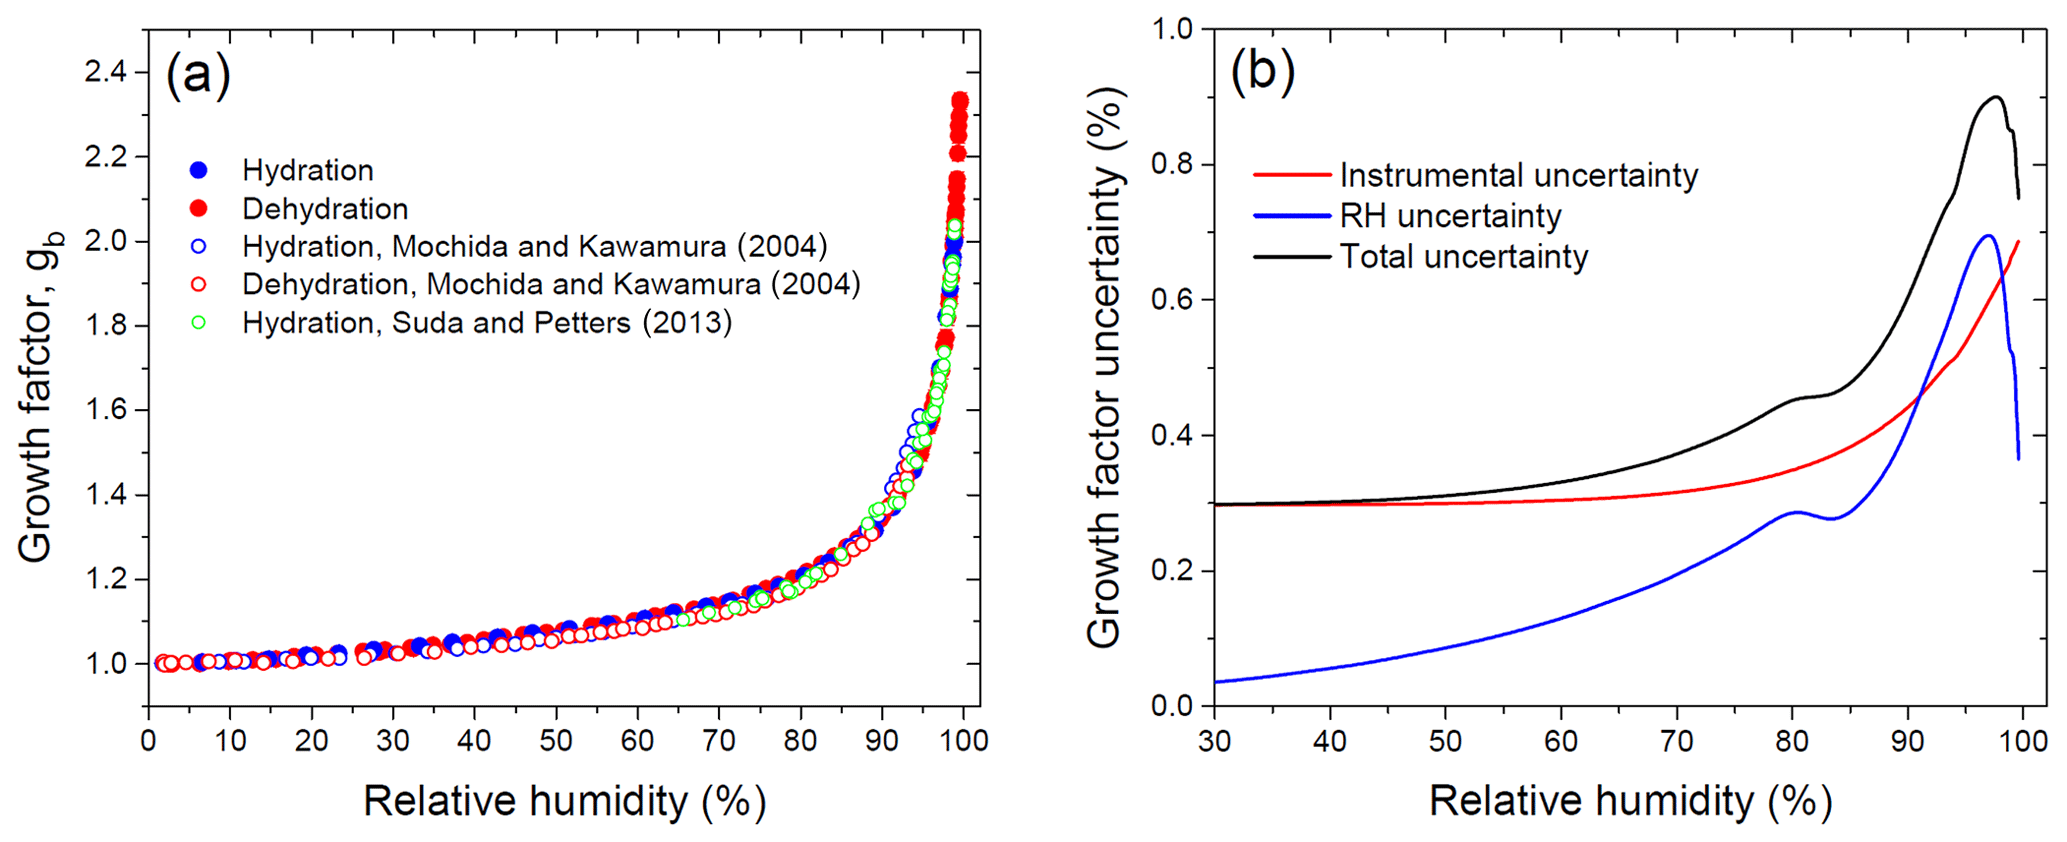
Figure 9Growth factors observed in the hydration and dehydration experiments for the preconditioned glucose aerosol particles with nm in comparison with literature data (a) and relative growth factor uncertainty due to instrumental and RH errors (b).
5.2.3 Glucose hydration and dehydration
Figure 9a shows the mobility equivalent growth factor observed upon the hydration and dehydration of preconditioned glucose aerosol particles with nm in the hydration and dehydration HHTDMA operation modes. In both modes, over the 2 %–99.6 % RH range the change in the growth factor occurred gradually. In contrast to (poly)crystalline ammonium sulfate (Fig. 8a), no stepwise changes in gb associated with DRH and ERH phase transitions are observed. Such behavior is typical for particles with an amorphous structure as discussed in Mikhailov et al. (2009). In general, the growth factors obtained in hydration and dehydration experiments are in good agreement with those previously reported by Mochida and Kawamura (2004) and Suda and Petters (2013). Nevertheless, a slight positive deviation of ∼1 % can be traced throughout the RH range. The growth factors presented by Mochida and Kawamura (2004) and Suda and Petters (2013) were calculated without particle shape correction. As noted in Sect. 5.1.2, due to porosity the glucose aerosol particles undergo a wet restructuring, decreasing their initial mobility diameter (Fig. 4b; Table 1). Therefore, using Db,i instead of as an approximation of the mass equivalent diameter of the dry solute particle Dm,s may lead to underestimated values of the growth factor (Eq. 8).
Figure 9b shows the change in the total relative uncertainty of the growth factor caused by RH and instrumental uncertainties. A small drop in growth factor uncertainty observed at ∼80 % RH (blue curve) is caused by replacing the RH control method (Sect. 2.4), and its decrease above ∼97 % RH is due to a sharp drop in ΔRH (gb,E-AIM) near water saturation (Eq. 2; Fig. 2). In contrast, the instrumental gb uncertainty increases monotonously (Fig. 9b, red curve) due to the smooth growth of the RH-dependent ratio in Eq. (1) (Fig. S1.3).
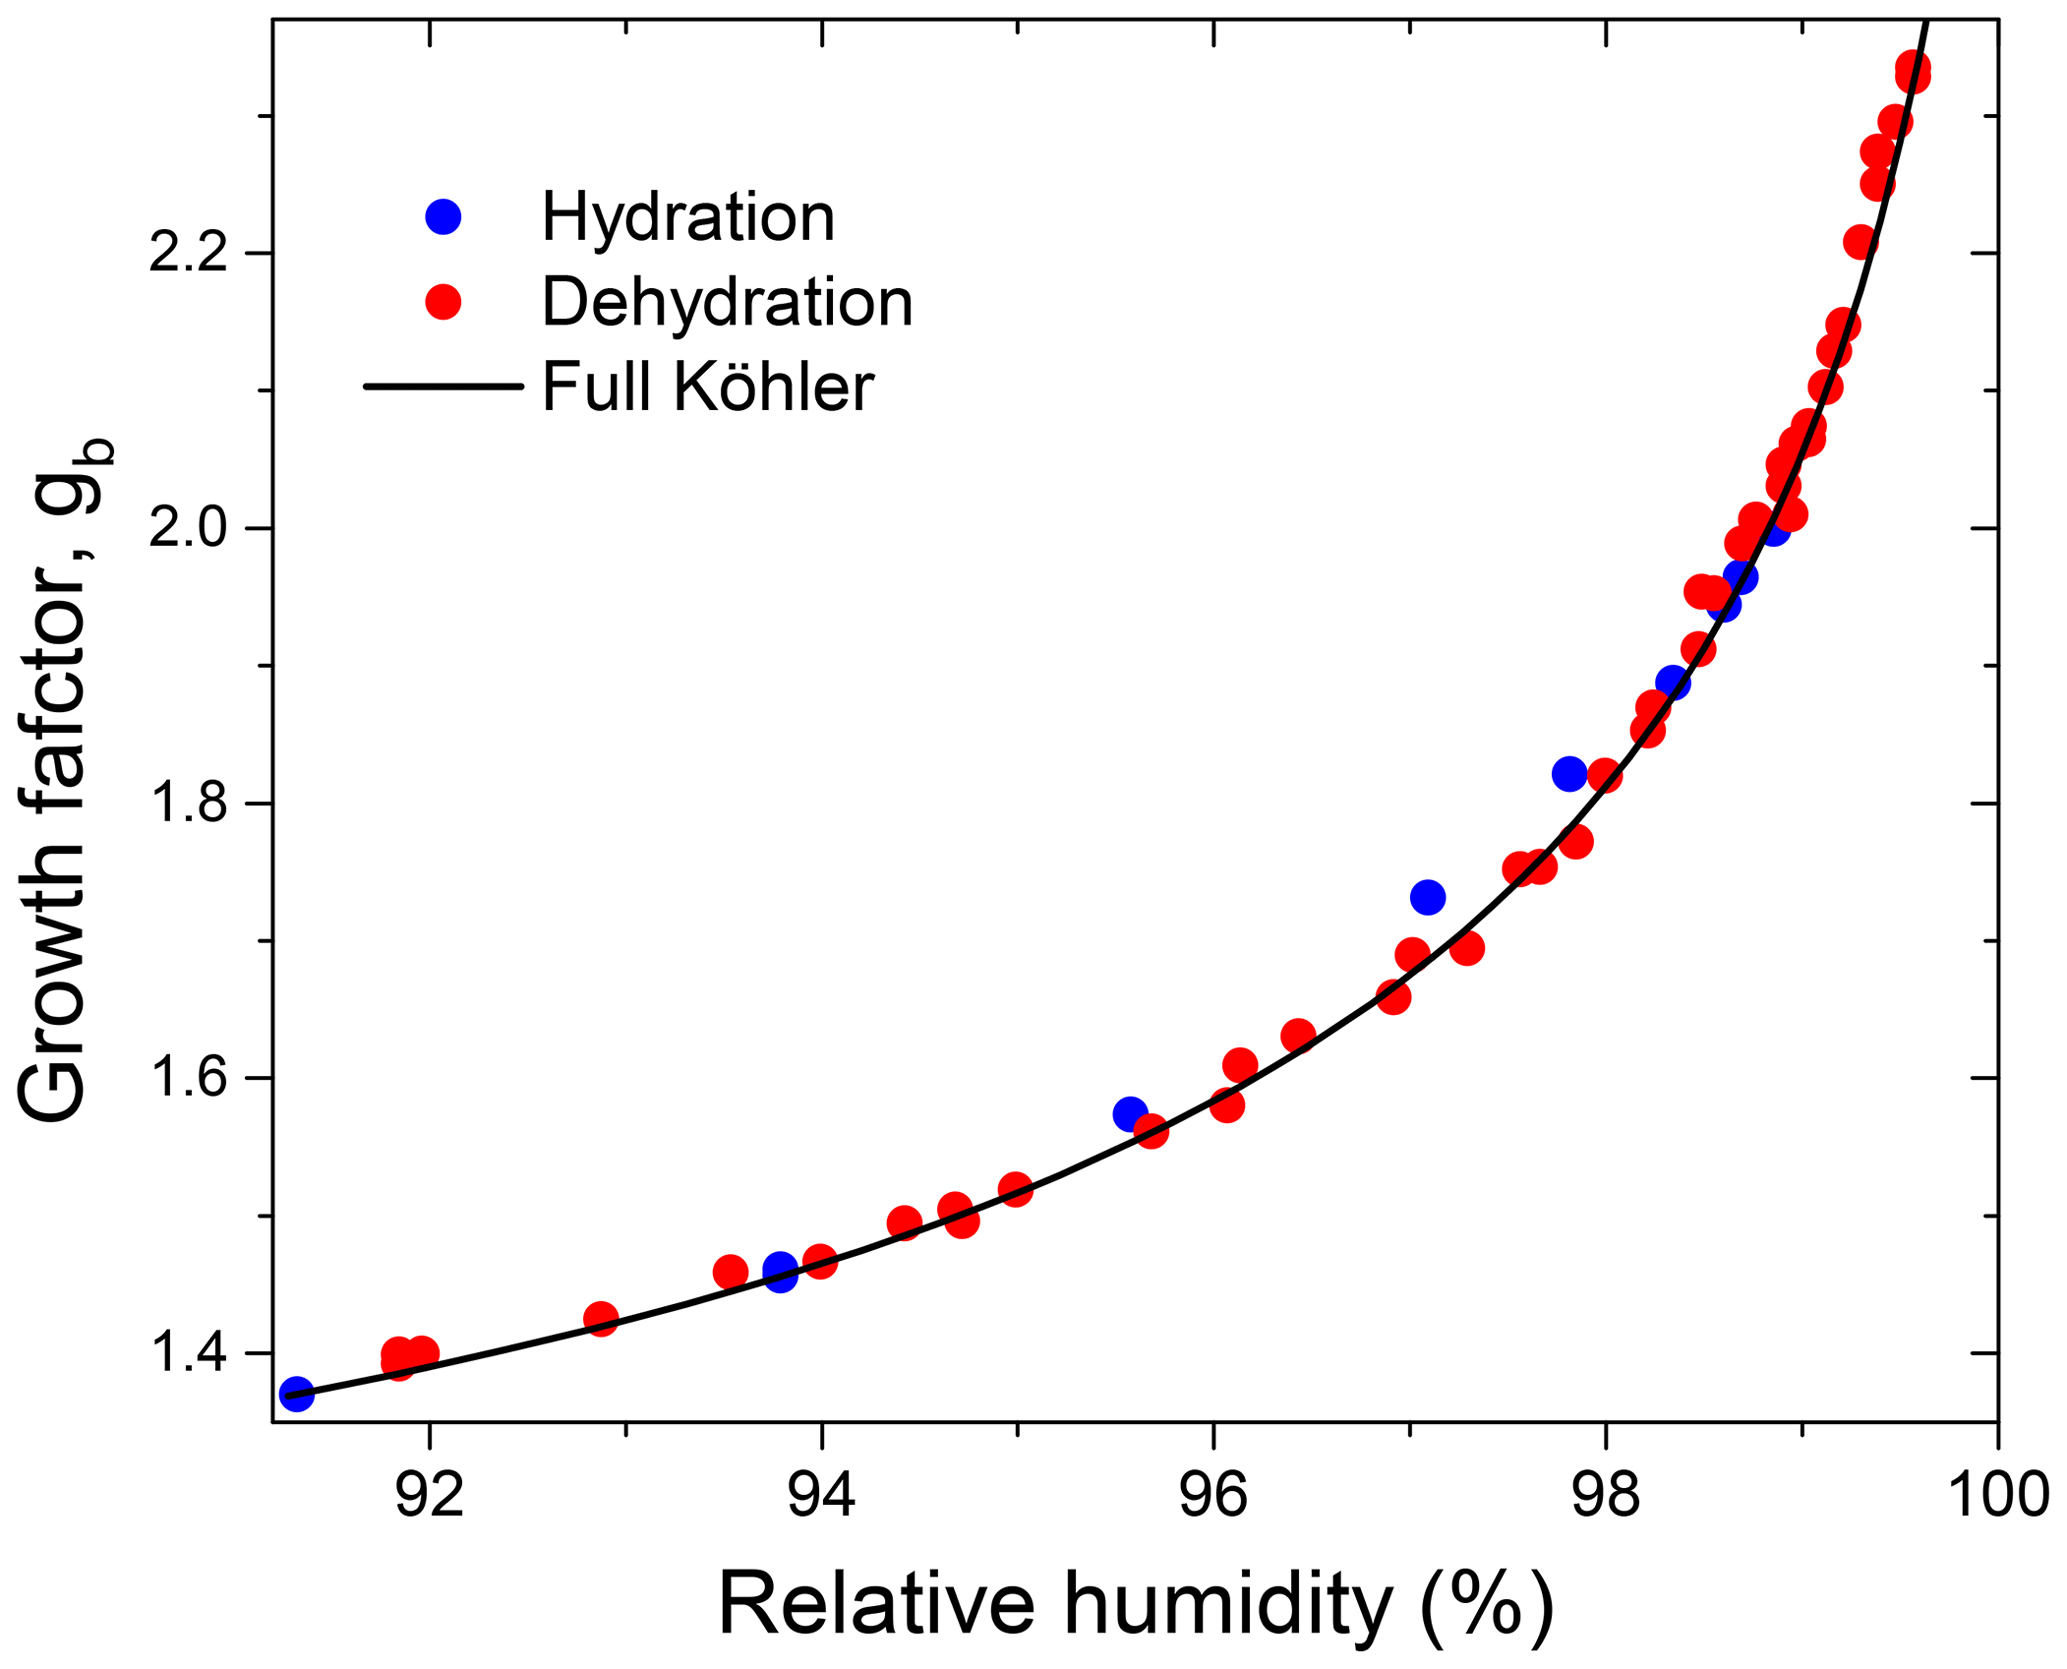
Figure 10Growth factors observed in the hydration and dehydration experiments for the preconditioned glucose aerosol particles with nm in comparison to mass equivalent growth factors calculated with the full Köhler model.
Figure 10 shows the HHTDMA growth factors compared to the full Köhler model (Eq. 6) with aw calculated from Eq. (15) using the bulk water activity coefficient, γw, from Taylor and Rowlinson (1955) (Sect. 4.1) and and σ calculated from Eqs. (7) and (10), respectively. Excellent agreement between HHTDMA-based and full Köhler model data is observed: throughout the 91.0 %–99.6 % RH range the average deviation of the experimental data points from the model is 0.7 %. The observed coincidence indicates that the value obtained upon restructuring is a good approximation of the mass equivalent diameter of the dry glucose aerosol particle, i.e., nm. It also confirms the small growth factor uncertainty associated with RH and instrumental gb errors, which is in the range of 0.3 %–0.9 % throughout the 2 %–99.6 % RH interval (Fig. 9b, black curve).
Table 2Parameters characterizing the hygroscopic properties of glucose aerosol particles: best-fit values (± standard errors) for the three-parameter fit (k1, k2, k3; Eq. 17); n and R2 are the number of data points and the coefficient of determination of the fit, respectively.
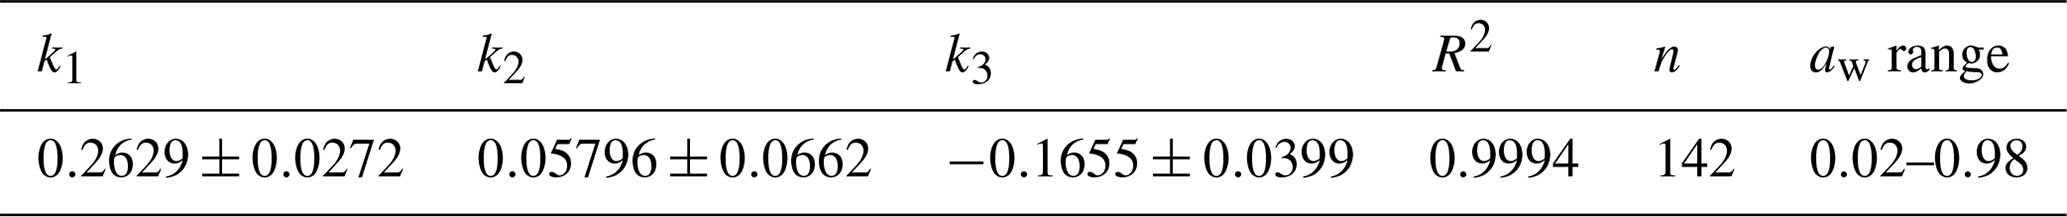
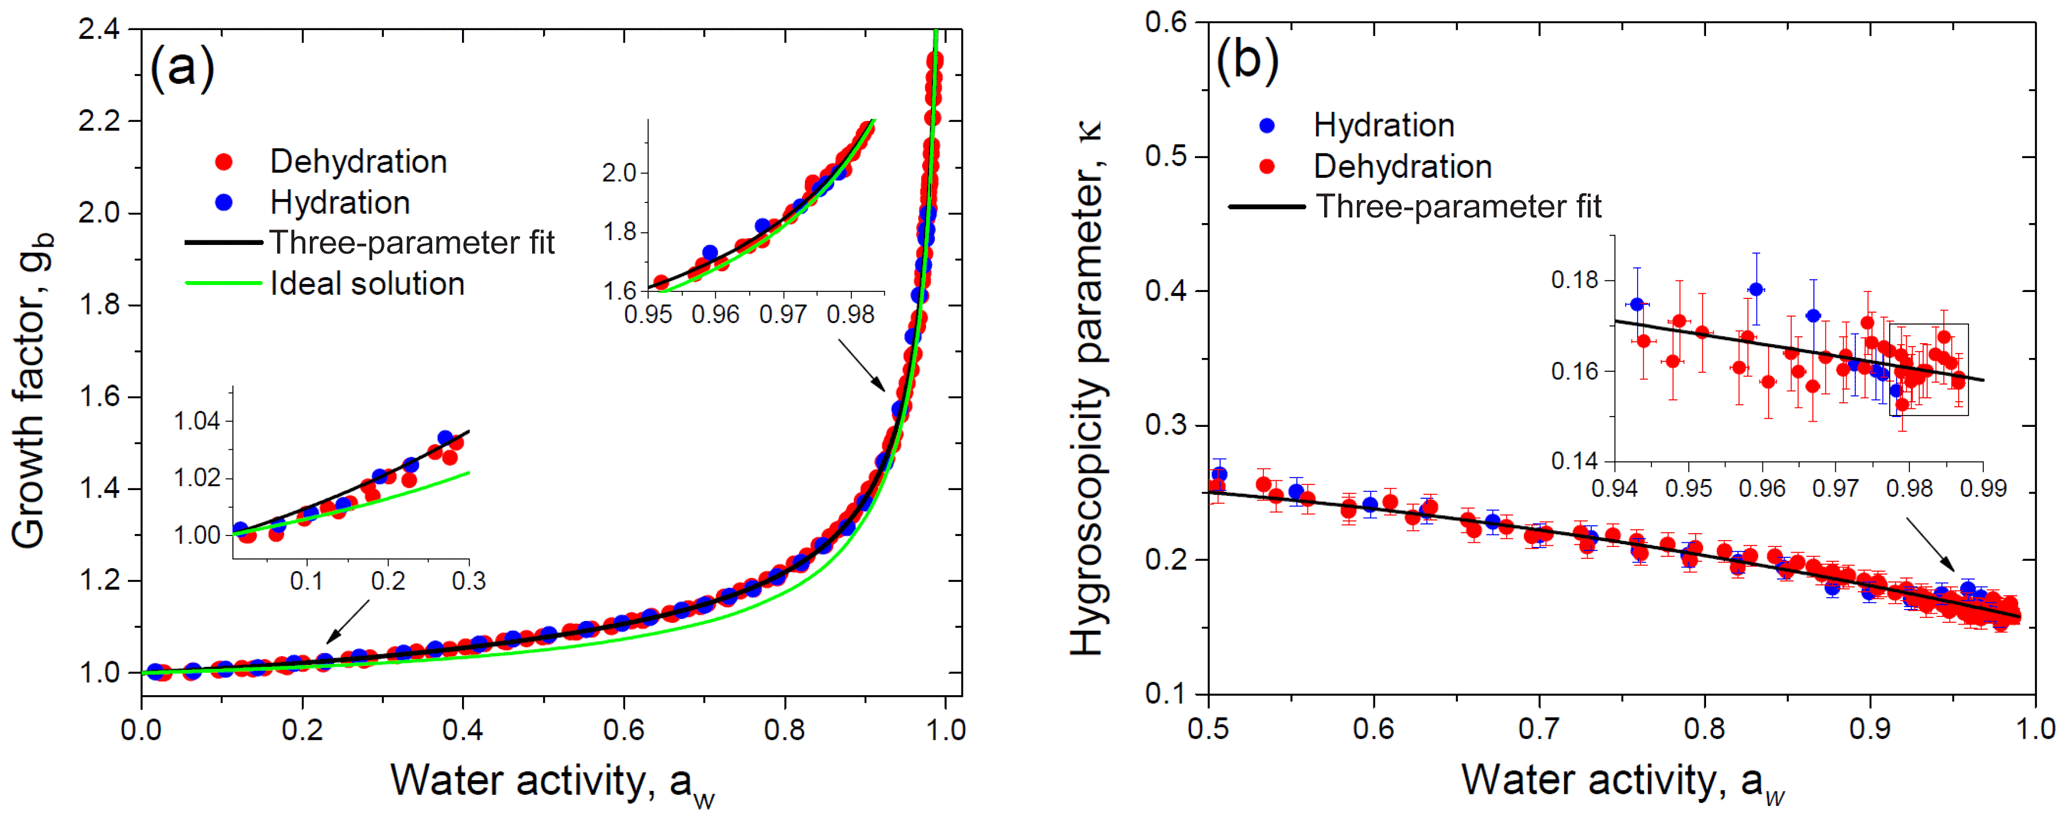
Figure 11Growth factor (a) and hygroscopicity parameter (b) of glucose aerosol particles as a function of water activity. Black lines in panels (a) and (b) correspond to the three-parameter fit using Eqs. (17) and (19), respectively. The green line accounts for the ideal solution model (a). Insets: (a) water-activity-based growth factors at low and high aw in comparison with model curves; (b) hygroscopicity parameter change at aw above 0.94. The data points selected by the rectangle are used to calculate the average value of the dilute hygroscopicity parameter, κ.
5.3 Glucose thermodynamic variables
5.3.1 Water activity and hygroscopicity parameter
Using Eq. (6) the experimental gb vs. RH data points are converted into data pairs gb vs. aw (Sect. 4.2). Figure 11a shows the obtained activity-based growth factors, which were fitted with Eq. (17) to determine the best-fit values of the parameters k1, k2, and k3 (Table 2). Figure 11a also illustrates the difference between experimental data points and the ideal solution model, which was traced throughout the water activity range (insets in Fig. 11a) with a maximal deviation of 3.6 % at aw≈0.8. Only at aw>0.98 did the experimental growth factors coincide with the ideal model within an uncertainty of gb∼0.6 %. For the ideal solution model the gb(aw) dependence is calculated from Eq. (25) with aw=xw. Note that, given Eq. (20) for κR, Eq. (25) can be reduced to
which is an analog of Eq. (19), where κ=κR.
For each experimental gb vs. aw data pair we have calculated κ values using Eq. (19). By inserting fitted values of gb(aw) into Eq. (19), we have obtained the corresponding fit curve for activity-based hygroscopicity, κ. The obtained results are shown in Fig. 11b. Due to concentration effects (Mikhailov et al., 2013, and references therein) the hygroscopicity parameter decreases with gb increasing. At aw>0.98 the κ becomes almost constant. In this area the estimated value of κ is 0.160±0.006 (average of the 10 data points ± propagated uncertainty; see the inset in Fig. 11b), which is close to the ideal solution value of κR=0.154 (Eq. 20). The hygroscopicity κ obtained in this study for dilute glucose solution is in agreement with that derived by Ruehl et al. (2010) () measured in the 99.4 %–99.9 % RH range using the continuous-flow thermal gradient column and with the HHTDMA-based value of κ=0.162 reported by Petters and Petters (2016) at RH>90 %. Note that at the same water activity range the measurement uncertainty of κ with the HHTDMA method is ∼6 times less than that in the thermal gradient column setup (0.006 vs. 0.033). As mentioned before, the optical measurements used for particle size determination (Ruehl et al., 2010; Wex et al., 2005; Suda and Petters, 2013) are subjected to limitations in accuracy resolution due to uncertainties in the refractive index and conversion from the optical to physical diameter.
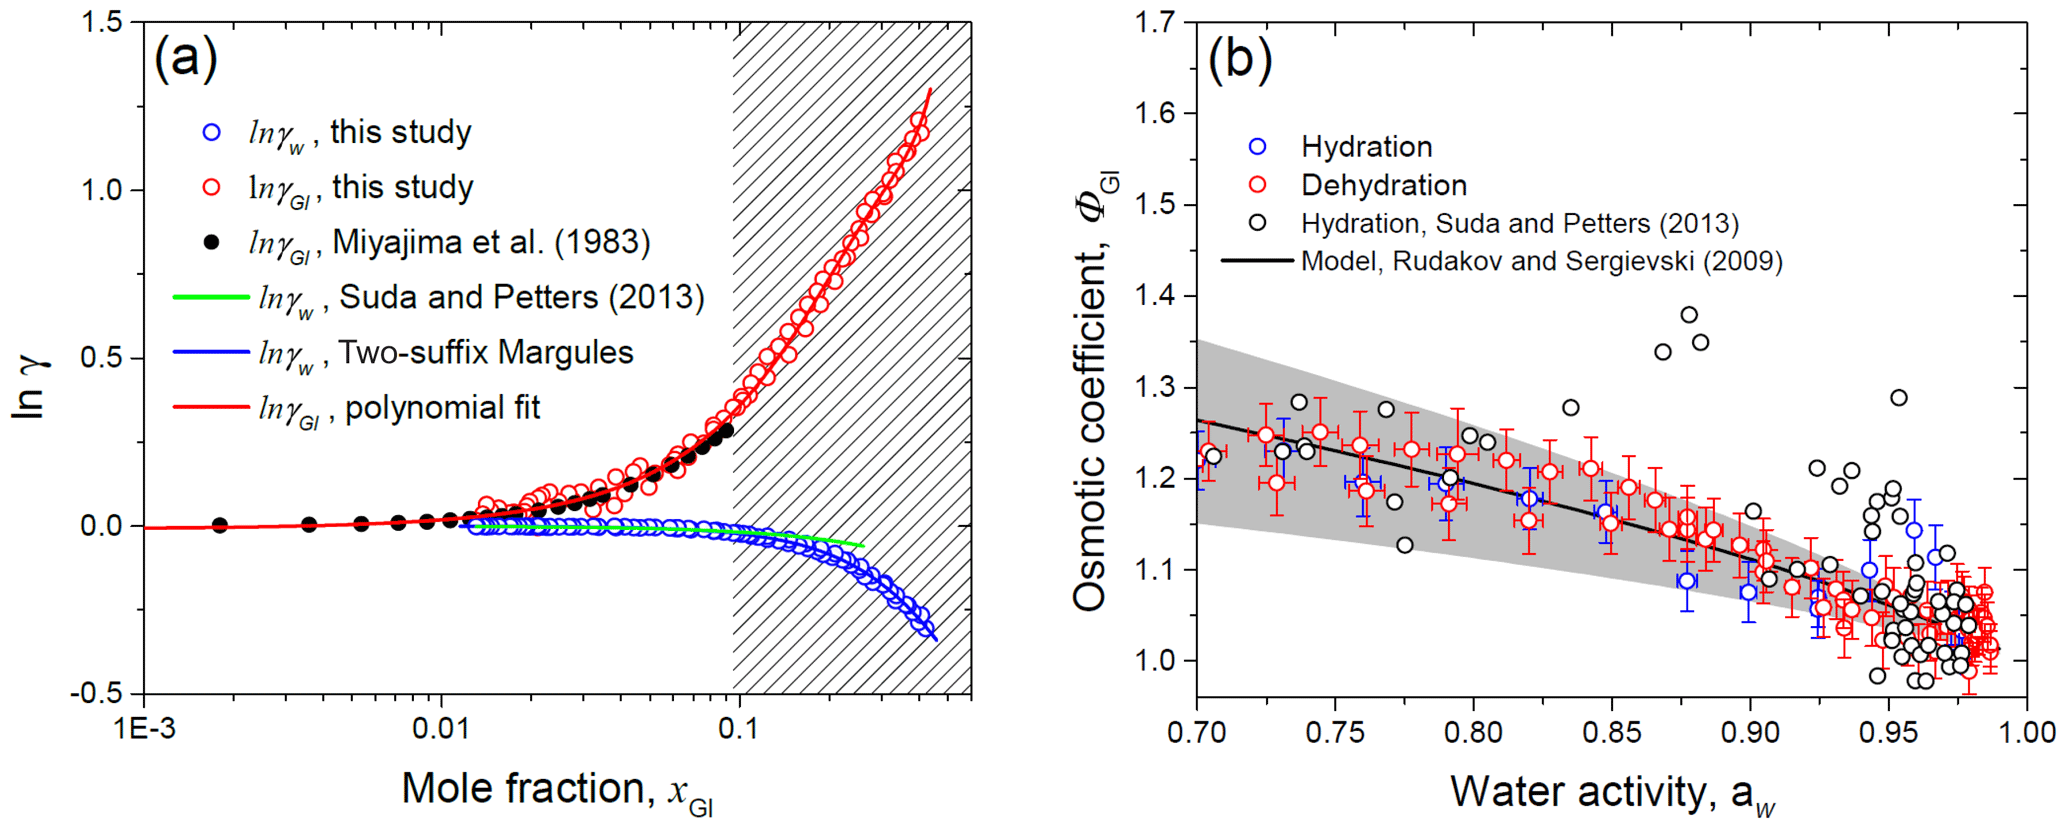
Figure 12HHTDMA-based activity coefficients of water (γw) and glucose (γGl) as a function of the mole fraction (a) and molal osmotic coefficient of glucose (ΦGl) vs. water activity (b) for glucose solution droplets in comparison with literature data. Bulk measurement of γGl from Miajima et al. (1983) – black solid (a); the data points and error bars are from the HHTDMA experiment with hydration (blue circles) and dehydration (red circles). The ΦGl values from Suda and Petters (2013) – black circles (b). Model lines: (a) two-suffix Margules equation (Eq. 16, with ) – blue solid; (b) Rudakov and Sergievskii (2009) model (Eq. 23) with hydration number h0=1.88 (the best-fit parameter with standard error is 0.04) – black solid. The gray shaded area denotes the hydration number range with h0+0.5 (upper bound) and h0−0.5 (lower bound). The red dashed fit line in panel (a) is the polynomial fourth-order fit function of ln γGl obtained in this study together with Miajima et al. (1983) bulk measurements. The shaded rectangle in panel (a) denotes the metastable area of the glucose solution droplet.
5.3.2 Activity and molal osmotic coefficients
Figure 12a shows the HHTDMA-based activity coefficient of water (γw) and glucose (γGl) in glucose aqueous solution. The activity coefficient of water was calculated from Eq. (15), where xw was obtained based on Eqs. (8) and (9) as described in Sect. 4.4, and water activity was derived from Eq. (6) with the assumptions considered in Sect. 4.2. The activity coefficient of glucose in water solution was obtained by numerical integration of Eq. (26) (Sect. 4.4).
The bulk DRH of glucose varied in the range of 88 %–90 % RH (Zamora et al., 2011, and references therein), which corresponds to the saturated mole fraction of glucose aqueous solution, xGl, of 0.095 (μGl=3.14 mol kg−1). Above this value, glucose particles are metastable supersaturated droplets (selected area in Fig. 12a), which are present in an amorphous (semisolid) state. Using the bulk water pressure method, Taylor and Rowlinson (1955) obtained water activity coefficient values up to xw of 0.195 and fitted their data using the two-suffix Margules Eq. (16) with (±0.062). Figure 12a shows that up to xw of 0.42 our HHTDMA-derived values of γw are in excellent agreement with the Taylor and Rowlinson (1955) data fit, indicating that the simple two-suffix Margules equation with is also applicable for deep metastable areas. The water activity coefficients obtained in this study were also compared with those reported by Suda and Petters (2013) (Fig. 12a, green line). At xGl<0.07 their HTDMA-derived γw values are in good agreement with ours (within ∼0.2 %), while at xGl>0.07 a systematic deviation is observed, reaching ∼7 % at xGl=0.25. The observed difference can be explained by the fact that Suda and Petters (2013) used the assumption of volume additivity to calculate the water activity coefficient. Moreover, as mentioned above, in their study no shape factor correction for the dry particles was made.
In addition, Fig. 12a shows the glucose activity coefficients, which are compared to bulk measurements by Miyajima et al. (1983) obtained with the isopiestic method (black symbols). One can see that our ln λGl values are in good agreement with literature data points. For future applications, we fitted our ln λGl data (up to xw=0.42), together with the Miyajima et al. (1983) bulk results, using a polynomial fourth-order fit function. The obtained fitting coefficients are listed in Table 3.
Table 3Fitted parameters (± standard deviation) of ln λGl as a function of the mole fraction of glucose, xGl, in glucose aqueous solution; n and R2 are the number of data points and the coefficient of determination of the fit, respectively.
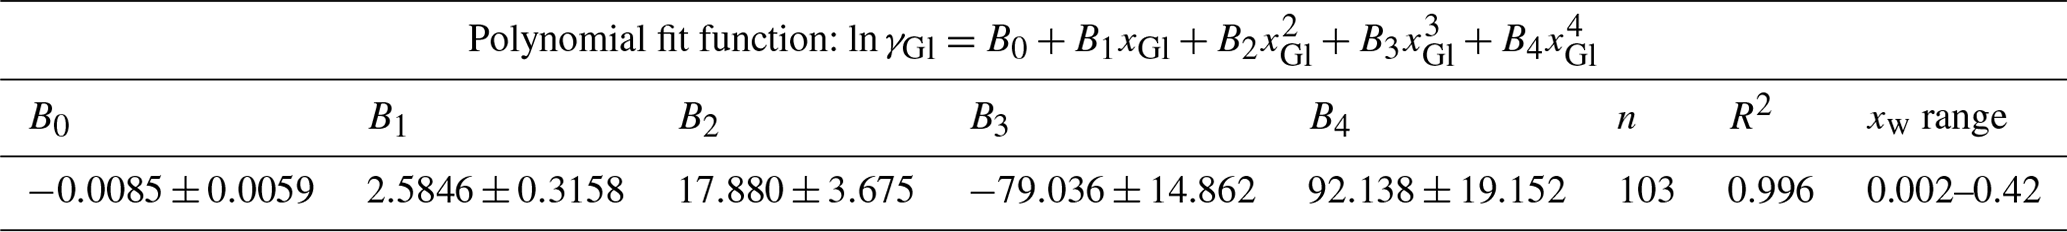
Figure 12b shows the HHTDMA-based molal osmotic coefficient of glucose, ΦGl, as a function of water activity. The molal osmotic coefficient was calculated from Eq. (21), where μGl was obtained using Eq. (14). The obtained data pairs ΦGl vs. aw are fitted using the theory relation (Eq. 23) proposed by Rudakov and Sergievskii (2009) (Sect. 4.3). The best-fit value of the hydration number, h0, is 1.88±0.04 (n=75; R2=0.858). That is close to reported by Rudakov and Sergievskii (2009). Our HHTDMA-based values of ΦGl are within h0±0.5 (gray shaded area, Fig. 12b). At aw>0.98 the ΦGl value is 1.034±0.025 (average ± propagated uncertainty; 11 data points). This result indicates that even in diluted glucose solution, nonideality caused by the hydration of glucose molecules still persists. Experimental values of ΦGl were accompanied by those obtained by Suda and Petters (2013) (black circles, Fig. 12b). In general, the Suda and Petters (2013) data points are close to our results. A noticeable deviation is observed in the water activity range of 0.85–0.95. The main reason is that the relatively small changes in the instrumental uncertainties of aerosol particle growth factors and in RH will lead to large uncertainties in the determination of their thermodynamic characteristics. Thus, for our HHTDMA system in the case of glucose aerosol particles in the RH range of 90 %–99 % the growth factor uncertainty of ∼0.6 % (Eq. 2) gives rise to uncertainty in ΦGl of ∼3 %.
We have demonstrated the key features of a newly designed HHTDMA instrument that allows for measuring particle hygroscopic growth with an uncertainty of ∼0.7 % throughout the 2 %–99.6 % RH range. This accuracy was firstly achieved by combining the restructuring mode with the conventional hydration–dehydration mode. The tandem of two modes allowed us to minimize uncertainties associated with the morphology of the initial dry particles. Secondly, both DMAs were temperature-stabilized. The temperature difference between sheath and excess flow in DMA2 is as small as ±0.015 ∘C, which made it possible to measure particle growth factors up to 99.6 % RH. Throughout the relative humidity range, the absolute RH uncertainty is less than 0.4 %.
We have checked the effect of the size dependence of the DMA2 transfer function width on, as well as the sensitivity of the SMPS inversion algorithm to, the uncertainty in particle sizing. Our test measurements have shown that the effect of transfer function broadening on the particle growth factor is negligibly small. With regard to the SMPS inversion algorithm and lognormal fit used for determination of the particle mobility diameter, we found that the particle size resolution significantly exceeds the size of individual bins. This is possibly because DMA1-selected particles are still polydisperse, and a small offset voltage leads to a change in the count statistics in each size bin. As a result, the fitted size spectra and modal mobility particle diameter shift proportionally to the voltage change. Thus, in our experiments for ∼100 nm aerosol particles we were able to maintain the required initial mobility diameter with a resolution of ±0.03 nm by changing the voltage on the DMA1 rod by several tens of millivolts.
Multiple experiments with the H&D mode (preconditioning mode) have shown that this mode provides complementary information about microstructural rearrangement processes upon aerosol particle interaction with water vapor. It allowed for quantifying the envelope shape and porosity of spray-dried ammonium sulfate and glucose aerosol particles. By changing the drying conditions, we found that in contrast to glucose aerosol particles the water release by ammonium sulfate particles is kinetically limited, most likely due to closed or partially shielded cavities. Overall, our H&D experiments showed that particle envelope and porosity are not constant. Depending on drying conditions, they can vary from case to case in a wide range of particle shape factors. Therefore, for accurate growth factor determination, we recommend combining in situ restructuring modes with hydration–dehydration modes. Since the restructured particles become compact, we were able to measure the thickness of the water adsorption layer on the surface of the ammonium sulfate particles before DRH. We found that water adsorption already occurs at lower humidities ranging ∼15 % RH. The number of monolayers linearly increased from ∼0 to 3.5 for the range of 5 %–75 % RH and sharply increased up to six monolayers over the range of 75 %–79 % RH.
Hydration–dehydration experiments with ammonium sulfate particles showed that experimental growth factors are in good agreement with E-AIM, confirming that after preconditioning the restructured particles are compact and spherical. Averaged over the range of 38 %–96 % RH, the mean relative deviation between measurement and model results is <0.5 %. We also tested the RH accuracy, which can be obtained from the conversion of experimental growth factors into RH using E-AIM. Due to low instrumental growth factor uncertainty, we were able to measure RH above 80 % with absolute accuracy no worse than 0.3 % RH. Moreover, this uncertainty decreased with RH increasing, dropping to 0.03 % at RH=99.5 %. Thus, by using ammonium sulfate growth factors as a calibration standard, it was possible to eliminate the RH uncertainty generated by capacitive and dew point sensors at RH above 80 %. In general, we have shown that tandem H&D (preconditioning) and hydration–dehydration modes, as well as improved methods for measuring RH, creates the prerequisites for an accurate determination of the thermodynamic parameters of aerosol particles in a wide range of RH. The effectiveness of this approach has been tested on glucose aerosol particles.
The glucose growth factors measured in the 2 %–99.6 % RH range are in good agreement with literature data. At RH above 90 %, perfect agreement between our data and those obtained by bulk methods was observed. Up to 99.6 % RH, the average deviation of experimental growth factors from the full Köhler is as small as 0.7 %. At water activity above 0.98, the calculated value of κ was 0.160±0.006. The HHTDMA-based activity coefficient of water and glucose in glucose aqueous solution has been obtained, including a metastable area up to xw=0.42. Both HHTDMA-derived activity coefficients are in good agreement with those obtained by bulk methods reported in the literature. We also calculated the molal osmotic coefficient of glucose and estimated hydration number, which is ∼1.9. One should note that all thermodynamic parameters were obtained without the assumption of volume additivity. Since the thermodynamic characteristics of glucose aqueous solution above bulk DRH are well defined, it can also be used as a reference standard for RH determination from experimental growth factors. It will reduce the upper limit of voltage applied to DMA2 and avoid potential discharge in the column at high RH.
Overall, our results demonstrated that the HHTDMA system described in this work allows us to determine the thermodynamic characteristics of aqueous solutions with an accuracy close to that obtained by bulk methods. At the same time, an important advantage of this method is the ability to determine these characteristics for highly supersaturated solution droplets.
The data are available at https://doi.org/10.17605/OSF.IO/87526 (last access: 4 March 2020) (Mikhailov, 2020).
The supplement related to this article is available online at: https://doi.org/10.5194/amt-13-2035-2020-supplement.
EFM designed the study, performed the measurements, and wrote this paper. SSV contributed to the discussion and interpretation of the results.
The authors declare that they have no conflict of interest.
All performed studies were supported by the Russian Science Foundation and the Max Planck Society (MPG). We thank the Geomodel Research Center and Interdisciplinary Resource Center for Nanotechnology at Saint Petersburg State University.
This research has been supported by the Russian Science Foundation (grant no. 18-17-00076).
The article processing charges for this open-access
publication were covered by the Max Planck Society.
This paper was edited by Mingjin Tang and reviewed by three anonymous referees.
Andreae, M. O. and Rosenfeld, D.: Aerosol-cloud-precipitation interactions. Part 1. The nature and sources of cloud-active aerosols, Earth-Sci. Rev., 89, 13–41, https://doi.org/10.1016/j.earscirev.2008.03.001, 2008.
Aumann, E. and Hildemann, L. M.: Measuring and modeling the composition and temperature-dependence of surface tension for organic solutions, Atmos. Environ., 44, 329–337, https://doi.org/10.1016/j.atmosenv.2009.10.033, 2010.
Biskos, G., Paulsen, D., Russell, L. M., Buseck, P. R., and Martin, S. T.: Prompt deliquescence and efflorescence of aerosol nanoparticles, Atmos. Chem. Phys., 6, 4633–4642, https://doi.org/10.5194/acp-6-4633-2006, 2006.
Brechtel, F. J. and Kreidenweis, S. M.: Predicting particle critical supersaturation from hygroscopic growth measurements in the humidified TDMA. Part II: Laboratory and Ambient Studies, J. Atmos. Sci. 57, 1872–1887, https://doi.org/10.1175/1520-0469(2000)057<1854:PPCSFH>2.0.CO;2, 2000.
Brockmann, J. E. and Rader, D. J.: APS response to nonspherical particles and experimental determination of dynamic shape factor, Aerosol Sci. Technol., 13, 162–172, https://doi.org/10.1080/02786829008959434, 1990.
Cerdeiriňa, C. A., Carballo, E., Tovar, C. A., and Romani, L.: Thermodynamic Properties of Aqueous Carbohydrate Solutions, J. Chem. Eng. Data, 42, 124–127, https://doi.org/10.1021/je960168t, 1997.
Chan, C. K., Flagan, R. C., and Seinfeld, J. H.: Water activity of NH4NO3∕(NH4)2SO4 solutions, Atmos. Environ., 26A, 1661–1673, https://doi.org/10.1016/0960-1686(92)90065-S, 1992.
Cheng, Y. F., Wiedensohler, A., Eichler, H., Heintzenberg, J., Tesche, M., Ansmann, A., Wendisch, M., Su, H., Althausen, D., Herrmann, H., Gnauk, T., Bruggemann, E., Hu, M., and Zhang, Y. H.: Relative humidity dependence of aerosol optical properties and direct radiative forcing in the surface boundary layer at Xinken in Pearl River Delta of China: An observation based numerical study, Atmos. Environ., 42, 6373–6397, https://doi.org/10.1016/j.atmosenv.2008.04.009, 2008.
Chuang, P. Y.: Measurement of the time scale of hygroscopic growth for atmospheric aerosols, J. Geophys. Res., 108, 4282, https://doi.org/10.1029/2002JD002757, 2003.
Ciobanu, V. G., Marcolli, C., Krieger, U. K., Zuend, A., and Peter, T.: Efflorescence of ammonium sulfate and coated ammonium sulfate particles: Evidence for surface nucleation, J. Phys. Chem. A, 114, 9486–9495, https://doi.org/10.1021/jp103541w, 2010.
Clegg, S. L. and Wexler, A. S.: Interactive comment on “Calibration and measurement uncertainties of a continuous-flow cloud condensation nuclei counter (DMT–CCNC): CCN activation of ammonium sulfate and sodium chloride aerosol particles in theory and experiment” by D. Rose et al., Atmos. Chem. Phys. Discuss., 7, S4180–S4183, 2007.
Clegg, S. L., Ho, S. S., Chan, C. K., and Brimblecombe, P.: Thermodynamic properties of aqueous (NH4)2SO4 to high supersaturation as a function of temperature, J. Chem. Eng. Data, 40, 1079–1090, https://doi.org/10.1021/je00021a011, 1995.
Clegg, S. L., Brimblecombe, P., and Wexler, A. S.: A thermodynamic model of the system H+ – NH+4 – Na+ – – – Cl− – H2O at 298.15 K, J. Phys. Chem. A, 102, 2155–2171, https://doi.org/10.1021/jp973043j, 1998.
Cohen, M. D., Flagan, R. C., and Seinfeld, J. H.: Studies of concentrated electrolyte solutions using the electrodynamic balance. 1. Water activities for single-electrolyte solutions, J. Phys. Chem., 91, 4563–4574, https://doi.org/10.1021/j100301a029, 1987.
Colberg, C. A., Krieger, U. K., and Peter, T: Morphological investigations of single levitated aerosol particles during deliquescence/efflorescence experiments, J. Phys. Chem. A, 108, 2700–2709, https://doi.org/10.1021/jp037628r, 2004.
DeCarlo, P. F., Slowik, J. G., Worsnop, D. R., Davidovits, P., and Jimenez, J. L.: Particle morphology and density characterization by combined mobility and aerodynamic diameter measurements. Part 1: Theory, Aerosol Sci. Technol., 38, 1185–1205, https://doi.org/10.1080/027868290903907, 2004.
DeCindio, B. and Correra, S.: Low temperature sugar-water equilibrium curve by a rapid calorimetric method, J. Food Eng., 24, 405–415, https://doi.org/10.1016/0260-8774(95)90053-E, 1995.
Dick, W. D., Ziemann, P. J., Huang, P.-F., and McMurry, P. H.: Optical shape fraction measurements of submicrometre laboratory and atmospheric aerosols, Meas. Sci. Technol. 9, 183–196, https://doi.org/10.1088/0957-0233/9/2/006, 1998.
Duplissy, J., Gysel, M., Sjogren, S., Meyer, N., Good, N., Kammermann, L., Michaud, V., Weigel, R., Martins dos Santos, S., Gruening, C., Villani, P., Laj, P., Sellegri, K., Metzger, A., McFiggans, G. B., Wehrle, G., Richter, R., Dommen, J., Ristovski, Z., Baltensperger, U., and Weingartner, E.: Intercomparison study of six HTDMAs: results and recommendations, Atmos. Meas. Tech., 2, 363–378, https://doi.org/10.5194/amt-2-363-2009, 2009.
Gao, Y., Chen, S. B., and Yu, L. E.: Efflorescence relative humidity for ammonium sulfate particles, J. Phys. Chem. A, 110, 7602–7608, https://doi.org/10.1021/jp057574g, 2006.
Gysel, M., Weingartner, E., and Baltensperger, U.: Hygroscopicity of aerosol particles at low temperatures. 2. Theoretical and experimental hygroscopic properties of laboratory generated aerosol, Environ. Sci. Technol., 36, 63–68, https://doi.org/10.1021/es010055g, 2002.
Gysel, M., Weingartner, E., Nyeki, S., Paulsen, D., Baltensperger, U., Galambos, I., and Kiss, G.: Hygroscopic properties of water-soluble matter and humic-like organics in atmospheric fine aerosol, Atmos. Chem. Phys., 4, 35–50, https://doi.org/10.5194/acp-4-35-2004, 2004.
Hänel, G.: The properties of atmospheric aerosol particles as function of relative humidity at the thermodynamic equilibrium with surrounding moist air, Adv. Geophys. 19, 73–188, https://doi.org/10.1016/S0065-2687(08)60142-9, 1976.
Hatch, C. D., Tumminello, P. R., Cassingham, M. A., Greenaway, A. L., Meredith, R., and Christie, M. J.: Technical note: Frenkel, Halsey and Hill analysis of water on clay minerals: toward closure between cloud condensation nuclei activity and water adsorption, Atmos. Chem. Phys., 19, 13581–13589, https://doi.org/10.5194/acp-19-13581-2019, 2019.
Hennig, T., Massling, A., Brechtel, F. J., and Wiedensohler, A.: A Tandem DMA for highly temperature-stabilized hygroscopic particle growth measurements between 90 % and 98 % relative humidity, J. Aerosol Sci., 36, 1210–1223, https://doi.org/10.1016/j.jaerosci.2005.01.005, 2005.
Johnson, G. R., Fletcher, C., Meyer, N., Modini, R., and Ristovski, Z. D.: A robust, portable H-TDMA for field use, Aeros. Sci., 39, 850–861, https://doi.org/10.1016/j.jaerosci.2008.05.005, 2008.
Koop, T., Bookhold, J., Shiraiwa, M., and Pöschl, U.: Glass transition and phase state of organic compounds: dependency on molecular properties and implications for secondary organic aerosols in the atmosphere, Phys. Chem. Chem. Phys., 13, 19238–19255, https://doi.org/10.1039/C1CP22617G, 2011.
Kreidenweis, S. M., Koehler, K., DeMott, P. J., Prenni, A. J., Carrico, C., and Ervens, B.: Water activity and activation diameters from hygroscopicity data – Part I: Theory and application to inorganic salts, Atmos. Chem. Phys., 5, 1357–1370, https://doi.org/10.5194/acp-5-1357-2005, 2005.
Kuwata, M. and Kondo, Y.: Measurements of particle masses of inorganic salt particles for calibration of cloud condensation nuclei counters, Atmos. Chem. Phys., 9, 5921–5932, https://doi.org/10.5194/acp-9-5921-2009, 2009.
Liu, B. Y. H., Pui, D. Y. H., Whitby, K., Kittelson, D. B., Kousaka, Y., and McKenzie, R. L.: The aerosol mobility chromatograph: a new detector for sulfuric acid aerosols, Atmos. Environ., 12, 99–104, 1978.
Lopez-Yglesias, X. F., Yeung, M. C., Stephen, E. D., Brechtel, F. J., and Chan, C. K.: Performance Evaluation of the Brechtel Mfg. Humidified Tandem Differential Mobility Analyzer (BMI HTDMA) for Studying Hygroscopic Properties of Aerosol Particles, Aerosol. Sci. Technol., 48, 969–980, https://doi.org/10.1080/02786826.2014.952366, 2014.
Massling, A., Niedermeier, N., Hennig, T., Fors, E. O., Swietlicki, E., Ehn, M., Hämeri, K., Villani, P., Laj, P., Good, N., McFiggans, G., and Wiedensohler, A.: Results and recommendations from an intercomparison of six Hygroscopicity-TDMA systems, Atmos. Meas. Tech., 4, 485–497, https://doi.org/10.5194/amt-4-485-2011, 2011.
McFiggans, G., Artaxo, P., Baltensperger, U., Coe, H., Facchini, M. C., Feingold, G., Fuzzi, S., Gysel, M., Laaksonen, A., Lohmann, U., Mentel, T. F., Murphy, D. M., O'Dowd, C. D., Snider, J. R., and Weingartner, E.: The effect of physical and chemical aerosol properties on warm cloud droplet activation, Atmos. Chem. Phys., 6, 2593–2649, https://doi.org/10.5194/acp-6-2593-2006, 2006.
Mikhailov, E. F.: HHTDMA_data to AMTDdoi.org10.5194amt-2019-478, OSF, https://doi.org/10.17605/OSF.IO/87526, 2020.
Mikhailov, E., Vlasenko, S., Niessner, R., and Pöschl, U.: Interaction of aerosol particles composed of protein and saltswith water vapor: hygroscopic growth and microstructural rearrangement, Atmos. Chem. Phys., 4, 323–350, https://doi.org/10.5194/acp-4-323-2004, 2004.
Mikhailov, E., Vlasenko, S., Martin, S. T., Koop, T., and Pöschl, U.: Amorphous and crystalline aerosol particles interacting with water vapor: conceptual framework and experimental evidence for restructuring, phase transitions and kinetic limitations, Atmos. Chem. Phys., 9, 9491–9522, https://doi.org/10.5194/acp-9-9491-2009, 2009.
Mikhailov, E., Vlasenko, S., Rose, D., and Pöschl, U.: Mass-based hygroscopicity parameter interaction model and measurement of atmospheric aerosol water uptake, Atmos. Chem. Phys., 13, 717–740, https://doi.org/10.5194/acp-13-717-2013, 2013.
Mikhailov, E. F., Merkulov, V. V., Vlasenko, S. S., Ryshkevich, T. I., and Pöschl, U. J.: Filter-based differential hygroscopicity analyzer of aerosol particles, Izvestiya, Atmos. Ocean. Phys. 47, 747–759, doi.10.1134/S0001433811060107, 2011.
Mikhailov, E. F., Mironov, G. N., Pöhlker, C., Chi, X., Krüger, M. L., Shiraiwa, M., Förster, J.-D., Pöschl, U., Vlasenko, S. S., Ryshkevich, T. I., Weigand, M., Kilcoyne, A. L. D., and Andreae, M. O.: Chemical composition, microstructure, and hygroscopic properties of aerosol particles at the Zotino Tall Tower Observatory (ZOTTO), Siberia, during a summer campaign, Atmos. Chem. Phys., 15, 8847–8869, https://doi.org/10.5194/acp-15-8847-2015, 2015.
Miyajima, K., Sawada, M., and Nakagaki, M.: Studies on aqueous solutions of saccharides. I. Activity coefficients of monosaccharides in aqueous solutions at 25 ∘C, Bull. Chem. Soc. Jpn., 56, 1620–1623, https://doi.org/10.1246/bcsj.56.1620, 1983.
Miyawaki, O., Saito, A., Matsuio, T., and Nakamura, K.: Activity and activity coefficient of water in aqueous solutions and their relationships with solution structure parameters, Biosci. Biotech Biochem., 61, 466–469, https://doi.org/10.1271/bbb.61.466, 1997.
Mochida, M. and Kawamura, K.: Hygroscopic properties of levoglucosan and related organic compounds characteristic to biomass burning aerosol particles, J. Geophys. Res., 109, D21202, https://doi.org/10.1029/2004JD004962, 2004.
Müller, U., Schmidt-Ott, A., and Burtscher, H.: First measurement of gas adsorption to free ultrafine particles: O2 on Ag, Phys. Rev. Lett., 58, 1684, https://doi.org/10.1103/PhysRevLett.58.1684, 1987.
Nilsson, E., Swietlicki, E., Sjogren, S., Löndahl, J., Nyman, M., and Svenningsson, B.: Development of an H-TDMA for long-term unattended measurement of the hygroscopic properties of atmospheric aerosol particles, Atmos. Meas. Tech., 2, 313–318, https://doi.org/10.5194/amt-2-313-2009, 2009.
Pajunoja, A., Lambe, A. T., Hakala, J., Rastak, N., Cummings, M. J., Brogan, J. F., Hao, L., Paramonov, M., Hong, J., Prisle, N. L., Malila, J., Romakkaniemi, S., Lehtinen, K. E. J., Laaksonen, A., Kulmala, M., Massoli, P., Onasch, T. B., Donahue, N. M., Riipinen, I., Davidovits, P., Worsnop, D. R., Petäjä, T., and Virtanen, A.: Adsorptive uptake of water by semisolid secondary organic aerosols, Geophys. Res. Lett., 42, 3063–3068, https://doi.org/10.1002/2015GL063142, 2015.
Petters, M. D. and Kreidenweis, S. M.: A single parameter representation of hygroscopic growth and cloud condensation nucleus activity, Atmos. Chem. Phys., 7, 1961–1971, https://doi.org/10.5194/acp-7-1961-2007, 2007.
Petters, S. S. and Petters, M. D.: Surfactant effect on cloud condensation nuclei for two-component internally mixed aerosols, J. Geophys. Res.-Atmos., 121, 1878–1895, https://doi.org/10.1002/2015JD024090, 2016.
Petters, M. D., Wex, H., Carrico, C. M., Hallbauer, E., Massling, A., McMeeking, G. R., Poulain, L., Wu, Z., Kreidenweis, S. M., and Stratmann, F.: Towards closing the gap between hygroscopic growth and activation for secondary organic aerosol – Part 2: Theoretical approaches, Atmos. Chem. Phys., 9, 3999–4009, https://doi.org/10.5194/acp-9-3999-2009, 2009.
Pöschl, U.: Atmospheric aerosols: composition, transformation, climate and health effects, Angew. Chem.-Int. Edit., 44, 7520–7540, https://doi.org/10.1002/anie.200501122, 2005.
Rader, D. J. and McMurry, P. H.: Application of the Tandem Differential Mobility Analyzer to studies of droplet growth and evaporation, J. Aerosol Sci., 17, 771–788, https://doi.org/10.1016/0021-8502(86)90031-5, 1986.
Rastak, N., Silvergren, S., Zieger, P., Wideqvist, U., Ström, J., Svenningsson, B., Maturilli, M., Tesche, M., Ekman, A. M. L., Tunved, P., and Riipinen, I.: Seasonal variation of aerosol water uptake and its impact on the direct radiative effect at Ny-Ålesund, Svalbard, Atmos. Chem. Phys., 14, 7445–7460, https://doi.org/10.5194/acp-14-7445-2014, 2014.
Robinson, R. A. and Stokes, R. H.: Electrolyte solutions, 2nd ed., Butterworths, London, 1970.
Romakkaniemi, S., Hämeri, K., Väkeva, M., and Laaksonen, A.: Adsorption of water on 8–15 nm NaCl and (NH4)2SO4 aerosols measured using an ultrafine tandem differential mobility analyzer, J. Phys. Chem. A, 105, 8183–8188, https://doi.org/10.1021/jp010647l, 2001.
Rose, D., Gunthe, S. S., Mikhailov, E., Frank, G. P., Dusek, U., Andreae, M. O., and Pöschl, U.: Calibration and measurement uncertainties of a continuous-flow cloud condensation nuclei counter (DMT-CCNC): CCN activation of ammonium sulfate and sodium chloride aerosol particles in theory and experiment, Atmos. Chem. Phys., 8, 1153–1179, https://doi.org/10.5194/acp-8-1153-2008, 2008.
Rovelli, G., Miles, R. E. H., Reid, J. P., and Clegg, S. L.: Accurate measurements of aerosol hygroscopic growth over a wide range in relative humidity, J. Phys. Chem. A, 120, 4376–4388, https://doi.org/10.1021/acs.jpca.6b04194, 2016.
Rudakov, A. M. and Sergievskii, V. V.: The Dependence of the Osmotic Coefficient on the Composition of Multicomponent Solutions, Russian J. Phys. Chem. A, 83, 1326–1330, https://doi.org/10.1134/S0036024409080147, 2009.
Ruehl, C. R., Chuang, P. Y., and Nenes, A.: Aerosol hygroscopicity at high (99 to 100 %) relative humidities, Atmos. Chem. Phys., 10, 1329–1344, https://doi.org/10.5194/acp-10-1329-2010, 2010.
Shiraiwa, M., Zuend, A., Bertram, A. K., and Seinfeld, J. H.: Gas-particle partitioning of atmospheric aerosols: interplay of physical state, non-ideal mixing and morphology, Phys. Chem. Chem. Phys., 15, 11441–11453, https://doi.org/10.1039/C3CP51595H, 2013.
Sorjamaa, R. and Laaksonen, A.: The effect of H2O adsorption on cloud drop activation of insoluble particles: a theoretical framework, Atmos. Chem. Phys., 7, 6175–6180, https://doi.org/10.5194/acp-7-6175-2007, 2007.
Stratmann, F., Kiselev, A., Wurzler, S., Wendisch, M., Heintzenberg, J., Charlson, R. J., Diehl, K., Wex, H., and Schmidt, S.: Laboratory Studies and Numerical Simulations of Cloud Droplet Formation under Realistic Supersaturation Conditions, J. Atmos. Ocean. Tech., 21, 876–887, https://doi.org/10.1175/1520-0426(2004)021<0876:LSANSO>2.0.CO;2, 2004.
Suda, S. R. and Petters, M. D.: Accurate determination of aerosol activity coefficients at relative humidities up to 99 % using the hygroscopicity tandem differential mobility analyzer technique, Aerosol Sci. Technol., 47, 991–1000, https://doi.org/10.1080/02786826.2013.807906, 2013.
Swietlicki, E., Hansson, H.-C., Hämeri, K., Svenningsson, B., Massling, A., McFiggans, G., McMurry, P. H., Petäjä, T., Tunved, P., Gysel, M., Topping, D., Weingartner, E., Baltensperger, U., Rissler, J., Wiedensohler, A., and Kulmala M.: Hygroscopic properties of submicrometer atmospheric aerosol particles measured with H-TDMA instruments in various environments – a review, Tellus, 60B, 432–469, https://doi.org/10.1111/j.1600-0889.2008.00350.x, 2008.
Tang, I. N. and Munkelwitz, H. R.: Water activities, densities, and refractive indices of aqueous sulfates and sodium nitrate droplets of atmospheric importance, J. Gephys. Res., 99, 18801–18808, https://doi.org/10.1029/94JD01345, 1994.
Tang, M., Chan, C. K., Li, Y. J., Su, H., Ma, Q., Wu, Z., Zhang, G., Wang, Z., Ge, M., Hu, M., He, H., and Wang, X.: A review of experimental techniques for aerosol hygroscopicity studies, Atmos. Chem. Phys., 19, 12631–12686, https://doi.org/10.5194/acp-19-12631-2019, 2019.
Taylor, J. B. and Rowlinson, J. S.: The thermodynamic properties of aqueous solutions of glucose, Trans. Faraday Soc., 51, 1183–1192, https://doi.org/10.1039/TF9555101183, 1955.
Wang, Z., King, S. M., Freney, E., Rosenoern, T., Smith, M. L., Chen, Q., Kuwata, M., Lewis, E. R., Pöschl, U., Wang, W., Buseck, P. R., and Martin, S. T.: The dynamic shape factor of sodium chloride nanoparticles as regulated by drying rate, Aerosol Sci. Technol., 44, 939–953, https://doi.org/10.1080/02786826.2010.503204, 2010.
Weingartner, E., Gysel, M., and Baltensperger, U.: Hygroscopicity of aerosol particles at low temperatures. 1. New low-temperature H-TDMA instrument: setup and first applications, Environ. Sci. Technol., 36, 55–62, https://doi.org/10.1021/es010054o, 2002.
Weis, D. D. and Ewing, G. E.: Water content and morphology of sodium chloride aerosol particles, J. Geoph. Res., 104, 21275–21285, https://doi.org/10.1029/1999JD900286, 1999.
Wex, H., Kiselev, A., Stratmann, F., Zoboki, J., and Brechtel, F.: Measured and modeled equilibrium sizes of NaCl and (NH4)2SO4 particles at relative humidities up to 99.1 %, J. Geophys. Res.-Atmos, 110, D21212, https://doi.org/10.1029/2004JD005507, 2005.
Wex, H., Petters, M. D., Carrico, C. M., Hallbauer, E., Massling, A., McMeeking, G. R., Poulain, L., Wu, Z., Kreidenweis, S. M., and Stratmann, F.: Towards closing the gap between hygroscopic growth and activation for secondary organic aerosol: Part 1 – Evidence from measurements, Atmos. Chem. Phys., 9, 3987–3997, https://doi.org/10.5194/acp-9-3987-2009, 2009.
Wexler, A. S. and Clegg, S. L.: Atmospheric Aerosol Models for Systems Including the Ions H+, , Na+, , , Cl−, Br−, and H2O, J. Geophys. Res., 107, 4207, https://doi.org/10.1029/2001JD000451, 2002.
Willeke, K. and Baron, P. A.: Aerosol measurements-Principles, Techniques, and Applications, Van Nostrand Reinhold, New York, 1993.
Yeşilbaş, M. and Boily, J.-F.: Particle size controls on water adsorption and condensation regimes at mineral surfaces, Sci. Rep.-UK, 6, 32136, https://doi.org/10.1038/srep32136, 2016.
Zamora, I. R., Tabazadeh, A., Golden, D. M., and Jacobson, M. Z.: Hygroscopic growth of common organic aerosol solutes, including humic substances, as derived from water activity measurements, J. Geophys. Res., 116, D23207, https://doi.org/10.1029/2011JD016067, 2011.
Zelenyuk, A., Cai, Y., and Imre, D.: From agglomerates of spheres to irregularly shaped particles: Determination of dynamic shape factors from measurements of mobility and vacuum aerodynamic diameters, Aerosol Sci. Technol., 40, 197–217, https://doi.org/10.1080/02786820500529406, 2006.
Zhao, L., Wang, F., Zhang, K., Zeng, Q., and Zhang, Y.: Deliquescence and efflorescence processes of aerosol particles studied by in situ FTIR and Raman spectroscopy, Chin. J. Chem. Phys., 21, 1–11, https://doi.org/10.1088/1674-0068/21/01/1-11, 2008.
Zieger, P., Fierz-Schmidhauser, R., Weingartner, E., and Baltensperger, U.: Effects of relative humidity on aerosol light scattering: results from different European sites, Atmos. Chem. Phys., 13, 10609–10631, https://doi.org/10.5194/acp-13-10609-2013, 2013.