the Creative Commons Attribution 4.0 License.
the Creative Commons Attribution 4.0 License.
 | 14 May 2020
Mind the gap – Part 1: Accurately locating warm marine boundary layer clouds and precipitation using spaceborne radars
Pavlos Kollias
Alessandro Battaglia
Simon Preval
Ground-based radar observations show that, over the eastern North Atlantic, 50 % of warm marine boundary layer (WMBL) hydrometeors occur below 1.2 km and have reflectivities of < −17 dBZ, thus making their detection from space susceptible to the extent of surface clutter and radar sensitivity.
Surface clutter limits the ability of the CloudSat cloud profiling radar (CPR) to observe the true cloud base in ∼52 % of the cloudy columns it detects and true virga base in ∼80 %, meaning the CloudSat CPR often provides an incomplete view of even the clouds it does detect. Using forward simulations, we determine that a 250 m resolution radar would most accurately capture the boundaries of WMBL clouds and precipitation; that being said, because of sensitivity limitations, such a radar would suffer from cloud cover biases similar to those of the CloudSat CPR.
Observations and forward simulations indicate that the CloudSat CPR fails to detect 29 %–43 % of the cloudy columns detected by ground-based sensors. Out of all configurations tested, the 7 dB more sensitive EarthCARE CPR performs best (only missing 9.0 % of cloudy columns) indicating that improving radar sensitivity is more important than decreasing the vertical extent of surface clutter for measuring cloud cover. However, because 50 % of WMBL systems are thinner than 400 m, they tend to be artificially stretched by long sensitive radar pulses, hence the EarthCARE CPR overestimation of cloud top height and hydrometeor fraction.
Thus, it is recommended that the next generation of space-borne radars targeting WMBL science should operate interlaced pulse modes including both a highly sensitive long-pulse mode and a less sensitive but clutter-limiting short-pulse mode.
- Article
(4158 KB) - Companion paper
- BibTeX
- EndNote


Because of their ubiquitous nature and the way they interact with solar and longwave radiation, warm marine boundary layer (WMBL) clouds play a crucial role in the global energy budget (Klein and Hartmann, 1993). Unfortunately, numerical models still struggle to properly represent their coverage, vertical distribution and brightness (e.g., Nam et al., 2012). This uncertainty ultimately affects our confidence in future climate projections (Bony et al., 2015; Sherwood et al., 2014). Collecting additional observations of the macrophysical and microphysical properties of WMBL clouds could lead to improvements in our understanding of the relationships between low-level clouds and their environment while also contributing to improving climate simulations through their intercomparison.
Millimeter-wavelength radar signals, because of their ability to penetrate clouds, have long been used to document the vertical distribution of WMBL clouds (e.g., Haynes et al., 2011; Sassen and Wang, 2008) and their internal structure (e.g., Bretherton et al., 2010; Dong and Mace, 2003; Huang et al., 2012; Lamer et al., 2015) as well as to identify precipitation (e.g., Ellis et al., 2009; Leon et al., 2008; Rapp et al., 2013) and characterize its vertical structure (e.g., Burleyson et al., 2013; Comstock et al., 2005; Frisch et al., 1995; Kollias et al., 2011). However, the representativeness of radar observations largely depends on factors such as coverage, radar sensitivity, and resolution and on the presence of clutter.
Spaceborne radars are often preferred over ground-based and airborne ones because of their ability to cover vast areas of the globe (Battaglia et al., 2020a). The first spaceborne cloud profiling radar (CPR) designed to detail the vertical structure of clouds was launched in 2006 on board CloudSat (Stephens et al., 2002). The CloudSat CPR is still operational; it transmits a 3.3 µs pulse with a 1.4 km field of view at the surface and can achieve a sensitivity of −28 dBZ after its measurements are averaged over 0.32 s time intervals and sampled at 0.16 s along its nadir track (Stephens et al., 2002). However, the CloudSat CPR's long powerful pulse also generates a surface clutter echo which tends to partially mask signals from cloud and precipitation forming below circa 1 km (Marchand et al., 2008). For this reason, the CloudSat CPR's actual ability to document WMBL clouds and precipitation remains uncertain.
A comparison of various satellite-based cloud products suggests that globally the CloudSat CPR can only detect roughly 30 %–50 % of all WMBL cloud-containing atmospheric columns (Christensen et al., 2013; Liu et al., 2016, 2018; Rapp et al., 2013). According to Christensen et al. (2013) most of the CloudSat CPR cloud cover bias is due to the CPR's inability to detect clouds forming entirely within the region occupied by its surface clutter. Rapp et al. (2013) instead attribute this deficiency mainly to the CloudSat CPR's sensitivity which they believe is insufficient for detecting the small droplets that compose WMBL clouds like those that form in the southeastern Pacific region. However, in another study, Liu et al. (2018) concluded that the coarse resolution of the CloudSat CPR has more of an impact on its ability to detect all cloudy columns than surface clutter and limited sensitivity. Such a lack of consensus makes designing superior radar architectures for future spaceborne missions more complicated. Also, because most existing CloudSat CPR performance assessments are based on observations from (visible) sensors that cannot penetrate cloud top, there is little to no information about the CloudSat CPR's ability to holistically document the vertical structure of those cloudy columns it detects (i.e., to provide information on cloud from cloud top to cloud base and on virga and rain below cloud).
It is not uncommon to rely on observations collected by highly sensitive airborne and ground-based millimeter radar observations to assess the performance of coarser less sensitive radars (e.g., Burns et al., 2016; Lamer and Kollias, 2015). Such observations have allowed Stephens et al. (2002) to conclude that, based on sensitivity alone, the CloudSat CPR should only be able to detect 70 % of marine boundary layer cloud segments. A study considering the impact of the CloudSat CPR's rather coarse vertical resolution, large horizontal field of view and surface clutter would complement this preliminary work and allow for a more rigorous quantification of the CPR's ability to document the vertical distribution of cloud fraction.
Instrument geometry effects are best accounted for in forward simulators. Using ground-based observations and an instrument forward simulator, Burns et al. (2016) determined that the CloudSat CPR's successor, the EarthCARE CPR (Illingworth et al., 2015), will only detect 70 %–80 % of WMBL cloud segments; moreover its coarse vertical resolution (500 m, same as the CloudSat CPR) will introduce significant biases into reported cloud boundaries. These results however likely need be revised since changes have since been made to the design of this joint European Space Agency (ESA) and Japan Aerospace Exploration Agency (JAXA) spaceborne mission (https://earth.esa.int/web/guest/missions/esa-future-missions/earthcare, last access: 30 April 2020).
Along those lines, the current study relies on the use of instrument forward simulators and on observations collected by the ground-based Ka-band ARM Zenith radar (KAZR) and the ceilometer operating at the Atmospheric Radiation Measurement (ARM) program Eastern North Atlantic (ENA) facility to document the properties of WMBL clouds and precipitation with the goals of
-
quantifying the CloudSat CPR's ability to estimate WMBL cloud coverage and vertical distribution as well as its accuracy in determining the location of cloud tops and cloud and virga bases (Sect. 3),
-
identifying which property (thickness, reflectivity, vertical location) of WMBL clouds and precipitation mostly complicates their detection from space (Sect. 4), and
-
evaluating the performance of alternative radar configurations designed for an optimum characterization of WMBL clouds and precipitation (Sect. 5).
This study focuses on evaluating how well spaceborne CPRs are able to document the properties of warm marine boundary layer (WMBL) clouds. We define WMBL clouds as cloudy columns with the highest cloud top below 5.5 km or 500 mbar and warmer than 0 ∘C. This definition limits our analysis to WMBL regimes not associated with mid- or high-level clouds aloft but does not exclude periods where multiple WMBL cloud layers overlap.
The next subsections describe how we extracted cloud and precipitation information from raw CloudSat CPR data to evaluate its performance (Sect. 2.1), ARM measurements which provide a benchmark (Sect. 2.2), and how we forward-simulated alternative spaceborne radar configurations (Sect. 2.3).
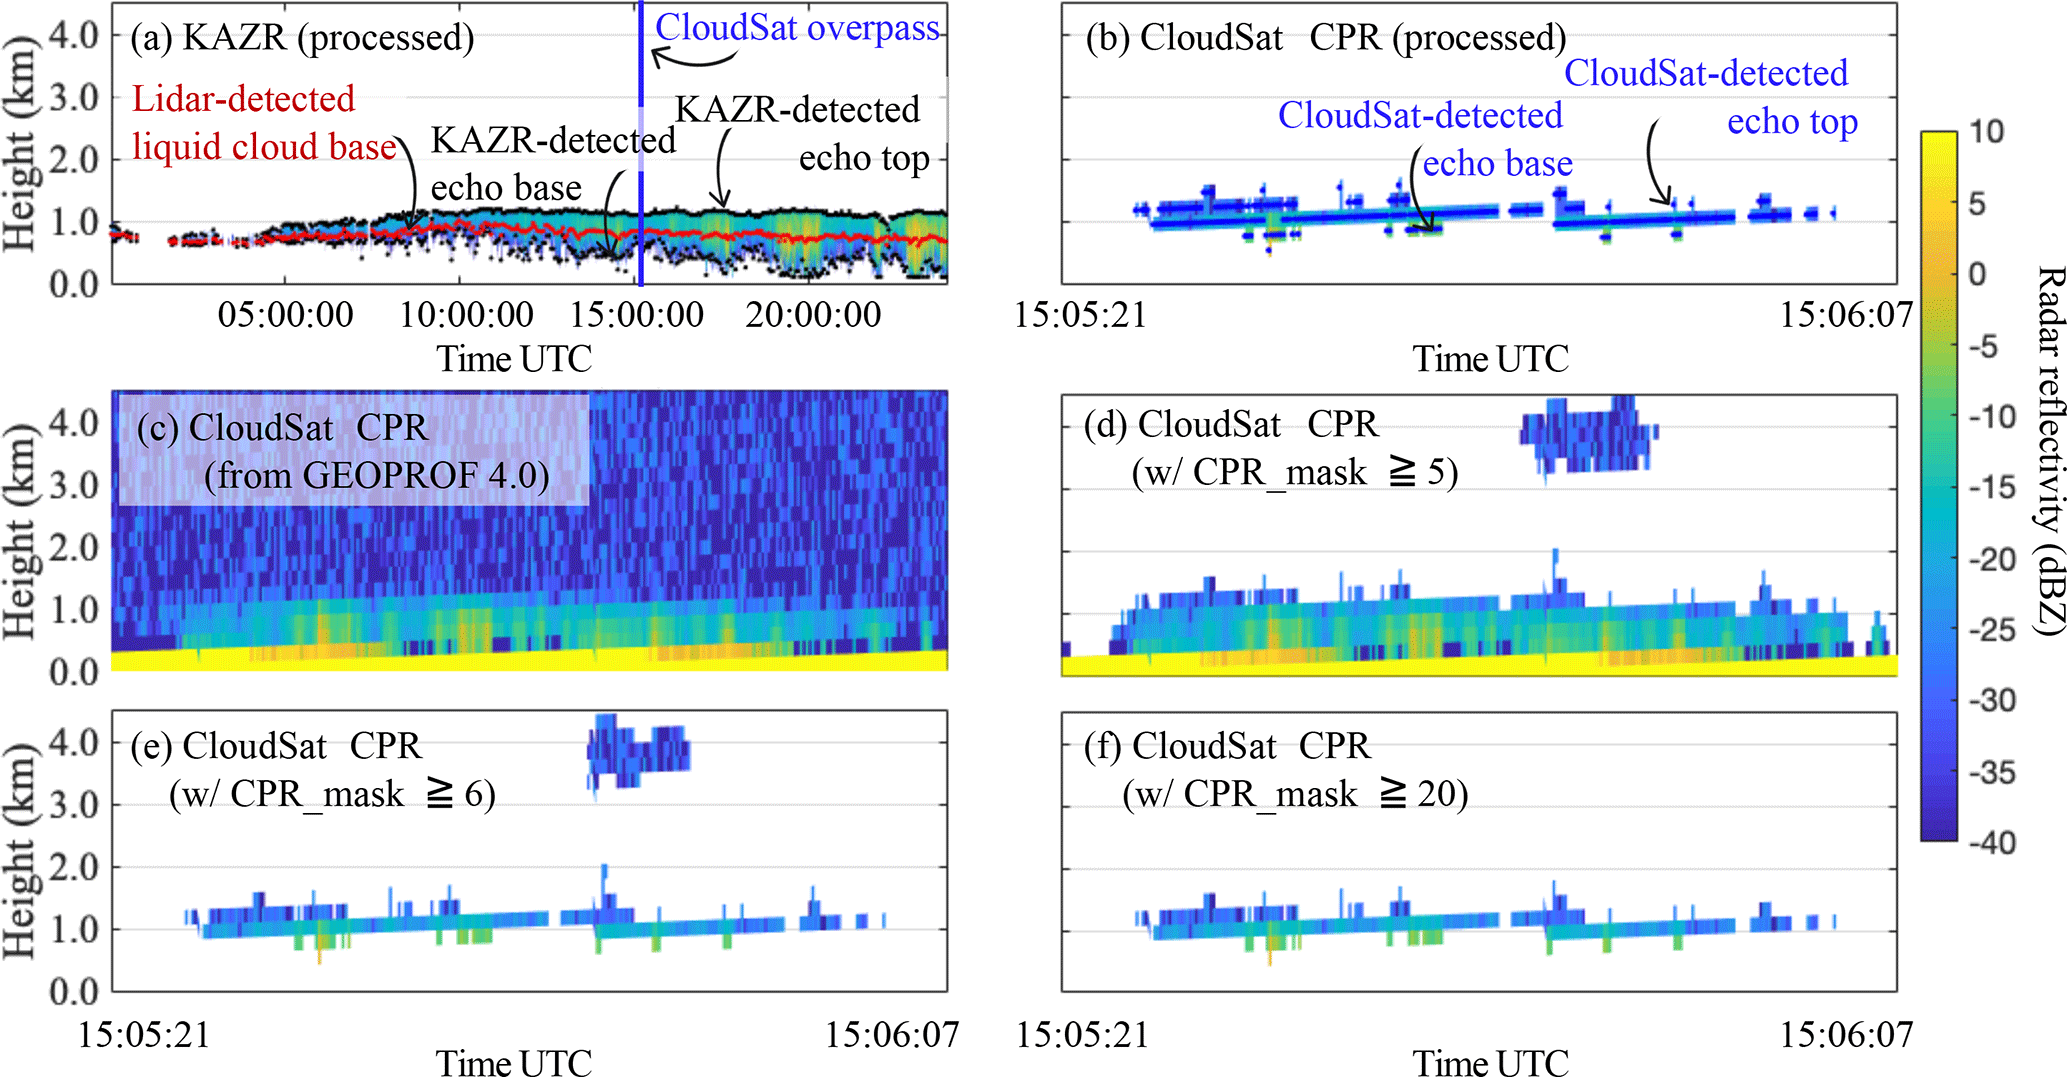
Figure 1Hydrometeor radar reflectivity measured on 27 February 2016 (a) by the KAZR located at the Eastern North Atlantic (ENA) observatory over the course of 24 h and (b) by the CloudSat CPR when it overpassed the 200 km radius region around the KAZR between 15:05:21 and 15:06:07 UTC. In (a) the blue line marks the time when CloudSat overpassed the KAZR, the red dots represent the location of the ceilometer-determined cloud base and the black dots represent the boundaries of the KAZR radar echo; the latter coincides with the center of the first and last radar range gates containing signal (postprocessing). In (b) blue dots represent the boundaries of the CloudSat CPR radar echo; they coincide with the center of the first and last radar range gates containing signal (postprocessing). Also plotted are the CloudSat radar reflectivity (c) raw, (d) for significant returns (CPR_mask ≥5), (e) for echoes deemed very weak and stronger (CPR_mask ≥6), and (f) for echoes deemed weak and stronger (CPR_mask ≥20).
2.1 CloudSat spaceborne W-band radar observations
The CloudSat CPR has been collecting observations since May 2006. It follows a Sun-synchronous orbit set to cross the Equator at 13:30 local time, repeating its ground track every 16 d. The CloudSat CPR went offline between May and October 2011 because of a spacecraft battery failure. After it returned online, it was placed in daylight-only mode (Stephens et al., 2018). Periods when CloudSat passed within a 200 km radius of the ARM ENA ground-based facility are used to evaluate the CloudSat CPR's ability to characterize WMBL clouds and precipitation (results presented in Sect. 3); this has happened on 138 instances since the ground-based site was made permanent at the end of 2015. For this site, daylight-mode operations make it such that data are collected only around 15:00 UTC between August and April but at both 04:00 and 15:00 UTC between May and July. The GEOPROF granules (algorithm version 4.0) corresponding to these overpasses were identified and extracted for analysis following the method of Protat et al. (2009). Variables taken from this product include Radar_Reflectivity, CPR_Cloud_mask (hydrometeor echo mask) and CPR_Echo_Top (cloud type classification). An example of raw radar reflectivity observations collected by the CloudSat CPR on 27 February 2016 is given in Fig. 1c.
The GEOPROF product provides observations sampled every ∼240 m in range and ∼1.0 km along-track taken from the CloudSat CPR native 500 m range resolution and ∼1.7 km along-track by 1.3 km across-track field of view (Stephens et al., 2002; Tanelli et al., 2008). The CloudSat CPR's raw radar reflectivity measurements are filtered for clutter and noise using CPR_Cloud_mask. Progressively more aggressive masks were applied until a compromise was reached between the number of detectable hydrometeors and the amount of remaining noise. Radar reflectivities were first masked for bad and missing echoes (mask value −9; Fig. 1d) and then for echoes with significant return power likely affected by – or resulting from – surface clutter (mask value 5; Fig. 1e). Comparison of Fig. 1d and e illustrate that a majority of the hydrometeor echoes with significant return power are deemed affected by the surface clutter echo and that following their removal the CloudSat CPR's ability to detect clouds and precipitation appears significantly reduced. Since further removing echoes labeled as very weak (mask value 6–20) helped clean up the remaining radar reflectivity time–height image while minimally affecting the number of detected hydrometeor echoes, our evaluation of the CloudSat CPR's performance is based only on echoes deemed weak to strong (mask value ≥20; Fig. 1f). According to estimates by Marchand et al. (2008) these echoes should have less than a 5 % chance of being false hydrometeor detections.
WMBL clouds are isolated using the CPR_Echo_Top mask; profiles with high clouds (mask value 2), midlevel clouds (mask value 3) and multilayer clouds (mask value 5) are filtered out, leaving low-level clouds and clear and undetermined profiles (mask values 4, 1 and 0, respectively; Fig. 1b). We additionally filter out profiles that have their maximum reflectivity more than 150 m away the location corresponding to 0 m height; this last step is intended to identify profiles for which the CloudSat CPR was mispointing, which creates a vertical offset in the surface peak return.
2.2 ARM ground-based observations
The ARM program's KAZR is a 34.86 GHz (i.e., Ka-band) radar capable of generating a 4 µs long vertical pulse creating a 0.3∘ wide 3 dB beamwidth. Following signal integration (1 s, 6000 pulses), this radar achieves a −44 dBZ minimum detectable signal (MDS) at 1 km. The KAZR is able to collect observations from 87 m above ground to 18 km at a ∼30 m vertical resolution and 2 s time resolution (Lamer et al., 2019). Because the KAZR's observations are not oversampled in the vertical, they are considered more independent than that of the CloudSat CPR.
We analyze the complete data record collected between October 2015 and November 2017 (719 d) to (1) characterize the properties of WMBL clouds and precipitation (results in Sect. 4) and (2) to evaluate the performance of theoretical radar architectures in detecting those clouds (results in Sect. 5). This period also includes the 138 CloudSat overpasses, which we analyze separately to identify gaps specific to the currently deployed CloudSat CPR (results in Sect. 3).
For each analysis, we extract several complementary datasets from the ARM archive: (i) KAZR general mode (processing level a1) – reflectivity, snr_copol (copolar signal-to-noise ratio); (ii) ceilometer – first_cloud_base_height; (iii) Parsivel laser disdrometer – equivalent radar reflectivity; and (iv) radiosonde – temperature.
KAZR signal-to-noise ratio measurements are used as input to the Hildebrand and Sekhon (1974) algorithm to distinguish significant echoes (hydrometeors and clutter) from noise. Liquid cloud base height determination from a collocated ceilometer is used to isolate radar echoes associated with cloud (above the first liquid cloud base height) and precipitation (below the first liquid cloud base height) and to filter out clutter in the subcloud layer. Clutter filtering is based on the argument that precipitation falling from cloud base should be continuous; thus any echo in the subcloud layer detached from the main echo is labeled as clutter and is filtered out. All echoes thinner than 90 m (three range gates) are also labeled as clutter and filtered out; comparison with the ceilometer confirms that this step does not lead to the removal of cloudy echoes. An example of processed radar reflectivity from the KAZR is depicted in Fig. 1a.
Filtered KAZR radar reflectivity measurements are corrected for gas attenuation following Rosenkranz (1998) and calibrated using observations collected during light precipitation events by the collocated surface-based Parsivel laser disdrometer as well as using observations from the CloudSat CPR collected over a small radius around the site following Kollias et al. (2019).
WMBL cloud profiles are isolated from ice and high-cloud-containing profiles using KAZR radar reflectivity and sonde temperature information. Only profiles having echoes below 5.5 km or below the height of the 0 ∘C isotherm, whichever one is lowest, are considered in this analysis.
2.3 Forward simulations based on ground-based KAZR observations
Forward simulations are conducted to improve our understanding of the CloudSat CPR limitations and to identify possible modifications which could lead to improvements in the detection of WMBL clouds (results in Sect. 5). We forward simulate seven radar architectures. The first four are based on the CloudSat CPR's current configuration gradually improving each of its capabilities until it matches the configuration of the EarthCARE CPR. The EarthCARE CPR design includes several improvements over CloudSat, namely
-
a new asymmetrical point target response,
-
enhanced sensitivity,
-
a smaller field of view and integration distance, and
-
increased range oversampling.
The EarthCARE CPR will also be the first spaceborne atmospheric radar capable of documenting the movement of hydrometeors. This capability has been evaluated in several publications such as Schutgens (2008), Battaglia et al. (2013), Kollias et al. (2014), Sy et al. (2014) and Burns et al. (2016) and is beyond the scope of this study. The last two architectures are based on propositions made in the context of the future Aerosol and Cloud, Convection and Precipitation (ACCP) mission of the National Aeronautics and Space Administration (NASA; https://science.nasa.gov/earth-science/decadal-accp, last access: 30 April 2020). They both have increased range resolution but reduced sensitivity. Specifications for each radar configuration are given in Table 1 and Fig. 2.
Table 1Specifications of the forward-simulated radar configurations including information about whether or not their pulse-weighting function is symmetrical (sym.) or asymmetrical (asym.) in either the vertical or the along-track dimension.
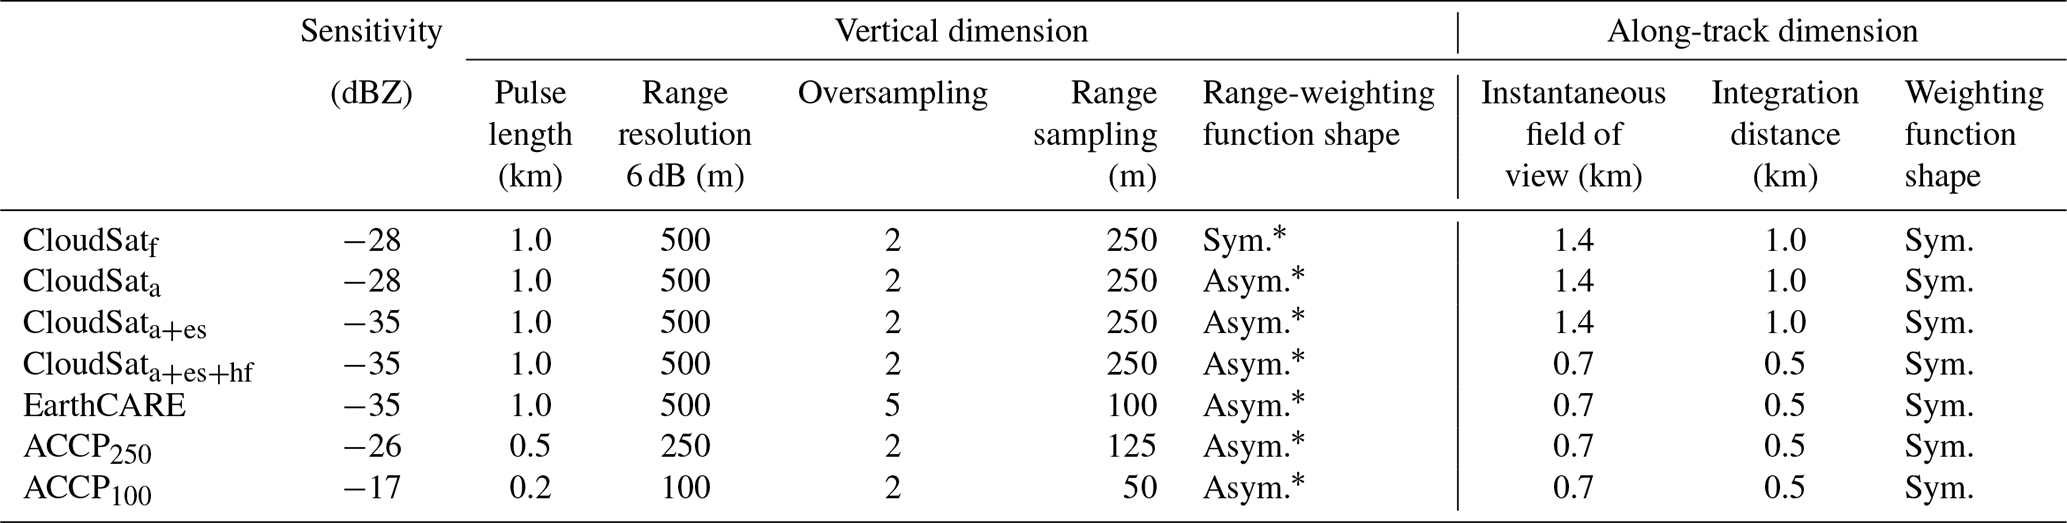
* Shape of the range-weighting function is depicted in Fig. 2.
Processed (i.e., filtered, corrected and calibrated) KAZR radar reflectivity observations (time–height) are used as input to the forward simulators. First, assuming a constant horizontal wind speed of 10 m s−1, the KAZR time axis is converted to horizontal distance. Then, to emulate the surface reflectivity which is not seen by the KAZR, an artificial surface echo is added to the processed KAZR reflectivity field at 0 m altitude (see Appendix A for more information on how real CloudSat CPR observations were used to construct this surface echo). Each spaceborne radar configuration is simulated first by horizontally convolving the high-resolution (30 m×20 m) KAZR reflectivity fields using an along-track weighting function represented using a symmetrical Gaussian distribution covering a distance equivalent to 2 times the along-track field of view and then by vertically convolving the horizontally convolved reflectivity field using either of the two range-weighting functions depicted in Fig. 2. The asymmetrical range-weighting function is modeled after the point target response of the EarthCARE CPR which was obtained from prelaunch testing of the EarthCARE CPR (mission's engineering team personal communications, 2019). The symmetrical range-weighting function used (only) for the CloudSatf forward simulation is modeled using a Gaussian distribution adjusted to produce a surface clutter echo profile similar to that observed by the CloudSat CPR postlaunch (more information in Appendix A). Finally, along-track integration is emulated by averaging the convolved profiles in sections dictated by the integration distance of each spaceborne radar without overlap between the sections. Note that these forward simulations are two dimensional and as such do not capture cross-track effects; also note that liquid attenuation and noise are not represented.
For cloud and precipitation characterization, the forward-simulated radar reflectivity fields are finally filtered for surface clutter (akin to reproducing the type of filtering achieved by applying the CPR_Cloud_mask). To do this, forward simulations of clear-sky conditions are used to estimate the vertical extent and intensity of surface clutter. For each radar configuration, for all heights affected by surface clutter, the clear-sky surface clutter reflectivity is removed from the forward-simulated radar reflectivity and only echoes with reflectivity at least 3 dB above the surface clutter reflectivity are conserved and deemed reliable. Otherwise, for all heights above the surface clutter, only those echoes with reflectivity below the radar MDS are filtered out.
2.4 Evaluation metrics
Radars alone do not have the capability to distinguish between clouds and precipitation. For this reason, we often refer to clouds and precipitation as hydrometeor layers. The current study aims to characterize
- i.
the base of the lowest hydrometeor layer (cloud or virga base being indistinguishable), which we take to be the height of the lowest radar echo in the profile;
- ii.
the top of the highest hydrometeor layer (i.e., cloud top), which we take to be the height of the highest radar echo in the profile; and
- iii.
the depth covered by hydrometeor layers, which we estimate as the distance between the top of the highest hydrometeor layer and the base of the lowest hydrometeor layer.
Note that we report hydrometeor boundary heights at the center point of each radar's vertical range gate and not as its upper or lower limit. This distinction, while seemingly insignificant for radars operating at a fine-range sampling (e.g., KAZR 30 m), can become important for radar systems with a coarse-range sampling (e.g., the CloudSat CPR 240 m).
We also estimate over the entire observation periods
- i.
hydrometeor cover, defined as the sum of all profiles containing at least one WMBL hydrometeor echo divided by the total number of observed profiles (excluding those determined to contain high, deep or ice clouds), and
- ii.
the hydrometeor fraction profile, which we take to be the number of WMBL hydrometeor echoes at each height divided by the total number of observed profiles (excluding those determined to contain high, deep or ice clouds).
Figure 1 illustrates examples of observations collected on 27 February 2016 near the ENA observatory. The ground-based KAZR radar and ceilometer detected the presence of a thin (up to ∼270 m) cloud layer whose properties varied throughout the day. Between 00:00 and 10:00 UTC (23:00 and 09:00 local time), cloud top height was observed to rise at a rate of roughly 21 m h−1. Shortly after 10:00 UTC, the KAZR detected signs of drizzle below the ceilometer-detected cloud base height at 941 m. The vertical extent of this drizzle was observed to increase over the course of the day, until it eventually reached 87 m altitude (the lowest altitude at which the KAZR measures) around 20:00 UTC. Besides changes in cloud top and hydrometeor layer base height, the KAZR also measured changes in radar reflectivity over the course of the day with more intense radar reflectivity recorded coincidently with deeper drizzle shafts.
At 15:05 UTC, CloudSat overpassed within 200 km of the KAZR and ceilometer location (marked by the blue line in Fig. 1a). Although the subset of noise-and-clutter-filtered CloudSat CPR observations shows the presence of a hydrometeor layer, the hydrometeor layer detected by the CloudSat CPR had breaks, a higher top (1.28 vs. 1.07 km) and a higher base (1.15 vs. 0.51 km) than that detected by the KAZR, misleadingly making it appear thinner overall (Fig. 1b).
To illustrate how the aforementioned example is representative of the general picture of the WMBL cloud regimes at the ENA, we also compared statistics of hydrometeor layer properties estimated for all instances where CloudSat overpassed within 200 km of the ENA and boundary layer clouds were the dominant cloud type (Figs. 3 and 4; 103 out of the 138 overpasses). For this comparison, only KAZR and ceilometer observations taken within ±1 h of the overpass time are considered. The predominance of boundary layer clouds is established using KAZR observations. Instances with fewer than 30 % (in time) high or cold clouds are deemed dominated by boundary layer clouds; high or cold clouds present in these instances (if any) are filtered out of the analysis. This region size (for the spaceborne observations) and time period (for the ground-based observations) were selected to match those of Protat et al. (2009) and constitute a compromise between keeping the domain size small enough to maintain its homogeneity (∼99 % ocean by area) and capturing a number of cases large enough to reach statistical significance (103 overpasses).
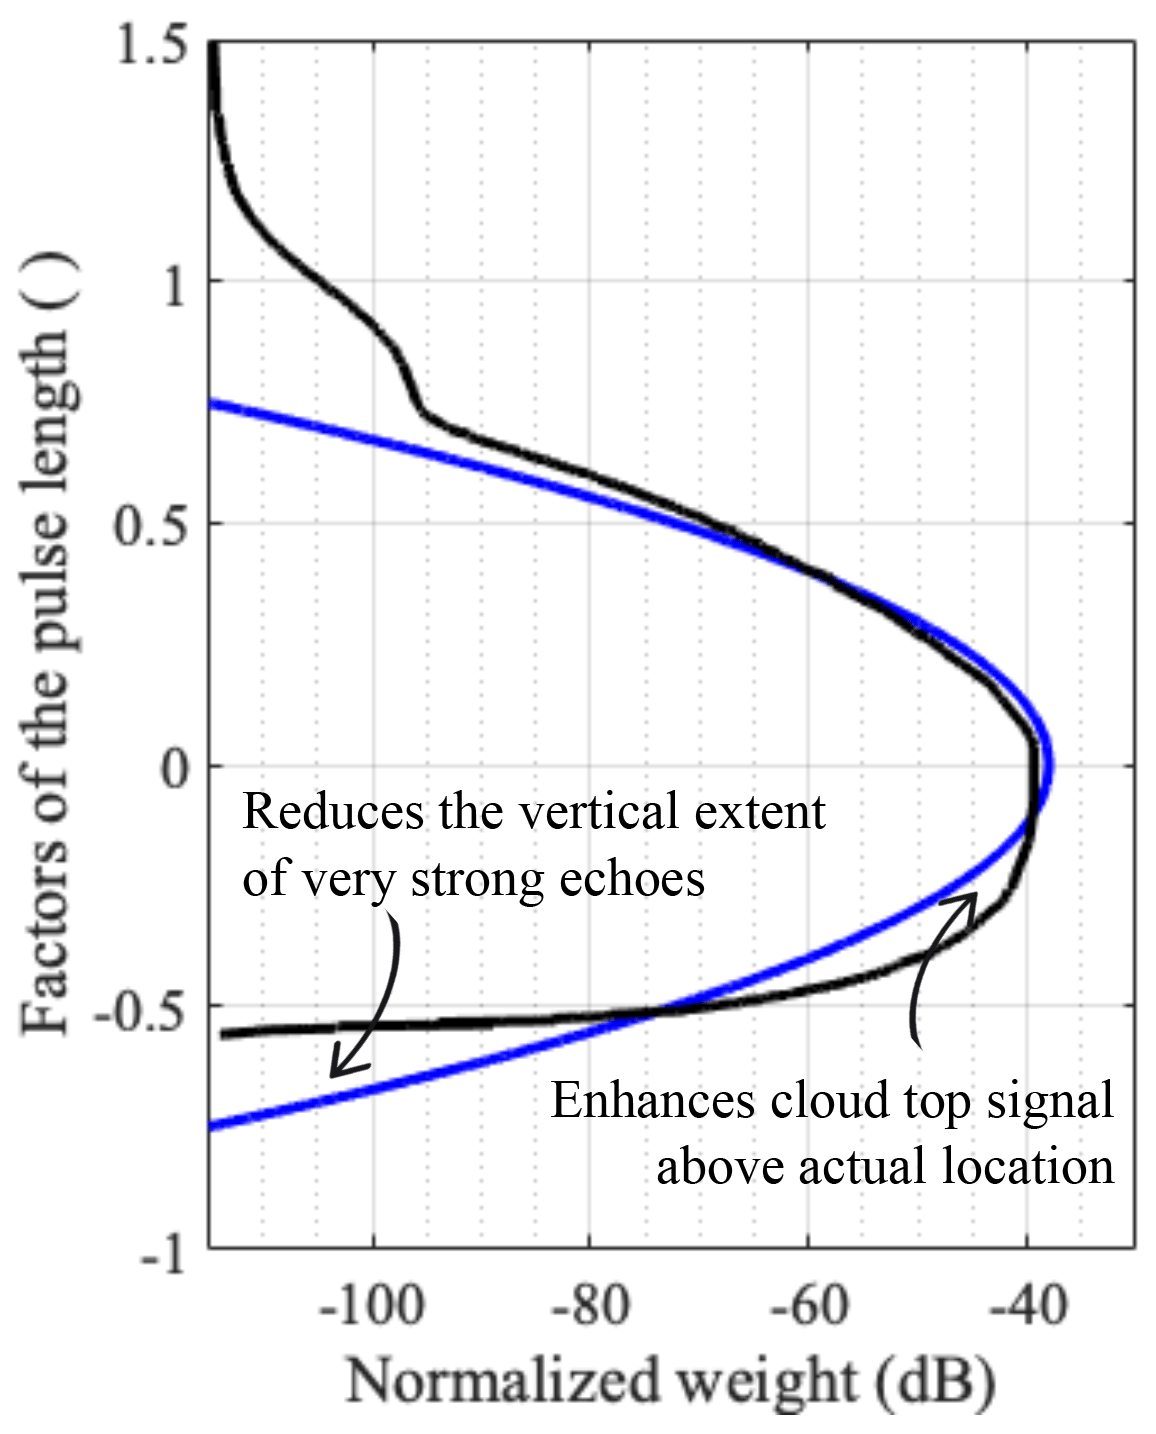
Figure 2Symmetrical (blue) and asymmetrical (black) range-weighting functions for the forward-simulated radar architectures detailed in Table 1. Negative values are associated with the leading edge of the pulse in the direction of propagation.
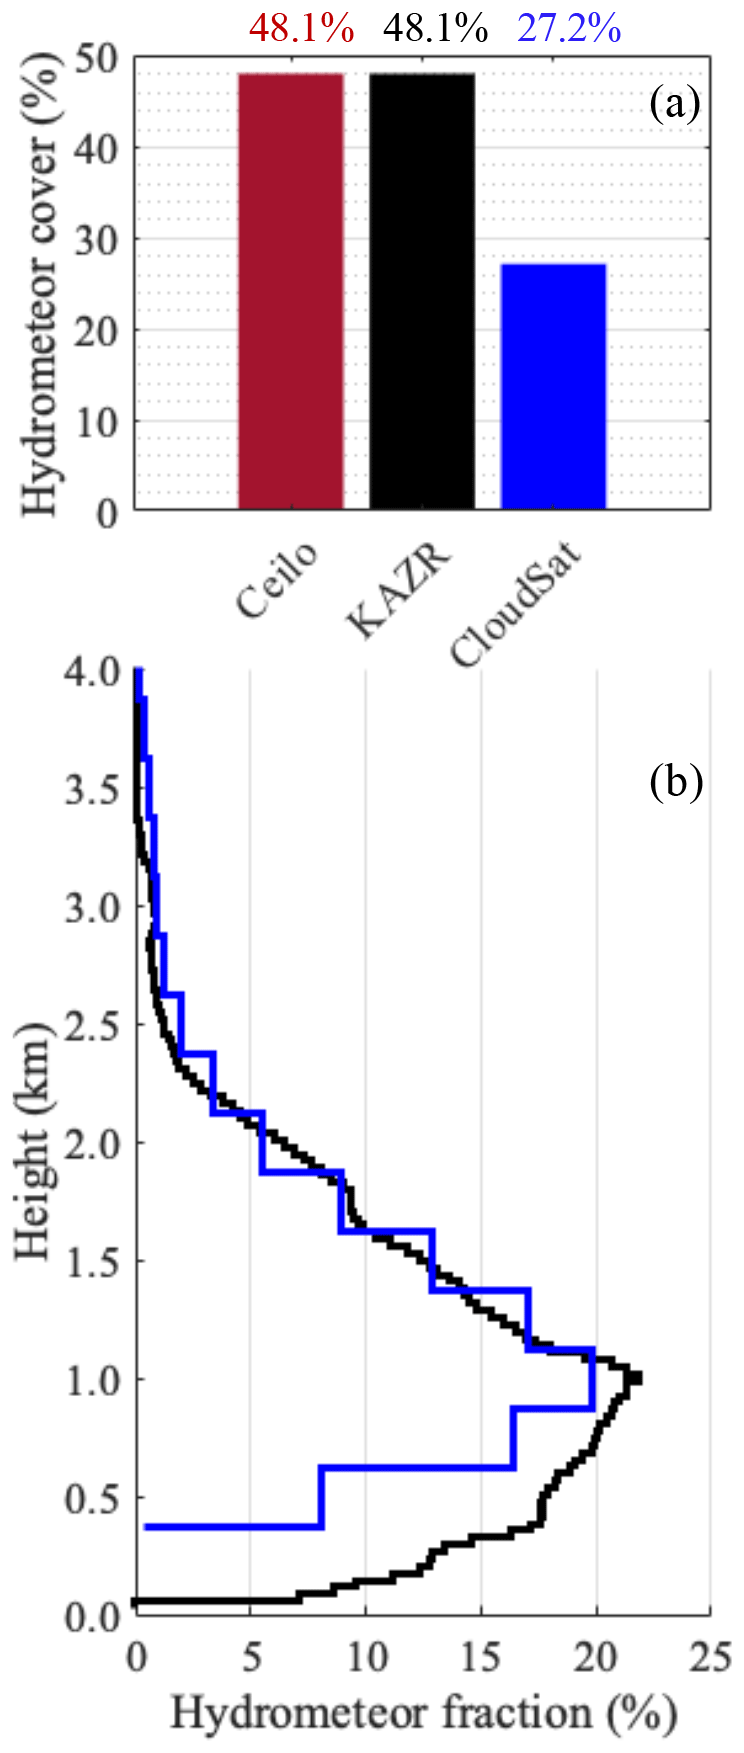
Figure 3For 103 instances where CloudSat overpassed the 200 km radius region centered on the ENA observatory, (a) fraction of observed profiles with cloud or rain (i.e., hydrometeor cover) and (b) hydrometeor fraction profile. Both estimated from CloudSat CPR observations within a 200 km radius of the ENA observatory (blue) and ground-based KAZR observations collected within ±1 h of the CloudSat overpass (black). Fractions are estimated based on the total number of observed profiles excluding those determined to contain high, deep or ice clouds.
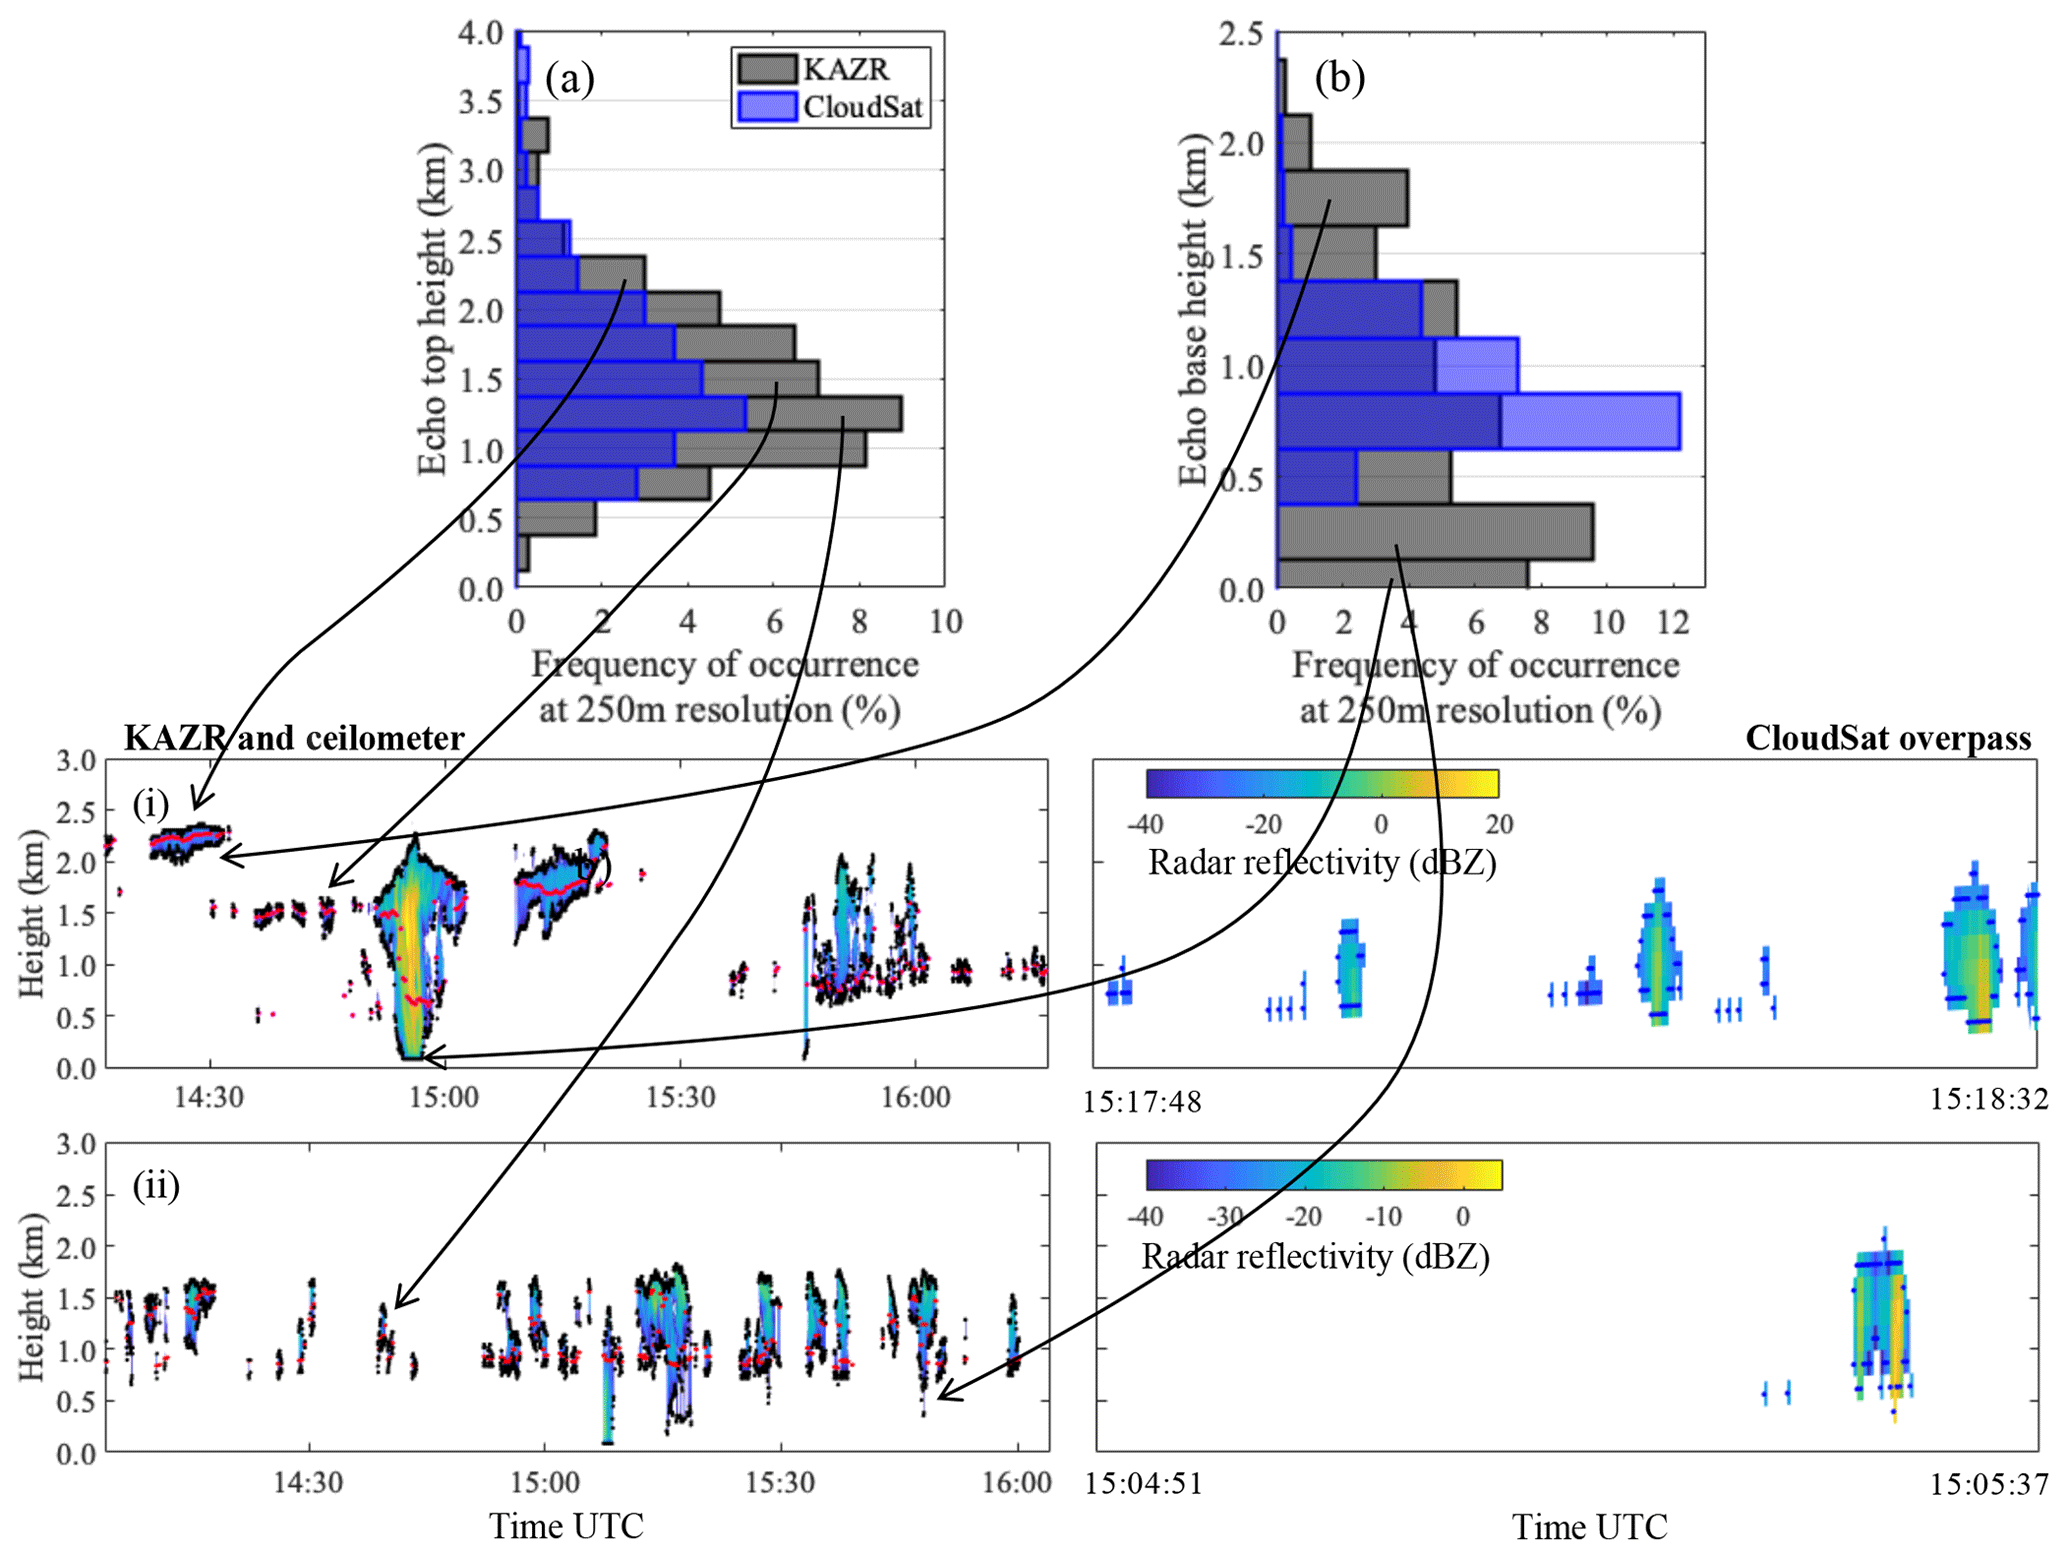
Figure 4For 103 instances where CloudSat overpassed the 200 km radius region centered on the ENA observatory, distribution of (a) echo top height and (b) echo base height, estimated from CloudSat CPR observations within a 200 km radius of the ENA observatory (blue) and ground-based KAZR observations collected within ±1 h of the CloudSat overpass (grey). For references are examples of hydrometeor radar reflectivity measured on (i) 11 February 2017 and (ii) 24 October 2016 by the ground-based KAZR within ±1 h of the CloudSat overpass and by the CloudSat CPR within 200 km of the KAZR location. Dots on these figures represent the boundaries of the radar echo (black and blue dots for the KAZR and the CloudSat CPR, respectively) and the location of the ceilometer-determined cloud base (red dots).
First, agreement between the KAZR-reported cloud cover and the ceilometer-reported cloud cover confirms that the KAZR's sensitivity is sufficient for detecting even the most tenuous clouds forming in this marine boundary layer regime; this makes the KAZR an ideal sensor to document the properties of WMBL clouds and evaluate the CloudSat CPR's performance (Fig. 3a). Although not expected to perfectly match, the large hydrometeor cover discrepancy between the KAZR (48.1 %) and CloudSat CPR (27.2 %) suggests that the CloudSat CPR fails to detect clouds in more than a few (on the order of ∼40 %) of the atmospheric columns it samples (Fig. 3a). On the other hand, the CloudSat CPR seems to capture the shape and magnitude of the hydrometeor fraction profile above 1.0 km reasonably well (Fig. 3b). This suggests that the CloudSat CPR is able to detect the bulk of the thick hydrometeor layers controlling hydrometeor fraction above 1.0 km. This also leads us to believe that the CloudSat CPR's hydrometeor cover biases result either from its inability to detect clouds entirely located below 1.0 km and/or from its inability to detect thin and narrow hydrometeor layers that are negligible contributors to hydrometeor fraction. Detailed analysis of the location of individual cloud tops shows evidence supporting both of these postulations (Fig. 4a). Specifically (1) the distribution of KAZR-detected cloud top heights shows clouds below 0.6 km, most of which are undetected by the CloudSat CPR. We estimate that this near-surface cloud mode produces 4.5 % of the total cloud cover, and so its misdetection could explain nearly a quarter of the CloudSat CPR hydrometeor cover bias. (2) The distribution of KAZR-detected cloud top heights also shows the presence of cloud top modes near 1.2 km and frequent occurrences near 2.2 km that are only partially detected by the CloudSat CPR (Fig. 4a). These elevated cloud tops modes are likely related to the several echo bases between 1.5 and 2.0 km that nearly all went undetected by the CloudSat CPR (Fig. 4b). A figure showing time–height observations from 2 additional overpass days allows us to visualize these layers as generally thin, weakly reflective and broken (Fig. 4i and ii). We speculate that misdetection of such thin or tenuous clouds explains the remainder of the CloudSat CPR's cloud cover bias.
Beyond its inability to detect all cloudy columns, the CloudSat CPR also severely underestimates the presence of hydrometeors below 0.75 km because it suffers from surface echo contamination; this creates an artificial enhancement in the number of apparent hydrometeor layer bases estimated from the CloudSat CPR near 0.75 km and is not representative of the true height of the base of either clouds or virga (Fig. 4b). We believe that the surface echo limits the CloudSat CPR's ability to observed true cloud base in ∼52 % of the cloudy columns it detects and true virga base in ∼80 %; in other words, the CloudSat CPR often provides an incomplete view of even the WMBL cloud systems it does detect. This approximation is made based on the subset of cloudy columns observed by the KAZR, whose tops are above the CloudSat CPR surface clutter echo (1.0 km) and are likely of sufficient thickness (250 m) and reflectivity (Z > −28 dBZ) to be detected by the CloudSat CPR.

Figure 5From ground-based KAZR observations collected between October 2015 and November 2017, (a) profile of cloud (solid black line) and sub-cloud-layer rain (dotted black line) fraction and the fraction of either cloud (solid red line) or sub-cloud-layer rain (dotted red line) echoes located below a certain height. Fractions are estimated based on the total number of observed profiles excluding those determined to contain high, deep or ice clouds. (b) Fraction of hydrometeor (cloud or rain) echoes with reflectivity larger than a given reflectivity threshold (colormap) with superimposed surface clutter profile as simulated for the CloudSatf (royal blue line), EarthCARE (magenta line), ACCP250 (red line) and ACCP100 (green line) CPR configurations and as observed by the CloudSat CPR between May 2010 and November 2017 (broken black line marks the median; dotted black lines mark the interquartile range). (c) Median profile of hydrometeor layer mean reflectivity as a function of thickness (black) and the fraction hydrometeor layers thinner than a certain thickness (red).
Although these 103 CloudSat overpasses are reasonably representative of the properties of the WMBL hydrometeor systems found in the vicinity of the Eastern North Atlantic facility, considering the entire set of measurements collected by the KAZR between October 2015 and November 2017 (719 d) provides additional insight on the challenges associated with measuring the properties of these hydrometeor systems (Fig. 5).
Analysis of the ground-based observations suggests that WMBL cloud fraction exceeds 5 % at all heights between 320 m and 2.09 km, with cloud fraction peaking at 1.13 km (Fig. 5a; solid black curve). On the other hand, rain tends to be found in the subcloud layer below 1.28 km altitude, occupying the largest fractional area between 100 m and 1.1 km (Fig. 5a; dotted black curve). The low height at which WMBL clouds and precipitation are found is especially challenging for spaceborne radar systems which are known to suffer from contamination from the surface return. We estimate that roughly 20 % of the cloud echoes and 52 % of the rain echoes recorded by the KAZR fall within the CloudSat CPR's surface echo region which extends at best only to 0.75 km (Fig. 5a; red curves).
The intensity (in terms of radar reflectivity) of cloud and precipitation also largely affects their ability to be detected by radars. Using KAZR observations, we characterize the intensity of the hydrometeor echoes observed at each height and report in Fig. 5b (colormap) the fraction of echoes with a reflectivity above a given threshold at each height. Generally, cloud and precipitation that produce radar reflectivity above a radar MDS can be detected. Thus, we would expect that the CloudSat CPR, with its −27 dBZ MDS (observed performance depicted by the broken black line in Fig. 5b), should have the capability to detect at best 80 % of all cloud and/or echoes forming at any given height, de facto missing at least 20 % of hydrometeor echoes. Radar performance degrades within the surface clutter region. In the clutter region, only those hydrometeor echoes whose intensity is larger than the surface echo intensity can be detected. To reflect this and for reference, we overlaid on Fig. 5b the median reflectivity recorded by the CloudSat CPR on clear-sky days between 2010 and 2016 as well as its variability as quantified by the interquartile range (broken and dashed black lines, respectively). Over that time interval, the CloudSat CPR's median surface echo varied from 37 dBZ at the surface to −27 dBZ at 0.75 km. Using this curve, we estimate that at a height of 0.5 km, the CloudSat CPR would miss at least 80 % of the echoes detected by the KAZR because their reflectivity is below that of the surface clutter, and that is based simply on sensitivity and does not account for other effects.
Adding to the challenge is the fact that boundary layer systems are shallow. Based on KAZR observations, 53 % of WMBL systems (cloud and rain) that form at ENA are shallower than 500 m, 33 % shallower than 250 m and 16 % shallower than 100 m (Fig. 5c; red line). Sampling hydrometeor layers using radar pulses longer than the hydrometeor layer thickness inherently produces partial-beam-filling issues, which lead to a weakening of the returned power. This results in an underestimation of the reflectivity of the thin echoes sampled and may even lead to their misdetection if the resulting reflectivity is below the radar MDS. There is also an unfortunate relationship between hydrometeor layer thickness and mean reflectivity such that thin layers not only suffer from more partial beam filling but also have weaker reflectivities. The black curve in Fig. 5c shows the median hydrometeor layer mean reflectivity as a function of hydrometeor layer thickness. From this figure we can estimate that 500 m thick hydrometeor layers typically have a mean reflectivity of −21 dBZ, 250 m thick layers −26 dBZ and 100 m thick layers −33 dBZ.
Improving our ability to detect boundary layer clouds and precipitation could likely be achieved through radar system modifications including the following (not necessarily in order of importance):
-
Alter the point target response (which dictates the shape of the forward-simulated range-weighting function).
-
Decrease the minimum detectable signal (MDS).
-
Reduce the horizontal field of view.
-
Increase the vertical oversampling.
-
Reduce the transmitted pulse length.
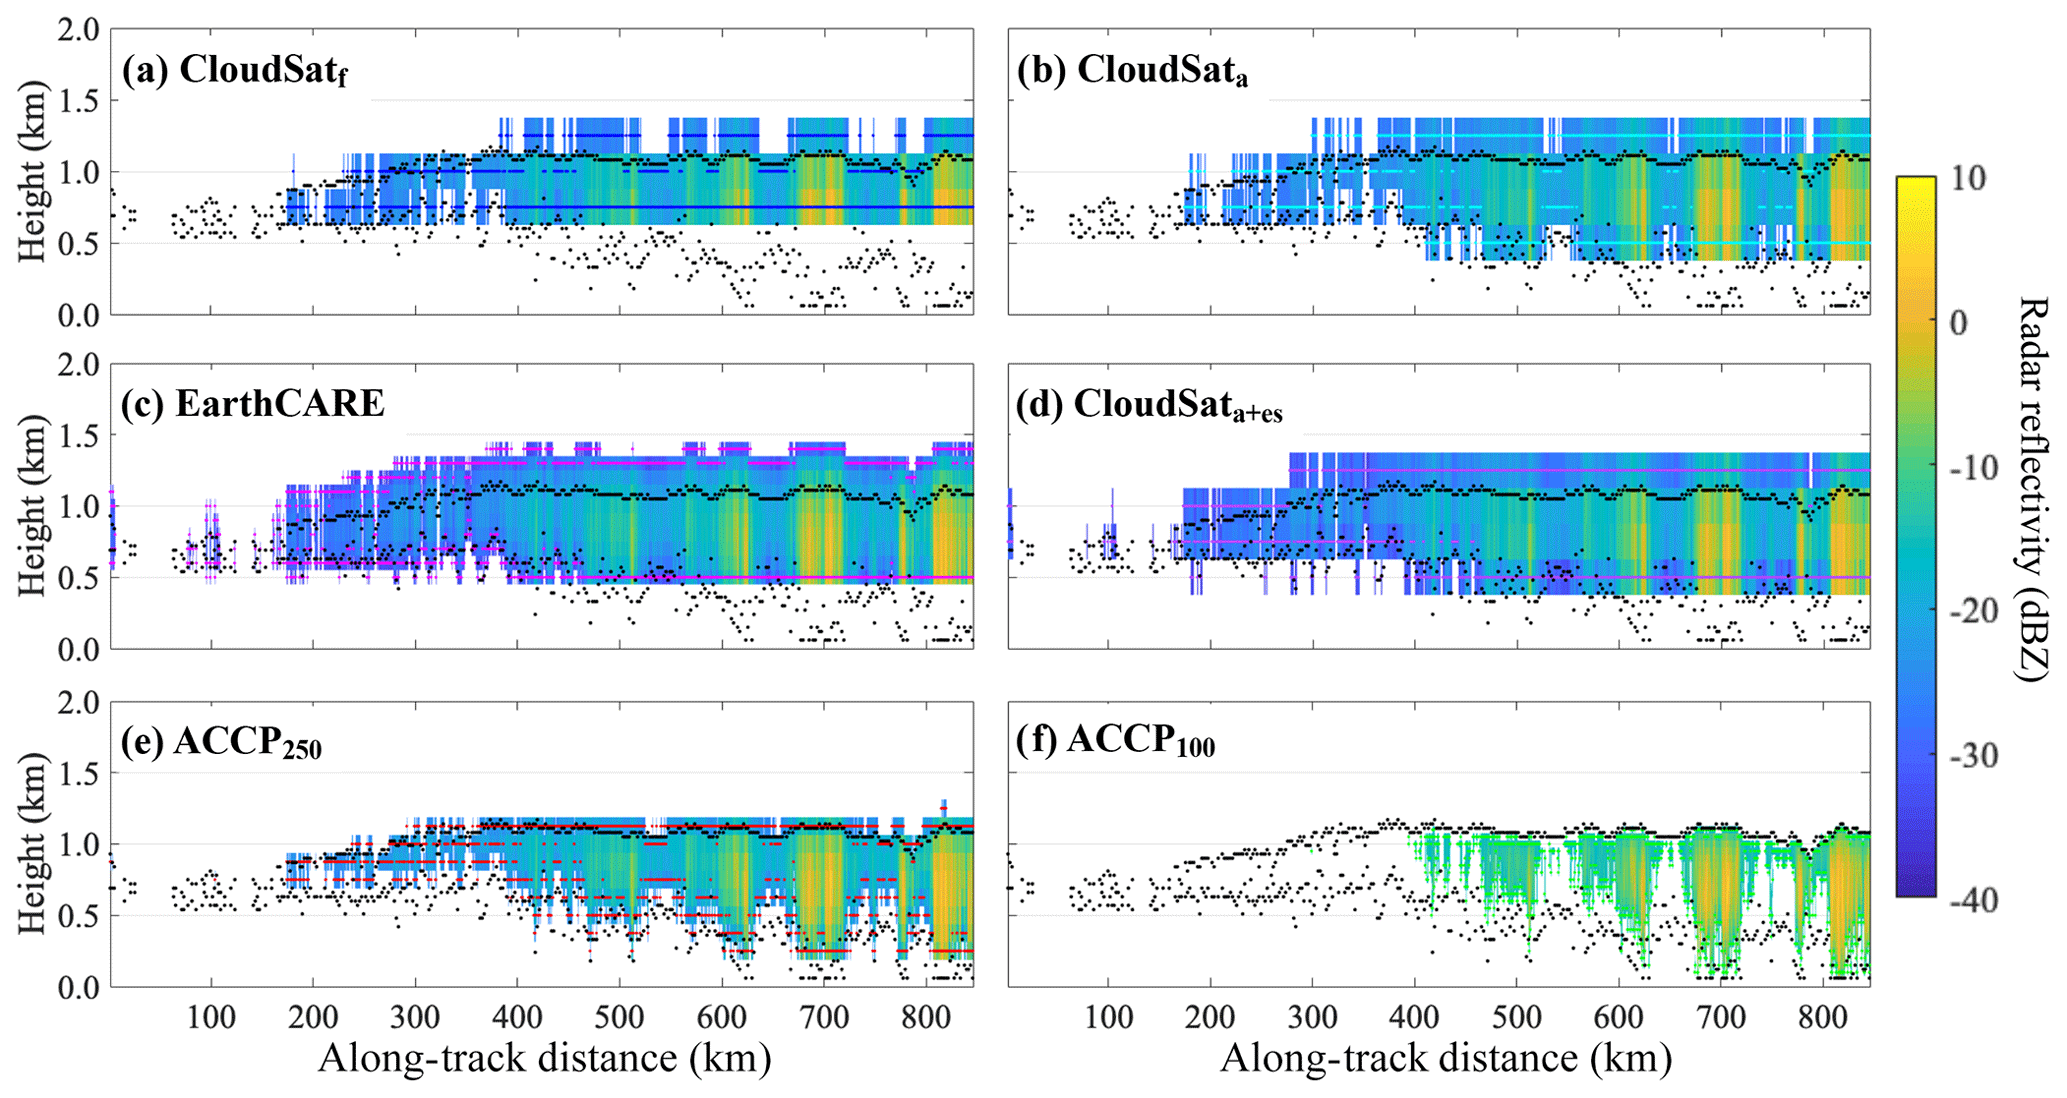
Figure 6Based on KAZR observations of the hydrometeor layer of 27 February 2016, forward-simulated radar reflectivity (colormap) and estimated hydrometeor layer boundaries (colored dots) for (a) CloudSatf (royal blue dots), (b) CloudSata which is CloudSat operating with the EarthCARE asymmetrical range-weighting function (cyan dots), (d) CloudSata+es which alternatively has an enhanced sensitivity equivalent to the EarthCARE (purple dots), (c) EarthCARE which additionally operates with a factor of 5 vertical oversampling (magenta dots), (e) ACCP250 which instead has a 250 m range resolution (red dots) and (f) ACCP100 which instead has a 100 m range resolution (green dots). For reference, the corresponding KAZR-observed radar reflectivity is depicted in Fig. 1a and echo boundaries identified by the KAZR are overlaid on each subpanel using black dots.
We emulate the impact of these radar modifications by constructing forward simulations for seven radar configurations, each of which has been gradually improved by the aforementioned radar modifications (described in Sect. 2.3, Table 1 and Fig. 2). Quantitative assessment of the performance of the forward-simulated radar configurations is estimated based on a set of 719 forward simulations constructed from KAZR observations collected between October 2015 and November 2017. As carried out for the real CloudSat CPR observations in Sect. 3, performance is evaluated in terms of how well hydrometeor cover and hydrometeor fraction are captured (Fig. 7) as well as in terms of how accurately the boundaries of hydrometeor layers are detected (Fig. 8). However, since all forward simulations presented in this section are based on the same KAZR observations, we expect a perfect match and interpret any deviations from the KAZR observations as a bias. To help visualize the performance of the seven radar configurations, we present output from forward simulations of the 27 February 2016 hydrometeor layer. The KAZR's view of this hydrometeor layer was depicted and described in Fig. 1a and Sect. 3; for reference the KAZR's detected echo top and base are overlaid on each forward simulation in Fig. 6 using black dots.
First, we validate our forward simulation framework by simulating the CloudSat CPR's current configuration (results depicted in royal blue and designated as CloudSatf for short). The forward simulations of the CloudSatf show similar biases to the real CloudSat CPR when compared to the KAZR, indicating that the forward simulator captures enough of the radar's characteristics to reasonably emulate its performance. In a nutshell, the CloudSatf underestimates hydrometeor cover by more than 10 % (Fig. 7a), likely owing to its misdetection of an important fraction of clouds with tops between 750 m and 1.75 km (Fig. 8a) and its inability to detect the small fraction of clouds forming entirely below 500 m. Just like the real CloudSat CPR, the CloudSatf performs well in capturing hydrometeor fraction between 750 m and 3 km but poorly below that height since it suffers from contamination by surface clutter (Fig. 7b).
Prelaunch testing of the EarthCARE CPR showed that its particular transmitter and receiver filter generate an asymmetrical point target response. This means that, unlike the CloudSat CPR, the EarthCARE CPR must be represented by an asymmetrical range-weighting function (Fig. 2). The range-weighting function of the EarthCARE CPR's pulse has a rapid cutoff at a factor of 0.5 times the pulse length on its leading edge and a longer taper extending to 1.5 times the pulse on its trailing edge. To isolate performance changes resulting strictly from this change in point target response, we contrast the result of forward simulations performed with the CloudSat CPR's original configuration (CloudSatf results depicted in royal blue) with a CloudSat-like configuration with the EarthCARE CPR's asymmetrical range-weighting function (CloudSata; results depicted in cyan). A time-series comparison of CloudSata (Fig. 6b) and CloudSatf (Fig. 6a) reflectivity shows that the asymmetrical point target response causes a reduction in the vertical extent of the surface clutter echo, allowing for the detection of a larger fraction of hydrometeor at 500 m. Over the entire set of 719 forward simulations, this leads to improvements in the representation of the hydrometeor fraction profile (Fig. 7b) and of the echo base height distribution (not shown) around 500 m. However, differences in the echo base height from the KAZR (black dots) and from CloudSata (cyan dots) suggest that changes in the shape of the pulse point target response alone are insufficient to accurately detect the base of the precipitating WMBL systems found at the ENA (Fig. 6b). We also note that the change in shape of the point target response alone only marginally improves the ability of CloudSatf to determine hydrometeor cover (improvement from 27.9 % to 28.2 % compared to 39.1 % reported by the KAZR); the reason for this is that hydrometeor cover is controlled by thin, tenuous clouds and clouds located entirely below 0.5 km. As a potential drawback, the asymmetrical point target response seems to lead to slightly more vertical stretching of cloud top signals (on average 37 m) such as those visible by comparing the examples in Fig. 6a and b and in Fig. 8a. When compounded over the entire ensemble of forward-simulated clouds, this leads to a 0.24 % overestimation of hydrometeor fraction at all heights between 0.75 and 3.00 km (Fig. 7b). The vertical stretching of cloud tops results from additional power being focused between a factor of 0.0 and 0.5 times the pulse length on the leading edge of the pulse (comparing the range-weighting function of EarthCARE CPR to that of the CloudSat CPR; the black and blue line in Fig. 2, respectively).
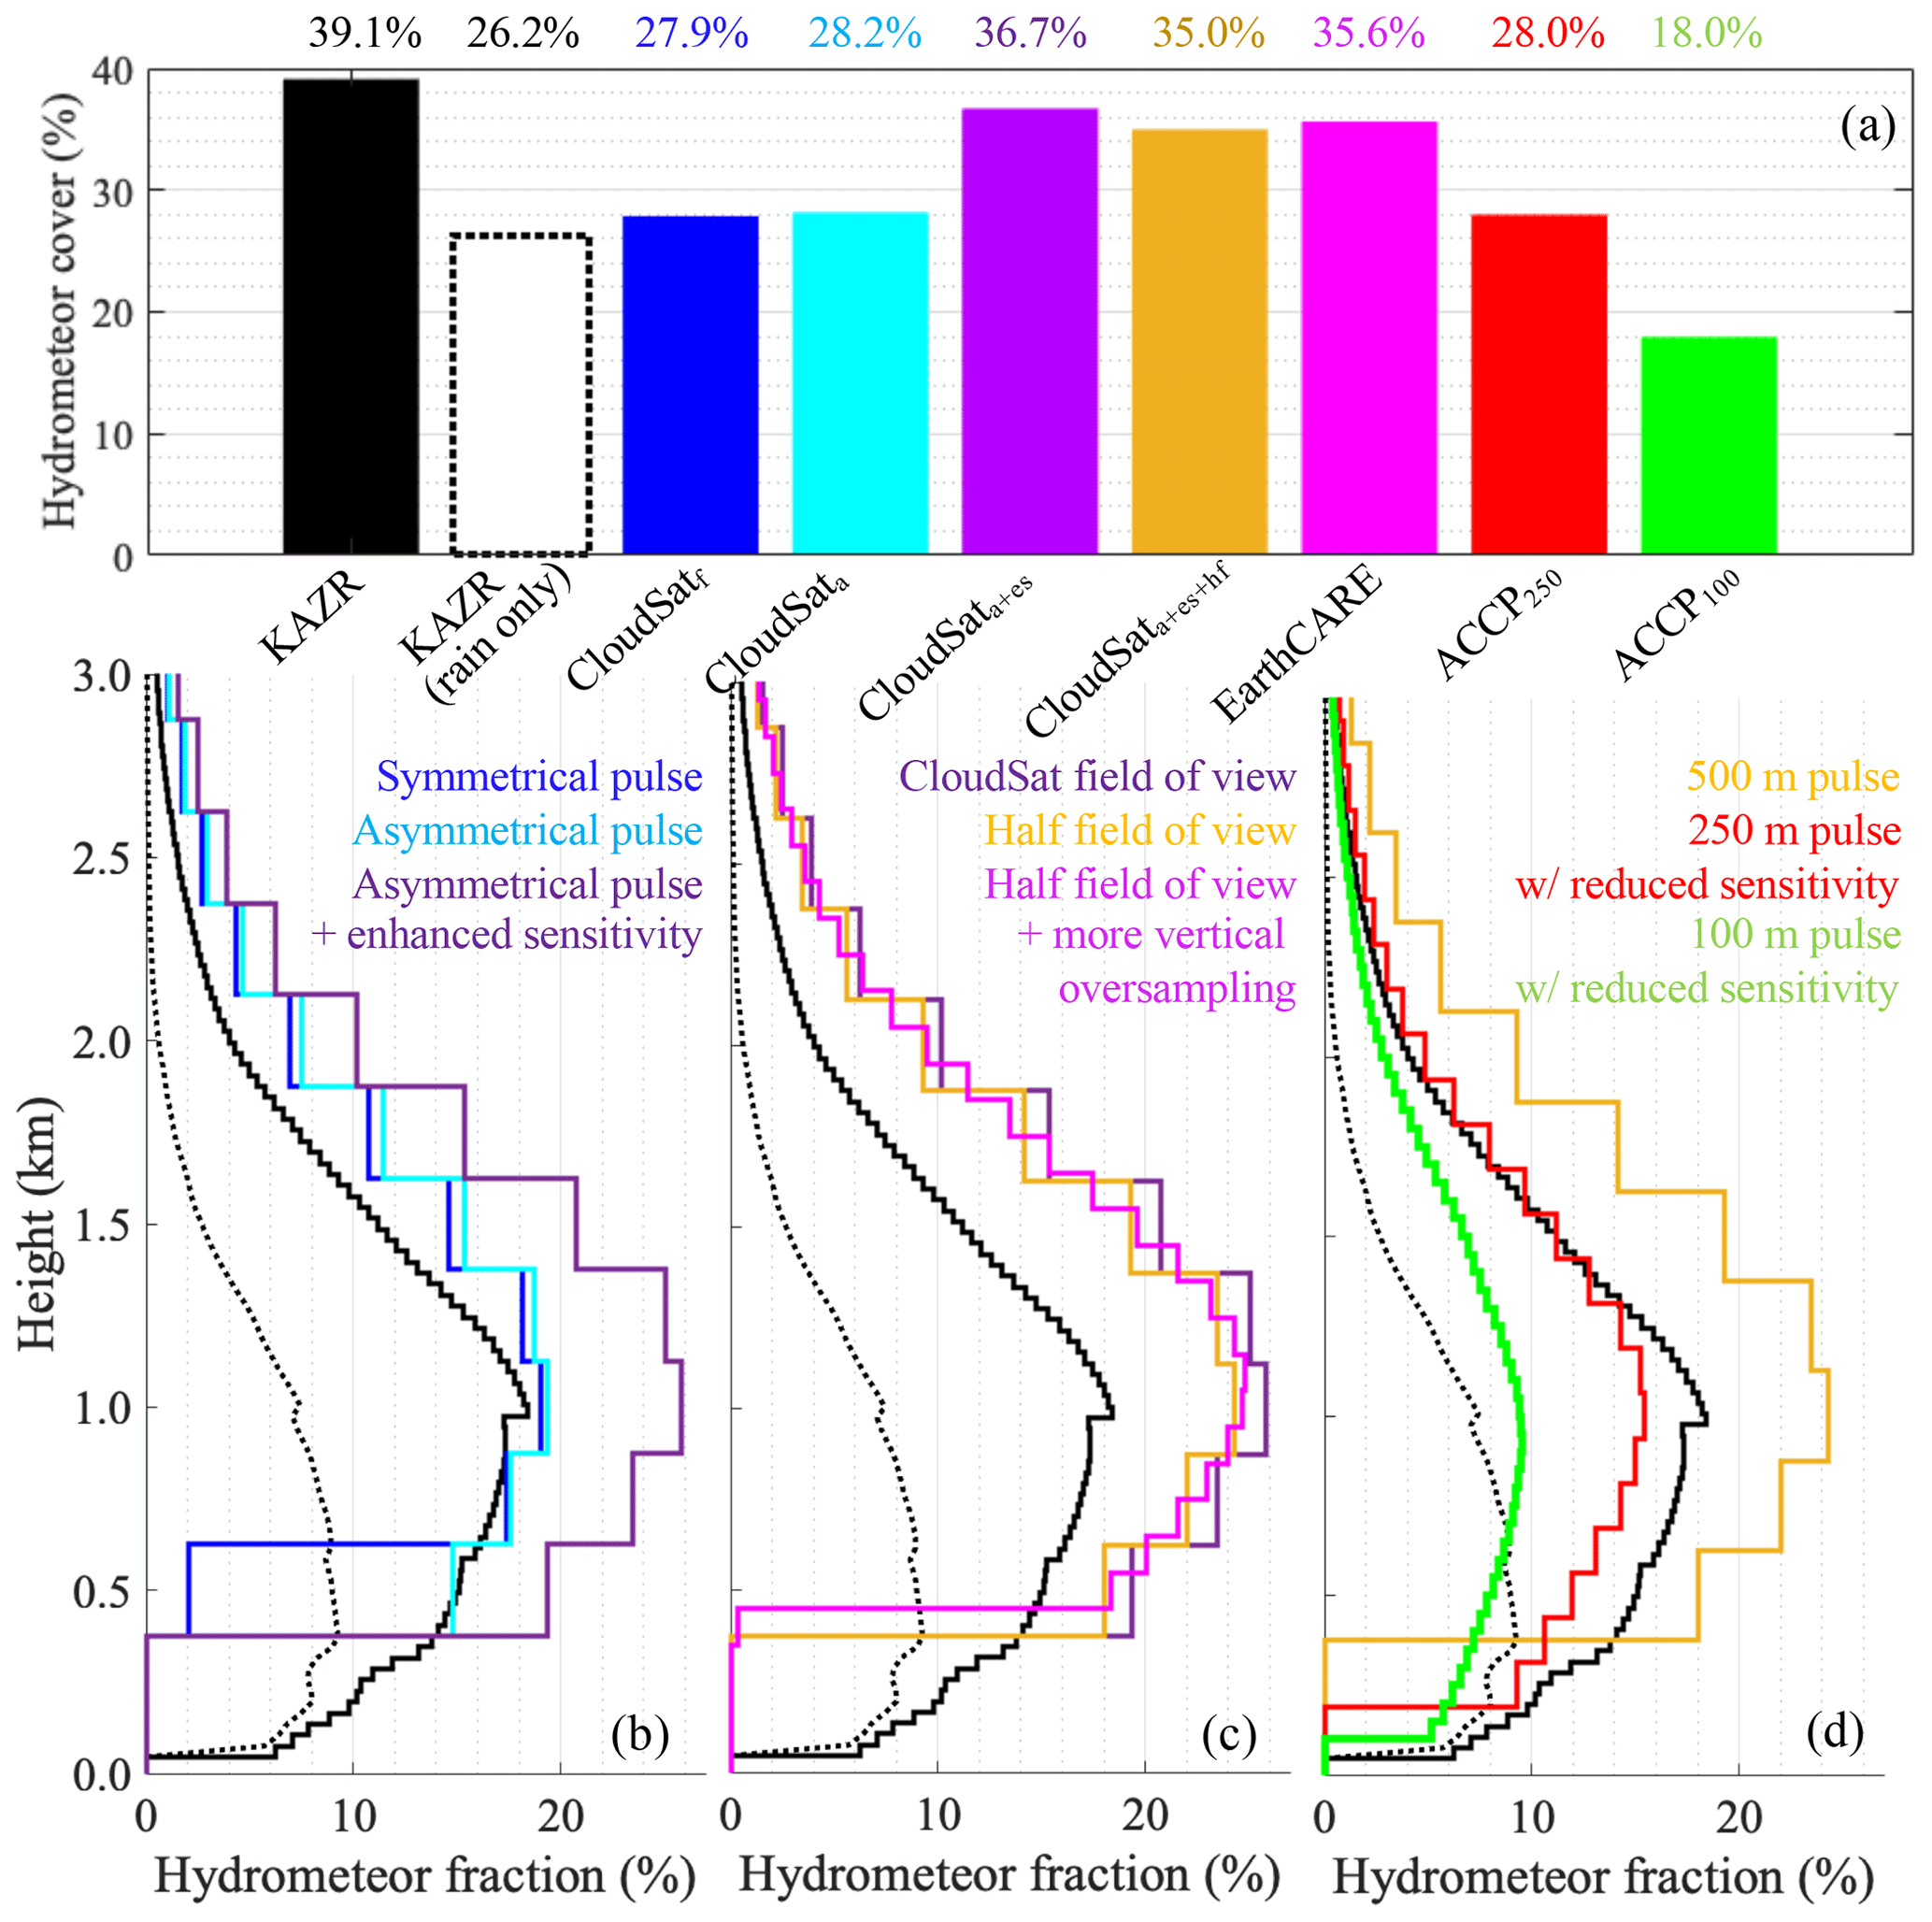
Figure 7For 719 forward-simulated days, (a) fraction of observed profiles containing either cloud or rain (i.e., hydrometeor cover); also, for the KAZR only, using complementary ceilometer observations, we estimate the fraction of all observed profiles containing rain in the subcloud layer. (b–d) Hydrometeor fraction profile estimated for all the forward-simulated radar architectures. All acronyms and colors are defined in Fig. 6 with the exception of CloudSat which is the CloudSat CPR operating with EarthCARE's asymmetrical range-weighting function, enhanced sensitivity and half the horizontal field of view (gold).
Besides having an asymmetrical point target response, the EarthCARE CPR will also operate with an MDS of −35 dBZ which is 7 dB more sensitive than the CloudSat CPR. To isolate performance changes resulting strictly from this sensitivity enhancement, we contrast the result of forward simulations performed with a CloudSat-like configuration with the asymmetrical point target response (CloudSata; results depicted in cyan) with that of a CloudSat-like configuration with both an asymmetrical point target response and enhanced sensitivity (CloudSata+es; results depicted in purple). A time-series comparison of CloudSata+es (Fig. 6d) and CloudSata (Fig. 6b) reflectivity shows that the sensitivity enhancement allows for the detection of hydrometeors in previously undetected columns such as the broken hydrometeor segments at around a 100 km distance along the forward-simulated track. Quantitatively, the more sensitive CloudSat CPR configuration detects 8 % more cloudy columns than either of the other two CloudSat CPR configurations discussed so far (i.e., with or without the asymmetrical point target response), reporting only 2.4 % less cloudy columns than the KAZR reports (Fig. 7a). This implies that, if an important mission objective is detecting even tenuous cloudy columns, improving the MDS is crucial. That being said, we advise against accomplishing this by transmitting a longer pulse (e.g., as done in the first 4 years of operation of the Global Precipitation Measurement (GPM) CPR) since there are two main drawbacks to transmitting a long pulse with a higher sensitivity, both caused by partial beam filling. Firstly, the enhanced sensitivity leads to additional vertical stretching of cloud boundaries, an effect visible between 400 and 800 km along-track when comparing Fig. 6d to b. This is because the signal from cloud boundaries measured away from their location by the edges of the radar range weighing function can then exceed the MDS. Secondly, the enhanced sensitivity also leads to previously undetected thin layers becoming detectable, but it stretches them vertically at least to the vertical extent of the radar pulse length. From changes in the location of the cloud top height distribution peak shown in Fig. 8a, we estimate that enhancing the sensitivity of a 3.3 µs long pulse from −28 to −35 dBZ would lead to a 250 m bias in detected cloud top height for the WMBL clouds that form at the ENA. Moreover, because it both vertically stretches clouds and detects more real clouds, the highly sensitive CloudSata+es overestimates hydrometeor cover by up to 7 % at all heights between 500 m and 3.0 km (Fig. 7b).
Since EarthCARE will travel at an altitude closer to the Earth's surface, it will also have half the horizontal field of view of CloudSat. Our results suggest that halving the CloudSat CPR's horizontal field of view and halving its integration distance would lead to a slight reduction in its estimated hydrometeor cover (1.7 % less). We take this as an indication that the larger horizontal field of view of the CloudSat CPR only marginally artificially broadens broken clouds (see CloudSat; results depicted in gold in Fig. 7). That being said, note that this result, like all the others presented here, is based on a 2-D forward simulation and as such it does not take into account cross-track effects which may also generate biases especially in sparse broken cloud fields.
Another interesting radar configuration proposed by the EarthCARE mission advisory group concerns the amount of vertical oversampling of the radar pulse. Radar signals are typically oversampled by a factor of 2 effectively halving the vertical spacing between available measurements. The EarthCARE CPR will use a factor of 5 oversampling to increase its vertical range sampling to 100 m while still operating at a 500 m vertical resolution. While oversampling may be appealing because it creates a smoother view of cloud fields, it does not effectively improve the vertical resolution because of the correlations between the oversampled measurements. Evaluating the impact of these correlations on the observed radar reflectivity field is beyond the scope of this study which instead focuses on evaluating the impact of oversampling on accurately locating cloud and precipitation boundaries. The time series of EarthCARE (Fig. 6c) reflectivity shows that increased oversampling will allow for a more precise characterization of the variability in echo base and top height (also see the echo top height distribution presented in Fig. 8c). Comparison of the ensemble of EarthCARE (magenta) and CloudSat (gold) forward simulations indicates that this precision can be achieved without causing significant biases in hydrometeor cover (Fig. 7a) or hydrometeor fraction (Fig. 7c).
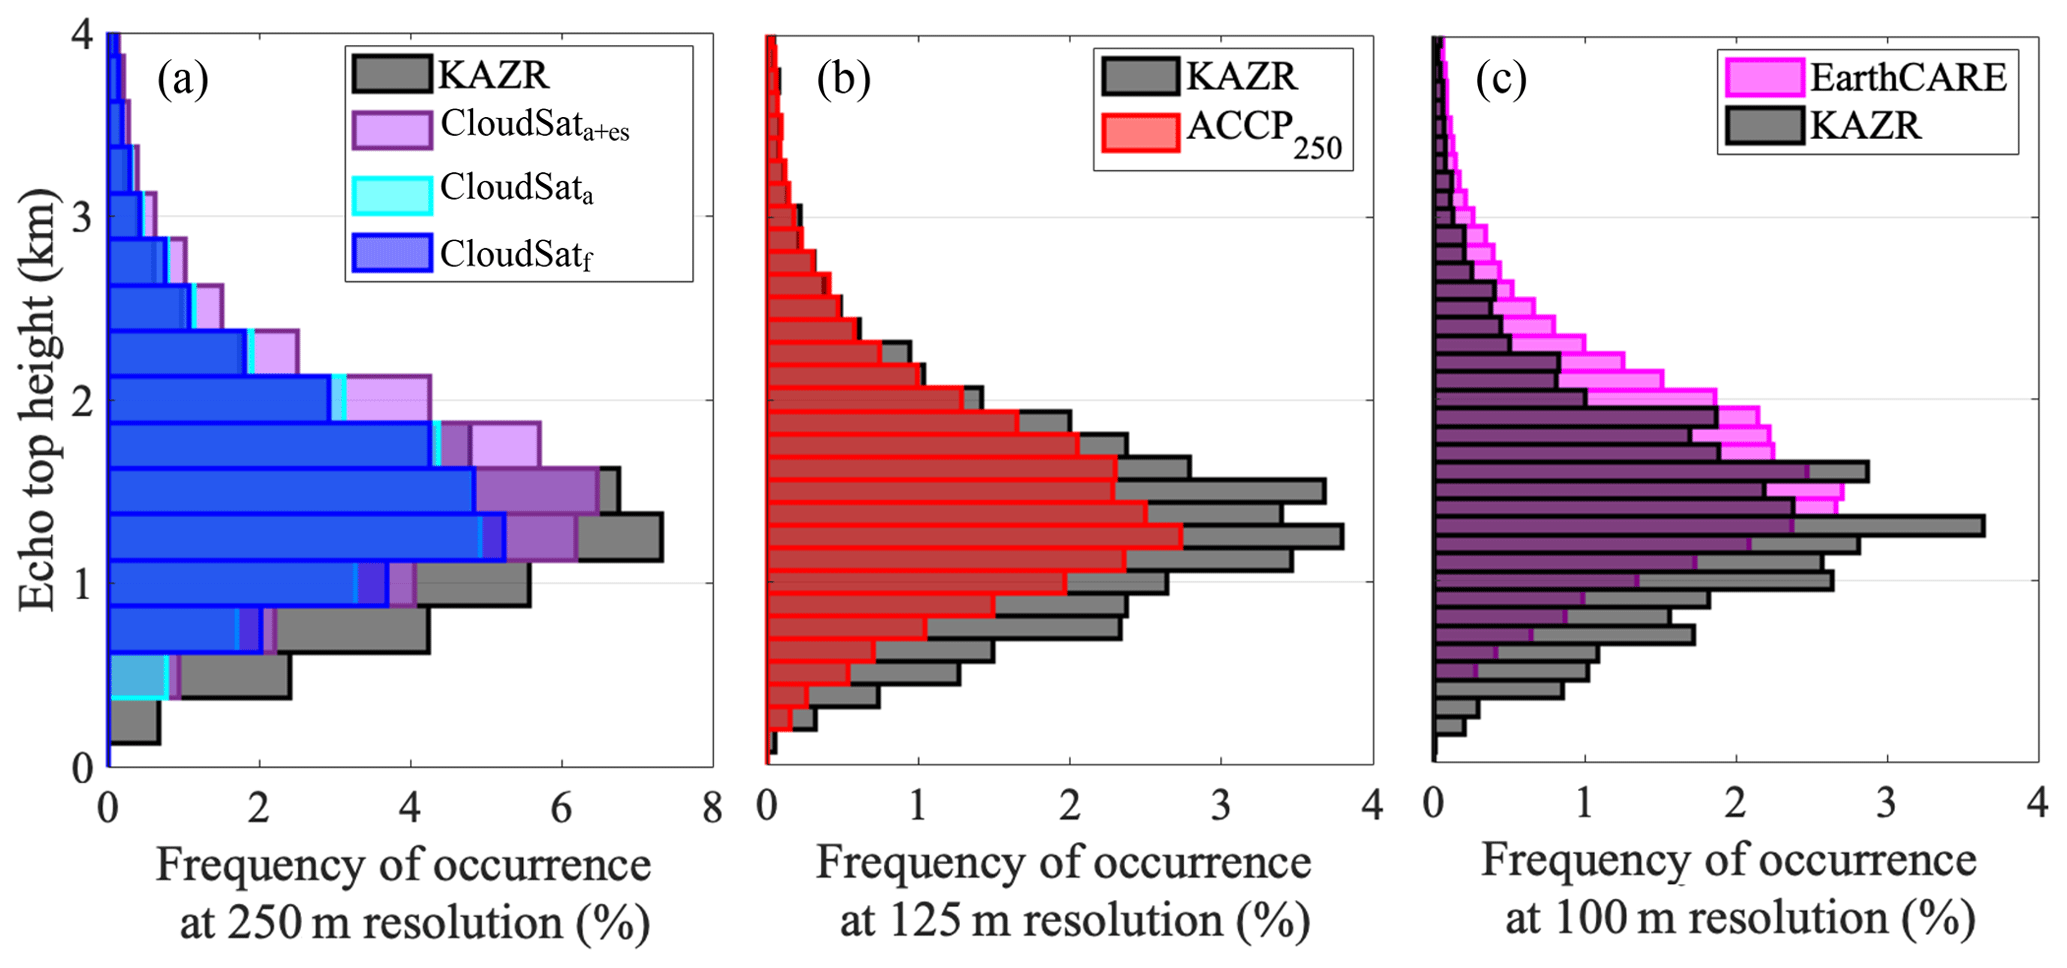
Figure 8For 719 forward-simulated days, distribution of echo top height observed by the KAZR (grey) and estimated from the forward-simulated radar architectures. Results are estimated at various range sampling resolutions according to the capability of each spaceborne sensor configuration. All acronyms and colors are defined in Fig. 6.
Although the EarthCARE CPR's performance is significantly better than that of the CloudSat CPR when it comes to detecting thin, tenuous and broken clouds as well as clouds and precipitation near 500 m, its configuration still does not allow for the detection of all WMBL clouds and precipitation. Remaining detection limitations occur below 500 m within the region of the surface clutter echo. Additional reduction of the vertical extent of the surface clutter can be achieved by reducing the pulse length. This, however, comes at the expense of reduced sensitivity. Comparing EarthCARE (results depicted in magenta), ACCP250 (results depicted in red) and ACCP100 (results depicted in green) simulations allows us to see the gain and penalty incurred from shortening the radar vertical range resolution from 500 to 250 to 100 m at the cost of reducing sensitivity from −35 to −26 and −17 dBZ. In alignment with our previous conclusion that a high sensitivity is necessary for detecting all cloudy columns, reducing the radar pulse length and sensitivity reduces the fraction of cloudy columns which can be detected by the ACCP configurations (Fig. 7a). For instance, the ACCP250 configuration, which is nearly as sensitive as CloudSat (−26 dB versus −28 dB), performs very similarly in terms of the number of cloudy columns it is able to detect (Fig. 7a) and in terms of how well it can capture the vertical distribution of hydrometeors between 500 m and 3.0 km (Fig. 7d), which we determined is influenced by the deeper more reflective clouds rather than the thin and tenuous ones. The ACCP250 configuration does, however, have the advantage of providing information on the base of clouds and/or precipitation down to 250 m which is much more than the CloudSat CPR can achieve (Fig. 7d). The short pulse of ACCP250 also helps mitigate the amount of cloud stretching related to partial-beam-filling issues, thus providing a more precise characterization of cloud top height (Fig. 8c; effects also visible in Fig. 6e). So generally speaking, reducing vertical pulse length reduces the fraction of detected cloudy columns but improves the characterization (both in terms of echo top and echo base location) of those cloudy columns which are detected.
Results also suggest that radars with shorter less sensitive pulses would be more suitable for the characterization of surface rain and virga, which are more reflective targets. In fact, we estimate that ACCP100 would detect 18 % of the rainy columns compared to the 26.2 % detected by the KAZR (Fig. 7a). ACCP100 would also do reasonably well at capturing the vertical distribution of drizzle and rain; comparisons of rain fraction profiles estimated from the KAZR (subcloud layer only) suggest that ACCP100 would miss < 2 % of the virga forming at each height below 750 m and would be able to detect the presence of rain as close as 25 m above the surface.
The macrophysical properties of warm marine boundary layer (WMBL) clouds and precipitation and the ability of spaceborne radars to characterize them are evaluated using ground-based ceilometer and Ka-band ARM Zenith Radar (KAZR) observations collected over the Atmospheric Radiation Measurement (ARM) program Eastern North Atlantic (ENA) facility.
Analysis of 719 d of KAZR observations collected between October 2015 and November 2017 suggests that the three following main properties of WMBL clouds and precipitation complicate their detection by spaceborne radars:
-
They are generally thin, with 50 % of the hydrometeor layers detected by the KAZR having a thickness below 400 m. As a result, they may not fill the entire spaceborne radar pulse volumes, causing serious partial-beam-filling issues.
-
They are weakly reflective, with 50 % of the hydrometeors detected by the KAZR having reflectivity below −22 dBZ. We also find that hydrometeor layer mean reflectivity is strongly related to hydrometeor layer thickness such that the thinnest layers are also typically the least reflective ones, further creating challenges for their detection.
-
They form at low levels, with 50 % of WMBL cloud echoes being located below 1.2 km and 50 % of sub-cloud-layer rain echoes below 0.75 km. Therefore, their signal may easily overlap and be masked by the strong surface return detected by spaceborne radars.
Observations from 103 overpasses and results from 719 2-D forward simulations constructed using KAZR observations consistently show that the CloudSat CPR fails to detect anything from 29 % to 43 % of the cloudy columns detected by the ground-based KAZR. Supporting the postulations of Christensen et al. (2013), Rapp et al. (2013) and Liu et al. (2018), our results suggest that a little over half of this bias can be attributed to the CloudSat CPR's inability to sample thin, tenuous cloud, while a quarter results from misdetection of clouds that form entirely within the CloudSat CPR surface (some of which are also thin and tenuous). Using forward simulations, we determined that mitigating the vertical extent of the surface clutter by changing the radar's point target response or by reducing its vertical range resolution by half would only partially improve the CloudSat CPR's ability to detect all cloudy columns, which is very much limited by the CloudSat CPR's low sensitivity. In other words, when it comes to detecting all cloudy columns, we find that improving the radar MDS is more important than reducing the vertical extent of the surface clutter. For this reason, the 7 dB more sensitive EarthCARE CPR is expected to detect significantly more cloud columns than the CloudSat CPR, only missing < 9.0 % of the simulated cloudy columns (reported clouded cover being 39.1 % in the simulation, 35.6 % detectable by the EarthCARE CPR and 27.9 % detectable by the CloudSatf).
On the other hand, our overpass and forward-simulation results suggest that the CloudSat CPR is able to capture the general vertical distribution of hydrometeor (i.e., hydrometeor fraction profile) above 750 m, which we find is dominantly controlled by thicker more reflective clouds. Unfortunately, we estimate that because of its asymmetrical point target response and because of the long length of its highly sensitive pulse, the EarthCARE CPR will overestimate (by ∼250 m) cloud top height and underestimate cloud base height, making hydrometeor layers appear artificially thicker than they are, which will also bias the EarthCARE CPR's hydrometeor fraction estimates. This effect would need to be addressed to extract accurate information about the location of cloud boundaries and about the vertical distribution of clouds and precipitation, two aspects likely to become increasingly important as we continue moving towards increasingly high-resolution global modeling. Synergy with the collocated atmospheric lidar (ATLID) could potentially help correct cloud top height; however, such corrections would only be possible in single-layer conditions and alternative techniques would need to be developed to improve the EarthCARE CPR's ability to accurately estimate the vertical extent of multilayer boundary layer clouds.
Below 1.0 km, the surface clutter echo seen by the CloudSat CPR masks portions of clouds and virga. Based on a subset of KAZR observations, we estimate that the surface echo limits the CloudSat CPR's ability to observe true cloud base in ∼52 % of the cloudy columns it detects and true virga base in ∼80 %. In other words, the CloudSat CPR often provides an incomplete view of even these cloud systems it does detect. Comparison of raw and masked CloudSat CPR's observations suggests that the clutter mask part of the GEOPROF version 4.0 product is relatively aggressive, and we believe the CloudSat CPR's performance could perhaps be somewhat improved by revising this clutter mask. That being said, a sensitivity study of the thresholds in the CloudSat CPR clutter mask is beyond the scope of this study. In terms of future spaceborne radar missions, radar architectures with finer-range resolution could more precisely characterize the boundaries of hydrometeor layers. For instance, the 250 m range resolution (oversampled at 125 m) radar architecture presented here produces echo top height statistics comparable to those of the ground-based KAZR in terms of detecting the minimum, maximum and mode of the distributions. However, since a shorter pulse can currently only be achieved at the expense of reduced sensitivity, this radar would suffer from the limitations similar to those of the CloudSat CPR in terms of the number of cloudy columns it could detect. This means that, while improving the detection of virga below 500 m might be possible, improving the detection of cloud bases below 500 m is unlikely achievable with current technologies.
Overall this analysis suggests that no one single radar configuration can adequately detect all WMBL clouds while simultaneously accurately determining the height of cloud top, cloud base and virga base. The alternative of deploying spaceborne radars capable of operating with interlaced operation modes is thus worth considering (Kollias et al., 2007). For example, a radar capable of generating both a highly sensitive long-pulse mode and a less sensitive but clutter-limiting short-pulse mode would likely provide a more comprehensive characterization of the boundary layer by detecting both low-reflectivity clouds and low-altitude rain.
On a related note, it is likely that the partial-beam-filling issues identified here as affecting both the CloudSat CPR's and the EarthCARE CPR's ability to locate clouds might, as hinted by Burns et al. (2016), also affect their ability to accurately measure their true reflectivity. Such radar reflectivity biases would affect water mass retrievals performed using radar reflectivity measurement and follow-up efforts should aim to quantify this effect and should look into alternative retrieval techniques and/or radar configurations that could address this issue (Battaglia et al., 2020b).
As a final thought we also point out that, due to the variations in the microphysical and macrophysical properties of oceanic warm clouds globally, the actual missed detections by the various spaceborne CPR architectures described here may change when considering other regimes. Liu et al. (2016) hint at the fact that regions dominated by stratiform clouds are more challenging to characterize than those dominated by cumulus. Thus, for completeness, follow-on studies could test the performance of the radar configurations proposed here in other climatic regimes.
Since the Earth's surface can be treated as a point target, observations of the surface clutter echo during clear-sky conditions can be used to gain insight into how the energy contained within radar pulses spreads out vertically when it hits a point target (i.e., about the range-weighting function).
We extract information about the shape of the CloudSat CPR's range-weighting function from a subset of observations collected between May 2010 and November 2017 identified as clear sky in the GEOPROF product (version 4.0; CPR_Echo_Top mask variable). We further ignore observations from nonsignificant echoes (Z < −27 dBZ) and mispointing events (profiles which have their maximum reflectivity more than 75 m from 0 m height). Over this period, the median surface reflectivity profile (depicted by the broken black line in Fig. 5b) shows a main peak at surface level quickly reducing in intensity with height; the surface radar reflectivity return was observed to reduce by ∼34 dB at a distance of 0.5 km (i.e., half the pulse length) away from its actual location at the surface. A secondary lobe whose peak intensity is ∼50 dB lower than that of the main lobe was observed to spread from a distance of roughly 0.5 to 1.0 km away from the main peak. Characterization of the CloudSat CPR point target response presented in Tanelli et al. (2008) also revealed the symmetrical character of the main lobe of the CloudSat CPR range-weighting function; the prelaunch analysis also showed that the presence of this secondary lobe is confined to the pulse's leading edge.
In the current analysis, we first use the median surface reflectivity profile we extracted (postlaunch) to adjust the width of the Gaussian range-weighting function used in the CloudSat forward simulator. The Gaussian range-weighting function depicted in Fig. 2 produces a forward-simulated surface echo return similar, in intensity and vertical extent, to the surface echo observed by the CloudSat CPR under clear-sky conditions (compare the royal blue line and black lines in Fig. 5b). Note that we did not attempt to reproduce the CloudSat CPR's secondary lobe and that the use of this Gaussian range-weighting function is limited to the CloudSatf forward simulation. All other forward simulations are conducted using the EarthCARE CPR asymmetrical range-weighting function constructed from prelaunch testing of the EarthCARE CPR.
The strength of the surface echo observed by CloudSat under clear-sky conditions is also used to determine the intensity of the surface clutter artificially input into the KAZR reflectivity field input to the forward simulations. We estimate the surface echo to be added to the KAZR's −30 to 0 m range gate should have an intensity of 52 dBZ such that, after its convolution by the range-weighting functions of the spaceborne radar configurations, the strength of the realized surface echo at 0 m height is 41 dBZ, matching the strength of the surface echo observed by CloudSat under clear-sky conditions (depicted by the broken black line in Fig. 5b). Note that variability in the surface return due to attenuation of the radar signal by liquid, heterogeneous surface conditions and changes in satellite altitude have not been included in the forward simulator. However, analysis of the real CloudSat CPR surface echo observed during clear sky suggests that variability due to heterogeneous surface conditions and changes in satellite altitude are on the order of < 2 dB (depicted by the dotted black lines in Fig. 5b).
All CloudSat CPR observations were obtained from the CloudSat data processing center (http://www.cloudsat.cira.colostate.edu/, last access: 12 June 2019, CloudSat, 2019). All ARM observations were obtained from the ARM archive (https://www.archive.arm.gov/discovery/, last access: 12 June 2019, ARM Data Discovery, 2019). Output of all forward simulations is fully reproducible from the information given.
KL coordinated the project, extracted the ground-based measurement files from the ARM archive, performed the data analysis and produced the final manuscript draft. PK extracted the CloudSat CPR GEOPROF product files from the data processing center and provided feedback on the forward simulator. AB provided feedback on the analysis methods as well as on the manuscript draft. SP performed exploratory data analysis and provided feedback on the manuscript draft.
The authors declare that they have no conflict of interest.
The authors would like to thank the three anonymous referees for their feedback. This work was conducted within the scope of the U.S. Department of Energy Atmospheric System Research program.
This research has been supported by the U.S. Department of Energy Biological and Environmental Research program (grant nos. DE-SC0016344 and DE-SC0017967).
This paper was edited by Vassilis Amiridis and reviewed by three anonymous referees.
ARM Data Discovery: https://www.archive.arm.gov/discovery/, last access: 12 June 2019.
Battaglia, A., Tanelli, S., and Kollias, P.: Polarization Diversity for Millimeter Spaceborne Doppler Radars: An Answer for Observing Deep Convection?, J. Atmos. Ocean. Tech., 30, 2768–2787, 2013.
Battaglia, A., Kollias, P., Dhillon, R., Roy, R. J., Tanelli, S., Lebsock, M., Grecu, M., Lamer, K., Heymsfield, G. M., Watters, D., and Mroz, K.: Space-borne cloud and precipitation radars: status, challenges and ways forward, Rev. Geophys., submitted, 2020a.
Battaglia, A., Kollias, P., Dhillon, R., Lamer, K., Khairoutdinov, M., and Watters, D.: Mind-thegap Part II: Improving quantitative estimates of cloud and rain water path in oceanic warm rain using spaceborne radars, Atmos. Meas. Tech. Discuss., https://doi.org/10.5194/amt-2020-80, in review, 2020b.
Bony, S., Stevens, B., Frierson, D. M., Jakob, C., Kageyama, M., Pincus, R., Shepherd, T. G., Sherwood, S. C., Siebesma, A. P., and Sobel, A. H.: Clouds, circulation and climate sensitivity, Nat. Geosci., 8, 261–268, 2015.
Bretherton, C. S., Wood, R., George, R. C., Leon, D., Allen, G., and Zheng, X.: Southeast Pacific stratocumulus clouds, precipitation and boundary layer structure sampled along 20∘ S during VOCALS-REx, Atmos. Chem. Phys., 10, 10639–10654, https://doi.org/10.5194/acp-10-10639-2010, 2010.
Burleyson, C. D., De Szoeke, S. P., Yuter, S. E., Wilbanks, M., and Brewer, W. A.: Ship-based observations of the diurnal cycle of southeast Pacific marine stratocumulus clouds and precipitation, J. Atmos. Sci., 70, 3876–3894, 2013.
Burns, D., Kollias, P., Tatarevic, A., Battaglia, A., and Tanelli, S.: The performance of the EarthCARE Cloud Profiling Radar in marine stratiform clouds, J. Geophys. Res.-Atmos., 121, 14525–14537, https://doi.org/10.1002/2016JD025090, 2016.
Christensen, M. W., Stephens, G. L., and Lebsock, M. D.: Exposing biases in retrieved low cloud properties from CloudSat: A guide for evaluating observations and climate data, J. Geophys. Res.-Atmos., 118, 12120–12131, https://doi.org/10.1002/2013JD020224, 2013.
CloudSat: http://www.cloudsat.cira.colostate.edu/, last access: 12 June 2019.
Comstock, K. K., Bretherton, C. S., and Yuter, S. E.: Mesoscale variability and drizzle in southeast Pacific stratocumulus, J. Atmos. Sci., 62, 3792–3807, 2005.
Dong, X. and Mace, G. G.: Arctic stratus cloud properties and radiative forcing derived from ground-based data collected at Barrow, Alaska, J. Climate, 16, 445–461, 2003.
Ellis, T. D., L'Ecuyer, T., Haynes, J. M., and Stephens, G. L.: How often does it rain over the global oceans? The perspective from CloudSat, Geophys. Res. Lett., 36, L03815, https://doi.org/10.1029/2008GL036728, 2009.
Frisch, A., Fairall, C., and Snider, J.: Measurement of stratus cloud and drizzle parameters in ASTEX with a Kα-band Doppler radar and a microwave radiometer, J. Atmos. Sci., 52, 2788–2799, 1995.
Haynes, J. M., Jakob, C., Rossow, W. B., Tselioudis, G., and Brown, J.: Major characteristics of Southern Ocean cloud regimes and their effects on the energy budget, J. Climate, 24, 5061–5080, 2011.
Hildebrand, P. H. and Sekhon, R.: Objective determination of the noise level in Doppler spectra, J. Appl. Meteorol., 13, 808–811, 1974.
Huang, Y., Siems, S. T., Manton, M. J., Hande, L. B., and Haynes, J. M.: The structure of low-altitude clouds over the Southern Ocean as seen by CloudSat, J. Climate, 25, 2535–2546, 2012.
Illingworth, A. J., Barker, H., Beljaars, A., Ceccaldi, M., Chepfer, H., Clerbaux, N., Cole, J., Delanoë, J., Domenech, C., and Donovan, D. P.: The EarthCARE satellite: The next step forward in global measurements of clouds, aerosols, precipitation, and radiation, B. Am. Meteorol. Soc., 96, 1311–1332, 2015.
Klein, S. A. and Hartmann, D. L.: The seasonal cycle of low stratiform clouds, J. Climate, 6, 1587–1606, 1993.
Kollias, P., Szyrmer, W., Zawadzki, I., and Joe, P.: Considerations for spaceborne 94 GHz radar observations of precipitation, Geophys. Res. Lett., 34, L21803, https://doi.org/10.1029/2007GL031536, 2007.
Kollias, P., Szyrmer, W., Rémillard, J., and Luke, E.: Cloud radar Doppler spectra in drizzling stratiform clouds: 2. Observations and microphysical modeling of drizzle evolution, J. Geophys. Res.-Atmos., 116, D13203, https://doi.org/10.1029/2010JD015238, 2011.
Kollias, P., Tanelli, S., Battaglia, A., and Tatarevic, A.: Evaluation of EarthCARE cloud profiling radar Doppler velocity measurements in particle sedimentation regimes, J. Atmos. Ocean. Tech., 31, 366–386, 2014.
Kollias, P., Puigdomènech Treserras, B., and Protat, A.: Calibration of the 2007–2017 record of Atmospheric Radiation Measurements cloud radar observations using CloudSat, Atmos. Meas. Tech., 12, 4949–4964, https://doi.org/10.5194/amt-12-4949-2019, 2019.
Lamer, K. and Kollias, P.: Observations of fair-weather cumuli over land: Dynamical factors controlling cloud size and cover, Geophys. Res. Lett., 42, 8693–8701, 2015.
Lamer, K., Kollias, P., and Nuijens, L.: Observations of the variability of shallow trade wind cumulus cloudiness and mass flux, J. Geophys. Res.-Atmos., 120, 6161–6178, 2015.
Lamer, K., Puigdomènech Treserras, B., Zhu, Z., Isom, B., Bharadwaj, N., and Kollias, P.: Characterization of shallow oceanic precipitation using profiling and scanning radar observations at the Eastern North Atlantic ARM observatory, Atmos. Meas. Tech., 12, 4931–4947, https://doi.org/10.5194/amt-12-4931-2019, 2019.
Leon, D. C., Wang, Z., and Liu, D.: Climatology of drizzle in marine boundary layer clouds based on 1 year of data from CloudSat and Cloud-Aerosol Lidar and Infrared Pathfinder Satellite Observations (CALIPSO), J. Geophys. Res.-Atmos., 113, D00A14, https://doi.org/10.1029/2008JD009835, 2008.
Liu, D., Liu, Q., Qi, L., and Fu, Y.: Oceanic single-layer warm clouds missed by the Cloud Profiling Radar as inferred from MODIS and CALIOP measurements, J. Geophys. Res.-Atmos., 121, 12947–12965, https://doi.org/10.1002/2016JD025485, 2016.
Liu, D., Liu, Q., Liu, G., Wei, J., Deng, S., and Fu, Y.: Multiple Factors Explaining the Deficiency of Cloud Profiling Radar on Detecting Oceanic Warm Clouds, J. Geophys. Res.-Atmos., 123, 8135–8158, 2018.
Marchand, R., Mace, G. G., Ackerman, T., and Stephens, G.: Hydrometeor detection using CloudSat–An Earth-orbiting 94-GHz cloud radar, J. Atmos. Ocean. Tech., 25, 519–533, 2008.
Nam, C., Bony, S., Dufresne, J. L., and Chepfer, H.: The “too few, too bright” tropical low-cloud problem in CMIP5 models, Geophys. Res. Lett., 39, L21801, https://doi.org/10.1029/2012GL053421, 2012.
Protat, A., Bouniol, D., Delanoë, J., O'Connor, E., May, P., Plana-Fattori, A., Hasson, A., Görsdorf, U., and Heymsfield, A.: Assessment of CloudSat reflectivity measurements and ice cloud properties using ground-based and airborne cloud radar observations, J. Atmos. Ocean. Tech., 26, 1717–1741, 2009.
Rapp, A. D., Lebsock, M., and L'Ecuyer, T.: Low cloud precipitation climatology in the southeastern Pacific marine stratocumulus region using CloudSat, Environ. Res. Lett., 8, 014027, https://doi.org/10.1088/1748-9326/8/1/014027, 2013.
Rosenkranz, P. W.: Water vapor microwave continuum absorption: A comparison of measurements and models, Radio Sci., 33, 919–928, 1998.
Sassen, K. and Wang, Z.: Classifying clouds around the globe with the CloudSat radar: 1-year of results, Geophys. Res. Lett., 35, L04805, https://doi.org/10.1029/2007GL032591, 2008.
Schutgens, N.: Simulated Doppler radar observations of inhomogeneous clouds: Application to the EarthCARE space mission, J. Atmos. Ocean. Tech., 25, 26–42, 2008.
Sherwood, S. C., Bony, S., and Dufresne, J.-L.: Spread in model climate sensitivity traced to atmospheric convective mixing, Nature, 505, 37–42, https://doi.org/10.1038/nature12829, 2014.
Stephens, G. L., Vane, D. G., Boain, R. J., Mace, G. G., Sassen, K., Wang, Z., Illingworth, A. J., O'Connor, E. J., Rossow, W. B., and Durden, S. L.: The CloudSat mission and the A-Train: A new dimension of space-based observations of clouds and precipitation, B. Am. Meteorol. Soc., 83, 1771–1790, 2002.
Stephens, G. L., Winker, D., Pelon, J., Trepte, C., Vane, D., Yuhas, C., L'ecuyer, T., and Lebsock, M.: CloudSat and CALIPSO within the A-Train: Ten years of actively observing the Earth system, B. Am. Meteorol. Soc., 99, 569–581, 2018.
Sy, O. O., Tanelli, S., Kollias, P., and Ohno, Y.: Application of matched statistical filters for EarthCARE cloud Doppler products, IEEE T. Geosci. Remote, 52, 7297–7316, 2014.
Tanelli, S., Durden, S. L., Im, E., Pak, K. S., Reinke, D. G., Partain, P., Haynes, J. M., and Marchand, R. T.: CloudSat's cloud profiling radar after two years in orbit: Performance, calibration, and processing, IEEE T. Geosci. Remote, 46, 3560–3573, 2008.