the Creative Commons Attribution 4.0 License.
the Creative Commons Attribution 4.0 License.
 | 15 May 2020
Nitrate radical generation via continuous generation of dinitrogen pentoxide in a laminar flow reactor coupled to an oxidation flow reactor
Ezra C. Wood
Jordan E. Krechmer
Francesca Majluf
Leah R. Williams
Philip L. Croteau
Manuela Cirtog
Anaïs Féron
Jean-Eudes Petit
Alexandre Albinet
Jose L. Jimenez
Oxidation flow reactors (OFRs) are an emerging tool for studying the formation and oxidative aging of organic aerosols and other applications. The majority of OFR studies to date have involved the generation of the hydroxyl radical (OH) to mimic daytime oxidative aging processes. In contrast, the use of the nitrate radical (NO3) in modern OFRs to mimic nighttime oxidative aging processes has been limited due to the complexity of conventional techniques that are used to generate NO3. Here, we present a new method that uses a laminar flow reactor (LFR) to continuously generate dinitrogen pentoxide (N2O5) in the gas phase at room temperature from the NO2 + O3 and NO2 + NO3 reactions. The N2O5 is then injected into a dark Potential Aerosol Mass (PAM) OFR and decomposes to generate NO3; hereafter, this method is referred to as “OFR-iN2O5” (where “i” stands for “injected”). To assess the applicability of the OFR-iN2O5 method towards different chemical systems, we present experimental and model characterization of the integrated NO3 exposure, NO3:O3, NO2:NO3, and NO2:O2 as a function of LFR and OFR conditions. These parameters were used to investigate the fate of representative organic peroxy radicals (RO2) and aromatic alkyl radicals generated from volatile organic compound (VOC) + NO3 reactions, and VOCs that are reactive towards both O3 and NO3. Finally, we demonstrate the OFR-iN2O5 method by generating and characterizing secondary organic aerosol from the β-pinene + NO3 reaction.
- Article
(5416 KB) -
Supplement
(283 KB) - BibTeX
- EndNote


The importance of nitrate radicals (NO3) as a nighttime oxidant is well established (Wayne et al., 1991; Brown and Stutz, 2012; Ng et al., 2017). In the atmosphere, NO2+O3 is the primary source of NO3, after which NO3 exists in equilibrium with NO2 and N2O5. Atmospheric nighttime NO3 mixing ratios can vary by at least 2 orders of magnitude, ranging from 1 ppt or less in remote areas to 10–400 ppt in polluted urban regions (Finlayson-Pitts and Pitts Jr., 2000; Asaf et al., 2010; Warneck and Williams, 2012; Ng et al., 2017). Atmospheric organic compounds that are reactive towards NO3 include isoprene and monoterpenes that are emitted from biogenic sources (including urban vegetation), phenols and methoxyphenols emitted from biomass burning, and polycyclic aromatic hydrocarbons (PAHs) emitted from combustion processes. NO3 oxidation of these compounds generates oxygenated volatile organic compounds (OVOCs) and/or secondary organic aerosol (SOA), including particulate organic nitrates or nitroaromatics. The importance of these sources and processes are likely to continue to increase for the foreseeable future due to climate change (Melaas et al., 2016; Short, 2017).
Laboratory studies have attempted to elucidate the mechanisms associated with NO3-initiated oxidative aging processes in the gas and condensed phases and in environmental chambers and flow tubes. Traditional NO3 generation techniques typically utilize N2O5 as the radical precursor. N2O5 is generated from the reaction NO+O3 → NO2+O2, followed by the reactions NO2+O3 → NO3+O2 and NO2+NO3 → N2O5. The synthesized N2O5 is collected and stored in a cold trap under dry conditions to minimize hydrolysis of N2O5 to nitric acid (HNO3). This method has limitations that hinder widespread usage: specifically, long-term storage and handling of N2O5 at low temperature and under dry conditions is difficult, and the continuous generation of N2O5 that is required for oxidation flow reactors (OFRs) or other continuous flow chambers is challenging. Thus, field studies investigating the NO3-induced SOA formation potential of ambient air are extremely limited (Palm et al., 2017). Alternative NO3 generation techniques that utilize reactions between chlorine atoms and chlorine nitrate (ClONO2) or fluorine atoms and HNO3 require cold storage of ClONO2 and handling or generation of halogen species that are reactive towards organic compounds (Burrows et al., 1985).
To address issues associated with traditional NO3 generation techniques, we developed and characterized a new method that is well suited to applications where a continuous source of N2O5 and NO3 is required, such as OFR studies. The method is capable of continuous N2O5 generation in the gas phase at room temperature using a laminar flow reactor (LFR) that is coupled to a dark OFR. N2O5 injected into the OFR decomposes to generate NO3 and initiate oxidation of reactive VOCs. Hereafter, we refer to this method as “OFR-iN2O5” (where “i” stands for “injected”). We present experimental and model characterization of OFR-iN2O5 as a function of LFR and OFR conditions, and we demonstrate the application of OFR-iN2O5 to generate and characterize SOA from the β-pinene + NO3 reaction.
2.1 N2O5 and NO3 generation
Figure 1 shows a process flow diagram of the OFR-iN2O5 method. Separate flows containing NO2 and O3 were input to a perfluoroalkoxy (PFA) tube with a 2.54 cm o.d. (outer diameter), a 2.22 cm i.d. (inner diameter), and a 152.4 cm length that was operated as an LFR. Previous studies used a similar process to generate N2O5 (Wood et al., 2003; Boyd et al., 2015), although the LFR materials, flow rates, and reagent concentrations were different. A compressed gas cylinder containing 1.00±0.02 % NO2 in N2 (Praxair) was used to supply NO2. While not used for this study, replacing NO2 with NO to avoid NO2-to-HNO3 conversion inside the gas cylinder and increasing [O3] accordingly achieves similar results. O3 was generated by passing 1750–1800 cm3 min−1 of pure O2 through a custom O3 chamber housing a mercury fluorescent lamp (GPH212T5VH, Light Sources, Inc.) or 500–1800 cm3 min−1 O2 through a corona discharge ozone generator (Enaly 1KNT). We used 1800 cm3 min−1 of O2 carrier gas flow through the LFR (Re ∼ 110, i.e., laminar flow) to achieve τLFR=20 s for reasons that are discussed in Sect. 3.1. The NO2 mixing ratio entering the LFR, [NO2]0, LFR, was calculated from the NO2 mixing ratio in the compressed gas mixture and the dilution ratio of 0–50 or 0–1300 cm3 min−1 gas flow into O2 which was controlled using mass flow controllers. The O3 mixing ratio entering the LFR, [O3]0, LFR, was measured using a 2B Technologies 106-MFT or a Teledyne M452 flow-through O3 analyzer when generated from the mercury lamp or corona discharge source, respectively. The output of the LFR was mixed with a carrier gas containing 3.8 L min−1 synthetic air and then injected into a Potential Aerosol Mass (PAM) OFR (Aerodyne Research, Inc.), which is a horizontal 13.3 L aluminum cylindrical chamber operated in continuous flow mode (Kang et al., 2007; Lambe et al., 2011, 2019) with 6.5 L min −1 flow through the reactor. The mean residence time in the OFR (τOFR) was 120±34 s (±1σ), as obtained from measurements of 10 s pulsed inputs of NO2 to the OFR obtained using a 2B Technologies Model 405 NOx analyzer (Fig. S1). Across all experiments, the relative humidity in the OFR (RHOFR) was controlled in the range of 7 %–85 % at 23–25 ∘C by passing the carrier gas through a Nafion humidifier (Perma Pure LLC) or heated recirculating water bath (NESLAB Instruments, Inc.) prior to mixing with the LFR outflow. The O3 mixing ratio at the exit of the OFR was measured with a 2B Technologies Model 106-M ozone analyzer.
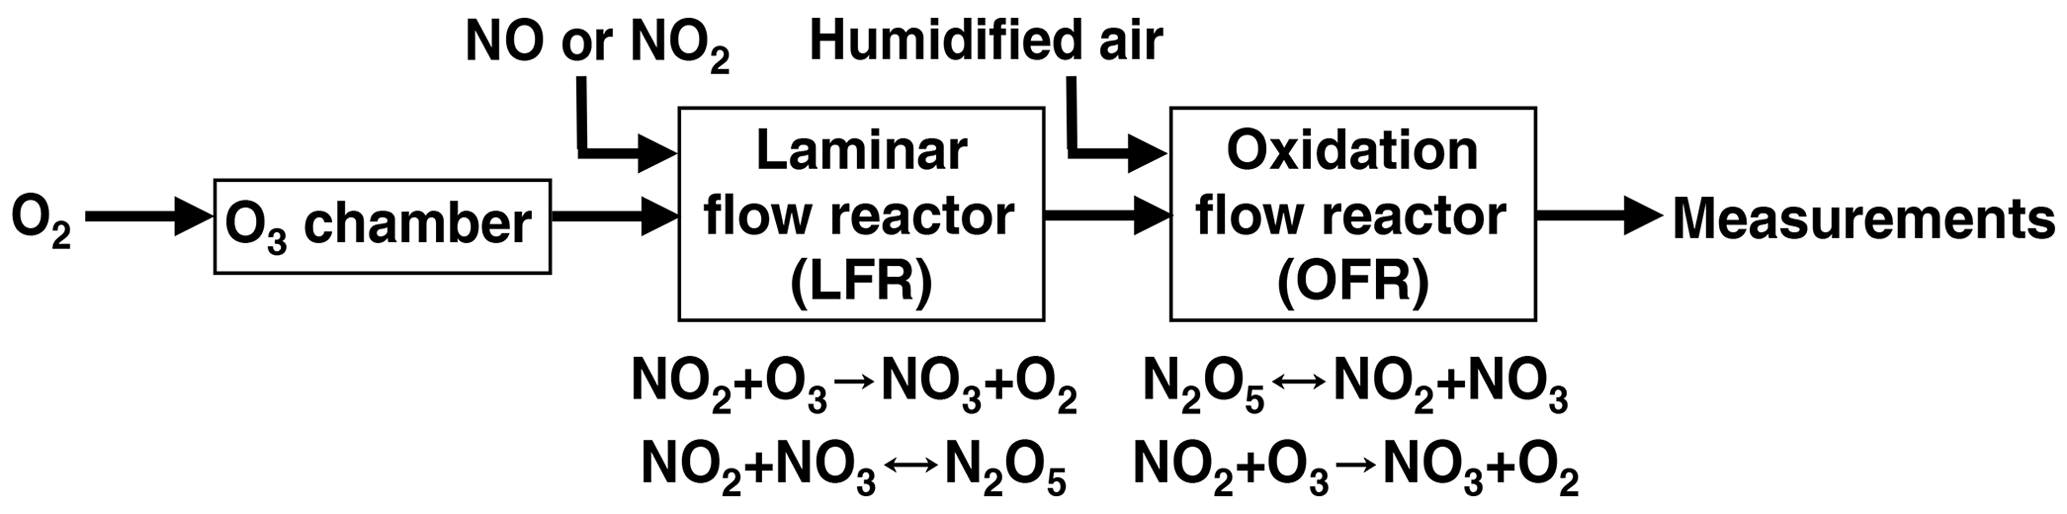
Figure 1Process flow diagram of the OFR-iN2O5 technique used to generate nitrate radicals (NO3).
2.1.1 OFR-iN2O5 characterization studies
In one set of experiments, the integrated NO3 exposure (NO3exp), defined here as the product of the average NO3 concentration and τOFR, was characterized by measuring the decay of VOC tracers reactive towards NO3 using a Tofwerk/Aerodyne Vocus proton transfer reaction time-of-flight mass spectrometer (PTR-MS; Krechmer et al., 2018). For this purpose, the tracer decay method is advantageous to direct NO3 measurements at the OFR inlet and/or outlet, because potential NO3 concentration gradients inside the OFR that might otherwise bias NO3exp are accounted for. Tracers that were liquid at room temperature were injected into the OFR through a 10.2 cm length of 0.0152 cm i.d. Teflon tubing at a liquid flow rate of about 0.94 µL h−1 using a syringe pump, prior to evaporation into a 2.4 L min−1 N2 carrier gas. In preliminary studies, tracers such as isoprene and β-pinene were too reactive towards NO3 to facilitate accurate characterization of NO3exp over the majority of the OFR-iN2O5 conditions that were investigated. Thus, experiments described in this paper used mixtures of tracers with bimolecular ranging from approximately 10−16 to 10−13 cm3 molecules−1 s−1 and cm3 molecules−1 s−1 (Table S1). Acetonitrile was used as a nonreactive tracer. In “low O3” experiments ([O3] to 300 ppm) a mixture of acetonitrile, butanal, thiophene, 2, 3-dihydrobenzofuran, and naphthalene-d8 (C10D8), each with mixing ratios of approximately 660, 50, 56, 40, and 18 ppb, respectively, was used. For this tracer mixture, the total external NO3 reactivity (NO3Rext), which is the summed product of each tracer mixing ratio and its NO3 rate constant, was approximately 0.07 s−1. Naphthalene-d8 was introduced by flowing 5 cm3 min−1 N2 through a Teflon tube packed with solid C10D8. In “high O3” experiments ([O3] to 7400 ppm), which generated higher NO3exp, a mixture of acetonitrile (275 ppb), toluene (45 ppb), o-xylene (40 ppb), p-cymene (31 ppb), 1, 2, 4-trimethylbenzene (35 ppb), 1-butanol (53 ppb), benzaldehyde (47 ppb), butanal (53 ppb), and thiophene (56 ppb) was used, with NO3Rext≈0.38 s−1.
In another set of experiments that were conducted as part of the Aerosol Chemical Monitor Calibration Center (ACMCC) particulate organonitrates (pON) experiment (Albinet et al., 2019), direct measurements of NO3 generated via OFR-iN2O5 were performed using a newly developed “incoherent broad band cavity enhanced absorption spectroscopy” (IBBCEAS) technique (Cirtog et al., 2020; Fouqueau et al., 2020). The IBBCEAS instrument that was used measured absorption as a function of wavelength between λ=640 and 680 nm, thereby allowing simultaneous measurements of NO2 and O3 along with NO3. During this experiment, pON were generated in a PAM OFR that used [O3]–160 ppm and [NO2], 1.0, and 2.0. IBBCEAS has been used to measure trace NO3 levels in laboratory and field studies (Venables et al., 2006; Kennedy et al., 2011) utilizing measurement principles that are described in detail by Fiedler et al. (2003) and Langridge et al. (2008). Briefly, measurements were conducted by exciting a high-finesse optical cavity formed by two high reflectivity mirrors with an incoherent broadband source centered on the λ=662 nm absorption cross section of NO3 ( cm2, Orphal et al., 2003). Photons resonate between the two mirrors, allowing an effective path length of up to 4.5 km inside the cavity. The absorption coefficient of the sample in the cavity, α(λ), was calculated using Eq. (1):
where α(λ) is the absorption coefficient of the OFR sample in the instrument, I(λ) and I0(λ) were the measured transmitted intensities in the presence and absence of the sample, d=61 cm was the distance between the cavity mirrors, and R(λ) was the mirror reflectivity (∼99.98 %). I0(λ) was obtained by stopping the OFR sample through the instrument and flowing nitrogen from a cylinder (Air Liquide). A period of at least 30 s was allowed between the measurement of I0(λ) and I(λ) to ensure the complete purge of the instrument. R(λ) was measured before each experiment using a certified calibration cylinder containing 600 ppb NO2 in zero air (Air Liquide). Concentrations were calculated by applying a least square fit to the measured α(λ) considering the absorbing species in the sample:
where NO2, NO3, and O3 are the species absorbing in the spectral region of the instrument, α(λ) represents the respective absorption cross sections convoluted with the apparatus function (Vandaele et al., 1998; Voigt et al., 2001; Orphal et al., 2003), and p(λ) represents a cubic polynomial to correct baseline deformations due to small LED intensity variations. To avoid saturation of the IBBCEAS in these experiments, the OFR sample was diluted by a controlled dilution factor ranging from 9 to 41, and the detection response was deliberately lowered by reducing the optical path length. The sampling line and optical cavity were made of PFA. The residence time in the IBBCEAS sampling line and instrument ranged from 8.3 to 21.8 s. At these residence times, the calculated transmission efficiencies of NO3 from the OFR to the IBBCEAS ranged from 0.3 % to 11 %, assuming a NO3 wall loss rate constant of 0.27 s−1 (Kennedy et al., 2011). Corrections to measured NO3 and NO2 values accounting for N2O5 thermal decomposition and sample dilution were applied to the IBBCEAS results presented in this paper.
To demonstrate the application of OFR-iN2O5 to generate SOA, the chemical composition and mass concentration of β-pinene + NO3 condensed-phase oxidation products was measured with an Aerodyne long-time-of-flight aerosol mass spectrometer (L-ToF-AMS) and/or an aerosol chemical speciation monitor (ACSM). A syringe pump was used to deliver β-pinene (10 %, v∕v, in carbon tetrachloride or 50 %, v∕v, in ethanol) into the carrier gas flow at liquid flow rates ranging from 0.94 to 19 µL h−1. Results presented in this paper assume an AMS or ACSM collection efficiency of 0.5 (Middlebrook et al., 2012) and a relative ionization efficiency of particulate organics equal to 1.6 (Xu et al., 2018).
2.2 Photochemical model
We used the KinSim chemical kinetic solver to calculate concentrations of radical and oxidant species (Peng et al., 2015; Peng and Jimenez, 2017, 2019). The KinSim mechanism shown in Table S2 was adapted from Palm et al. (2017) to model NO3 and N2O5 concentrations in the LFR and OFR. Inputs to the LFR-KinSim model were [O3]0, LFR, [NO2]0, LFR, RH=1 %, T=24 ∘C, τLFR=20 s (modeled as plug flow, see Sect. 3.1), and first-order wall loss rates of NO3 and N2O5 ( and ). Inputs to the OFR-KinSim model were [O3], [NO2], [NO3], and [N2O5] output from the LFR scaled by a measured dilution factor of 4.4; RH and T measured in the OFR; τOFR=120 s, , and ; and input VOC tracer concentrations and their values. Because the calculated N2O5 residence time in the OFR inlet (∼0.04 s) was short compared with the N2O5 decomposition timescale at T=23–25 ∘C (∼20 s), potential thermal decomposition of N2O5 during the dilution step was not considered in the model.
2.2.1 LFR and OFR and values
Published values onto tubing with a 1 cm (Teflon) and a 4 cm (Pyrex) i.d. are 0.2 and 0.1 s−1, respectively (Dubé et al., 2006; Wood et al., 2003), which bound the 2.22 cm i.d. of the LFR used in this study. Assuming kw is inversely proportional to the internal diameter of the tube, we assumed s−1. Extrapolating this value to the OFR (20.32 cm i.d.) yielded s−1. At fixed OFR-iN2O5 conditions that are summarized in Table S3, varying between 0 and 0.3 s−1 changed the NO3exp achieved in the OFR by 0.3 %. Results were even less sensitive to the assumed for the OFR because of its larger diameter and higher NO3Rext.
Published values onto dry (RH ≈20 %) Pyrex or PFA tubing with 4 and 7 cm i.d. are 0.04 and 0.009 s−1, respectively (Wagner et al., 2008; Gržinić et al., 2015). Extrapolating these values to the LFR used here and then averaging them together yielded s−1, which was applied in the LFR-KinSim model. In preliminary OFR-KinSim modeling studies, we assumed s−1 (Palm et al., 2017). However, as will be discussed in Sect. 3.3, was humidity-dependent and required modifications to match measured NO3exp values as a function of RH OFR.
3.1 LFR design considerations
The optimal LFR residence time (τLFR) was identified using model simulations of the injection of 300 ppm O3 and NO2 into the LFR followed by dilution and injection of the LFR output into an OFR operated with τOFR=120 s. Figure S2 plots the NO3exp achieved in the OFR as a function of τLFR ranging from 1 to 60 s. Potential entry length effects that may have influenced results obtained below τLFR≈4–5 s were not considered in the model. Figure S2 shows that the maximum NO3exp in the OFR was obtained at τLFR=20 s at room temperature (unheated case); other NO3exp values were normalized to this condition. Below τLFR=20 s, NO3exp was suppressed due to higher NO2 levels entering the OFR. Above τLFR=20 s, NO3exp was suppressed due to lower N2O5 levels entering the OFR because of more extensive LFR wall loss.
In traditional studies of NO3 oxidative aging processes that are conducted at low pressure and short residence time (τ∼1 s), N2O5 is heated to generate a burst of NO3 prior to injection into the system (Knopf et al., 2011). While not experimentally considered in this work, we modeled the NO3exp achieved assuming complete thermal dissociation of N2O5 between the LFR and OFR – for example, by heating to 120 ∘C for 300 ms (Wood et al., 2003). Figure S2 suggests that the effect of heating N2O5 on NO3exp was most significant at short τLFR, where [N2O5] at the exit of the LFR was higher due to less wall loss and room-temperature decomposition. For example, at τLFR=8 s, the modeled NO3exp was 2.8 times higher in the complete-dissociation case than in the unheated case, whereas NO3exp increased by factors of 2.3 and 1.5 at τLFR=20 and 60 s. Thus, a combination of reducing τLFR and heating N2O5 at the exit of the LFR increases NO3exp and should be explored for future advanced implementations of OFR-iN2O5.
3.2 Example OFR-iN2O5 characterization studies
Figure 2a shows time series of O3 and NO2 concentrations during an OFR-iN2O5 characterization experiment where RHOFR=11 %, ppm, and to 320 ppm. Figure 2b shows time series of acetonitrile (C2H3N), butanal (C4H8O), thiophene (C4H4S), 2, 3-dihydrobenzofuran (C8H8O), and naphthalene-d8 (C10D8) signals measured during the same period. Following NO3 generation, the fractional decay of C2H3N, C4H8O, C4H4S, and C8H8O increased with increasing tracer , as expected. C8H8O was too reactive to measure any significant changes in its decay as a function of OFR-iN2O5 conditions, as shown in Fig. 2; however, maximum decay of C4H8O and C4H4S was observed at [NO2] in this experiment. Decay of naphthalene-d8, which was influenced by both NO3 and NO2 concentrations (Table S1), was maximized at to 1.1.
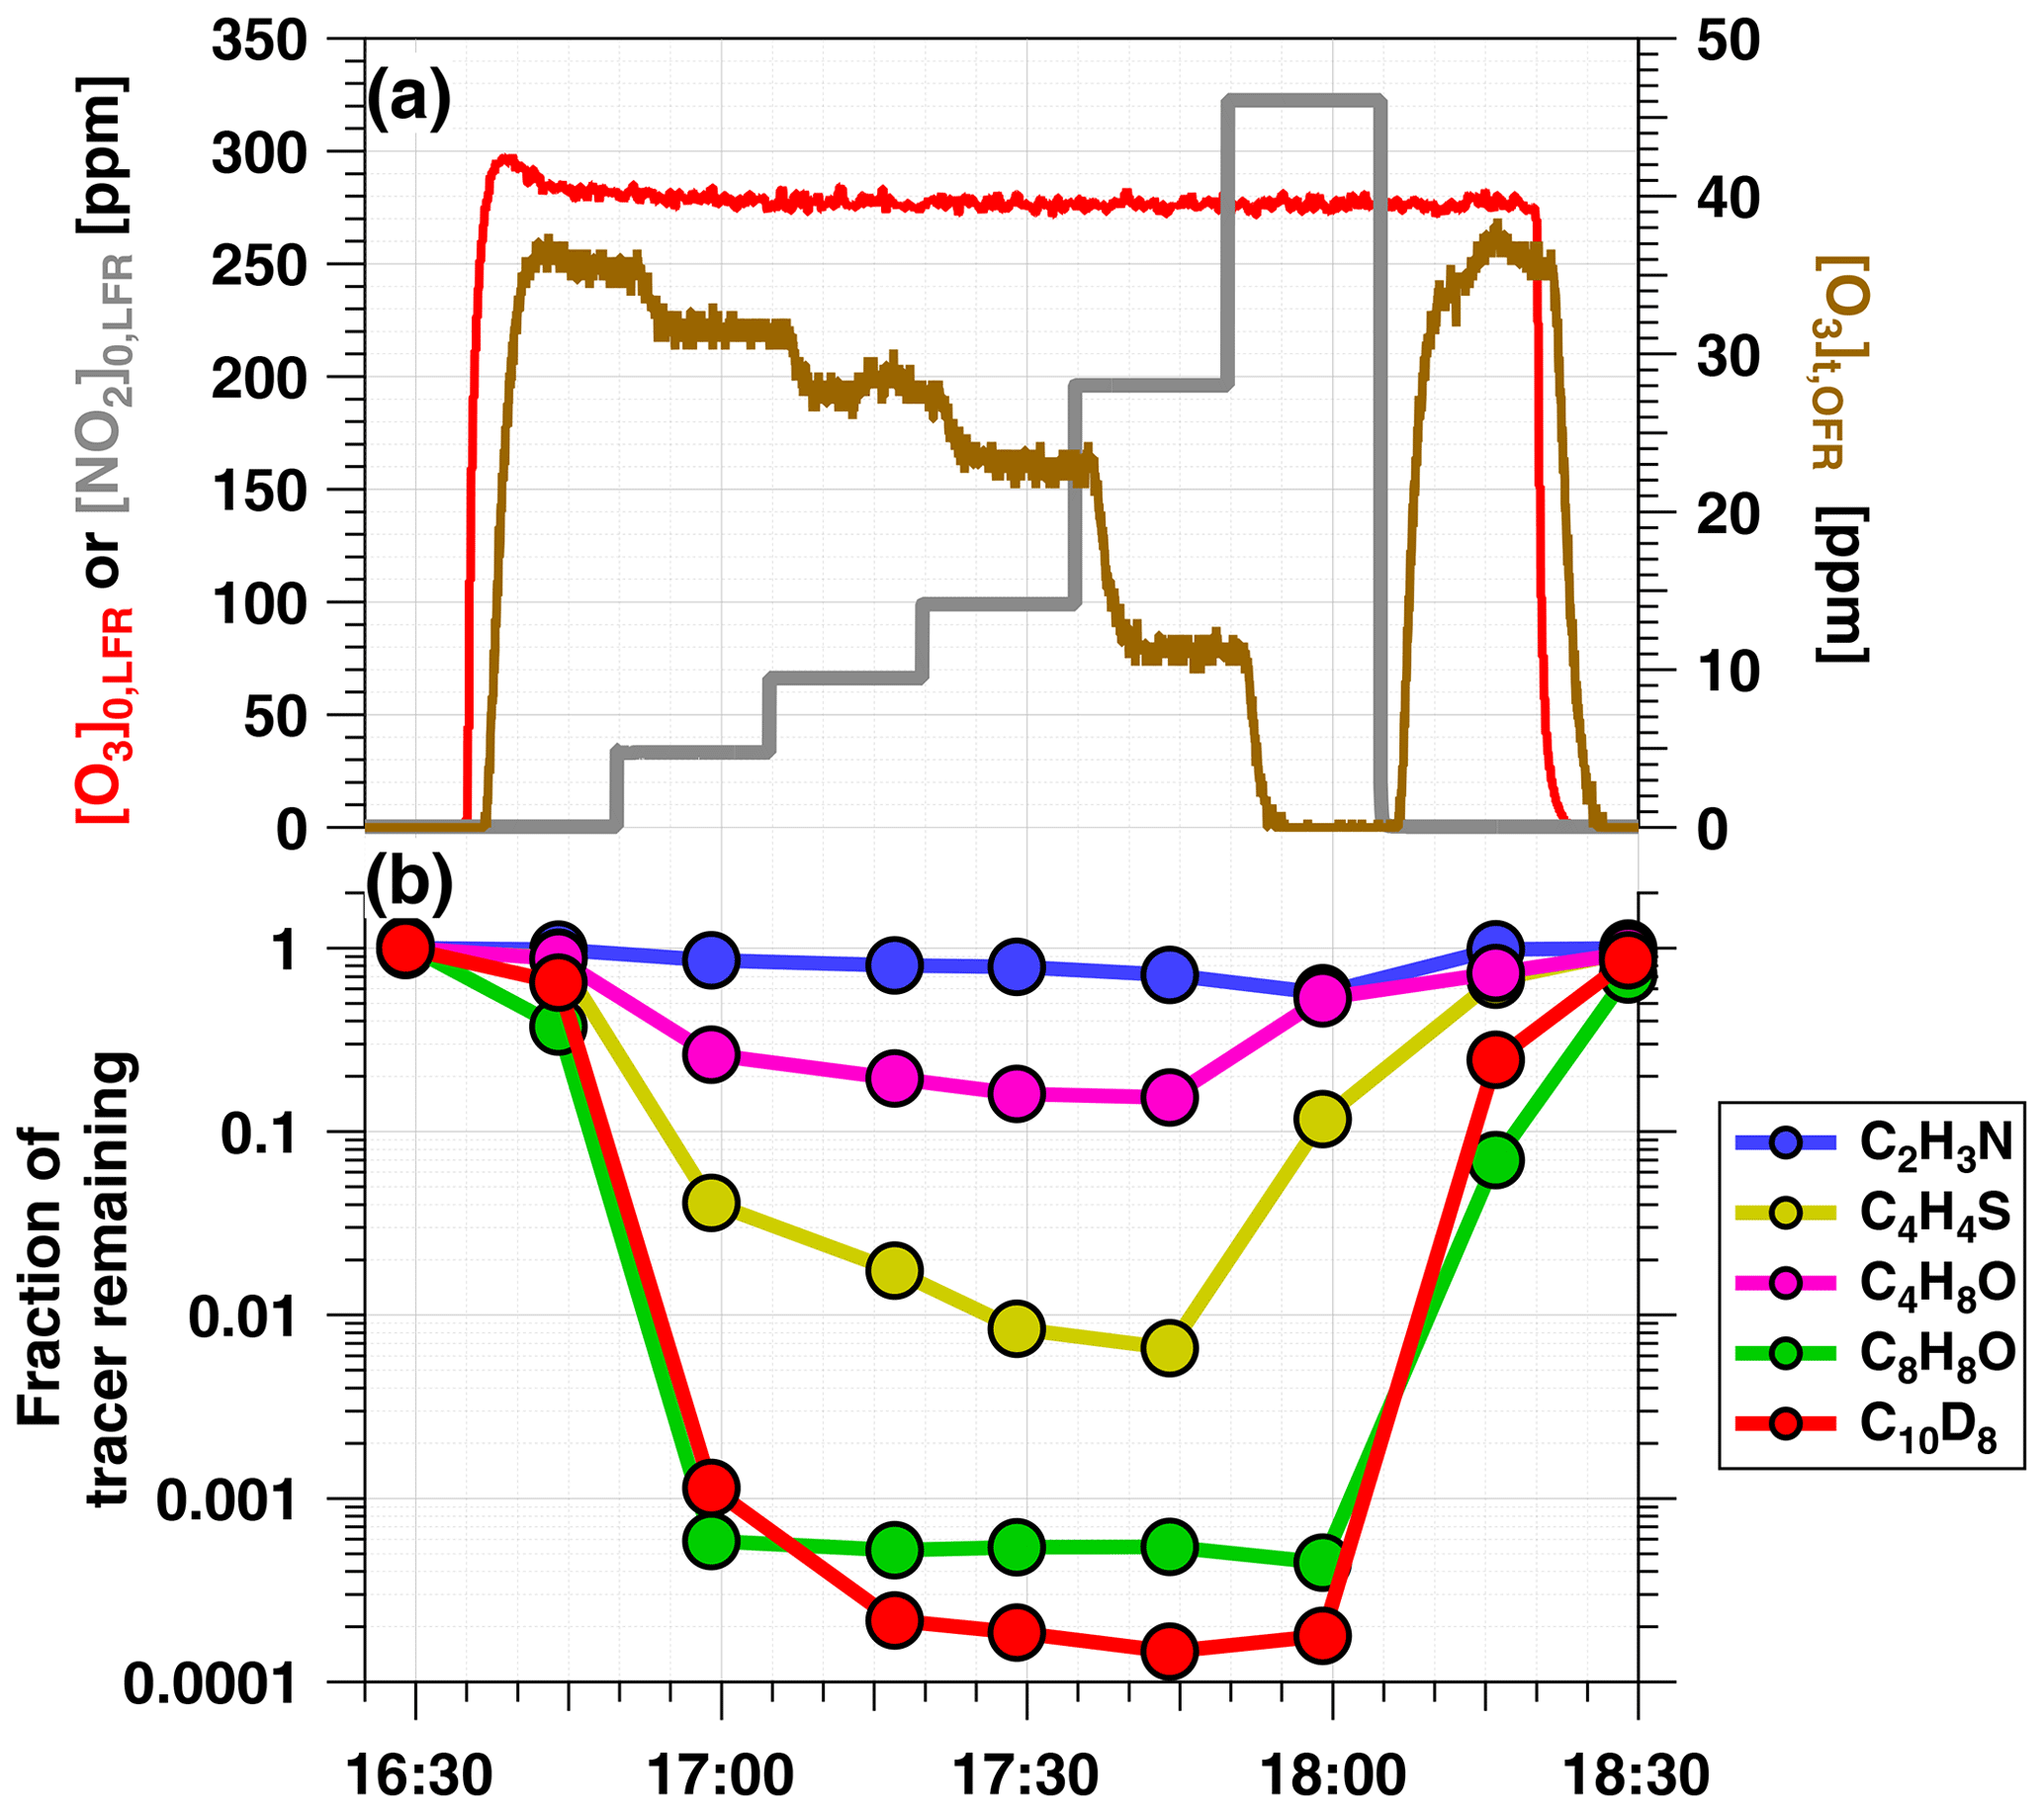
Figure 2Time series from a representative OFR-iN2O5 characterization experiment conducted at RHOFR=11 % of (a) O3 and NO2 mixing ratios input to LFR (left axis) and O3 measured at the exit of the OFR (right axis), and (b) VOC tracers measured with PTR-MS: acetonitrile (C2H3N), butanal (C4H8O), thiophene (C4H4S), 2, 3-dihydrobenzofuran (C8H8O), and naphthalene-d8 (C10D8).
To confirm that the VOC degradation shown in Fig. 2b was due to reaction with NO3, Fig. 3 shows IBBCEAS measurements of NO3 obtained in separate OFR-iN2O5 characterization experiments that used –160 ppm and and 2.0. The maximum IBBCEAS signal observed at λ=662 nm indicated the presence of NO3, as is evident from comparison with the wavelength-dependent absorption cross section of NO3 obtained by Orphal et al. (2003) and plotted in Fig. 3b. Additionally, Fig. S3 shows the relative rate coefficient obtained from the decay of C4H8O and C4H4S measured with PTR-MS. We measured a relative rate coefficient of 2.83, which is in agreement with a relative rate coefficient value of 3.22±0.95 calculated from C4H8O+NO3 and C4H4S+NO3 rate coefficients (Atkinson, 1991; D'Anna et al., 2001). Ions corresponding to peroxy butyl nitrate, nitrothiophene, and nitronaphthalene-d7, which are known NO3 oxidation products of C4H8O, C4H4S, and C10D8, respectively (Atkinson et al., 1990; Jenkin et al., 2003; Saunders et al., 2003; Cabañas et al., 2005), were also detected with PTR-MS. Tracer decay experiments similar to the measurements shown in Fig. 2 were repeated over [O3]0, LFR ranging from 10 to 7400 ppm, [NO2]0, LFR ranging from 0 to 7200 ppm, and RHOFR ranging from 7 % to 85 %. For experiments where [O3] ppm, NO3exp was calculated from the decay of o-xylene because (1) p-cymene has a large ionized fragment at (thus interfering with detection of toluene), (2) NO3 oxidation products were generated that interfered with detection of oxygenated tracers (butanol, benzaldehyde, and butanal), and (3) the remaining tracers that were used were too reactive towards NO3 to accurately constrain NO3exp.
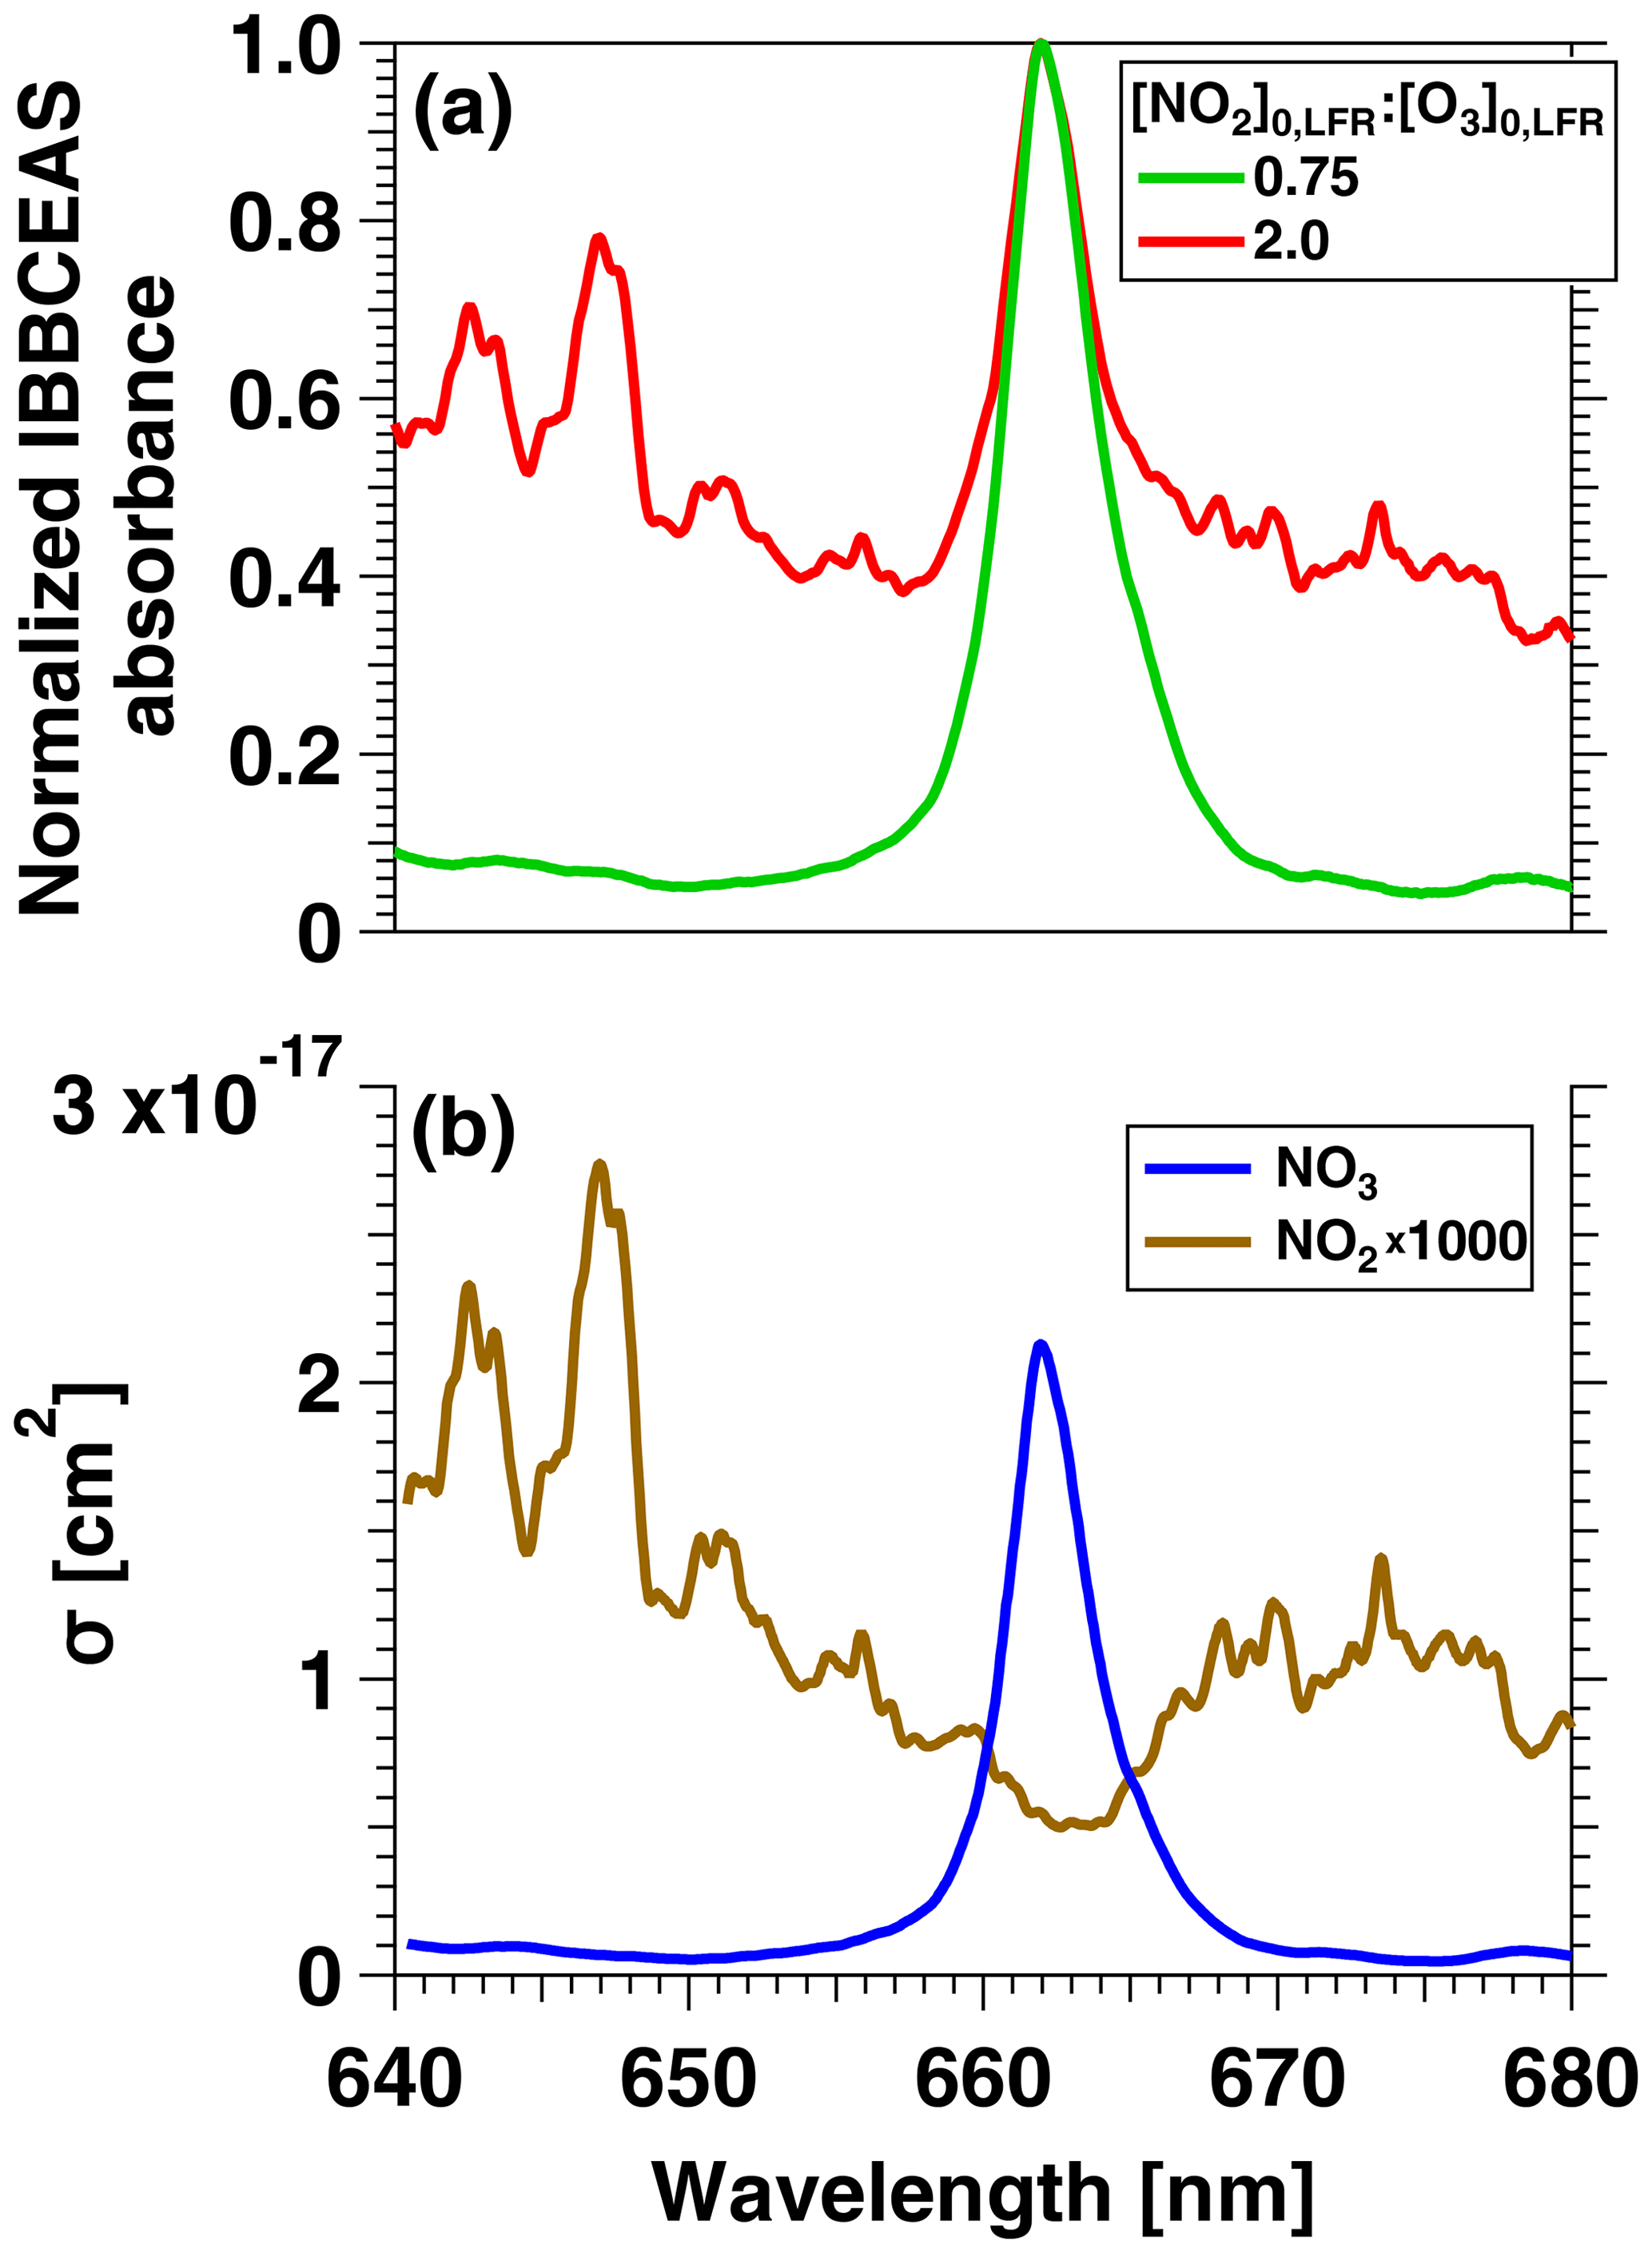
Figure 3(a) IBBCEAS measurements of NO2 and NO3 absorbance obtained from an OFR-iN2O5 characterization experiment conducted at [O3]–160 ppm and [NO2] and 2.0. (b) Absorption cross sections of NO2 and NO3 (Vandaele et al., 1998; Orphal et al., 2003).
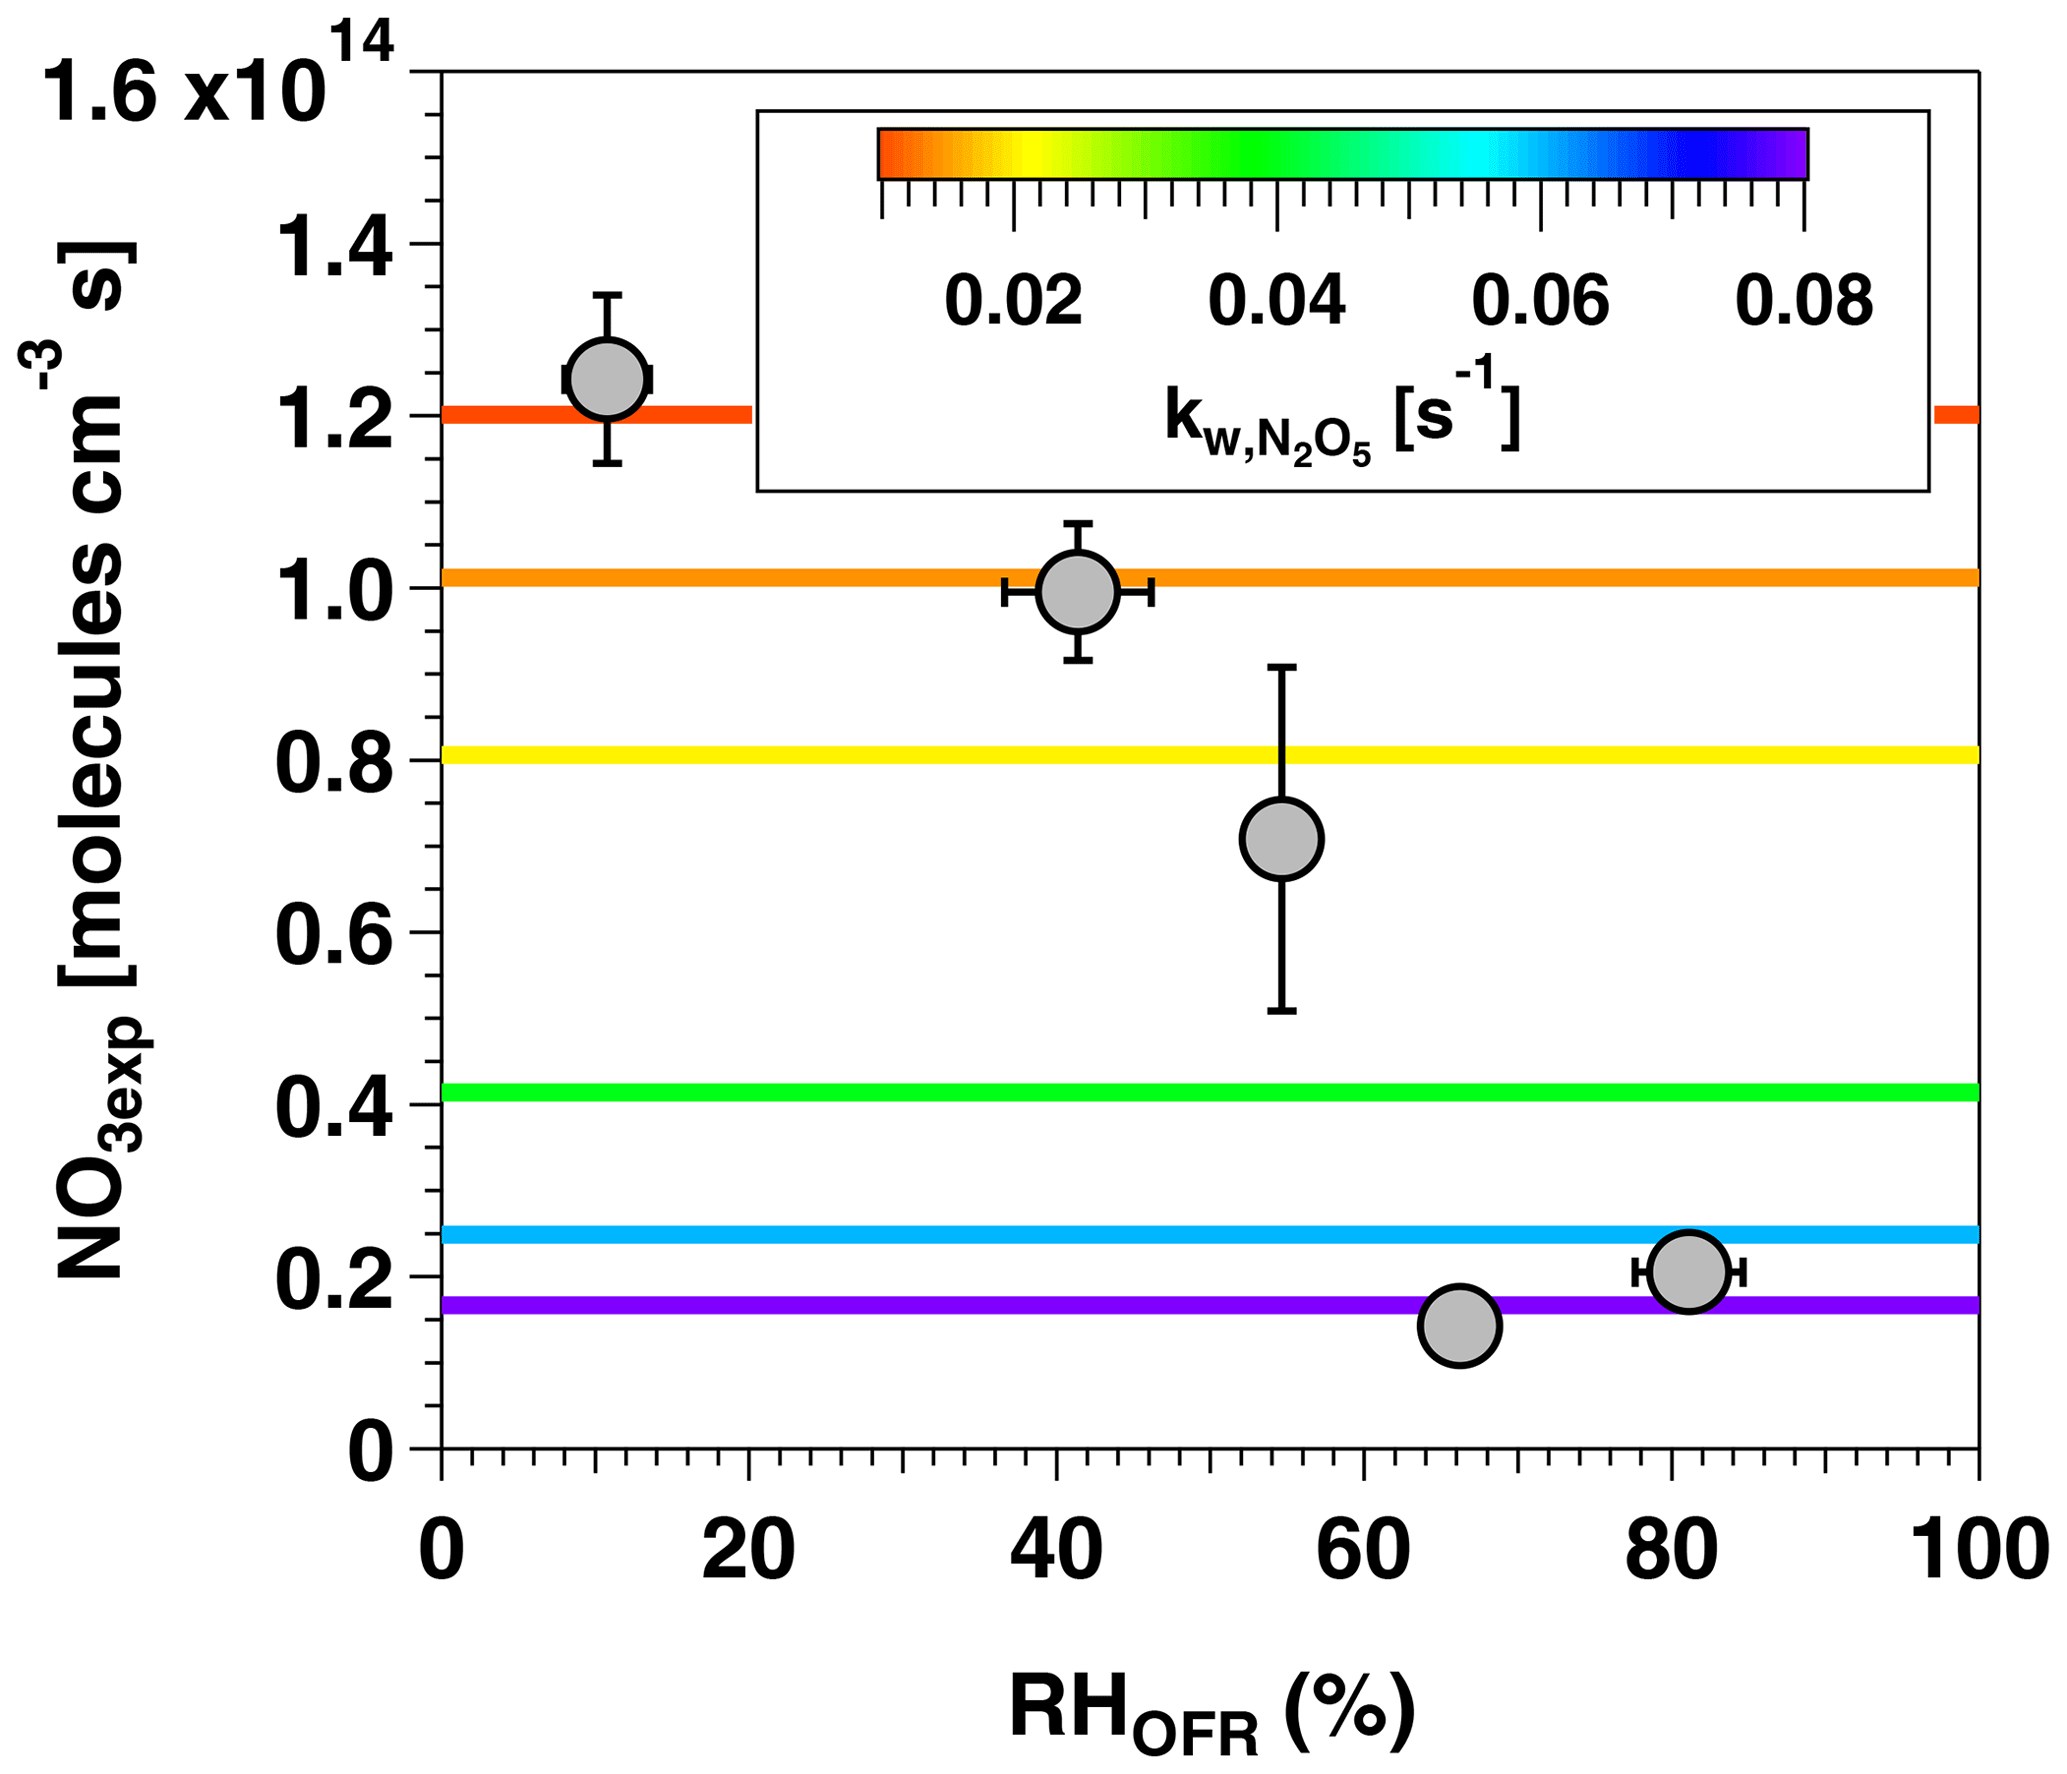
Figure 4NO3exp as a function of RHOFR at [O3] ppm and [NO2] ppm. Horizontal lines represent N2O5 wall loss rate constants ranging from 0.01 to 0.08 s−1 that were input to the OFR-iN2O5 KinSim mechanism (Table S2).
3.3 Effect of RHOFR, [O3]0, LFR, and [NO2]0, LFR on NO3exp
Figure 4 shows NO3exp as a function of RHOFR at [O3] ppm and [NO2] ppm. Under these conditions, NO3exp decreased from 1.2×10¹⁴ to 2.0×10¹³ molecules cm−3 s as RHOFR increased from 11 % to 81 %. We hypothesize that this result is due to more efficient hydrolysis of N2O5 to HNO3 on the wetted walls of the OFR at higher RH, thereby suppressing NO3exp relative to values obtained at lower RH conditions. In an attempt to model this behavior, values input to the model were adjusted as a function of RHOFR. Figure 4 suggests that humidity-dependent values ranging from 0.01 to 0.08 s−1 were required to cover the range of measured NO3exp . These values agreed within a factor of 2 or better with humidity-dependent values ranging from 0.014 to 0.040 s−1 measured by Palm et al. (2017) in a similar OFR and were applied in subsequent model calculations.
Figure 5 shows NO3exp as a function of [O3]0, LFR for measurements with [NO2] and RH %. The equivalent ambient photochemical age shown on the right y axis was calculated assuming a 14 h average nighttime NO3 mixing ratio of 30 ppt and a 10 h daytime NO3 mixing ratio of 0 ppt (Asaf et al., 2010). NO3exp increased with increasing [O3]0, LFR due to increased NO3 production from higher [N2O5]. Over the range of measured conditions, increasing [O3]0, LFR from 33 to 7092 ppm increased NO3exp from 6.4×10¹² to 4.0×10¹⁵ molecules cm−3 s−1. The black line in Fig. 5 represents NO3exp modeled using the mechanism shown in Table S2. Measured and modeled NO3exp values agreed within a factor of 2 or better above [O3] ppm, and the gain in NO3exp as a function of [O3]0, LFR was highest between [O3] and 300 ppm. Over this range of [O3]0, LFR, the NO2 oxidation lifetime with respect to O3 decreased from 115 to 4 s. Because τLFR=20 s, under this range of LFR conditions, the NO2 lifetime in the LFR was long enough that high NO2 levels exiting the LFR suppressed NO3exp in the OFR. In contrast, increasing [O3]0, LFR from 300 to 7000 ppm decreased the NO2 oxidation lifetime with respect to O3 from 4 to 0.2 s, and [NO2] exiting the LFR was too low to significantly affect NO3exp. To support this hypothesis, Fig. 6 plots NO3exp as a function of [NO2] at [O3] ppm and 6850±400 ppm. Here, we incorporated NO3exp values obtained over RHOFR=11 % to 81 % for better statistics, and normalized each NO3exp value to the maximum NO3exp obtained at the same RH. Figure 6 shows that at [O3] ppm, the maximum NO3, exp was achieved at [NO2] to 0.7. Conversely, at [O3] ppm, the maximum NO3exp value was achieved at [NO2].
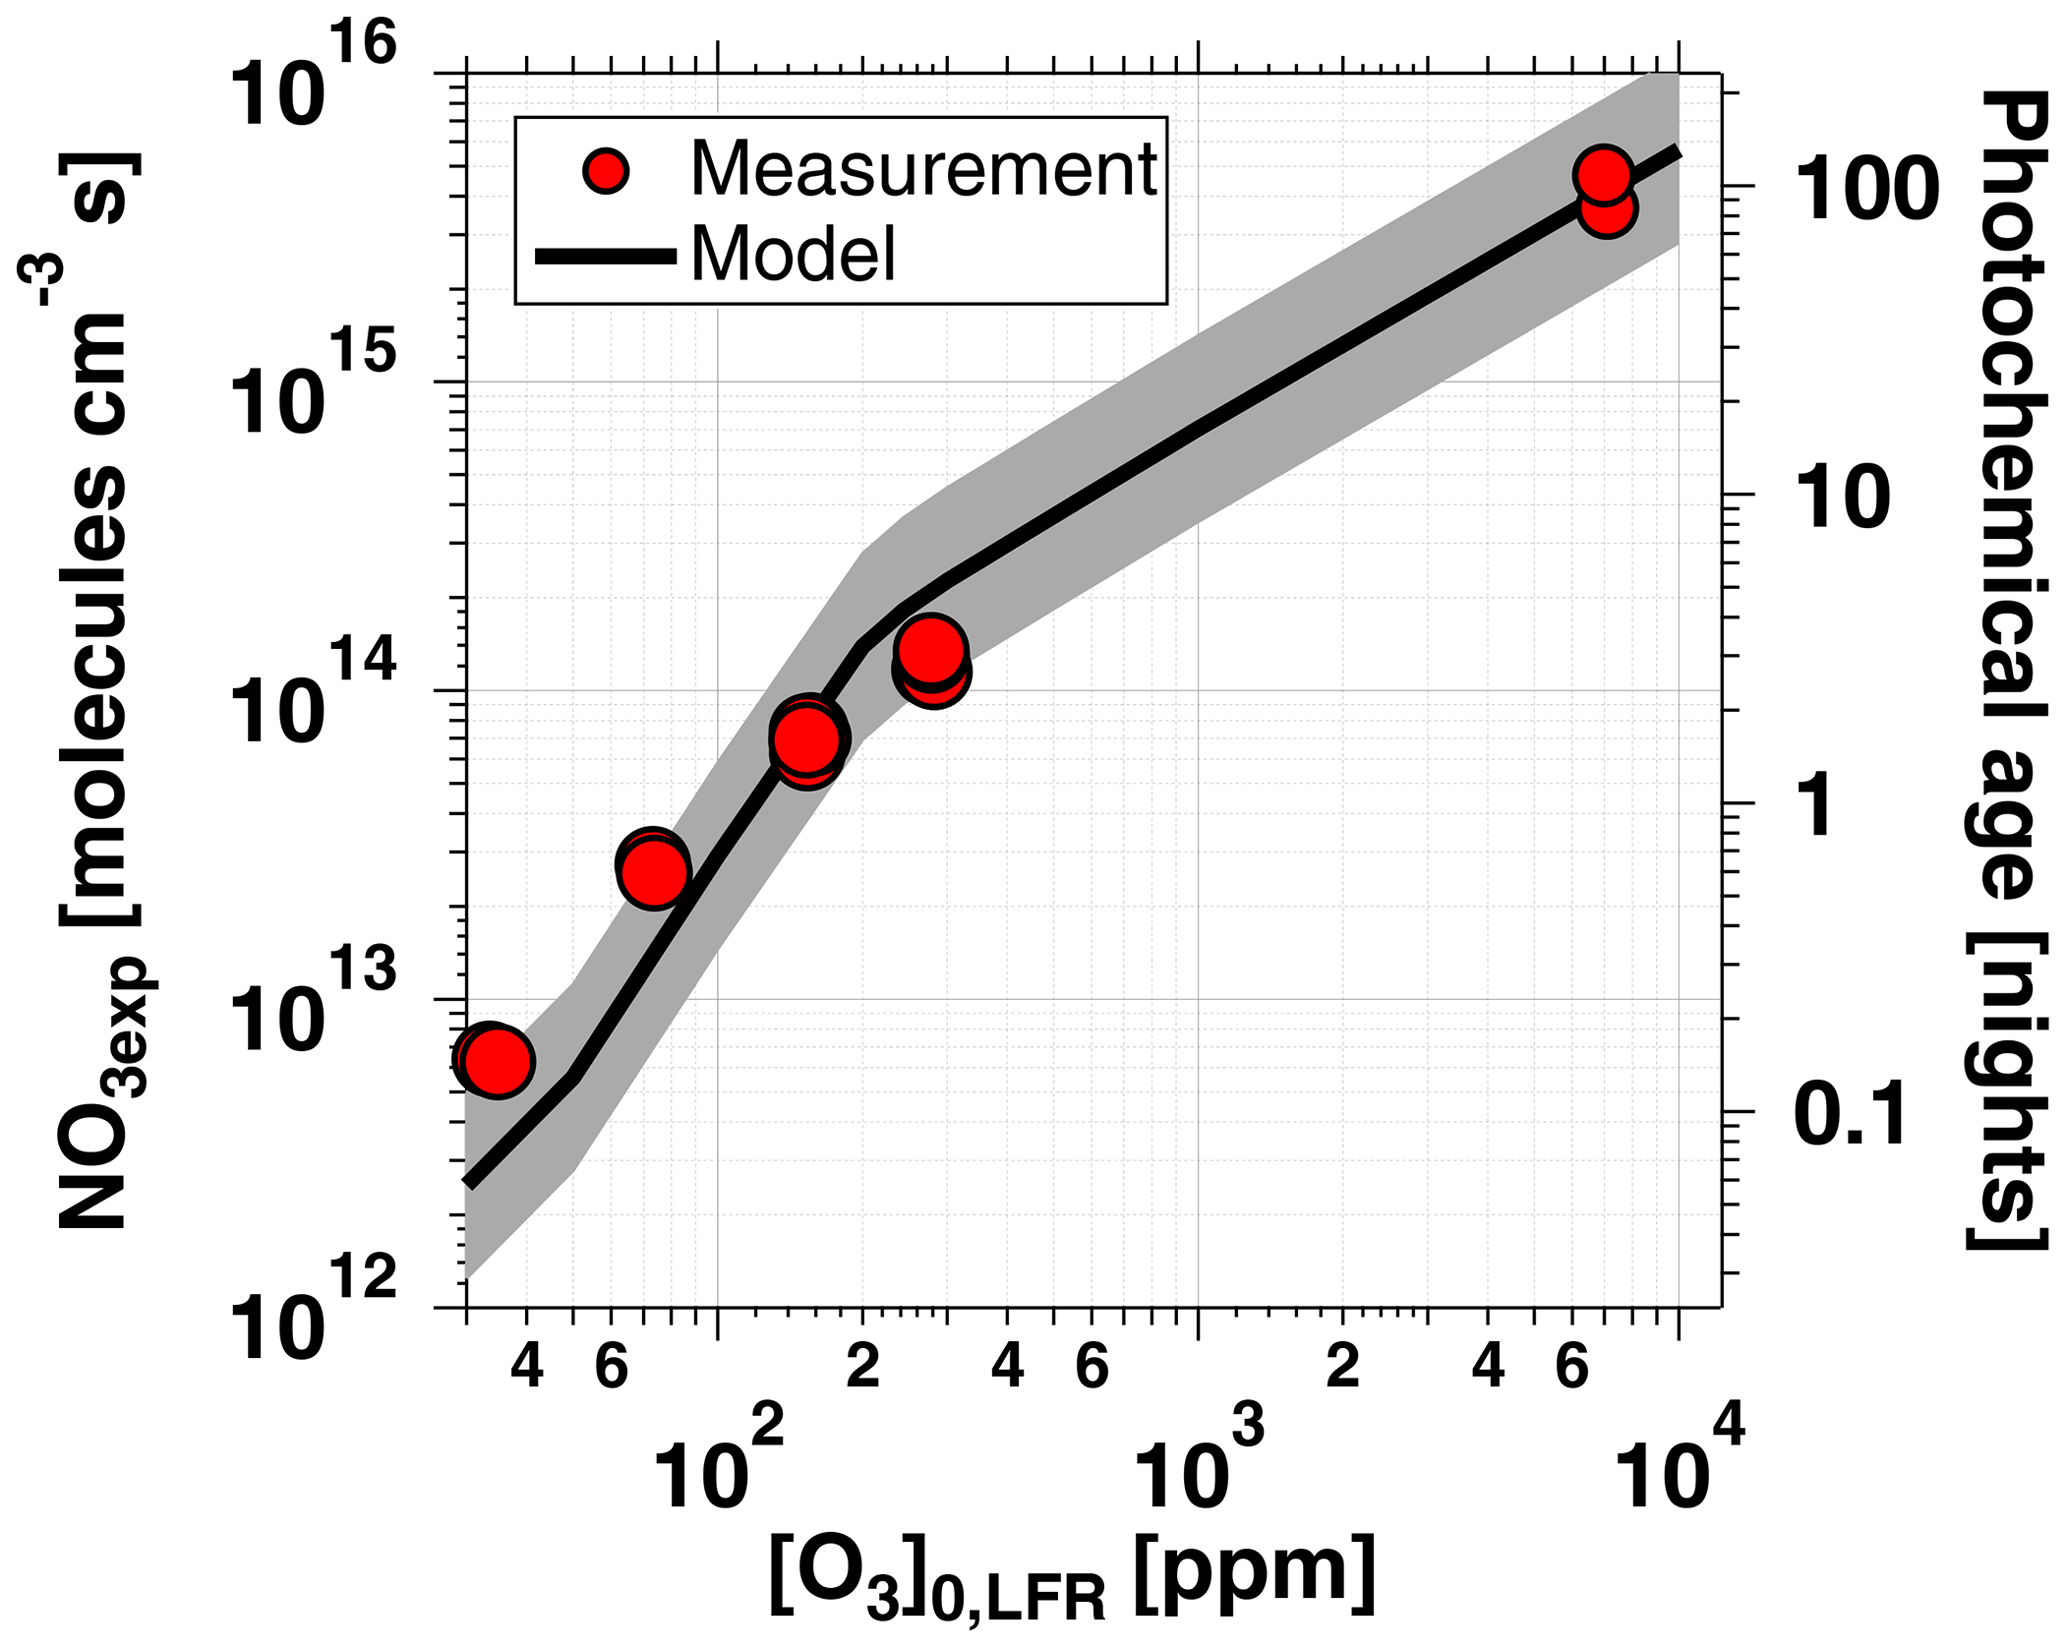
Figure 5NO3exp as a function of [O3]0, LFR for measurements with [NO2]. Equivalent ambient photochemical age was calculated assuming a 14 h average nighttime NO3 mixing ratio of 30 ppt and 10 h daytime average NO3 mixing ratio of 0 ppt (Asaf et al., 2010). Model inputs were s−1 and s−1 ( ppm) or 0.38 s−1 ([O3] ppm). The shaded region encompasses model output scaled by factors of 0.5 and 2.
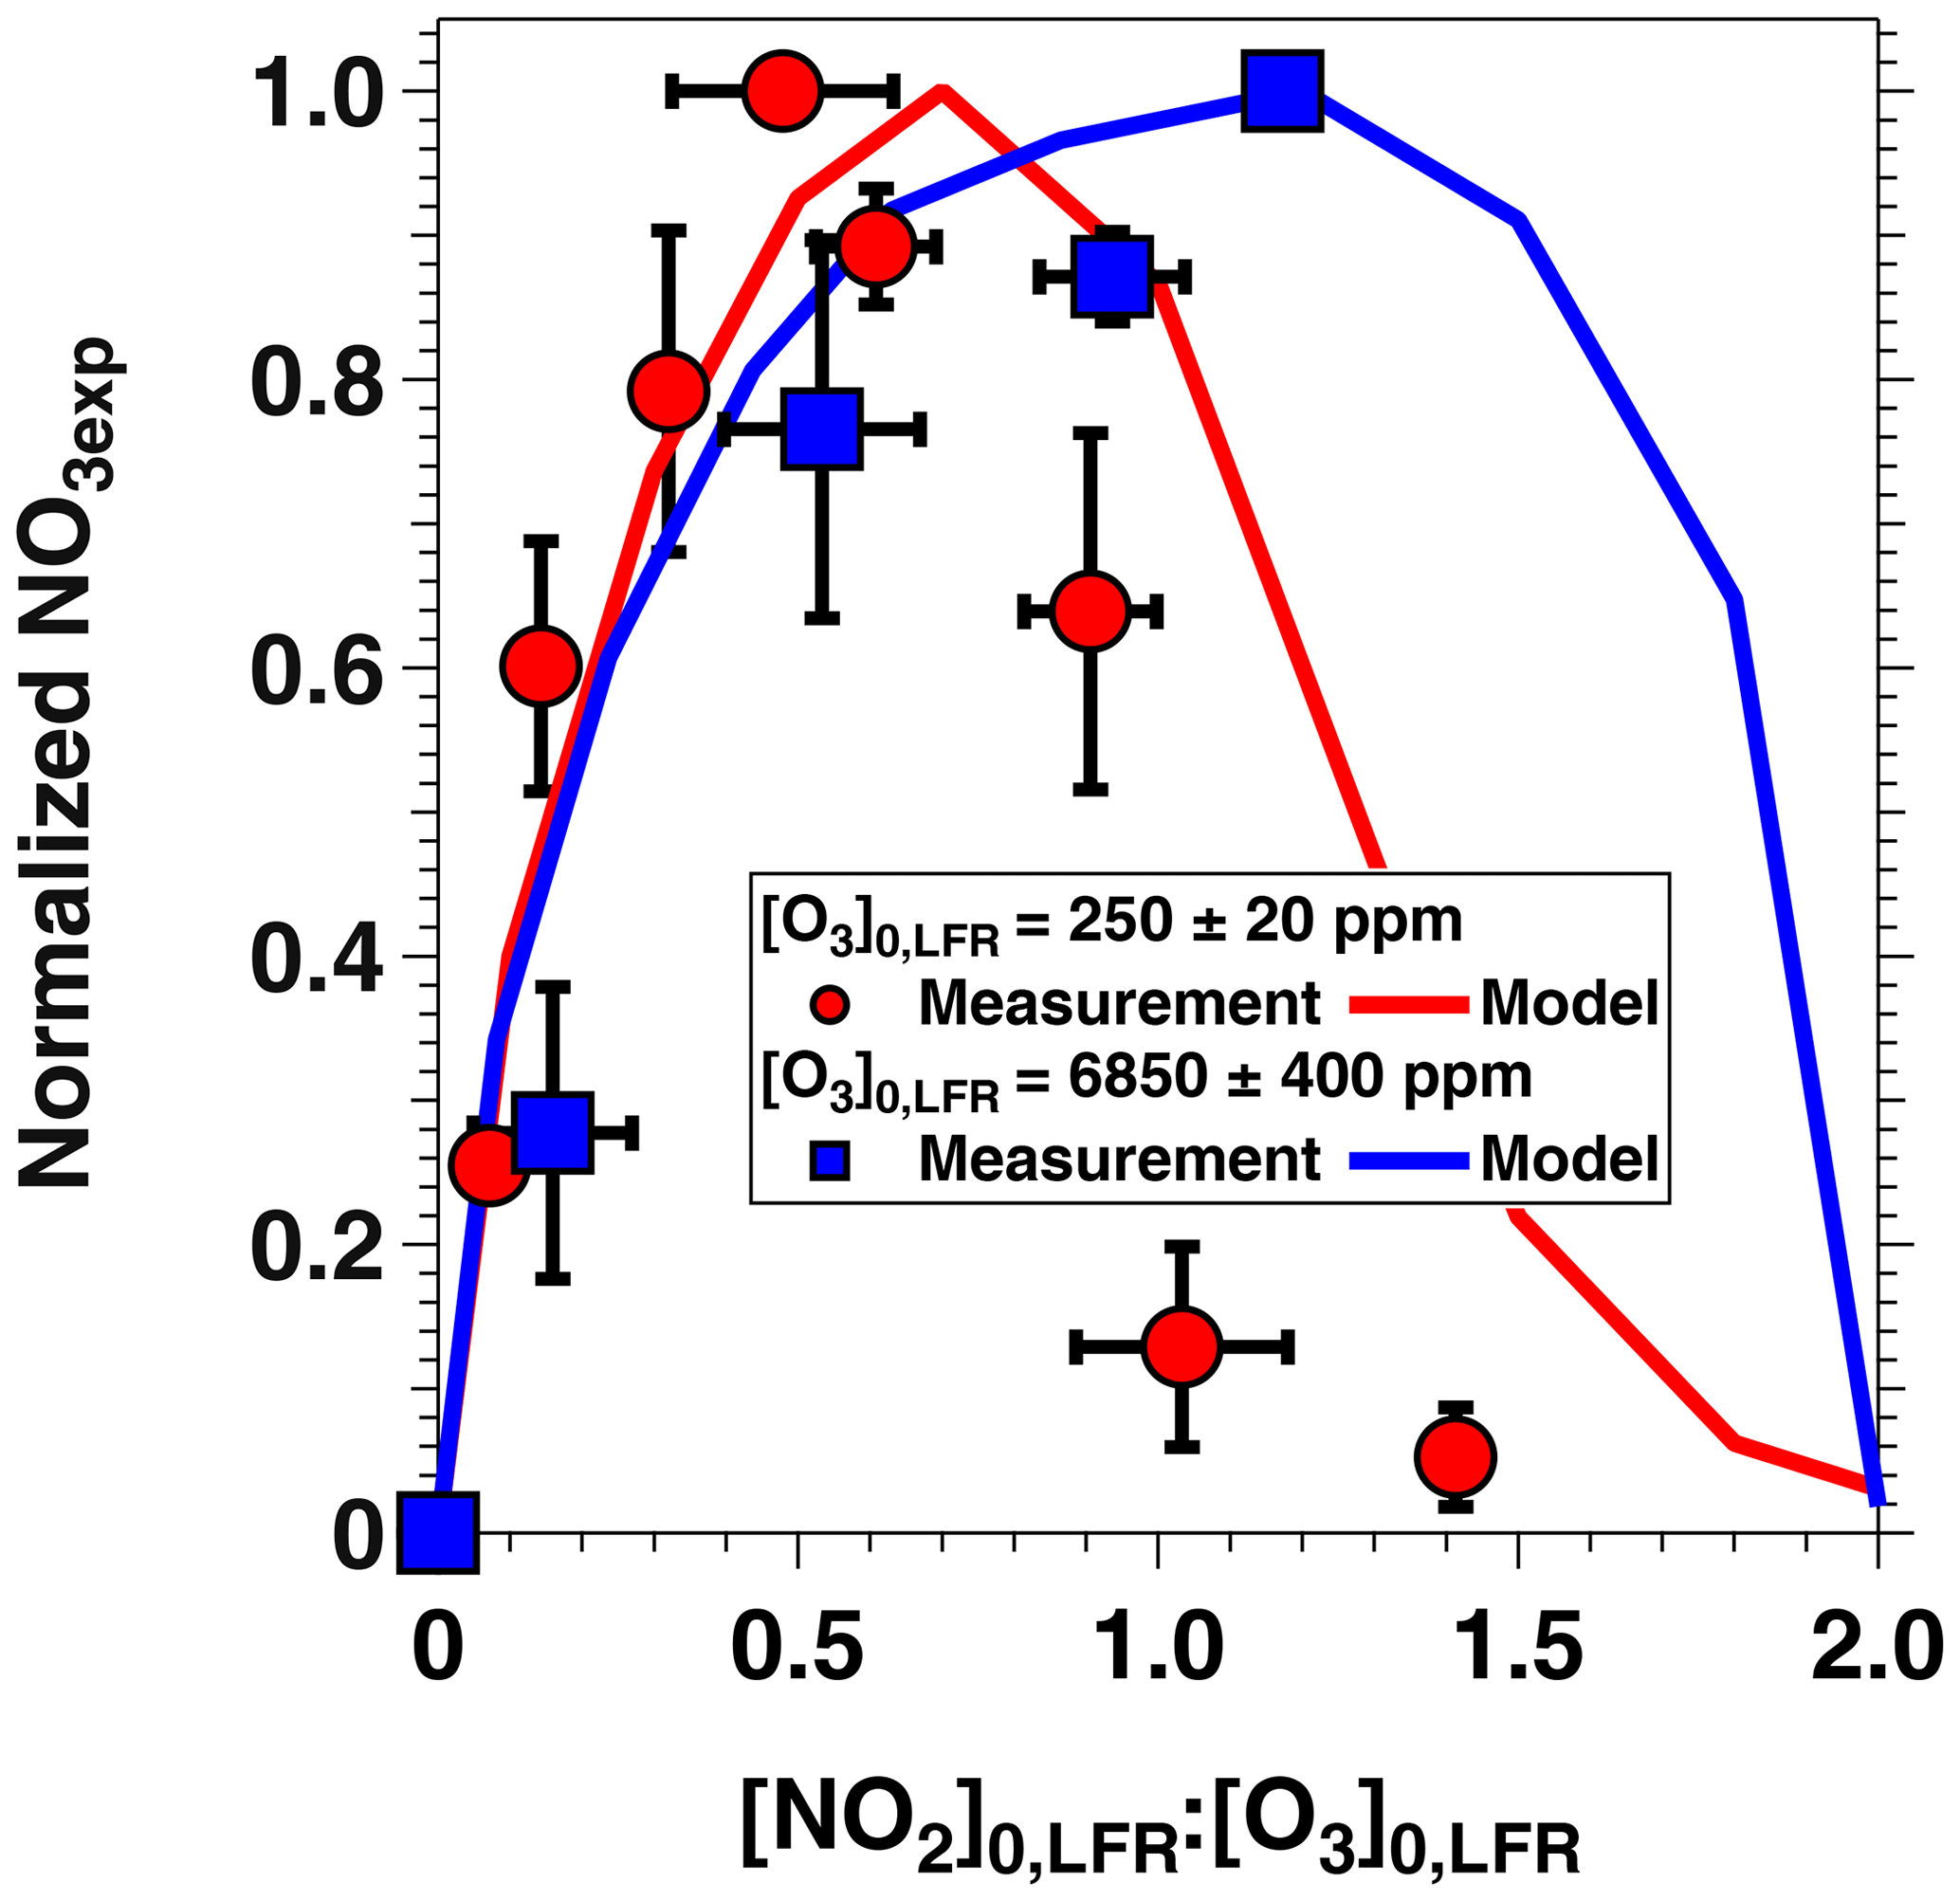
Figure 6NO3exp as a function of [NO2] at fixed [O3]0, LFR values of 250±20 and 6850±400 ppm and RHOFR=11 % to 81 %. NO3exp values were normalized to the maximum NO3exp value obtained at the same RH.
In a related set of experiments, IBBCEAS measurements of the NO2:NO3 ratio at the exit of the OFR (obtained from Fig. 3a spectra) confirmed that significantly higher NO2 levels were present in the OFR at higher [NO2], as expected. For example, at [O3] ppm and [NO2] ppm, , whereas at ppm and [NO2] ppm, . NO2:NO3, along with NO3:O3 and NO2:NO3, has important implications for the fate of organic species in OFR-iN2O5 that are discussed in the following sections.
3.4 Model characterization of OFR-i, NO2:NO3, and NO2:O2
To examine OFR-iN2O5 performance over a wider range of conditions, Fig. 7 plots the mean NO3exp, [O3], NO3:O3, NO2:NO3, and NO2:O2 values obtained with the model as a function of [O3] to 105 ppm (10 %), for [NO2], 0.1, 0.5, 1.0, 1.5, 1.8, and 2.0. Three observations are apparent from Fig. 7. First, at [O3] ppm and [NO2] to 1.8, the maximum NO3exp increased with [NO2] prior to decreasing at [NO2] (Fig. 7a). Above [O3] ppm and below [NO2], NO3exp was less sensitive to [NO2]. Second, the maximum NO3:O3 increased with increasing [NO2] above [O3] ppm (Fig. 7c). Third, the [NO2] case demonstrated unique behavior relative to the other cases because residual O3 exiting the LFR was low (<10 ppm) due to almost complete conversion of O3 to O2 inside the LFR (Fig. 7b). Consequently, the high residual [NO2] suppressed NO3exp by 1 to 2 orders of magnitude relative to [NO2] cases (Fig. 7a) and generated enhanced NO3:O3, NO2:NO3, and NO2:O2 values. In addition, NO2:NO3 ratios obtained from IBBCEAS measurements at [O3] to 160 ppm and [NO2], 1.0 and 2.0 are shown in Fig. 7d. The measured NO2:NO3 values are comparable to, or lower than, the modeled NO2:NO3 values obtained under similar conditions and, therefore, broadly support using model results to further investigate the fate of (1) RO2 formed from NO3 oxidation of VOCs, (2) alkyl radicals that are reactive towards NO2 and O2, and (3) VOCs that are reactive towards O3 and NO3 in the following sections.
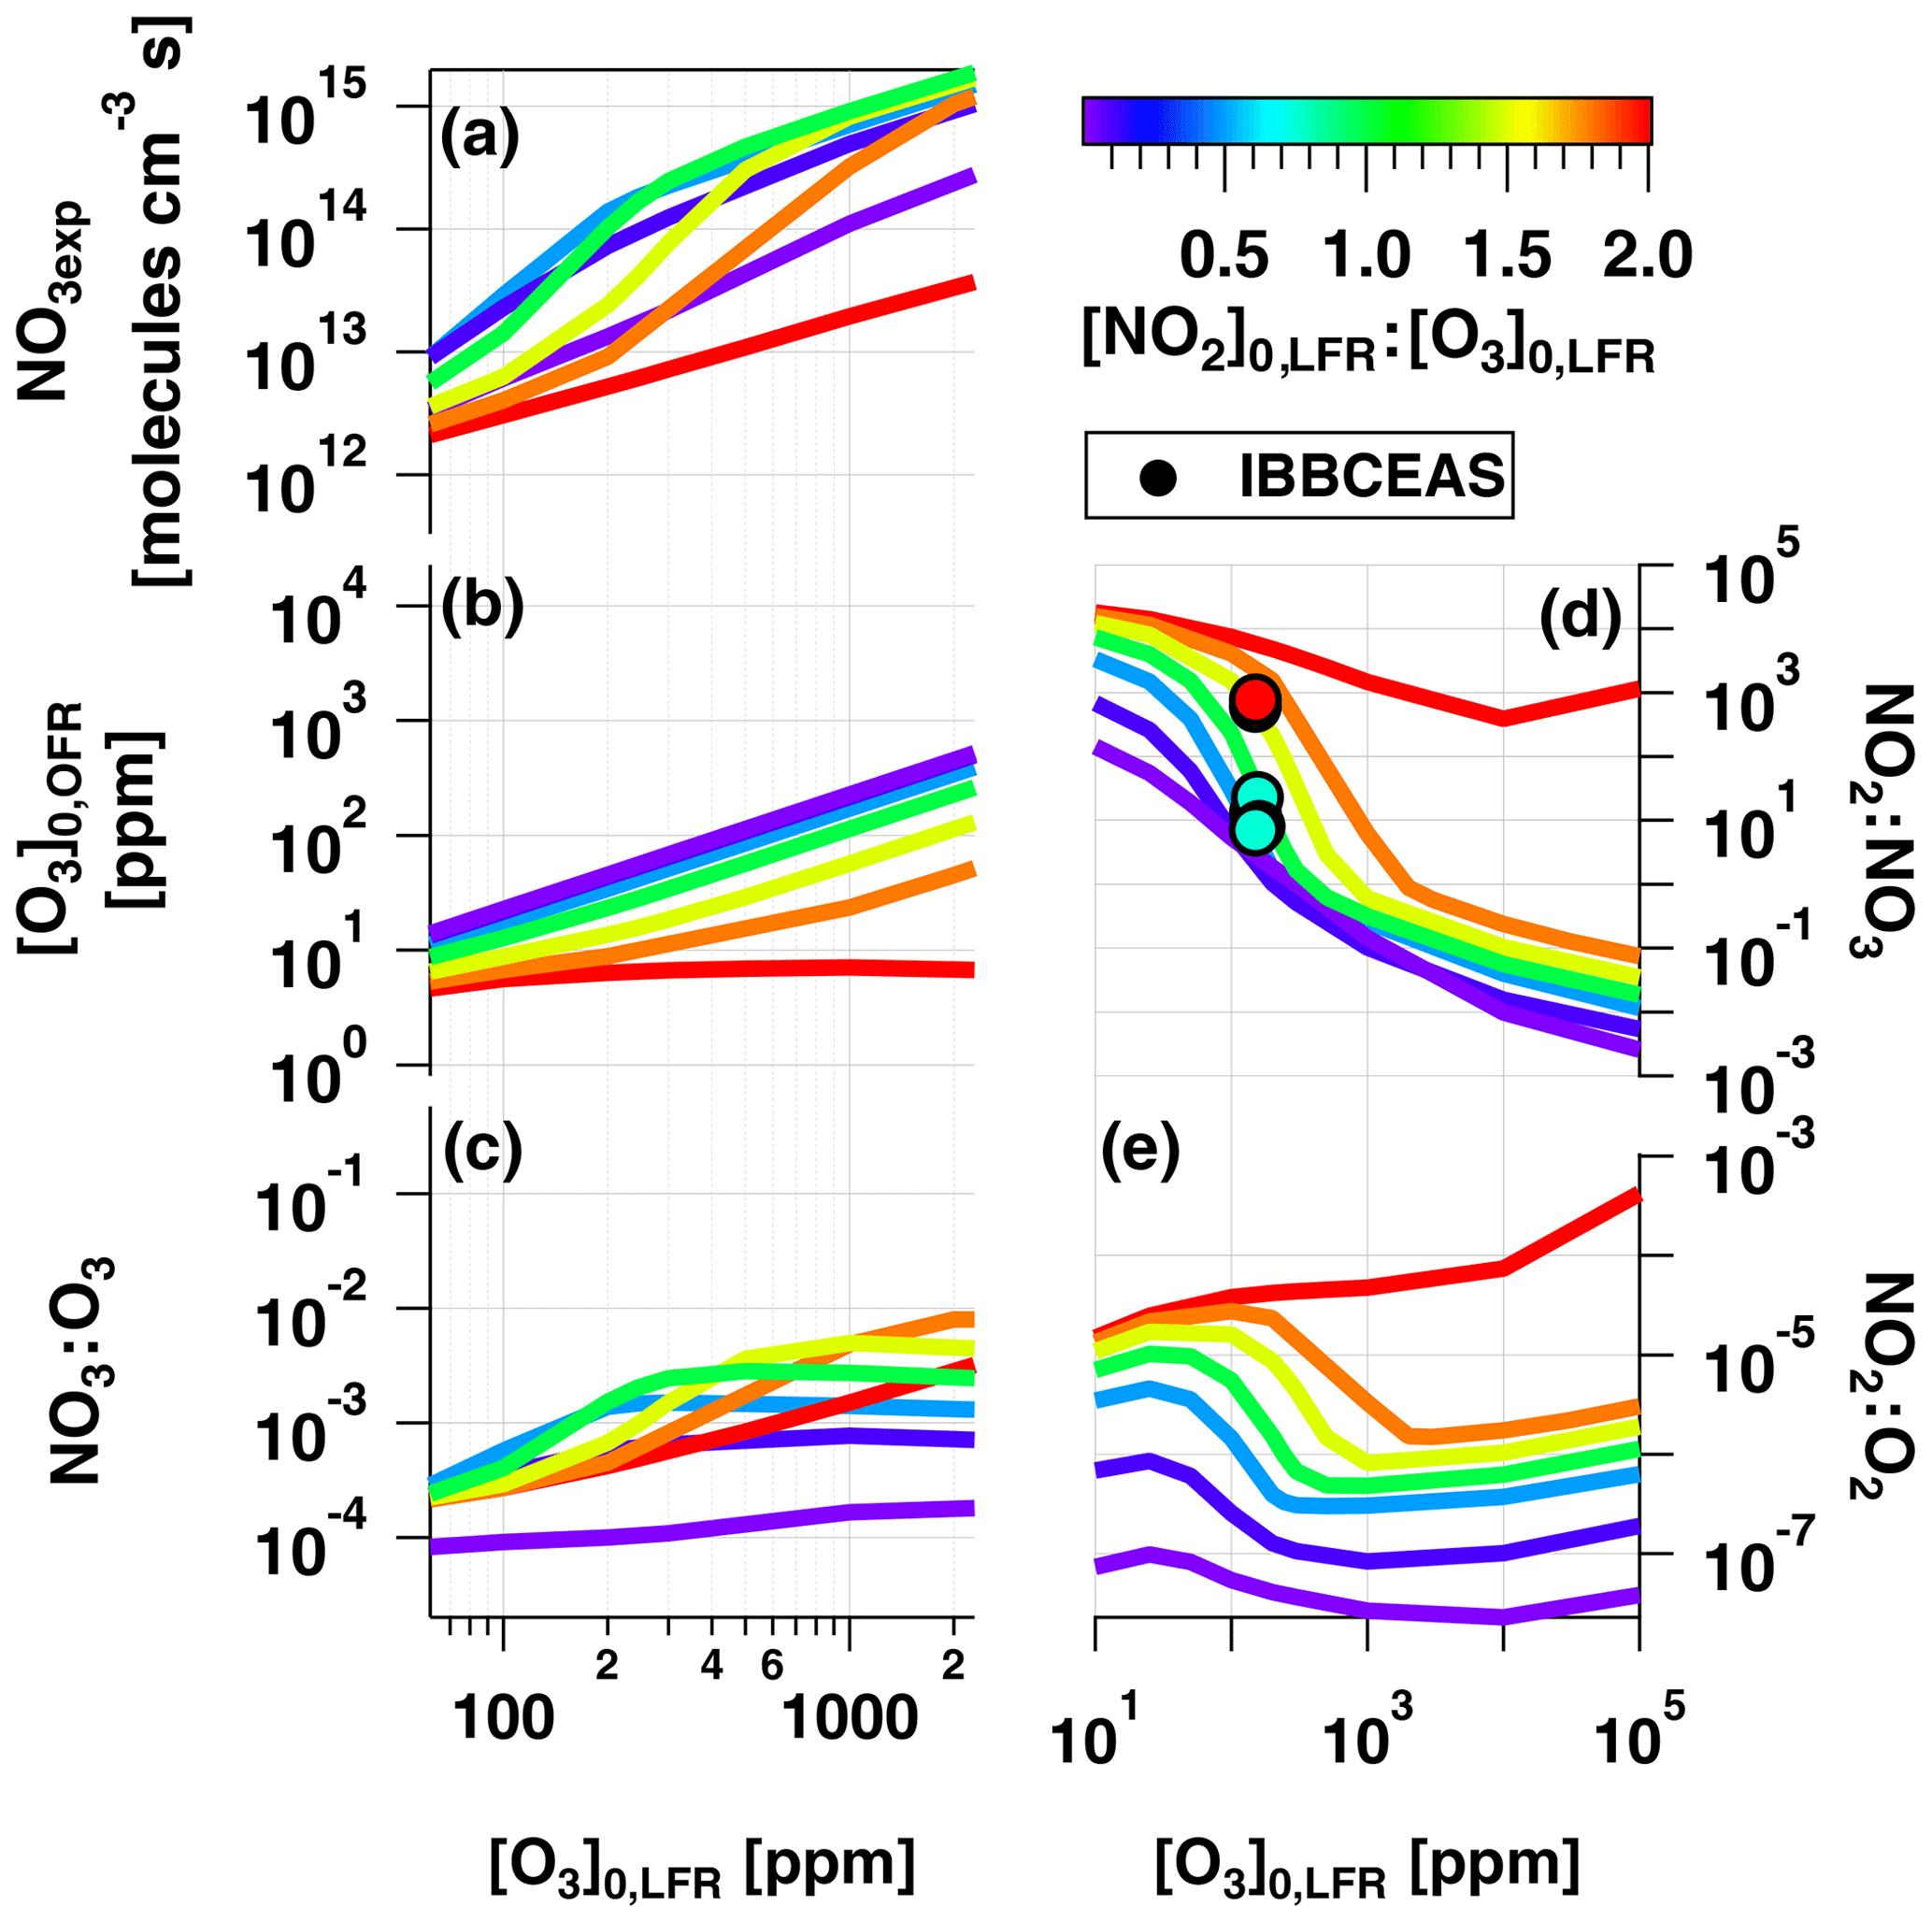
Figure 7Modeled (a) NO3exp, (b) [O3], (c) NO3:O3, (d) NO2:NO3, and (e) NO2:O2 as a function of [O3] to 105 ppm, for [NO2], 0.1, 0.5, 1.0, 1.5, 1.8, and 2.0. Model inputs were s−1, NO3Rext=0.07 s−1. IBBCEAS-measured NO2:NO3 values are plotted in (d).
3.4.1 Fate of organic peroxy radicals (RO2) formed from NO3 + VOC reactions
Organic peroxy radicals (RO2) react with NO, NO2, NO3, HO2, or other RO2 to generate alkoxy (RO) radicals, peroxynitrates (RO2NO2), hydroperoxides or organic peroxides, and may additionally undergo autooxidation via sequential isomerization and O2 addition. To investigate the fate of RO2 as a function of OFR-iN2O5 conditions, we applied the methodology of Peng et al. (2019) by calculating the fractional oxidative loss of a generic alkyl or acyl RO2 to each of these species over the range of conditions shown in Fig. 7. Kinetic data from Orlando and Tyndall (2012) that were used in these calculations are summarized in Table S4. Under almost all OFR-iN2O5 conditions shown in Fig. 7, RO2 reactions with NO, HO2, and RO2 were minor (<1 %) loss pathways compared with reaction with NO2 and NO3. We conducted a model sensitivity analysis in which the RO2+RO2 reaction rate was enhanced by increasing NO3Rext from 0.07 to 0.7 s−1 and increasing the RO2+RO2 rate constant from to cm3 molecule−1 s−1 (Berndt et al., 2018a, b). Despite these perturbations, the relative contribution of RO2+RO2 reactions to total RO2 loss remained <1 % across this range of OFR-iN2O5 conditions.
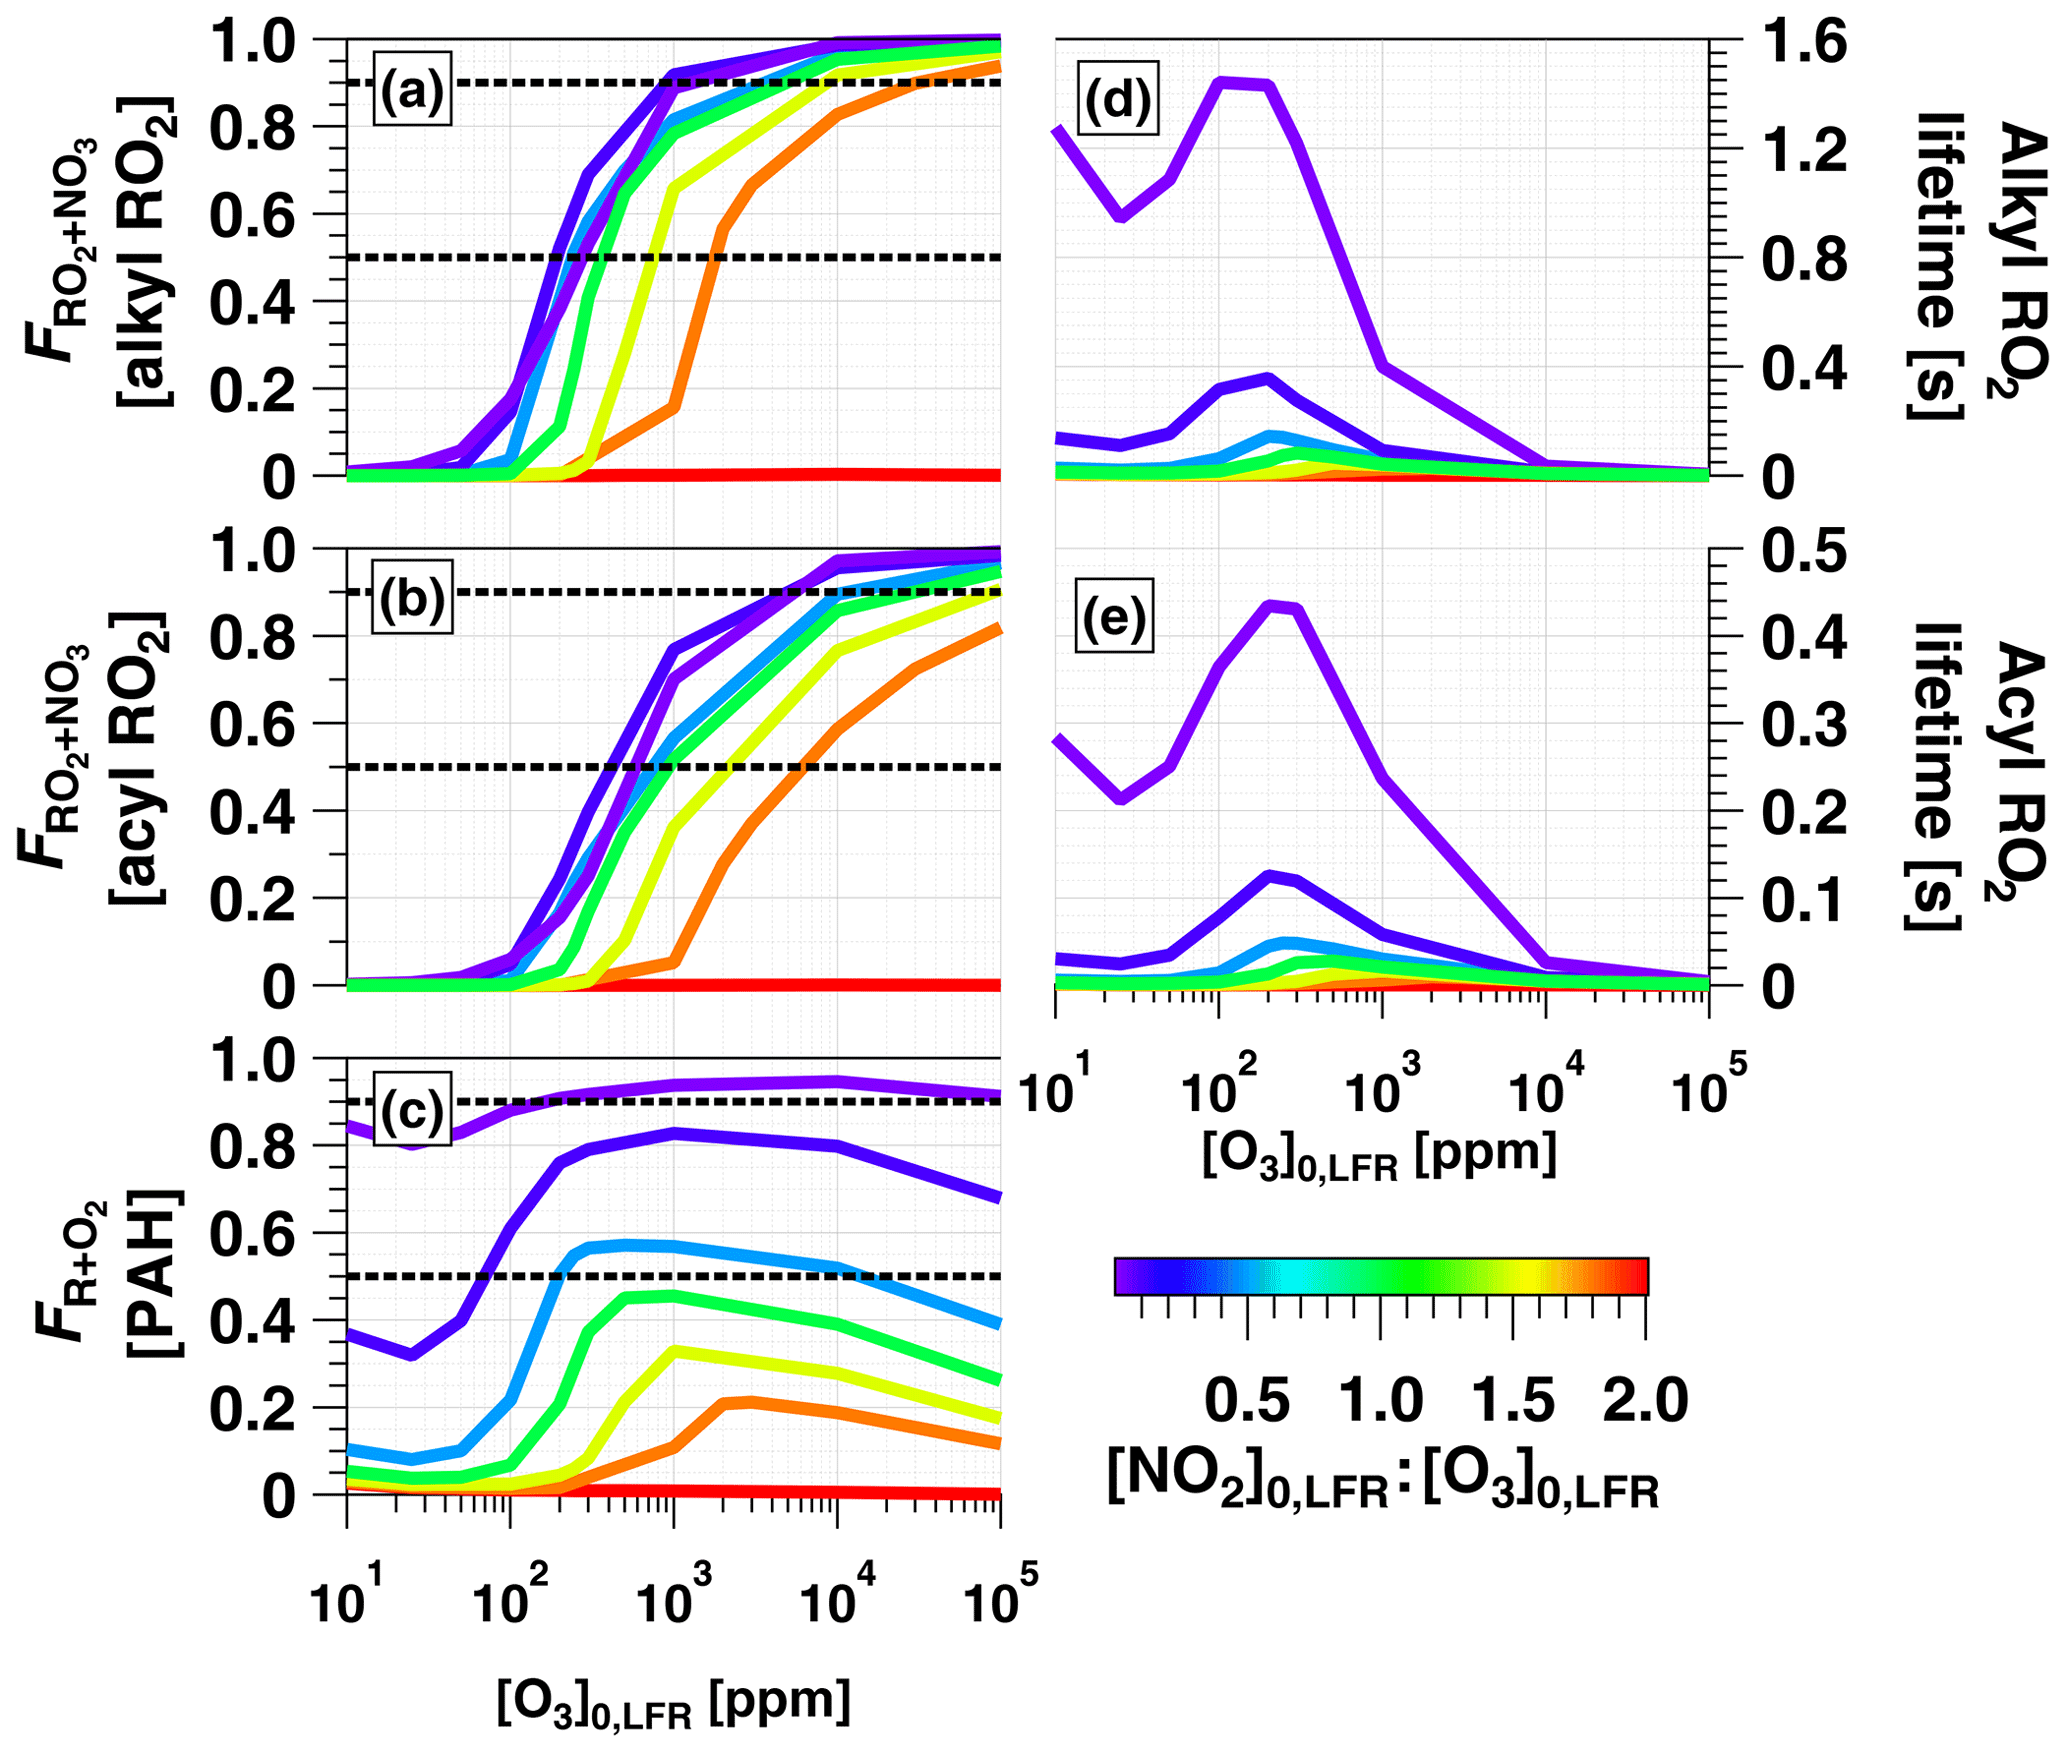
To investigate the relative importance of competing RO2+NO2 and RO2+NO3 pathways, we defined the fractional reactive loss of RO2 due to NO3, :
Figure 8a and b show F calculated for alkyl and acyl RO2, respectively. To simplify the analysis, we assumed that the thermal decomposition of RO2NO2 species formed from RO2+NO2 reactions was slow compared with τOFR. This assumption generates a lower limit F value for the alkyl RO2 case, where RO2NO2 decomposition occurs on timescales of seconds or less (Orlando and Tyndall, 2012) but has minimal influence on the acyl-RO2 case due to higher thermal stability of peroxyl acyl nitrates. For alkyl RO2, Fig. 8a shows that was achieved between [NO2, O3] (125 ppm, 250 ppm) and (3240 ppm, 1800 ppm). For acyl RO2, due to faster reaction with NO2, Fig. 8b shows that was achieved using [NO2, O3] (350 ppm, 700 ppm) to (1.1 %, 0.6 %).
To investigate the feasibility of generating OFR-iN2O5 conditions where RO2 loss is dominated by autooxidation, we calculated the lifetime of alkyl and acyl RO2 () over the range of OFR-iN2O5 conditions shown in Fig. 7 and Fig. 8a and b. As shown in Fig. 8d and e, maximum values of ≈1.4 s (alkyl) and 0.4 s (acyl) were obtained at [NO2] ppm and [O3] ppm. At lower [O3]0, LFR, decreased due to a faster RO2+NO2 reaction rate, and at higher [O3]0, LFR, decreased due to a faster RO2+NO3 reaction rate. Because RO2 autooxidation timescales range from 0.005 to 200 s depending on the specific RO2 composition (Crounse et al., 2013), OFR-iN2O5 may achieve autooxidation-dominant conditions for some RO2 but not for others.
3.4.2 Fate of aromatic alkyl radicals (R) formed from NO3 + VOC reactions
The majority of aromatic alkyl radicals (R) that are generated from NO3 oxidation of VOCs quickly react with O2 to generate RO2. However, NO3 oxidation of a subset of aromatic VOCs generates R that react more slowly with O2, thereby enabling competing reactions with NO2. For example, the phenoxy radical (C6H5O) generated from NO3 oxidation of phenol (C6H5OH) has (Platz et al., 1998), and the C10H7NO3 radical that is generated from NO3 oxidation of naphthalene (C10H8) has (Atkinson et al., 1994). Alkyl radicals generated from NO3 oxidation of other PAHs may behave similarly to C10H7NO3, but kinetic data are unavailable in the literature. To investigate the relative importance of competing R+NO2 and R+O2 reactions in these systems, we defined the fractional reactive loss of R with respect to O2, :
Figure 8c shows over the same OFR-iN2O5 operating conditions used to generate Fig. 7 and Fig. 8a and b. For C6H5O (not shown), over the entire range of OFR-iN2O5 conditions shown in Figs. 7e and 8c. For C10H7NO3, was achieved for the majority of OFR-iN2O5 conditions where [NO2] and also between [NO2, O3] (100 ppm, 200 ppm) and (5000 ppm, 10000 ppm). The use of [NO2] always generated conditions where the reaction rate of R+NO2 exceeded R+O2.
3.4.3 Fate of VOCs reactive towards O3 and NO3
We defined the fractional reactive loss of a VOC with respect to NO3, :
and we established as the criterion for NO3-dominated oxidative loss. Figure 9 plots NO3:O3 at which for several classes of organic compounds with published and values greater than 10−16 and 10−19 cm−3 molecules−1 s−1, respectively. Therefore, this figure excludes compounds such as alkanes and monocyclic aromatics that react slowly with NO3 and are essentially unreactive towards O3 (). NO3:O3 values that correspond to [NO2]0, LFR and [O3] (2 ppm, 200 ppm), (150 ppm, 300 ppm), and (5400 ppm, 3000 ppm) are represented by horizontal bands with upper and lower limit values calculated assuming values of 0.01 and 0.08 s−1 (Sect. 3.3). These LFR inputs generated OFR-iN2O5 conditions that maximize the RO2 lifetime and NO3:O3 at and 1.8, respectively (Figs. 7, 8). Figures 7 and 9 as well as kinetic data from the literature suggest that the injection of 2 ppm NO2 and 200 ppm O3 into the LFR was sufficient to achieve for phenols, PAHs with no double bonds, and mono- and sesquiterpenes with one double bond at low RHOFR. Increasing [NO2]0, LFR to 150 ppm and [O3]0, LFR to 300 ppm additionally achieved for acenaphthylene, isoprene, and mono- and sesquiterpenes with one double bond at elevated RHOFR. Further increasing [NO2]0, LFR to 5400 ppm and [O3]0, LFR to 3000 ppm achieved for ≥ C3 linear alkenes, unsaturated aldehydes, and mono- and sesquiterpenes with two double bonds at low RHOFR. While [20 %, 10 %] (not shown) achieved for (E)-3-penten-2-one and ethene, the corresponding NO3exp ≈1014 molecules cm−3 s achieved at this condition (Fig. 7a) was insufficient to oxidize more than 1 %–2 % of the initial ethene concentration due to its slow NO3 rate constant (Atkinson, 1991).
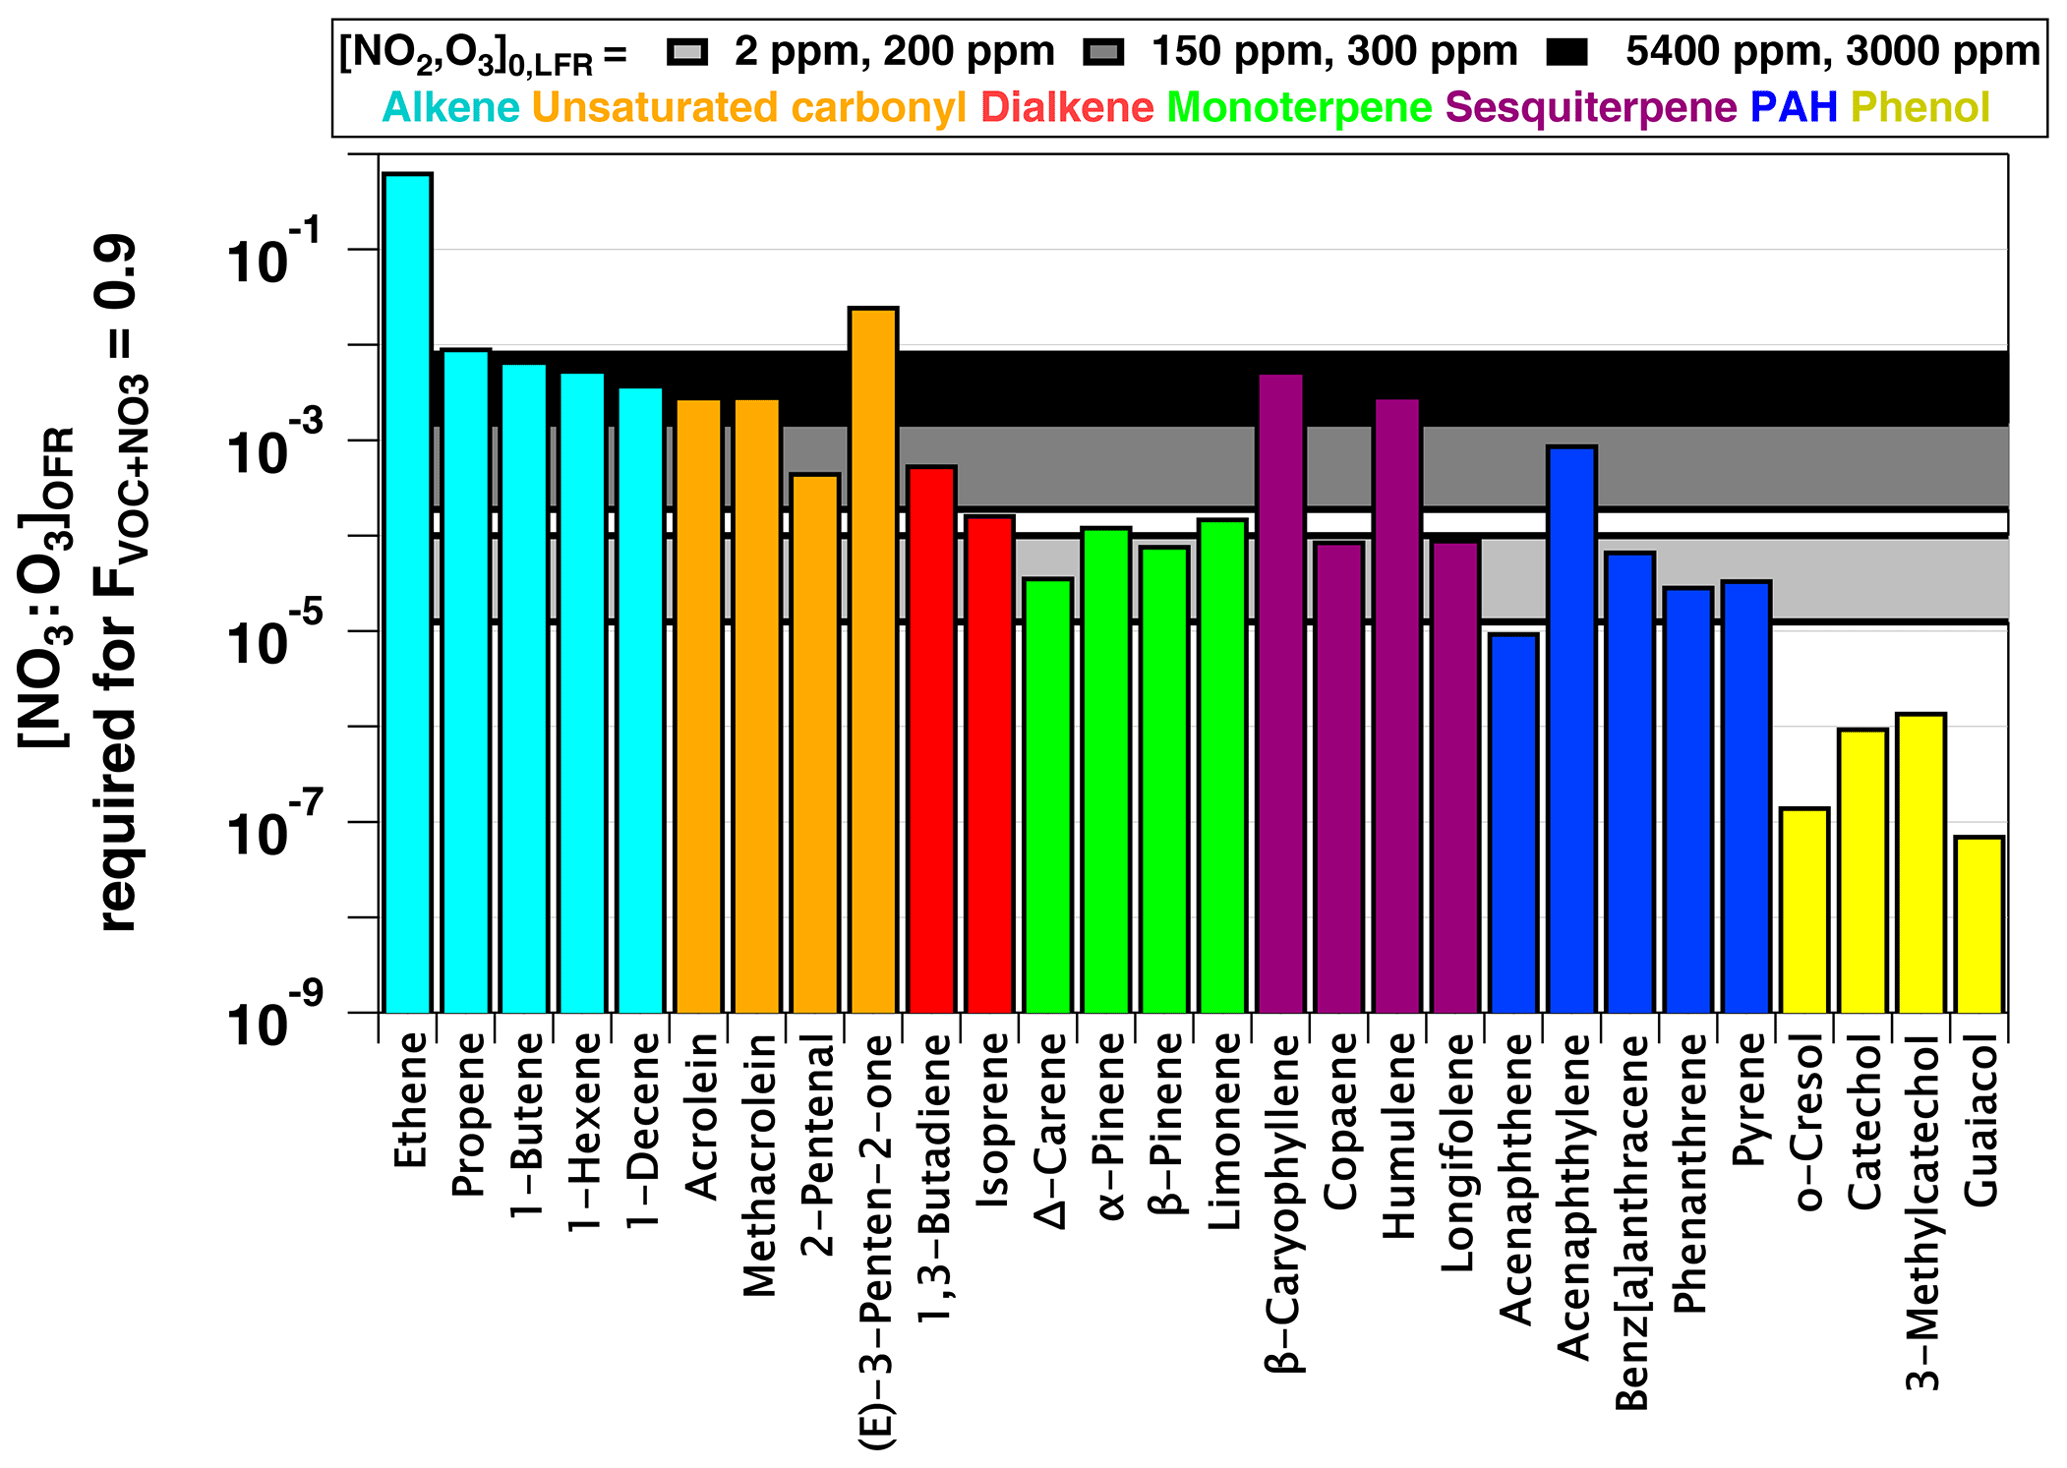
Figure 9NO3:O3 at which for representative VOCs with and cm3 molecules−1 s−1 (Manion et al., 2015). Horizontal bands represent upper and lower limit values calculated assuming and 0.08 s−1.
3.5 NO3 estimation equation for OFR-iN2O5
Previous studies reported empirical OH exposure algebraic estimation equations for use with OFRs (Li et al., 2015; Peng et al., 2015, 2018; Lambe et al., 2019). These equations parameterize OHexp as a function of readily measured experimental parameters, thereby providing a simpler alternative to detailed photochemical models for experimental planning and analysis. Here, we expand on those studies by deriving an NO3exp estimation equation for OFR-iN2O5. Model results obtained from the base case of the model – a VOC reacting with NO3 at cm3 molecule−1 s−1 as a surrogate for NO3Rext – were used to derive the following equation that allows for the estimation of NO3exp for OFR-iN2O5:
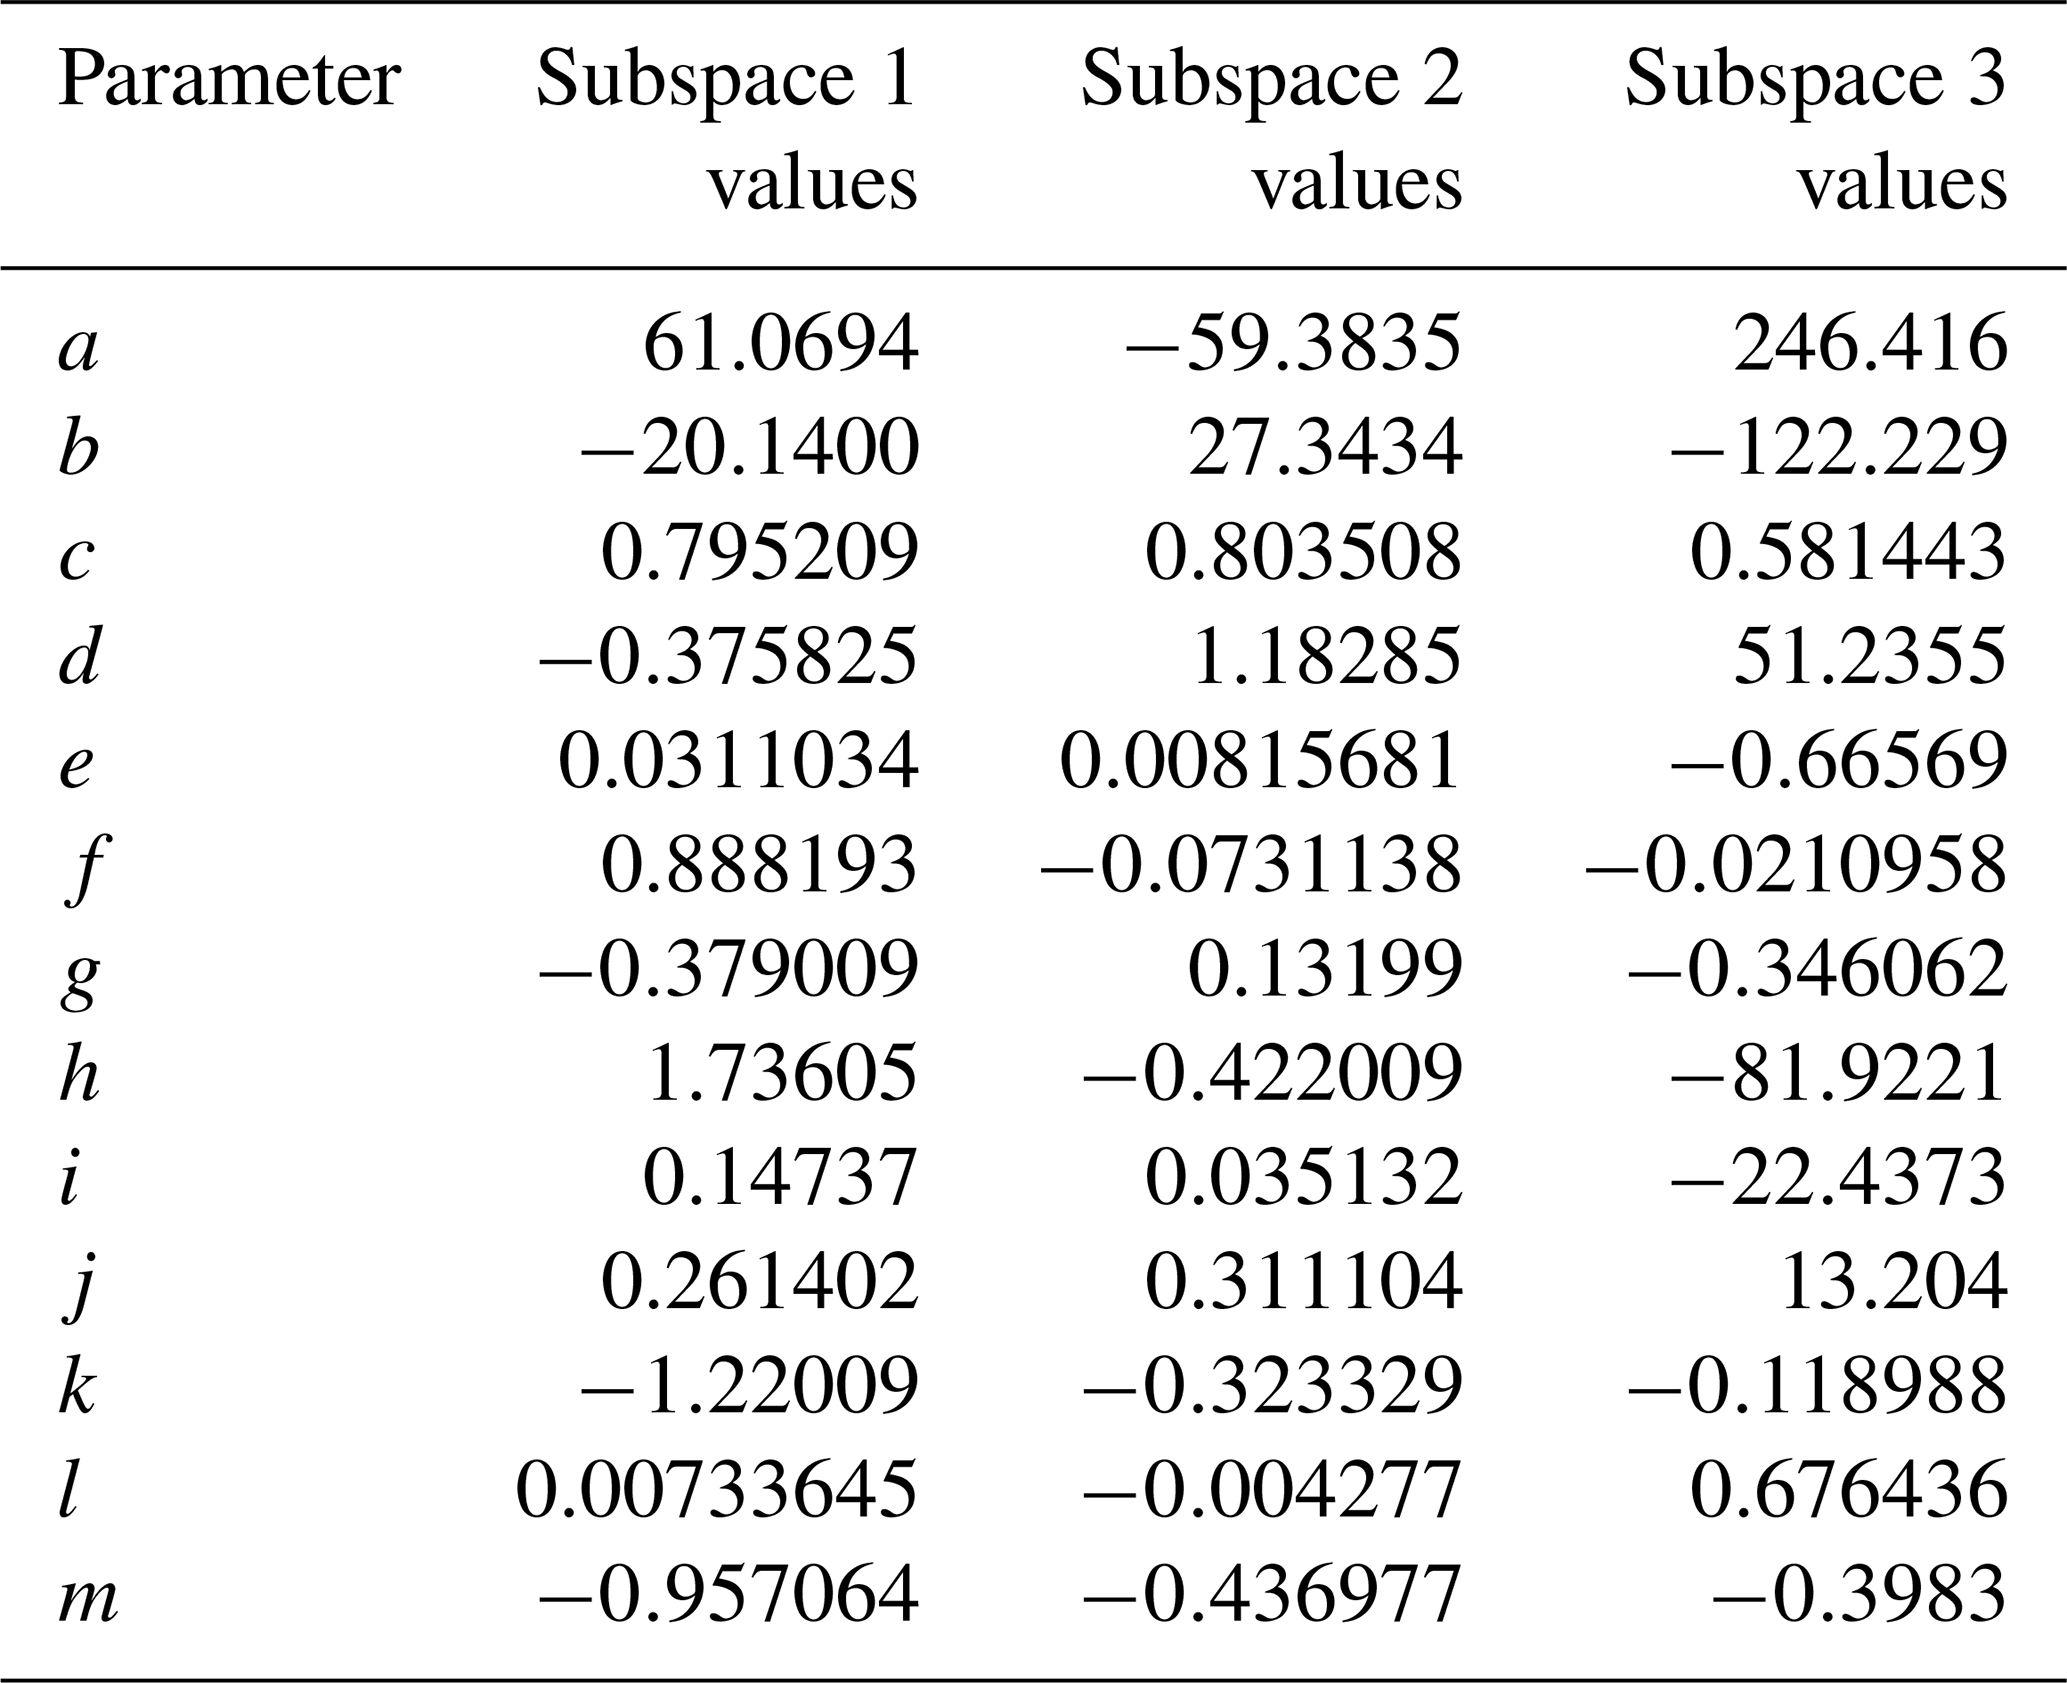
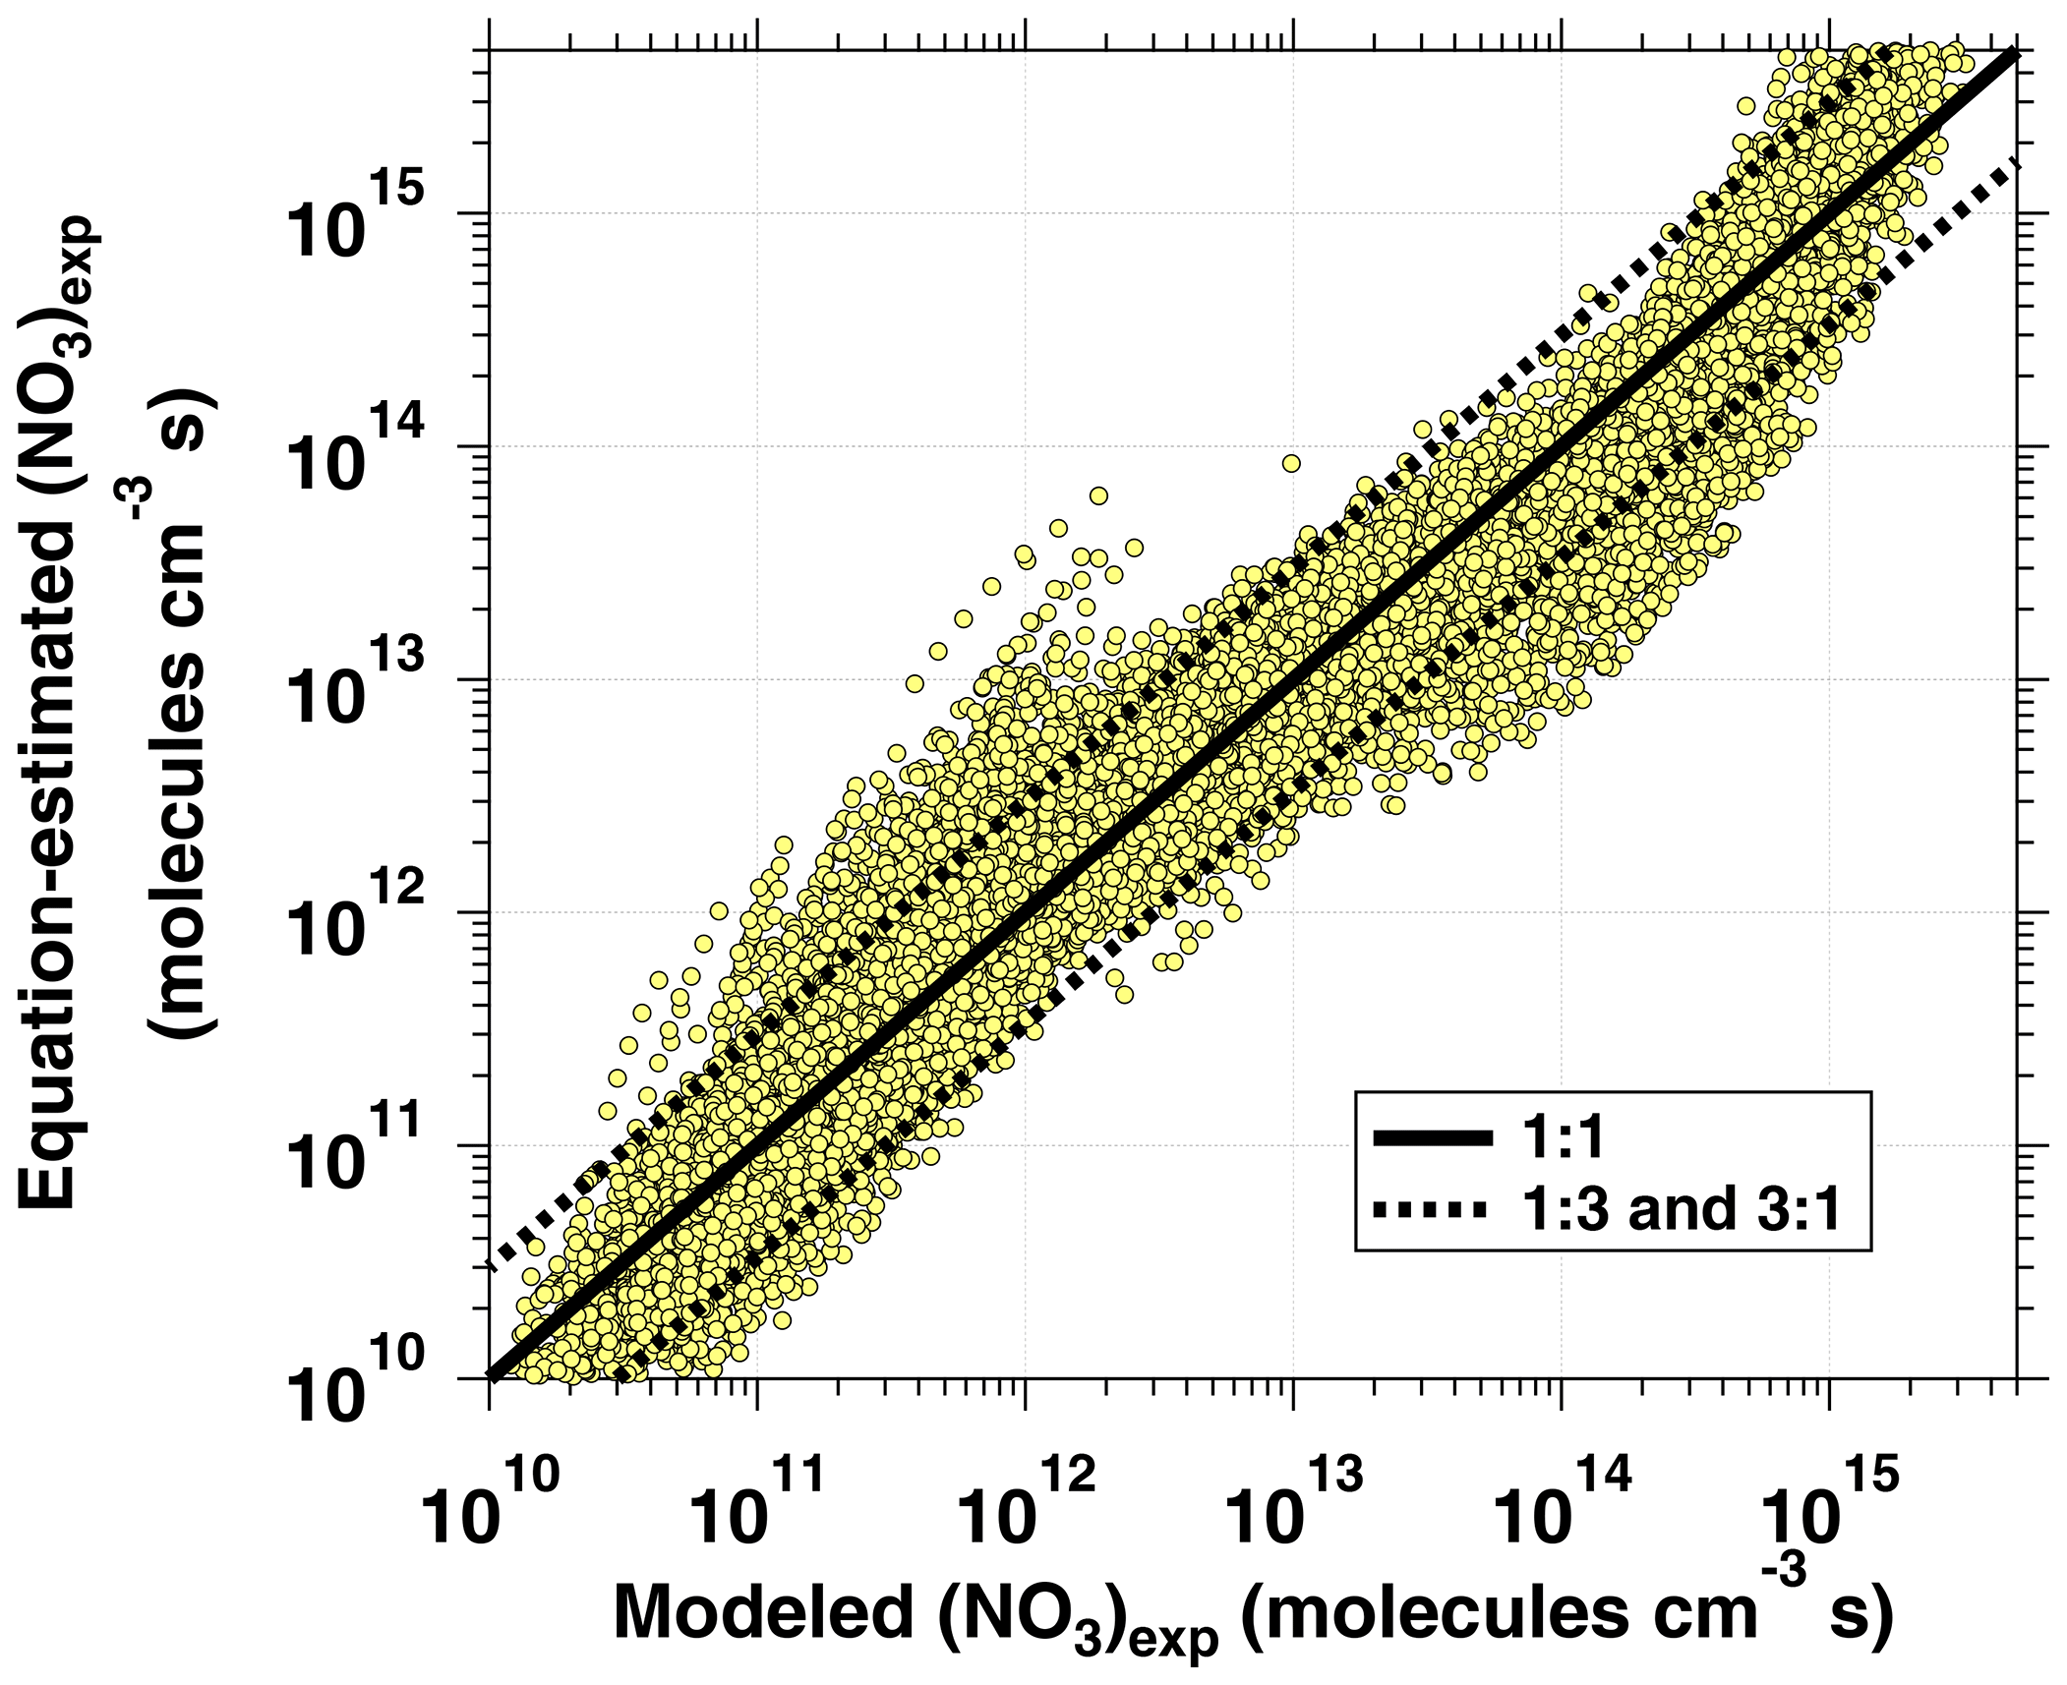
The phase space of OFR-iN2O5 parameters for fitting Eq. (6) to the NO3exp model results was defined as follows: [O3]–1000 ppm, [NO2]–1000 ppm, , –200 s−1, –0.08 s−1, TOFR=0–40 ∘C, and τOFR=60–300 s. The cases where [O3] ppm and/or [NO2] were not considered due to less practical interest. We explored 11, 11, 7, 4, and 5 logarithmically evenly distributed values in the ranges of [O3]0, LFR, [NO2]0, LFR (11 values over 10–1000 ppm), , , and τOFR, respectively. Due to significantly different chemical regimes in different parts of the phase space, fit coefficients that are reported in Table 1 were obtained by fitting the same functional form (Eq. 6) over three subphase spaces with the following additional constraints: (1) –1 and –200 s−1; (2) –1 and –20 s−1; and (3) –2. For these three subspaces, 10080, 13440, and 5880 respective model cases were simulated. In Eq. (6), the terms involving the coefficients g–j were included to reproduce the relationship between normalized NO3exp and [NO2] shown in Fig. 5. Logarithms of first- and second-order terms were successively added until no further fit quality improvement was achieved. Figure 10 compares NO3exp estimated from Eq. (6) and calculated from the model described in Sect. 2.2. The mean absolute value of the relative deviation was 49 % which is comparable to results obtained for previous estimation equations with significant NOy chemistry (Peng et al., 2018).
NO3Rext of a system will change over the course of multiple generations of NO3 oxidation due to changes in kinetic rate coefficients between different species and NO3 (). The sensitivity of Eq. (6) to changes in depends in part on the relative magnitudes of and the internal NO3 reactivity, NO3Rint, which is approximately equal to [NO2]. If , changes in NO3Rext would have minimal influence on Eq. (6). In one case study, we examined changes in NO3Rext following conversion of biogenic VOCs (BVOCs) to gas-phase carbonyl oxidation products with known values. Table S5 compares of isoprene to methyl vinyl ketone and methacrolein, α-pinene to pinonaldehyde, sabinene to sabinaketone, and 3-carene to caronaldehyde. At the limit where 100 % of each BVOC is converted to its carbonyl oxidation product, NO3Rext decreases by a factor of 200 or greater. Unsaturated organic nitrates that are generated from BVOC + NO3 may also be reactive towards NO3, but for these species are not available. In another case study, we examined changes in NO3Rext following conversion of BVOCs to SOA. An effective for SOA was calculated using the following equation adapted from Lambe et al. (2009):
where Fdiff is a correction factor accounting for diffusion limitations to the particle surface in the transition regime (Fuchs and Sutugin, 1970),
γ is the fraction of collisions between NO3 and SOA resulting in reaction; Dp is the surface area-weighted mean particle diameter; ρp is the particle density; NA is Avogadro's number; is the mean molecular speed of NO3 (3.2×104 cm s −1 at T=298 K); MSOA is the mean molecular weight of the SOA; and = 0.08 cm2 s−1 is the NO3 diffusion coefficient in air (Rudich et al., 1996). Figure S4 shows as a function of Dp ranging from 1 to 1000 nm, assuming ρp=1.4 g cm−3, MSOA=250 g mol−1 (Nah et al., 2016), and an upper limit γ=0.1 for BVOC-derived SOA (Ng et al., 2017). For reference, the range of slowest (isoprene) and fastest (humulene) known are indicated by the vertical blue line on the y axis. At the limit where 100 % of a BVOC is converted to SOA, NO3Rext decreases by a factor of 10 or greater depending on and Dp. Taken together, these results suggest that NO3Rext decreases following NO3 oxidation of BVOCs to carbonyl oxidation products and/or SOA. In this case, inputting NO3Rext of the BVOC precursor to Eq. (6) generates a lower limit to NO3exp over multiple generations of NO3 oxidation. Results for other systems will depend on the values of associated gas- and condensed-phase precursors and their oxidation products.
3.6 SOA generation from β-pinene + NO3
To apply the OFR-iN2O5 technique to SOA formation studies, we generated SOA from β-pinene + NO3 in the absence of seed particles using [O3] ppm, [NO2] ppm, and RHOFR≈1 %. PTR-MS measurements confirmed the complete consumption of β-pinene, and numerous product ions were detected. The largest ions detected were (H+)C9H14O and (H+)C10H14 which may correspond to nopinone (C9H14O) and fragmentation or decomposition products of C10H17NO4, respectively (Hallquist et al., 1999; Claflin and Ziemann, 2018). The mass yield of SOA ranged from 0.03 to 0.39 over β-pinene mixing ratios ranging from 20 to 400 ppbv that were injected into the OFR. These yield values are broadly consistent with previous environmental chamber studies (Ng et al., 2017) but are lower than chamber SOA yields obtained at the same β-pinene mixing ratio, presumably due to the absence of seed particles in the OFR (Lambe et al., 2015). To compare the results obtained using OFR-iN2O5 with a conventional environmental chamber method, Fig. 11a and b show HR-ToF-AMS spectra of SOA generated from NO3 oxidation of β-pinene in the Georgia Tech chamber (Boyd et al., 2015) and in the OFR, along with a scatter plot of relative ion abundances present in the two spectra (Fig. 11c). The same spectra are presented on a logarithmic scale in Fig. S5. As is evident, β-pinene + NO3 SOA generated in the chamber and OFR exhibit a high degree of similarity (linear regression slope =0.98 and r2=0.99). The largest ion signal was observed at NO+, which, along with the signal at and , is consistent with the formation of particulate organic nitrates (Farmer et al., 2010). Signals observed at CHO+, C2H3O+, and other CxHyO ions suggest the presence of other multifunctional oxidation products.
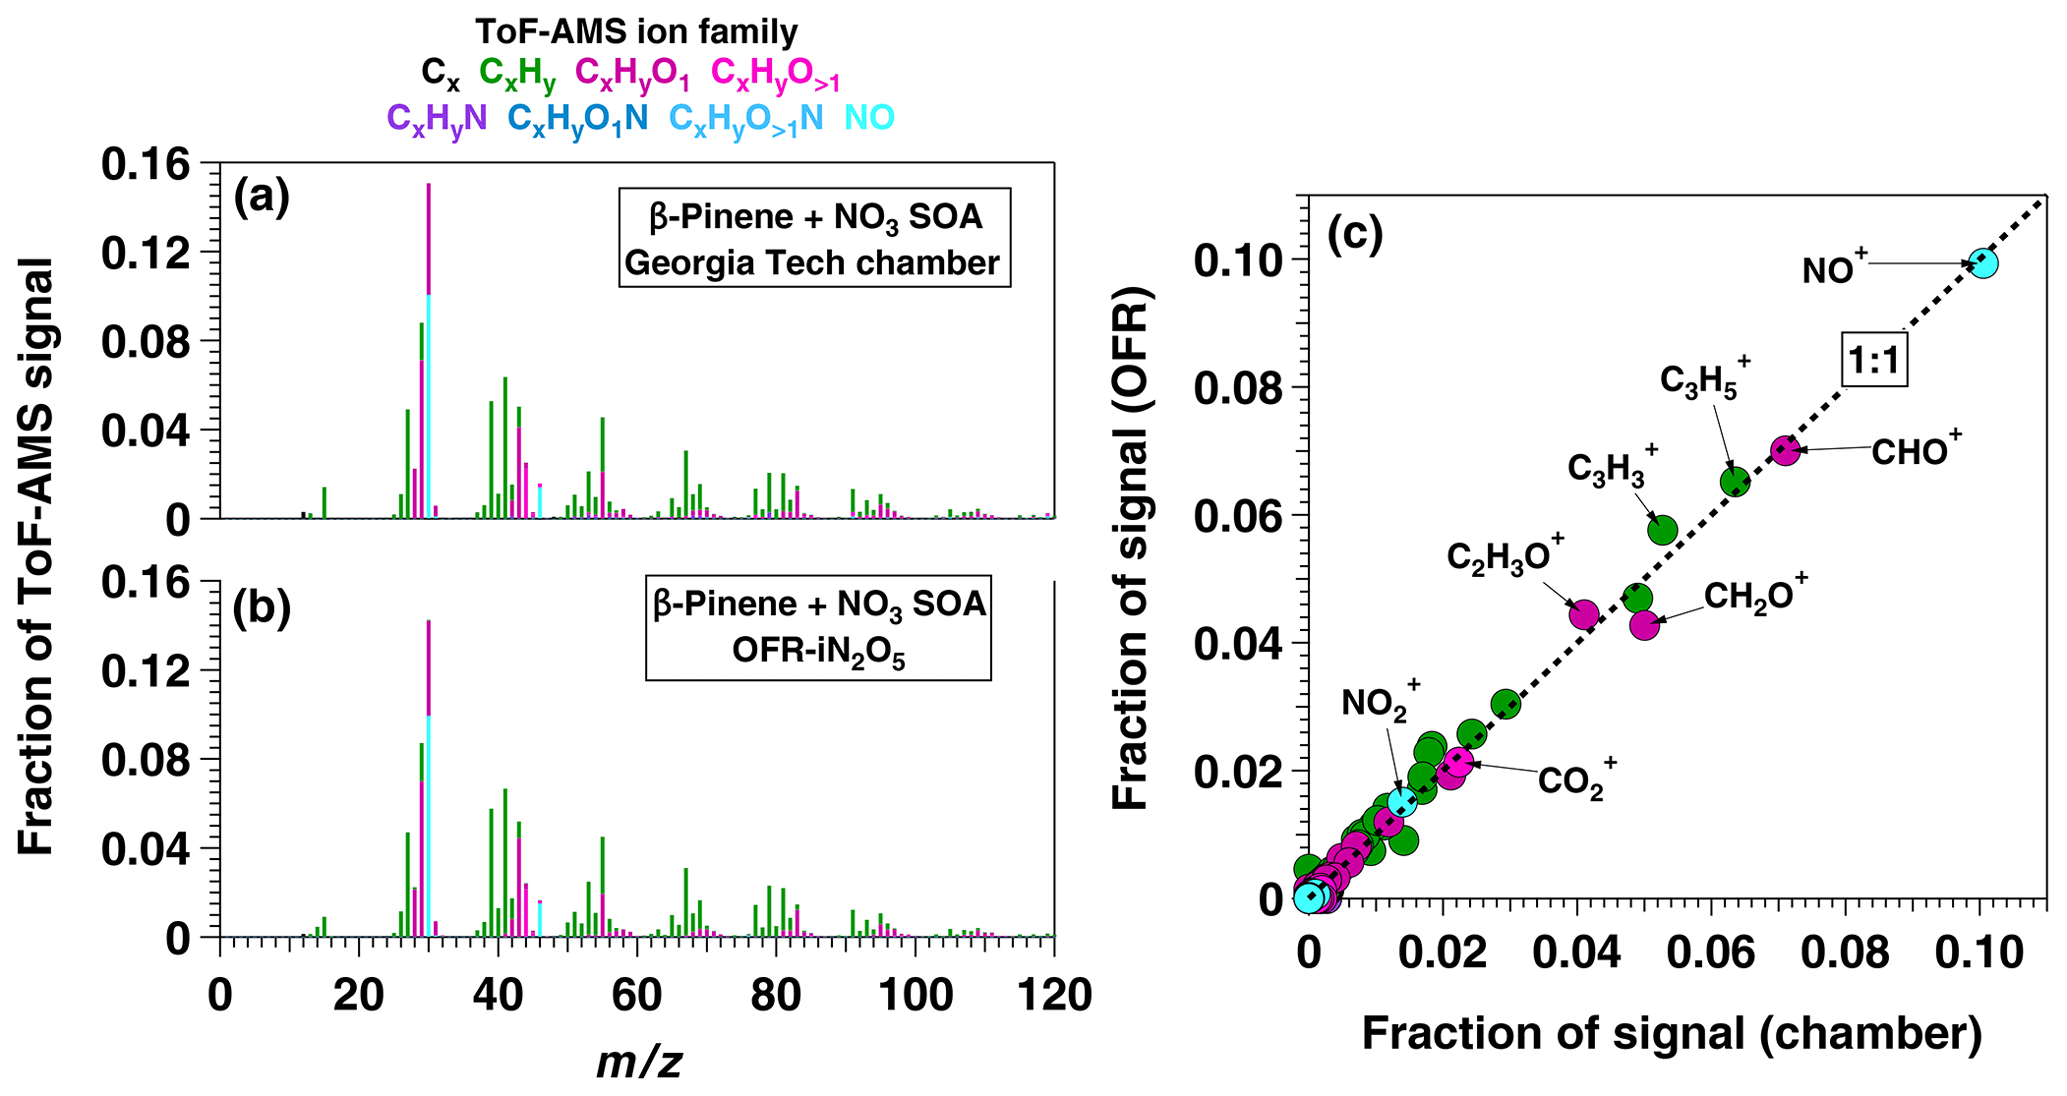
Figure 11AMS spectra of SOA generated from NO3 oxidation of β-pinene in (a) the Georgia Tech environmental chamber (Boyd et al., 2015) and (b) OFR-iN2O5. The scatter plot in (c) shows spectra generated in the OFR and in the chamber plotted against each other.
OFR-iN2O5 complements recently developed methods that enable NOx-dependent photooxidation studies in OFRs such as OFR-iN2O and OFR-iC3H7ONO (Lambe et al., 2017; Peng et al., 2018; Lambe et al., 2019) by enabling studies of nighttime NO3-initiated oxidative aging processes. Important OFR-iN2O5 parameters are [O3], [NO2], [H2O], T, NO3Rext, and τOFR. By contrast, important OFR-iN2O and OFR-iC3H7ONO parameters are UV intensity, external OH reactivity (OHRext), τOFR, and either or [C3H7ONO]. Notably, NO3Rext is typically less significant in OFR-iN2O5 than OHRext in OFR-iN2O or OFR-iC3H7ONO because (1) most compounds are less reactive towards NO3 than OH; (2) NO3exp is higher than OHexp; and (3) (NO3R)int of OFR-iN2O5, which is dominated by the NO3+NO2 reaction, is larger and easier to manipulate than the internal OH reactivity of OFR-iN2O and OFR-iC3H7ONO, which is dominated by OH+HO2 and OH+NO2 reactions. To identify optimal OFR-iN2O5 conditions for different applications, we characterized NO3exp, , , , and at [O3] ppm to 10 %, [NO2] to 2.0, and RHOFR=7 % to 85 %. Optimal NO3exp was achieved by minimizing [H2O] in the OFR and associated humidity-dependent N2O5 wall losses. This is contrary to most OFR techniques that are used to generate OH radicals, where optimal OHexp is achieved by maximizing [H2O] and the associated OH production from the O(1D)+H2O reaction and/or H2O photolysis at λ=185 nm.
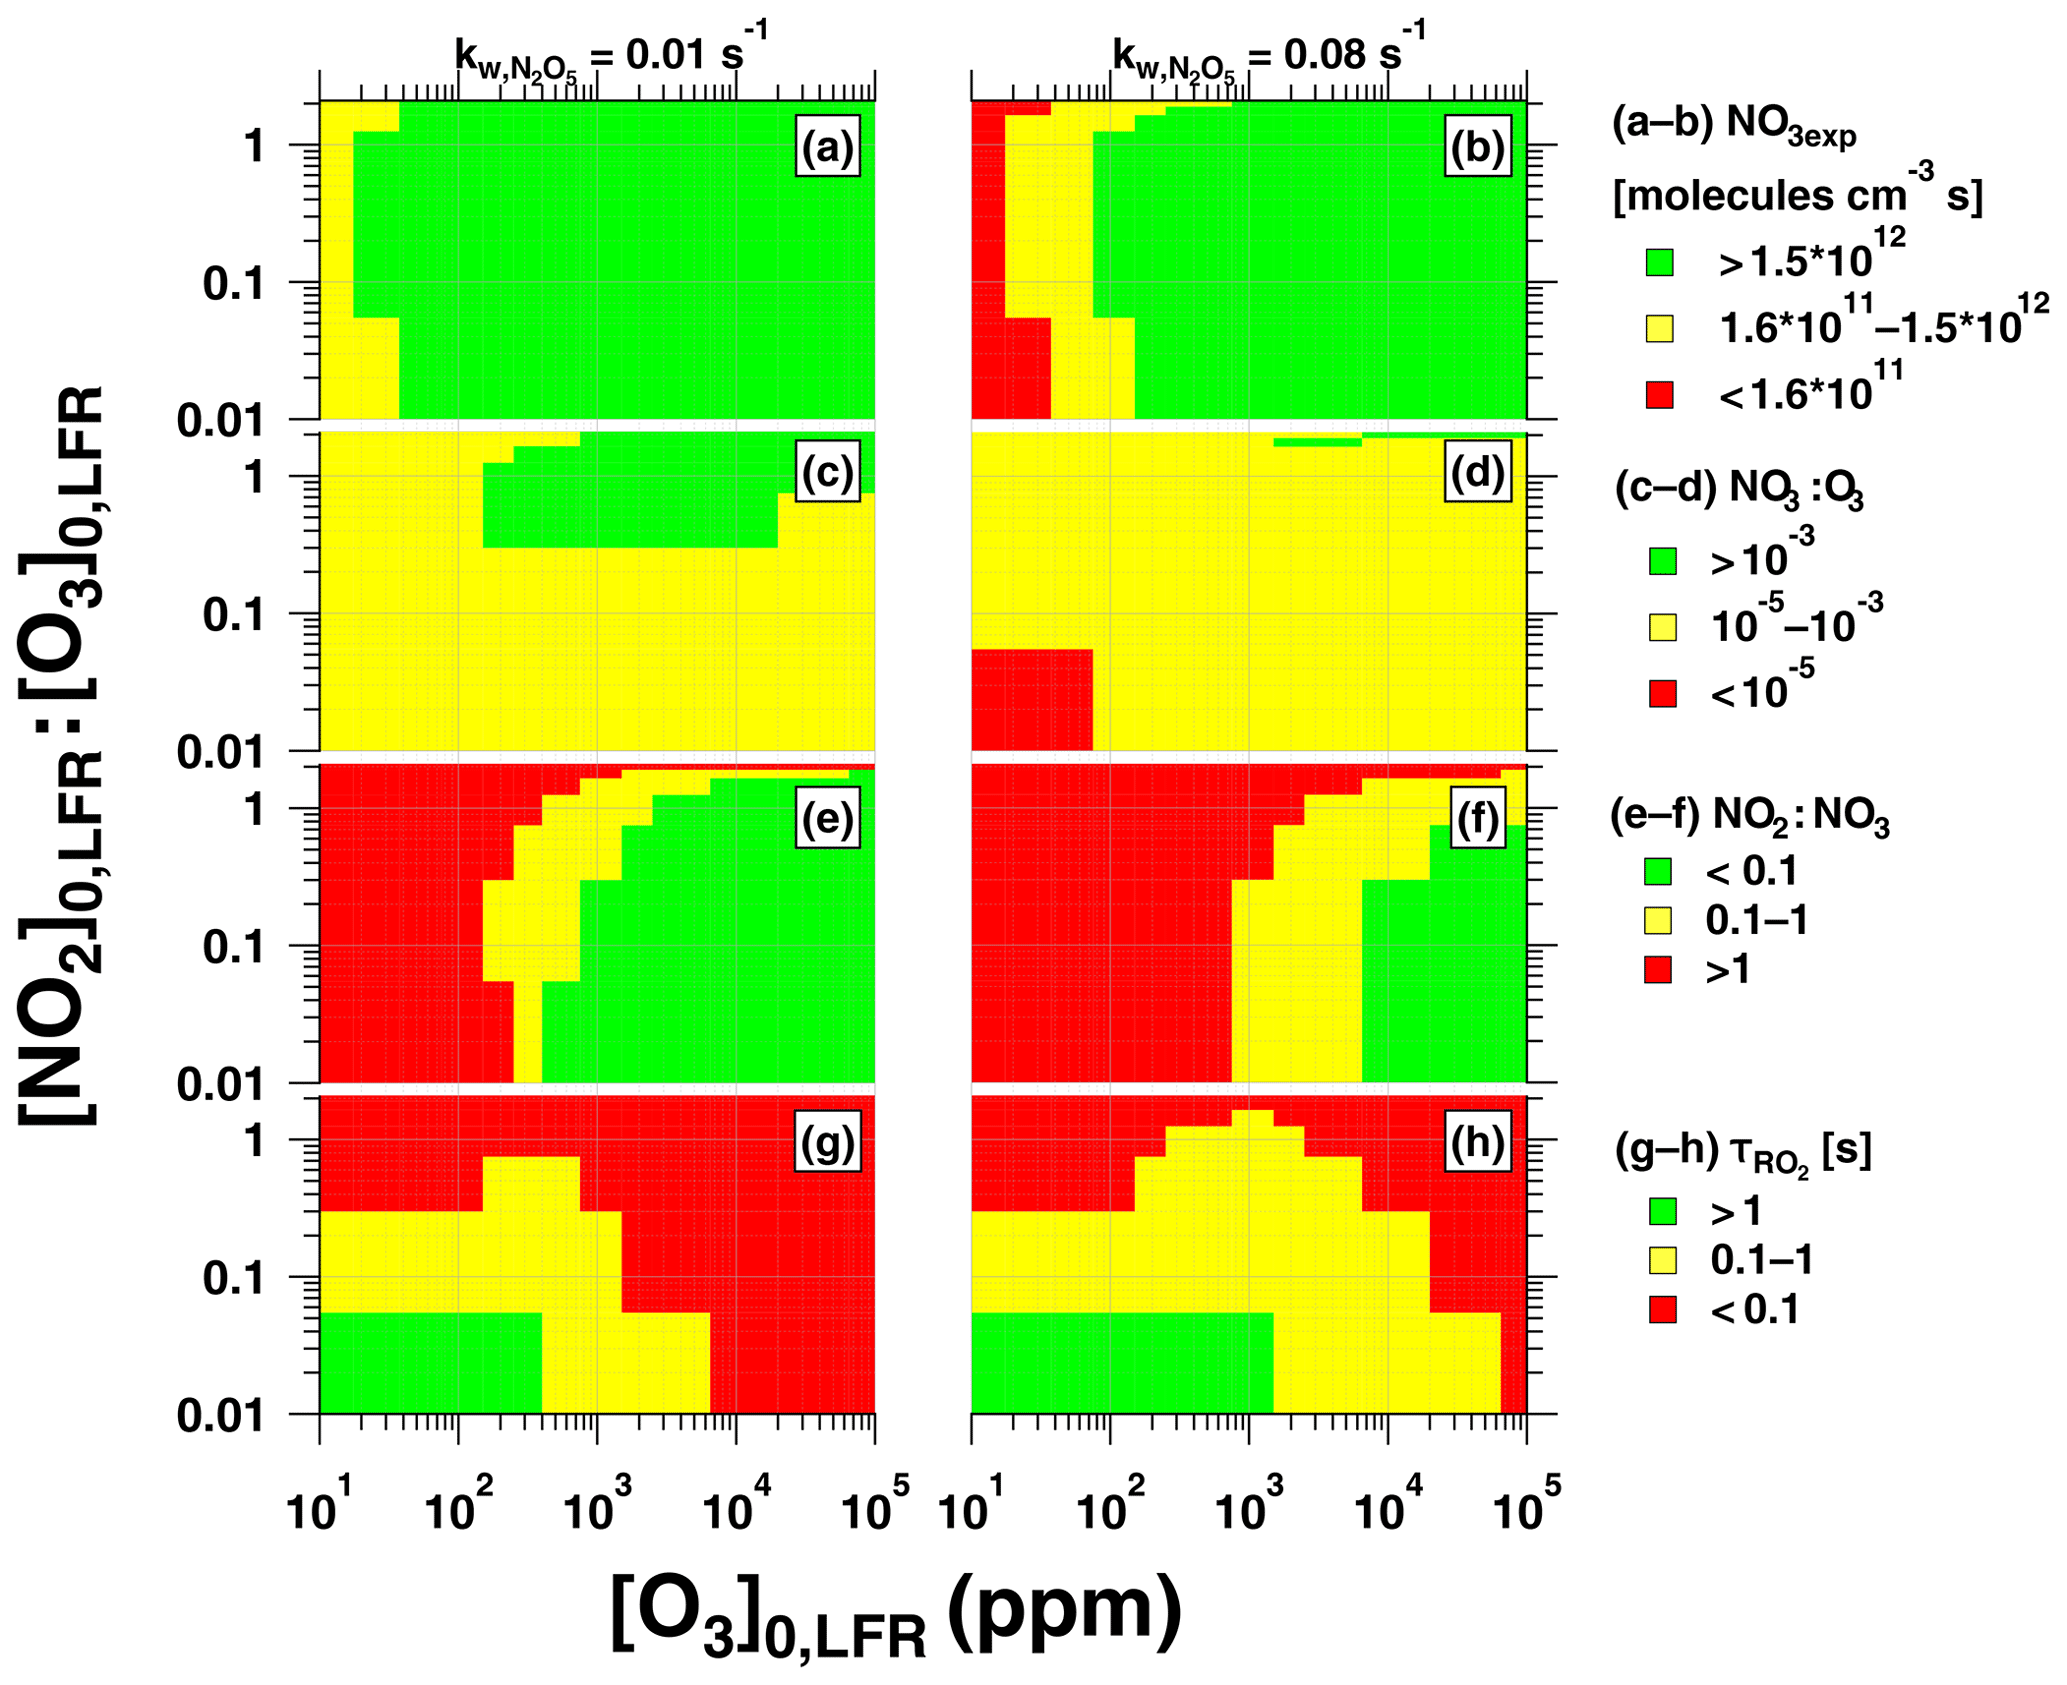
Figure 12Summary of OFR-iN2O5 operating conditions suitable for maximum (a, b) NO3exp, (c, d) NO3:O3, (e, f) NO2:NO3, and (g, h) , assuming and 0.08 s−1.
Figure 12 presents image plots that represent OFR-iN2O5 conditions suitable for generating optimal NO3exp, NO3:O3, NO2:NO3, and values at the lower and upper limit values that were measured. Most OFR-iN2O5 conditions using [O3] ppm generated NO3exp molecules cm−3 s (Fig. 12a, b), which is sufficient to oxidize isoprene and compounds with similar ; for reference, NO3exp molecules cm−3 s is required to oxidize α-pinene. At [O3] ppm and [NO2], OFR-iN2O5 generated NO3:O3 at s−1 (Fig. 12c), which achieved for mono- and sesquiterpenes with one double bond, most PAHs, and phenol/methoxyphenol species. Achieving NO3:O3 at s−1 was more challenging (Fig. 12d). Increasing [O3]0, LFR decreased [NO2]:[NO3] and, therefore, increased (Fig. 12e, f). In contrast, decreasing [O3]0, LFR or increasing , and, consequently, NO3exp, increased (Fig. 12g, h), potentially allowing more time for the autooxidation processes to occur. The best overlap between OFR-iN2O5 conditions that achieved and s was obtained with [NO2]–3 ppm and [O3]–300 ppm. Because atmospheric NO2:NO3 is highly variable and often much larger than NO2:NO3 achieved using OFR-iN2O5 (Brown et al., 2003; Stutz et al., 2004), simply attempting to maximize may not always be necessary and has trade-offs such as decreasing NO3:O3 and . OFR-iN2O5 was more difficult to apply to species such as unsaturated carbonyls and mono- and sesquiterpenes with multiple double bonds that react more efficiently with O3 than other VOCs; here, alternative NO3 generation techniques that do not introduce O3 to the OFR warrant consideration, even though they are more difficult to implement (Palm et al., 2017).
Because OFR-iN2O5 can continuously generate N2O5 and NO3 at room temperature, it is significantly easier to apply in continuous flow reactor studies than related techniques. However, in addition to the aforementioned considerations, high N2O5 and HNO3 concentrations that are generated using OFR-iN2O5 complicate the application of techniques such as iodide-adduct chemical ionization mass spectrometry due to efficient reactions between the iodide reagent ion and N2O5 or HNO3 (Lee et al., 2014). Additionally, the humidity-dependent N2O5 wall loss rate must be accurately characterized to model the performance of a specific OFR-iN2O5 configuration. Future applications of OFR-iN2O5 will investigate the NO3-initiated OVOC and SOA formation potential of simple and complex precursors in laboratory and field studies.
Data and KinSim mechanisms presented in this paper are available upon request. The KinSim kinetic solver is freely available at http://tinyurl.com/kinsim-release (Peng and Jimenez, 2020).
The supplement related to this article is available online at: https://doi.org/10.5194/amt-13-2397-2020-supplement.
ATL, ECW, and AA conceived and planned the experiments. ATL, JEK, FM, LRW, PLC, AA, and JEP carried out the experiments. MC and AF performed the IBBCEAS measurements and data analysis. AL, JLJ, and ZP conceived and planned the model simulations, and ATL and ZP carried out the model simulations. ATL, ECW, ZP, and JLJ contributed to the interpretation of the results. AL took the lead in writing the paper. All authors provided feedback on the paper.
The authors declare no competing interests.
Andrew T. Lambe thanks Christopher Boyd and Sally Ng (Georgia Tech) for sharing AMS data obtained in their environmental chamber, and the following colleagues for helpful discussions: Megan Claflin, Manjula Canagaratna, John Jayne, and Douglas Worsnop from ARI; William Brune from Pennsylvania State University; Manfred Winnewisser from Ohio State University; Karl Christe from the University of Southern California; and Robert Woodward-Massey, Youfeng Wang, and Chunxiang Ye from Peking University. The authors thank the ACMCC and participants of the ACMCC pON experiment in December 2018.
The ACMCC pON experiment was supported by the French Ministry of Environment and part of the COST Action CA16109 COLOSSAL and the Aerosol, Clouds, and Trace gases Research InfraStructure (ACTRIS). Zhe Peng and Jose L. Jimenez were supported by the US NSF (grant no. AGS-1822664) and EPA STAR (grant no. 83587701-0). This paper has not been reviewed by the EPA and no endorsement should be inferred.
This paper was edited by Keding Lu and reviewed by three anonymous referees.
Albinet, A., Petit, J.-E., Lambe, A. T., Kalogridis, A., Heikkinen, L., Graeffe, F., Cirtog, M., Féron, A., Allan, J. D., Bibi, Z., Amodeo, T., Karoski, N., Aujay-Plouzeau, R., Meunier, L., Gros, V., Bonnaire, N., Sarda-Estève, R., Truong, F., Ehn, M., Jokinen, T., Aurela, M., Maasikmets, M., Marin, C., Marmureanu, L., Eriksson, A., Ahlberg, E., Freney, E., Minguillon, M., Croteau, P. L., Jayne, J. T., Williams, L. R., and Favez, O.: Overview of the ACMCC particulate organonitrates (pON) experiment, in: 37th AAAR Conference, 14–18 October 2019, Portland, OR, USA, 2019. a
Asaf, D., Tas, E., Pedersen, D., Peleg, M., and Luria, M.: Long-Term Measurements of NO3 Radical at a Semiarid Urban Site: 2. Seasonal Trends and Loss Mechanisms, Environ. Sci. Technol., 44, 5901–5907, https://doi.org/10.1021/es100967z, 2010. a, b, c
Atkinson, R.: Kinetics and Mechanisms of the Gas-Phase Reactions of the NO3 Radical with Organic Compounds, J. Phys. Chem. Ref. Data, 20, 459–507, https://doi.org/10.1063/1.555887, 1991. a, b
Atkinson, R., Arey, J., Zielinska, B., and Aschmann, S. M.: Kinetics and nitro-products of the gas-phase OH and NO3 radical-initiated reactions of naphthalene-d8, fluoranthene-d10, and pyrene, Int. J. Chem., 22, 999–1014, https://doi.org/10.1002/kin.550220910, 1990. a
Atkinson, R., Tuazon, E. C., Bridier, I., and Arey, J.: Reactions of NO3-naphthalene adducts with O2 and NO2, Int. J. Chem. Kinet., 26, 605–614, https://doi.org/10.1002/kin.550260603, 1994. a
Berndt, T., Mentler, B., Scholz, W., Fischer, L., Herrmann, H., Kulmala, M., and Hansel, A.: Accretion Product Formation from Ozonolysis and OH Radical Reaction of α-Pinene: Mechanistic Insight and the Influence of Isoprene and Ethylene, Environ. Sci. Technol., 52, 11069–11077, https://doi.org/10.1021/acs.est.8b02210, 2018a. a
Berndt, T., Scholz, W., Mentler, B., Fischer, L., Herrmann, H., Kulmala, M., and Hansel, A.: Accretion Product Formation from Self- and Cross-Reactions of RO2 Radicals in the Atmosphere, Angew. Chem. Int. Ed., 57, 3820–3824, https://doi.org/10.1002/anie.201710989, 2018b. a
Boyd, C. M., Sanchez, J., Xu, L., Eugene, A. J., Nah, T., Tuet, W. Y., Guzman, M. I., and Ng, N. L.: Secondary organic aerosol formation from the β-pinene+NO3 system: effect of humidity and peroxy radical fate, Atmos. Chem. Phys., 15, 7497–7522, https://doi.org/10.5194/acp-15-7497-2015, 2015. a, b, c
Brown, S. S. and Stutz, J.: Nighttime radical observations and chemistry, Chem. Soc. Rev., 41, 6405–6447, https://doi.org/10.1039/C2CS35181A, 2012. a
Brown, S. S., Stark, H., Ryerson, T. B., Williams, E. J., Nicks Jr., D. K., Trainer, M., Fehsenfeld, F. C., and Ravishankara, A. R.: Nitrogen oxides in the nocturnal boundary layer: Simultaneous in situ measurements of NO3, N2O5, NO2, NO, and O3, J. Geophys. Res., 108, 4299, https://doi.org/10.1029/2002jd002917, 2003. a
Burrows, J. P., Tyndall, G. S., and Moortgat, G. K.: Absorption spectrum of NO3 and kinetics of the reactions of NO3 with NO2, Cl, and several stable atmospheric species at 298 K, J. Phys. Chem., 89, 4848–4856, https://doi.org/10.1021/j100268a038, 1985. a
Cabañas, B., Baeza, M. T., MartÍn, P., Salgado, S., Villanueva, F., Monedero, E., and Wirtz, K.: Products and Mechanism of the NO3 Reaction with Thiophene, J. Atmos. Chem., 51, 317–335, https://doi.org/10.1007/s10874-005-3580-5, 2005. a
Cirtog, M., Fouqueau, A., Michoud, V., Cazaunau, M., Bergé, A., Maisonneuve, F., Zapf, P., Pangui, E., Landsheere, X., Giacomoni, J., Gobbi, M., Hannotel, L., Paris, A., Roulier, N., Mellouki, A., Formenti, P., Cantrell, C., Doussin, J.-F., and Picquet-Varralut, B.: Development of a Broad Band Cavity Enhanced Absorption Spectrometer for NO3 measurements on field and first observations of nighttime NO3 vertical profils over Paris, Atmos. Meas. Tech. Discuss., manuscript in preparation, 2020. a
Claflin, M. S. and Ziemann, P. J.: Identification and Quantitation of Aerosol Products of the Reaction of beta-Pinene with NO3 Radicals and Implications for Gas- and Particle-Phase Reaction Mechanisms, J. Phys. Chem. A, 122, 3640–3652, https://doi.org/10.1021/acs.jpca.8b00692, 2018. a
Crounse, J. D., Nielsen, L. B., Jørgensen, S., Kjaergaard, H. G., and Wennberg, P. O.: Autoxidation of Organic Compounds in the Atmosphere, J. Phys. Chem. Lett., 4, 3513–3520, 2013. a
D'Anna, B., Andresen, Ø., Gefen, Z., and Nielsen, C. J.: Kinetic study of OH and NO3 radical reactions with 14 aliphatic aldehydes, Phys. Chem. Chem. Phys., 3, 3057–3063, https://doi.org/10.1039/B103623H, 2001. a
Dubé, W. P., Brown, S. S., Osthoff, H. D., Nunley, M. R., Ciciora, S. J., Paris, M. W., McLaughlin, R. J., and Ravishankara, A. R.: Aircraft instrument for simultaneous, in situ measurement of NO3 and N2O5 via pulsed cavity ring-down spectroscopy, Rev. Sci., 77, 34–101, https://doi.org/10.1063/1.2176058, 2006. a
Farmer, D. K., Matsunaga, A., Docherty, K. S., Surratt, J. D., Seinfeld, J. H., Ziemann, P. J., and Jimenez, J. L.: Atmospheric Chemistry Special Feature: Response of an aerosol mass spectrometer to organonitrates and organosulfates and implications for atmospheric chemistry, P. Natl. Acad. Sci. USA, 107, 6670–6675, 2010. a
Fiedler, S. E., Hese, A., and Ruth, A. A.: Incoherent broad-band cavity-enhanced absorption spectroscopy, Chem. Phys. Lett., 371, 284–294, 2003. a
Finlayson-Pitts, B. J. and Pitts Jr., J. N.: Chemistry of the Upper and Lower Atmosphere: Theory, Experiments, and Applications, Academic Press, Cambridge, Massachusetts, US, 2000. a
Fouqueau, A., Cirtog, M., Cazaunau, M., Pangui, E., Zapf, P., Siour, G., Landsheere, X., Méjean, G., Romanini, D., and Picquet-Varrault, B.: Implementation of an IBBCEAS technique in an atmospheric simulation chamber for in situ NO3 monitoring: characterization and validation for kinetic studies, Atmos. Meas. Tech. Discuss., https://doi.org/10.5194/amt-2020-103, in review, 2020. a
Fuchs, N. A. and Sutugin, A. G.: Highly Dispersed Aerosols, Ann Arbor Science Publishers, Newton, MA, 1970. a
Gržinić, G., Bartels-Rausch, T., Berkemeier, T., Türler, A., and Ammann, M.: Viscosity controls humidity dependence of N2O5 uptake to citric acid aerosol, Atmos. Chem. Phys., 15, 13615–13625, https://doi.org/10.5194/acp-15-13615-2015, 2015. a
Hallquist, M., Wängberg, I., Ljungström, E., Barnes, I., and Becker, K.-H.: Aerosol and Product Yields from NO3 Radical-Initiated Oxidation of Selected Monoterpenes, Environ. Sci. Technol., 33, 553–559, https://doi.org/10.1021/es980292s, 1999. a
Jenkin, M. E., Saunders, S. M., Wagner, V., and Pilling, M. J.: Protocol for the development of the Master Chemical Mechanism, MCM v3 (Part B): tropospheric degradation of aromatic volatile organic compounds, Atmos. Chem. Phys., 3, 181–193, https://doi.org/10.5194/acp-3-181-2003, 2003. a
Kang, E., Root, M. J., Toohey, D. W., and Brune, W. H.: Introducing the concept of Potential Aerosol Mass (PAM), Atmos. Chem. Phys., 7, 5727–5744, https://doi.org/10.5194/acp-7-5727-2007, 2007. a
Kennedy, O. J., Ouyang, B., Langridge, J. M., Daniels, M. J. S., Bauguitte, S., Freshwater, R., McLeod, M. W., Ironmonger, C., Sendall, J., Norris, O., Nightingale, R., Ball, S. M., and Jones, R. L.: An aircraft based three channel broadband cavity enhanced absorption spectrometer for simultaneous measurements of NO3, N2O5 and NO2, Atmos. Meas. Tech., 4, 1759–1776, https://doi.org/10.5194/amt-4-1759-2011, 2011. a, b
Knopf, D. A., Forrester, S. M., and Slade, J. H.: Heterogeneous oxidation kinetics of organic biomass burning aerosol surrogates by O3, NO2, N2O5, and NO3, Phys. Chem. Chem. Phys., 13, 21050–21062, https://doi.org/10.1039/C1CP22478F, 2011. a
Krechmer, J., Lopez-Hilfiker, F., Koss, A., Hutterli, M., Stoermer, C., Deming, B., Kimmel, J., Warneke, C., Holzinger, R., Jayne, J., Worsnop, D., Fuhrer, K., Gonin, M., and de Gouw, J.: Evaluation of a New Reagent-Ion Source and Focusing Ion–Molecule Reactor for Use in Proton-Transfer-Reaction Mass Spectrometry, Anal. Chem., 90, 12011–12018, https://doi.org/10.1021/acs.analchem.8b02641, 2018. a
Lambe, A., Miracolo, M., Hennigan, C., Robinson, A., and Donahue, N.: Effective Rate Constants and Uptake Coefficients for the Reactions of Organic Molecular Markers (n-Alkanes, Hopanes, and Steranes) in Motor Oil and Diesel Primary Organic Aerosols with Hydroxyl Radicals, Environ. Sci. Technol., 43, 8794–8800, 2009. a
Lambe, A. T., Ahern, A. T., Williams, L. R., Slowik, J. G., Wong, J. P. S., Abbatt, J. P. D., Brune, W. H., Ng, N. L., Wright, J. P., Croasdale, D. R., Worsnop, D. R., Davidovits, P., and Onasch, T. B.: Characterization of aerosol photooxidation flow reactors: heterogeneous oxidation, secondary organic aerosol formation and cloud condensation nuclei activity measurements, Atmos. Meas. Tech., 4, 445–461, https://doi.org/10.5194/amt-4-445-2011, 2011. a
Lambe, A. T., Chhabra, P. S., Onasch, T. B., Brune, W. H., Hunter, J. F., Kroll, J. H., Cummings, M. J., Brogan, J. F., Parmar, Y., Worsnop, D. R., Kolb, C. E., and Davidovits, P.: Effect of oxidant concentration, exposure time, and seed particles on secondary organic aerosol chemical composition and yield, Atmos. Chem. Phys., 15, 3063–3075, https://doi.org/10.5194/acp-15-3063-2015, 2015. a
Lambe, A., Massoli, P., Zhang, X., Canagaratna, M., Nowak, J., Daube, C., Yan, C., Nie, W., Onasch, T., Jayne, J., Kolb, C., Davidovits, P., Worsnop, D., and Brune, W.: Controlled nitric oxide production via O(1D) + N2O reactions for use in oxidation flow reactor studies, Atmos. Meas. Tech., 10, 2283–2298, https://doi.org/10.5194/amt-10-2283-2017, 2017. a
Lambe, A. T., Krechmer, J. E., Peng, Z., Casar, J. R., Carrasquillo, A. J., Raff, J. D., Jimenez, J. L., and Worsnop, D. R.: HOx and NOx production in oxidation flow reactors via photolysis of isopropyl nitrite, isopropyl nitrite-d7, and 1, 3-propyl dinitrite at λ=254, 350, and 369 nm, Atmos. Meas. Tech., 12, 299–311, https://doi.org/10.5194/amt-12-299-2019, 2019. a, b, c
Langridge, J. M., Ball, S. M., Shillings, A. J. L., and Jones, R. L.: A broadband absorption spectrometer using light emitting diodes for ultrasensitive, in situ trace gas detection, Rev. Sci., 79, 123110, https://doi.org/10.1063/1.3046282, 2008. a
Lee, B. H., Lopez-Hilfiker, F. D., Mohr, C., Kurten, T., Worsnop, D. R., and Thornton, J. A.: An Iodide-Adduct High-Resolution Time-of-Flight Chemical-Ionization Mass Spectrometer: Application to Atmospheric Inorganic and Organic Compounds, Environ. Sci. Technol., 48, 6309–6317, 2014. a
Li, R., Palm, B. B., Ortega, A. M., Hlywiak, J., Hu, W., Peng, Z., Day, D. A., Knote, C., Brune, W. H., De Gouw, J. A., and Jimenez, J. L.: Modeling the Radical Chemistry in an Oxidation Flow Reactor: Radical Formation and Recycling, Sensitivities, and the OH Exposure Estimation Equation, J. Phys. Chem. A, 119, 4418–4432, https://doi.org/10.1021/jp509534k, 2015. a
Manion, J. A., Huie, R. E., Levin, R. D., Burgess Jr., D. R., Orkin, V. L., Tsang, W., McGivern, W. S., Hudgens, J. W., Knyazev, V. D., Atkinson, D. B., Chai, E., Tereza, A. M., Lin, C.-Y., Allison, T. C., Mallard, W. G., Westley, F., Herron, J. T., Hampson, R. F., and Frizzell, D. H.: NIST Chemical Kinetics Database, NIST Standard Reference Database 17, Version 7.0 (Web Version), Release 1.6.8, Data version 2015.09, National Institute of Standards and Technology, Gaithersburg, Maryland, 20899-8320, available at: http://kinetics.nist.gov/ (last access: 13 May 2020), 2015. a
Melaas, E. K., Wang, J. A., Miller, D. L., and Friedl, M. A.: Interactions between urban vegetation and surface urban heat islands: a case study in the Boston metropolitan region, Environ. Res. Lett., 11, 054020, https://doi.org/10.1088/1748-9326/11/5/054020, 2016. a
Middlebrook, A. M., Bahreini, R., Jimenez, J. L., and Canagaratna, M. R.: Evaluation of Composition-Dependent Collection Efficiencies for the Aerodyne Aerosol Mass Spectrometer using Field Data, Aerosol. Sci. Technol., 46, 258–271, 2012. a
Nah, T., Sanchez, J., Boyd, C. M., and Ng, N. L.: Photochemical Aging of α-pinene and β-pinene Secondary Organic Aerosol formed from Nitrate Radical Oxidation, Environ. Sci. Technol., 50, 222–231, https://doi.org/10.1021/acs.est.5b04594, 2016. a
Ng, N. L., Brown, S. S., Archibald, A. T., Atlas, E., Cohen, R. C., Crowley, J. N., Day, D. A., Donahue, N. M., Fry, J. L., Fuchs, H., Griffin, R. J., Guzman, M. I., Herrmann, H., Hodzic, A., Iinuma, Y., Jimenez, J. L., Kiendler-Scharr, A., Lee, B. H., Luecken, D. J., Mao, J., McLaren, R., Mutzel, A., Osthoff, H. D., Ouyang, B., Picquet-Varrault, B., Platt, U., Pye, H. O. T., Rudich, Y., Schwantes, R. H., Shiraiwa, M., Stutz, J., Thornton, J. A., Tilgner, A., Williams, B. J., and Zaveri, R. A.: Nitrate radicals and biogenic volatile organic compounds: oxidation, mechanisms, and organic aerosol, Atmos. Chem. Phys., 17, 2103–2162, https://doi.org/10.5194/acp-17-2103-2017, 2017. a, b, c, d
Orlando, J. J. and Tyndall, G. S.: Laboratory studies of organic peroxy radical chemistry: an overview with emphasis on recent issues of atmospheric significance, Chem. Soc. Rev., 41, 6294–6317, https://doi.org/10.1039/C2CS35166H, 2012. a, b
Orphal, J., Fellows, C. E., and Flaud, P.-M.: The visible absorption spectrum of NO3 measured by high-resolution Fourier transform spectroscopy, J. Geophys. Res.-Atmos., 108, 4077, https://doi.org/10.1029/2002JD002489, 2003. a, b, c, d
Palm, B. B., Campuzano-Jost, P., Day, D. A., Ortega, A. M., Fry, J. L., Brown, S. S., Zarzana, K. J., Dube, W., Wagner, N. L., Draper, D. C., Kaser, L., Jud, W., Karl, T., Hansel, A., Gutiérrez-Montes, C., and Jimenez, J. L.: Secondary organic aerosol formation from in situ OH, O3, and NO3 oxidation of ambient forest air in an oxidation flow reactor, Atmos. Chem. Phys., 17, 5331–5354, https://doi.org/10.5194/acp-17-5331-2017, 2017. a, b, c, d, e
Peng, Z. and Jimenez, J. L.: Modeling of the chemistry in oxidation flow reactors with high initial NO, Atmos. Chem. Phys., 17, 11991–12010, https://doi.org/10.5194/acp-17-11991-2017, 2017. a
Peng, Z. and Jimenez, J. L.: KinSim: A Research-Grade, User-Friendly, Visual Kinetics Simulator for Chemical-Kinetics and Environmental-Chemistry Teaching, J. Chem. Educ., 96, 806–811, https://doi.org/10.1021/acs.jchemed.9b00033, 2019. a
Peng, Z. and Jimenez, J.: Downloadable KinSim cases and mechanisms, available at: https://tinyurl.com/kinsim-cases#bookmark=kix.6zu8zdwq2lce, last access: 13 May 2020. a
Peng, Z., Day, D. A., Stark, H., Li, R., Lee-Taylor, J., Palm, B. B., Brune, W. H., and Jimenez, J. L.: HOx radical chemistry in oxidation flow reactors with low-pressure mercury lamps systematically examined by modeling, Atmos. Meas. Tech., 8, 4863–4890, https://doi.org/10.5194/amt-8-4863-2015, 2015. a, b
Peng, Z., Palm, B. B., Day, D. A., Talukdar, R. K., Hu, W., Lambe, A. T., Brune, W. H., and Jimenez, J. L.: Model Evaluation of New Techniques for Maintaining High-NO Conditions in Oxidation Flow Reactors for the Study of OH-Initiated Atmospheric Chemistry, ACS Earth Space Chem., 2, 72–86, https://doi.org/10.1021/acsearthspacechem.7b00070, 2018. a, b, c
Peng, Z., Lee-Taylor, J., Orlando, J. J., Tyndall, G. S., and Jimenez, J. L.: Organic peroxy radical chemistry in oxidation flow reactors and environmental chambers and their atmospheric relevance, Atmos. Chem. Phys., 19, 813–834, https://doi.org/10.5194/acp-19-813-2019, 2019. a
Platz, J., Nielsen, O. J., Wallington, T. J., Ball, J. C., Hurley, M. D., Straccia, A. M., Schneider, W. F., and Sehested, J.: Atmospheric Chemistry of the Phenoxy Radical, C6H5O: UV Spectrum and Kinetics of its Reaction with NO, NO2 and O2, J. Phys. Chem. A, 102, 7964–7974, https://doi.org/10.1021/jp982221l, 1998. a
Rudich, Y., Talukdar, R. K., Imamura, T., Fox, R. W., and Ravishankara, A. R.: Uptake of NO3 on KI solutions: rate coefficient for the NO3+I-reaction and gas-phase diffusion coefficients for NO3, Chem. Phys. Lett., 261, 467–473, 1996. a
Saunders, S. M., Jenkin, M. E., Derwent, R. G., and Pilling, M. J.: Protocol for the development of the Master Chemical Mechanism, MCM v3 (Part A): tropospheric degradation of non-aromatic volatile organic compounds, Atmos. Chem. Phys., 3, 161–180, https://doi.org/10.5194/acp-3-161-2003, 2003. a
Short, K. C.: Spatial wildfire occurrence data for the United States, 1992–2015, 4th Edition, https://doi.org/10.2737/RDS-2013-0009.4, 2017. a
Stutz, J., Alicke, B., Ackermann, R., Geyer, A., White, A., and Williams, E.: Vertical profiles of NO3, N2O5, O3, and NOx in the nocturnal boundary layer: 1. Observations during the Texas Air Quality Study 2000, J. Geophys. Res., 109, D12306, https://doi.org/10.1029/2003jd004209, 2004. a
Vandaele, A. C., Hermans, C., Simon, P. C., Carleer, M., Colin, R., Fally, S., Mérienne, M. F., Jenouvrier, A., and Coquart, B.: Measurements of the NO2 absorption cross-section from 42 000 cm−1 to 10 000 cm−1 (238–1000 nm) at 220 K and 294 K., J. Quant. Spectrosc. Radiat. Transf., 59, 171–184, https://doi.org/10.1016/S0022-4073(97)00168-4, 1998. a, b
Venables, D. S., Gherman, T., Orphal, J., Wenger, J. C., and Ruth, A. A.: High Sensitivity in Situ Monitoring of NO3 in an Atmospheric Simulation Chamber Using Incoherent Broadband Cavity-Enhanced Absorption Spectroscopy, Environ. Sci. Technol., 40, 6758–6763, https://doi.org/10.1021/es061076j, 2006. a
Voigt, S., Orphal, J., Bogumil, K., and Burrows, J. P.: The temperature dependence (203–293 K) of the absorption cross sections of O3 in the 230–850 nm region measured by Fourier-transform spectroscopy, J. Photoch. Photobio. A, 143, 1–9, 2001. a
Wagner, C., Hanisch, F., Holmes, N., de Coninck, H., Schuster, G., and Crowley, J. N.: The interaction of N2O5 with mineral dust: aerosol flow tube and Knudsen reactor studies, Atmos. Chem. Phys., 8, 91–109, https://doi.org/10.5194/acp-8-91-2008, 2008. a
Warneck, P. and Williams, J.: The Atmospheric Chemist's Companion, Springer, Dordrecht, https://doi.org/10.1007/978-94-007-2275-0, 2012. a
Wayne, R. P., Barnes, I., Biggs, P., Burrows, J. P., Canosa-Mas, C. E., Hjorth, J., Le Bras, G., Moortgat, G. K., Perner, D., Poulet, G., Restelli, G., and Sidebottom, H.: The nitrate radical: physics, chemistry, and the atmosphere, Atmos. Environ. A, 25, 1–203, 1991. a
Wood, E. C., Wooldridge, P. J., Freese, J. H., Albrecht, T., and Cohen, R. C.: Prototype for In Situ Detection of Atmospheric NO3 and N2O5 via Laser-Induced Fluorescence, Environ. Sci. Technol., 37, 5732–5738, https://doi.org/10.1021/es034507w, 2003. a, b, c
Xu, W., Lambe, A., Silva, P., Hu, W., Onasch, T., Williams, L., Croteau, P., Zhang, X., Renbaum-Wolff, L., Fortner, E., Jimenez, J. L., Jayne, J., Worsnop, D., and Canagaratna, M.: Laboratory evaluation of species-dependent relative ionization efficiencies in the Aerodyne Aerosol Mass Spectrometer, Aerosol. Sci. Technol., 52, 626–641, https://doi.org/10.1080/02786826.2018.1439570, 2018. a