the Creative Commons Attribution 4.0 License.
the Creative Commons Attribution 4.0 License.
 | 15 May 2020
An intercomparison of CH3O2 measurements by fluorescence assay by gas expansion and cavity ring-down spectroscopy within HIRAC (Highly Instrumented Reactor for Atmospheric Chemistry)
Lavinia Onel
Alexander Brennan
Michele Gianella
James Hooper
Nicole Ng
Gus Hancock
Lisa Whalley
Paul W. Seakins
Grant A. D. Ritchie
Dwayne E. Heard
Simultaneous measurements of CH3O2 radical concentrations have been performed using two different methods in the Leeds HIRAC (Highly Instrumented Reactor for Atmospheric Chemistry) chamber at 295 K and in 80 mbar of a mixture of 3:1 He∕O2 and 100 or 1000 mbar of synthetic air. The first detection method consisted of the indirect detection of CH3O2 using the conversion of CH3O2 into CH3O by excess NO with subsequent detection of CH3O by fluorescence assay by gas expansion (FAGE). The FAGE instrument was calibrated for CH3O2 in two ways. In the first method, a known concentration of CH3O2 was generated using the 185 nm photolysis of water vapour in synthetic air at atmospheric pressure followed by the conversion of the generated OH radicals to CH3O2 by reaction with CH4∕O2. This calibration can be used for experiments performed in HIRAC at 1000 mbar in air. In the second method, calibration was achieved by generating a near steady state of CH3O2 and then switching off the photolysis lamps within HIRAC and monitoring the subsequent decay of CH3O2, which was controlled via its self-reaction, and analysing the decay using second-order kinetics. This calibration could be used for experiments performed at all pressures. In the second detection method, CH3O2 was measured directly using cavity ring-down spectroscopy (CRDS) using the absorption at 7487.98 cm−1 in the A←X (ν12) band with the optical path along the ∼1.4 m chamber diameter. Analysis of the second-order kinetic decays of CH3O2 by self-reaction monitored by CRDS has been used for the determination of the CH3O2 absorption cross section at 7487.98 cm−1, both at 100 mbar of air and at 80 mbar of a 3:1 He∕O2 mixture, from which cm2 molecule−1 was determined for both pressures. The absorption spectrum of CH3O2 between 7486 and 7491 cm−1 did not change shape when the total pressure was increased to 1000 mbar, from which we determined that is independent of pressure over the pressure range 100–1000 mbar in air. CH3O2 was generated in HIRAC using either the photolysis of Cl2 with UV black lamps in the presence of CH4 and O2 or the photolysis of acetone at 254 nm in the presence of O2. At 1000 mbar of synthetic air the correlation plot of [CH3O2]FAGE against [CH3O2]CRDS gave a gradient of 1.09±0.06. At 100 mbar of synthetic air the FAGE–CRDS correlation plot had a gradient of 0.95±0.024, and at 80 mbar of 3:1 He∕O2 mixture the correlation plot gradient was 1.03±0.05. These results provide a validation of the FAGE method to determine concentrations of CH3O2.
- Article
(1526 KB) -
Supplement
(1138 KB) - BibTeX
- EndNote


Methyl peroxy (CH3O2) radicals are important intermediates during atmospheric oxidation (Orlando and Tyndall, 2012) and combustion chemistry (Zador et al., 2011), and they are produced mainly by the oxidation of CH4 and larger hydrocarbons followed by the termolecular reaction between the CH3 radical, O2 and a third body M (Reaction R1).
In environments influenced by anthropogenic NOx emissions, CH3O2 predominantly reacts with NO to produce NO2 and CH3O (Reaction R2).
CH3O subsequently reacts with O2 (Reaction R3) to generate HO2, which in turn oxidises another NO molecule to NO2 (Reaction R4). The subsequent photolysis of NO2 leads to the formation of tropospheric ozone, an important constituent of photochemical smog.
In remote, clean environments, i.e. under low-NOx levels, CH3O2 is significantly removed by its self-reaction (Reaction R5) and the cross-reactions with HO2 and other organic peroxy radicals (RO2) (Tyndall et al., 2001).
Recently the reaction of CH3O2 with OH was measured to be fast (Fittschen, 2019; Yan, 2016) and provides an additional loss route for CH3O2 under low-NOx conditions (Fittschen et al., 2014; Assaf et al., 2017). As CH3O2 is formed by the oxidation of CH4, one of the most abundant tropospheric trace gases, as well as by the oxidation of other volatile organic compounds, it is predicted by numerical models to be the most abundant RO2 species in the atmosphere. Although CH3O2 has not (yet) been selectively measured in the atmosphere, its concentration has been estimated using atmospheric models to peak at ∼107–108 molecule cm−3 during the daytime (Whalley et al., 2010, 2011, 2018).
At present, CH3O2 is not measured selectively in the atmosphere by any direct or indirect method. The sum of HO2 and all RO2 species, , and, separately, the sum of RO2, , have been measured in the atmosphere using a range of indirect methods. Onel et al. (2017a) presents an overview of these methods, such as the peroxy radical chemical amplifier (PERCA) (Cantrell et al., 1984; Hernandez et al., 2001; Green et al., 2006; Miyazaki et al., 2010; Wood et al., 2017), ROx chemical conversion – CIMS (chemical ionisation mass spectrometry) (ROxMAS) (Hanke et al., 2002) and ROx chemical conversion – LIF (laser-induced fluorescence) (ROxLIF) (Fuchs et al., 2008; Whalley et al., 2013). ROxLIF uses LIF detection of OH at low pressure, known as fluorescence assay by gas expansion (FAGE) and has been employed for partially speciated RO2 detection, distinguishing between the sum of alkene, aromatic and long-chain alkane-derived RO2 radicals and the sum of short-chain alkane-derived RO2 radicals (Whalley et al., 2013, 2018).
CIMS methods using reagent ions such as H3O+(H2O)n, and have been employed in the simultaneous and selective detection of RO2 in a number of recent studies (Noziere and Hanson, 2017; Noziere and Vereecken, 2019; Hansel et al., 2018; Jokinen et al., 2014). Volatile small RO2 radicals such as CH3O2 have been selectively measured in CIMS laboratory experiments with detection limits between and 1×10⁹ molecule cm−3 (Noziere and Hanson, 2017). CIMS with reagent ion has been employed in field measurements to record diurnal profiles of some highly oxygenated low-vapour-pressure RO2 radicals produced in the ozonolysis of monoterpenes peaking at a few 107 molecule cm−3 (Jokinen et al., 2014).
Many of the early laboratory studies of the CH3O2 radical reactions employed UV-absorption spectroscopy to monitor the B←X band centred around 240 nm, which is common to alkyl RO2 species (Wallington et al., 1992; Tyndall et al., 2001). The similarity of the broad featureless UV-absorption spectra of RO2 radicals made it challenging to distinguish between the individual RO2 species, particularly in a mixture (Orlando and Tyndall, 2012). The sensitivity of UV-absorption spectroscopy is quite low; for example, a minimum detectable absorption of , corresponding to 4×10¹² molecule cm−3 CH3O2, was reported (Sander and Watson, 1980). The A←X electronic transition of RO2 in the near IR (NIR) displays more structured spectra than the UV region, allowing for a selective identification of RO2 radicals. However, the A←X transition is weaker than the B←X transition, and multipass arrangements have been used to improve the detection sensitivity. A step-scan Fourier transform infrared spectrometer (Huang et al., 2007) operated using a multipass White cell has been used to detect a number of RO2 species, including CH3O2, with a typical minimum detectable absorbance of , corresponding to a limit of detection (LOD) of molecule cm−3 for most RO2 species studied. The use of cavity ring-down spectroscopy (CRDS) further improves the sensitivity of the RO2 detection due to the significantly longer path lengths that can be realised and to the coupling of high-performance NIR lasers, detectors and optical components. For example, an absorbance detection limit of less than has been obtained by using cavity mirrors of a maximum reflectivity of 99.995 % (Atkinson and Spillman, 2002).
The CRDS technique has been used under both ambient and jet-cooled conditions to provide insight into the molecular structure of CH3O2 and more complex RO2, as well as to selectively measure [RO2] in the laboratory (Sharp et al., 2008; Kline and Miller, 2014; Pushkarsky et al., 2000; Farago et al., 2013; Atkinson and Spillman, 2002; Sprague et al., 2013). Good agreement has been found between the experimental spectrum of CH3O2 in the range between ∼7200–8600 cm−1 (∼1.18–1.40 µm) measured using pulsed CRDS at typically 200 mbar of and theoretical predictions (Chung et al., 2007; Sharp et al., 2008). The origin band of the A←X transition has been located at 7382.8 cm−1 and a value of cm2 molecule−1 has been estimated for the absorption cross section at this wavenumber (Pushkarsky et al., 2000; Chung et al., 2007). A weaker absorption band has been found at 7488 cm−1 and assigned to a transition involving the methyl torsion (ν12) (Pushkarsky et al., 2000; Chung et al., 2007). By using the CH3O2 spectrum measured by Pushkarsky et al. (2000) from 7300 to 7700 cm−1, which covers both the origin band and the band involving the methyl torsional mode, a value of ca. cm2 molecule−1 is estimated for the maximum cross section for the ν12 transition, σmax(ν12). A few years later, Atkinson and Spillman (2002) measured cm2 molecule−1 at 27 mbar using continuous-wave (cw) CRDS. Very recent cw-CRDS studies reported cm2 molecule−1 at 67 mbar of a He+O2 mixture (Fittschen, 2019) and no dependence of σmax(ν12) on pressure over the range from 67 to 133 mbar (Farago et al., 2013).
Recently we have developed a new method for the selective and sensitive detection of CH3O2 using the conversion of CH3O2 to CH3O with excess NO followed by CH3O detection by FAGE with laser excitation at ca. 298 nm (Onel et al., 2017b). The LOD for the method whilst sampling from atmospheric pressure is molecule cm−3 for a signal-to-noise ratio of 2 and 5 min averaging time; the LOD is reduced to molecule cm−3 by averaging over 1 h. Therefore, the method has potential to be used in the measurement of atmospheric levels of CH3O2 in clean environments where [CH3O2] has been calculated to be of the order of 108 molecule cm−3 (Whalley et al., 2010, 2011). As LIF is not an absolute method of detection, FAGE instruments require calibration. Two methods of calibration for CH3O2 have been used (Onel et al., 2017b): the 184.9 nm photolysis of water vapour in the presence of excess CH4 and the kinetics of the second-order decay of CH3O2 via its self–reaction observed in the Highly Instrumented Reactor for Atmospheric Chemistry (HIRAC). Good agreement was found; i.e. the calibration factors obtained using the two methods had overlapping error limits at the 1σ level.
However, radicals are difficult to detect accurately and, particularly as FAGE is not an absolute and direct method, may be subject to systematic errors and hence require validation using complementary methods. Recently we intercompared measurements of HO2 concentrations by the indirect FAGE method and the direct and absolute CRDS method within HIRAC, and we demonstrated good agreement, within 10 % and 16 % at 150 mbar and 1000, respectively (Onel et al., 2017b), which validates the FAGE method for HO2. In this work, CH3O2 measurements by FAGE and CRDS within HIRAC are intercompared at 80 mbar for a mixture of 3:1 He∕O2 and at 100 and 1000 mbar for air.
2.1 CH3O2 generation in HIRAC
The HIRAC chamber (Glowacki et al., 2007) is constructed from SAE 304 stainless steel and has an internal volume of ∼ 2.25 m3, the contents of which are homogenised by four mixing fans. Eight 50 mm diameter quartz tubes are mounted radially inside the chamber and extend along its ∼2 m length. Each of the eight tubes house a UV lamp that is used to initiate chemical reactions. The lamps can be changed to different wavelength outputs depending on the chemical precursors to be used. The FAGE instrument is connected to the HIRAC chamber through an ISO-K160 flange with an O-ring compression fitting to allow the inlet distance from the wall of the chamber to be varied. The 380 mm long inlet allows the instrument to sample well away from the inner walls of the HIRAC chamber and avoid chemical processes at the metal surface. Because the FAGE system removes gas from the HIRAC chamber, a constant flow of synthetic air is introduced into the chamber to maintain a constant pressure. The CRDS set-up is described in Sect. 2.3.
The experiments were conducted inside the HIRAC chamber at 295 K using three different pressure and gas mixtures. The first used 80 mbar total pressure of helium (BOC, >99.99 %) and oxygen (BOC, >99.999 %) in the ratio of . The second and third mixtures both used synthetic air obtained by mixing oxygen with nitrogen (BOC, >99.998 %) in the ratio at 100 and 1000 mbar total pressure, respectively. CH3O2 was generated in the chamber by photolysing one of two precursor gas mixtures. The first CH3O2 precursor system was a mixture of Cl2 (Sigma Aldrich, ≥99.5 %) and CH4 (BOC, CP grade, 99.5 %), where the Cl2 was photolysed at ∼365 nm (Phillips, TL-D36W/BLB, λ=350–400 nm) to generate CH3O2 via the following reactions:
Typical reagent concentrations were [CH4]=1.2–2.5×10¹⁶ molecule cm−3 and [Cl2]=1.1–5.5×10¹⁵ molecule cm−3. The second method used the photolysis of acetone (Sigma Aldrich, HPLC grade, ≥99.9 %) at 254 nm (GE G55T8/OH 7G lamps) to produce CH3O2 via Reactions (R8) and (R9) followed by Reaction (R1):
Typical initial concentrations were molecule cm−3. In the FAGE calibration experiments using the kinetic decays molecule cm−3 with CH4 at one of two concentrations: 2.5×10¹⁶ and 2.5×10¹⁷ molecule cm−3. In the kinetic experiments performed to determine the absorption cross section of CH3O2 at 7487.98 cm−1, molecule cm−3 and molecule cm−3 at 80 mbar and molecule cm−3 and molecule cm−3 at 100 mbar .
2.2 FAGE instrument and calibration for CH3O2
The FAGE instrument in HIRAC has been described in detail previously (Winiberg et al., 2015; Onel et al., 2017a, b). The instrument has a ∼1 m long black anodised aluminium sampling tube with an inner diameter of 50 mm. The interior of the tube is held at a low pressure (3.3 mbar for a HIRAC pressure, pHIRAC of 1000 mbar of synthetic air and 0.9 mbar for pHIRAC=100 mbar synthetic air and pHIRAC=80 mbar mixture of ) and draws sample gas in through a 1 mm diameter pinhole mounted on one end of the tube at a rate of ∼3 SLPM. Two fluorescence cells are integrated into the tube, the centre of the first cell is ∼300 mm from the pinhole, and the centre of the second cell is a further ∼300 mm downstream, followed by a line of tubing that is connected to a rotary-backed roots blower pump system (Leybold Trivac D40B and Ruvac WAU 251). The first cell is used to detect OH radicals but is not relevant to this work and is not discussed further, whereas the second cell is used for the CH3O2 measurements detailed here. The CH3O2 radicals sampled through the FAGE pinhole at 1000 mbar in HIRAC reached the detection region in about 85 ms. High-purity NO (BOC, N2.5 nitric oxide) is injected at 2.5 sccm using a mass flow controller (Brooks 5850S) into the centre of the gas flow ∼ 25 mm prior to the second cell to convert CH3O2 radicals into CH3O. Pulsed laser light at 297.79 nm is directed through the cell, propagates perpendicular to the gas flow and is used to excite the transition of CH3O. The off-resonant red-shifted fluorescence (320–430 nm) from CH3O (A) is subsequently detected by a microchannel plate photomultiplier (Photek PMT325) using photon counting. Measurements are made at an excitation wavelength of 297.79+2.5 nm in order to determine the laser background, which is subtracted to leave only signal due to CH3O fluorescence.
The FAGE technique is not absolute and therefore determination of the calibration factor, (counts cm3 molecule−1 s−1 mW−1), is required to convert the measured signal, (counts s−1 mW−1), to the CH3O2 concentration:
2.2.1 Calibration at atmospheric pressure – H2O vapour photolysis in the presence of excess CH4
This calibration procedure has been described in detail previously (Winiberg et al., 2015; Onel et al., 2017b), as such only important points are presented here. CH3O2 radicals were generated by photolysing water vapour in air (BOC, synthetic BTCA 178) at 184.9 nm to produce OH radicals, which then reacted with methane (BOC, CP grade, 99.5 %) to produce CH3O2:
The subsequent air/radical mixture was then sampled by the FAGE instrument. The concentration of CH3O2 generated is given by
where σ is the absorption cross section of water vapour at 184.9 nm, cm2 molecule−1 (Cantrell et al., 1997; Creasey et al., 2000); Φ is the photodissociation quantum yield of OH at 184.9 nm (unity); t is the residence time of the gas in the photolysis field, which is ∼16.6 and ∼8.3 ms at 20 and 40 SLPM, respectively; and F is the lamp flux at 184.9 nm. The product F⋅t is determined using chemical actinometry (Winiberg et al., 2015). The 184.9 nm photon flux, F, is proportional to the electrical current supplied to the photolysis lamp and is varied to produce a range of CH3O2 radical concentrations. A typical calibration plot of the FAGE LIF signal versus generated [CH3O2] calculated using Eq. (2) is shown in Fig. S2 in the Supplement. An average of four calibrations gave counts cm3 molecule−1 s−1 mW−1 where the error represents the overall uncertainty (17 %) calculated using the statistical error (7 %) and the systematic error (16 %) at the 1σ level (Onel et al., 2017b).
2.2.2 Calibration using kinetics of the CH3O2 temporal decay
The calibration described in the previous section is only valid when FAGE is sampling at atmospheric pressure. However, when sampling from lower pressures, as described in Sect. 2.1, the FAGE cell pressure decreases (0.9 mbar sampling from 100 mbar) and the calibration is no longer valid. An alternative calibration procedure using the kinetics of the CH3O2 self-reaction inside the HIRAC chamber allowed the FAGE instrument to be calibrated under the same conditions of pressure as the intercomparison experiments, including at lower pressures. Table 1 shows the sensitivity factors, , obtained for each set of chamber conditions. Radicals were generated in the chamber in the same manner as those described in Sect. 2.1. However, instead of measuring steady-state radical concentrations, the lamps were switched off and on at ∼120 s intervals to produce a series of second-order decays, typically four per experiment, in which CH3O2 undergoes loss via self-reaction:
Assuming no wall loss for CH3O2, the kinetic decays can be described by the integrated second-order rate equation:
where [CH3O2]t is the radical concentration at time t of the decay; [CH3O2]0 is the initial concentration at the time t0, when the lamps are switched off; ; and kobs is the observed rate coefficient. The observed rate coefficient is larger than the second-order rate coefficient of just the CH3O2 recombination Reaction (R5) as the methoxy radicals generated by Reaction (R5b) react rapidly with oxygen present in large excess to produce HO2 (Reaction R3), which in turn reacts with CH3O2 (Reaction R12).
As each HO2 radical consumes rapidly one CH3O2 species on the timescale of Reaction (R5), the CH3O2 decay is described by second-order kinetics (Sander and Watson, 1980, 1981; McAdam et al., 1987; Kurylo and Wallington, 1987; Jenkin et al., 1988; Simon et al., 1990), with , where r5b is the branching ratio for Reaction (R5b). By using the IUPAC recommendations (Atkinson et al., 2006): molecule−1 cm3 s−1 and , a value of molecule−1 cm3 s−1 is obtained for kobs.
Modelling of the decay process with a variety of CH3O2 and HO2 concentrations after the lamps were switched off and following the establishment of steady-state conditions showed that Eq. (3) was valid within experimental error. With molecule−1 cm3 s−1 (Atkinson et al., 2006), a faster observed rate constant (defined by Eq. 3) was obtained from the model with a value, molecule−1 cm3 s−1, consistent with that recommended by IUPAC, ( molecule−1 cm3 s−1 (1σ uncertainty; Atkinson et al., 2006). Substituting Eq. (1) into Eq. (3) allows the measured signal over the decay to be related to the instrument sensitivity by
where and are the FAGE signal at time t and t0, respectively. Taking the reciprocal of Eq. (4) gives
which is then used to fit to the experimental data with kobs fixed to the value recommended by IUPAC for 298 K, molecule−1 cm3 s−1, using the Levenberg–Marquardt algorithm. Figure 1 shows an example CH3O2 self-reaction decay trace obtained at 1000 mbar, where the red line shows the result of the fitting process.
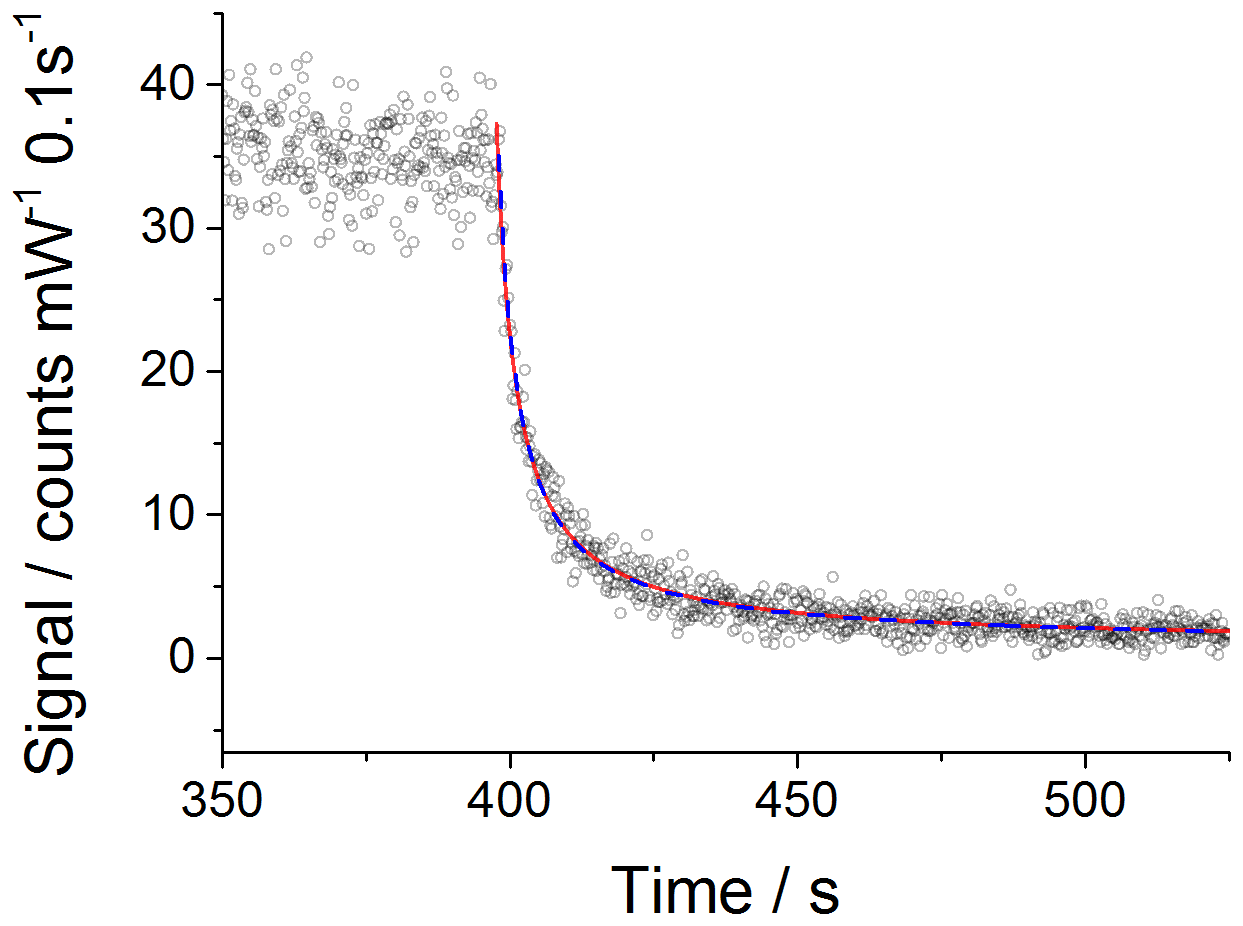
Figure 1An example of a second-order decay of the FAGE CH3O2 signal (normalised for laser power fluctuations) with 0.1 s time resolution (black open circles) recorded at 295 K and a 1000 mbar air mixture. CH3O2 was generated using [Cl2] of molecule cm− 1 and [CH4] of molecule cm−3. At time zero (∼400 s) the photolysis lamps were turned off to allow the radicals to decay. The data were fitted to Eq. (5) (excluding the wall loss rate, kloss; red line) and Eq. (6) (including kloss; blue dashed line) using the Levenberg–Marquardt algorithm. The obtained value for the sensitivity factor was the same for both fits: counts cm3 molecule−1 s−1 mW−1. The errors given above represent statistical uncertainties at the 1σ level.
However, as the HIRAC chamber is constructed from steel, the potential for a loss of CH3O2 to the walls was investigated. As circulation fans were used during all the experiments, the “movement” of CH3O2 radicals within the chamber is in part molecular diffusion and in part convection. Therefore, the parameter kloss is controlled by both convection and diffusion processes. By incorporating the wall loss as a first-order process, Eq. (5) becomes
Fitting Eqs. (5) and (6) to the experimental data is also shown in Fig. 1. The extracted values for the sensitivity factor are the same for the fit without and with wall loss included: counts cm3 molecule−1 s−1 mW−1 (statistical errors at the 1σ level). The close overlap of the fits without and with wall loss included and the small values extracted for kloss (upper limit of s−1) fitting Eq. (6) demonstrates that wall losses are very small and can be neglected. This is evidenced further by the lack of an observable radical gradient across the chamber diameter as shown in Fig. S5. In addition, modelling the CH3O2 decays including a wall loss for HO2 in the range of measured values, 0.03–0.09 s−1 (Onel et al., 2017a), showed a minor impact of the wall loss of HO2 on kobs, i.e. kobs within 98 %–95 % agreement with the IUPAC preferred value of molecule−1 cm3 s−1 (1σ uncertainty; Atkinson et al., 2006).
Table 1Average sensitivity factors for the FAGE instrument using the CH3O2 kinetic decay method under each chamber environment. Examples of these decays can be found in Fig. 1 above and in Figs. S3 and S4, and the reported values are typically from an average of eight decays. All the data were fitted using Eq. (5). The errors given in the table are overall uncertainties (13 %) at the 1σ level.
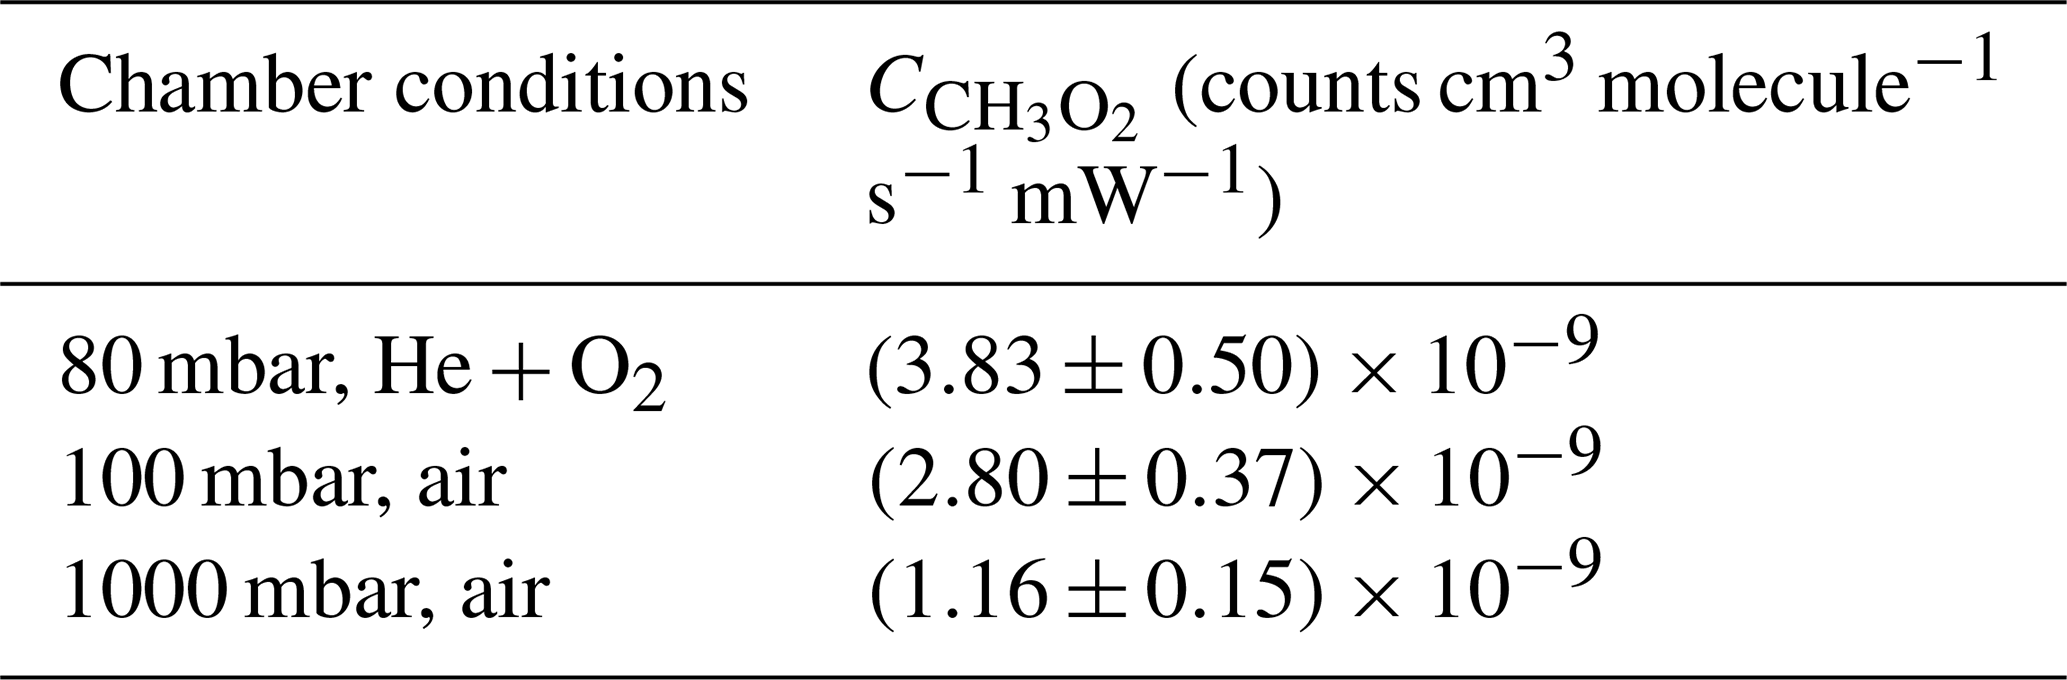
Table 1 shows the average sensitivity factors obtained by fitting Eq. (5) to a typical number of eight temporal decays of under each of the chamber conditions, and example decay traces for the 80 and 100 mbar experiments can be found in Figs. S3 and S4, respectively. These factors are used for their respective experimental conditions. For the 1000 mbar intercomparison experiments with CRDS, an average of the water vapour photolysis sensitivity factor at 1000 mbar ( counts cm3 molecule−1 s−1 mW−1) and the average sensitivity factor obtained from the kinetic decay ( counts cm3 molecule−1 s−1 mW−1) (Table 1) is used, giving counts cm3 molecule−1 s−1 mW−1. We make a brief comment regarding the difference in the sensitivity factors and , for which the ratio is ∼0.7, showing a ∼30 % difference, although the two calibration methods have overlapping error limits at the 2σ level. The kinetic method relies on the rate coefficient kobs for the CH3O2 self-reaction as recommended by IUPAC (Atkinson et al., 2006), which has a quoted 2σ uncertainty of 23 %. In a separate paper we will present a detailed study of the kinetics of the CH3O2 self-reaction, and its temperature dependence, and report a revised rate coefficient for this reaction at 298 K.
As the pressure in the FAGE detection cell was 2–3 orders of magnitude lower than the corresponding pressure in HIRAC (vide supra in Sect. 2.2), the concentrations of the reagents (Cl2, methane and acetone) were also 2–3 orders of magnitude lower in the fluorescence cells than the reagent concentrations in HIRAC. However, a potential effect of the reagents (Cl2, methane and acetone) on the FAGE sensitivity factor in the HIRAC experiments was investigated. Two different concentrations of CH4 were used in the kinetic method for FAGE calibration at 80 mbar of He+O2 in HIRAC to find practically the same sensitivity factor: counts cm3 molecule−1 s−1 mW−1 for 2.5×10¹⁶ molecule cm−3 CH4 (2.8×10¹⁴ molecule cm−3 in the fluorescence cell) and counts cm3 molecule−1 s−1 mW−1 for 2.5×10¹⁷ molecule cm−3 CH4 (2.8×10¹⁵ molecule cm−3 in the fluorescence cell). As shown in Fig. S1 there is a good agreement between the laser excitation scans of CH3O obtained from the CH3O2 generated in HIRAC using the two methods: acetone photolysis in the presence of O2 and Cl2 photolysis in the presence of CH4 and O2. In addition, a good agreement has been previously found between the laser excitation spectra of CH3O generated using the reaction of CH4 with OH (generated by the 184.9 nm photolysis of water) in the presence of O2 and directly through the 184.9 nm photolysis of CH3OH (Onel et al., 2017b). Therefore, no effect of the used reagents on the laser excitation spectrum of CH3O was found.
2.2.3 FAGE measurements of CH3O2 concentration gradient across the HIRAC diameter
Measurement of radical gradients across the chamber diameter have been performed previously for HO2 radicals (Onel et al., 2017a), where no gradient was observed until measuring <10 cm from the chamber wall where the signal began to decrease, ultimately by ∼16 % at the point at which the FAGE sampling pinhole was level with the chamber walls. To investigate any similar gradient effects for CH3O2, a steady-state concentration of CH3O2 was generated in the chamber at atmospheric pressure by photolysing O3 in the presence of air and methane:
Ozone and methane were present in the chamber at and 2.5 ×10¹⁷ molecule cm−3, respectively. The FAGE inlet was translated across the width of the chamber and the CH3O2 signal was observed to show no decrease within the ∼10 % 1σ statistical error of each measurement up until the point at which the pinhole was level with the chamber walls. Moving the instrument further backwards positioned the pinhole inside the ISO-K160 coupling flange and effectively ∼4 cm behind the chamber walls where there is likely to be little air movement. This position is analogous to that of the CRDS mirrors, which are recessed into the chamber walls as they mount to the outside of the chamber (see Sect. 2.3). In this position a signal drop of ∼14 % was observed, within the statistical error margins of the measurements. A plot of the radical gradient is shown in Fig. S5.
2.3 CRDS set-up
The optical path of the CRDS spectrometer within the HIRAC chamber is shown in Fig. 2 and is the same spectrometer as used to probe HO2 across the chamber's diameter, which has been described previously (Onel et al., 2017a).
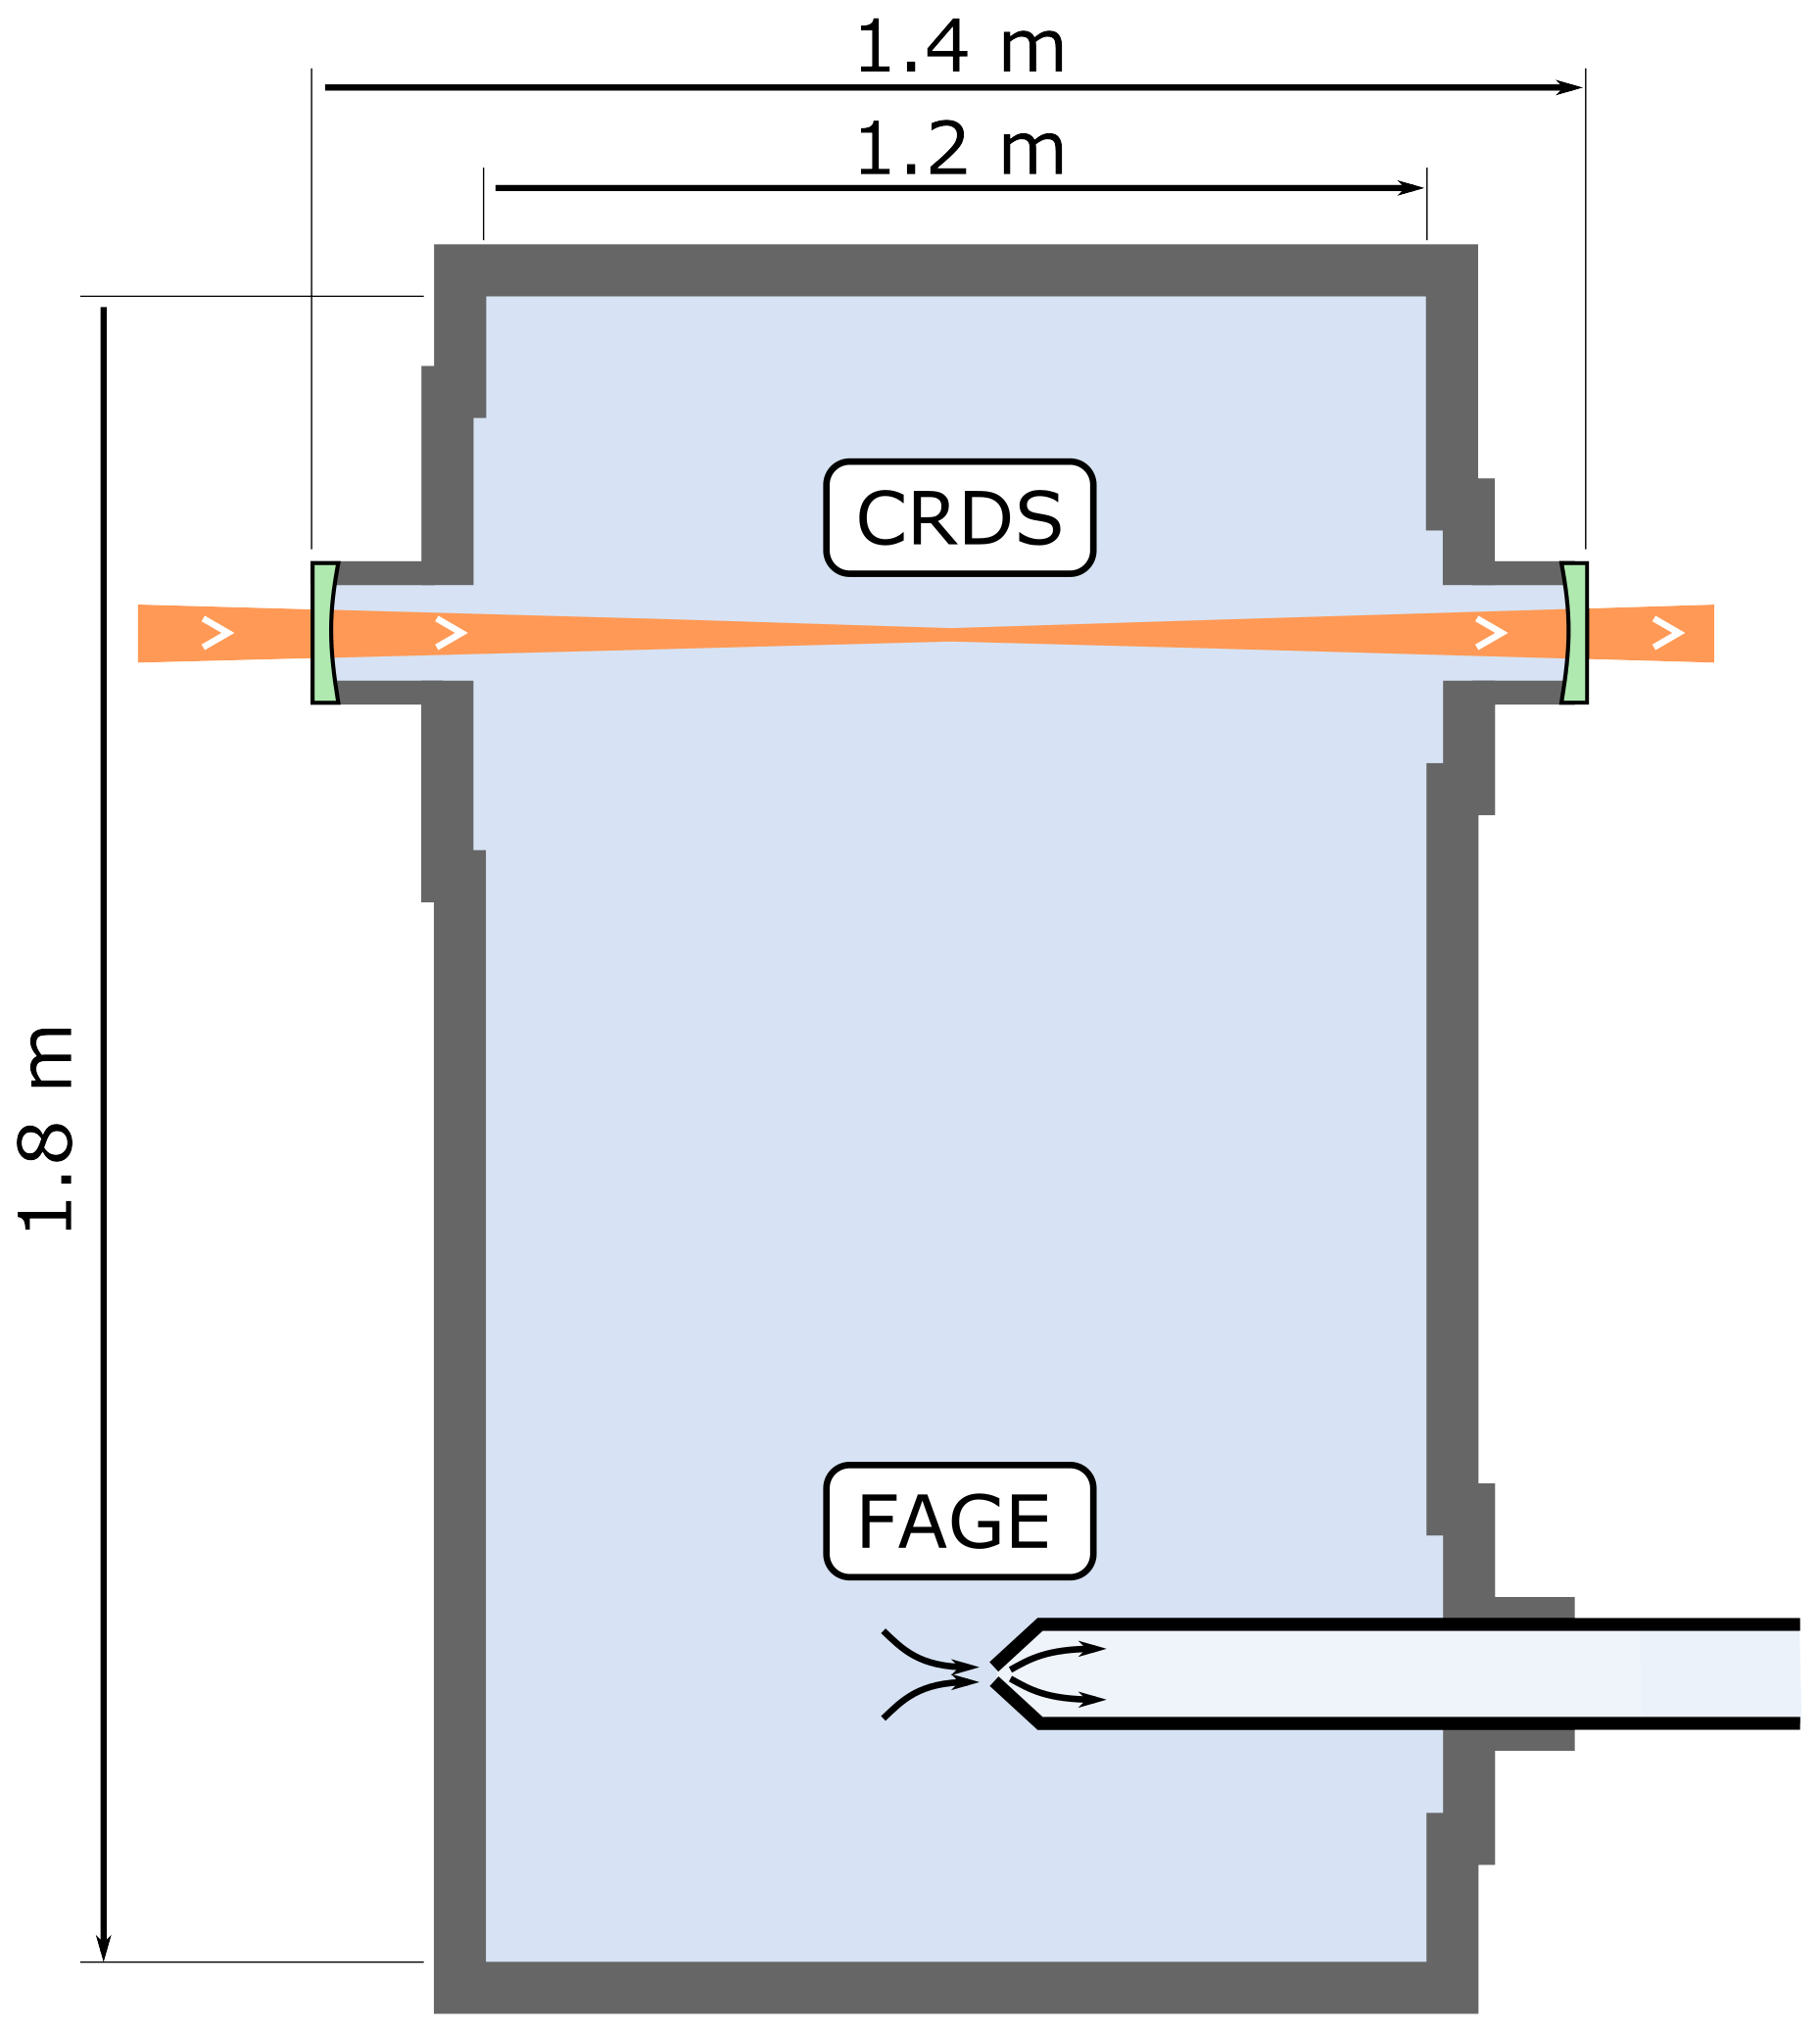
Figure 2Longitudinal (horizontal) section of the HIRAC chamber. The CRDS spectrometer probes the CH3O2 concentration as an average across the chamber's diameter, while the FAGE instrument probes CH3O2 in the chamber at a single point close to the centre.
The cavity is formed by two highly reflective 1 in. diameter mirrors (99.999 %, Layertec, curvature radius = 1 m) housed in custom-built mounts that allow the mirrors to be tilted slightly whilst maintaining a gas-tight seal. The position of the mirror on the laser injection side is modulated along the cavity axis by a few micrometres using a piezoelectric transducer at ∼10 Hz, with the overall distance between the two mirrors being ∼1.4 m. Laser light of ∼1.335 µm is generated by a distributed feedback (DFB) fibre pig-tailed diode laser (NTT Electronics, NLK1B5EAAA) held in a butterfly laser diode mount (Thorlabs LM14S2). The electrical current that drives the laser diode and thermoelectric cooler is generated by a Thorlabs ITC502 driver. The DFB is connected to an in-line optical isolator (Thorlabs IO-H-1335APC), an acousto-optic modulator (AOM, Gooch & Housego Fibre-Q M040-0.5C8H-3-F2S) and a fibre collimator (Thorlabs CFC-8X-C). The laser light is then guided into the cavity by two silver mirrors (Thorlabs PF10-03-P01). On the detection side of the cavity, light leaking out of the mirror is directed onto another silver mirror that guides the light through a f=30 mm focusing lens (Thorlabs LA1805-C) onto an InGaAs photodiode (Thorlabs DET10C/M) that is isolated from ambient light by a 1250 nm long-pass filter (Thorlabs FELH1250). The photodiode signal is amplified (FEMTO DLPCA-200) and sent to a data acquisition unit (DAQ, National Instruments USB-6361) and to a custom-built comparator that acts as a trigger unit. The comparator compares the amplified photodiode signal with a manually adjustable threshold voltage, and upon reaching a preset threshold the AOM is switched off, stopping the injection of light into the cavity within tens of nanoseconds and initiating a ring-down event. The DAQ is simultaneously triggered and acquires the signal by a ring-down method. The system resets after a set time (typically 5 ms) and is ready for the next event. The acquired data are processed using a custom-made LabView program that fits the ring-down events with an exponential function to extract the ring-down time, τ. Filters are applied to process the ring-down events to exclude potential outliers caused by dust particles passing through the beam and false positives (when the acquisition is triggered by a transient noise spike), so that only legitimate ring-down events are taken into account. The ring-down time can then be converted into the absorption coefficient, α:
where τ and τ0 are the ring-down times with and without CH3O2 radicals present, respectively, and c is the speed of light. τ0 would be obtained in a typical experiment by recording ring-down events for ∼1 min before switching on the photolysis lamps in the chamber. As it is not possible to measure τ0 and τ simultaneously, the background was monitored regularly during each experiment by switching off the photolysis lamps and allowing the signal to return to the baseline.
The molecular chlorine delivery did not result in a change in the measured ring-down time. However, delivery of the methane and acetone reagents led to a decrease in the ring-down time indicating that, in the concentrations delivered to the chamber, methane and acetone absorbed in the wavenumber range used in the present work (∼7486–7491 cm−1). An absorption coefficient of cm−1 was measured for [acetone] molecule cm−3 at the typical measurement point of 7487.98 cm−1 (vide infra). An absorption coefficient in the range (0.7–1.4) cm−1 was determined at 7487.98 cm−1 for CH4 in typical concentrations in the FAGE–CRDS intercomparison experiments in the range (1.2–2.5) ×1016 molecule cm−3. The background ring-down time τ0 (Eq. 7) contained the contributions of the reagents, methane or acetone, and was monitored regularly during the experiments by turning off the chamber lamps (vide supra).
The CH3O2 absorption feature used in these measurements is a band associated with the electronic transition centred around 7488 cm−1, and it has been documented in previous work (Faragó et al., 2013; Atkinson and Spillman, 2002; Pushkarsky et al., 2000). There are interfering methane and water vapour lines in this region, and these together with the change in [CH3O2] during longer (10 min) scanning times did not allow us to generate a continuous high-resolution scan across the CH3O2 transition. Instead, as shown in Fig. 3, the absorption spectrum was mapped out as a series of point measurements at fixed wavelengths, normalised by the absorption at the optimum measurement point, 7487.98 cm−1, where the absorption feature is sufficiently strong and furthest in wavelength from interfering methane absorption lines and where the CH3O2 cross section was determined (Sect. 3.2). The absorption coefficient of CH4 was about 7 times lower at 7487.98 cm−1 than at 7489.16 cm−1, i.e. at the peak of the CH3O2 spectral feature where Fittschen (2019) reported . Therefore, 7487.98 cm−1 (rounded to 7488 cm−1 henceforth) was chosen as the measurement point instead of the value of 7489.16 cm−1 used by Fittschen (2019). Each datum point in Fig. 3 was obtained by measuring the absorption coefficient, , and the baseline (lamps on, then off) at 7488 cm−1 followed by measuring and baseline at another wavelength on the absorption feature and then reverting to measuring at 7488 cm−1 again. This pattern was repeated multiple times for different wavelengths to build up an absorption feature, with all data points normalised to and then multiplied by the CH3O2 cross section at 7488 cm−1 (Sect. 3.2) to obtain the absorption spectrum shown in Fig. 3. The method was used to measure the CH3O2 absorption spectrum under each of the three experimental conditions detailed in Sect. 2.1: 80 mbar (He+O2) and 100 and 1000 mbar of synthetic air.
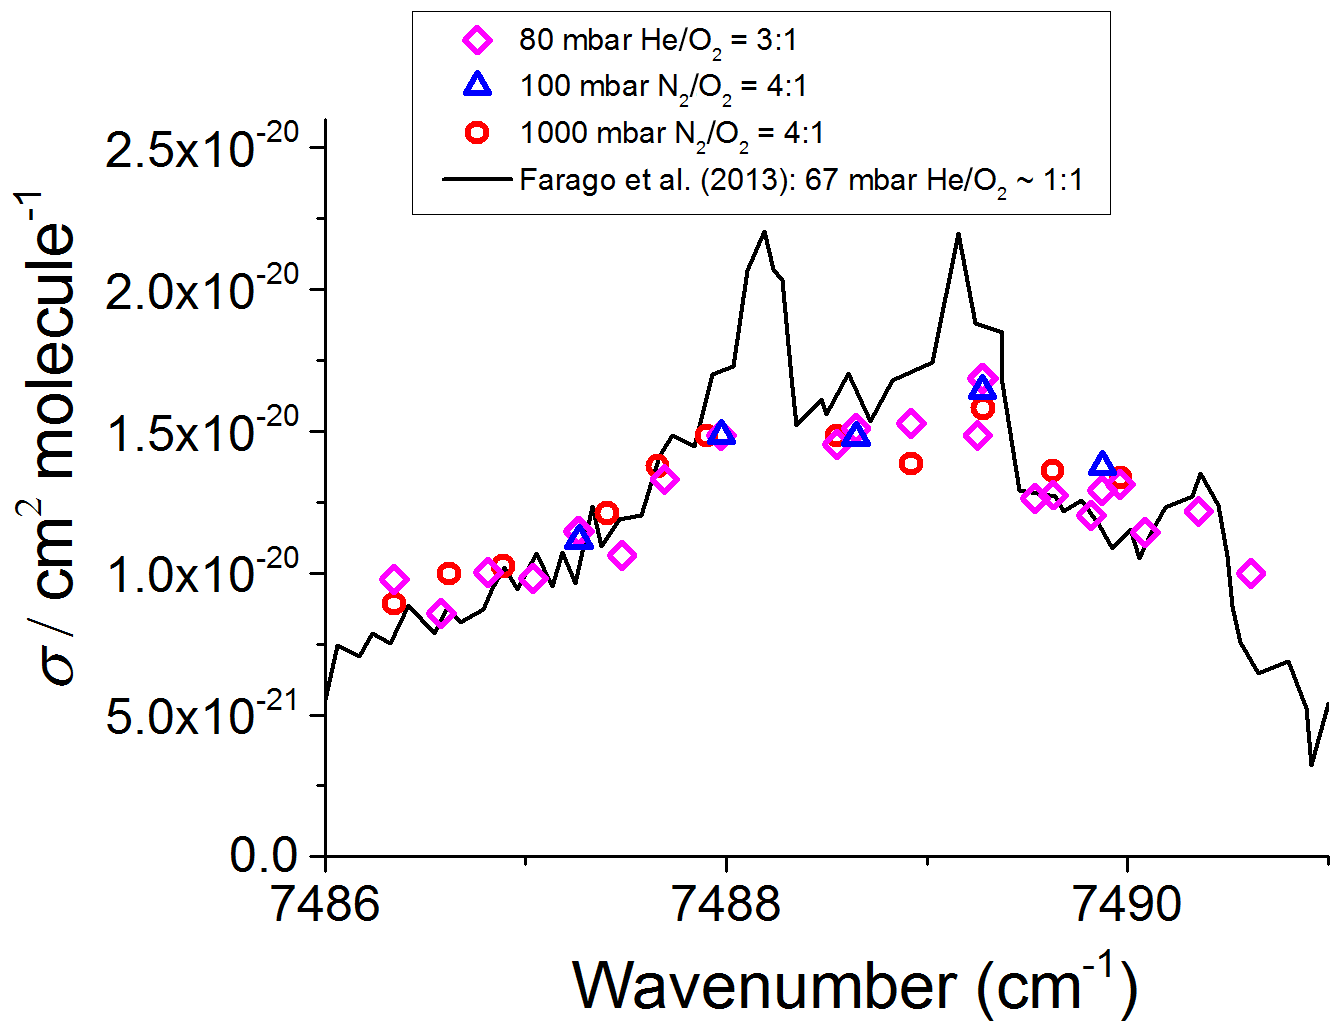
Figure 3CH3O2 absorption spectrum at 295 K. The measured absorption spectrum scaled to the absolute cross section determined at 7488 cm−1 using the kinetics of the CH3O2 decay monitored using CRDS (Sect. 3.2 below). The black line represents the CH3O2 spectrum measured by Faragó et al. (2013) at 67 mbar but with the absolute cross section scaled to reflect the recent update reported by Fittschen (2019) giving cm2 molecule−1.
3.1 CH3O2 absorption spectrum and comparison with the literature
Figure 3 shows that the relatively broad absorption feature obtained in this work in the range from ∼7486 to 7491 cm−1 is almost the same at 80 mbar and at 100 and 1000 mbar of synthetic air. As shown in Fig. 3, the spectrum found in this work agrees well with the general shape of the CH3O2 spectrum measured by Faragó et al. (2013) at 67 mbar He∕O2 but scaled to reflect the very recent update to the absolute absorption cross section reported by Fittschen (2019), which gave cm2 molecule−1. The peaks at the top of the spectral feature reported by Faragó et al. (2013) are not reproduced in this work owing to the method of generating the spectrum (Sect. 2.3). Previously Pushkarsky et al. (2000) measured the CH3O2 absorption spectrum over a larger wavenumber range (7300–7700 cm−1), where the ν12 transition is located at 7488 cm−1 in agreement with this work. In addition, if the CH3O2 spectrum at 27 mbar reported by Atkinson and Spillman (2002) was shifted by ∼2 cm−1 toward higher wavenumbers compared to this work and the study of Faragó et al. (2013), the shape of the ν12 band from Atkinson and Spillman is in agreement with the results shown in Fig. 3.
The similarity of the results at 80 mbar and at 100 and 1000 mbar of air reported in this work and their agreement with the previous measurements performed at relatively low pressures (Fittschen, 2019; Faragó et al., 2013; Atkinson and Spillman, 2002; Pushkarsky et al., 2000) can be explained by an overlap of several individual absorption lines resulting in a spectral structure in the range from ∼7486 to 7491 cm−1 with practically no pressure dependence observed between ∼30–1000 mbar. Therefore, it can be assumed that the absorption cross section at 7488 cm−1, σ (7488 cm−1), is the same under the conditions used in this work, i.e. at 80 mbar of He and O2 and at 100 and 1000 mbar of air.
3.2 Determination of the absorption cross section of CH3O2 at 7488 cm−1
The kinetics of the CH3O2 temporal decay by its self-reaction (Reaction R5) were used to determine the absorption cross section of CH3O2 at 7488 cm−1, i.e. σ (7488 cm−1). Note that the cross section used is not the more standard integrated cross section used by HITRAN and other spectral databases. CH3O2 radicals were generated by using CH4∕Cl2∕synthetic-air mixtures (Sect. 2.1) with the chamber UV lamps switched on to generate Cl atoms (Reaction R6). By extinguishing the UV lamps, CH3O2 radicals were removed by self-reaction and wall loss. Figure 4 shows an example of a kinetic decay obtained at 100 mbar using CRDS. The experimental data were fitted by using two functions described by Eqs. (8) and (9), which are closely related to Eqs. (5) and (6) used in the analysis of the CH3O2 decays measured using FAGE. Equation (8) assumes that the wall loss of CH3O2 is negligible, and hence the removal of CH3O2 can be described by the integrated second-order rate law equation, leading to
where αt is the CH3O2 absorption coefficient at 7488 cm−1 and at time t; α0 is the absorption coefficient at time zero of the reaction when the lamps are switched off, i.e. t0; ; and kobs is the observed rate coefficient of the self-reaction at 298 K, i.e. cm3 molecule−1 s−1 (Atkinson et al., 2006).
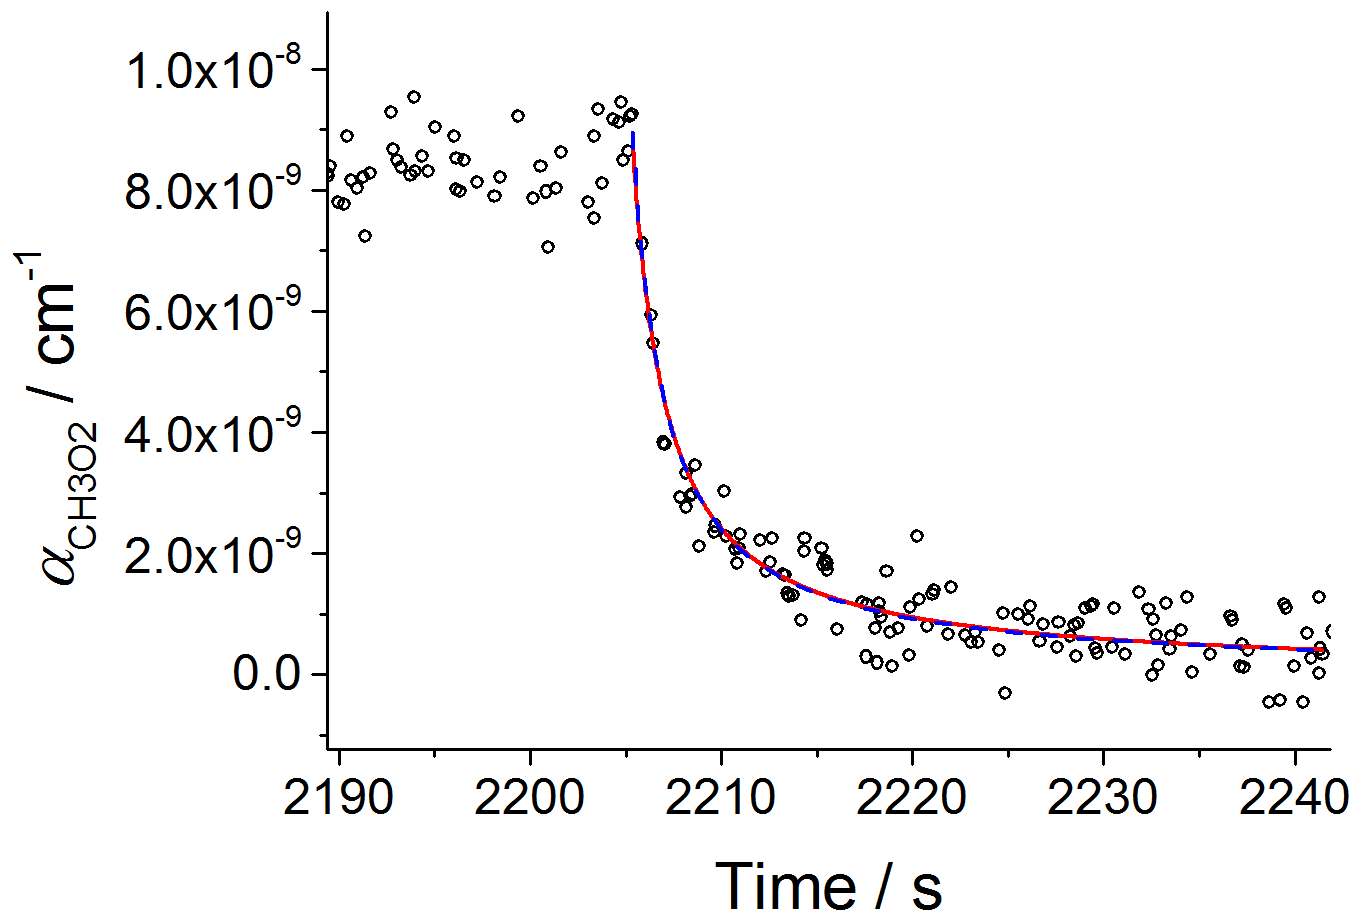
Figure 4Second-order decay of the CH3O2 absorption coefficient at 7488 cm−1 monitored by CRDS. Experiment carried out at 295 K and 100 mbar of synthetic air; [CH4] molecule cm−3 and [Cl2] molecule cm−3. At time 2205 s the photolysis lamps were turned off (time t0). Fitting Eq. (8) to the data (red line) gave σ(7488 cm cm2 molecule−1. A fit including the wall loss rate, kloss (Eq. 9), is shown by the blue dashed line and resulted in cm2 molecule−1. The error limits are statistical errors at the 1σ level.
For completeness, Eq. (9) includes the CH3O2 wall loss as a first-order process, leading to
where kloss is the rate coefficient describing the CH3O2 wall loss (Onel et al., 2017a).
Figure 4 shows that the fits given by Eqs. (8) and (9) to the data overlap over all of the temporal CH3O2 decay and the values of σ (7488 cm−1) extracted by the two fits are in a very good agreement: cm2 molecule−1 (Eq. 8) and cm2 molecule−1 (Eq. 9), where the quoted errors are statistical uncertainties. The values extracted for kloss by fitting Eq. (9) to the CRDS data were small and similar to the values obtained by fitting Eq. (6) to the kinetic decays monitored by FAGE. An upper limit of s−1 was obtained for kloss in both FAGE and CRDS measurements, showing that wall losses are negligible. From fitting Eq. (8) to the temporal decays obtained at 100 mbar of synthetic air, an averaged value of cm2 molecule−1 was obtained, where the error represents 1σ overall uncertainty (13 %). Fitting Eq. (8) to the data at 80 mbar (Fig. S6) gave an average value of σ(7488 cm−1) cm2 molecule−1 (1σ overall uncertainty), in very good agreement with the value at 100 mbar of air. The average of the results at 80 mbar and 100 mbar of air, cm2 molecule−1, is in excellent agreement with the determination of Atkinson and Spillman (2002): cm2 molecule−1 and consistent with the estimation of cm2 molecule−1 for σmax(ν12) obtained using the CH3O2 spectrum reported by Pushkarsky et al. (2000). To enable a comparison at 7487.98 cm−1 with the very recent measurement of Fittschen (2019), who found cm2 molecule−1 at 7489.16 cm−1, σ(7487.98 cm−1) cm2 molecule−1 obtained in this work was multiplied by the σ(7489.16 cm−1) : σ(7487.98 cm−1) ratio obtained by using the high-resolution spectrum reported by Faragó et al. (2013) (Fig. 3). The obtained value, σ(7489.16 cm−1) cm2 molecule−1, is in reasonable agreement with the result of Fittschen (2019), i.e. σ(7489.16 cm−1) cm2 molecule−1.
3.3 Determination of the CRDS limit of detection
The CRDS limit of detection (LOD) has been computed using plots of the square root of the Allan–Werle variance (Werle et al., 1993; Onel et al., 2017a) obtained by continuously recording single ring-down events for 1–2 h after delivering either acetone or methane in typical concentrations to the chamber filled with the bath gas ( at 80 mbar and synthetic air at 100 and 1000 mbar, respectively). The square root of the Allan–Werle variance, here referred to as the Allan–Werle deviation, σA(n), gives an estimate of the error, δα, between successively measured absorption coefficients for a given averaging size n. For a signal-to-noise ratio (S∕N) of 2, the limit of detection for CH3O2 was determined as , where cm2 molecule−1 is the CH3O2 cross section at 7488 cm−1 and is shown in Table 2. The optimum CRDS sensitivity under all conditions is achieved by averaging ∼500 ring-down events, requiring ∼77 s at an acquisition rate of 6.5 Hz on average, with an example shown in Fig. 5.
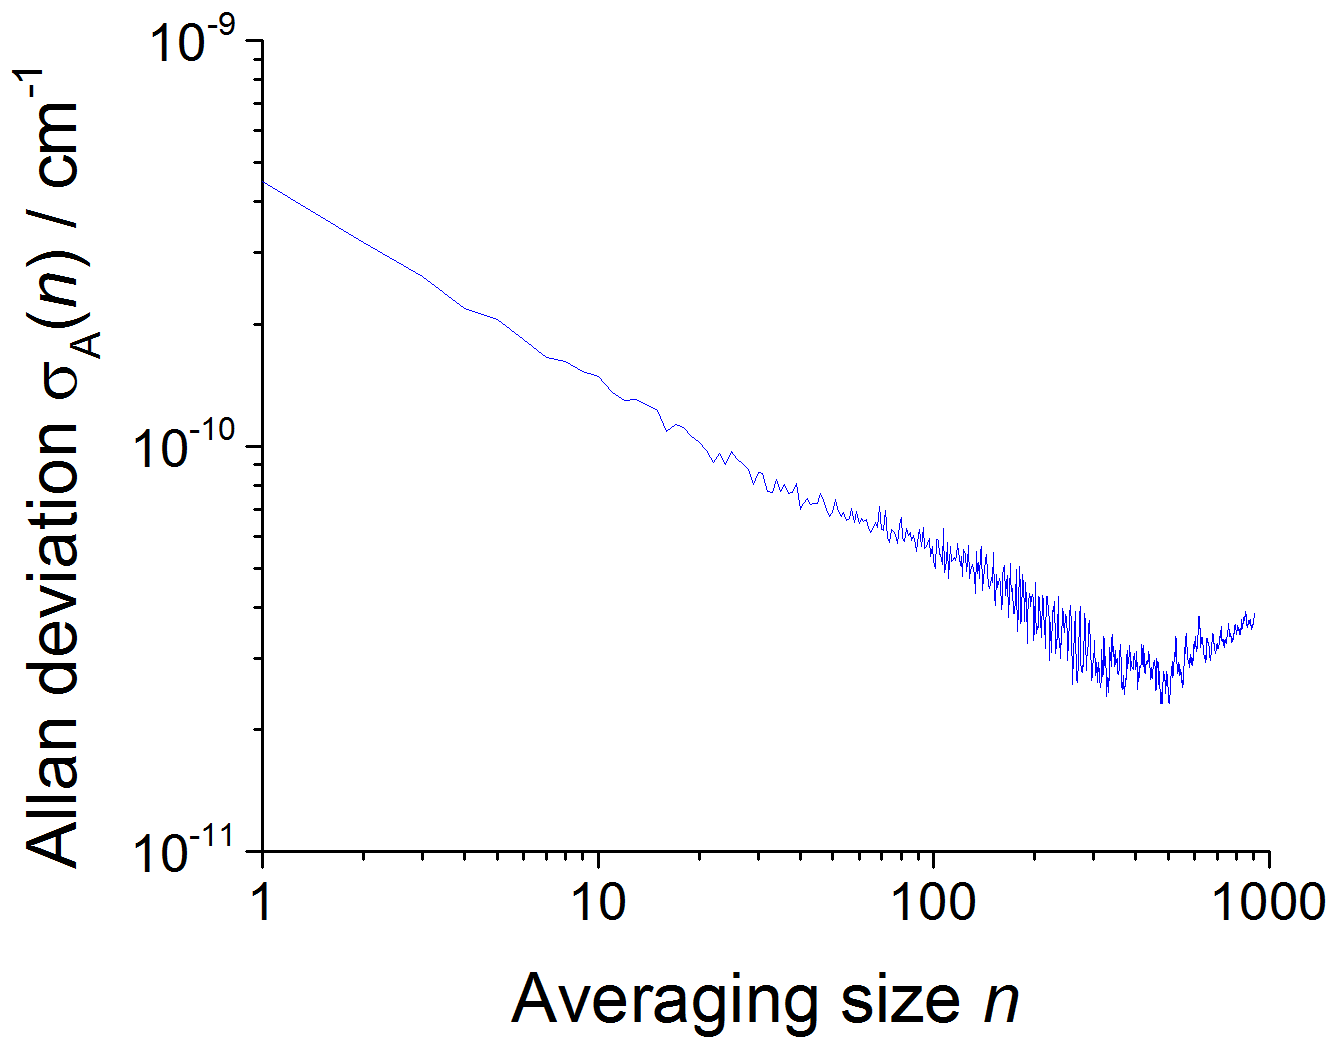
Figure 5An example of the Allan–Werle deviation plot (the plot of the square root of the Allan–Werle variance) of the absorption coefficient at 7488 cm−1 in the absence of CH3O2 and the presence of a typical acetone concentration of 8.8×10¹⁴ molecule cm−3 at 1000 mbar against the number of ring-down events averaged, n. For , the minimum detectable absorption coefficient for a single ring-down measurement is cm−1, which decreases to a minimum of cm−1 after n=500 (requiring 77 s at an acquisition rate of 6.5 Hz).
As the filter (FELH1250 Thorlabs, cut-off wavelength: 1250 nm) used to cut off the laboratory visible light from the background of the CRDS measurements allowed some of the 254 nm light generated by the HIRAC lamps to be transmitted and then detected by the InGaAS photodiode detector, the CRDS sensitivity was worse in the experiments using acetone/O2 and 254 nm lamps as a source of CH3O2 compared to the experiments using Cl2/CH4/O2 and UV black lamps to generate CH3O2. Therefore, separate Allan–Werle deviation plots were constructed using measurements of single ring-down events after filling HIRAC with the bath gas and turning the 254 nm lamps on. Then, the composite error, calculated as the sum in quadrature of δα obtained in the presence of acetone and the 254 nm lamps turned off, and δα, determined in the absence of acetone but keeping the 254 nm lamps turned on, were used to determine the LOD of CRDS in the acetone/O2, and 254 nm light experiments (Table 2). The composite LOD (with acetone/O2 and 254 nm lamps) was on average ∼55 % greater than the LOD determined with the UV lamps off and in the absence of acetone; on average the LOD with Cl2/CH4∕O2 and UV black lamps was ∼40 % higher than LOD with the bath gas.
Table 2CRDS detection limits for CH3O2 calculated at 80 mbar and 100 and 1000 mbar of synthetic air for single ring-down measurements (Δt=0.15 s), the optimum averaging time obtained from Allan–Werle deviation plot (Fig. 5 shows an example), Δtopt. (77 s under all experimental conditions) and Δt=60 s.
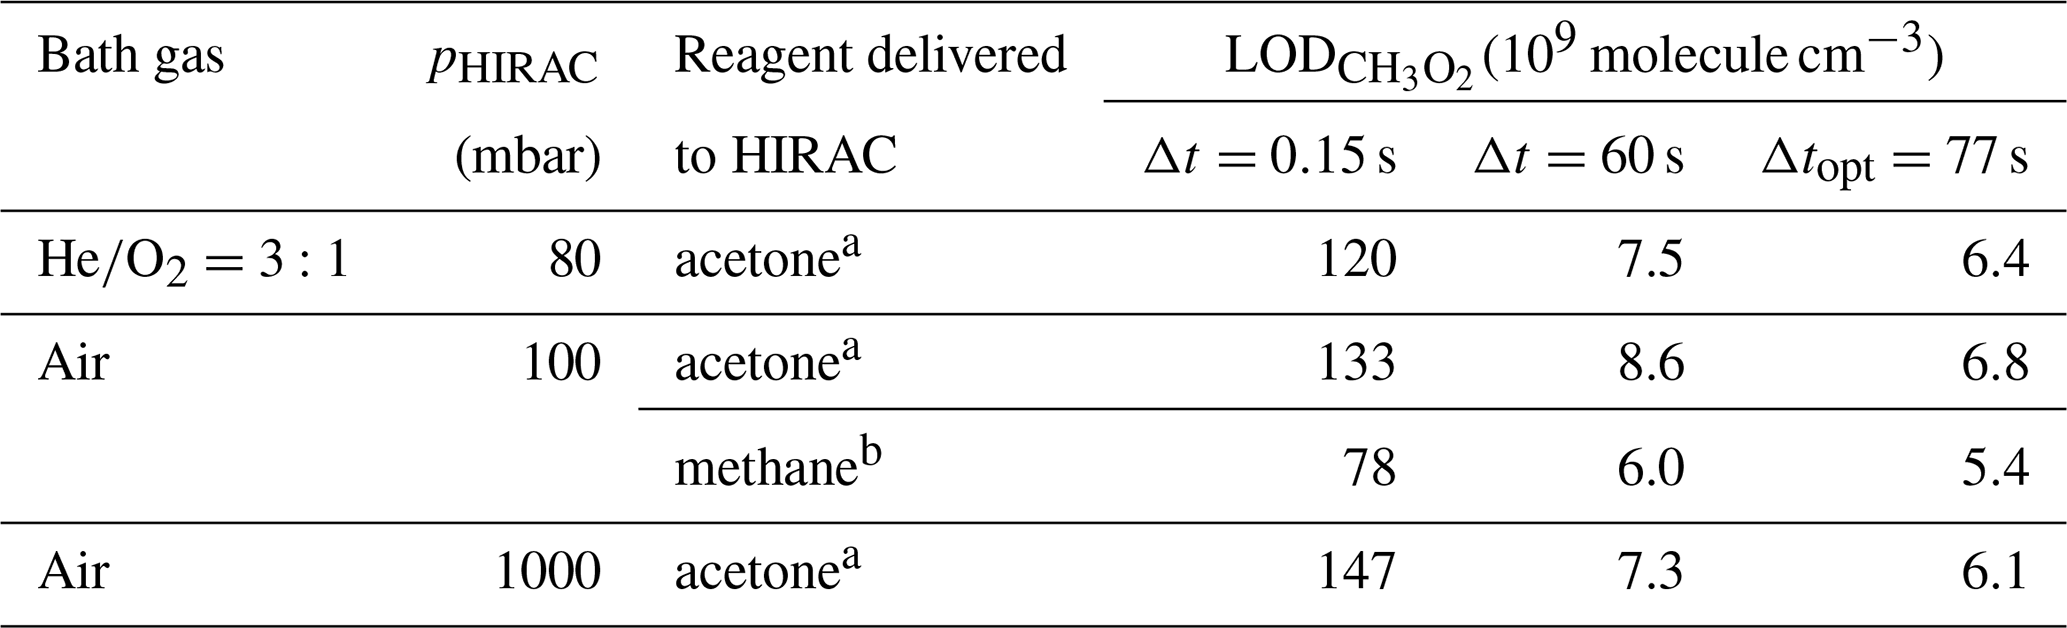
a Using the composite error calculated as the sum in quadrature of δα obtained using a typical concentration of acetone, 8.8×10¹⁴ molecule cm−3, and δα determined in the absence of acetone but keeping the 254 nm lamps turned on during all measurements. b molecule cm−3.
As the daytime concentrations of CH3O2 have been calculated using an atmospheric box model to peak at ∼107–108 molecule cm−3 (Whalley et al., 2010, 2011, 2018), the current CRDS sensitivity is insufficient for the detection of ambient [CH3O2]. The typical concentrations of CH4 and acetone in ambient air are orders of magnitude lower than [CH4] and [(CH3)2CO] used in the HIRAC experiments. However, water vapour, which is present in the atmosphere in much larger concentrations (typically ∼1017 molecule cm−3) than in HIRAC for these experiments (∼1013–1014 molecule cm−3) will significantly absorb in this wavelength region and contribute towards the background of the measurements. The limits of detection shown in Table 2 allow for HIRAC measurements of molecule cm−3 in steady state (where averaging times of ∼60 s can be used) under all conditions used, and kinetic measurements of molecule cm−3 with the present instrument resolution time (0.15 s) at 80 mbar and 100 mbar of air.
The relatively long ring-down times achieved here require the lasers to be blocked for several milliseconds during which the full exponential ring-down time is measured. This imposes an upper limit to the ring-down rate. The achieved rate is significantly smaller (6.5 Hz on average) for the following reasons. The width of the resonances of the optical cavity is of the order of 1 kHz, much narrower than the laser linewidth. This makes the injection of light into the cavity inefficient. Reducing the laser linewidth, e.g. with optical feedback techniques, could significantly increase the injection efficiency and the ring-down rate. Moreover, the resonance frequencies jitter and drift due to the unavoidable vibrations associated with the operation of the HIRAC chamber. The cavity length was actively modulated in order to repeatedly force coincidence of laser and resonance frequency. Due to the poor injection efficiency mentioned above, however, not every coincidence resulted in a ring-down event. Furthermore, a significant fraction of the ring-down events have to be discarded because of the passage of dust particles, moved around by the fans within the chamber, through the cavity axis. The use of an additional optical filter to cut off the 254 nm light from the background of the CRDS measurements is expected to improve the CRDS sensitivity if the 254 nm lamps are used in HIRAC. The CRDS sensitivity could be further improved by mounting the cavity mirrors along the HIRAC length, which would result in a cavity of about 2 m length containing CH3O2 radicals, and hence above the current 1.4 m length. Although the origin band centred at 7388 cm−1 is about 3 times stronger than the methyl torsional band at 7488 cm−1 (Pushkarsky et al., 2000; Chung et al., 2007), the latter was targeted because absorption due to water vapour is between 1 and 3 orders of magnitude weaker there (assuming 1 % v∕v, atmospheric pressure) (Gordon et al., 2017).
3.4 Intercomparison of CRDS and FAGE CH3O2 measurements
All the intercomparison measurements have been performed at 7488 cm−1, where the CH3O2 cross section was determined using CRDS (Sect. 3.2). For the measurements at 80 mbar He∕O2 (3:1) and 100 mbar N2∕O2 (4:1), CH3O2 was generated either from the photolysis of acetone at 254 nm in the presence of O2 or from the photolysis of Cl2 using UV black lamps in the presence of CH4∕O2. At 1000 mbar of synthetic air, the overlap of the methane absorption lines due to the pressure broadening resulted in a significant CH4 absorption over the range from 7486 to 7491 cm−1 in the background of the CH3O2 measurements. Therefore, all the measurements at 1000 mbar have been carried out using the photolysis of acetone∕O2 at 254 nm. The data recorded by CRDS using acetone∕O2 were more scattered than the CRDS data recorded using for the reasons discussed above (see Figs. 6a and 8a in comparison with Fig. 7a) and were the main contributors to the scatter on [CH3O2]CRDS in the correlation plots (Figs. 6b, 7b and 8b below). There was less signal noise present in the FAGE measurements, where the most significant source of noise is the shot noise (Poisson noise), which increases with the number of photons counted by the detector (Figs. 1, S3 and S4) and results in a scatter on the FAGE data growing with [CH3O2] in Figs. 6a, 7a and 8a.
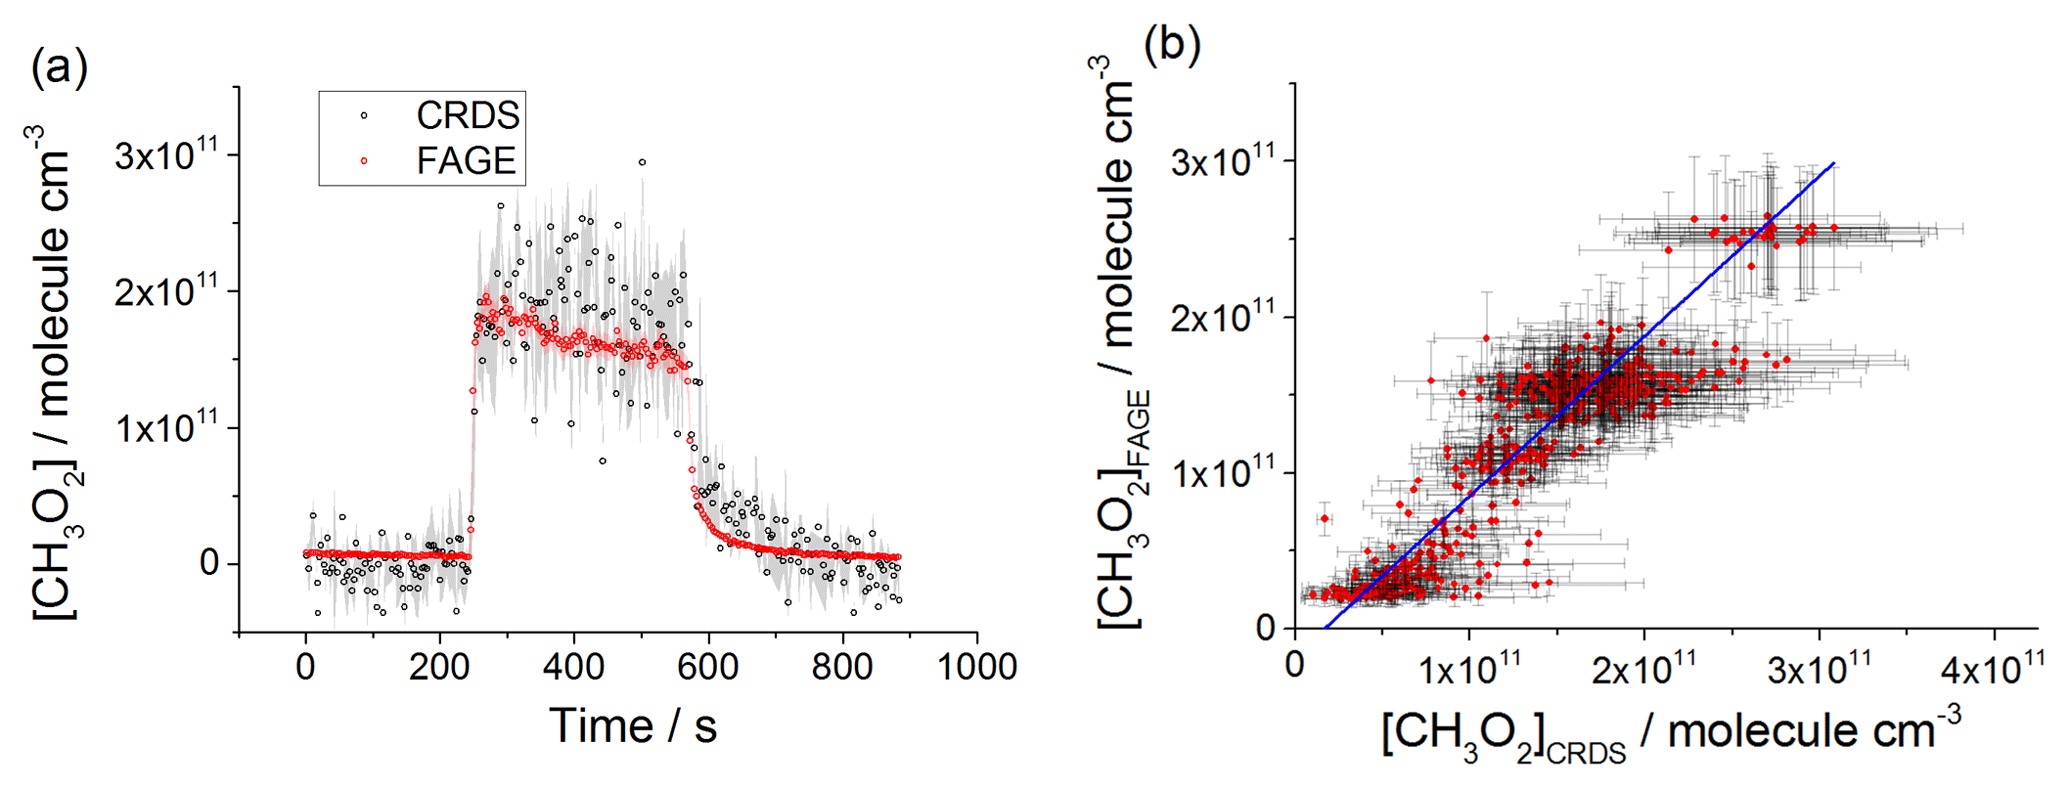
Figure 6(a) Comparison of CH3O2 measurement at 80 mbar He∕O2 (3:1) where the lamps were turned on at t∼250 s for ∼5 min to generate CH3O2 and then turned off again. The measurement by FAGE is shown in red and the measurement by CRDS is plotted in black. CH3O2 radicals were generated using the 254 nm photolysis of (CH3)2CO (8.8×10¹⁴ molecule cm−3). The 1σ statistical errors generated by the data averaging are shown as grey (CRDS) and red (FAGE) shadows. (b) Correlation plot at 80 mbar He∕O2 (3:1) combining the data obtained using acetone/O2 and 254 nm lamps with the data generated using Cl2/CH4∕O2 and UV black lamps. [CH3O2] measured by FAGE is plotted against [CH3O2] measured by CRDS. The linear fit to the data generates a gradient of 1.03±0.05 and an intercept of ( molecule cm−3. The linear fits were generated using the orthogonal distance regression algorithm; fit errors at the 2σ level. In both panels [CH3O2]FAGE was determined using a calibration factor of counts cm3 molecule−1 s−1 mW−1, and [CH3O2]CRDS was calculated using a cross section of cm2 molecule−1. Each point is a value averaged over 3 s.
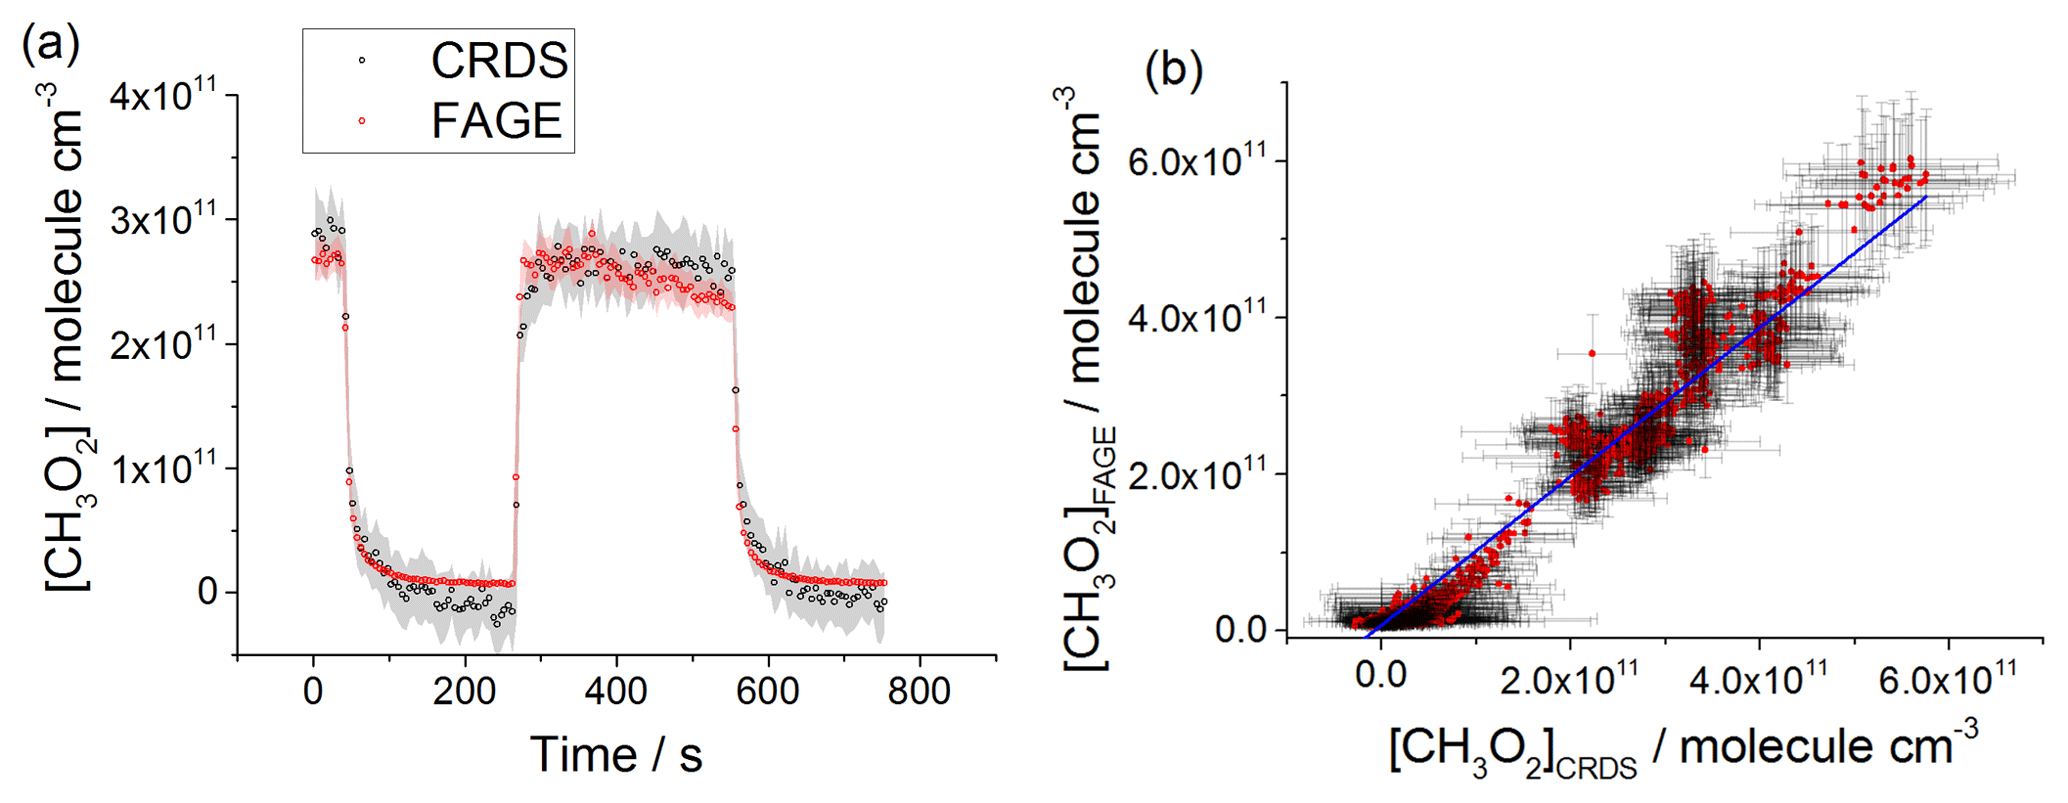
Figure 7Comparison of CH3O2 measurement (a) and the correlation plot at 100 mbar of N2∕O2 (4:1) (b). In both figures [CH3O2]FAGE was computed using a calibration factor of counts cm3 molecule−1 s−1 mW−1 and [CH3O2]CRDS was determined using a cross section of cm2 molecule−1. Each point is a value averaged over 5 s. Panel (a) shows the measurement by FAGE (red) and the measurement by CRDS (black) where the CH3O2 radicals were generated by the photolysis of Cl2 (2.5×10¹⁵ molecule cm−3) in the presence of CH4 (2.4×10¹⁶ molecule cm−3) and O2. The UV black lamps were alternately switched on and off: the lamps were turned off at t∼40 s and then turned on at t∼250 s for ∼5 min before being switched off again. The 1σ statistical errors generated by the data averaging are shown as grey (CRDS) and red (FAGE) shadows. Panel (b) combines the data obtained using acetone/O2 and 254 nm lamps with the data generated using Cl2/CH4∕O2 and UV black lamps. [CH3O2] measured by FAGE is plotted versus [CH3O2] measured by CRDS. The linear fit to the data is obtained using the orthogonal distance regression algorithm and results in a gradient of 0.95±0.02 and an intercept of molecule cm−3; fit errors given at the 2σ level.
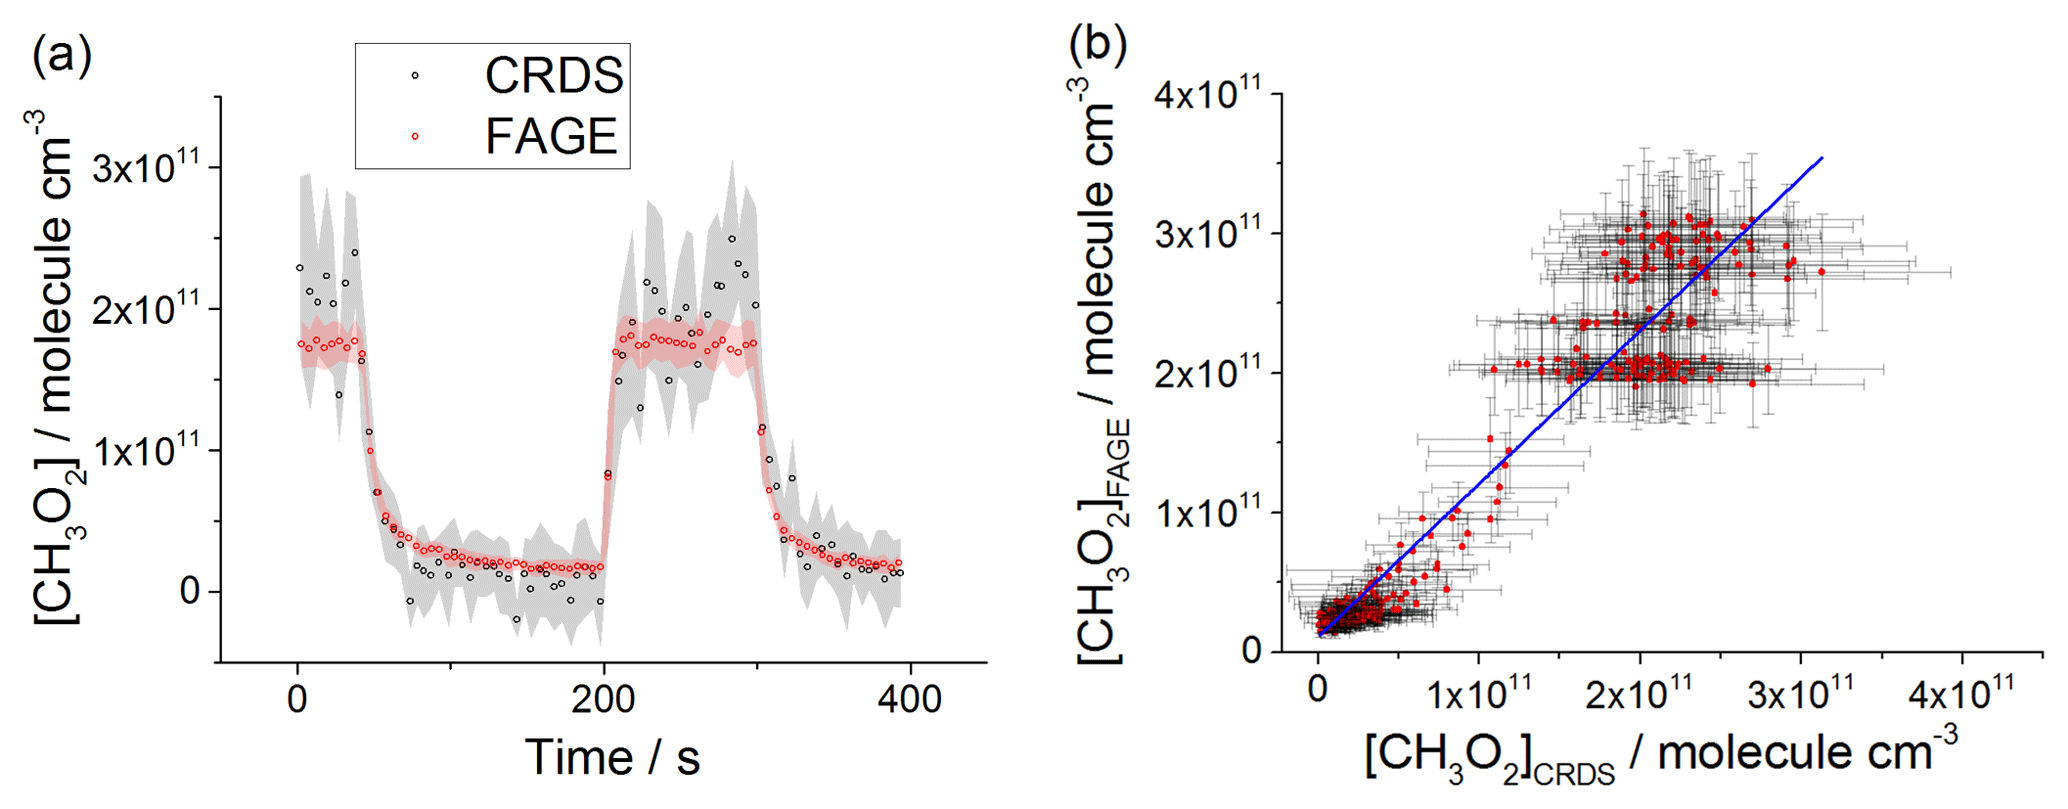
Figure 8(a) Comparison of CH3O2 measurements at 1000 mbar of synthetic air where the lamps were turned off at t∼40 s and then on at t∼200 s for ∼2 min before being switched off again. The measurement by FAGE is shown in red and the measurement by CRDS is plotted in black. CH3O2 radicals were generated using the 254 nm photolysis of (CH3)2CO (8.8×10¹⁴ molecule cm−3). The 1σ statistical errors generated by the data averaging are shown as grey (CRDS) and red (FAGE) shadows. (b) Correlation plot of all the data generated at 1000 mbar of air. [CH3O2] measured by FAGE is plotted against [CH3O2] measured by CRDS. The linear fit to the data is generated using the orthogonal distance regression algorithm and results in a gradient of 1.09±0.06 and an intercept of ( molecule cm−3; fit errors given at the 2σ level. In both panels [CH3O2]FAGE was determined using a calibration factor of counts cm3 molecule−1 s−1 mW−1 and [CH3O2]CRDS was calculated using a cross section of cm2 molecule−1. Each point is a value averaged over 5 s.
As the acquisition rate of CRDS (6.5 Hz in average) differed compared to the FAGE acquisition rate (in the range 1–10 Hz) the comparison data were averaged to enable comparison of [CH3O2] by the two instruments at the same moments of time. The averaging interval of time was chosen in the range 3–5 s, depending on the comparison measurement, to average at least 10 ring-down events over each time interval. This was done because the CRDS data were filtered to exclude outliers caused by dust particles passing through the light beam trapped in the optical cavity and the number of encountered “dust events” varied from one experiment to another.
CH3O2 was generated over a range of concentrations: 2–26×1010 molecule cm−3 at 80 mbar of He+O2 mixture, 2–60×1010 molecule cm−3 at 100 mbar of synthetic air and 2–30×1010 molecule cm−3 at 1000 mbar of synthetic air. The comparison involved both periods with lamps on, where the concentration of CH3O2 was changing slowly, and where the lamps were turned off and the rapid decay of CH3O2 was observed. Figures 6a, 7a and 8a show examples of time-resolved CH3O2 concentrations where the lamps were turned on and off. CRDS absorption coefficients were converted into concentrations using the absorption cross section determined by studying the second-order recombination kinetics, σ(7488 cm−1) cm2 molecule−1 (Sect. 3.2). The FAGE signals were converted into [CH3O2] using the sensitivity factor derived from the analysis of the temporal decays of CH3O2 at 80 mbar of He+O2 mixture and 100 mbar of air, ( and ( counts cm3 molecule−1 s−1 mW−1, respectively. The data in the correlation plots of the CH3O2 concentrations determined by FAGE (y axis) and CRDS (x axis) (Figs. 6b, 7b and 8b) were fitted using an orthogonal distance linear regression fit (Boggs et al., 1987), which accounts for errors in both the y and x directions. The gradient of the correlation plot of the CH3O2 concentrations determined by FAGE (y axis) and CRDS (x axis) at 80 mbar of He+O2 (Fig. 6b) is 1.03±0.05, showing an overall level of agreement within 3 %. The gradient of the correlation plot of the CH3O2 concentrations determined by FAGE (y axis) and CRDS (x axis) at 100 mbar of air (Fig. 7b) is 0.95±0.02, showing an overall level of agreement within 5 %.
At 1000 mbar of air, the FAGE signal observed in HIRAC could be calibrated in one of two ways: either via the photolysis of water vapour to generate OH followed by reaction with CH4 to form CH3O2, or via the kinetic analysis of second-order temporal decays of CH3O2. The conversion of the FAGE signals into [CH3O2] at 1000 mbar air for the intercomparison with CRDS shown in Fig. 8a and b was based on the average of the results of the water vapour calibration method and the kinetic decay calibration method, which gives counts cm3 molecule−1 s−1 mW−1, Sect. 2.2.2). The gradient of the overall correlation plot (Fig. 8b) using is 1.09±0.06, showing agreement to within 9 %. Figure S7 shows separately the two correlation plots obtained using the sensitivities from the two methods of calibration for FAGE: counts cm3 molecule−1 s−1 mW−1 (water vapour calibration method) and counts cm3 molecule−1 s−1 mW−1 (second-order kinetic decay method). The gradients of the two linear fits are 1.35±0.07 (water vapour calibration) and 0.92±0.05 (kinetic method of calibration). Therefore, a significantly better agreement (within 8 %) was obtained by using the kinetic method for the calibration of FAGE compared with using the water vapour method for calibration of FAGE (35 % agreement). Better agreement is expected when using the kinetic method to calibrate FAGE, as this is the same method used to determine the absorption cross section and hence calibrate the CRDS method, and the intercomparison is not affected by any error in the rate coefficient, kobs, for the CH3O2 self-reaction. We consider that the main contribution to the discrepancy in values obtained by the two methods of calibration derives from an overestimation of the reported value of the observed rate coefficient for the CH3O2 self-reaction, molecule−1 cm3 s−1 (1σ error) at 298 K (Atkinson et al., 2006). In a subsequent paper we will report a revised kobs, which will bring the two methods of calibration into agreement.
An intercomparison between the recently developed indirect method for the measurement of the CH3O2 radicals using fluorescence assay by gas expansion (FAGE) (Onel et al., 2017b) and the direct cavity ring-down spectroscopy (CRDS) method has been performed within the Leeds Highly Instrumented Reactor for Atmospheric Chemistry (HIRAC). CRDS detected CH3O2 by using the A←X (ν12) electronic transition at 7488 cm−1. The CH3O2 radical was generated from the photolysis of mixtures of either or acetone∕O2 at room temperature and three total pressures, 80 mbar of and 100 and 1000 mbar of , and CH3O2 was measured simultaneously using the two methods.
At all pressures FAGE was calibrated using the kinetics of the CH3O2 second-order decay by self-reaction. At 1000 mbar the conventional 185 nm photolysis of water vapour in the presence of excess CH4 and O2 was used to calibrate FAGE in addition to the kinetic method. The two calibration methods have overlapping error limits at the 2σ level (34 % for the water vapour photolysis method and 26 % for the kinetic method) as it has been found previously (Onel et al., 2017b). The difference between (water vapour method) and (kinetic method) has been discussed in detail previously (Onel et al., 2017b). In the case of HO2, a very good agreement (difference within 8 %) between (water vapour method) and (kinetic method) was obtained previously (Onel et al., 2017a; Winiberg et al., 2015), which suggests that the production of OH and HO2 from the photolysis of water vapour in air can be quantified robustly. We consider it unlikely that there is a significant error in the fraction of OH which is converted to CH3O2 upon the addition of methane. We consider instead that the discrepancy between the two calibration methods is due to an overestimation of the reported value of kobs for the CH3O2 self-reaction (Atkinson et al., 2006); the two methods of calibrations agree if kobs is reduced by 25 %–30 %, which is close to the reported 2σ uncertainty in the rate coefficient (Atkinson et al., 2006). The average value of the sensitivity factor obtained from the two calibration methods, counts cm3 molecule−1 s−1 mW−1, corresponds to a limit of detection (LOD) for CH3O2 of 1.18×10⁸ molecule cm−3 for a S∕N of 2 and 60 s averaging period. The FAGE sensitivity factor increased by ∼3 times by decreasing the pressure in the FAGE detection cell (from 3.3 mbar, corresponding to a total HIRAC pressure of 1000, to 0.9 mbar, corresponding to a total chamber pressure of 100 or 80 mbar).
The CH3O2 absorption cross section at 7488 cm−1 at 100 mbar of air and 80 mbar of was determined using the kinetics of the CH3O2 second-order decays: cm2 molecule−1. No change in the shape of the CH3O2 spectrum with pressure was found from the reduced pressures (100 mbar of air and 80 mbar of ) to 1000 mbar of air, showing that is almost independent of pressure. For a time averaging of 60 s, the calculated CRDS LOD using the Allan–Werle deviation plots and is around 8×10⁹ molecule cm−3 using acetone/O2 and 254 nm light at all operating pressures and 6×10⁹ molecule cm−3 using CH4/Cl2 and black lamps at the reduced pressures.
The FAGE–CRDS intercomparison used measurements of CH3O2 under steady-state conditions (photolysis lamps on) as well as rapid decays in [CH3O2] (lamps switched off) to cover large concentration ranges: 2–26×1010 molecule cm−3 at 80 mbar of He+O2 mixture, 2–60×1010 molecule cm−3 at 100 mbar of air and 2–30×1010 molecule cm−3 at 1000 mbar of air. A good agreement between [CH3O2]FAGE and [CH3O2]CRDS was obtained under all conditions as shown by the gradient of the correlation plots: 1.03±0.05 at 80 mbar He∕O2, 0.95±0.02 at 100 mbar air and 1.09±0.06 at 1000 mbar air (using an average of the sensitivity factors for the two FAGE calibration methods). The study provides a validation for the indirect FAGE method for CH3O2 measurements, in agreement with the previous FAGE validation for HO2 measurements (Onel et al., 2017a).
Data presented in this study are available from the authors upon request (chmlo@leeds.ac.uk and d.e.heard@leeds.ac.uk).
The supplement related to this article is available online at: https://doi.org/10.5194/amt-13-2441-2020-supplement.
LO and AB setup the CRDS spectrometer and performed experiments and data analysis, together with assistance from JH; MG and NN built the CRDS spectrometer; LO prepared the article, with assistance from AB and with contributions from GH, LW, PWS, GADR and DEH, who also commented on all results.
The authors declare that they have no conflict of interest.
This work has received funding from the Natural Environment Research Council (NERC grant no. NE/M011208/1), the National Centre for Atmospheric Science and the European Union's Horizon 2020 research and innovation programme through the EUROCHAMP-2020 Infrastructure Activity under grant agreement no. 730997. Alexander Brennan thanks NERC for a studentship awarded in the framework of the SPHERES doctoral training programme (NE/L002574/1). The authors thank Christa Fittschen for helpful discussions on the absorption cross section of CH3O2.
This research has been supported by the Natural Environment Research Council (grant no. NE/M011208/1), the European Union's Horizon 2020 through the EUROCHAMP-2020 Infrastructure Activity (grant no. 730997) and the SPHERES doctoral training programme (NE/L002574/1).
This paper was edited by Jean-Francois Doussin and reviewed by three anonymous referees.
Assaf, E., Sheps, L., Whalley, L., Heard, D., Tomas, A., Schoemaecker, C., and Fittschen, C.: The reaction between CH3O2 and OH radicals: product yields and atmospheric implications, Environ. Sci. Technol., 51, 2170–2177, https://doi.org/10.1021/acs.est.6b06265, 2017.
Atkinson, D. B. and Spillman, J. L.: Alkyl peroxy radical kinetics measured using near infrared CW-cavity ring-down spectroscopy, J. Phys. Chem. A, 106, 8891–8902, https://doi.org/10.1021/jp0257597, 2002.
Atkinson, R., Baulch, D. L., Cox, R. A., Crowley, J. N., Hampson, R. F., Hynes, R. G., Jenkin, M. E., Rossi, M. J., Troe, J., and IUPAC Subcommittee: Evaluated kinetic and photochemical data for atmospheric chemistry: Volume II – gas phase reactions of organic species, Atmos. Chem. Phys., 6, 3625–4055, https://doi.org/10.5194/acp-6-3625-2006, 2006.
Boggs, P. T., Byrd, R. H., and Schnabel, R. B.: A stable and efficient algorithm for nonlinear orthogonal distance regression, Siam. J. Sci. Stat. Comp., 8, 1052–1078, https://doi.org/10.1137/0908085, 1987.
Cantrell, C. A., Stedman, D. H., and Wendel, G. J.: Measurement of atmospheric peroxy-radicals by chemical amplification, Anal. Chem., 56, 1496–1502, https://doi.org/10.1021/ac00272a065, 1984.
Cantrell, C. A., Zimmer, A., and Tyndall, G. S.: Absorption cross sections for water vapor from 183 to 193 nm, Geophys. Res. Lett., 24, 2687–2687, https://doi.org/10.1029/97gl02803, 1997.
Chung, C. Y., Cheng, C. W., Lee, Y. P., Liao, H. Y., Sharp, E. N., Rupper, P., and Miller, T. A.: Rovibronic bands of the A<−X transition of CH3OO and CD3OO detected with cavity ringdown absorption near 1.2–1.4 µm, J. Chem. Phys., 127, 044311-1–044311-14, https://doi.org/10.1063/1.2747616, 2007.
Creasey, D. J., Heard, D. E., and Lee, J. D.: Absorption cross-section measurements of water vapour and oxygen at 185 nm. Implications for the calibration of field instruments to measure OH, HO2 and RO2 radicals, Geophys. Res. Lett., 27, 1651–1654, https://doi.org/10.1029/1999gl011014, 2000.
Farago, E. P., Viskolcz, B., Schoemaecker, C., and Fittschen, C.: Absorption Spectrum and Absolute Absorption Cross Sections of CH3O2 Radicals and CH3I Molecules in the Wavelength Range 7473–7497 cm−1, J. Phys. Chem. A, 117, 12802–12811, https://doi.org/10.1021/jp408686s, 2013.
Fittschen, C.: The reaction of peroxy radicals with OH radicals, Chem. Phys. Lett., 725, 102–108, 2019.
Fittschen, C., Whalley, L. K., and Heard, D. E.: The Reaction of CH3O2 Radicals with OH Radicals: A Neglected Sink for CH3O2 in the Remote Atmosphere, Environ. Sci. Technol., 48, 7700–7701, https://doi.org/10.1021/es502481q, 2014.
Fuchs, H., Holland, F., and Hofzumahaus, A.: Measurement of tropospheric RO2 and HO2 radicals by a laser-induced fluorescence instrument, Rev. Sci. Instrum., 79, 084104, https://doi.org/10.1063/1.2968712, 2008.
Glowacki, D. R., Goddard, A., Hemavibool, K., Malkin, T. L., Commane, R., Anderson, F., Bloss, W. J., Heard, D. E., Ingham, T., Pilling, M. J., and Seakins, P. W.: Design of and initial results from a Highly Instrumented Reactor for Atmospheric Chemistry (HIRAC), Atmos. Chem. Phys., 7, 5371–5390, https://doi.org/10.5194/acp-7-5371-2007, 2007.
Gordon, I. E., Rothman, L. S., Hill, C., Kochanov, R. V., Tan, Y., Bernath, P. F., Birk, M., Boudon, V., Campargue, A., Chance, K. V., Drouin, B. J., Flaud, J. M., Gamache, R. R., Hodges, J. T., Jacquemart, D., Perevalov, V. I., Perrin, A., Shine, K. P., Smith, M. A. H., Tennyson, J., Toon, G. C., Tran, H., Tyuterev, V. G., Barbe, A., Csaszar, A. G., Devi, V. M., Furtenbacher, T., Harrison, J. J., Hartmann, J. M., Jolly, A., Johnson, T. J., Karman, T., Kleiner, I., Kyuberis, A. A., Loos, J., Lyulin, O. M., Massie, S. T., Mikhailenko, S. N., Moazzen-Ahmadi, N., Muller, H. S. P., Naumenko, O. V., Nikitin, A. V., Polyansky, O. L., Rey, M., Rotger, M., Sharpe, S. W., Sung, K., Starikova, E., Tashkun, S. A., Vander Auwera, J., Wagner, G., Wilzewski, J., Wcislo, P., Yu, S., and Zak, E. J.: The HITRAN2016 molecular spectroscopic database, J. Quant. Spectrosc. Ra., 203, 3–69, https://doi.org/10.1016/j.jqsrt.2017.06.038, 2017.
Green, T. J., Reeves, C. E., Fleming, Z. L., Brough, N., Rickard, A. R., Bandy, B. J., Monks, P. S., and Penkett, S. A.: An improved dual channel PERCA instrument for atmospheric measurements of peroxy radicals, J. Environ. Monitor., 8, 530–536, https://doi.org/10.1039/b514630e, 2006.
Hanke, M., Uecker, J., Reiner, T., and Arnold, F.: Atmospheric peroxy radicals: ROXMAS, a new mass-spectrometric methodology for speciated measurements of HO2 and ΣRO2 and first results, Int. J. Mass Spectrom., 213, 91–99, https://doi.org/10.1016/s1387-3806(01)00548-6, 2002.
Hansel, A., Scholz, W., Mentler, B., Fischer, L., and Bernd, T.: Detection of RO2 radicals and other products from cyclohexene ozonolysis with NH4+ and acetate chemical ionization mass spectrometry, Atmos. Environ., 186, 248–255, https://doi.org/10.1016/j.atmosenv.2018.04.023, 2018.
Hernandez, M. D. A., Burkert, J., Reichert, L., Stobener, D., Meyer-Arnek, J., Burrows, J. P., Dickerson, R. R., and Doddridge, B. G.: Marine boundary layer peroxy radical chemistry during the AEROSOLS99 campaign: Measurements and analysis, J. Geophys. Res.-Atmos., 106, 20833–20846, https://doi.org/10.1029/2001jd900113, 2001.
Huang, D. R., Chu, L. K., and Lee, Y. P.: Infrared absorption of gaseous CH3OO detected with a step-scan Fourier-transform spectrometer, J. Chem. Phys., 127, 234318-1–234318-7, https://doi.org/10.1063/1.2807241, 2007.
Jenkin, M. E., Cox, R. A., Hayman, G. D., and Whyte, L. J.: Kinetic study of the reactions CH3O2+CH3O2 and CH3O2+HO2 using molecular modulation spectroscopy, J. Chem. Soc. Faraday Trans. II, 84, 913–930, https://doi.org/10.1039/f29888400913, 1988.
Jokinen, T., Sipila, M., Richters, S., Kerminen, V. M., Paasonen, P., Stratmann, F., Worsnop, D., Kulmala, M., Ehn, M., Herrmann, H., and Berndt, T.: Rapid Autoxidation Forms Highly Oxidized RO2 Radicals in the Atmosphere, Angew. Chem. Int. Ed., 53, 14596–14600, https://doi.org/10.1002/anie.201408566, 2014.
Kline, N. D. and Miller, T. A.: Observation of the A−X electronic transition of C6−C10 peroxy radicals, Chem. Phys. Lett., 601, 149–154, https://doi.org/10.1016/j.cplett.2014.03.087, 2014.
Kurylo, M. J. and Wallington, T. J.: The temperature dependence of the rate constant for the gas phase disproportionation reaction of CH3O2 radicals, Chem. Phys. Lett., 138, 543–547, https://doi.org/10.1016/0009-2614(87)80121-5, 1987.
McAdam, K., Veyret, B., and Lesclaux, R.: UV absorption spectra of HO2 and CH3O2 radicals and the kinetics of their mutual reactions ant 298 K, Chem. Phys. Lett., 133, 39–44, https://doi.org/10.1016/0009-2614(87)80049-0, 1987.
Miyazaki, K., Parker, A. E., Fittschen, C., Monks, P. S., and Kajii, Y.: A new technique for the selective measurement of atmospheric peroxy radical concentrations of HO2 and RO2 using a denuding method, Atmos. Meas. Tech., 3, 1547–1554, https://doi.org/10.5194/amt-3-1547-2010, 2010.
Noziere, B. and Hanson, D. R.: Speciated Monitoring of Gas-Phase Organic Peroxy Radicals by Chemical Ionization Mass Spectrometry: Cross-Reactions between CH3O2, CH3(CO)O2, (CH3)3CO2, and c-C6H11O, J. Phys. Chem. A, 121, 8453–8464, https://doi.org/10.1021/acs.jpca.7b06456, 2017.
Noziere, B. and Vereecken, L.: Direct Observation of Aliphatic Peroxy Radical Autoxidation and Water Effects: An Experimental and Theoretical Study, Angew. Chem. Int. Ed., 58, 13976–13982, https://doi.org/10.1002/anie.201907981, 2019.
Onel, L., Brennan, A., Gianella, M., Ronnie, G., Lawry Aguila, A., Hancock, G., Whalley, L., Seakins, P. W., Ritchie, G. A. D., and Heard, D. E.: An intercomparison of HO2 measurements by fluorescence assay by gas expansion and cavity ring-down spectroscopy within HIRAC (Highly Instrumented Reactor for Atmospheric Chemistry), Atmos. Meas. Tech., 10, 4877–4894, https://doi.org/10.5194/amt-10-4877-2017, 2017a.
Onel, L., Brennan, A., Seakins, P. W., Whalley, L., and Heard, D. E.: A new method for atmospheric detection of the CH3O2 radical, Atmos. Meas. Tech., 10, 3985–4000, https://doi.org/10.5194/amt-10-3985-2017, 2017b.
Orlando, J. J. and Tyndall, G. S.: Laboratory studies of organic peroxy radical chemistry: an overview with emphasis on recent issues of atmospheric significance, Chem. Soc. Rev., 41, 8213–8213, 2012.
Pushkarsky, M. B., Zalyubovsky, S. J., and Miller, T. A.: Detection and characterization of alkyl peroxy radicals using cavity ringdown spectroscopy, J. Chem. Phys., 112, 10695–10698, https://doi.org/10.1063/1.481705, 2000.
Sander, S. P. and Watson, R. T.: Kinetic studies of the reactions of CH3O2 with NO, NO2 and CH3O2 at 298 K, J. Phys. Chem., 84, 1664–1674, https://doi.org/10.1021/j100450a002, 1980.
Sander, S. P. and Watson, R. T.: Temperature dependence of the self-reaction of CH3O2 radicals, J. Phys. Chem., 85, 2960–2964, https://doi.org/10.1021/j150620a023, 1981.
Sharp, E. N., Rupper, P., and Miller, T. A.: The structure and spectra of organic peroxy radicals, Phys. Chem. Chem. Phys., 10, 3955–3981, https://doi.org/10.1039/b800954f, 2008.
Simon, F. G., Schneider, W., and Moortgat, G. K.: UV absorption spectrum of the methylperoxy radical and the kinetics of its disproportionation reaction at 300 K, Int. J. Chem. Kinet., 22, 791–812, https://doi.org/10.1002/kin.550220802, 1990.
Sprague, M. K., Mertens, L. A., Widgren, H. N., Okumura, M., Sander, S. P., and McCoy, A. B.: Cavity Ringdown Spectroscopy of the Hydroxy Methyl Peroxy Radical, J. Phys. Chem. A, 117, 10006–10017, https://doi.org/10.1021/jp400390y, 2013.
Tyndall, G. S., Cox, R. A., Granier, C., Lesclaux, R., Moortgat, G. K., Pilling, M. J., Ravishankara, A. R., and Wallington, T. J.: Atmospheric chemistry of small organic peroxy radicals, J. Geophys. Res.-Atmos., 106, 12157–12182, https://doi.org/10.1029/2000jd900746, 2001.
Wallington, T. J., Dagaut, P., and Kurylo, M. J.: Ultraviolet absorption cross-sections and reaction kinetics and mechanisms for peroxy radicals in the gas-phase, Chem. Rev., 92, 667–710, https://doi.org/10.1021/cr00012a008, 1992.
Werle, P., Mucke, R., and Slemr, F.: The limits of signal averaging in atmospheric trace-gas monitoring by tunable diode-laser absorption-spectroscopy (TDLAS), Appl. Phys. B-Photo., 57, 131–139, https://doi.org/10.1007/bf00425997, 1993.
Whalley, L. K., Furneaux, K. L., Goddard, A., Lee, J. D., Mahajan, A., Oetjen, H., Read, K. A., Kaaden, N., Carpenter, L. J., Lewis, A. C., Plane, J. M. C., Saltzman, E. S., Wiedensohler, A., and Heard, D. E.: The chemistry of OH and HO2 radicals in the boundary layer over the tropical Atlantic Ocean, Atmos. Chem. Phys., 10, 1555–1576, https://doi.org/10.5194/acp-10-1555-2010, 2010.
Whalley, L. K., Edwards, P. M., Furneaux, K. L., Goddard, A., Ingham, T., Evans, M. J., Stone, D., Hopkins, J. R., Jones, C. E., Karunaharan, A., Lee, J. D., Lewis, A. C., Monks, P. S., Moller, S. J., and Heard, D. E.: Quantifying the magnitude of a missing hydroxyl radical source in a tropical rainforest, Atmos. Chem. Phys., 11, 7223–7233, https://doi.org/10.5194/acp-11-7223-2011, 2011.
Whalley, L. K., Blitz, M. A., Desservettaz, M., Seakins, P. W., and Heard, D. E.: Reporting the sensitivity of laser-induced fluorescence instruments used for HO2 detection to an interference from RO2 radicals and introducing a novel approach that enables HO2 and certain RO2 types to be selectively measured, Atmos. Meas. Tech., 6, 3425–3440, https://doi.org/10.5194/amt-6-3425-2013, 2013.
Whalley, L. K., Stone, D., Dunmore, R., Hamilton, J., Hopkins, J. R., Lee, J. D., Lewis, A. C., Williams, P., Kleffmann, J., Laufs, S., Woodward-Massey, R., and Heard, D. E.: Understanding in situ ozone production in the summertime through radical observations and modelling studies during the Clean air for London project (ClearfLo), Atmos. Chem. Phys., 18, 2547–2571, https://doi.org/10.5194/acp-18-2547-2018, 2018.
Winiberg, F. A. F., Smith, S. C., Bejan, I., Brumby, C. A., Ingham, T., Malkin, T. L., Orr, S. C., Heard, D. E., and Seakins, P. W.: Pressure-dependent calibration of the OH and HO2 channels of a FAGE HOx instrument using the Highly Instrumented Reactor for Atmospheric Chemistry (HIRAC), Atmos. Meas. Tech., 8, 523–540, https://doi.org/10.5194/amt-8-523-2015, 2015.
Wood, E. C., Deming, B. L., and Kundu, S.: Ethane-Based Chemical Amplification Measurement Technique for Atmospheric Peroxy Radicals, Environ. Sci. Technol., 4, 15–19, https://doi.org/10.1021/acs.estlett.6b00438, 2017.
Yan, C., Kocevska, S., and Krasnoperov, L. N.: Kinetics of the Reaction of CH3O2 Radicals with OH Studied over the 292–526 K Temperature Range, J. Phys. Chem. A, 120, 6111–6121, https://doi.org/10.1021/acs.jpca.6b04213, 2016.
Zador, J., Taatjes, C. A., and Fernandes, R. X.: Kinetics of elementary reactions in low-temperature autoignition chemistry, Prog. Energ. Combust., 37, 371–421, https://doi.org/10.1016/j.pecs.2010.06.006, 2011.