the Creative Commons Attribution 4.0 License.
the Creative Commons Attribution 4.0 License.
 | 23 Jan 2020
Quantification of nitrous acid (HONO) and nitrogen dioxide (NO2) in ambient air by broadband cavity-enhanced absorption spectroscopy (IBBCEAS) between 361 and 388 nm
Nick Jordan
This work describes an incoherent broadband cavity-enhanced absorption spectroscopy (IBBCEAS) instrument for quantification of HONO and NO2 mixing ratios in ambient air. The instrument is operated in the near-ultraviolet spectral region between 361 and 388 nm. The mirror reflectivity and optical cavity transmission function were determined from the optical extinction observed when sampling air and helium. To verify the accuracy of this approach, Rayleigh scattering cross sections of nitrogen and argon were measured and found to be in quantitative agreement with literature values. The mirror reflectivity exceeded 99.98 %, at its maximum near 373 nm, resulting in an absorption path length of 6 km from a 1 m long optical cavity. The instrument precision was assessed through Allan variance analyses and showed minimum deviations of ±58 and ±210 pptv (1σ) for HONO and NO2, respectively, at an optimum acquisition time of 5 min. Measurements of HONO and NO2 mixing ratios in laboratory-generated mixtures by IBBCEAS were compared to thermal dissociation cavity ring-down spectroscopy (TD-CRDS) data and agreed within combined experimental uncertainties. Sample ambient air data collected in Calgary are presented.
- Article
(3230 KB) -
Supplement
(1492 KB) - BibTeX
- EndNote


Nitrous acid (HONO) has long been recognized as an important tropospheric oxide of nitrogen (Nash, 1974). Photodissociation of HONO produces the hydroxyl radical (OH); this pathway can be a more important OH radical source (>10 times greater) than the photolysis of O3 to O(1D) and subsequent reaction with water, especially in polluted urban environments (Harrison et al., 1996; Ren et al., 2006; Alicke et al., 2002). Despite the importance of HONO, accurate and time-resolved (i.e., <5 min) in situ measurements of ambient HONO mixing ratios remain a challenge, exemplified by discrepancies reported among individual instruments in recent inter-comparison studies (Rodenas et al., 2013; Pinto et al., 2014; Crilley et al., 2019). These discrepancies arise in part as atmospheric HONO measurements by wet chemical techniques or mass spectrometry require external calibration and are prone to interferences. For instance, long path absorption photometry (LOPAP), while sensitive with limits of detection (LODs) of <1 part per trillion (10−12, pptv), is prone to interference from atmospheric NO2 and O3 and (partial) conversion of peroxyacetyl nitrate (PAN) (Villena et al., 2011) and peroxynitric acid (HO2NO2) (Legrand et al., 2014). In practice, the interference from NO2 and O3 can be accounted for with a two-channel system and interference from PAN can be avoided by sampling at low pH (Kleffmann et al., 2006). Interference from HO2NO2 is likely only significant in cold environments such as the Earth's poles since this compound is prone to thermal decomposition (Legrand et al., 2014). In contrast, spectroscopic methods that observe HONO directly are less prone to interferences because concentrations are derived from first principles (i.e., the Beer–Lambert law and known absorption cross sections) and do not need to rely on external calibration. The prime example is open-path differential optical absorption spectroscopy (DOAS), with LODs typically in the range of 10–100 pptv with integration times of several minutes (Tsai et al., 2018). A considerable advantage of open-path instruments is the lack of any inlet and associated chemistry, such as loss of HONO due to partitioning onto inlet walls (Duan et al., 2018) or HONO formation, for example from reaction of NO2 with soot particles (Longfellow et al., 1999; Kalberer et al., 1999; Indarto, 2012) that may have deposited on the inlet lines and particle filter. Open-path DOAS, however, only provides concentrations averaged over an absorption path that is multiple kilometres long. Spectroscopic techniques that have been used for HONO quantification in situ include Fourier transform infrared (FTIR) spectroscopy (Hanst et al., 1982), tuneable diode laser spectroscopy (TDLS) (Schiller et al., 2001), cavity ring-down spectroscopy (CRDS) (Wang and Zhang, 2000), and infrared quantum cascade laser (QCL) absorption spectroscopy (Lee et al., 2011). With the exception of the QCL instrument, LODs of these techniques are in the parts-per-billion (10−9, ppbv) range, which is insufficient to quantify HONO at many locations. Improved LODs are desirable for quantification of HONO in less polluted environments, in particular during daytime, when few techniques are sufficiently sensitive and responsive to study the highly variable and often low mixing ratios.
In recent years, the incoherent broadband cavity-enhanced absorption spectroscopy (IBBCEAS) technique has been applied to the quantification of HONO and demonstrated improved LODs (e.g., 600 pptv in 20 s by Donaldson et al., 2014; 760 pptv in 10 s by Scharko et al., 2014; 175 pptv in 5 s by Min et al., 2016; and 90 pptv in 30 s by Duan et al., 2018; Table 1). The IBBCEAS technique operates on the principle that the absorption path length is enhanced by an optical cavity usually constructed from two reflective mirrors (Fiedler et al., 2003). Typically, effective absorption path lengths of a few to several tens of kilometres can be obtained from a 0.5–2 m long optical cavity. A large source of uncertainty in the retrieval of mixing ratios is knowledge of relevant absorption cross sections and their convolution to each spectrometer's resolution. Other sources of systematic error in IBBCEAS instruments include the determination of the mirror reflectivity curve and, if purge gases are used to prevent contact of the sampled gas with the mirrors, the length over which the absorber is present (d0) compared to the total optical path length (d) (Duan et al., 2018). To exemplify these challenges, a recent inter-comparison study (Crilley et al., 2019) has revealed significant biases in the retrieved mixing ratios between two modern IBBCEAS instruments, implying that IBBCEAS instruments must be validated.
Table 1State-of-the-art IBBCEAS instruments for quantification of NO2 and HONO in the near-UV region.

a Peak wavelength + full-width at half maximum. b Effective path length, . c Laboratory sample. d Field sample. n/a: not applicable.
In this work, we report a new IBBCEAS instrument for quantification of HONO and NO2 in ambient air, nicknamed “HONO detection by optical resonance” (HODOR). We present measurements of Rayleigh scattering cross sections of N2 and Ar in the 350 to 400 nm region. The instrument's precision and optimum signal averaging time were assessed through Allan variance analyses (Werle et al., 1993). Using laboratory-generated air mixtures, we compared HODOR HONO and NO2 measurements to a thermal dissociation cavity ring-down spectroscopy (TD-CRDS) instrument, which quantified mixing ratios of NO2 via its absorption at 405 nm and of HONO via thermal dissociation to NO at 600 ∘C and subsequent titration of NO to NO2 in excess O3. Sample IBBCEAS measurements of ambient air in Calgary are presented.
2.1 IBBCEAS setup
A schematic of HODOR is shown in Fig. 1a. The instrument is comprised of a light source, collimating optics, a resonant cavity, an optical filter, a fibre collimator, a specialized fibre bundle, and a grating spectrometer. Many instrument components, including the sample cell design, are identical to the instrument described by Jordan et al. (2019), with differences noted below.
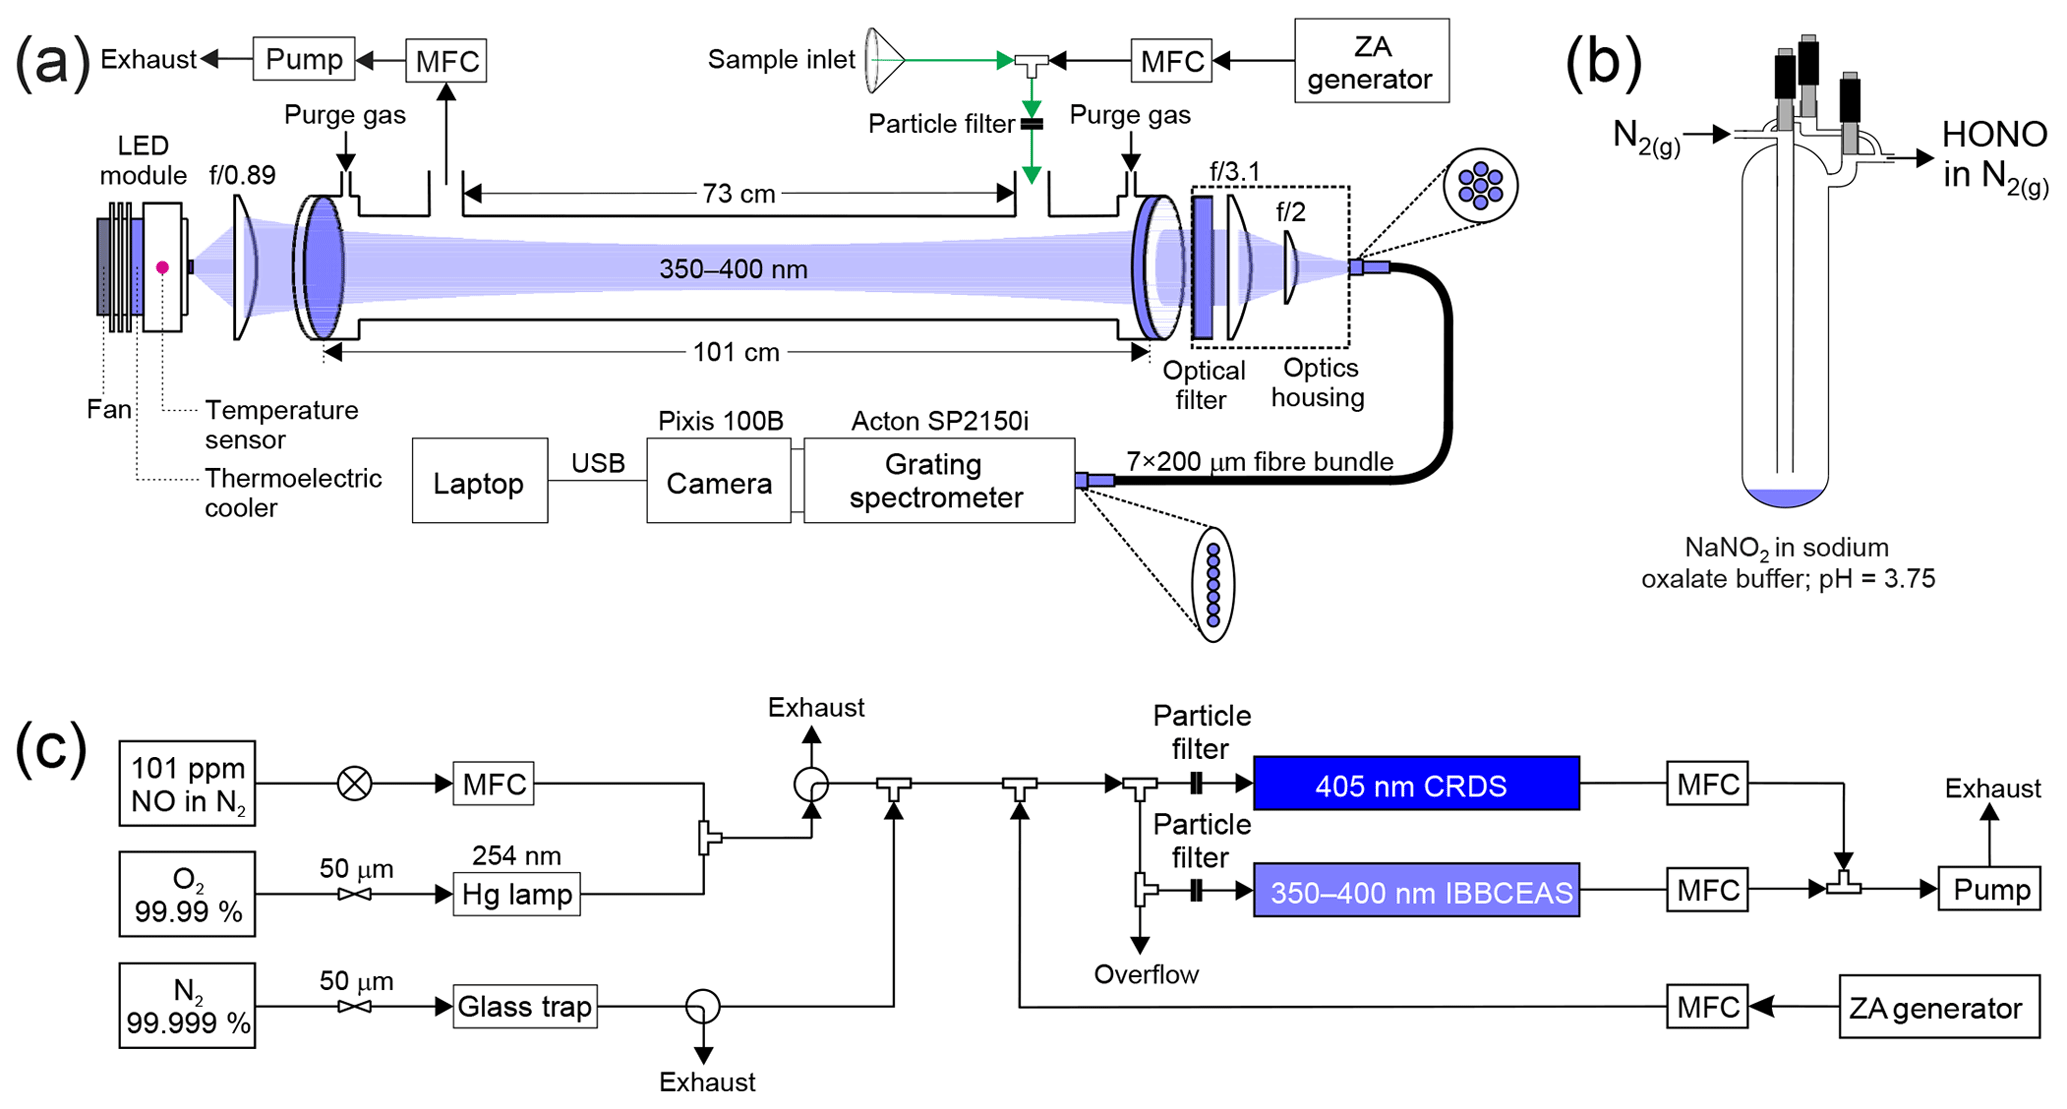
Figure 1Schematics of (a) HODOR optical setup and ambient air sampling system. The optical portion of the instrument consists of temperature-stabilized LED module, collimating and focusing optics, band-pass filter, specialized fibre bundle, grating spectrometer, and a charge-coupled device array detector. Sample ambient air is pulled through a 2–4 m long sampling inlet using a diaphragm pump. Zero air (ZA) is occasionally switched on from a cylinder or produced by a zero air generator. (b) A glass trap containing dissolved NaNO2 showing HONO production in the gas phase while sampling in active mode. (c) Laboratory air sampling system for delivery of NO2 and HONO for quantification by IBBCEAS and CRDS in parallel. MFC = mass flow controller. USB = universal serial bus.
The light source is a light-emitting diode (LED; Thorlabs M365LP1, Newton, NJ, USA) with emitting area of 1.4×1.4 mm2 and high optical output power (1150 mW minimum; 1400 mW typical) and is equipped with a heat sink. A single thermoelectric module (CUI Inc. CP30238, Tualatin, Oregon, USA) is mounted between the LED and its heat sink such that the module is only ∼3 cm away from the LED chip. The LED temperature is controlled by a PID controller (Omega CNi3253) and stabilized to 25.00±0.05 ∘C with the aid of a K-type thermocouple (Omega) situated ∼0.5 cm behind the LED chip. At this temperature, the LED output spectrum has a peak wavelength at 367.8 nm and a full width at half maximum (FWHM) of 10.1 nm (Fig. S1 in the Supplement).
The LED is coupled to the cavity by a single f/0.89 aspheric condenser lens (Thorlabs ACL2520U-A) with a high numeric aperture (NA=0.60) to maximize coupling efficiency of the large angular displacement of the LED output rays. In this work, the LED was operated at 68 % (1150 mA) of its maximum forward current (∼1700 mA). This allows for sufficient light to couple into the cavity such that the integrated IBBCEAS signal (∼50 000 counts near the peak wavelength) is ∼30 % below saturation (∼70 000 counts) for a cavity filled with cylinder “zero” air (80.5 % N2 and 19.5 % O2, Praxair) at ambient pressure (893.3 hPa).
The optical cavity is constructed from two highly reflective, dielectric mirrors (Advanced Thin Films, Boulder, CO, USA), 2.54 cm in diameter, 0.635 cm thickness, with 1 m radius of curvature, and maximum reflectivity between 360 and 390 nm. The cavity output is collected by an f/3.1 lens (Thorlabs LA4725) and filtered through a coloured glass UV filter (Thorlabs FGUV5M) to remove light outside the range of the highly reflective mirrors. The signal is then imaged onto a 0.5 cm diameter f/2 lens (74-UV; Ocean Optics, Dunedin, FL, USA) that couples light into the round end of a 2 m long, 0.22 NA, 7×200 µm fibre bundle (Thorlabs BFL200HS02). The line end of the fibre bundle is aligned with the entrance slit of a grating imaging spectrograph to optimize coupling and maximize illumination of the spectrometer detector.
The grating spectrometer (spectrograph and camera; Princeton Instruments Acton SP2156) has been described by Jordan et al. (2019). The spectrograph is configured with a 1200 groove mm−1 grating, blazed at 500 nm and positioned at 350 nm central wavelength with a spectral coverage from 291.9 to 408.2 nm. The spectrograph is controlled by custom software written in LabVIEW™ (National Instruments). The spectrograph entrance slit width was set at ∼100 µm resulting in a ∼1 nm spectral resolution, estimated from the emission lines of a Ne lamp directed through the slit. The spectral resolution varied slightly with wavelength: emission lines at 352.05, 359.35, and 375.42 nm exhibited FWHM values of 1.08±0.02, 0.99±0.01, and 1.02±0.04, respectively (Fig. S2 and Table S1 in the Supplement).
The instrument's inlet was constructed from 1∕4 in. (0.635 cm) outer diameter (o.d.) and 3∕16 in. (0.476 cm) inner diameter (i.d.) fluorinated ethylene propylene (FEP) Teflon™ tubing (Saint Gobain Plastics), perfluoroalkoxy alkanes (PFA) Teflon™ compression fittings (Entegris Fluid Handling), a 2 µm pore size, 47 mm diameter Teflon™ filter (Pall) housed in a PFA Teflon™ filter holder (Cole Parmer).
2.2 Determination of mirror reflectivity
We used the method by Washenfelder et al. (2008) to determine R(λ). Briefly, the method requires measuring the optical extinction of two high-purity gases with known scattering cross sections. The mirror reflectivity is then calculated from
Here, R(λ) is the wavelength dependent mirror reflectivity, is the extinction coefficient due to Rayleigh scattering, IX(λ) is the measured signal intensity in the presence of non-absorbing, scattering gas molecules, and d is the cavity length.
For ambient air measurements in this work, we filled the optical cavity using air (“zero” grade, 19.5 % O2 and 80.5 % N2, Praxair) and with He (Praxair, 99.999 %) via the purge ports and used the scattering cross sections of air from Bodhaine et al. (1999) and those of Cuthbertson and Cuthbertson (1932) for He. For the measurement of the Ar scattering cross sections, the mirror reflectivity was obtained from the dispersion of N2 and He and the literature scattering cross sections of N2 (Peck and Khanna, 1966) and He (Cuthbertson and Cuthbertson, 1932). The scattering cross sections of N2 were determined from the mirror reflectivity based on the dispersion by Ar (Peck and Fisher, 1964) and He.
2.3 Operation of HODOR
The instrument was turned on 30 min prior to measurements to allow for the LED temperature to stabilize and the CCD camera to cool to its operating temperature of −80 ∘C. Dark spectra were acquired daily with identical integration time as that of the sample spectra and then averaged to 60 s to represent the dark spectrum applied in the analysis. The dark spectrum was subtracted from raw data spectra as a first step in the data reduction. Air was sampled at a flow rate of 2–3 slpm resulting in a residence time of 5.5–3.6 s.
Spectral data were recorded at 1 s integration time and averaged to 10 s. Following data reduction, retrieved mixing ratios were averaged to either 1 or 5 min. He and zero air were sampled for 5 min each day and used to determine the mirror reflectivity (Sect. 3.2). For ambient air measurements, zero air was generated using a custom-built generator (Jordan et al., 2019). The IBBCEAS sampled zero air every 10 min for a duration of 2 min.
2.4 Reference spectra and spectral fitting
Absorption spectra were calculated as described by Washenfelder et al. (2008) using
Here, RL is the ratio of the cavity length (d≈101 cm) divided by the length occupied by the sample (d0≈82 cm – Sect. 3.3), αRay(λ) is the total extinction due to scattering, I0(λ) is the intensity spectrum in the absence of absorbers in the cavity cell, and I(λ) is the intensity spectrum measured in the presence of absorbers. Zero spectra were interpolated between successive zero determinations by a macro written in Igor Pro software (Wavemetrics, Inc.); this macro also calculated the absorption spectra, αabs(λ).
Following Tsai et al. (2018), we chose the absorption cross sections of Stutz et al. (2000) and Vandaele et al. (1998) for HONO and NO2 retrievals, respectively. These cross sections were convolved with a sharp line at 359.35 nm (observed nm) from the emission of a Ne lamp to match the resolution of HODOR (Fig. S2 and Sect. 2.1). The convolved cross sections are shown in Fig. S3. Convolution was found to be critical for accurate retrieval of gas-phase concentrations. If omitted, retrieved mixing ratios showed significant (>50 %) systematic errors (data not shown).
The retrieval of gas-phase concentrations from the observed absorption spectra was performed with DOAS intelligent system (DOASIS) software (Kraus, 2003). Data were fitted using the convolved absorption spectra of NO2 and HONO (Fig. S3) and a third-order polynomial from 361 to 388 nm. The spectral shifting setting in DOASIS was set to ±0.1 nm. Stretching was allowed within a margin of ±3 %. Since the zero air generator produces scrubbed air at the same relative humidity as in ambient air, absorption by water in this region (Lampel et al., 2017) was negligible in αabs(λ) calculated from Eq. (2). Gas concentrations were extracted from a linear least squares fit applied to the calculated absorption coefficient, followed by conversion to mixing ratios using the number density of air calculated from the ideal gas law and the temperature and pressure of the sampled gas, monitored using a K-type thermocouple (Omega) attached to the sample cell holder and a pressure transducer (MKS Baratron 722B) located next to where gases exit the sample cell and upstream of the mass flow controller.
2.5 Measurement of Rayleigh scattering cross sections
To measure scattering cross sections, gases were introduced into the IBBCEAS instrument through the purge ports, and the instrument inlet was open to ambient air (while the sample cell exhaust was sealed) to allow other gases to be displaced. The extinction spectrum of each gas was recorded at ambient pressure and temperature for 10 min at an acquisition rate of 10 s with a 1 s integration of the output intensity signal. The scattering cross sections were determined from the relationship given by Thalman et al. (2014):
Here, is the scattering coefficient of the gas A in question, IA(λ) and IB(λ) are the IBBCEAS signal intensities measured individually for two different gases, and is the scattering coefficient of gas B which is found from a known scattering cross section and the number density calculated from the ideal gas law.
2.6 Preparation and delivery of NO2 and HONO
Figure 1c shows the experimental setup used to generate NO2. Briefly, NO2 was generated by mixing the output of a standard NO cylinder (Scott-Marrin, 101±1 ppmv in oxygen- and moisture-free nitrogen) with O3 produced by illuminating a flow of O2 (99.99 %, Praxair) by a 254 nm Hg lamp followed by dilution with zero air to vary the product concentration. When not in use, the setup remained under O2 flow to prevent moisture and other impurities from contaminating the tubing.
Gas streams containing HONO were produced by dissolving ∼0.1 g of sodium nitrite (NaNO2) into 5 mL potassium oxalate ∕ oxalic acid (K2C2O4•H2O∕H2C2O4) buffer solution (pH=3.74) placed inside a glass trap as illustrated in Fig. 1b. The trap was operated in active mode with a dilution flow of N2 (99.998 %) directed through the trap bypass and controlled by a 50 µm critical orifice which was regulated by a back pressure of 138 kPa. A thin sheath of aluminum was wrapped around the exterior of the trap to reduce HONO photolysis. The sample stream of HONO in N2 was further diluted downstream in zero air to vary the concentration of HONO. The glass trap, containing the buffer solution and the dissolved NaNO2, was placed under constant flow of N2 for approximately 2 d prior to sampling to remove as much NO and NO2 as possible. The trap acted as a source of both HONO and NO2 and allowed for the simultaneous determination of both, while also allowing the influence on the retrievals of HONO in the presence of another gas of high concentration (i.e., NO2) to be captured.
2.7 Measurement of NO2 and NO2+HONO by TD-CRDS
Mixing ratios of HONO and NO2 were measured in parallel by HODOR and a compact TD-CRDS instrument equipped with two 55 cm long optical cavities, henceforth referred to as the general nitrogen oxide measurement (GNOM) (Taha et al., 2013). Mixing ratios of NO2 were quantified through optical absorption at 405 nm by a continuous-wave, blue diode laser (Power Technology IQμ2A105, Little Rock, AR, USA) at 1 s temporal resolution (Paul and Osthoff, 2010; Odame-Ankrah, 2015). Both GNOM channels were equipped with heated quartz inlets for thermal conversion of NOz (odd nitrogen; e.g., PAN, HONO, or HNO3) to NO2. The cylindrical quartz inlets were 60 cm long, 0.625 cm o.d. and 0.365 cm i.d., and resistively heated using a 14.5Ω nickel–chromium (Nichrome) alloy wire coiled several tens of times around each quartz tube, covering a length of ∼30 cm. Temperature was monitored by a K-type thermocouple embedded within the coating material and in direct contact with the quartz surface at the centre of each heated section of the inlet. These quartz tubes were connected to the remaining inlet assembly via PFA Teflon™ compression fittings (Entegris Fluid Handling).
When the quartz portion of the inlet is heated above ∼300 ∘C, HONO dissociates to NO and OH radicals (Perez et al., 2007). The inlet of the “hot” channel was heated to 525 ∘C to ensure complete dissociation of HONO and occasionally ramped in 15 ∘C decrements (10 s interval) to lower temperatures. The other, “cold,” channel was kept at a reference temperature of 225 ∘C.
Following the TD section but prior to entering the CRDS cell, NO (present in the sampled air and generated by TD of HONO) reacted with excess O3 to NO2 (Wild et al., 2014). Ozone was produced through illumination of a ∼7 sccm flow of O2 (99.99 %) by a 185 nm Hg pen-ray lamp (Jelight, Irvine, CA, USA). After mixing with the sampled air, the O3 mixing ratio was ∼8 parts per million (10−6, ppm), measured off-line by optical absorption using a commercial instrument (Thermo 49i). A box model simulation (not shown) was carried out to verify that (a) NO is fully titrated by the time the sampled air enters the cavity, and (b) that loss of NO2 to oxidation by O3 is small. The simulation showed that under the conditions employed here, the conversion efficiency of NO to NO2 was less than unity, ∼83.8 % when averaged over the length of the optical cavity, because the sampled gas entered the cavity prior to complete titration of NO to NO2. The TD-CRDS HONO data were hence scaled by a factor of prior to presentation. The accuracy of this correction factor is limited by knowledge of the rate coefficient for the oxidation of NO by O3, ±10 % (Burkholder et al., 2015).
Figure S4 shows a sample TD-CRDS inlet temperature scan when the output of the source described in Sect. 2.6 was sampled. In this particular example, the heated channel (to which excess O3 was continuously added) measured ∼137.5 ppbv of NOy (NOx+HONO) while the cold channel measured ∼108 ppbv NO2 originating from the glass trap. When the hot channel temperature was cooled to a temperature of 350 ∘C, the same amount of NO2 was observed in both channels.
2.8 Sample ambient air measurements
Ambient air was sampled by HODOR at the “Penthouse” laboratory located on the rooftop of the Science B building at the University of Calgary (latitude 51.0794∘ N, longitude −114.1297∘ W, ∼25 m above ground level) on 27–30 April 2018. This site was the location of several earlier studies (Mielke et al., 2011, 2016; Odame-Ankrah and Osthoff, 2011; Woodward-Massey et al., 2014) and exhibits NOx levels in the range of tens of parts per billion of volume, which is typical of urban environments. The instrument sampled from a 1.8 m long FEP Teflon™ inlet at a flow rate of 2 slpm, of which roughly one-third was guided through a partially open window.
3.1 Determination of mirror reflectivity R(λ)
Figure 2a shows the IBBCEAS signal intensities for a cavity filled with air, N2 and He, as well as the respective literature scattering cross sections; Fig. 2b shows R(λ) (∼0.99981 near 373 nm) and the absorption path enhancement (∼6 km) from the 1.01 m long cavity. Repeated measurements of R(λ) over a 1-week period showed a standard deviation of ±0.000003 (at maximum R). From this, it was judged that one daily measurement of R(λ) suffices for accurate retrieval of mixing ratios.
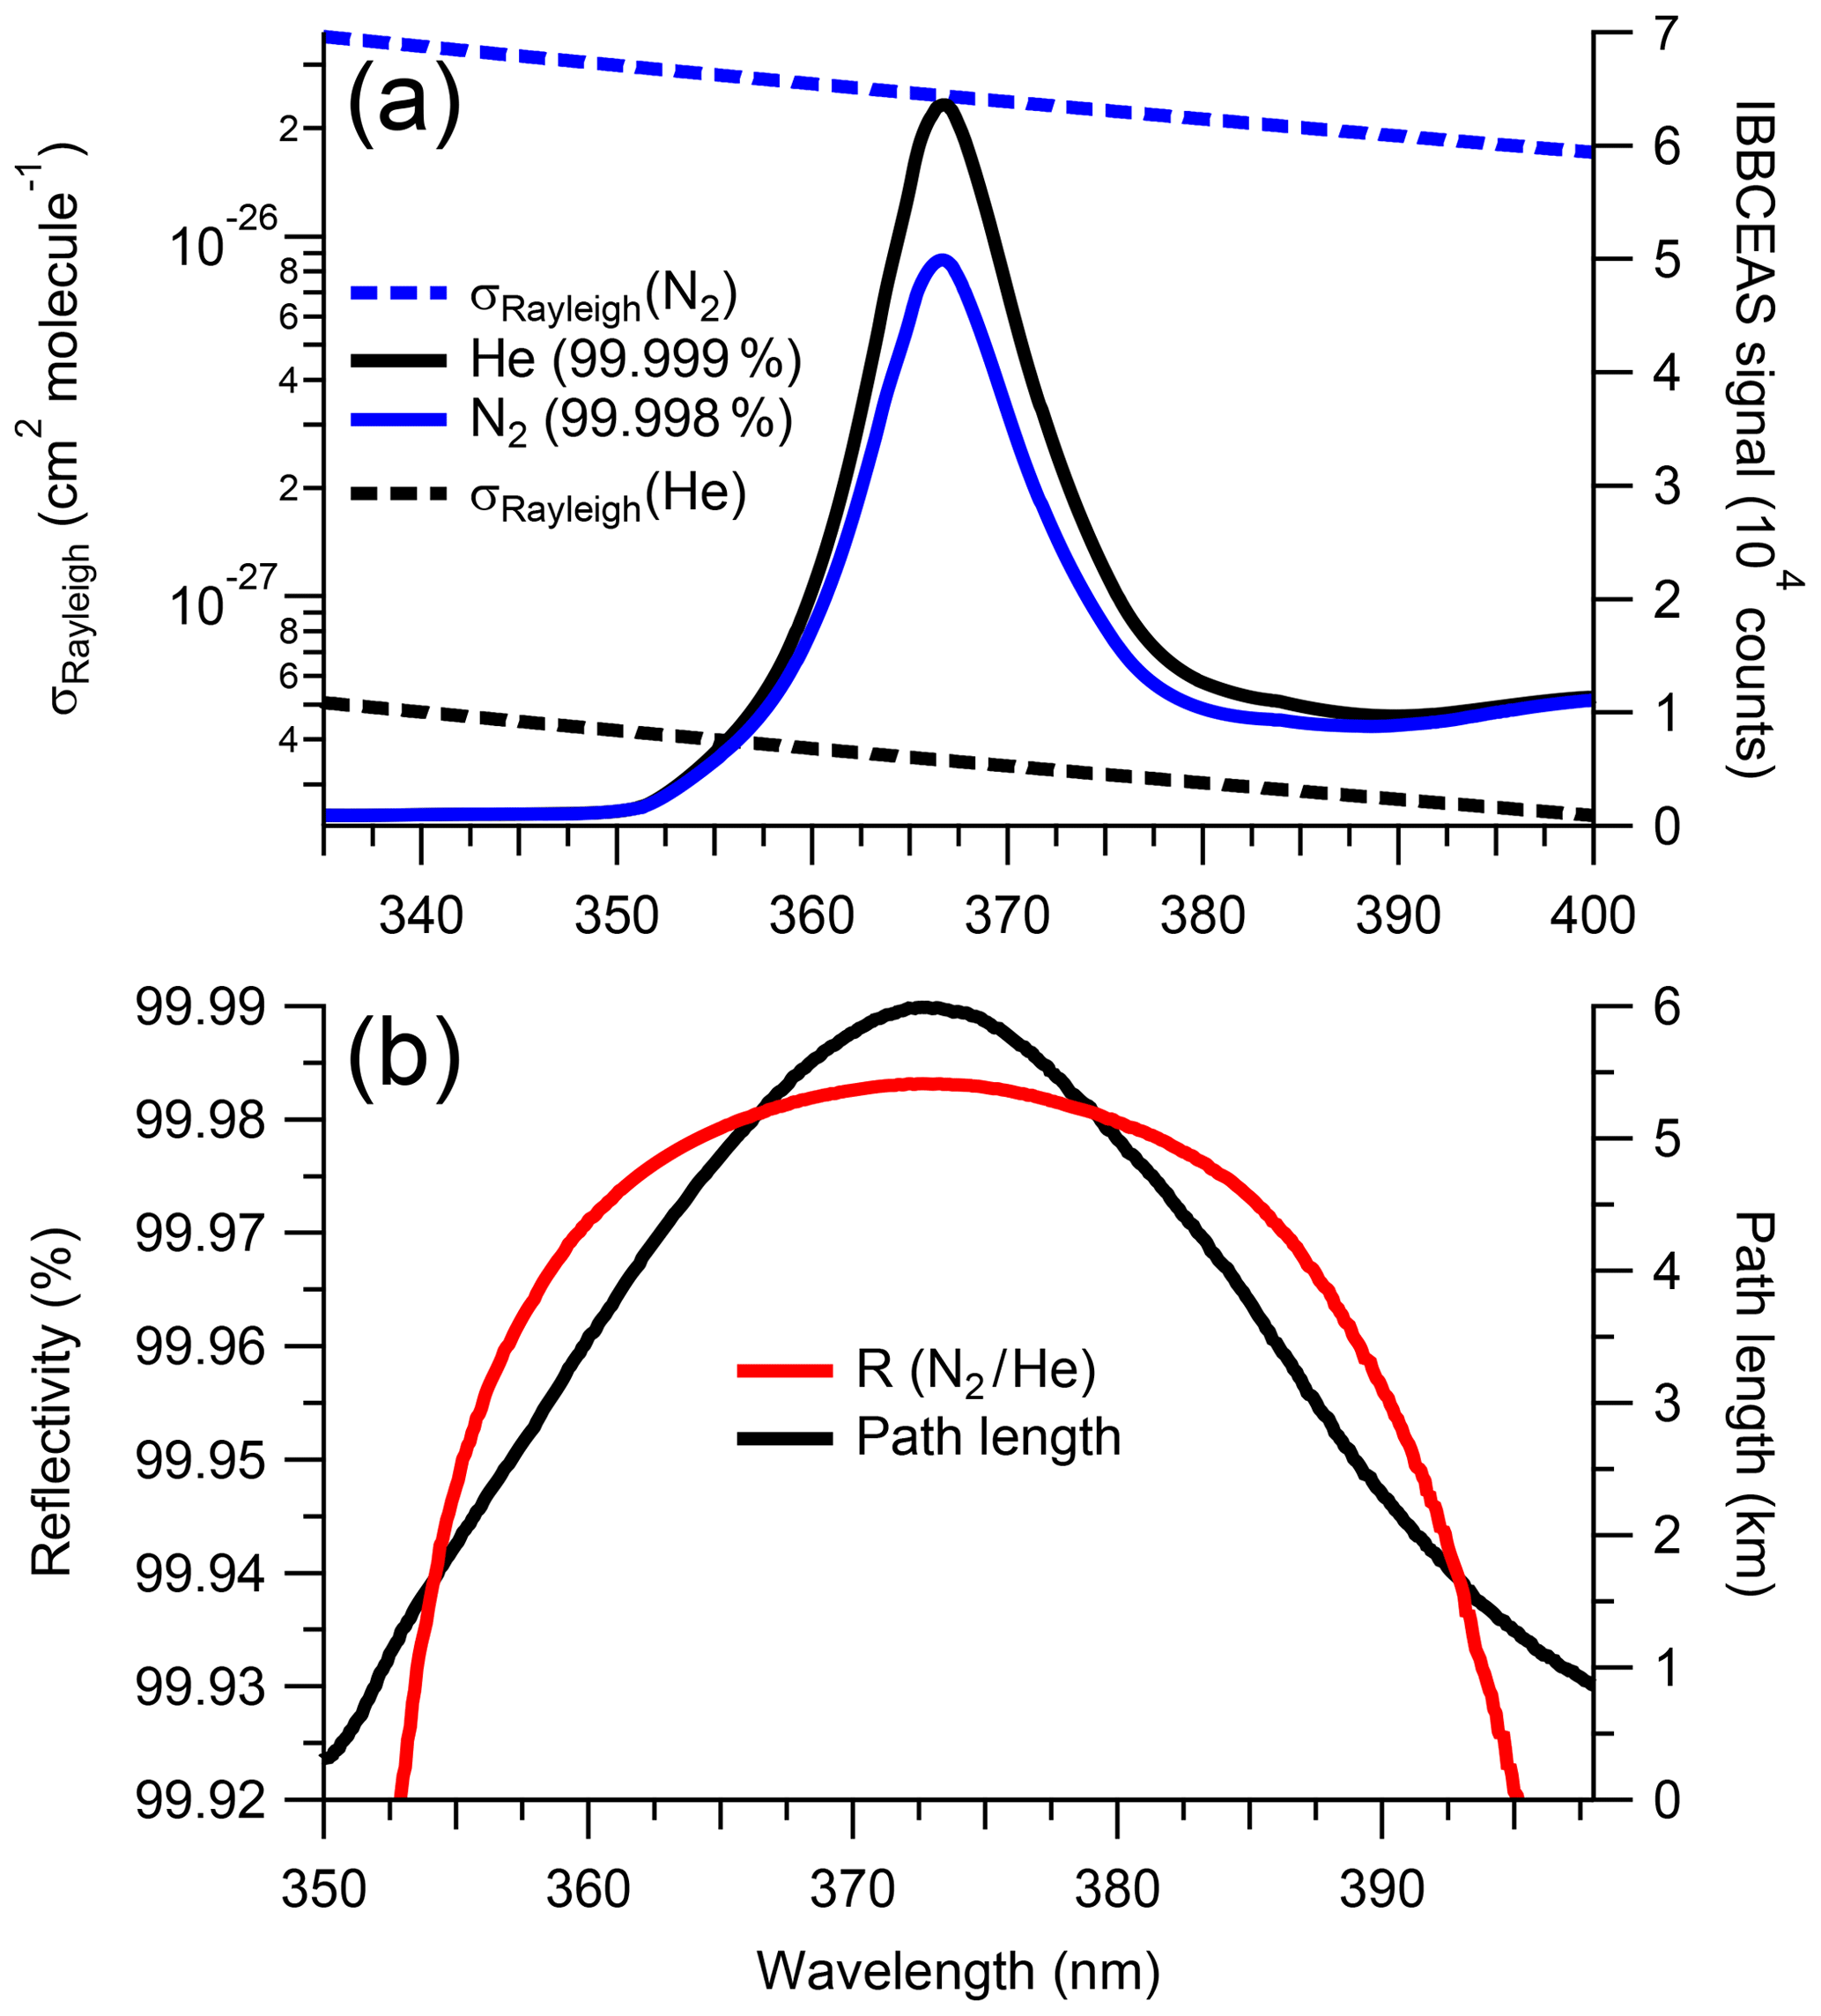
Figure 2(a) Cavity output signal for samples of N2 (99.998 %) and He (99.999 %), and their scattering cross sections by Peck and Khanna (1966) and Cuthbertson and Cuthbertson (1932), respectively. The cavity output signal is a function of the LED spectral output and the superimposed mirror reflectivity and filter functions. (b) Reflectivity curve calculated from the ratio of He to N2 (shown above) using Eq. (2). The effective path length is shown in black.
The choice of N2 and He in the determination of R(λ) assumes that their cross sections are well known but nevertheless may introduce a systematic bias. To validate the above approach, scattering cross sections of N2 and Ar were measured and examined for their consistency.
3.2 Rayleigh scattering cross sections of N2 and Ar in the near-UV
Figure 3 shows the extinction cross sections of N2 and Ar in the 352–398 nm range at a pressure of 881.9±0.7 hPa and temperature of 298.0±0.1 K, along with literature values. The 1σ uncertainty of the IBBCEAS data (±2.5 %) was mainly limited by the uncertainty in the measurement of the mirror reflectivity (±2.3 %).
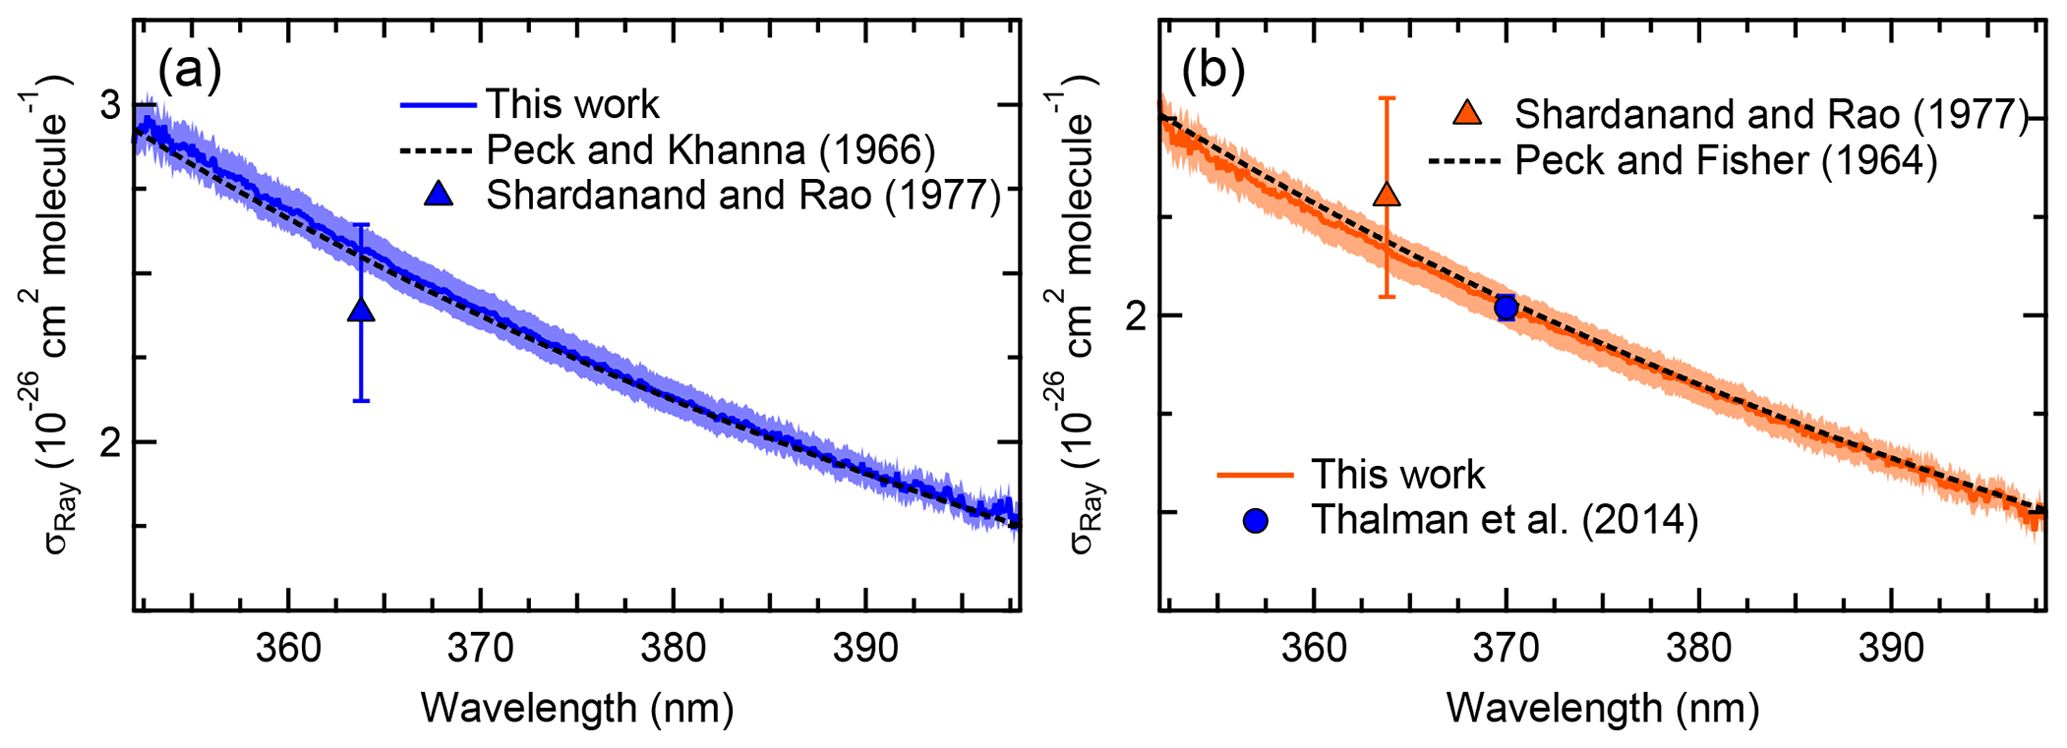
Figure 3Cross sections of pure gases: (a) N2 (99.998 %, in blue), and (b) Ar (99.998 %, orange).
Figure 3a shows the IBBCEAS-derived scattering cross sections of N2. Superimposed are the refractive index-based (n-based) literature cross sections of Peck and Khanna (1966) with a King correction factor from Bates (1984) and the nephelometer data of Shardanand and Rao (1977). The observed cross sections are slightly larger than the n-based values near the extreme wavelengths where the mirror reflectivity is smaller: for example, the IBBCEAS cross section is larger by +2.0 % at 355.03 nm and by +0.02 % at 395.08 nm relative to the n-based cross section. On the other hand, the nephelometer data underestimate both the IBBCEAS and the n-based data at 363.8 nm by 7.4 % and 6.5 %, respectively, but agree with the other methods within their measurement uncertainty of ±11 % (Table 2).
Table 2Summary of observed and literature scattering cross sections at 363.8 and 370.0 nm.
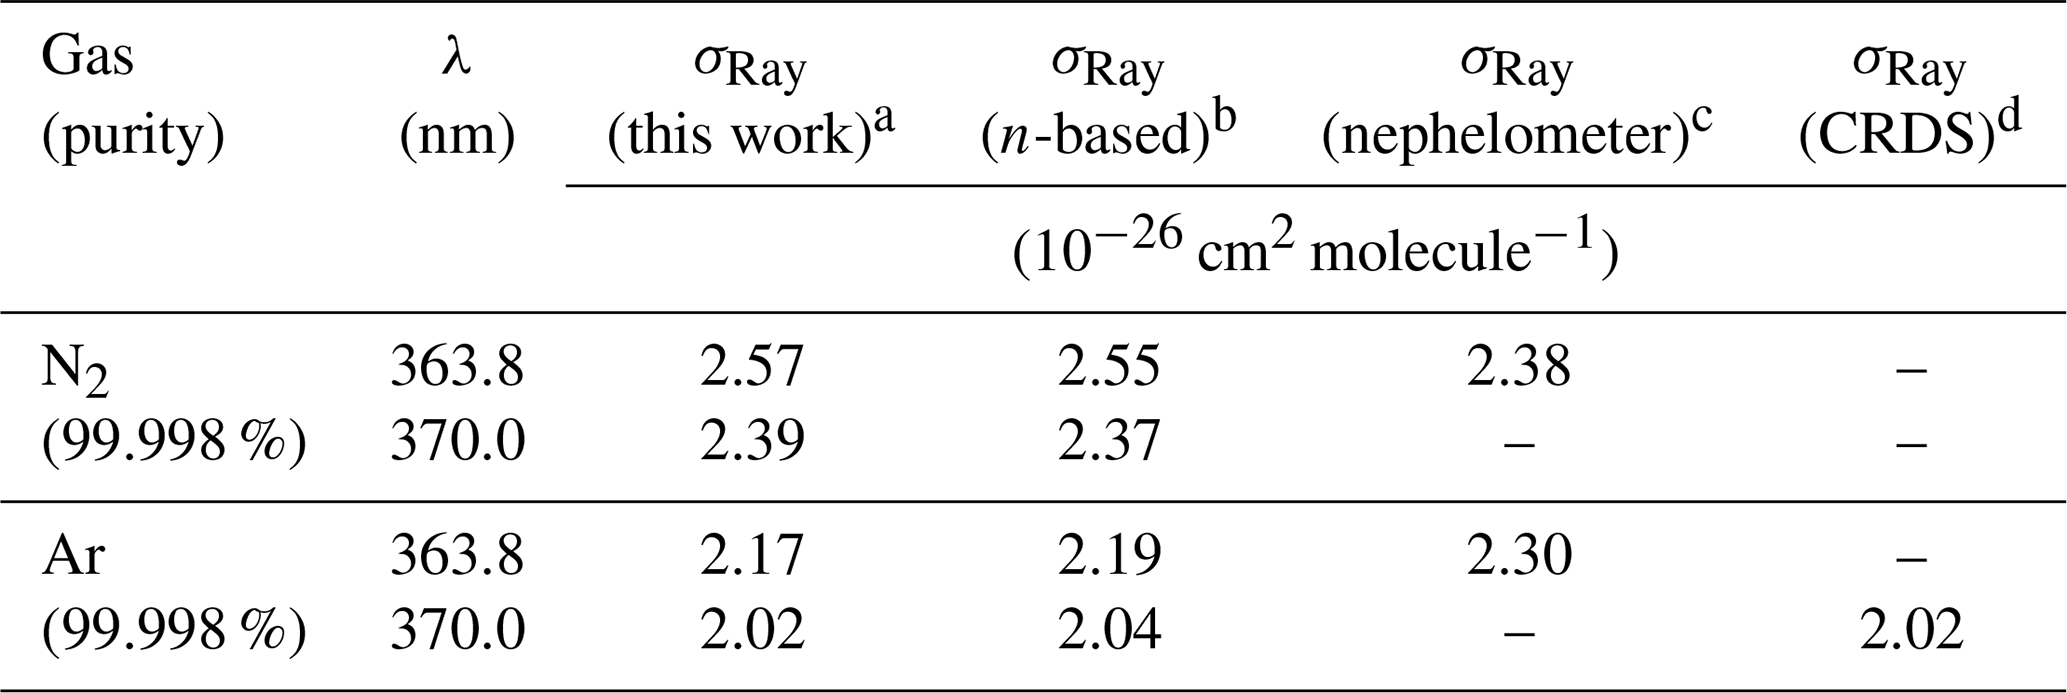
a The uncertainty is ±2.5 % (see Sect. 3.6). b See text for references of n-based scattering cross sections and references therein for corresponding calculations of King correction factors. c Data set of Shardanand and Rao (1977). d Data set of (Thalman et al., 2014). e The ratio of N2∕O2 in the cylinder was .
Figure 3b shows the scattering cross sections of Ar. Superimposed are the n-based scattering cross sections calculated from the data of Peck and Fisher (1964) and King correction factor from Bates (1984), as well as the CRDS data of Thalman et al. (2014). Similar to N2, the IBBCEAS scattering cross sections of Ar are marginally smaller than those of the n-based predictions, with larger difference (up to −2.0 %) at shorter wavelengths. The nephelometer data at 363.8 nm differ by +4.9 % and +5.9 % from the IBBCEAS and n-based data but are within their uncertainty of ±11 % (Table 2). The IBBCEAS cross section of Ar at 370.0 nm agrees with the measurement by Thalman et al. (2014), i.e., cm2 molecule−1.
The scattering cross sections of N2 and Ar measured in this work were consistent with literature values (Table 2). The IBBCEAS measurement verified that both refractive-index-based and IBBCEAS-observed scattering cross sections can be used to calibrate the mirror reflectivity.
3.3 Determination of the effective absorption path
The effective absorption path (d0) requires determination in IBBCEAS experiments that use purge volume to maintain mirror cleanliness. The ratio of d∕d0 was determined by sampling oxygen (99.99 %, Praxair) and monitoring the absorption of the weakly bound molecular oxygen complex, whose concentration was retrieved using cross sections by Thalman and Volkamer (2013). When N2 or zero air was used as a purge gas, d0 can be calculated directly from this absorption. A slower but (perhaps) more accurate approach is to turn the purge flows off and on. Following Duan et al. (2018), d0 is then given by
where [O2]on and [O2]off are the [O2] with or without the purge flows. Figure S5 shows RL as a function of flow rate. At a flow rate of 2 slpm, RL was 1.28±0.05.
3.4 Simultaneous retrieval of NO2 and HONO and comparison of HODOR to TD-CRDS
Figure 4 shows an example fit containing NO2 and HONO in ambient air, collected on 27 April 2018 at 01:00 MST (Mountain Standard Time). Panel (a) shows the entire absorption (and the fit shown in black) along with the scattering coefficient of air. In this example, NO2 (shown in blue) and HONO (shown in orange) mixing ratios of 42.8±0.2 and 1.9±0.2 ppbv were obtained, respectively.
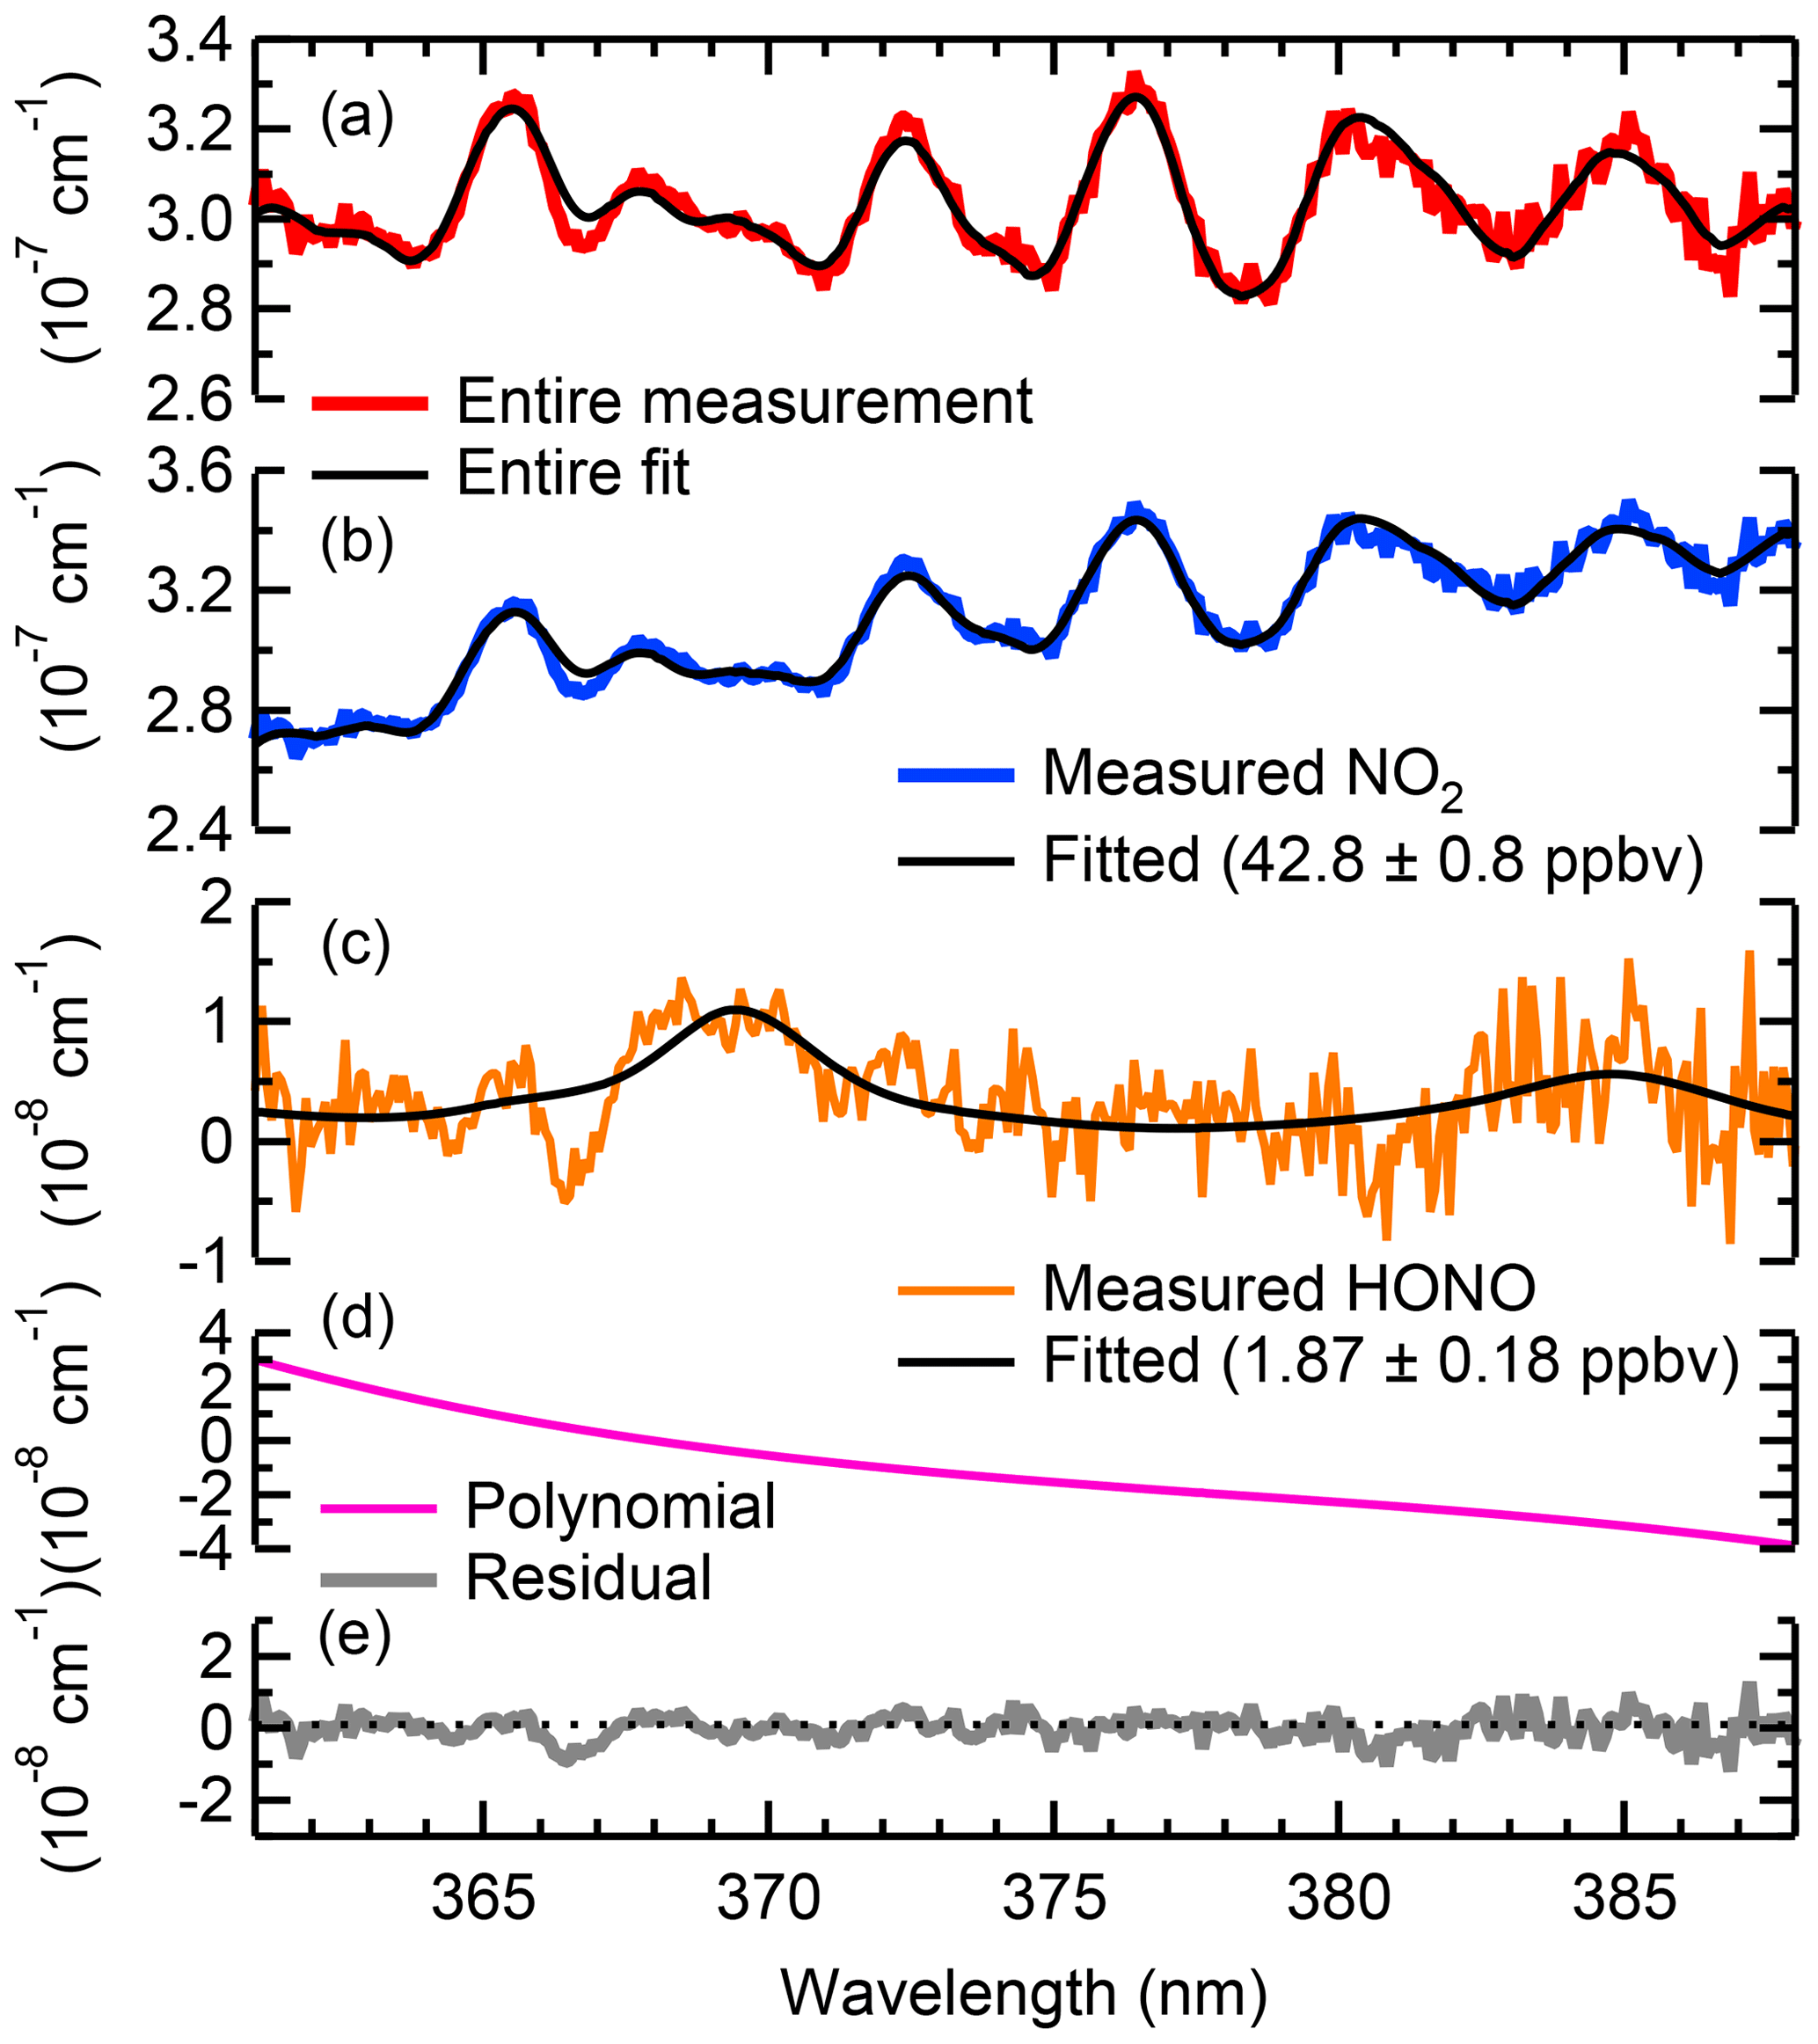
Figure 4Sample fit of ambient air containing NO2 and HONO sampled on 27 April 2018, at 01:00 MST. Panel (a) shows the entire absorption spectrum. Shown in panels (b–d) are the absorption spectra of NO2 and HONO with their respective fit errors and the polynomial. Panel (e) shows the fit residual.

Figure 5Time series of NO2 and HONO mixing ratios observed by HODOR, CRDS and TD-CRDS, averaged to 1 min. The instruments sampled for zero air (grey underlay), laboratory air (blue underlay) and laboratory air to which varying amounts of synthetic air containing NO2, HONO and zero air were added (white underlay). (a) NO2 mixing ratios reported by IBBCEAS (HODOR, blue) and CRDS (GNOM, red). (b) HONO mixing ratios reported by TD-CRDS (black) and IBBCEAS (orange). From 23:30 to 00:10 UTC, the TD-CRDS inlet converter temperature was ramped up and down several times to collect a thermogram; only data collected at an inlet temperature >520 ∘C are shown here. The inset shows the mixing ratio of HONO in laboratory air containing 40–50 ppbv of NO2. The error bars show the measurement uncertainty of HODOR.
Figure 5 shows a time series of NO2 and HONO mixing ratios (data averaged to 1 min). In this example, the inlet sampled laboratory air or laboratory-generated mixtures of NO2 and HONO from the glass trap described in Sect. 2.6. The NO2 mixing ratios observed by IBBCEAS ranged from 0.01 to 124.2 ppbv and from 0.01 to 28.2 ppbv for HONO mixing ratios. For the time period sampling indoor air, the mixing ratios ranged from 16.9 to 48.4 ppbv (median 32.8 ppbv) for NO2 and from 0.24 to 2.3 ppbv (median 1.1 ppbv) for HONO with a median HONO:NO2 ratio of 3.6 %; these levels are reasonable for an indoor environment (Collins et al., 2018). In contrast to the IBBCEAS instrument, the TD-CRDS instrument was unable to quantify HONO in indoor air since the high-NO2 background introduces a large subtraction error in the heated channel. The scatter plot for IBBCEAS vs. CRDS NO2 data (Fig. S6a) has a slope of 1.05±0.01, an intercept of 1.5±0.3 ppbv and r2 of 0.990. The scatter plot of IBBCEAS vs. TD-CRDS HONO data (Fig. S6b; only data points from when the synthetic source was sampled were included in the fit) has a slope of 1.01±0.01, an intercept of 0.01±0.24 ppbv and r2 of 0.995.
Figure S7 shows a subset of the above data at 1 s time resolution. When switching between sample and zero periods, the instrument responded rapidly, on the timescale it takes to replace the sampled air from the optical cavity, suggesting that the inlets were “well-behaved”, i.e., there is no evidence to suggest inlet memory effects such as sample loss or production.
3.5 Precision, limit of detection and accuracy
Allan deviation analyses (Werle et al., 1993) were carried out to determine the optimum signal averaging time by continuously sampling zero air through the IBBCEAS cavity, calculating extinction and retrieving NO2 and HONO mixing ratios. This analysis also allows an estimate of the LOD for each molecule for white-noise-dominated data (Werle et al., 1993). While commonly used amongst IBBCEAS practitioners (Thalman and Volkamer, 2010; Langridge et al., 2006; Vaughan et al., 2008; Washenfelder et al., 2008; Duan et al., 2018), this approach does not follow the recommended practice by the International Union of Pure and Applied Chemistry (IUPAC), who recommend repeatedly measuring (at least) one concentration near the LOD in addition to the blank (Loock and Wentzell, 2012).
Figure 6 shows the Allan deviation plots with respect to NO2 and HONO. The Allan deviations after 10, 60 and 300 s averaging for NO2 are 1223, 533 and 210 pptv, respectively, with an optimum acquisition time (minimum in the Allan deviation plot) of ∼15 min. The respective values for HONO are 270, 118 and 58 pptv for the 10, 60 and 300 s acquisition, but with a lower optimum acquisition time of ∼5 min. Based on the above, the LOD (2σ) for 5 min data was estimated at 420 and 116 pptv for NO2 and HONO, respectively.
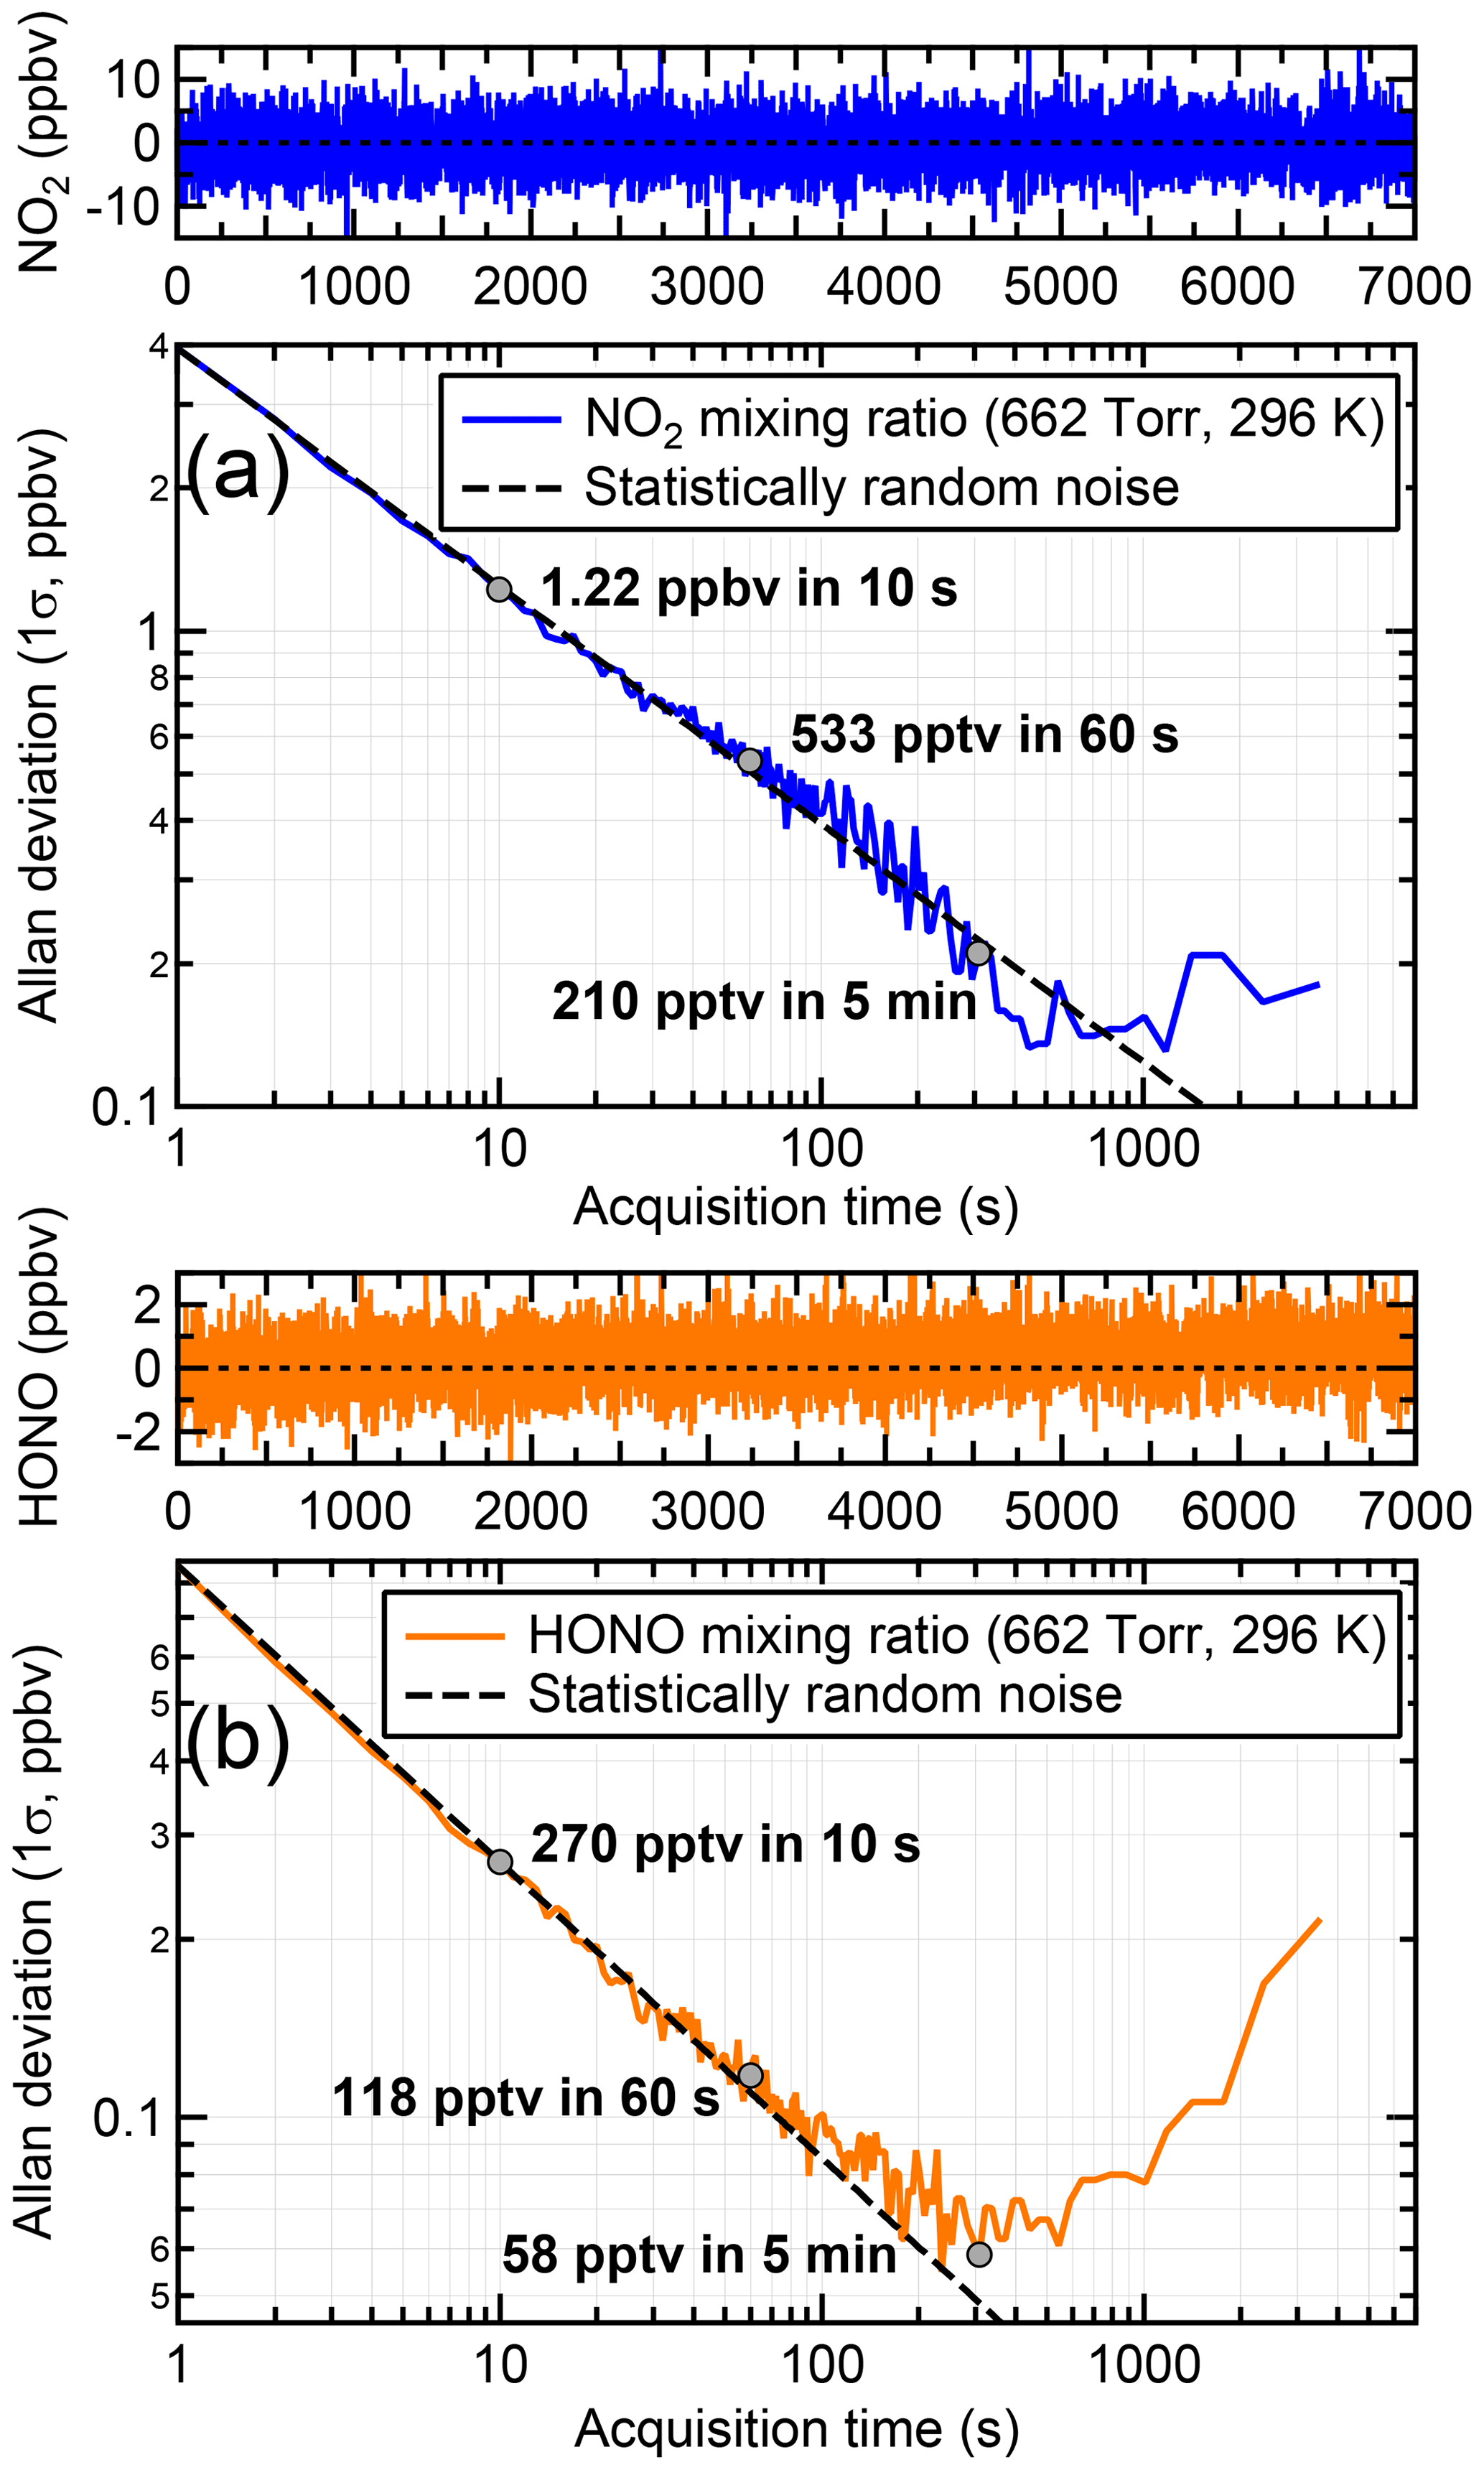
Figure 6Allan deviation plots for (a) NO2 and (b) HONO. The optimum signal averaging time is the inflection point in each variance trace. Each trace was generated by sampling zero air through HODOR for 2 h at a flow rate of 2 slpm and at ambient pressure (∼880 hPa) and temperature (296 K), followed by calculation of the absorption coefficient and fitting of the respective convolved absorption cross sections.
Several factors limit the accuracy of IBBCEAS retrievals: the mirror reflectivity (±2.3 %), RL (±5 %), the fit retrieval error (±2 %–4 %), the literature absorption cross sections of HONO (±5 %) and NO2 (±4 %), calibration errors in the sample mass flow controller (±1 %), cell pressure (±0.7 %), and cell temperature (±0.5 %). Assuming that these errors are independent, the overall uncertainties, when summed in quadrature (Min et al., 2016), are calculated to 7.3 %–8.1 % and 7.8 %–8.6 % for NO2 and HONO, respectively.
Not included in this estimate are potential systematic errors resulting from the spectral convolution and fitting procedure (Sect. 2.4), photolysis of the fitted species within the optical cavity, and potential inlet artefacts (which were not characterized under atmospheric conditions). Both NO2 and HONO can photodissociate when exposed to light in the 360 to 390 nm wavelength region, which is of potential concern in IBBCEAS instruments that utilize ever-more powerful LEDs (Table 1). Calculations of the photolysis frequencies within the optical cavity are challenging because neither the amount of power injected into the optical cavity nor the beam shape (i.e., divergence) are well known. A rough calculation using a mirror reflectivity of R(λ)∼0.9998 and assuming 500 mW of near-UV light that is coupled into the optical cavity and NO2 and HONO absorption cross sections of and cm2 molecule−1, respectively (Burkholder et al., 2015), gives j(NO2) and j(HONO) of 0.04 and 0.01 s−1 within the sample region. When the IBBCEAS is operated at a flow rate of 2 slpm, the total residence time is ∼5.5 s and sufficiently long that photolysis could occur, biasing the retrieved NO2 and HONO mixing ratios low. The excellent agreement with CRDS NO2 and TD-CRDS HONO data and their linear correlation, however, suggest that photodissociation of NO2 and HONO are negligible. If it had occurred, it could have been suppressed simply by sampling at a higher flow rate.
3.6 Sample ambient air measurements
Figure 7 shows a time series of ambient air HONO and NO2 data over a 4 d period, averaged to 5 min. Mixing ratios of NO2 ranged from 0.6 to 45.1 ppbv (median 6.0 ppbv) and those of HONO from below the detection limit up to 1.97 ppbv (median 0.42 ppbv). Larger HONO mixing ratios were generally observed at night, which is not surprising given the lack of photolysis sinks at that time of day.
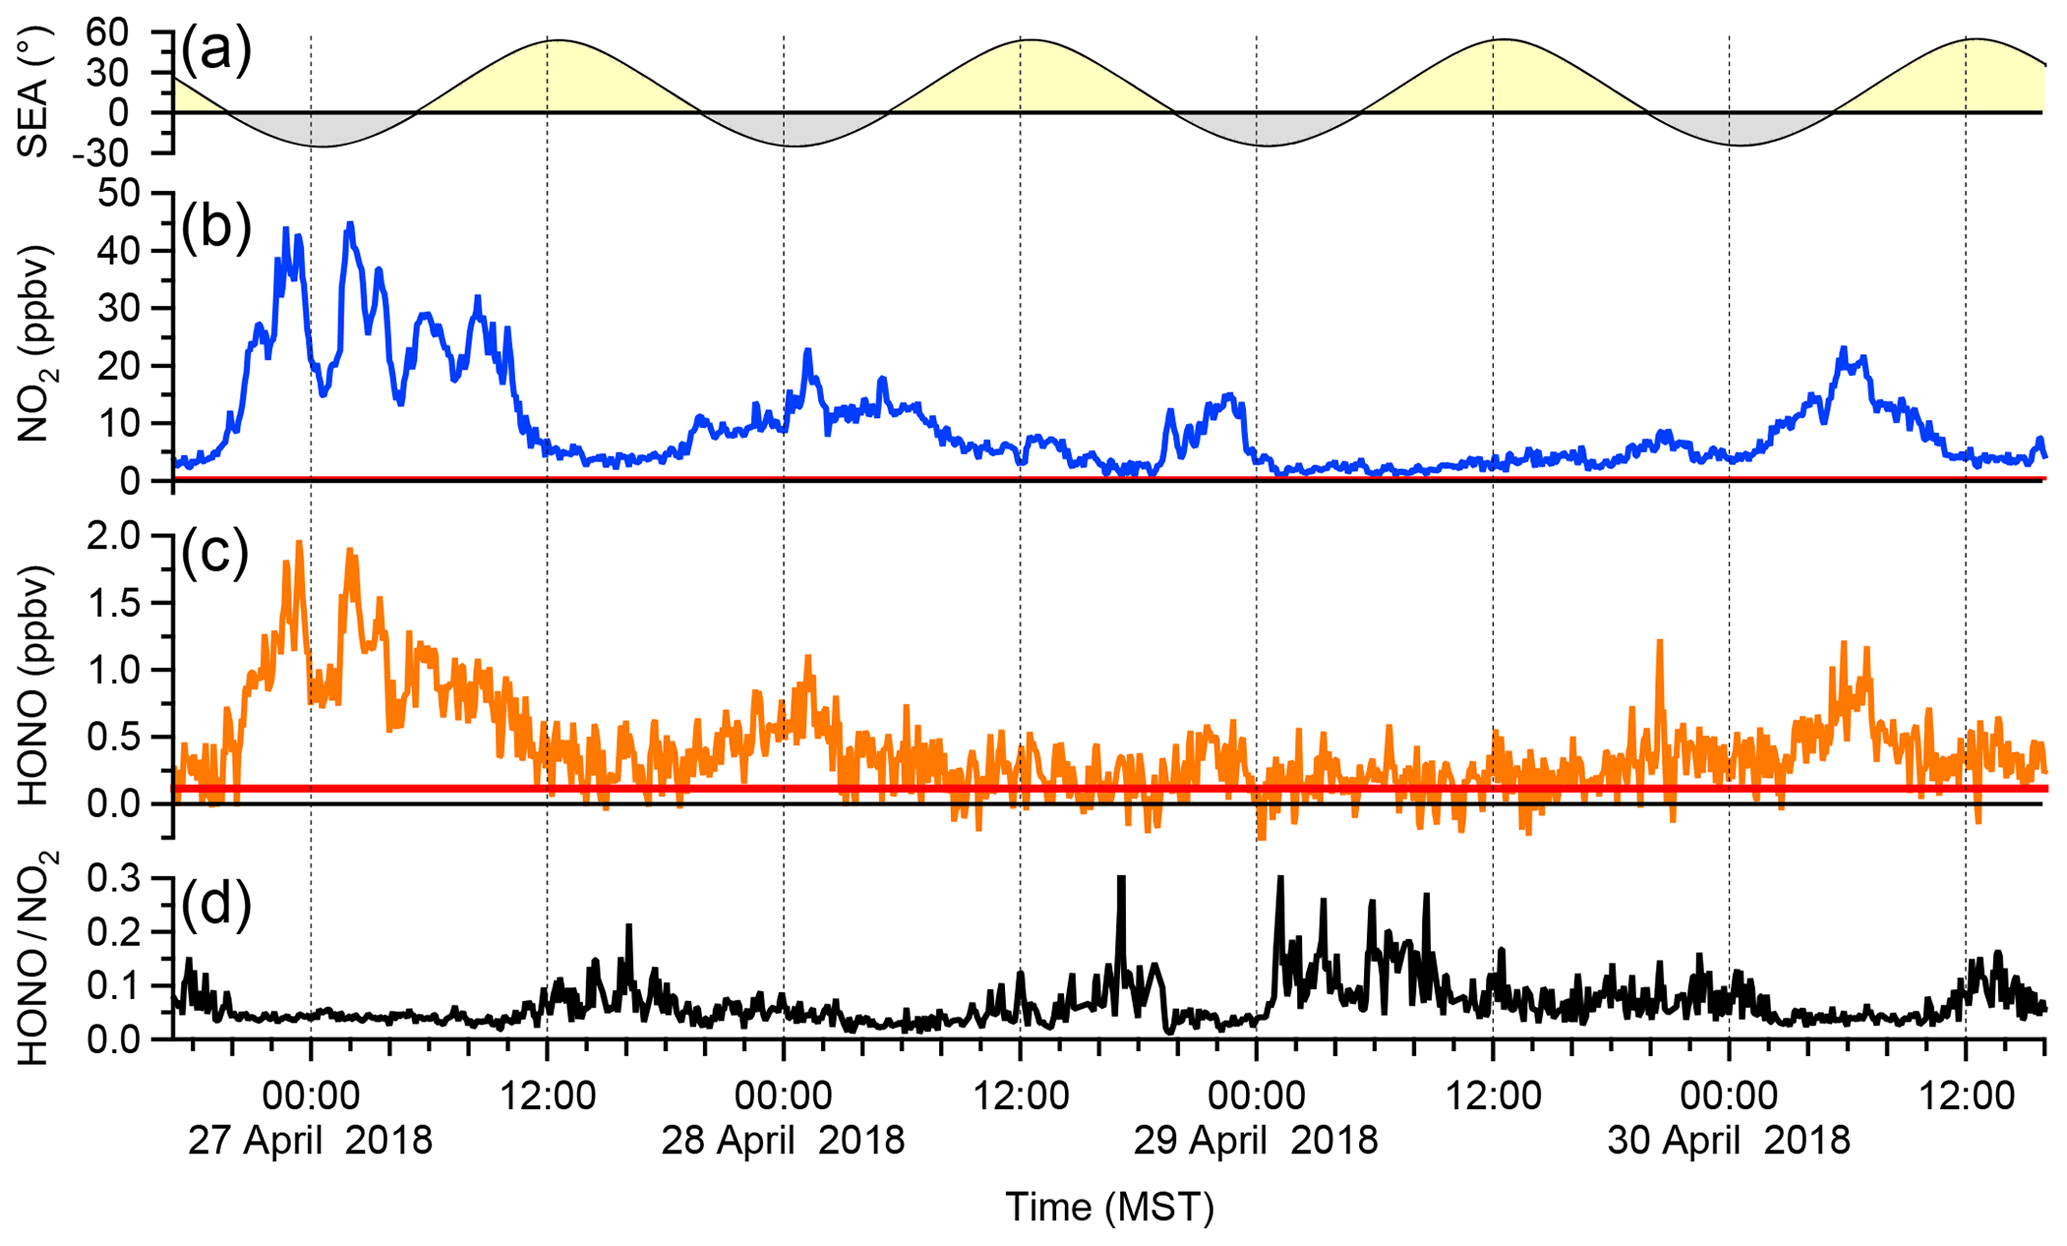
Figure 7Sample ambient air data. (a) Solar elevation angle (SEA) with the yellow and grey shading symbolizing night and day. (b) IBBCEAS NO2 mixing ratios (c) IBBCEAS HONO mixing ratios. The red solid lines indicate the IBBCEAS LOD (2σ level). (d) HONO:NO2 ratio calculated from the above. Points below the LOD of HONO were removed from panel (d) prior to presentation.
A frequently used diagnostic is the HONO:NO2 ratio (Fig. 7d); its median value was 4.5 %, with lower values observed at night (median of 4.0 % at 06:00) than during the day (median of 6.2 % at 14:00). The nocturnal values are on par with those reported by Wong et al. (2011) for their lowest-elevation light path in Houston, Texas, USA, and are thus reasonable. On the other hand, the daytime ratios are surprisingly large. Daytime HONO formation has been an enigma for some time: while traffic emissions generally exhibit HONO:NO2 ratios of <2 % (Lee et al., 2013), many other daytime sources of HONO have been recognized, including conversion of NO2 on surfaces containing photosensitizers such as soot (Stemmler et al., 2007) or photolysis of HNO3 (Zhou et al., 2011), sources that are active near the ground where the IBBCEAS was sampling. The nature of the daytime HONO source is outside the scope of this paper and will be investigated in future studies.
This paper has described an IBBCEAS instrument for the quantification of HONO and NO2 in ambient air using their absorption in the 361–388 nm wavelength region. The measurement precision (2σ) was ±117 and ±420 pptv (300 s) for HONO and NO2, respectively, and is on par with recent instruments described in the literature (Table 1). The combination of mirror reflectivity and cavity length produced path length of 6 km from a 1 m long cavity, i.e., better than most works, with the exception of Gherman et al. (2008), who used a longer cavity (4.5 m) to achieve a path length enhancement of 7.5 km, and the work of Scharko et al. (2014), who used slightly more reflective mirrors (99.986 % vs. this work's 99.981 %) and a cavity of approximately the same length. The 60 s HODOR LOD was 240 pptv and of similar magnitude to the LODs of 180 pptv reported by Duan et al. (2018) and of 200 pptv reported by Nakashima and Sadanaga (2017) and are hence on par with state-of-the-art instruments.
One of the challenges we encountered in the accurate retrieval of NO2 and HONO was the convolution procedure and choice of cross section. Literature values for NO2 vary by up to ±6.2 % (Harder et al., 1997; Burrows et al., 1998; Vandaele et al., 1998), such that the choice may introduce a systematic bias. In addition, some NO2 reference spectra have been reported to contain HONO as an impurity (Kleffmann et al., 2006). Though not performed in this work, it may be advisable to use one's own reference spectra in future IBBCEAS NO2 and HONO retrievals.
An ongoing issue in the measurement of HONO in ambient air are measurement differences such as those described in Crilley et al. (2019) that are occasionally larger than expected from stated instrumental uncertainties. Mixing ratios measured by the IBBCEAS instrument described in this work were compared with blue diode laser CRDS NO2 and TD-CRDS HONO and found to be in agreement. However, the agreement for HONO was somewhat fortuitous, given that a large TD-CRDS correction factor was necessary to account for undertitration of the NO generated from TD of HONO. Due diligence needs to be exercised in future measurements to verify the accuracy of NO2 and HONO retrievals.
Though not examined in this work, interferences may arise when sampling for long periods in heavily polluted environments from soot deposition on inlet filters and walls. In such situations, it would be advisable to monitor inlets for HONO production (or loss) upon aging, for example using a setup such as that recently described by Duan et al. (2018).
The data used in this study are available from the corresponding author upon request (hosthoff@ucalgary.ca).
The supplement related to this article is available online at: https://doi.org/10.5194/amt-13-273-2020-supplement.
NJ and HDO designed the experiments and carried them out.
The authors declare that they have no conflict of interest.
This research has been supported by the Natural Sciences and Engineering Research Council of Canada (NSERC (discovery grant no. RGPIN/03849-2016)), of the Canadian Foundation for Innovation (CFI) (Leadership Opportunity Fund (LOF) (grant no. 17785)), and by the Government of Alberta's Advanced Education and Technology (AET) Small Equipment Grants Program (SEGP (project no. 10-018-SEG)).
This paper was edited by Mingjin Tang and reviewed by four anonymous referees.
Alicke, B., Platt, U., and Stutz, J.: Impact of nitrous acid photolysis on the total hydroxyl radical budget during the Limitation of Oxidant Production/Pianura Padana Produzione di Ozono study in Milan, J. Geophys. Res., 107, D228196, https://doi.org/10.1029/2000jd000075, 2002.
Bates, D. R.: Rayleigh scattering by air, Planet. Space Sci., 32, 785–790, https://doi.org/10.1016/0032-0633(84)90102-8, 1984.
Bodhaine, B. A., Wood, N. B., Dutton, E. G., and Slusser, J. R.: On Rayleigh optical depth calculations, J. Atmos. Ocean. Tech., 16, 1854–1861, https://doi.org/10.1175/1520-0426(1999)016<1854:ORODC>2.0.CO;2, 1999.
Burkholder, J. B., Sander, S. P., Abbatt, J. P. D., Barker, J. R., Huie, R. E., Kolb, C. E., Kurylo, M. J., Orkin, V. L., Wilmouth, D. M., and Wine, P. H.: Chemical Kinetics and Photochemical Data for Use in Atmospheric Studies, Evaluation Number 18, National Aeronautics and Space Administration, Jet Propulsion Laboratory, California Institute of Technology, Pasadena, California, 2015.
Burrows, J. P., Dehn, A., Deters, B., Himmelmann, S., Richter, A., Voigt, S., and Orphal, J.: Atmospheric remote-sensing reference data from GOME: Part 1. Temperature-dependent absorption cross-sections of NO2 in the 231–794 nm range, J. Quant. Spectrosc. Ra., 60, 1025–1031, https://doi.org/10.1016/S0022-4073(97)00197-0, 1998.
Collins, D. B., Hems, R. F., Zhou, S. M., Wang, C., Grignon, E., Alavy, M., Siegel, J. A., and Abbatt, J. P. D.: Evidence for Gas-Surface Equilibrium Control of Indoor Nitrous Acid, Environ. Sci. Technol., 52, 12419–12427, https://doi.org/10.1021/acs.est.8b04512, 2018.
Crilley, L. R., Kramer, L. J., Ouyang, B., Duan, J., Zhang, W., Tong, S., Ge, M., Tang, K., Qin, M., Xie, P., Shaw, M. D., Lewis, A. C., Mehra, A., Bannan, T. J., Worrall, S. D., Priestley, M., Bacak, A., Coe, H., Allan, J., Percival, C. J., Popoola, O. A. M., Jones, R. L., and Bloss, W. J.: Intercomparison of nitrous acid (HONO) measurement techniques in a megacity (Beijing), Atmos. Meas. Tech., 12, 6449–6463, https://doi.org/10.5194/amt-12-6449-2019, 2019.
Cuthbertson, C. and Cuthbertson, M.: The refraction and dispersion of neon and helium, P. Roy. Soc. Lond. A-Mat., 135, 40–47, https://doi.org/10.1098/rspa.1932.0019, 1932.
Donaldson, M. A., Berke, A. E., and Raff, J. D.: Uptake of Gas Phase Nitrous Acid onto Boundary Layer Soil Surfaces, Environ. Sci. Technol., 48, 375–383, https://doi.org/10.1021/es404156a, 2014.
Duan, J., Qin, M., Ouyang, B., Fang, W., Li, X., Lu, K., Tang, K., Liang, S., Meng, F., Hu, Z., Xie, P., Liu, W., and Häsler, R.: Development of an incoherent broadband cavity-enhanced absorption spectrometer for in situ measurements of HONO and NO2, Atmos. Meas. Tech., 11, 4531–4543, https://doi.org/10.5194/amt-11-4531-2018, 2018.
Fiedler, S. E., Hese, A., and Ruth, A. A.: Incoherent broad-band cavity-enhanced absorption spectroscopy, Chem. Phys. Lett., 371, 284–294, https://doi.org/10.1016/s0009-2614(03)00263-x, 2003.
Gherman, T., Venables, D. S., Vaughan, S., Orphal, J., and Ruth, A. A.: Incoherent broadband cavity-enhanced absorption spectroscopy in the near-ultraviolet: Application to HONO and NO2, Environm. Sci. Technol., 42, 890–895, https://doi.org/10.1021/es0716913, 2008.
Hanst, P. L., Wong, N. W., and Bragin, J.: A long-path infrared study of Los-Angeles smog, Atmos. Environ., 16, 969–981, https://doi.org/10.1016/0004-6981(82)90183-4, 1982.
Harder, J. W., Brault, J. W., Johnston, P. V., and Mount, G. H.: Temperature dependent NO2 cross sections at high spectral resolution, J. Geophys. Res., 102, 3861–3879, https://doi.org/10.1029/96jd03086, 1997.
Harrison, R. M., Peak, J. D., and Collins, G. M.: Tropospheric cycle of nitrous acid, J. Geophys. Res., 101, 14429–14439, https://doi.org/10.1029/96jd00341, 1996.
Indarto, A.: Heterogeneous reactions of HONO formation from NO2 and HNO3: a review, Res. Chem. Intermediat., 38, 1029–1041, https://doi.org/10.1007/s11164-011-0439-z, 2012.
Jordan, N., Ye, C. Z., Ghosh, S., Washenfelder, R. A., Brown, S. S., and Osthoff, H. D.: A broadband cavity-enhanced spectrometer for atmospheric trace gas measurements and Rayleigh scattering cross sections in the cyan region (470–540 nm), Atmos. Meas. Tech., 12, 1277–1293, https://doi.org/10.5194/amt-12-1277-2019, 2019.
Kalberer, M., Ammann, M., Arens, F., Gäggeler, H. W., and Baltensperger, U.: Heterogeneous formation of nitrous acid (HONO) on soot aerosol particles, J. Geophys. Res., 104, 13825–13832, https://doi.org/10.1029/1999jd900141, 1999.
Kleffmann, J., Lorzer, J. C., Wiesen, P., Kern, C., Trick, S., Volkamer, R., Rodenas, M., and Wirtz, K.: Intercomparison of the DOAS and LOPAP techniques for the detection of nitrous acid (HONO), Atmos. Environ., 40, 3640–3652, https://doi.org/10.1016/j.atmosenv.2006.03.027, 2006.
Kraus, S.: DOAS Intelligent System, Version 3.2.3505, Institute of Environmental Physics, University of Heidelberg, available at: https://doasis.iup.uni-heidelberg.de/bugtracker/projects/doasis/ (last access: 31 August 2018), 2003.
Lampel, J., Pöhler, D., Polyansky, O. L., Kyuberis, A. A., Zobov, N. F., Tennyson, J., Lodi, L., Frieß, U., Wang, Y., Beirle, S., Platt, U., and Wagner, T.: Detection of water vapour absorption around 363 nm in measured atmospheric absorption spectra and its effect on DOAS evaluations, Atmos. Chem. Phys., 17, 1271–1295, https://doi.org/10.5194/acp-17-1271-2017, 2017.
Langridge, J. M., Ball, S. M., and Jones, R. L.: A compact broadband cavity enhanced absorption spectrometer for detection of atmospheric NO2 using light emitting diodes, Analyst, 131, 916–922, https://doi.org/10.1039/B605636A, 2006.
Lee, B. H., Wood, E. C., Zahniser, M. S., McManus, J. B., Nelson, D. D., Herndon, S. C., Santoni, G. W., Wofsy, S. C., and Munger, J. W.: Simultaneous measurements of atmospheric HONO and NO2 via absorption spectroscopy using tunable mid-infrared continuous-wave quantum cascade lasers, Appl. Phys. B-Lasers O., 102, 417–423, https://doi.org/10.1007/s00340-010-4266-5, 2011.
Lee, B. H., Wood, E. C., Herndon, S. C., Lefer, B. L., Luke, W. T., Brune, W. H., Nelson, D. D., Zahniser, M. S., and Munger, J. W.: Urban measurements of atmospheric nitrous acid: A caveat on the interpretation of the HONO photostationary state, J. Geophys. Res., 118, 12274–12281, https://doi.org/10.1002/2013jd020341, 2013.
Legrand, M., Preunkert, S., Frey, M., Bartels-Rausch, Th., Kukui, A., King, M. D., Savarino, J., Kerbrat, M., and Jourdain, B.: Large mixing ratios of atmospheric nitrous acid (HONO) at Concordia (East Antarctic Plateau) in summer: a strong source from surface snow?, Atmos. Chem. Phys., 14, 9963–9976, https://doi.org/10.5194/acp-14-9963-2014, 2014.
Longfellow, C. A., Ravishankara, A. R., and Hanson, D. R.: Reactive uptake on hydrocarbon soot: Focus on NO2, J. Geophys. Res., 104, 13833–13840, https://doi.org/10.1029/1999jd900145, 1999.
Loock, H. P. and Wentzell, P. D.: Detection limits of chemical sensors: Applications and misapplications, Sensor. Actuat. B-Chem., 173, 157–163, https://doi.org/10.1016/j.snb.2012.06.071, 2012.
Mielke, L. H., Furgeson, A., and Osthoff, H. D.: Observation of ClNO2 in a mid-continental urban environment, Environ. Sci. Technol., 45, 8889–8896, https://doi.org/10.1021/es201955u, 2011.
Mielke, L. H., Furgeson, A., Odame-Ankrah, C. A., and Osthoff, H. D.: Ubiquity of ClNO2 in the nocturnal boundary layer of Calgary, AB, Canada, Can. J. Chem., 94, 414–423, https://doi.org/10.1139/cjc-2015-0426, 2016.
Min, K.-E., Washenfelder, R. A., Dubé, W. P., Langford, A. O., Edwards, P. M., Zarzana, K. J., Stutz, J., Lu, K., Rohrer, F., Zhang, Y., and Brown, S. S.: A broadband cavity enhanced absorption spectrometer for aircraft measurements of glyoxal, methylglyoxal, nitrous acid, nitrogen dioxide, and water vapor, Atmos. Meas. Tech., 9, 423–440, , 2016.
Nakashima, Y. and Sadanaga, Y.: Validation of in situ Measurements of Atmospheric Nitrous Acid Using Incoherent Broadband Cavity-enhanced Absorption Spectroscopy, Anal. Sci., 33, 519–524, https://doi.org/10.2116/analsci.33.519, 2017.
Nash, T.: Nitrous acid in the atmosphere and laboratory experiments on its photolysis, Tellus, 26, 175–179, https://doi.org/10.3402/tellusa.v26i1-2.9768, 1974.
Odame-Ankrah, C. A. and Osthoff, H. D.: A compact diode laser cavity ring-down spectrometer for atmospheric measurements of NO3 and N2O5 with automated zeroing and calibration, Appl. Spectrosc., 65, 1260–1268, https://doi.org/10.1366/11-06384, 2011.
Odame-Ankrah, C. A.: Improved detection instrument for nitrogen oxide species, PhD theses, Chemistry, University of Calgary, Calgary, https://doi.org/10.5072/PRISM/26475, 2015.
Paul, D. and Osthoff, H. D.: Absolute Measurements of Total Peroxy Nitrate Mixing Ratios by Thermal Dissociation Blue Diode Laser Cavity Ring-Down Spectroscopy, Anal. Chem., 82, 6695–6703, https://doi.org/10.1021/ac101441z, 2010.
Peck, E. R. and Fisher, D. J.: Dispersion of argon, J. Opt. Soc. Am., 54, 1362–1364, https://doi.org/10.1364/josa.54.001362, 1964.
Peck, E. R. and Khanna, B. N.: Dispersion of nitrogen, J. Opt. Soc. Am., 56, 1059–1063, https://doi.org/10.1364/josa.56.001059, 1966.
Perez, I. M., Wooldridge, P. J., and Cohen, R. C.: Laboratory evaluation of a novel thermal dissociation chemiluminescence method for in situ detection of nitrous acid, Atmos. Environ., 41, 3993–4001, https://doi.org/10.1016/j.atmosenv.2007.01.060, 2007.
Pinto, J. P., Dibb, J., Lee, B. H., Rappengluck, B., Wood, E. C., Levy, M., Zhang, R. Y., Lefer, B., Ren, X. R., Stutz, J., Tsai, C., Ackermann, L., Golovko, J., Herndon, S. C., Oakes, M., Meng, Q. Y., Munger, J. W., Zahniser, M., and Zheng, J.: Intercomparison of field measurements of nitrous acid (HONO) during the SHARP campaign, J. Geophys. Res.-Atmos., 119, 5583–5601, https://doi.org/10.1002/2013jd020287, 2014.
Ren, X. R., Brune, W. H., Mao, J. Q., Mitchell, M. J., Lesher, R. L., Simpas, J. B., Metcalf, A. R., Schwab, J. J., Cai, C. X., Li, Y. Q., Demerjian, K. L., Felton, H. D., Boynton, G., Adams, A., Perry, J., He, Y., Zhou, X. L., and Hou, J.: Behavior of OH and HO2 in the winter atmosphere in New York city, Atmos. Environ., 40, S252–S263, https://doi.org/10.1016/j.atmosenv.2005.11.073, 2006.
Rodenas, M., Munoz, A., Alacreu, F., Brauers, T., Dorn, H. P., Kleffmann, J., and Bloss, W.: Assessment of HONO Measurements: The FIONA Campaign at EUPHORE, in: Disposal of Dangerous Chemicals in Urban Areas and Mega Cities: Role of Oxides and Acids of Nitrogen in Atmospheric Chemistry, edited by: Barnes, I. and Rudzinski, K. J., NATO Science for Peace and Security Series C-Environmental Security, 45–58, 2013.
Scharko, N. K., Berke, A. E., and Raff, J. D.: Release of Nitrous Acid and Nitrogen Dioxide from Nitrate Photolysis in Acidic Aqueous Solutions, Environ. Sci. Technol., 48, 11991–12001, https://doi.org/10.1021/es503088x, 2014.
Schiller, C. L., Locquiao, S., Johnson, T. J., and Harris, G. W.: Atmospheric measurements of HONO by tunable diode laser absorption spectroscopy, J. Atmos. Chem., 40, 275–293, https://doi.org/10.1023/A:1012264601306, 2001.
Shardanand and Rao, A. D. P.: Absolute Rayleigh scattering cross sections of gases and freons of stratospheric interest in the visible and ultraviolet regions, National Aeronautics and Space Administration (NASA), Washington, D.C., NASA TN D-8442, 37 pp., 1977.
Stemmler, K., Ndour, M., Elshorbany, Y., Kleffmann, J., D'Anna, B., George, C., Bohn, B., and Ammann, M.: Light induced conversion of nitrogen dioxide into nitrous acid on submicron humic acid aerosol, Atmos. Chem. Phys., 7, 4237–4248, https://doi.org/10.5194/acp-7-4237-2007, 2007.
Stutz, J., Kim, E. S., Platt, U., Bruno, P., Perrino, C., and Febo, A.: UV-visible absorption cross sections of nitrous acid, J. Geophys. Res., 105, 14585–14592, https://doi.org/10.1029/2000JD900003, 2000.
Taha, Y. M., Odame-Ankrah, C. A., and Osthoff, H. D.: Real-time vapor detection of nitroaromatic explosives by catalytic thermal dissociation blue diode laser cavity ring-down spectroscopy, Chem. Phys. Lett., 582, 15–20, https://doi.org/10.1016/j.cplett.2013.07.040, 2013.
Thalman, R. and Volkamer, R.: Temperature dependent absorption cross-sections of O2-O2 collision pairs between 340 and 630 nm and at atmospherically relevant pressure, Phys. Chem. Chem. Phys., 15, 15371–15381, https://doi.org/10.1039/c3cp50968k, 2013.
Thalman, R., Zarzana, K. J., Tolbert, M. A., and Volkamer, R.: Rayleigh scattering cross-section measurements of nitrogen, argon, oxygen and air, J. Quant. Spectrosc. Ra., 147, 171–177, https://doi.org/10.1016/j.jqsrt.2014.05.030, 2014.
Thalman, R. and Volkamer, R.: Inherent calibration of a blue LED-CE-DOAS instrument to measure iodine oxide, glyoxal, methyl glyoxal, nitrogen dioxide, water vapour and aerosol extinction in open cavity mode, Atmos. Meas. Tech., 3, 1797–1814, https://doi.org/10.5194/amt-3-1797-2010, 2010.
Tsai, C., Spolaor, M., Colosimo, S. F., Pikelnaya, O., Cheung, R., Williams, E., Gilman, J. B., Lerner, B. M., Zamora, R. J., Warneke, C., Roberts, J. M., Ahmadov, R., de Gouw, J., Bates, T., Quinn, P. K., and Stutz, J.: Nitrous acid formation in a snow-free wintertime polluted rural area, Atmos. Chem. Phys., 18, 1977–1996, https://doi.org/10.5194/acp-18-1977-2018, 2018.
Vandaele, A. C., Hermans, C., Simon, P. C., Carleer, M., Colin, R., Fally, S., Mérienne, M. F., Jenouvrier, A., and Coquart, B.: Measurements of the NO2 absorption cross-section from 42 000 cm−1 to 10 000 cm−1 (238–1000 nm) at 220 K and 294 K, J. Quant. Spectrosc. Ra., 59, 171–184, https://doi.org/10.1016/S0022-4073(97)00168-4, 1998.
Vaughan, S., Gherman, T., Ruth, A. A., and Orphal, J.: Incoherent broad-band cavity-enhanced absorption spectroscopy of the marine boundary layer species I2, IO and OIO, Phys. Chem. Chem. Phys., 10, 4471–4477, https://doi.org/10.1039/b802618a, 2008.
Villena, G., Bejan, I., Kurtenbach, R., Wiesen, P., and Kleffmann, J.: Development of a new Long Path Absorption Photometer (LOPAP) instrument for the sensitive detection of NO2 in the atmosphere, Atmos. Meas. Tech., 4, 1663–1676, https://doi.org/10.5194/amt-4-1663-2011, 2011.
Wang, L. M. and Zhang, J. S.: Detection of nitrous acid by cavity ring down spectroscopy, Environ. Sci. Technol., 34, 4221–4227, https://doi.org/10.1021/es0011055, 2000.
Washenfelder, R. A., Langford, A. O., Fuchs, H., and Brown, S. S.: Measurement of glyoxal using an incoherent broadband cavity enhanced absorption spectrometer, Atmos. Chem. Phys., 8, 7779–7793, https://doi.org/10.5194/acp-8-7779-2008, 2008.
Werle, P., Mucke, R., and Slemr, F.: The Limits of Signal Averaging in Atmospheric Trace-Gas Monitoring by Tunable Diode-Laser Absorption-Spectroscopy (TDLAS), Appl. Phys. B-Photo., 57, 131–139, https://doi.org/10.1007/BF00425997, 1993.
Wild, R. J., Edwards, P. M., Dube, W. P., Baumann, K., Edgerton, E. S., Quinn, P. K., Roberts, J. M., Rollins, A. W., Veres, P. R., Warneke, C., Williams, E. J., Yuan, B., and Brown, S. S.: A Measurement of Total Reactive Nitrogen, NOy, together with NO2, NO, and O3 via Cavity Ring-down Spectroscopy, Environ. Sci. Technol., 48, 9609–9615, https://doi.org/10.1021/es501896w, 2014.
Wong, K. W., Oh, H.-J., Lefer, B. L., Rappenglück, B., and Stutz, J.: Vertical profiles of nitrous acid in the nocturnal urban atmosphere of Houston, TX, Atmos. Chem. Phys., 11, 3595–3609, https://doi.org/10.5194/acp-11-3595-2011, 2011.
Woodward-Massey, R., Taha, Y. M., Moussa, S. G., and Osthoff, H. D.: Comparison of negative-ion proton-transfer with iodide ion chemical ionization mass spectrometry for quantification of isocyanic acid in ambient air, Atmos. Environ., 98, 693–703, https://doi.org/10.1016/j.atmosenv.2014.09.014, 2014.
Wu, T., Zha, Q., Chen, W., Xu, Z., Wang, T., and He, X.: Development and deployment of a cavity enhanced UV-LED spectrometer for measurements of atmospheric HONO and NO2 in Hong Kong, Atmos. Environm., 95, 544–551, https://doi.org/10.1016/j.atmosenv.2014.07.016, 2014.
Zhou, X., Zhang, N., TerAvest, M., Tang, D., Hou, J., Bertman, S., Alaghmand, M., Shepson, P. B., Carroll, M. A., Griffith, S., Dusanter, S., and Stevens, P. S.: Nitric acid photolysis on forest canopy surface as a source for tropospheric nitrous acid, Nat. Geosci., 4, 440–443, https://doi.org/10.1038/ngeo1164, 2011.