the Creative Commons Attribution 4.0 License.
the Creative Commons Attribution 4.0 License.
 | 29 May 2020
Development of a new correction algorithm applicable to any filter-based absorption photometer
Hanyang Li
Gavin R. McMeeking
Among the various measurement approaches to quantify the light absorption coefficient (Babs), filter-based absorption photometers are dominant in monitoring networks around the globe. Numerous correction algorithms have been introduced to minimize the artifacts due to the presence of the filter in these instruments. However, from our recent studies conducted during the Fire Influence on Regional and Global Environments Experiment (FIREX) laboratory campaign, corrected filter-based Babs remains biased high by roughly a factor of 2.5 when compared to a reference value using a photoacoustic instrument for biomass burning emissions. Similar overestimations of Babs from filter-based instruments exist when implementing the algorithms on 6 months of ambient data from the Department of Energy (DOE) Atmospheric Radiation Measurement (ARM) Southern Great Plains (SGP) user facility from 2013 (factor of roughly 3). In both datasets, we observed an apparent dependency on single-scattering albedo (SSA) and the absorption Ångström exponent (AAE) in the agreement between Babs based on existing correction factors and the reference Babs. Consequently, we developed a new correction approach that is applicable to any filter-based absorption photometer that includes light transmission from the filter-based instrument as well as the derived AAE and SSA. For the FIREX and SGP datasets, our algorithm results in good agreement between all corrected filter-based Babs values from different filter-based instruments and the reference (slopes ≈1 and R2≈0.98 for biomass burning aerosols and slopes ≈1.05 and R2≈0.65 for ambient aerosols). Moreover, for both the corrected Babs and the derived optical properties (SSA and AAE), our new algorithms work better or at least as well as the two common correction algorithms applied to a particle soot absorption photometer (PSAP). The uncertainty of the new correction algorithm is estimated to be ∼10 %, considering the measurement uncertainties of the operated instruments. Therefore, our correction algorithm is applicable to any filter-based absorption photometer and has the potential to “standardize” reported results across any filter-based instrument.
- Article
(3625 KB) -
Supplement
(2590 KB) - BibTeX
- EndNote


Light-absorbing atmospheric aerosols directly affect the Earth's energy budget by absorbing solar radiation, leading to a warming effect when they are suspended in the atmosphere and to the melting of snow and ice following deposition (Bond and Bergstrom, 2006; Boucher, 2015; Horvath, 1993). For decades, scientists have conducted field experiments around the globe to investigate how absorbing aerosols influence the atmospheric radiative balance and interact with clouds (e.g., Andrews et al., 2011; Cappa et al., 2016; Lack et al., 2008b; Rajesh and Ramachandran, 2018; Schwarz et al., 2008). These experiments may be performed at fixed stations (e.g., observation sites maintained by the Department of Energy (DOE) Atmospheric Radiation Measurement (ARM) program or the National Oceanic and Atmospheric Administration (NOAA) Global Monitoring Division – GMD) or on mobile platforms (e.g., car trailer, aircraft, ship), typically involving measurements of aerosol chemical, physical, and optical properties. Crucial to the quantification of the radiative forcing of absorbing aerosols are measurements of the absorption coefficient (Babs). For example, long-term monitoring of Babs provides essential data to evaluate chemistry–climate model simulations (e.g., Chen et al., 2019; Vignati et al., 2010), while intensive measurements of Babs during short-term field campaigns allow for the investigation of optical properties that govern features of aerosol forcing (e.g., McMeeking et al., 2014; Olson et al., 2015).
A variety of instruments have been used to measure Babs, which are generally classified into two large categories: filter-based techniques and photoacoustic techniques (Lack et al., 2014; Moosmüller et al., 2009). The major difference between the two categories of techniques is that Babs is measured after the aerosols are deposited on the filter media in filter-based instruments, while the aerosols are characterized within an airstream in photoacoustic instruments. Compared to filter-based instruments, photoacoustic instruments have the advantage of avoiding potential artifacts due to the contact of aerosols with filters; therefore, they are often used as the reference instruments in intercomparison studies of aerosol absorption (e.g., Arnott et al., 2005; Davies et al., 2019; Jiang et al., 2018; Li et al., 2019; Schmid et al., 2006; Sheridan et al., 2005).
Filter-based absorption photometers have been widely used at observational sites around the world due to their ease of operation and relatively low cost. Numerous instruments can be classified as filter-based absorption photometers including the Radiance Research Particle Soot Absorption Photometer (PSAP), the NOAA Continuous Light Absorption Photometer (CLAP), the Brechtel Manufacturing Tricolor Absorption Photometer (TAP), the Magee Scientific Aethalometer (AETH), and the Thermo Scientific Multi-Angle Absorption Photometer (MAAP). Operationally, all of these instruments are similar in that aerosols are deposited onto a filter and the reduction in the transmission (Tr) of light by the particles (sometimes called attenuation – ATN) is used to infer Babs. Where the instruments may differ is that some are multiwavelength (multi-λ) instruments (e.g., 3λ-PSAP, CLAP, TAP, 7λ-AETH models), while others are not (e.g., 1λ-PSAP, other AETH models, MAAP).
One challenge with filter-based absorption photometers is that biases can arise due to the presence of the filter. For example, light scattering by particles loaded onto the filter or by the filter itself may affect the transmission of light (e.g., Arnott et al., 2005; Bond et al., 1999); non-absorbing material may result in absorption enhancement (e.g., Cappa et al., 2008), or organic vapors adsorbed to the filter may absorb light (e.g., Subramanian et al., 2007). Consequently, various correction algorithms exist to minimize these biases, but they are often specific only to certain instruments. For example, some are applicable to the PSAP, CLAP, and TAP (e.g., Bond et al., 1999; Müller et al., 2014; Ogren, 2010; Virkkula, 2010; Virkkula et al., 2005), while others are applicable to the AETH (e.g., Arnott et al., 2005; Collaud Coen et al., 2010; Drinovec et al., 2017; Kirchstetter and Novakov, 2007; Schmid et al., 2006; Virkkula et al., 2007, 2015; Weingartner et al., 2003).
Although the equations associated with these existing correction algorithms are different, they share some commonalities. For example, filter-based absorption photometers are assessed using laboratory (e.g., ammonium sulfate, fullerene soot) or ambient aerosols during experiments, which include reference measurements of Babs. These reference measurements often include either direct photoacoustic Babs or inferred Babs as the difference between the extinction coefficient (Bext) and the scattering coefficient (Bscat). Correction equations are developed by comparing data between the filter-based instrument and the reference instrument, and the equations often contain one term that accounts for filter loading effects and another that accounts for multiple-scattering effects. Consequently, the correction equations frequently incorporate both Tr and either Bscat or the single-scattering albedo (SSA) to account for these effects. However, even when the correction algorithms are applied, potential issues can remain, such as the following.
-
Corrected filter-based Babs may remain biased high relative to a reference value of Babs (e.g., Arnott et al., 2003; Davies et al., 2019; Lack et al., 2008a; Li et al., 2019; Müller et al., 2011a).
-
Comparisons between the reference instrument and Babs corrected by different algorithms can yield variable agreement (e.g., Collaud Coen et al., 2010; Davies et al., 2019; Saturno et al., 2017).
-
Corrected Babs from different filter-based absorption photometers may not agree (e.g., Davies et al., 2019; Müller et al., 2011a).
-
Derived products (such as absorption Ångström exponents – AAEs) may differ based on the implemented correction algorithm (e.g., Backman et al., 2014; Davies et al., 2019).
-
The agreement between measurements of Babs and estimates of Babs by chemistry–climate models may vary based on the implemented correction algorithm (e.g., Alvarado et al., 2016).
The first three issues in this list may arise due to differences in aerosol optical properties between those used in deriving the correction equation and those associated with a given aerosol sample, and these issues can propagate through to the fourth issue. The final issue is arguably most important because the evaluation of chemistry–climate models may be severely affected by the differences between different correction algorithms, which may inhibit the modeling community from providing accurate projections of future temperature and precipitation response.
In this work, we seek to address some of these issues. First, we evaluate the CLAP, TAP, and PSAP using two common PSAP-based correction algorithms, namely Bond et al. (1999) as updated by Ogren (2010) and Virkkula et al. (2005) as updated by Virkkula (2010). For brevity, we refer to these corrections as B1999 and V2005 for Bond et al. (1999) and Virkkula et al. (2005), respectively, incorporating their respective updates. In addition, we propose new correction algorithms that are applicable to any filter-based absorption photometer (e.g., CLAP, TAP, PSAP, and AETH) across multiple wavelengths by combining observed filter-based Babs with Bscat (e.g., from a colocated nephelometer – NEPH) and reference Babs (e.g., from a colocated photoacoustic instrument). However, in reality (e.g., at long-term observatories), reference values of Babs are rare, and in some cases, complementary Bscat measurements may not exist; consequently, we also provide methods to correct filter-based Babs data in these scenarios. To our knowledge, this is the first study to simultaneously evaluate B1999 and V2005 corrections on PSAP “successors” (i.e., CLAP and TAP) and to present a correction algorithm that is broadly applicable to any filter-based absorption photometer. Regarding the latter, even if our correction algorithm has its own limitations, its use can nevertheless standardize the reporting of Babs in long-term datasets.
We developed the general form for our correction algorithms using CLAP and TAP measurements collected from biomass burning (65 fires in total) during the Fire Influence on Regional to Global Environments Experiment (FIREX) laboratory campaign in 2016. By using biomass burning emissions, we considered a dataset spanning a broader range of aerosol optical properties (SSA at 652 nm: 0.14–0.98; AAE: 1.25–4.73) than has traditionally been used in developing these correction algorithms. We then conducted a further evaluation and validation of the model using ambient data, specifically using CLAP measurements from the DOE ARM Southern Great Plains (SGP) user facility in Lamont, OK, USA (1 February to 9 July 2013). Our algorithms were then extended to the AETH data from the FIREX laboratory campaign and the PSAP data collected at the SGP site to verify the generalizability of the algorithms.
2.1 The FIREX campaign
2.1.1 Experimental setup
In October and November of 2016, we participated in the laboratory portion of the FIREX campaign to investigate wildfire smoke and its impact on the atmosphere. During the campaign, over 100 burns took place at the US Forest Service's combustion facility at the Fire Sciences Laboratory (FSL). The fuels burned in this study are representative of western US ecosystems, such as spruce, fir, various pines, and “chaparral” biome (e.g., manzanita, chamise; see Koss et al., 2018, and Selimovic et al., 2018, for more details).
A typical burn lasted for 1–3 h depending on the smoke sampling strategies (e.g., stack burns versus room burns). During each burn, one or multiple “snapshots” of smoke (typical Babsat 652 nm ranged from 100 to 1200 Mm−1) were transferred from the combustion room at FSL into a mixing chamber (210 L) through a long transfer duct (30 m in length, 8′′ in diameter). The smoke was then diluted by filter air (∼230 liters per minute – LPM) in the chamber. Once the concentration in the chamber was stable (detected by the photoacoustic extinctiometer (PAX), which was operated continuously through all fires), the smoke was passed to a suite of instruments to obtain aerosol- and gas-phase parameters. This chamber also served as an intermediate between the transfer duct and the instrumentation to minimize potential biases that arose due to different sample flow rates and sample locations of the instruments. A more detailed description of our experiments can be found in Li et al. (2019).
2.1.2 Measurements of aerosol optical properties
During the campaign, five instruments provided measurements of Babs (CLAP, NOAA GMD; TAP, Brechtel Manufacturing Inc. – BMI; Aethalometer, model AETH-31, Magee Scientific; two PAXs, model PAX-870 and PAX-405, Droplet Measurement Technologies), and two instruments provided measurements of Bscat (PAX-870 and PAX-405). The instruments included in the present work are summarized in Table 1.
Table 1Summary of specifications for instruments relevant to this work.
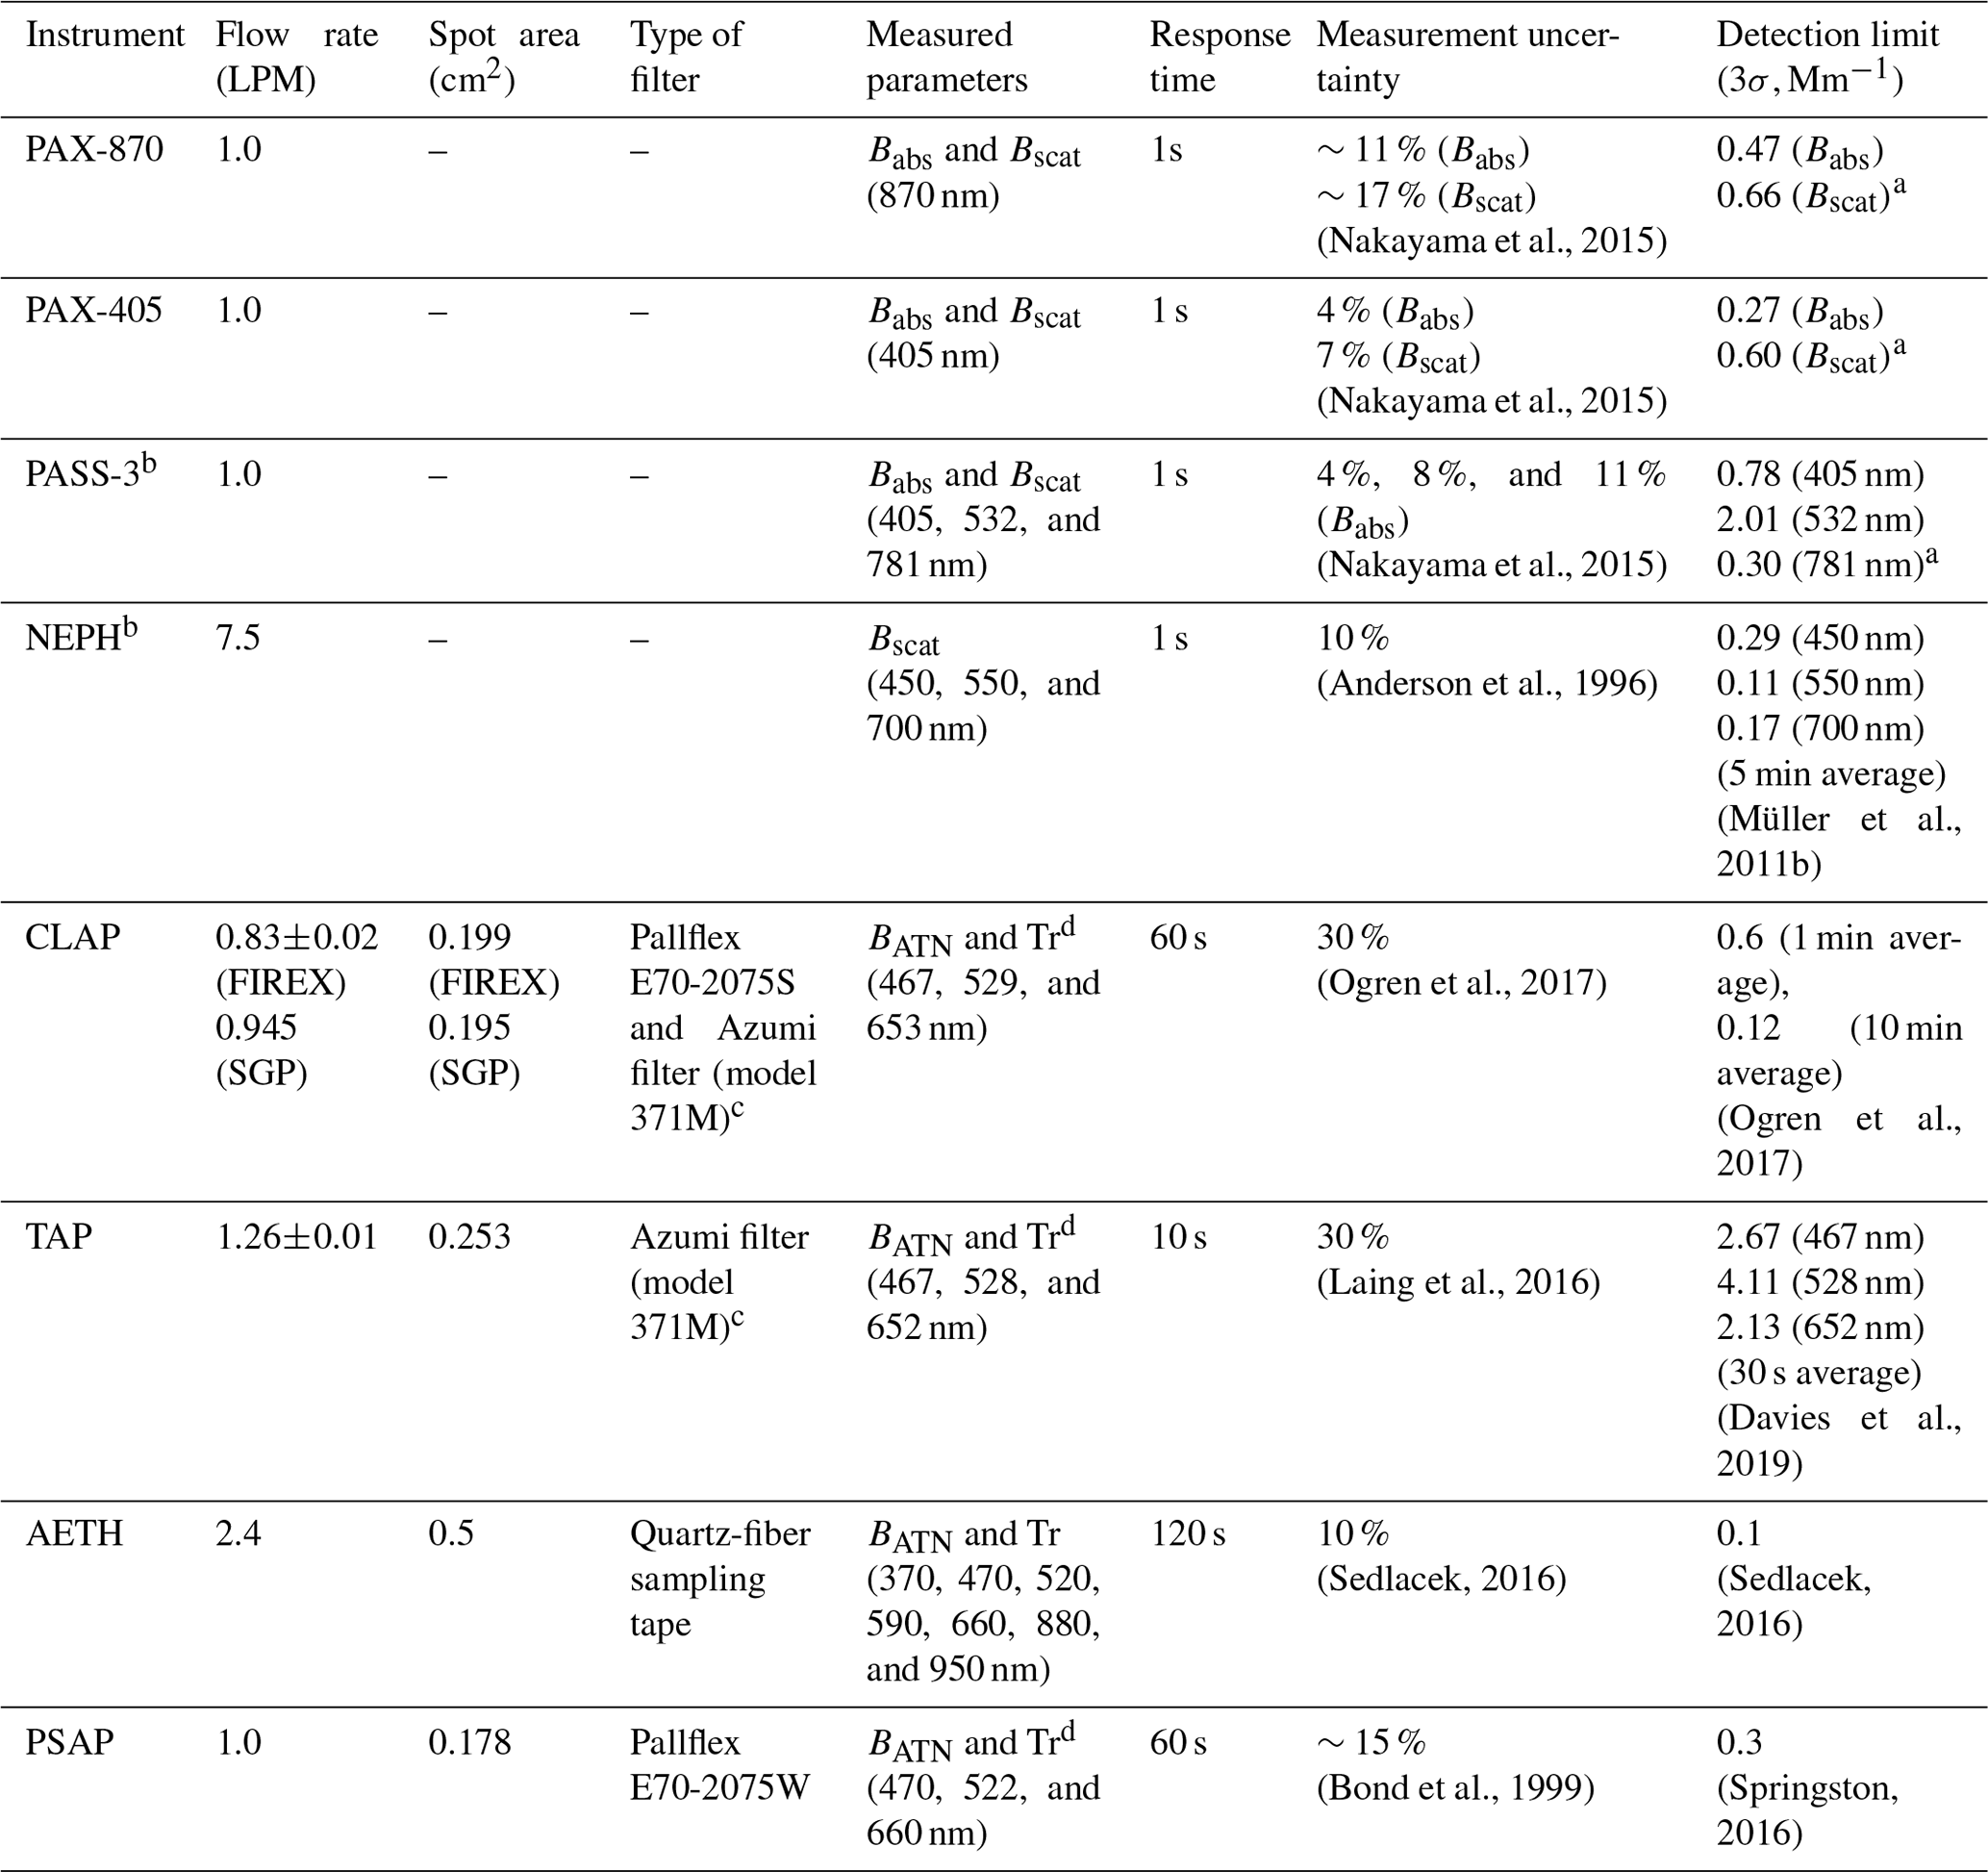
a The detection limits of PAX and PASS-3 are determined by Allan deviation analysis (Allan, 1966) of Babs during “background zero”. b During the analysis of the data collected at the SGP, we use Babs derived by the PASS and Bscat derived by the NEPH to yield the coefficients in the algorithms. c Two types of filters were used during the FIREX campaign (see Sect. 2.1.2). d The operating wavelengths of CLAP, TAP, and PSAP are stated slightly different by the instrument manufacturers. We simply use 467, 528, and 652 nm throughout this paper.
Both CLAP and TAP provide Babs measurements of the particles deposited on a filter, similar to PSAP. Different from PSAP, there are multiple filter spots (eight sample spots and two reference spots) cycling through one filter in CLAP and TAP, enabling the instruments to run continuously through two or three burns without changing filter. In the CLAP and TAP, sample illumination is provided by light-emitting diodes (LEDs) operated at three wavelengths (467, 528, and 652 nm). Here, we apply both B1999 and V2005 to CLAP and TAP data, similar to previous work (e.g., Backman et al., 2014; Davies et al., 2019).
The key differences between the CLAP and TAP during the FIREX campaign include the following.
-
The spot change in the CLAP was manually performed when Tr reached approximately 0.5 (or ATN decreased to ∼69), while the TAP advanced to a new spot automatically with a Tr threshold set to be 0.5.
-
The spot area, flow rate, and LED-detected wavelengths differed slightly (Table 1).
-
The CLAP recorded Babs every minute, while the TAP recorded Babs every 10 sec. To enable the following analysis, we compute the 1 min averages of TAP-derived parameters.
-
For the first portion of the campaign (the first 17 d of the 45 d campaign), Pallflex E70-2075S filters were used in the CLAP, while Azumi filters (model 371M, Azumi Filter Paper Co., Japan) were used in the second portion of the campaign (due to a lack of availability of the Pallflex filters). The TAP was equipped exclusively with the Azumi filters throughout the campaign. We apply the filter correction recommended in Ogren et al. (2017) to the CLAP and convert from Pallflex to Azumi filters.
-
BMI substantially reengineered the CLAP in their development of the TAP.
These differences resulted in variable agreement between the CLAP and TAP during FIREX; however, the two instruments did largely agree within experimental uncertainty (see, e.g., Figs. S8 and S13 in Li et al., 2019).
A PAX measures Babs and Bscat simultaneously for suspended particles using a modulated diode laser. We use these photoacoustic absorption measurements as the reference to evaluate the filter-based Babs and develop our correction algorithms. To enable the evaluation of CLAP and TAP, which operate at different wavelengths than the PAXs, we interpolate the measurements of Babs and Bscat to the wavelengths of 467, 528, and 652 nm using the values of AAE and scattering Ångström exponents (SAEs), similar to Backman et al. (2014) and Virkkula et al. (2005). Theoretically, AAE and SAE fit absorption and scattering as power-law functions of wavelength (Bergstrom et al., 2007).
Due to the numerous correction algorithms for the Aethalometer (e.g., Arnott et al., 2005; Collaud Coen et al., 2010; Kirchstetter and Novakov, 2007; Saturno et al., 2017; Schmid et al., 2006; Virkkula et al., 2007; Weingartner et al., 2003), we do not evaluate these in the present work to limit the scope. In fact, the majority of our focus is the B1999 and V2005 corrections to TAP and CLAP. However, we still test the performance of the new algorithms on the AETH to explore its applicability to that instrument.
2.2 Measurements of aerosol optical properties at the SGP observatory
The ambient data used in this paper are the ground-based aerosol data measured at the SGP observatory from 1 February to 9 July 2013 (archived at https://www.archive.arm.gov/discovery/, last access: 16 January 2019). For evaluation purposes, we randomly select a range of dates during which the observations are valid (without incorrect, suspect, and missing data) and the PASS is operated after laser (532 nm) upgrade.
At the site, an impactor was used to switch the sampling between two cutoffs (particle diameter < 10 µm (PM10) in the first 30 min of each hour and < 1 µm (PM1) in the latter 30 min of each hour). The aerosols exiting the impactor were dried to RH less than 40 % and passed to a CLAP, a PSAP, and two NEPHs. Moreover, a three-wavelength photoacoustic soot spectrometer (PASS-3) was operated at the site and measured Babs and Bscat of the aerosols, but these aerosols did not pass through the impactor (e.g., characterizing total suspended particles – TSPs). Typical Babs and Bscat reported at the site ranged from 0 to 10 and 0 to 50 Mm−1 at 550 nm, respectively (e.g., Sherman et al., 2015). Although the site is rural (clean background air), long-term transport aerosols (such as mineral dust, absorbing organic aerosols, and secondary organic aerosol – SOA) may affect the local aerosol properties (Andrews et al., 2019).
We preprocess the SGP data in three steps. First, due to the systematic difference in aerosol sizes between PASS-derived and filter-based absorption, we only include the PM10 observations, inherently assuming that any differences in the optical properties of PM10 and TSPs are negligible. Then, we smooth the 1 sec data into 10 min averages. Thirdly, we estimate the detection limits at each of the three wavelengths in the PASS-3 using the data measured during the background zero periods (Allan, 1966) and discard the observations below the detection limits. With a 10 min averaging time, the detection limits (3σ) for the PASS-3 are 0.78 Mm−1 (405 nm), 2.01 Mm−1 (532 nm), and 0.30 Mm−1 (781 nm). For the filter-based instruments, the detection limits are based on previous studies (see Table 1). Moreover, we only retain the observations that satisfy Babs (405 nm) > Babs (532 nm) > Babs (781 nm) (or AAE > 0), similar to Fischer and Smith (2018). As with the PAX data from the laboratory, we adjust the PASS-derived Babs to 467, 528, and 652 nm using the inferred AAE values for each 10 min average.
2.3 Calibrations
Following Bond et al. (1999) and Ogren et al. (2010), the filter-based instruments were calibrated and corrected for sample area, flow rate, and filter type (see Li et al., 2019) for the FIREX data and Sherman et al. (2015) for the SGP data. Other than that, we did not do any verification beyond the manufacturer's calibration for the filter-based instruments. The SGP nephelometer measurements were corrected for truncation effects (Sherman et al., 2015). The FIREX photoacoustic measurements were calibrated by ammonium sulfate aerosol and fullerene soot (Li et al., 2019).
2.4 The correction algorithms
In filter-based instruments, the light intensities transmitted through the sample spot and blank spot of the filter are recorded as Is and Ib, respectively. The logarithmic ratio of the two intensities at time t is defined as ATN using the Beer–Lambert law:
where ATN =0 when beginning a new filter spot (t=0).
The ATN can be related to Tr by normalizing Is∕Ib at time t relative to Is∕Ib at the start of a new filter spot (t=0):
The change in ATN over a time interval (Δt) for the instrument operated at a volume flow rate of Q and spot area of A yields the attenuation coefficient (BATN) for that time interval:
BATN is finally converted to Babs by applying correction algorithms. The general form of the correction algorithms presented for the PSAP in Bond et al. (1999) and Virkkula et al. (2005) can be summarized as
where f(Tr) is some function of Tr (that may vary between approaches), correcting for the filter loading effect. C1 is a constant that may vary with wavelength; specifically, it is a penalty for light scattering by the particles collected on the filter, which may contribute to the quantification of ATN. In most atmospheric and laboratory studies, Bscat is measured independently, typically using a colocated NEPH.
Besides the abovementioned B1999 and V2005 corrections, the constrained two-stream (CTS) correction proposed by Müller et al. (2014) can be also applied on PSAP-similar instruments. The CTS correction was developed based on the relationship between absorption optical depth and Babs. However, it is not straightforward to reformulate the CTS correction as a function of Tr as those presented in Eqs. (5) and (6). Thus, we exclude the Babs results corrected by the CTS correction in the following analysis. For those who are interested in the Babs results corrected by the CTS correction, we provide the correction results of our SGP–CLAP data in Supplement Fig. S9.
2.4.1 The B1999 correction
Bond et al. (1999) were the first study to present a correction algorithm for filter-based instruments. This empirical correction was originally developed for the PSAP operated at 550 nm using various mixtures of laboratory-generated nigrosin (SSA ≈0.5) and ammonium sulfate (SSA ≈1) with Babs ranging from 0 to 800 Mm−1.
After calibrating the flow rate and spot area of the PSAP, Bond et al. (1999) derived C1=0.016 and defined f(Tr) as follows:
Following an adjustment by Ogren (2010), C2 and C3 in Eq. (5) were updated to 1.55 and 1.02, respectively. These are the values used in the present work (Table 2) for B1999. Moreover, Ogren (2010) stated that the correction forms of Eqs. (4) and (5) were valid for any wavelength, while additional experiments were needed to establish the equation parameters for wavelengths other than 574 nm.
Table 2Overview of the studies of B1999 and V2005 and the description of our experiments.
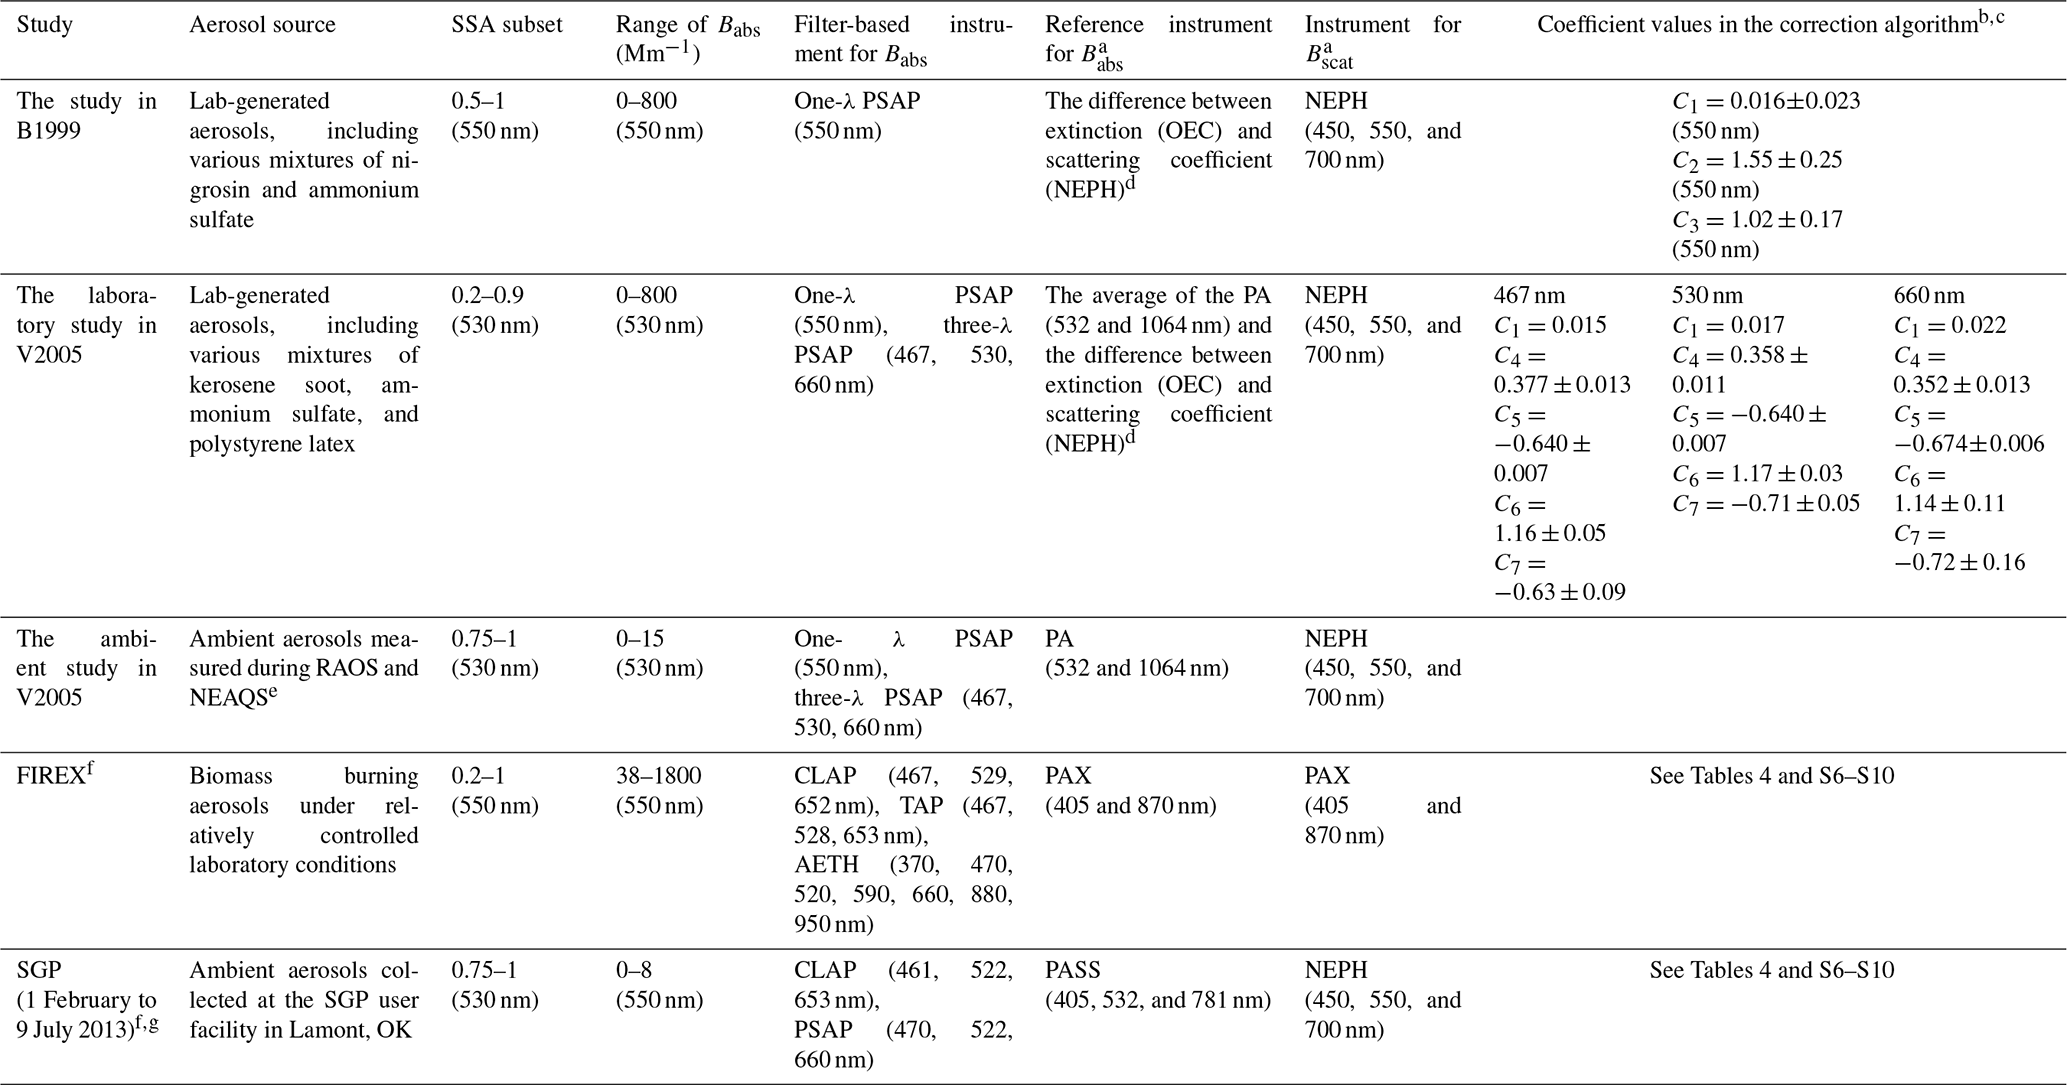
a The operating wavelengths are based on the manufacturer specifications. b The coefficients provided in Table 2 are the values presented in Ogren (2010) and Virkkula (2010), which are updated from Bond et al. (1999) and Virkkula et al. (2005), respectively. c We reformulate the correction equations in the original publications to agree with Eqs. (4)–(6) in this paper. C1 to C7 are the coefficients in the present work. d OEC is the optical extinction cell and PA is the instrument using the photoacoustic technique. e RAOS and NEAQS are the Reno Aerosol Optics Study and New England Air Quality Study, respectively. f The relative humidity (%) of the sampled aerosols from the FIREX and SGP study is 29.3±3.3 and 26.1±13.94, respectively. g The scatterplot of AAE and SAE for the SGP data can be found in Fig. S15. Our results of AAE and SAE are compared to the values reported for different NOAA Earth System Research Laboratory (ESRL) observational sites in Schmeisser et al. (2017).
2.4.2 The V2005 correction
Virkkula et al. (2005) developed a correction algorithm for both three-wavelength PSAP (467, 530, and 660 nm) and one-wavelength PSAP (574 nm) using the same functional form as Eq. (4). Since the operating wavelengths of the photoacoustic instruments and the NEPH were different from those of the PSAP, the measured photoacoustic Babs and Bscat were extrapolated or interpolated to 467, 530, and 660 nm using inferred AAE and SAE, respectively. In this study, the authors used various mixtures of kerosene soot, ammonium sulfate, and polystyrene latex (SSA ranged from 0.2 to 0.9) with Babs ranging from 0 to 800 Mm−1 at 530 nm.
Different from the f(Tr) in the B1999 correction, which was a reciprocal function of Tr, the f(Tr) presented in V2005 was a multivariate linear function of the natural logarithm of Tr and SSA (including an interaction term between the two):
where the parameters in Eq. (6) vary with wavelength. The parameters in V2005 were updated in Virkkula (2010) by correcting for flowmeter calibration (Table 2).
Due to the unknown values of SSA before deriving Babs, Virkkula et al. (2005) provided a solution through an iterative procedure. In the iteration, Babs is first calculated using the B1999 correction (e.g., Eqs. 4 and 5) and is then used to compute the initial guess of SSA for use in Eq. (6). The Babs and SSA can be updated using Eqs. (4) and (6) until convergence is reached.
2.4.3 Refitting the coefficients in B1999 and V2005
With the reference measurements of Babs from the photoacoustic instruments, we are able to refit the coefficients in the B1999 and V2005 corrections (C2 to C7 in Eqs. 5 and 6) using our data. Specifically, we use the Levenberg–Marquardt algorithm (1944) to iteratively fit the coefficients until the chi square of the coefficients is minimized (Levenberg, 1944). The fitting is implemented using the Curvefit function in Igor Pro. It is worth noting that the derived coefficients may only be valid for the SGP and FIREX data. For aerosol properties different from our study, the optimal coefficients are likely to be different from the ones reported here. Hereafter, the B1999 and V2005 results with refitted coefficients are referred to as “updated B1999” and “updated V2005”, respectively.
2.4.4 The new correction
We develop a set of new correction algorithms with the same general form as Eq. (4) using the biomass burning emissions from 65 different burns during the FIREX laboratory study, providing a broader range of aerosol optical properties and aerosol concentrations than previous work. This was motivated by the disagreement that remained between filter-based and photoacoustic instruments, even after applying B1999 to the data (see, e.g., Li et al., 2019, their Fig. 4 and our Fig. 2). These differences may persist because we were effectively extrapolating the B1999 correction equation to values outside the range for which it was developed.
This new correction is developed based on multiple linear regression techniques with three dependent variables of ln(Tr), SSA, and AAE as well as one independent variable of Babs∕BATN (Eqs. 7–9). As with other correction equations, this model takes into account the influence of scattering and weakly absorbing materials, but we have the additional aim of developing a model that is applicable to any filter-based absorption photometer.
Similar to the B1999 and V2005 corrections, this new model starts with the general form of Eq. (4), rewritten here to define Bscat in terms of SSA and Babs.
Rearranging this equation to move all Babs terms to the left-hand side yields
where g (Tr(λ), SSA(λ)) =f (Tr(λ)) .
We define a new function g that can be used in Eq. (8). Specifically, we construct a multivariate linear model for g, introducing AAE as a dependent variable and including interaction terms between SSA, AAE, and ln(Tr):
Equation (9) suggests that different combinations of SSA, AAE, and ln(Tr) can result in the same value of g (i.e., Babs∕BATN); likewise, a given value of Babs∕BATN may have infinitely many points with distinct slopes passing through it (Fig. S3). Although Eq. (9) is developed based on statistical approaches, we attempt to relate this statistical model to physical effects. The coefficients G1−G3 are fairly straightforward, as these account for the influence of filter loading (G1), relative light scattering by the aerosols (G2), and the brownness of the aerosols (G3). The interaction terms (G4−G7) are more difficult to assign a physical meaning; however, the interaction between filter loading and relative light scattering (G4) might be interpreted as an absolute light scattering by the aerosols on the filter, while the interaction between filter loading and aerosol brownness (G6) is somewhat analogous to G4. The three-way interaction between filter loading, scattering, and the brownness of aerosols (G7) is required because of the three two-way interaction terms.
To further this physical interpretation of our statistical model (Eq. 9), we explore the relationship between and ln(Tr), which essentially follows a form, where y is and x is ln(Tr). The slope (m) is defined as SSA + G6× AAE SSA × AAE, and the intercept (b) is defined as G2× SSA + G3× AAE SSA × AAE. Therefore, different combinations of SSA and AAE modulate this relationship between and ln(Tr). For example, loading “black” particles on the filter (e.g., AAE ∼1 and SSA ∼0.3) tends to produce larger values of , while loading “white” particles on the filter (e.g., AAE ∼3 and SSA ∼0.9) tends to produce smaller values of (see Fig. S3 of this work and Fig. 4 in Virkkula et al., 2005). This relationship becomes more complex when considering, e.g., mixed sulfate and black carbon particles; SSA can be high while AAE is low, and the corresponding can be variable (also see Fig. S3). Therefore, in order to properly compensate for the effects of loading and aerosol optical properties, a multiple linear regression with interaction terms is introduced in Eq. (9).
A detailed description of the procedure for the model development (e.g., variable transformation – from Tr to ln(Tr), variable selection using the best subsets and stepwise approaches, and model assessment) is provided in the Supplement. We evaluate the model by plotting against aerosol properties not included in Eq. (9) (such as relative humidity and aerosol geometric mean diameter, which have been previously reported to bias corrections of filter-based Babs; Moteki et al., 2010; Nakayama et al., 2010; Schmid et al., 2006). The results are presented in Figs. S5–S7.
As in V2005, iteration is required in our algorithm because Babs is dependent on knowledge of SSA and AAE, which themselves are dependent on Babs. We propose the following iterative process to update SSA and AAE in the model.
-
Initialize AAE from BATN across the three wavelengths ( and initialize SSA for each wavelength using BATN from the filter-based absorption photometer and Bscat from a colocated NEPH, i.e., .
-
Yield an initial set of coefficients G0 through G7 for each wavelength to calculate g(Tr, SSA, AAE) in Eq. (9) using one of the algorithms described in Sect. 2.5.
-
Calculate Babs for each wavelength using Eq. (8).
-
Update AAE and SSA using Babs calculated in Step 3.
-
Derive a new set of coefficient values.
-
Iterate Steps (3)–(5) until converged.
2.5 Application of correction algorithms
In developing a procedure for applying our algorithm, we envision three potential scenarios.
-
Algorithm A. The filter-based instrument is colocated with a NEPH and reference instrument providing Babs. This scenario facilitates the computation of G0 through G7 in Eq. (9) (Step 2 in the iterative process) as well as the derivation of new coefficients for existing correction algorithms. This scenario can also enable the development of a new a set of coefficients that may be more appropriate for aerosol sources that we do not consider here.
-
Algorithm B. The filter-based instrument is colocated with a NEPH but not a reference instrument providing Babs, which is perhaps the most likely scenario (at least at many long-term monitoring sites). This scenario requires an initial guess of the coefficients; we provide sets of these in Table 4 below for different filter-based instruments and aerosol sources.
-
Algorithm C. The filter-based instrument is deployed with neither a colocated NEPH nor a reference instrument providing Babs. This scenario is the most challenging because there are no measurements of Bscat to compute SSA; to address this issue, we propose the use of a nonlinear relationship between SSA and AAE (AAE SSAc) to provide an initial guess of SSA in the iterations.
To aid in decision-making between algorithms, we developed a flowchart for selecting appropriate correction algorithms for CLAP, TAP, and PSAP (Fig. 1). Furthermore, programs based on Igor Pro (WaveMetrics, Inc.) and Python (version 3.7.5) for selecting and implementing our correction algorithms can be found at https://doi.org/10.5281/zenodo.3742342.
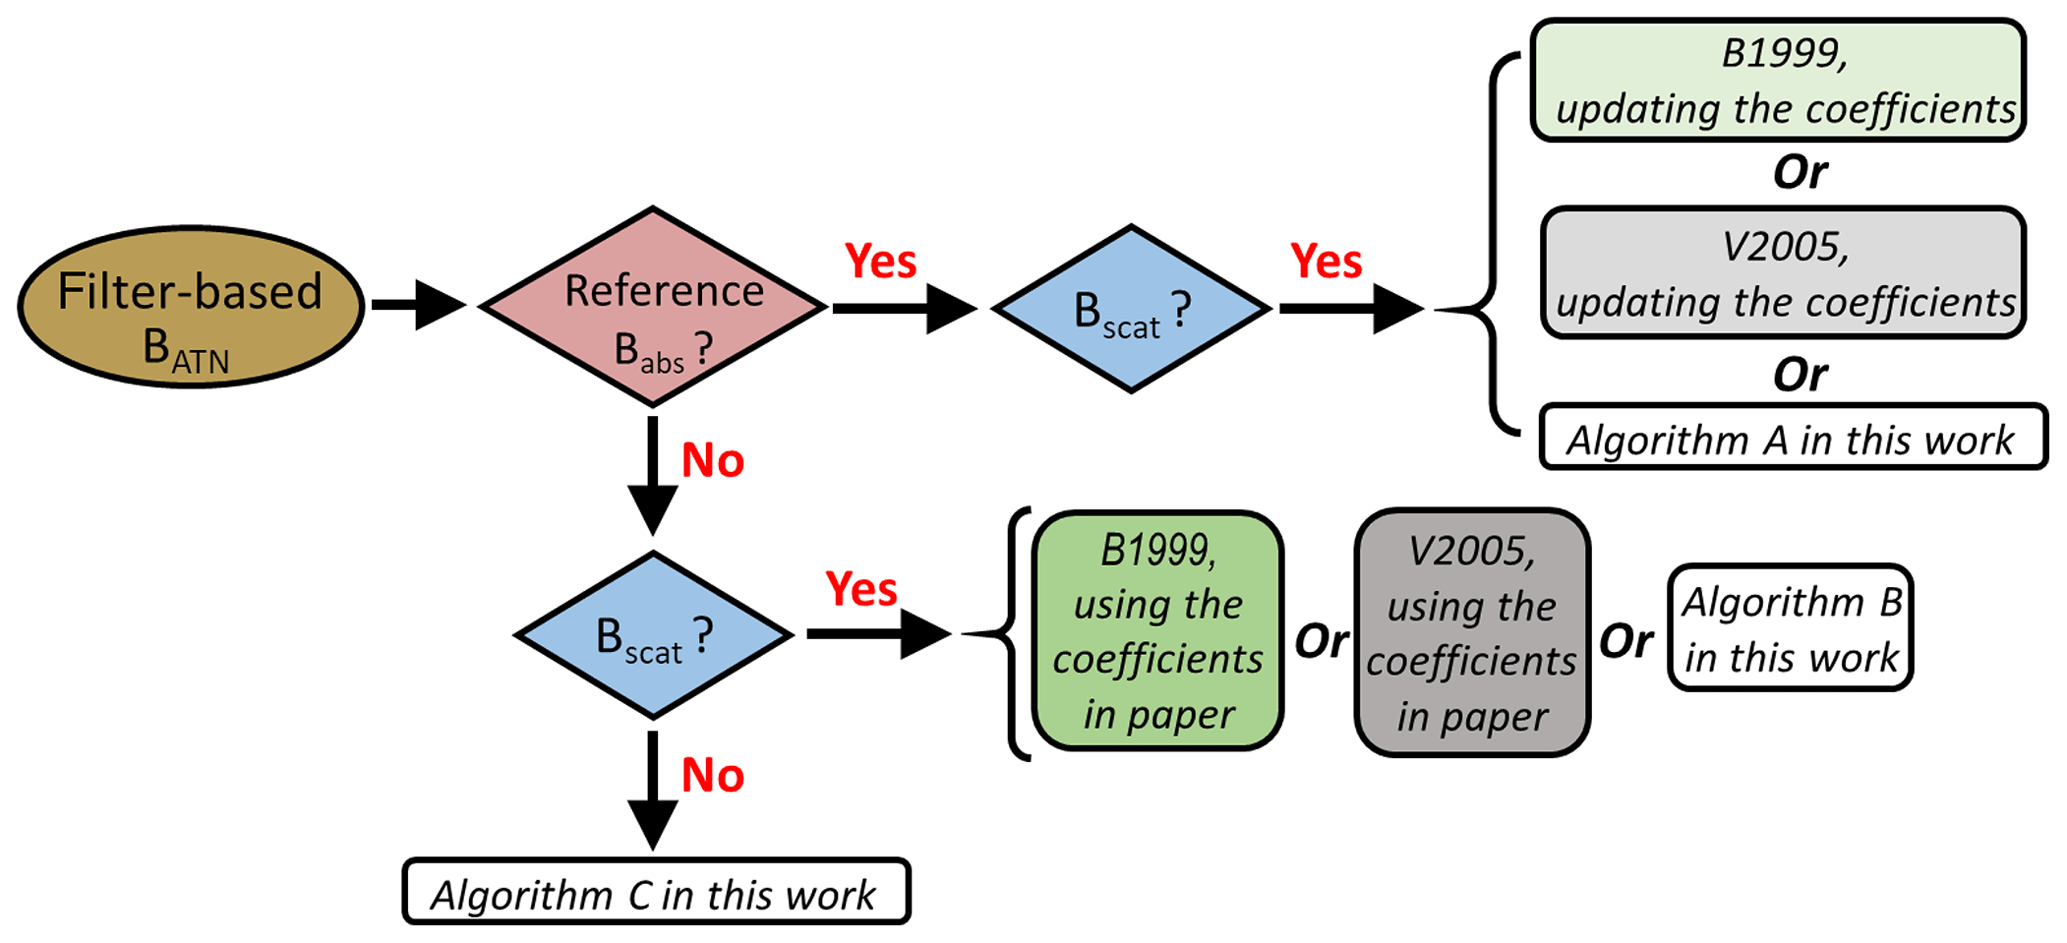
Figure 1The flowchart for the application of correction algorithms on PSAP, CLAP, and TAP. Similar logic is followed for the AETH.
3.1 Application of the previous algorithms on different aerosols
We first consider the application of the B1999 and V2005 corrections on different combinations of aerosol type and filter-based absorption photometer. Specifically, we apply the two corrections to the biomass burning data from the FIREX laboratory campaign (CLAP and TAP) and 6 months of ambient data from the SGP site (CLAP and PSAP). In doing so, we use the “default” coefficients recommended in B1999 and V2005 as well as “updated” coefficients that are estimated via regression techniques. It is important to keep in mind that the updated coefficient values of B1999 and V2005 (Table S7) are only valid for the aerosols investigated in this study. Future experiments are needed to systematically determine how the coefficients in B1999 and V2005 may change for different aerosol types. We focus on the results of the CLAP in the main text because a CLAP is the only instrument common to deployments for both FIREX and SGP. The results of the TAP from FIREX and the PSAP from the SGP site can be found in the Supplement (Table S5 and Fig. S11).
Our intercomparison between the corrected CLAP-derived Babs and reference Babs for the FIREX and SGP data is provided in Fig. 2 and Table 3. For the FIREX measurements, both analyses (using the default coefficients and updating the coefficients) suggest good correlation (coefficient of determination (R2) > 0.9) between the CLAP and the reference across all three wavelengths. Nevertheless, the corrections using the default coefficients result in overprediction of Babs by factors of ∼2.5. If we update the coefficients in the corrections, there is an obvious improvement in the agreement (i.e., slope ≈1; R2 increases). The results are generally similar for SGP, although the R2 for ambient data is generally lower for ambient data (R2 < 0.7). Decreased R2 may be due to the lower aerosol concentrations measured in ambient air, which could lead to lower signal-to-noise ratios in the instruments. Moreover, it is worth mentioning that for both datasets (FIREX and SGP), the corrected Babs values from different filter-based absorption photometers using the default approaches do not agree with each other (slopes range from 0.69 to 1.40). However, after updating the coefficients, the slopes approach unity (Table S6).
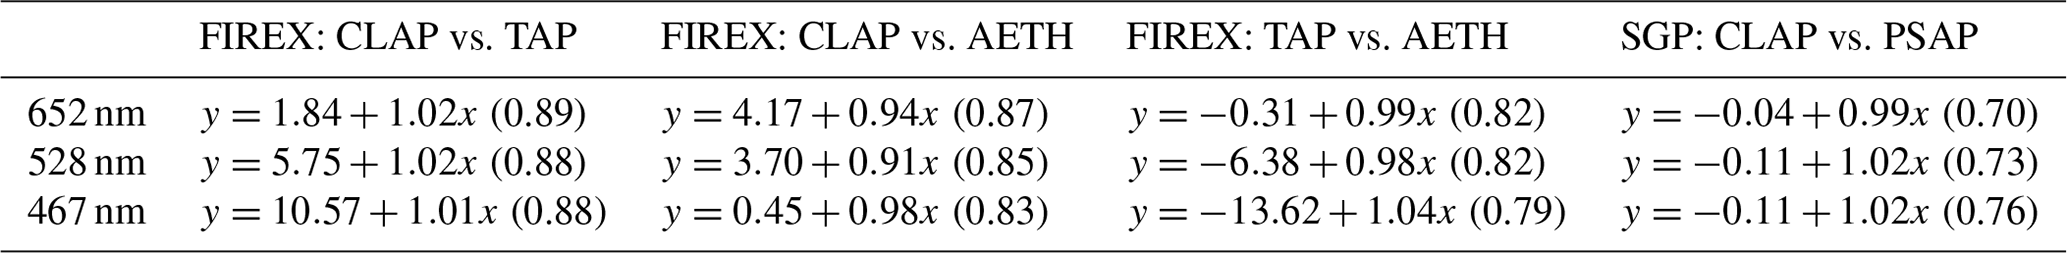
Table 3Relationship between the CLAP-derived Babs corrected by the B1999 and V2005 algorithms (including updated coefficients) and the reference Babs at 652, 528, and 467 nm. The relationship is achieved using major axis regression (Ayers, 2001). The value in parentheses represents the coefficient of determination (R2) of the linear relationship.
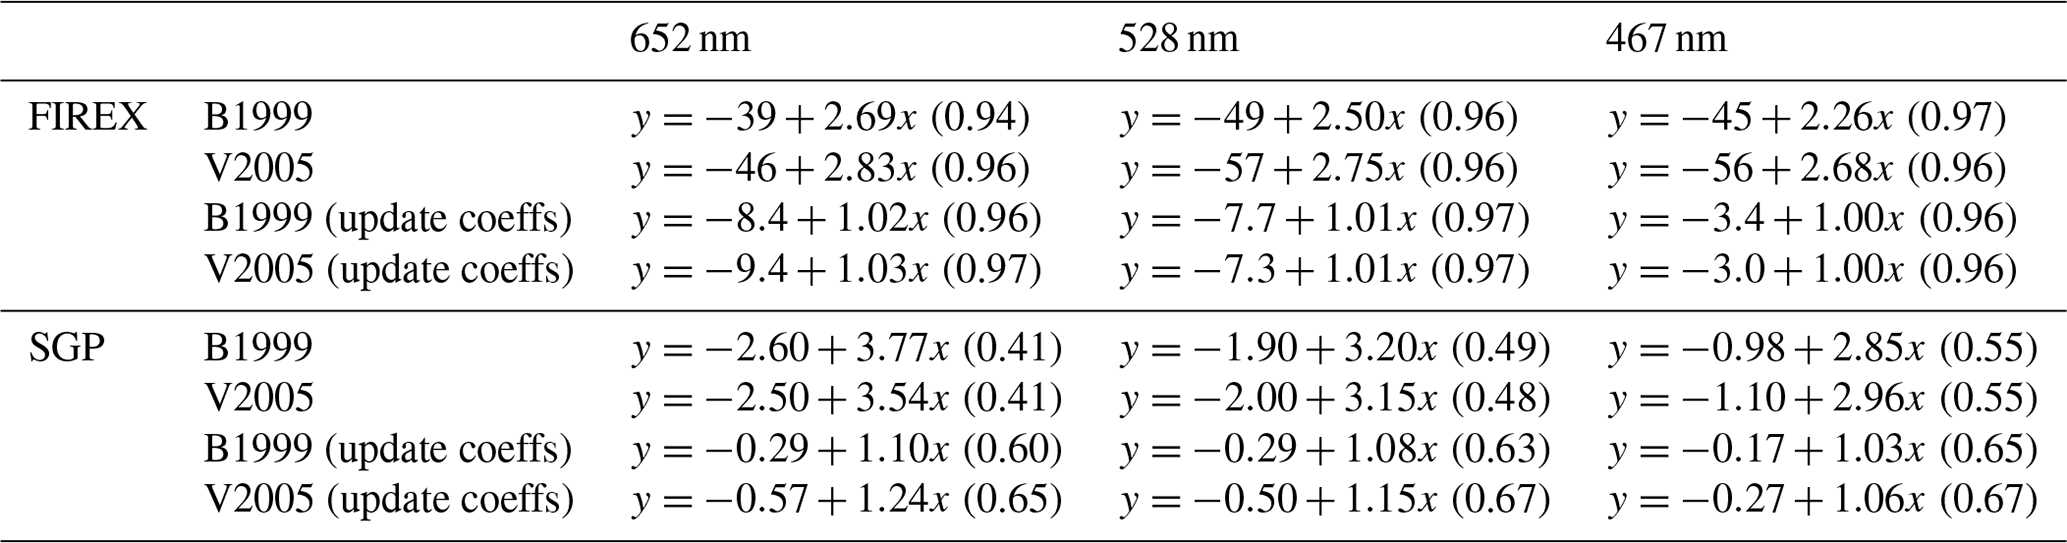
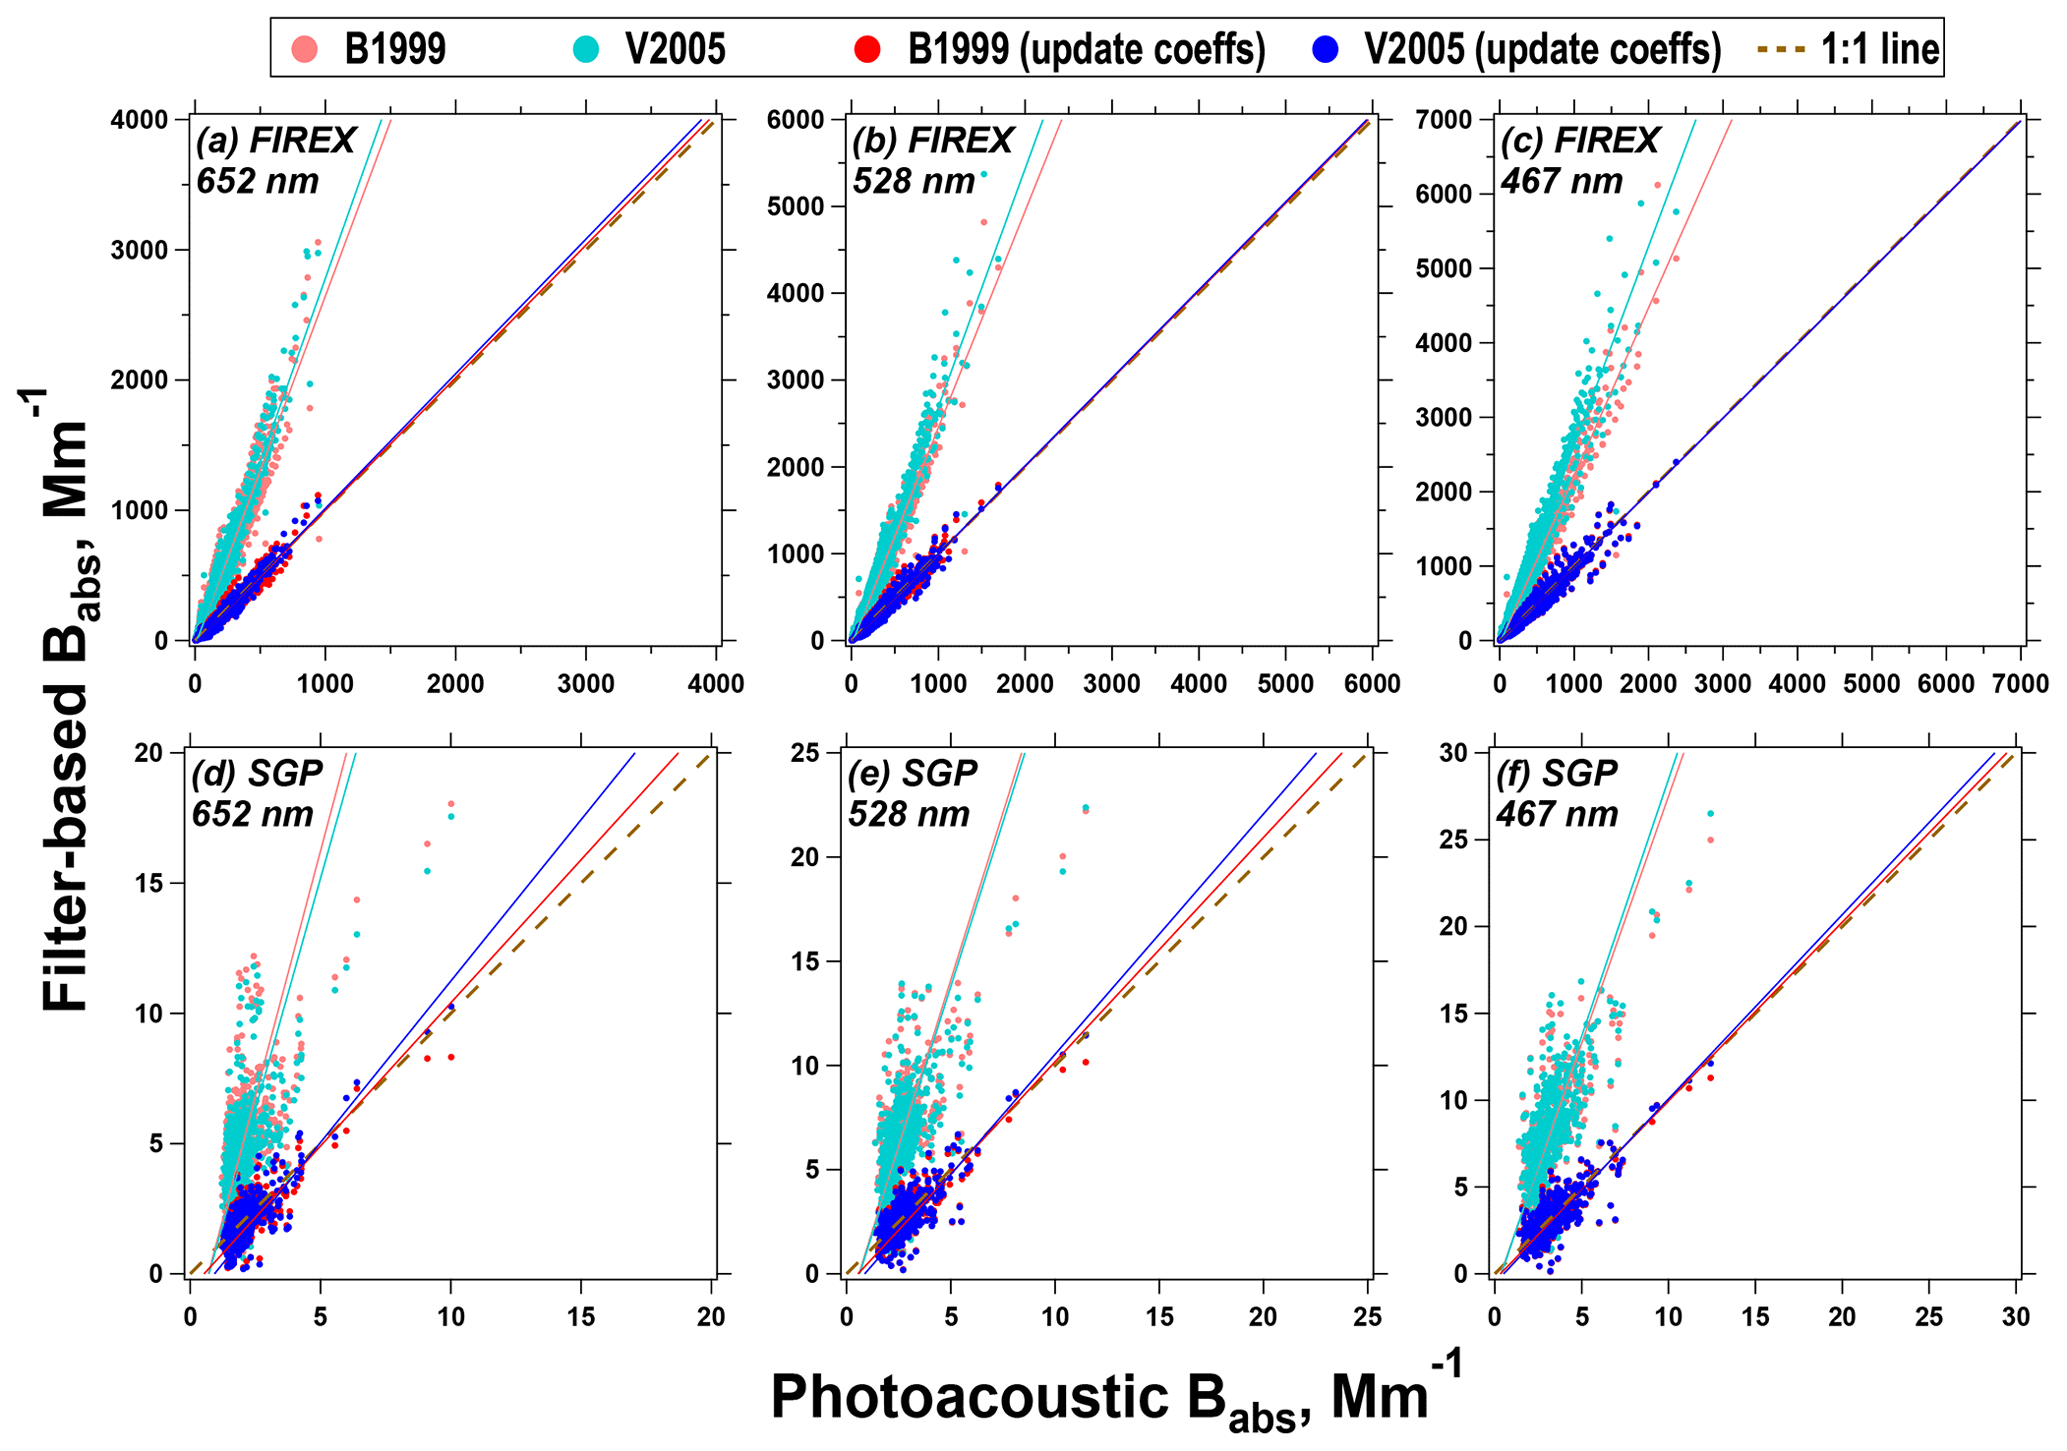
Figure 2Intercomparison between the CLAP-derived Babs corrected by the B1999 and V2005 algorithms and the reference Babs at 652, 528, and 467 nm for both FIREX and SGP data. The solid lines represent linear regressions, while the dashed line is a 1:1 line.
In the FIREX data, there is an apparent dependency of the updated coefficients on the wavelength of light but, more importantly, on the aerosol optical properties, namely SSA and AAE (Tables S7–S9). However, in the ambient data from SGP, the dependency on optical properties is less obvious (Tables S10–S11). Nevertheless, all of these coefficients differ from those reported in B1999 and V2005 (again, derived for the PSAP rather than the CLAP), which highlights the potential need to use coefficient values that are appropriate for the instrument being used, its wavelength(s) of light, and optical properties that are representative of the sampled aerosols when applying correction factors to BATN.
3.2 Application of the new algorithms to the FIREX data
The colocation of the CLAP, TAP, AETH, and PAX during FIREX allows us to apply each algorithm (A, B, C) to these data. Similar to Sect. 3.1, we focus our discussion on the CLAP, with details on the TAP and AETH presented in the Supplement (Fig. S11–S12). However, we provide the recommended initial guesses in the new algorithms and the comparison of absorption (corrected filter-based Babs versus reference Babs) for all filter-based absorption photometers in Tables 4 and 5 to help readers quickly retrieve key information on our algorithms.
Table 4Coefficient values for Eq. (9) derived using Algorithm A. We recommend these as the initial guesses when implementing Algorithm B*.
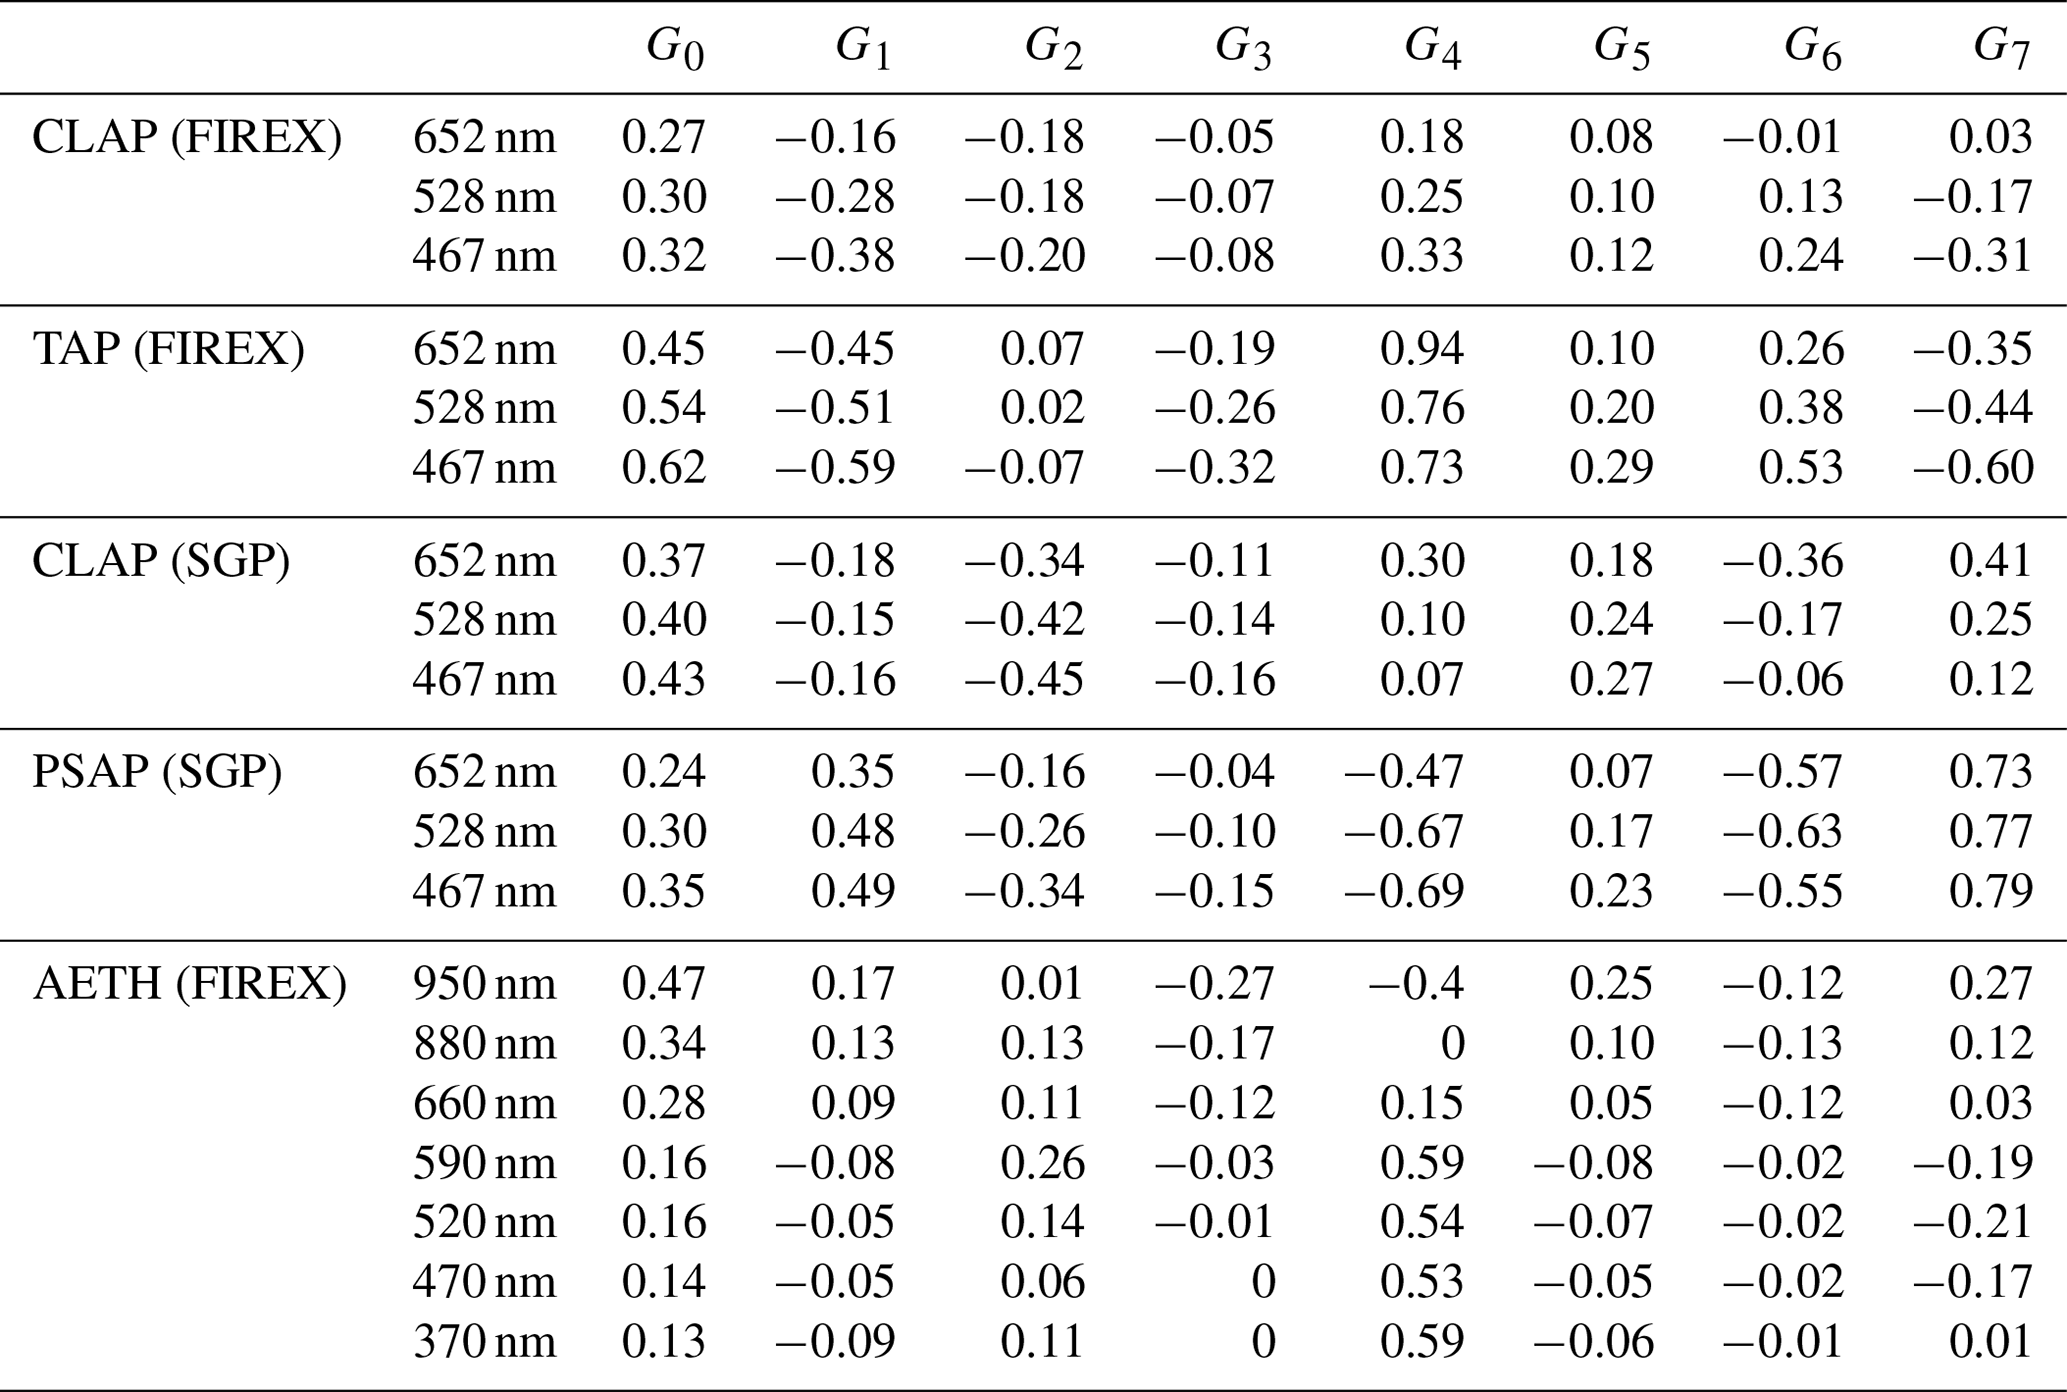
* The coefficients derived from FIREX may be more appropriate for biomass burning aerosols, and the coefficients derived from SGP may be more appropriate for rural background environments in the absence of marine aerosols and dust (see Fig. S15).
Figure 3 provides a comparison between the uncorrected BATN from the CLAP at all three wavelengths, as well as photoacoustic Babs interpolated to those wavelengths using AAE. For each wavelength, the slopes are significantly greater than 1. Moreover, there is an apparent dependency on SSA and AAE in the agreement between the instruments. This is most obvious in Fig. 3a (652 nm), where data with lower SSA and lower AAE (smaller markers, “brighter” colors) fall below the best-fit line, while data with higher SSA and higher AAE (larger markers, “darker” colors) fall above the best-fit line. This phenomenon is less clear in Fig. 3b–c, but an apparent dependency on SSA and AAE remains, which highlights the need to include both of these aerosol optical properties (and appropriate interaction terms) when correcting BATN values.
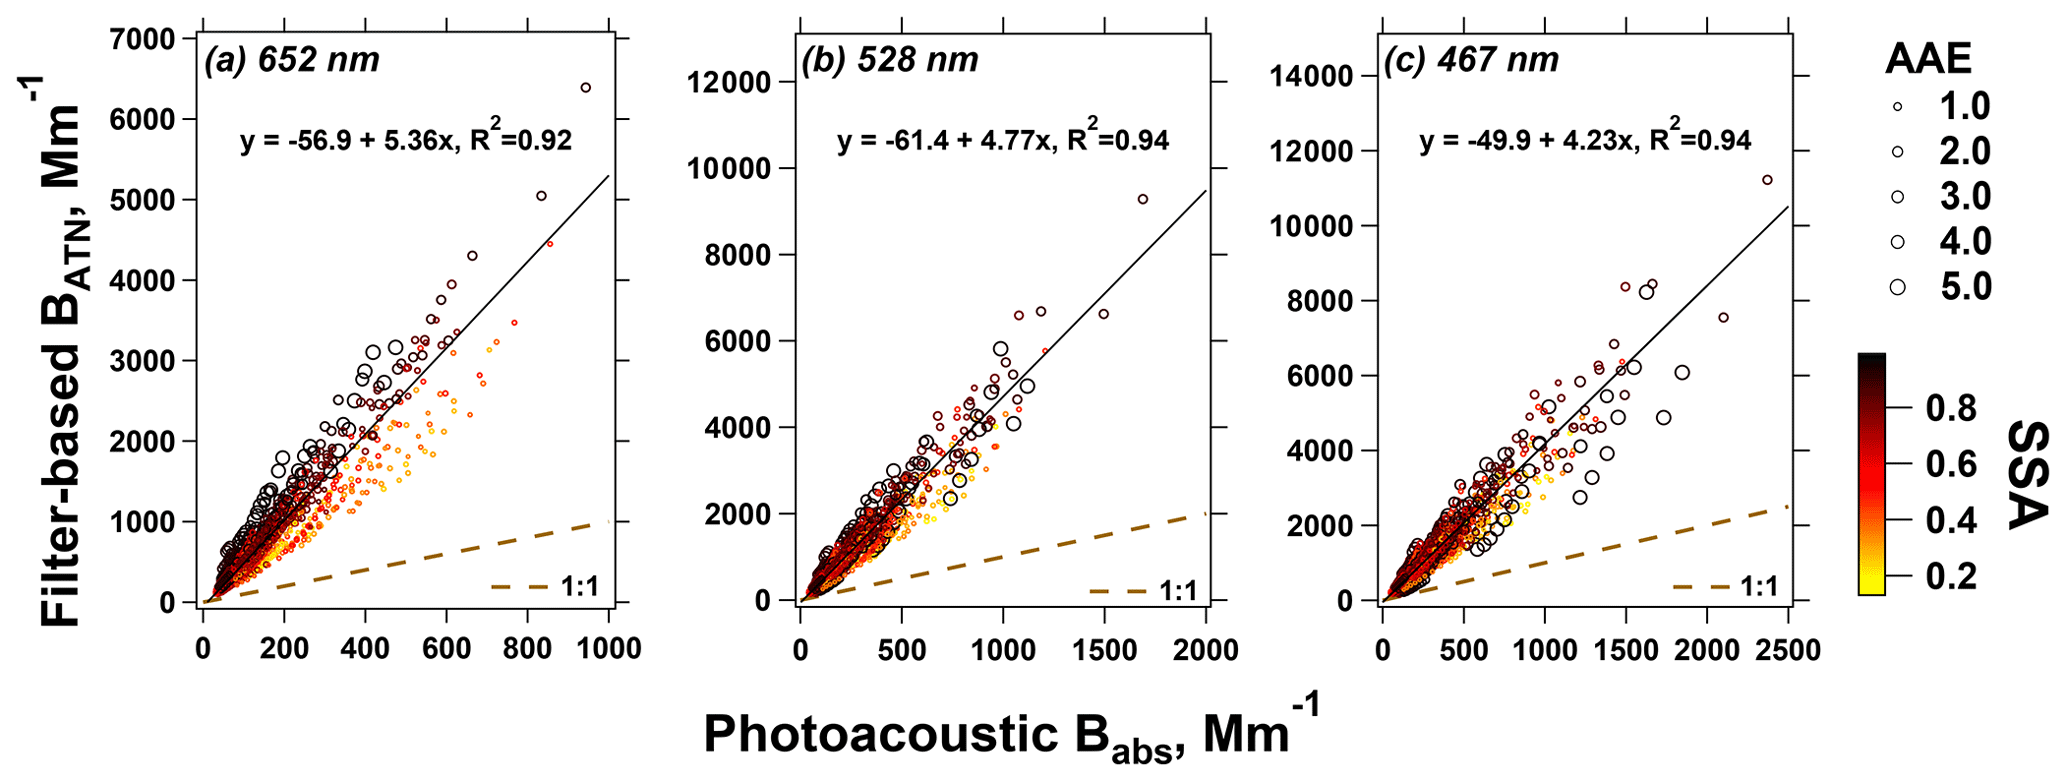
Figure 3Comparison of the uncorrected CLAP-derived BATN and the reference Babs at 652, 528, and 467 nm for the FIREX data. The data points are colored by the corresponding SSA at the given wavelength. The size of data points reflects their AAE quantified by the two PAXs. The solid line represents the linear regression, while the dashed line is a 1:1 line.
We first apply Algorithm A to the CLAP BATN data in Fig. 3. Using the reference Babs values from the PAX (in addition to Bscat values), we are able to derive a set of coefficients that enable the correction of the data (Table 4). Corrected CLAP values are presented in Fig. 4, with the linear relationships presented in Table 5. The slope for each wavelength is very close to the 1:1 line, suggesting that our approach works well in correcting these data. Moreover, the heteroscedasticity that exists in Fig. 3 has been minimized after correction, and there are no apparent trends in how the data are organized in Fig. 4 due to the aerosol optical properties.
Table 5Relationship between the filter-based Babs corrected by Algorithm A and the reference Babs at the operating wavelengths for the filter-based instrument. The relationship is achieved using major axis regression (Ayers, 2001). The value in the parentheses represents the coefficient of determination (R2) for the linear relationship.
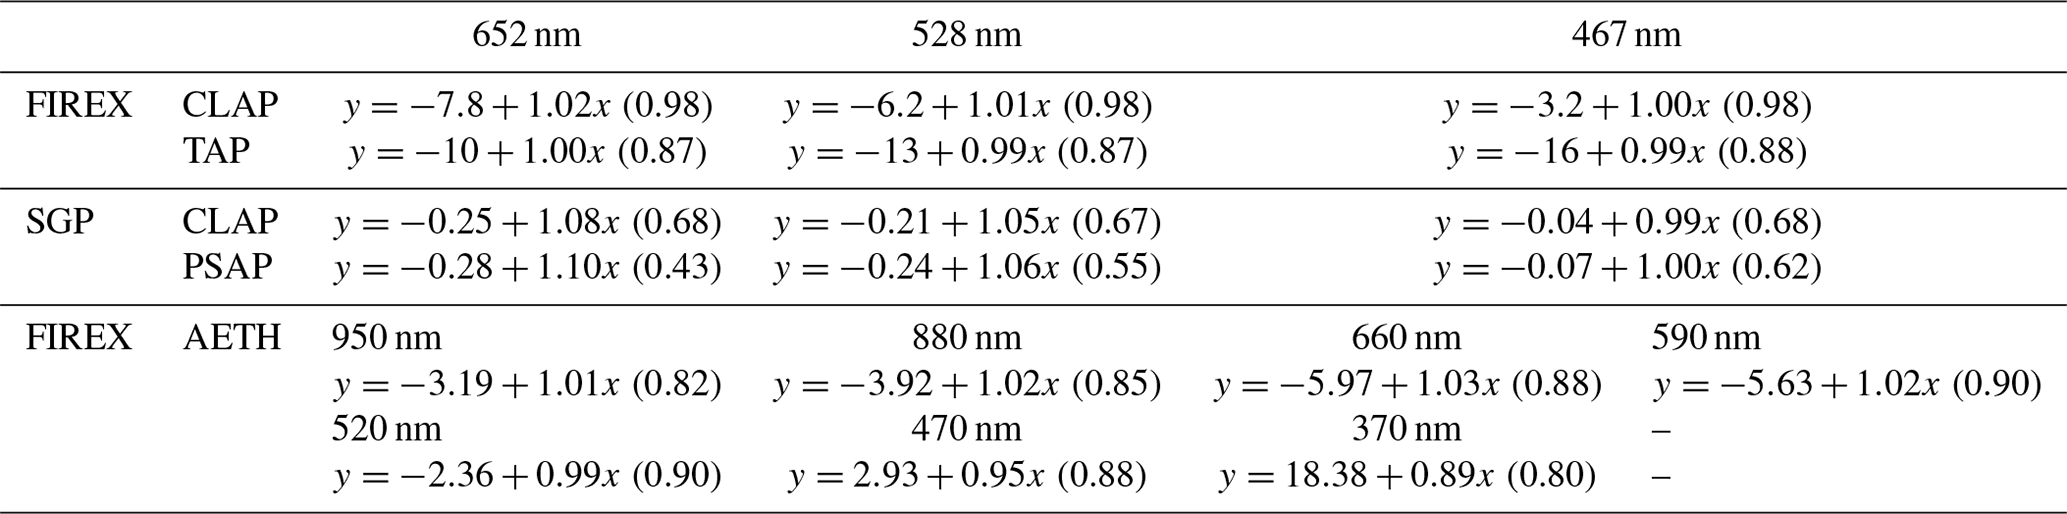
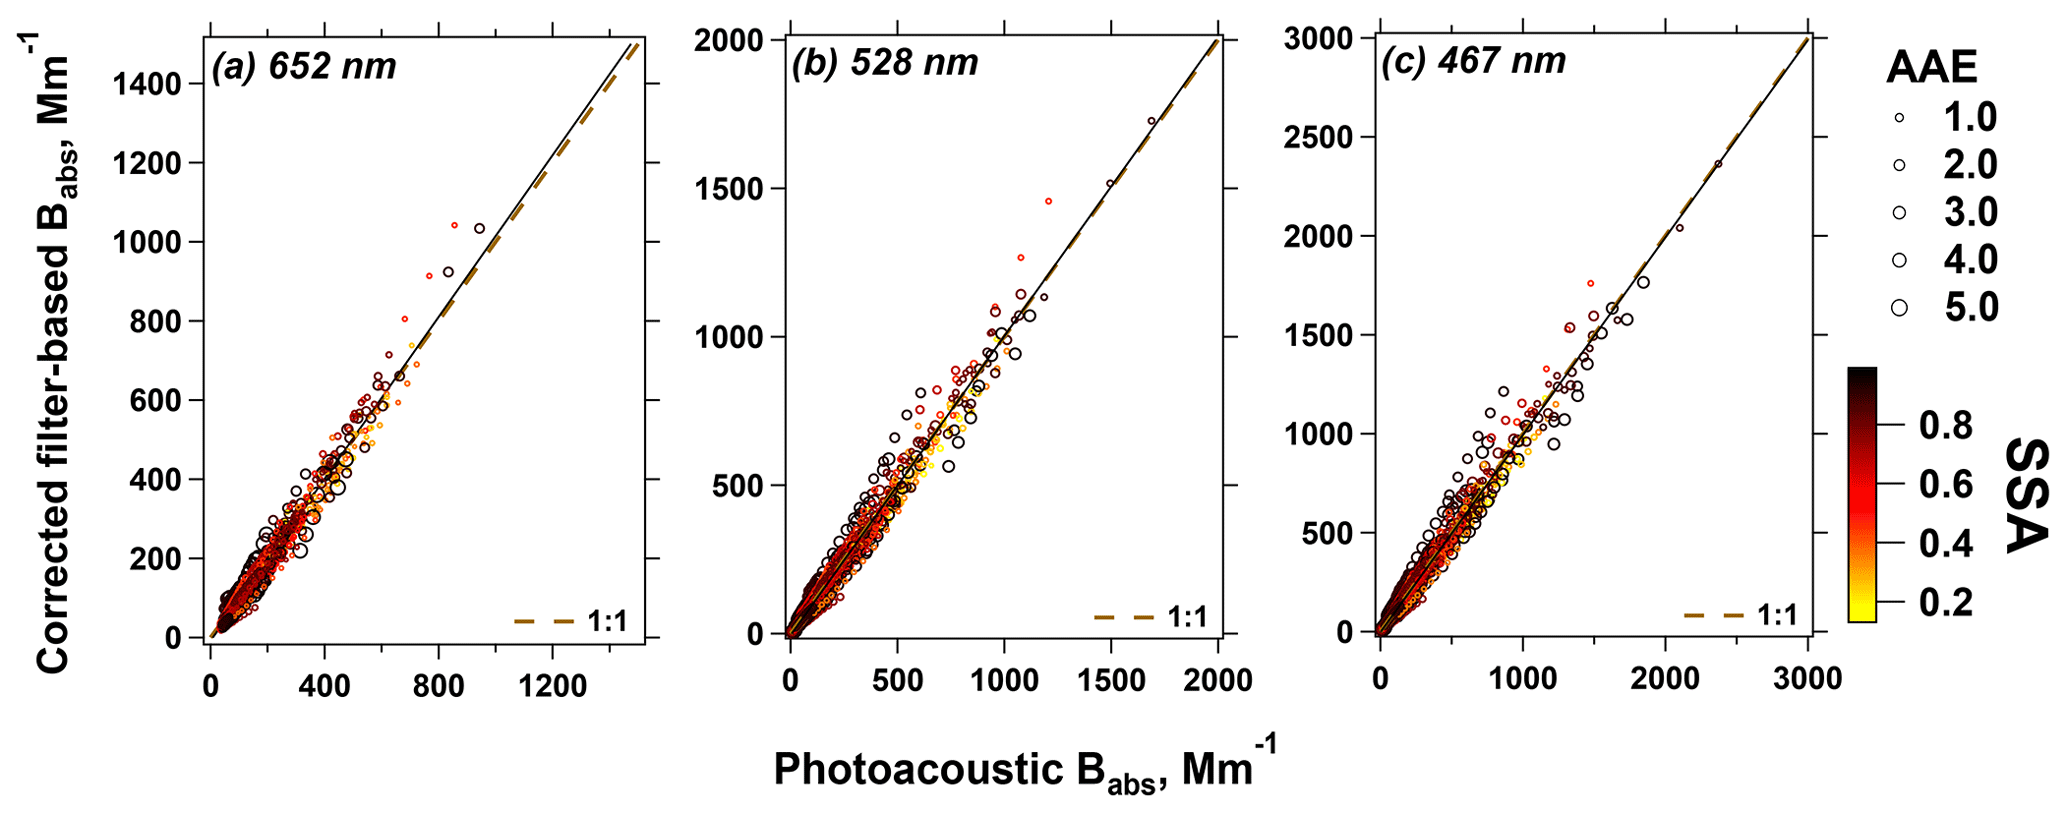
Figure 4As in Fig. 3, but the CLAP-based BATN values have been corrected using our Algorithm A.
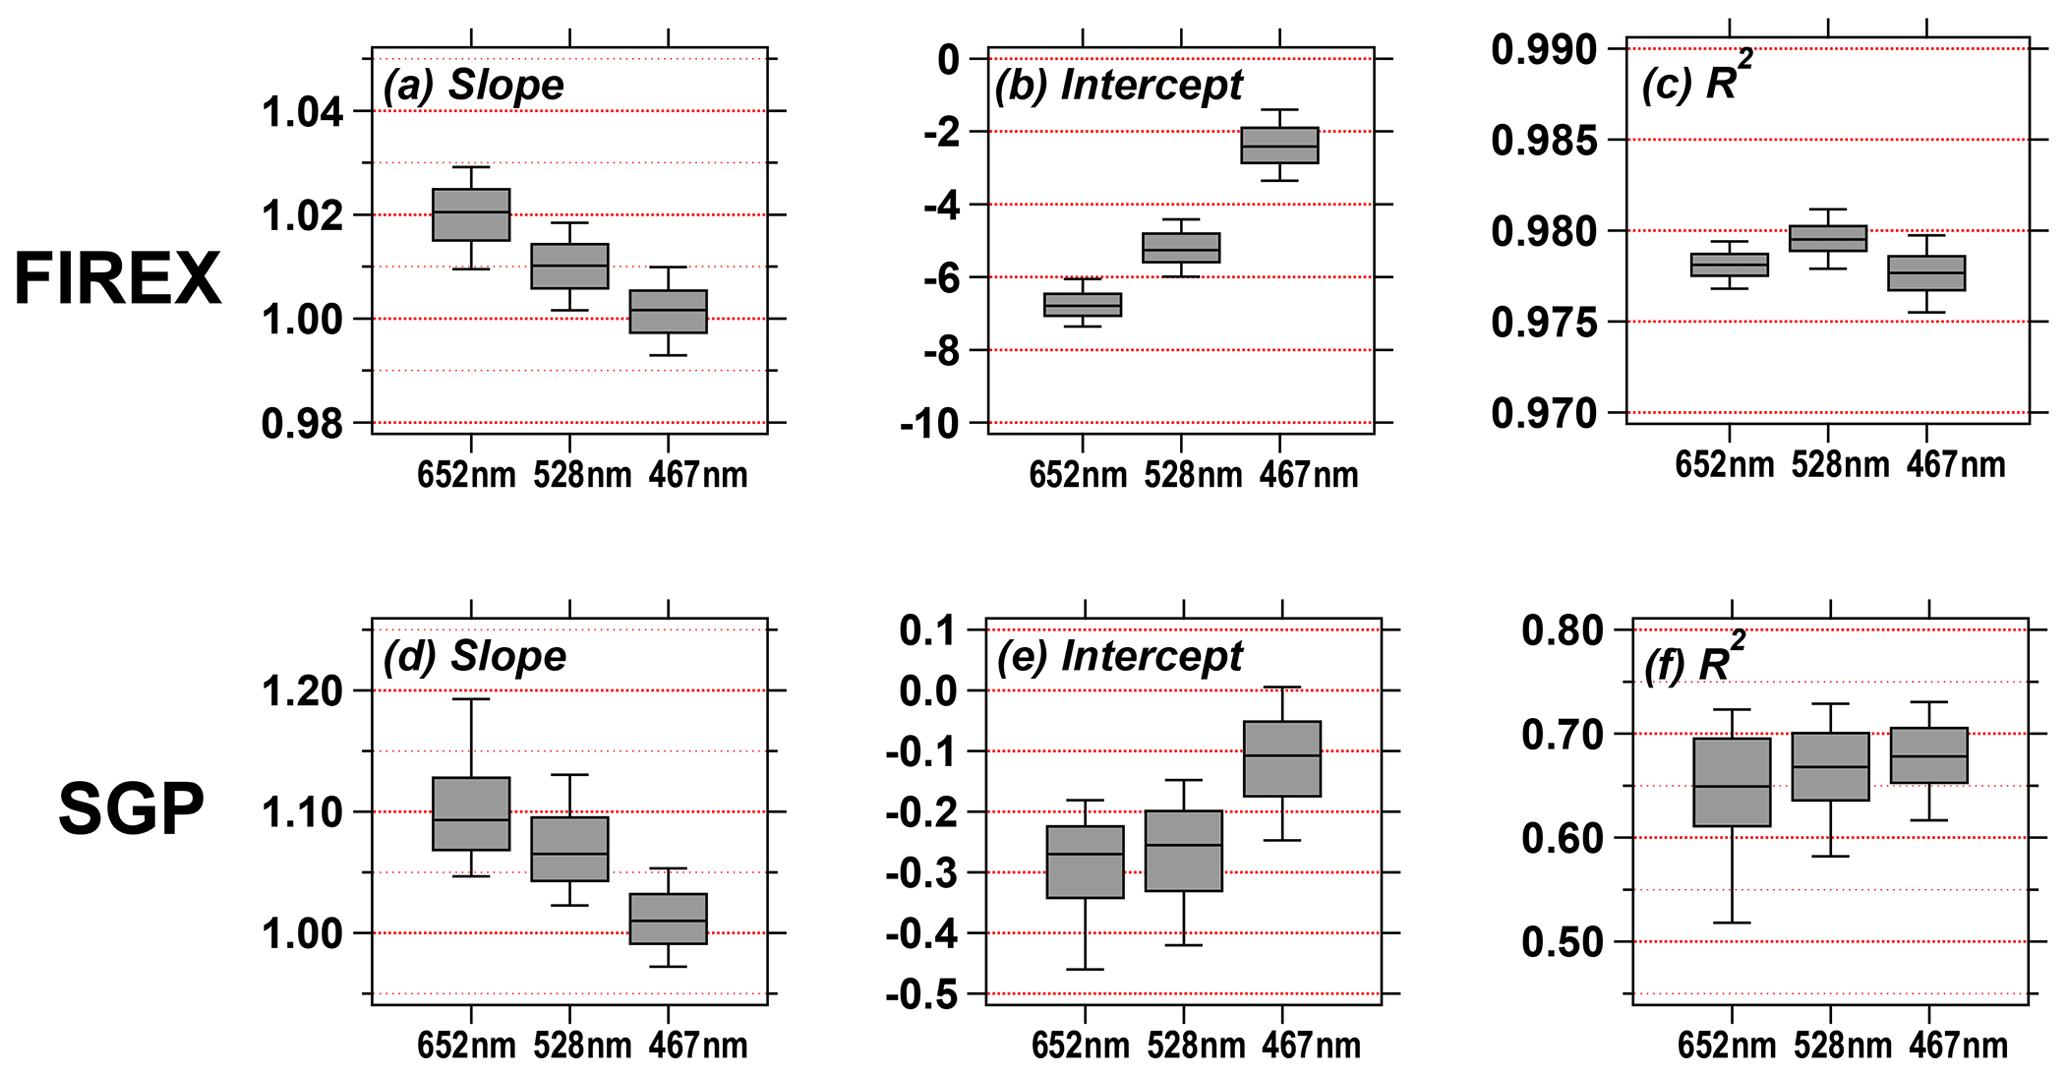
Figure 5The box-and-whisker plots for the slope, intercept, and R2 of the relationship between the CLAP-derived Babs (corrected by Algorithm B in the present work) and PAX-derived Babs for all three wavelengths. For details on how these values were generated, please refer to the text.
We next investigate the repeatability of the coefficient values presented in Table 4 by randomly selecting half of the measurements (N= 1338) from the whole FIREX dataset. By implementing Algorithm A for the extracted observations, we obtain new coefficient values for G0 to G7. This is repeated 1000 times to obtain a distribution of coefficient values (Fig. S13). The extraction approach mimics the process of obtaining new biomass burning datasets so that we can estimate the variability of these derived coefficients. From Fig. S13 and Table S12, the derived coefficients are mostly insensitive to the different randomly extracted datasets; most of the quartile deviation (defined as (Q3−Q1)∕2, where Q1 and Q3 are the first and third quartile, respectively) is within 0.05 except G4, which has a quartile deviation of ∼0.08. Consequently, the coefficient values obtained in Algorithm A appear to be reasonable initial guesses to correct filter-based absorption measurements during biomass burning events when the reference Babs is unavailable, such as in Algorithm B and Algorithm C.
We next implement Algorithm B for the CLAP BATN data from Fig. 3 using the initial guesses of the coefficients derived from Algorithm A (Table 4) along with reference Bscat values. To get a sense of the variability in the results, we randomly select half of the data and applied the correction; this process is repeated 1000 times. For each iteration, we compare the corrected Babs from the CLAP to the reference Babs from the PAX; the resulting slope, intercept, and R2 values are summarized as box-and-whisker plots in Fig. 5. For all three wavelengths, the slopes are close to unity, and there is good correlation between the two absorption measurements (R2≈0.98), which indicates that the good performance seen in Fig. 4 is independent of the reference Babs measurements and our algorithm is able to correct “new” BATN. Consequently, when scattering measurements are colocated with filter-based absorption measurements, our new correction algorithm performs well.
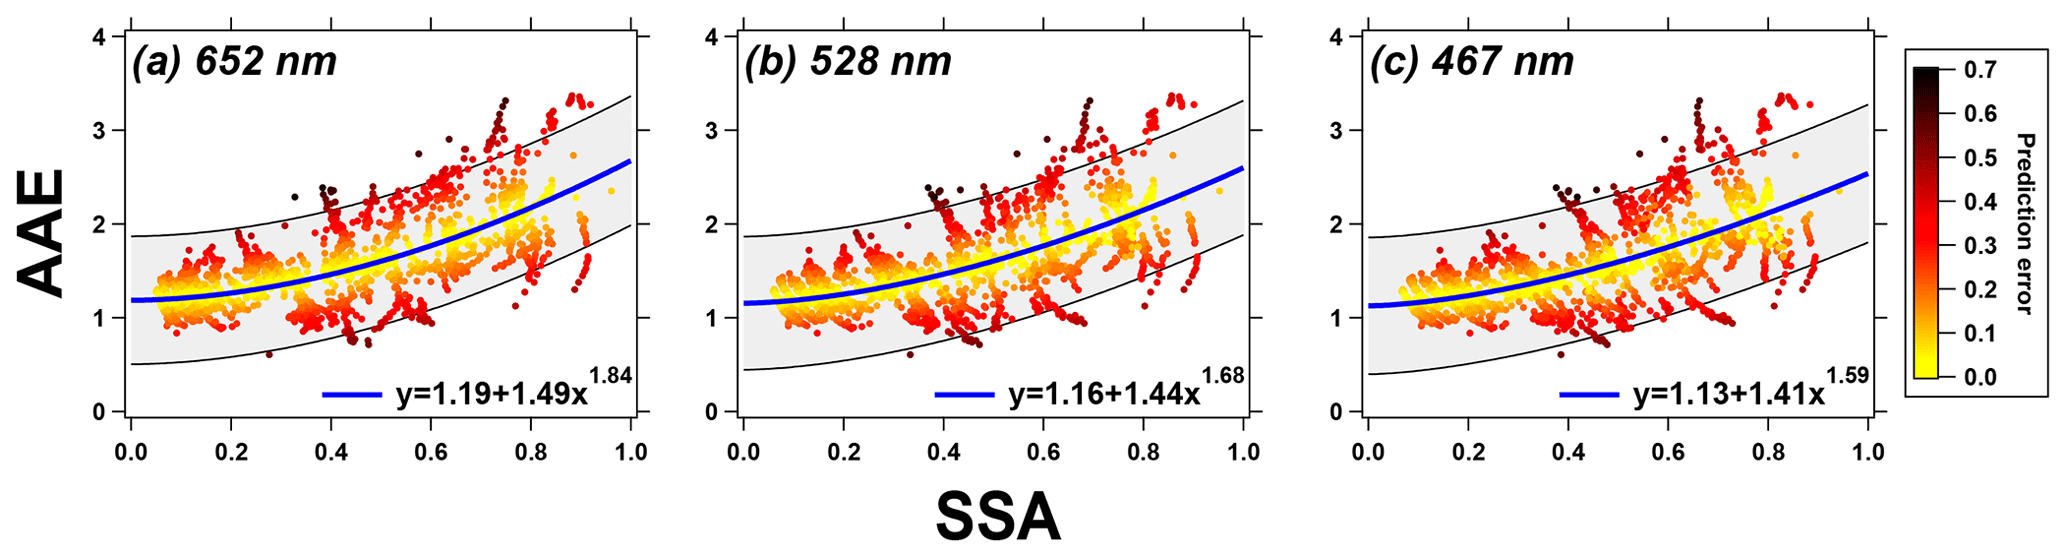
Figure 6AAE plotted against SSA for the FIREX data. In the figures, AAE was computed using a power-law fit across all three wavelengths, and SSA was computed using the interpolated Bscat from the two PAXs and the reported BATN from the CLAP. The data points are colored by their prediction error (true AAE minus calculated AAE divided by calculated AAE).
Lastly, we apply Algorithm C to the data in Fig. 3. However, we first require a functional relationship between AAE and SSA because in this scenario, the CLAP BATN values are the only data input to the algorithm (and therefore SSA is unknown). Liu et al. (2014) proposed that a power function can describe this relationship (AAE SSAc); we present these data from FIREX along with power function fits (and associated prediction intervals) in Fig. 6. To define AAE in this figure, we fit a power-law relationship to the three BATN values from the CLAP; similarly, we define SSA using interpolated Bscat from the PAX and BATN from the CLAP (the rationale for using BATN is that if Algorithm C were to be implemented in practice, only BATN would be available). In Fig. 6, the data points are colored by “prediction error”, effectively a metric to quantify how well the power function reproduces the individual data points. Although there is a fair amount of error in some of these points, we still obtain an SSA–AAE relationship required to initialize Algorithm C.
Even though there is uncertainty in the SSA vs. AAE relationship used in Algorithm C, after corrections have been applied, the filter-based Babs for the CLAP agrees well with the independent reference Babs; the slopes for all wavelengths are slightly greater than 1 (1.03–1.05) and the R2 values are all high (0.97–0.98). However, even though the absorption measurements are corrected well, there are still large uncertainties in values of inferred scattering. Examples of this are provided in Fig. 7, where we compare the SSA inferred from the PAX to the SSA inferred from Algorithm C as well as Bscat for each wavelength. Generally speaking, data that are better represented by the SSA vs. AAE relationship (i.e., smaller prediction error) result in better agreement with the reference for both SSA and Bscat, but there is also a clear divergence from the 1:1 line in Fig. 7a–c as SSA decreases. Therefore, even though Algorithm C performs well at correcting filter-based BATN to agree with the reference Babs, estimates of final SSA values should be considered to be uncertain.
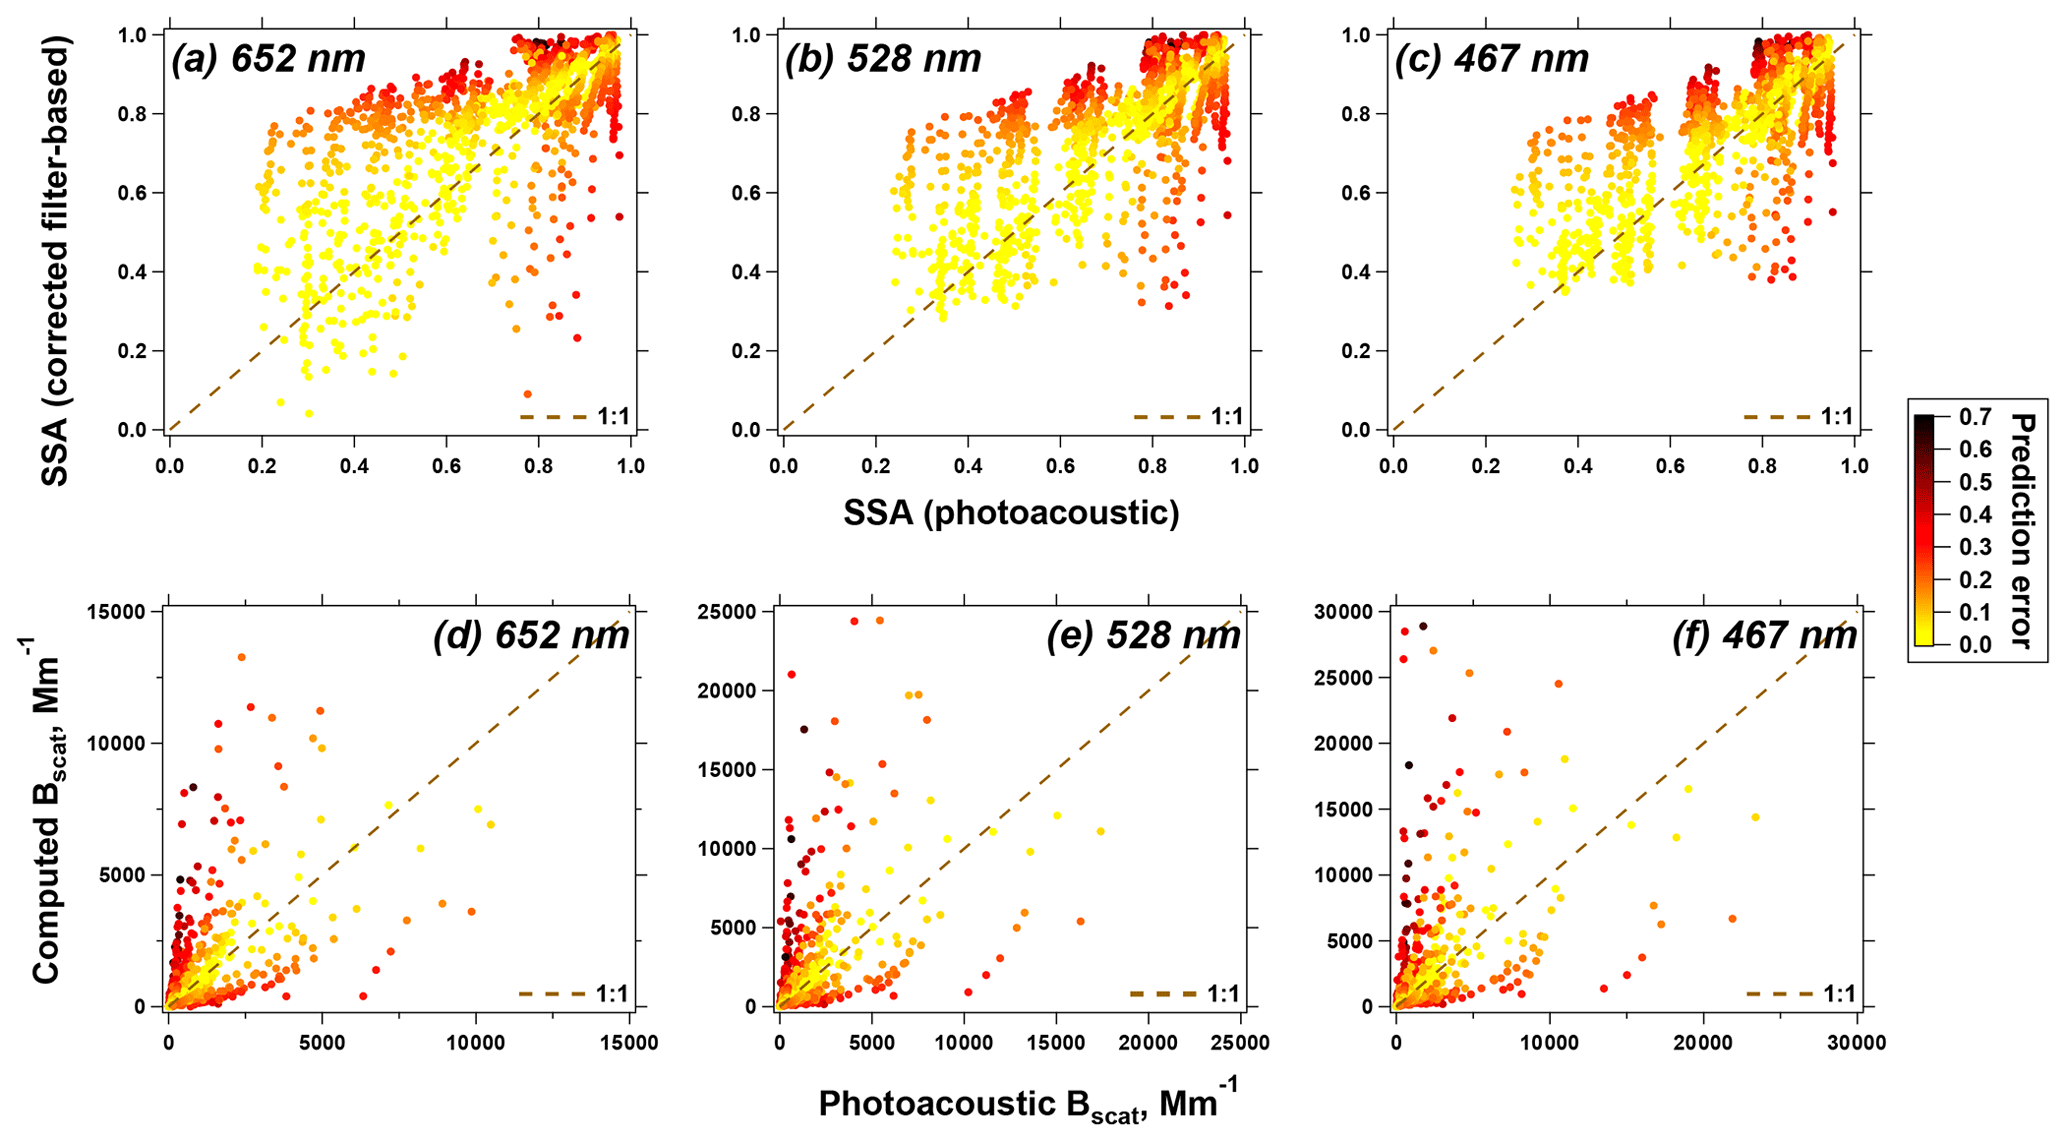
Figure 7Comparison of SSA (a–c) and Bscat (d–f) at the three wavelengths for the FIREX data. Vertical axis: values output from Algorithm C; horizontal axis: values calculated using the photoacoustic Babs and Bscat.
To explore the generalization of the new algorithms across different instruments, we next apply our algorithms to the other filter-based absorption photometers operated during the FIREX study (TAP and AETH). Consistent with what we observed for the CLAP results, the corrected TAP- and AETH-derived Babs is in good agreement with the photoacoustic Babs (as demonstrated in Tables 4 and 5, as well as Figs. S11–S12). Moreover, the corrected Babs values from the three filter-based instruments agree with each other for all three wavelengths (Table 6), confirming the consistency of our algorithm.
Table 6Intercomparison between different filter-based Babs corrected by Algorithm A in the present work. The value in the parentheses represents the coefficient of determination (R2) of the linear relationship.
3.3 Application of the new algorithms to ambient data
To test our algorithms further, we extended our work to ambient data collected at the DOE SGP site in the time period during which the PASS-3 was operational. From the SGP data, we derived a different set of coefficients for ambient data using Algorithm A, which differ from those derived for FIREX (Table 4). The results presented in Fig. 8 and Table 5 suggest that our new algorithm works at least as well as B1999 and V2005 on this dataset (both with updated coefficients). The repeatability of the coefficient values in Algorithm A is confirmed for the SGP measurements using the same procedure as described in Sect. 3.2 (see results in Fig. S13 and Table S12).
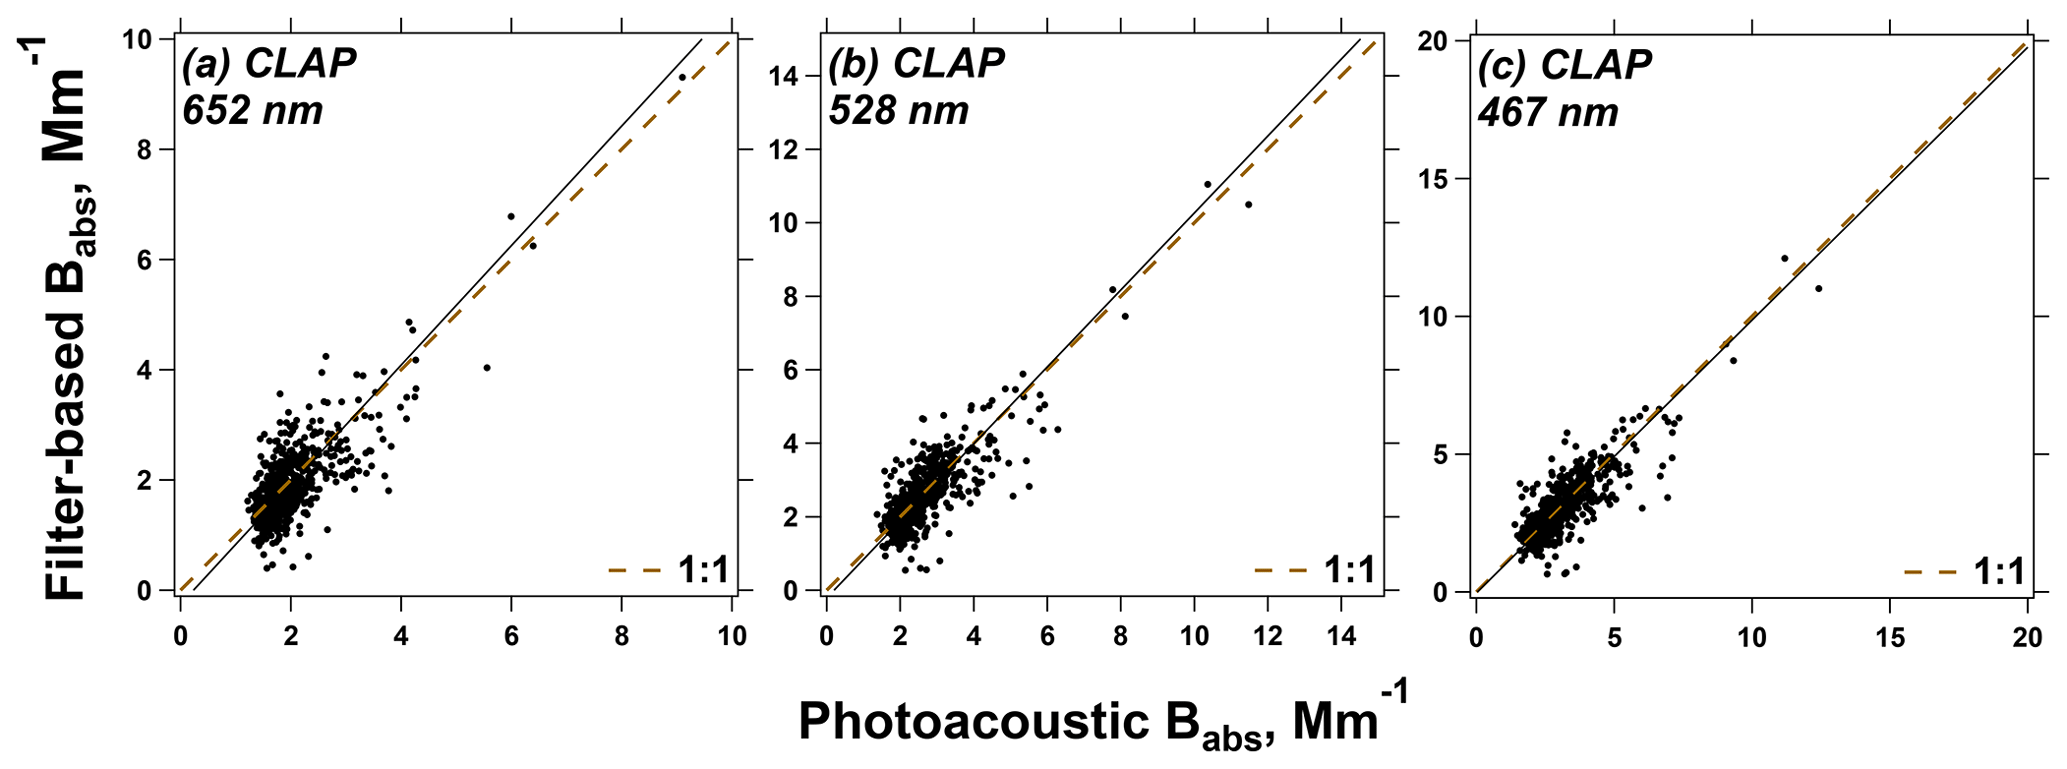
Figure 8Intercomparison between the CLAP-derived Babs corrected by Algorithm A in the present work and reference Babs at 652, 528, and 467 nm for the ambient data at the SGP study area. The solid line represents the linear regression, while the dashed line is a 1:1 line.
For the SGP data, we see similar performance to the FIREX data when we apply Algorithm B, whereby we again sampled half of the CLAP data, used the initial guesses derived in Algorithm A, and repeated this process 1000 times. Although the slopes tend to be larger than 1 (i.e., the corrected CLAP Babs remains high relative to the PASS Babs), the results still represent an improvement over B1999 and V2005 using their recommended coefficients for their correction equations.
Implementing Algorithm C is challenging for ambient data because there is no distinct power function relationship in AAE vs. SSA (Fig. 9); this is consistent with other field studies reporting both SSA and AAE (e.g., Backman et al., 2014 and Lim et al., 2018). Our approach described here is only appropriate for ambient aerosols that follow a power function, such as sites impacted by biomass burning. Nevertheless, we did apply this to a subset of the SGP data for which the AAE–SSA prediction error is within 30 % (N=86), and for this subset of data, Algorithm C works fairly well (slopes ≈0.95; see Fig. S14). Therefore, while Algorithm C may have utility for ambient data, we advise caution when using this algorithm since the aerosols influencing the site may not be represented by a clear AAE–SSA power function (e.g., when biomass burning and coarse aerosols are equally prevalent at a long-term monitoring site).
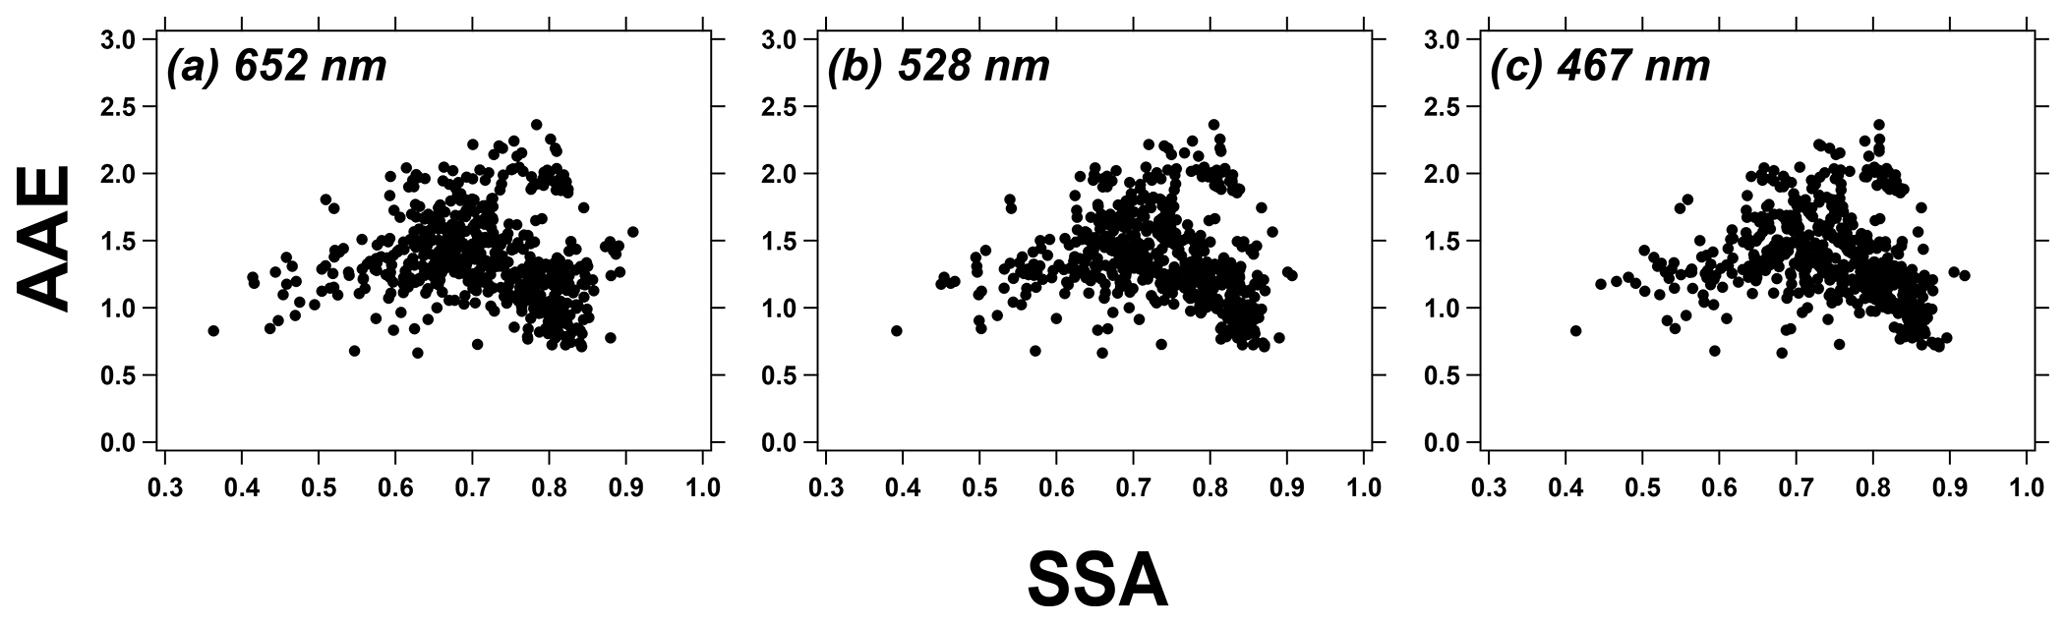
Figure 9AAE plotted against SSA for the SGP ambient data. The power-law fit (AAE SSAc) is performed on SSA (SSA )) and AAE computed by three-wavelength BATN.
These new algorithms are also applicable to the PSAP deployed at the SGP site. The results of the correction for the PSAP are presented in Table 5 and Fig. S11, and the recommended initial guesses when implementing Algorithm B to PSAP BATN in ambient environments are given in Table 4. As expected, there is good agreement between corrected PSAP and CLAP Babs (Table 6).
To investigate if our algorithms are suitable to correct Babs obtained from different ambient environments, the aerosol properties from the SGP site are compared to those from the other NOAA/ESRL observational sites. We use a similar AAE–SAE space as that in Cappa et al. (2016) and Schmeisser et al. (2017) to infer dominant aerosol types (e.g., BC, BrC, dust, mixed dust–BC–BrC; see Fig. S15). Our results of AAE and SAE overlap most of the values from the NOAA/ESRL sites, except when marine aerosols or dust contribute to the local aerosol emissions. Though none of the NOAA/ESRL sites fall into the clusters of BC or BC–BrC, some of our data can represent the optical properties of aerosols from these clusters. Therefore, we highlight that our algorithm developed by the SGP data may have the potential to be generalized to a variety of environmental conditions, but we would need to validate this using observations from more studies.
3.4 Impact of the implemented correction algorithm on aerosol optical properties
In addition to the direct comparisons of Babs between the filter-based and photoacoustic measurements, we compare derived optical properties (AAE and SSA) from different instruments to assess the algorithms' performance on derived aerosol optical properties. For example, we have discussed the discrepancy of SSA between the filter-based and photoacoustic measurements when implementing Algorithm C in Sect. 3.2. In this section we will more broadly discuss the impact of different correction algorithms on AAE and SSA.
In Fig. 10, we present the frequency distribution of AAE for both FIREX and SGP data generated from different campaign and/or instrument pairs using different correction approaches. For the FIREX data (Fig. 10a–b), most corrections (with the exception of the default B1999) are consistent with the photoacoustic data, while for the SGP data (Fig. 10c–d), most corrections (with the exception of default V2005) are consistent with the photoacoustic data. However, updating the coefficients for B1999 and V2005 improves the agreement with the photoacoustic data. The 50 % difference that exists between the B1999 and V2005 algorithms in all panels in Fig. 10 is consistent with previous studies. For example, both Backman et al. (2014) and Davies et al. (2019) found that V2005-derived AAE is greater than B1999-derived AAE by 33 % to 50 % for ambient aerosols. Therefore, we highlight that the default coefficients in B1999 and V2005 may have some limitations when deriving AAE using the corrected Babs; instead, updating the coefficients or using the new algorithm proposed in this work may yield more robust AAE results.

Figure 10The frequency distribution of AAE calculated for different instrument–correction combinations of multiwavelength Babs.
Similar to Fig. 10, we also investigate the distribution of SSA computed by using corrected Babs along with Bscat. We provide the results at 652 nm as an example in the main text (Fig. 11); figures for 528 and 467 nm can be found in the Supplement (Figs. S16 and S17). For both FIREX and SGP data, the SSA obtained using the new algorithm agrees very well with the B1999 and V2005 but only when their coefficients have been updated. Calculations of SSA using B1999 and V2005 with their recommended coefficients suggest that these values may be biased low, which follows the overestimation of corrected Babs demonstrated in Fig. 2.
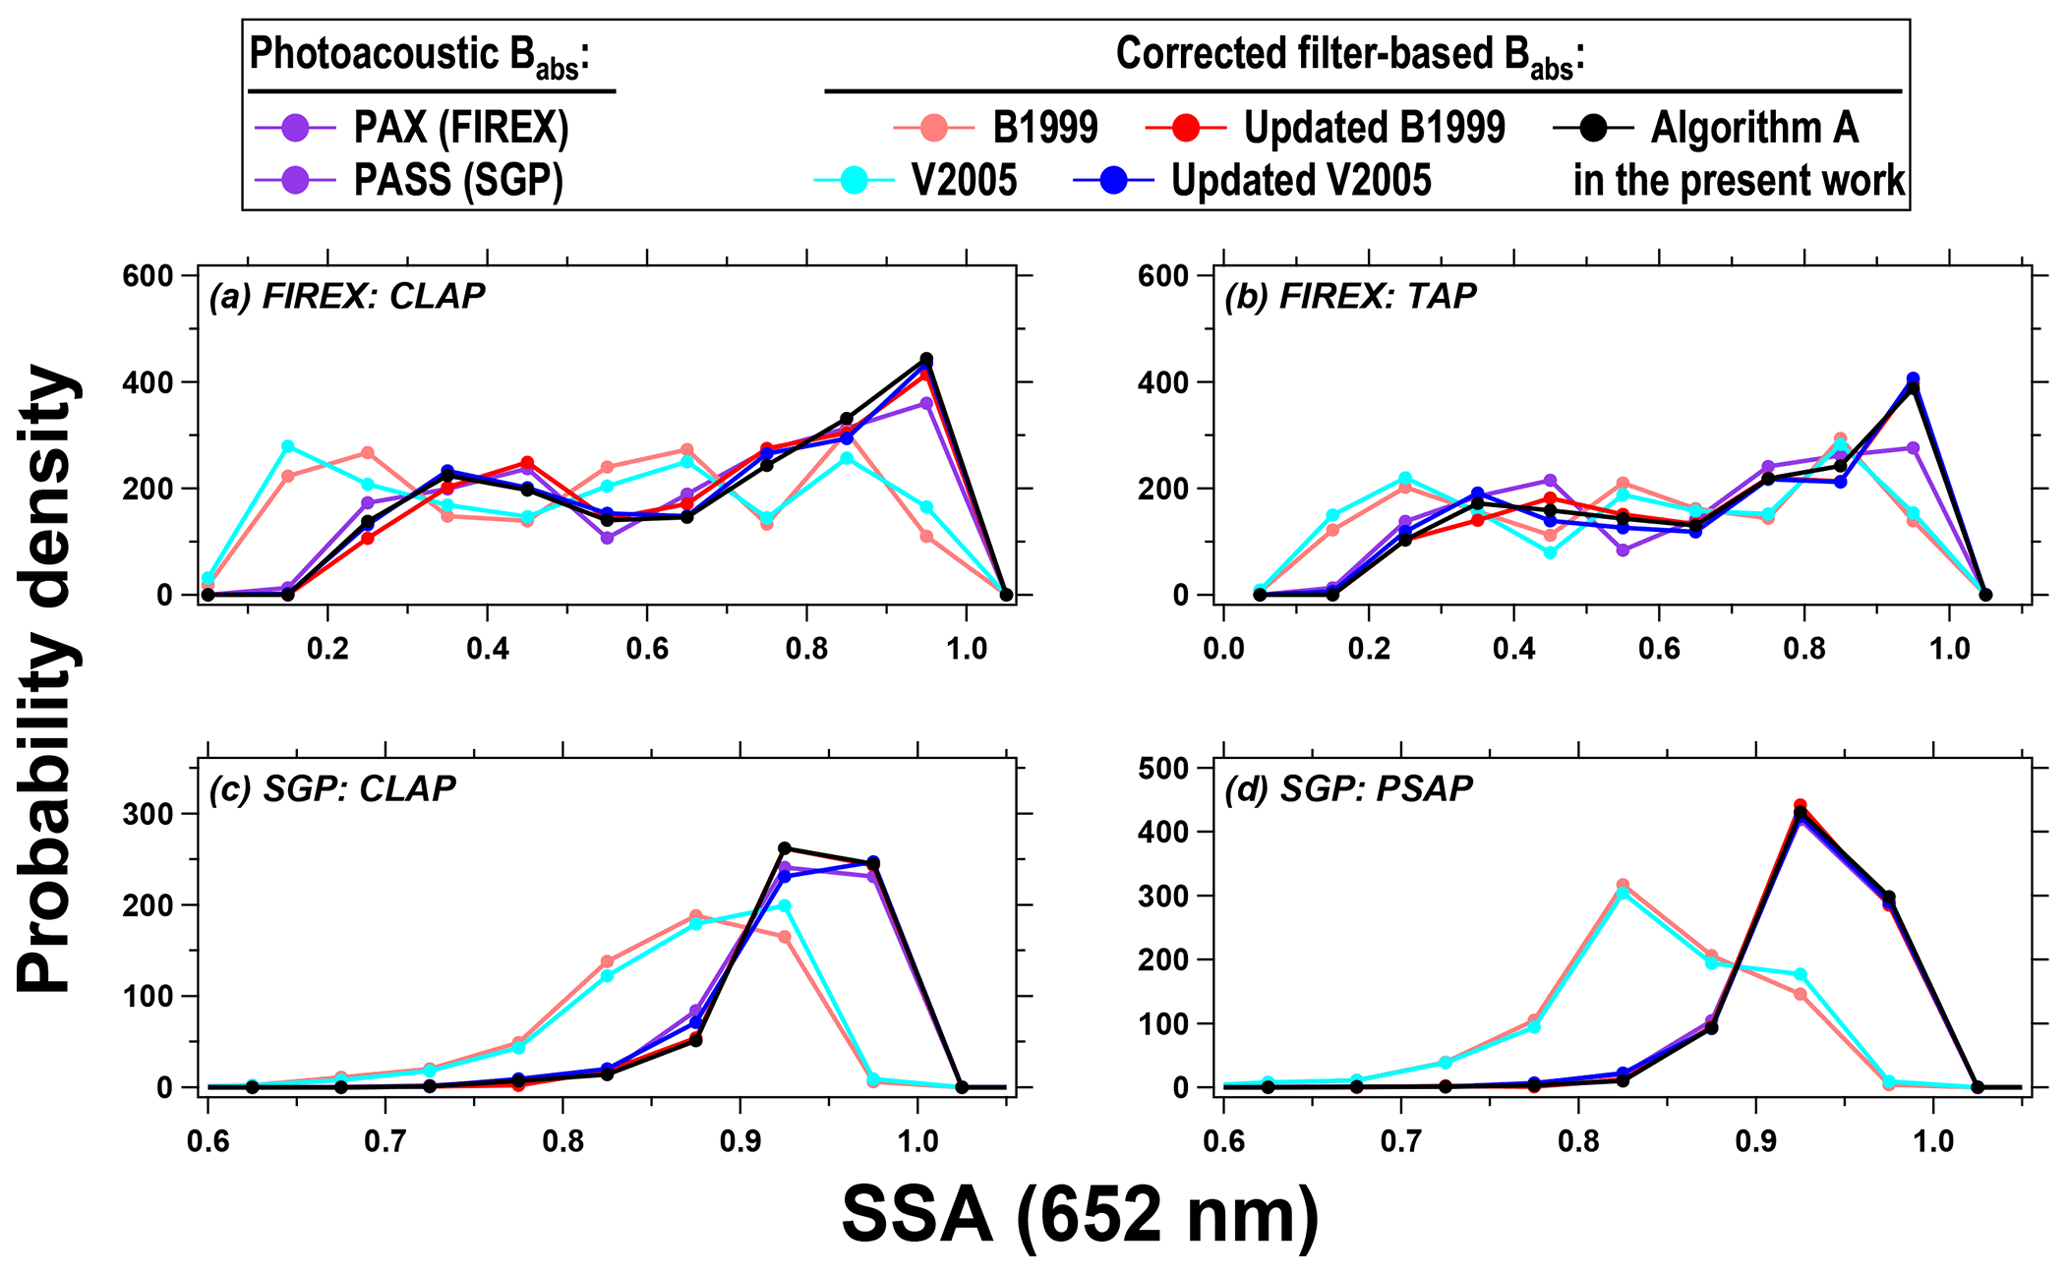
Figure 11The frequency distribution of SSA (652 nm) calculated for different instrument–correction combinations of Babs and Bscat.
Moreover, we plot similar figures as Figs. 10–11 using all algorithms (A, B, and C). As shown in Fig. S18, the results using Algorithm B agree very well with those using Algorithm A, but the use of Algorithm C results in some obvious discrepancies compared to the photoacoustic reference, again highlighting the potential for large uncertainty using this algorithm.
In Fig. 12, we directly compare the distributions of both AAE and SSA at 652 nm for all of the filter-based absorption photometers considered here using our Algorithm A to correct the BATN data. For both datasets, after the corrections have been applied, there are only marginal differences in the AAE (Fig. 10a and b) derived by different instruments. Similarly, there is good agreement among the SSA values when using corrected Babs from different instruments (Fig. 10c and d). Overall, the derived properties using the new correction are consistent across all instruments, suggesting its generalizability.
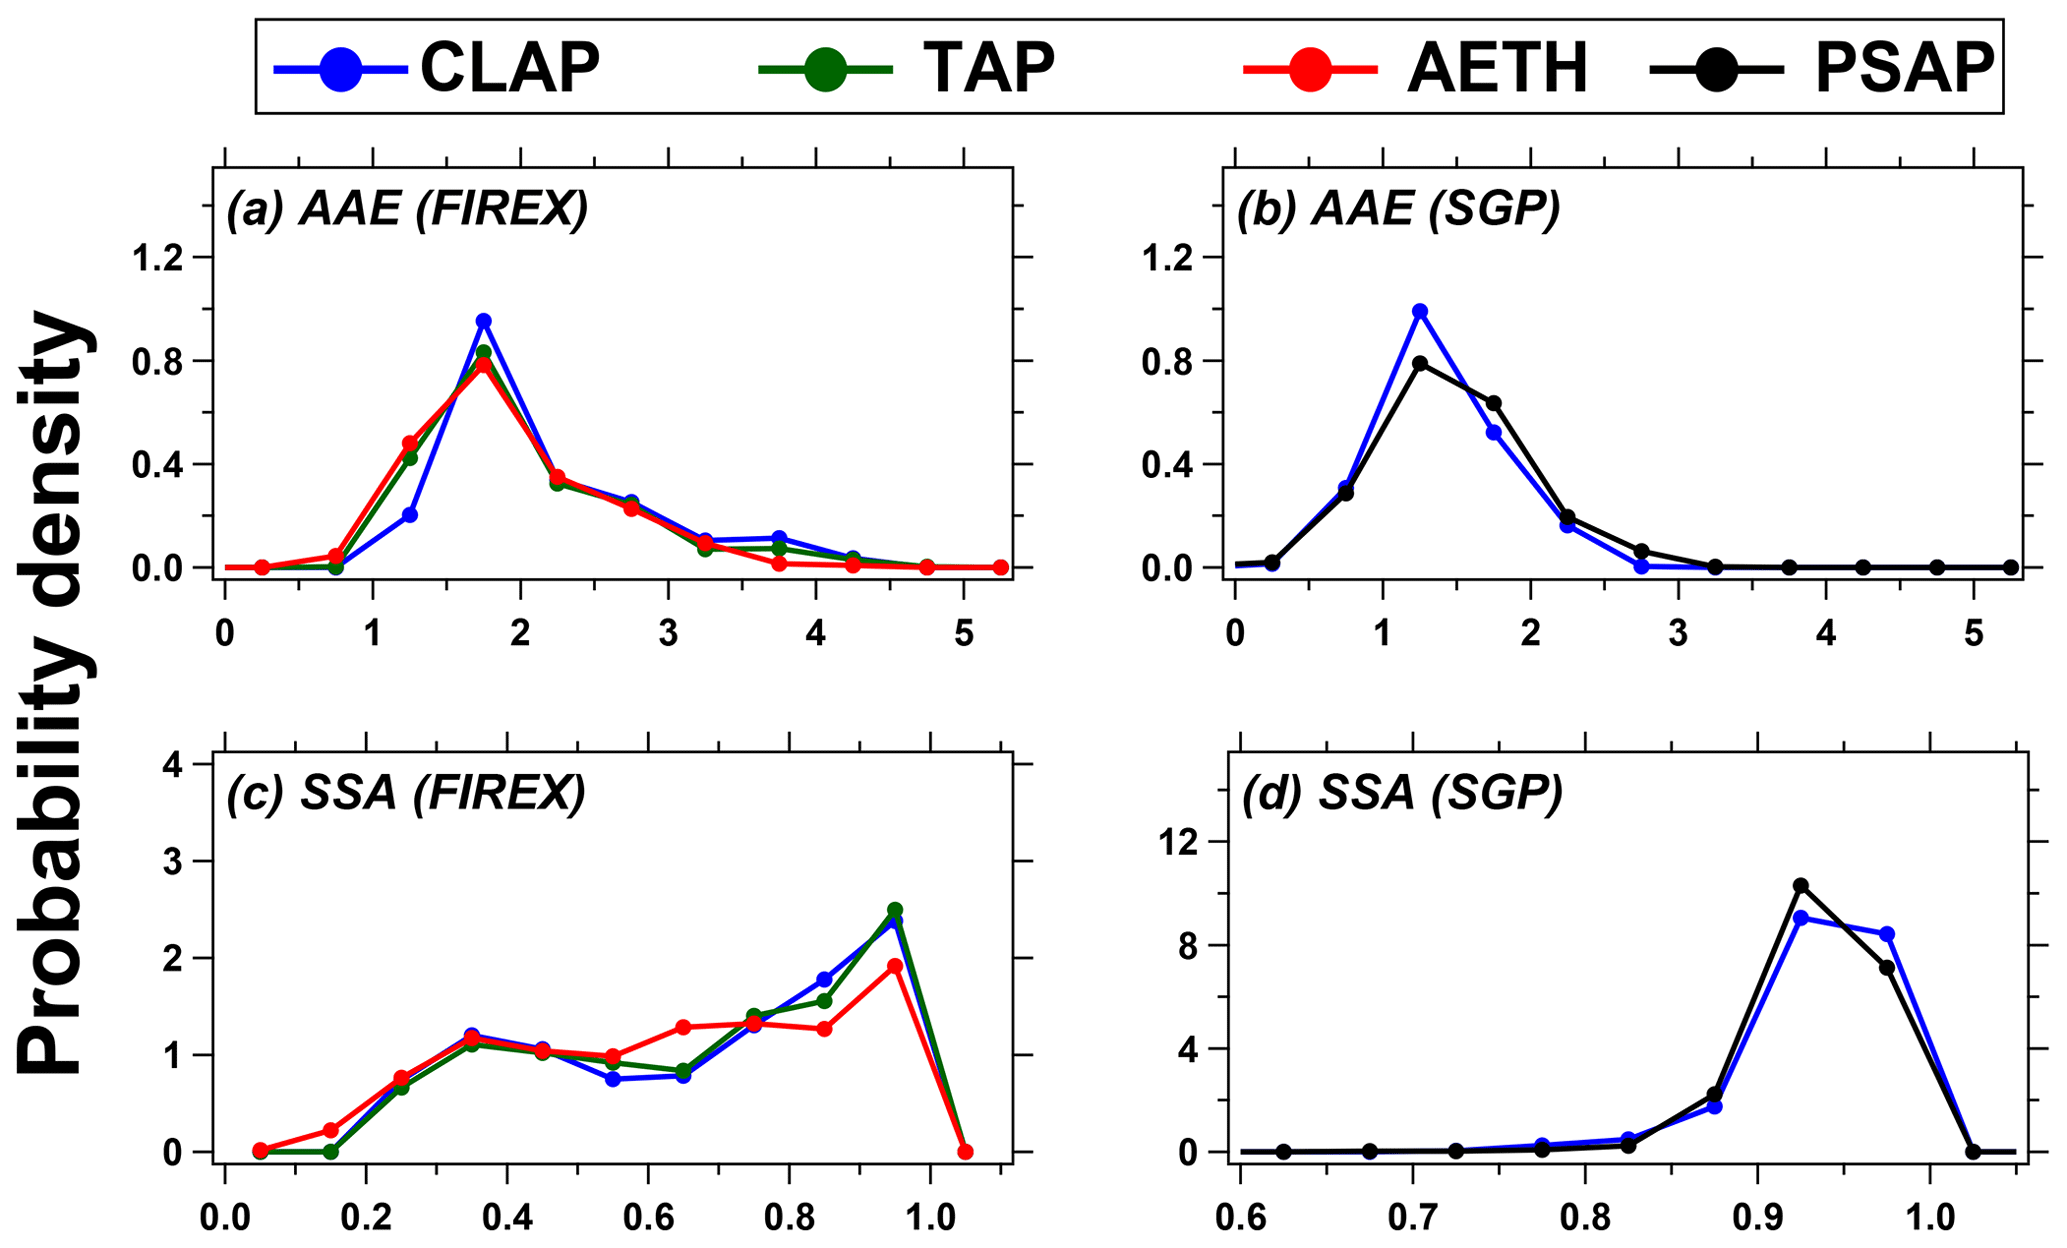
Figure 12The probability density of AAE and SSA (652 nm) derived by different filter-based photometers Babs (corrected by Algorithm A in the present work). Note that the number of total observations varies across instruments.
3.5 Uncertainty of the new algorithms
In this section, we estimate the uncertainty of the new algorithms due to both measurement uncertainties of the instruments and the uncertainties of parameter computation. We then simulate the propagated uncertainty in the corrected filter-based Babs reported in this paper.
Measurement uncertainties of the instruments considered here have been reported in previous work (e.g., Anderson et al., 1996; Nakayama et al., 2015; Ogren et al., 2017; Sherman et al., 2015) and are summarized in Table 1. The typical sources of measurement uncertainty of the aerosol instruments include (1) instrument noise (often associated with the averaging time); (2) calibration uncertainties (such as the accuracy of the operating wavelengths and the properties of the calibration materials); (3) standard temperature and pressure (STP) correction uncertainties (Sherman et al., 2015); and (4) flow rate uncertainties. Additional uncertainties that are specific to filter-based absorption photometers include spot size and filter medium corrections (Bond et al., 1999; Ogren et al., 2017). Regardless, these values all tend to be ≤30 %, which is consistent with other commonly used aerosol instrumentation.
Because correction algorithms for filter-based absorption instruments also require aerosol optical properties, the algorithms' performance will be affected by these values as well. For example, uncertainties in SSA are directly related to uncertainties associated with Babs and Bscat, which are both included in our simulations. However, capturing uncertainties in AAE is more complex, as AAE can be computed by either a 2λ fit (a linear fit using Babs at two wavelengths) or 3λ fit (the same as the power fit used in the present work). Davies et al. (2019) used the 3λ fit to calculate AAE and compared this to calculations using 662 and 785 nm (i.e., AAE662∕785), finding that the 3λ results were about 50 % greater. Moreover, similar differences (−35 % to 85 %) can exist when comparing two different 2λ combinations (AAE440∕870 and AAE675∕870), depending on the contribution of brown carbon to absorption at 440 nm (Wang et al., 2016). However, based on Figs. S19 and S20, we demonstrate small (< ∼10 %) differences in the calculated values of AAE using our Algorithm A with different 2λ combinations for linear fits and the 3λ power-law fit when considering both FIREX and SGP data. Consequently, we do not include AAE calculation uncertainty in our simulation.
In our simulations, the propagated uncertainty of corrected Babs is estimated by implementing the new algorithm for datasets in which filter-based BATN, reference Babs, and Bscat are subject to measurement uncertainties. The full procedure is outlined in the Supplement, but we provide a brief overview of our Monte Carlo approach here. First, we create a synthetic dataset (n=500 records) that defines Babs at 652 nm and AAE that is intended to represent biomass burning. Values of BATN and SSA are then computed using the relationships presented in Figs. 3 and 6, respectively. Respective uncertainties associated with each of these values are applied following Table 1, assuming that these follow a normal distribution. We then applied Algorithm B to the BATN dataset, repeated 1000 times, to quantify the overall uncertainty associated with our correction algorithm.
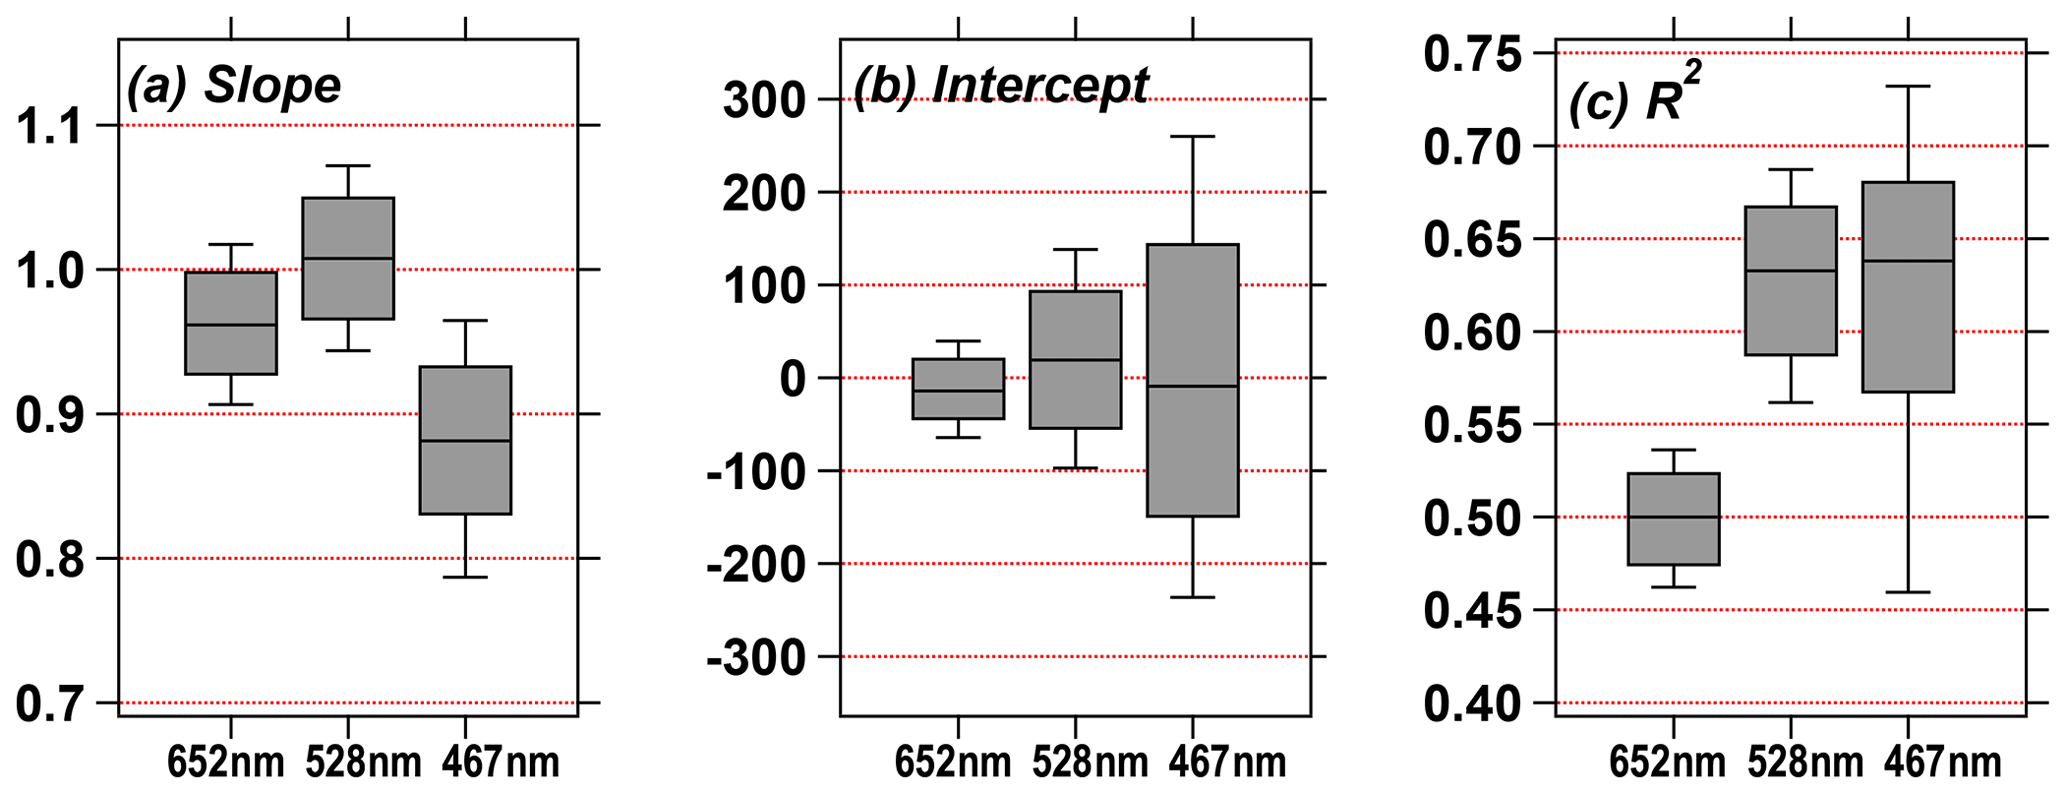
Figure 13The box-and-whisker plots (slope, intercept, and R2) for the Monte Carlo simulation of the relationship between the CLAP-derived Babs (corrected by Algorithm B in the present work) and “true” Babs for all three wavelengths.
Figure 13 provides a graphical summary of our uncertainty simulation results, which was derived by fitting linear equations to the “true” Babs value (that we defined) and the “corrected” Babs values (outputs of each iteration). Considering the slopes (Fig. 12a), our algorithm can generally reproduce the true value within 10 % at 652 and 528 nm, but the performance is slightly degraded at 467 nm. The median intercept for our simulations is close to zero, but the interquartile range increases with decreasing wavelength (Fig. 12b), suggesting that the uncertainty may increase at shorter wavelengths. The coefficients of determination (Fig. 12c) range from 0.47 (652 nm) to 0.68 (467 nm), showing that the algorithm may be less precise if large measurement uncertainties exist. Even though these sources of uncertainty exist when implementing our correction algorithms and propagate through to the corrected values, we argue that our new algorithm will standardize uncertainties across corrected Babs values from filter-based absorption photometers. Moreover, the new algorithms perform at least better than the previous algorithms with default coefficients or as well as the previous algorithms with updated coefficients.
Filter-based absorption instruments are widely used at global observational sites due to their relatively low cost, fast response, and easy operation. Despite the existence of different correction algorithms to correct the filter-based Babs measurements, these are not “standardized” as differences in corrected Babs values exist across different instrument–correction combinations, even when the instruments are colocated. This study provides a systematic evaluation of the previous correction algorithms (B1999 and V2005 corrections) on the CLAP and similar instruments (TAP and PSAP) using both laboratory-generated biomass burning emissions and ambient aerosols. We also developed new correction algorithms that are applicable to any filter-based absorption photometer (e.g., PSAP, CLAP, TAP, AETH), which will have utility for any historic or future filter-based absorption measurements and which have the potential to standardize absorption coefficients across all filter-based instruments. This latter point is demonstrated in Table 6 and Fig. 12 in that there is good agreement across all filter-based absorption photometers when applying our corrections to both biomass burning and ambient data. In practice, we anticipate that our Algorithm B will be the most common because at long-term monitoring sites, filter-based absorption photometers are typically colocated with a nephelometer.
Using the existing corrections on our CLAP measurements, we find that the corrected Babs overestimates photoacoustic Babs by factors of ∼2.6 (biomass burning aerosols) and ∼3.2 (ambient aerosols). Similar overestimations of absorption by filter-based instruments are seen in the results of TAP from the FIREX study and PSAP deployed at the SGP. Comparing B1999 and V2005, Babs values corrected by the two corrections differ by −6 % to 18 %. These discrepancies in our results are consistent with those reported for intercomparisons between filter-based and photoacoustic absorption instruments (e.g., Arnott et al., 2003; Davies et al., 2019; Li et al., 2019; Müller et al., 2011a).
Overall, our new developed algorithms (A, B, and C) perform well in correcting Babs for different filter-based absorption photometers (CLAP, TAP, PSAP, and AETH) from both biomass burning and ambient measurements. Our work suggests that if the filter-based instrument is co-operated with a reference absorption instrument and a NEPH in the field for a period, researchers can compute site-specific initial guesses (the same as Algorithm A in the present work). Otherwise, either Algorithm B or Algorithm C proposed in this paper can be used to correct the filter-based measurements. In Algorithm B when a filter-based absorption photometer is colocated with a NEPH but without a reference instrument, the set of coefficients yielded in this work (Table 4) can be used as initial guesses to implement the algorithm. In Algorithm C when a filter-based absorption photometer is operated by itself, a “representative” relationship between AAE and SSA can be used to estimate SSA from AAE at each step in the iterative process, but we advise caution if this relationship is not monotonic (e.g., as in the ambient data from SGP and from Backman et al., 2014, and Lim et al., 2018). The only scenario not included in the present work is when the filter-based absorption photometer is colocated with a reference absorption instrument but no instrument for scattering. However, under this scenario, one could simply use the photoacoustic Babs data because no filter-induced biases exist for those instruments.
In terms of the aerosol optical properties (AAE and SSA) computed by different corrections, the new algorithm suggests no bias of AAE and SSA when compared to that derived by updated B1999 and updated V2005 for both aerosol datasets.
However, the new algorithm is not without limitations. First, we used the photoacoustic Babs as the reference to develop the algorithm and the initial guess of the coefficients; meanwhile, some studies argue that photoacoustic absorption is not a “ground truth” (e.g., Lack et al., 2006; Lewis et al., 2008). Thus, we simulate the propagated uncertainty of our algorithms considering the measurement uncertainties due to the photoacoustic Babs (as well as BATN and Bscat) and find that the corrected Babs can be biased by −17 % to 5 %, depending on the operated wavelength. Although potential bias due to the precision of photoacoustic Babs cannot be excluded, using our new algorithm to correct the filter-based Babs will at least eliminate correction-related biases among different filter-based instruments. Second, we only tested the algorithms with data from biomass burning and ambient measurements. It is unclear how the algorithms will work for other absorbing aerosols (e.g., dominated by fossil fuel emissions or mineral dust). Further evaluation of the performance of the new algorithm on other aerosol sources may help to address this issue. Regardless, we argue that our approach can standardize reported absorption coefficients at long-term monitoring sites, which has the potential to yield a better dataset with which to evaluate chemistry–climate models.
The code for the algorithm was initially written in Igor Pro (WaveMetrics Inc.) and has been developed to be accessible through either Python (version 3.7.5) or Igor Pro. The implementation of our algorithm is available at https://doi.org/10.5281/zenodo.3742342 (Li et al., 2020). The FIREX aerosol products are available at the NOAA CSL data archive https://esrl.noaa.gov/csl/projects/firex/firelab/ (National Oceanic and Atmospheric Administration, 2020). The SGP aerosol products are available at the DOE ARM data archive https://www.archive.arm.gov/discovery/ (US Department of Energy, 2020) (February 2013–July 2013; 36∘36′ 18.0′′ N, 97∘29′6.0′′ W: Southern Great Plains Central Facility).
The supplement related to this article is available online at: https://doi.org/10.5194/amt-13-2865-2020-supplement.
HL developed the model, conducted the evaluations, and drafted the paper. AAM and GRM edited the paper and obtained funding.
The authors declare that they have no conflict of interest.
The authors would like to thank Allison Aiken (Los Alamos National Laboratory) for useful discussions regarding the SGP PASS-3 data. The authors greatly acknowledge Vanessa Selimovic and Robert Yokelson from the University of Montana for lending us the PAX-405; Patrick Sheridan, John Ogren, and Derek Hageman from NOAA for lending us the CLAP; and Anthony Prenni from the National Park Service for lending us the AETH during the FIREX campaign. We also thank Nick Good (Colorado State University), Jim Roberts (NOAA), and Carsten Warneke (NOAA) for their on-site support at FSL. The ambient data at the SGP site in Lamont (OK, USA) were obtained from the Atmospheric Radiation Measurement (ARM) user facility, a U.S. Department of Energy (DOE) Office of Science user facility managed by the Office of Biological and Environmental Research.
The authors and FIREX data acquisition were supported by the National Oceanic and Atmospheric Administration, Climate Program Office (grant no. NA16OAR4310109).
This paper was edited by Paolo Laj and reviewed by two anonymous referees.
Allan, D. W.: Statistics of atomic frequency standards, P. IEEE, 54, 221–230, https://doi.org/10.1109/PROC.1966.4634, 1966.
Alvarado, M. J., Lonsdale, C. R., Macintyre, H. L., Bian, H., Chin, M., Ridley, D. A., Heald, C. L., Thornhill, K. L., Anderson, B. E., Cubison, M. J., Jimenez, J. L., Kondo, Y., Sahu, L. K., Dibb, J. E., and Wang, C.: Evaluating model parameterizations of submicron aerosol scattering and absorption with in situ data from ARCTAS 2008, Atmos. Chem. Phys., 16, 9435–9455, https://doi.org/10.5194/acp-16-9435-2016, 2016.
Anderson, T. L., Covert, D. S., Marshall, S. F., Laucks, M. L., Charlson, R. J., Waggoner, A. P., Ogren, J. A., Caldow, R., Holm, R. L., Quant, F. R., Sem, G. J., Wiedensohler, A., Ahlquist, N. A., and Bates, T. S.: Performance Characteristics of a High-Sensitivity, Three-Wavelength, Total Scatter/Backscatter Nephelometer, J. Atmos. Ocean. Tech., 13, 967–986, https://doi.org/10.1175/1520-0426(1996)013<0967:PCOAHS>2.0.CO;2, 1996.
Andrews, E., Sheridan, P. J., and Ogren, J. A.: Seasonal differences in the vertical profiles of aerosol optical properties over rural Oklahoma, Atmos. Chem. Phys., 11, 10661–10676, https://doi.org/10.5194/acp-11-10661-2011, 2011.
Andrews, E., Sheridan, P. J., Ogren, J. A., Hageman, D., Jefferson, A., Wendell, J., Alástuey, A., Alados-Arboledas, L., Bergin, M., Ealo, M., Hallar, A. G., Hoffer, A., Kalapov, I., Keywood, M., Kim, J., Kim, S.-W., Kolonjari, F., Labuschagne, C., Lin, N.-H., Macdonald, A., Mayol-Bracero, O. L., McCubbin, I. B., Pandolfi, M., Reisen, F., Sharma, S., Sherman, J. P., Sorribas, M., and Sun, J.: Overview of the NOAA/ESRL Federated Aerosol Network, B. Am. Meteorol. Soc., 100, 123–135, https://doi.org/10.1175/BAMS-D-17-0175.1, 2019.
Arnott, W. P., Moosmüller, H., Sheridan, P. J., Ogren, J. A., Raspet, R., Slaton, W. V., Hand, J. L., Kreidenweis, S. M., and Collett, J. L.: Photoacoustic and filter-based ambient aerosol light absorption measurements: Instrument comparisons and the role of relative humidity, J. Geophys. Res., 108, 4034, https://doi.org/10.1029/2002JD002165, 2003.
Arnott, W. P., Hamasha, K., Moosmüller, H., Sheridan, P. J., and Ogren, J. A.: Towards Aerosol Light-Absorption Measurements with a 7-Wavelength Aethalometer: Evaluation with a Photoacoustic Instrument and 3-Wavelength Nephelometer, Aerosol Sci. Tech., 39, 17–29, https://doi.org/10.1080/027868290901972, 2005.
Ayers, G. P.: Comment on regression analysis of air quality data, Atmos. Environ., 35, 2423–2425, https://doi.org/10.1016/S1352-2310(00)00527-6, 2001.
Backman, J., Virkkula, A., Vakkari, V., Beukes, J. P., Van Zyl, P. G., Josipovic, M., Piketh, S., Tiitta, P., Chiloane, K., Petäjä, T., Kulmala, M., and Laakso, L.: Differences in aerosol absorption Ångström exponents between correction algorithms for a particle soot absorption photometer measured on the South African Highveld, Atmos. Meas. Tech., 7, 4285–4298, https://doi.org/10.5194/amt-7-4285-2014, 2014.
Bergstrom, R. W., Pilewskie, P., Russell, P. B., Redemann, J., Bond, T. C., Quinn, P. K., and Sierau, B.: Spectral absorption properties of atmospheric aerosols, Atmos. Chem. Phys., 7, 5937–5943, https://doi.org/10.5194/acp-7-5937-2007, 2007.
Bond, T. C. and Bergstrom, R. W.: Light absorption by carbonaceous particles: An investigative review, Aerosol Sci. Tech., 40, 27–67, https://doi.org/10.1080/02786820500421521, 2006.
Bond, T. C., Anderson, T. L., and Campbell, D.: Calibration and Intercomparison of Filter-Based Measurements of Visible Light Absorption by Aerosols, Aerosol Sci. Tech., 30, 582–600, https://doi.org/10.1080/027868299304435, 1999.
Boucher, O.: Atmospheric Aerosols, Springer Netherlands, Dordrecht, 2015.
Cappa, C. D., Lack, D. A., Burkholder, J. B., and Ravishankara, A. R.: Bias in Filter-Based Aerosol Light Absorption Measurements Due to Organic Aerosol Loading: Evidence from Laboratory Measurements, Aerosol Sci. Tech., 42, 1022–1032, https://doi.org/10.1080/02786820802389285, 2008.
Cappa, C. D., Kolesar, K. R., Zhang, X., Atkinson, D. B., Pekour, M. S., Zaveri, R. A., Zelenyuk, A., and Zhang, Q.: Understanding the optical properties of ambient sub- and supermicron particulate matter: results from the CARES 2010 field study in northern California, Atmos. Chem. Phys., 16, 6511–6535, https://doi.org/10.5194/acp-16-6511-2016, 2016.
Chen, S., Russell, L. M., Cappa, C. D., Zhang, X., Kleeman, M. J., Kumar, A., Liu, D., and Ramanathan, V.: Comparing black and brown carbon absorption from AERONET and surface measurements at wintertime Fresno, Atmos. Environ., 199, 164–176, https://doi.org/10.1016/j.atmosenv.2018.11.032, 2019.
Collaud Coen, M., Weingartner, E., Apituley, A., Ceburnis, D., Fierz-Schmidhauser, R., Flentje, H., Henzing, J. S., Jennings, S. G., Moerman, M., Petzold, A., Schmid, O., and Baltensperger, U.: Minimizing light absorption measurement artifacts of the Aethalometer: evaluation of five correction algorithms, Atmos. Meas. Tech., 3, 457–474, https://doi.org/10.5194/amt-3-457-2010, 2010.
Davies, N. W., Fox, C., Szpek, K., Cotterell, M. I., Taylor, J. W., Allan, J. D., Williams, P. I., Trembath, J., Haywood, J. M., and Langridge, J. M.: Evaluating biases in filter-based aerosol absorption measurements using photoacoustic spectroscopy, Atmos. Meas. Tech., 12, 3417–3434, https://doi.org/10.5194/amt-12-3417-2019, 2019.
Drinovec, L., Gregorič, A., Zotter, P., Wolf, R., Bruns, E. A., Prévôt, A. S. H., Petit, J.-E., Favez, O., Sciare, J., Arnold, I. J., Chakrabarty, R. K., Moosmüller, H., Filep, A., and Močnik, G.: The filter-loading effect by ambient aerosols in filter absorption photometers depends on the coating of the sampled particles, Atmos. Meas. Tech., 10, 1043–1059, https://doi.org/10.5194/amt-10-1043-2017, 2017.
Fischer, D. A. and Smith, G. D.: A portable, four-wavelength, single-cell photoacoustic spectrometer for ambient aerosol absorption, Aerosol Sci. Tech., 52, 393–406, https://doi.org/10.1080/02786826.2017.1413231, 2018.
Horvath, H.: Atmospheric light absorption – A review, Atmos. Environ. A-Gen., 27, 293–317, https://doi.org/10.1016/0960-1686(93)90104-7, 1993.
Jiang, Y., Yang, J., Gagné, S., Chan, T. W., Thomson, K., Fofie, E., Cary, R. A., Rutherford, D., Comer, B., Swanson, J., Lin, Y., Van Rooy, P., Asa-Awuku, A., Jung, H., Barsanti, K., Karavalakis, G., Cocker, D., Durbin, T. D., Miller, J. W., and Johnson, K. C.: Sources of variance in BC mass measurements from a small marine engine: Influence of the instruments, fuels and loads, Atmos. Environ., 182, 128–137, https://doi.org/10.1016/j.atmosenv.2018.03.008, 2018.
Kirchstetter, T. W. and Novakov, T.: Controlled generation of black carbon particles from a diffusion flame and applications in evaluating black carbon measurement methods, Atmos. Environ., 41, 1874–1888, https://doi.org/10.1016/j.atmosenv.2006.10.067, 2007.
Koss, A. R., Sekimoto, K., Gilman, J. B., Selimovic, V., Coggon, M. M., Zarzana, K. J., Yuan, B., Lerner, B. M., Brown, S. S., Jimenez, J. L., Krechmer, J., Roberts, J. M., Warneke, C., Yokelson, R. J., and de Gouw, J.: Non-methane organic gas emissions from biomass burning: identification, quantification, and emission factors from PTR-ToF during the FIREX 2016 laboratory experiment, Atmos. Chem. Phys., 18, 3299–3319, https://doi.org/10.5194/acp-18-3299-2018, 2018.
Lack, D. A., Lovejoy, E. R., Baynard, T., Pettersson, A., and Ravishankara, A. R.: Aerosol Absorption Measurement using Photoacoustic Spectroscopy: Sensitivity, Calibration, and Uncertainty Developments, Aerosol Sci. Tech., 40, 697–708, https://doi.org/10.1080/02786820600803917, 2006.
Lack, D. A., Cappa, C. D., Covert, D. S., Baynard, T., Massoli, P., Sierau, B., Bates, T. S., Quinn, P. K., Lovejoy, E. R., and Ravishankara, A. R.: Bias in Filter-Based Aerosol Light Absorption Measurements Due to Organic Aerosol Loading: Evidence from Ambient Measurements, Aerosol Sci. Tech., 42, 1033–1041, https://doi.org/10.1080/02786820802389277, 2008a.
Lack, D. A., Lerner, B., Granier, C., Baynard, T., Lovejoy, E., Massoli, P., Ravishankara, A. R., and Williams, E.: Light absorbing carbon emissions from commercial shipping, Geophys. Res. Lett., 35, L13815, https://doi.org/10.1029/2008GL033906, 2008b.
Lack, D. A., Moosmüller, H., McMeeking, G. R., Chakrabarty, R. K., and Baumgardner, D.: Characterizing elemental, equivalent black, and refractory black carbon aerosol particles: A review of techniques, their limitations and uncertainties, Anal. Bioanal. Chem., 406, 99–122, https://doi.org/10.1007/s00216-013-7402-3, 2014.
Laing, J. R., Jaffe, D. A., and Hee, J. R.: Physical and optical properties of aged biomass burning aerosol from wildfires in Siberia and the Western USA at the Mt. Bachelor Observatory, Atmos. Chem. Phys., 16, 15185–15197, https://doi.org/10.5194/acp-16-15185-2016, 2016.
Levenberg, K.: A method for the solution of certain non-linear problems in least squares, Q. Appl. Math., 2, 164–168, 1944.
Lewis, K., Arnott, W. P., Moosmüller, H., and Wold, C. E.: Strong spectral variation of biomass smoke light absorption and single scattering albedo observed with a novel dual-wavelength photoacoustic instrument, J. Geophys. Res.-Atmos., 113, 1–14, https://doi.org/10.1029/2007JD009699, 2008.
Li, H., Lamb, K. D., Schwarz, J. P., Selimovic, V., Yokelson, R. J., McMeeking, G. R., and May, A. A.: Inter-comparison of black carbon measurement methods for simulated open biomass burning emissions, Atmos. Environ., 206, 156–169, https://doi.org/10.1016/j.atmosenv.2019.03.010, 2019.
Li, H., McMeeking G., and May A.: A New Correction Algorithm Applicable to any Filter-Based Absorption Photometers (Version 1.1), Zenodo, https://doi.org/10.5281/zenodo.3742342, 2020.
Lim, S., Lee, M., Kim, S.-W., and Laj, P.: Sulfate alters aerosol absorption properties in East Asian outflow, Sci. Rep.-UK, 8, 5172, https://doi.org/10.1038/s41598-018-23021-1, 2018.
Liu, S., Aiken, A. C., Arata, C., Dubey, M. K., Stockwell, C. E., Yokelson, R. J., Stone, E. A., Jayarathne, T., Robinson, A. L., DeMott, P. J., and Kreidenweis, S. M.: Aerosol single scattering albedo dependence on biomass combustion efficiency: Laboratory and field studies, Geophys. Res. Lett., 41, 742–748, https://doi.org/10.1002/2013GL058392, 2014.
McMeeking, G. R., Fortner, E., Onasch, T. B., Taylor, J. W., Flynn, M., Coe, H., and Kreidenweis, S. M.: Impacts of nonrefractory material on light absorption by aerosols emitted from biomass burning, J. Geophys. Res.-Atmos., 119, 12272–12286, https://doi.org/10.1002/2014JD021750, 2014.
Moosmüller, H., Chakrabarty, R. K., and Arnott, W. P.: Aerosol light absorption and its measurement: A review, J. Quant. Spectrosc. Ra., 110, 844–878, https://doi.org/10.1016/j.jqsrt.2009.02.035, 2009.
Moteki, N., Kondo, Y., and Nakamura, S.: Method to measure refractive indices of small nonspherical particles: Application to black carbon particles, J. Aerosol Sci., 41, 513–521, https://doi.org/10.1016/j.jaerosci.2010.02.013, 2010.
Müller, T., Henzing, J. S., de Leeuw, G., Wiedensohler, A., Alastuey, A., Angelov, H., Bizjak, M., Collaud Coen, M., Engström, J. E., Gruening, C., Hillamo, R., Hoffer, A., Imre, K., Ivanow, P., Jennings, G., Sun, J. Y., Kalivitis, N., Karlsson, H., Komppula, M., Laj, P., Li, S.-M., Lunder, C., Marinoni, A., Martins dos Santos, S., Moerman, M., Nowak, A., Ogren, J. A., Petzold, A., Pichon, J. M., Rodriquez, S., Sharma, S., Sheridan, P. J., Teinilä, K., Tuch, T., Viana, M., Virkkula, A., Weingartner, E., Wilhelm, R., and Wang, Y. Q.: Characterization and intercomparison of aerosol absorption photometers: result of two intercomparison workshops, Atmos. Meas. Tech., 4, 245–268, https://doi.org/10.5194/amt-4-245-2011, 2011a.
Müller, T., Laborde, M., Kassell, G., and Wiedensohler, A.: Design and performance of a three-wavelength LED-based total scatter and backscatter integrating nephelometer, Atmos. Meas. Tech., 4, 1291–1303, https://doi.org/10.5194/amt-4-1291-2011, 2011b.
Müller, T., Virkkula, A., and Ogren, J. A.: Constrained two-stream algorithm for calculating aerosol light absorption coefficient from the Particle Soot Absorption Photometer, Atmos. Meas. Tech., 7, 4049–4070, https://doi.org/10.5194/amt-7-4049-2014, 2014.
Nakayama, T., Kondo, Y., Moteki, N., Sahu, L. K., Kinase, T., Kita, K., and Matsumi, Y.: Size-dependent correction factors for absorption measurements using filter-based photometers: PSAP and COSMOS, J. Aerosol Sci., 41, 333–343, https://doi.org/10.1016/j.jaerosci.2010.01.004, 2010.
Nakayama, T., Suzuki, H., Kagamitani, S., Ikeda, Y., Uchiyama, A., and Matsumi, Y.: Characterization of a Three Wavelength Photoacoustic Soot Spectrometer (PASS-3) and a Photoacoustic Extinctiometer (PAX), J. Meteorol. Soc. Jpn., 93, 285–308, https://doi.org/10.2151/jmsj.2015-016, 2015.
National Oceanic and Atmospheric Administration (Chemical Sciences Division): Fire Lab 2016, available at: https://esrl.noaa.gov/csl/projects/firex/firelab/, last access: 26 May 2020.
Ogren, J. A.: Comment on “ Calibration and Intercomparison of Filter-Based Measurements of Visible Light Absorption by Aerosols”, Aerosol Sci. Tech., 44, 589–591, https://doi.org/10.1080/02786826.2010.482111, 2010.
Ogren, J. A., Wendell, J., Andrews, E., and Sheridan, P. J.: Continuous light absorption photometer for long-term studies, Atmos. Meas. Tech., 10, 4805–4818, https://doi.org/10.5194/amt-10-4805-2017, 2017.
Olson, M. R., Victoria Garcia, M., Robinson, M. A., Van Rooy, P., Dietenberger, M. A., Bergin, M., and Schauer, J. J.: Investigation of black and brown carbon multiple-wavelength-dependent light absorption from biomass and fossil fuel combustion source emissions, J. Geophys. Res.-Atmos., 120, 6682–6697, https://doi.org/10.1002/2014JD022970, 2015.
Ogren, J. A., Wendell, J., Andrews, E., and Sheridan, P. J.: Continuous light absorption photometer for long-term studies, Atmos. Meas. Tech., 10, 4805–4818, https://doi.org/10.5194/amt-10-4805-2017, 2017.
Rajesh, T. A. and Ramachandran, S.: Black carbon aerosol mass concentration, absorption and single scattering albedo from single and dual spot aethalometers: Radiative implications, J. Aerosol Sci., 119, 77–90, https://doi.org/10.1016/j.jaerosci.2018.02.001, 2018.
Schmeisser, L., Andrews, E., Ogren, J. A., Sheridan, P., Jefferson, A., Sharma, S., Kim, J. E., Sherman, J. P., Sorribas, M., Kalapov, I., Arsov, T., Angelov, C., Mayol-Bracero, O. L., Labuschagne, C., Kim, S.-W., Hoffer, A., Lin, N.-H., Chia, H.-P., Bergin, M., Sun, J., Liu, P., and Wu, H.: Classifying aerosol type using in situ surface spectral aerosol optical properties, Atmos. Chem. Phys., 17, 12097–12120, https://doi.org/10.5194/acp-17-12097-2017, 2017.
Schmid, O., Artaxo, P., Arnott, W. P., Chand, D., Gatti, L. V., Frank, G. P., Hoffer, A., Schnaiter, M., and Andreae, M. O.: Spectral light absorption by ambient aerosols influenced by biomass burning in the Amazon Basin. I: Comparison and field calibration of absorption measurement techniques, Atmos. Chem. Phys., 6, 3443–3462, https://doi.org/10.5194/acp-6-3443-2006, 2006.
Schwarz, J. P., Spackman, J. R., Fahey, D. W., Gao, R. S., Lohmann, U., Stier, P., Watts, L. A., Thomson, D. S., Lack, D. A., Pfister, L., Mahoney, M. J., Baumgardner, D., Wilson, J. C., and Reeves, J. M.: Coatings and their enhancement of black carbon light absorption in the tropical atmosphere, J. Geophys. Res., 113, D03203, https://doi.org/10.1029/2007JD009042, 2008.
Sedlacek, A. J.: DOE/SC-ARM-TR-156 Aethalometer™ Instrument Handbook, DOE Office of Science Atmospheric Radiation Measurement (ARM) Program, https://doi.org/10.2172/1251391, 2016.
Selimovic, V., Yokelson, R. J., Warneke, C., Roberts, J. M., de Gouw, J., Reardon, J., and Griffith, D. W. T.: Aerosol optical properties and trace gas emissions by PAX and OP-FTIR for laboratory-simulated western US wildfires during FIREX, Atmos. Chem. Phys., 18, 2929–2948, https://doi.org/10.5194/acp-18-2929-2018, 2018.
Sheridan, P. J., Arnott, W. P., Ogren, J. A., Andrews, E., Atkinson, D. B., Covert, D. S., Moosmüller, H., Petzold, A., Schmid, B., Strawa, A. W., Varma, R., and Virkkula, A.: The Reno Aerosol Optics Study: An Evaluation of Aerosol Absorption Measurement Methods, Aerosol Sci. Tech., 39, 1–16, https://doi.org/10.1080/027868290901891, 2005.
Sherman, J. P., Sheridan, P. J., Ogren, J. A., Andrews, E., Hageman, D., Schmeisser, L., Jefferson, A., and Sharma, S.: A multi-year study of lower tropospheric aerosol variability and systematic relationships from four North American regions, Atmos. Chem. Phys., 15, 12487–12517, https://doi.org/10.5194/acp-15-12487-2015, 2015.
Springston, S. R.: DOE/SC-ARM-TR-176 Radiance Research Particle Soot/Absorption Photometer Instrument Handbook, DOE Office of Science Atmospheric Radiation Measurement (ARM) Program (United States), 2016.
Subramanian, R., Roden, C. A., Boparai, P., and Bond, T. C.: Yellow Beads and Missing Particles: Trouble Ahead for Filter-Based Absorption Measurements, Aerosol Sci. Tech., 41, 630–637, https://doi.org/10.1080/02786820701344589, 2007.
US Department of Energy (Atmospheric Radiation Measurement): ARM Data Discovery, available at: https://www.archive.arm.gov/discovery/, last access: 26 May 2020.
Vignati, E., Karl, M., Krol, M., Wilson, J., Stier, P., and Cavalli, F.: Sources of uncertainties in modelling black carbon at the global scale, Atmos. Chem. Phys., 10, 2595–2611, https://doi.org/10.5194/acp-10-2595-2010, 2010.
Virkkula, A.: Correction of the Calibration of the 3-wavelength Particle Soot Absorption Photometer (3λ PSAP), Aerosol Sci. Tech., 44, 706–712, https://doi.org/10.1080/02786826.2010.482110, 2010.
Virkkula, A., Ahlquist, N. C., Covert, D. S., Arnott, W. P., Sheridan, P. J., Quinn, P. K., and Coffman, D. J.: Modification, calibration and a field test of an instrument for measuring light absorption by particles, Aerosol Sci. Tech., 39, 68–83, https://doi.org/10.1080/027868290901963, 2005.
Virkkula, A., Mäkelä, T., Hillamo, R., Yli-Tuomi, T., Hirsikko, A., Hämeri, K., and Koponen, I. K.: A simple procedure for correcting loading effects of aethalometer data, J. Air Waste Manage., 57, 1214–1222, https://doi.org/10.3155/1047-3289.57.10.1214, 2007.
Virkkula, A., Chi, X., Ding, A., Shen, Y., Nie, W., Qi, X., Zheng, L., Huang, X., Xie, Y., Wang, J., Petäjä, T., and Kulmala, M.: On the interpretation of the loading correction of the aethalometer, Atmos. Meas. Tech., 8, 4415–4427, https://doi.org/10.5194/amt-8-4415-2015, 2015.
Wang, X., Heald, C. L., Sedlacek, A. J., de Sá, S. S., Martin, S. T., Alexander, M. L., Watson, T. B., Aiken, A. C., Springston, S. R., and Artaxo, P.: Deriving brown carbon from multiwavelength absorption measurements: method and application to AERONET and Aethalometer observations, Atmos. Chem. Phys., 16, 12733–12752, https://doi.org/10.5194/acp-16-12733-2016, 2016.
Weingartner, E., Saathoff, H., Schnaiter, M., Streit, N., Bitnar, B., and Baltensperger, U.: Absorption of light by soot particles: Determination of the absorption coefficient by means of aethalometers, J. Aerosol Sci., 34, 1445–1463, https://doi.org/10.1016/S0021-8502(03)00359-8, 2003.