the Creative Commons Attribution 4.0 License.
the Creative Commons Attribution 4.0 License.
 | 22 Jun 2020
Continuous methane concentration measurements at the Greenland ice sheet–atmosphere interface using a low-cost, low-power metal oxide sensor system
Christian Juncher Jørgensen
Jacob Mønster
Karsten Fuglsang
Jesper Riis Christiansen
In this paper, the performance of a low-cost and low-power methane (CH4) sensing system prototype based on a metal oxide sensor (MOS) sensitive to CH4 is tested in a natural CH4-emitting environment at the Greenland ice sheet (GrIS). We investigate if the MOS could be used as a supplementary measurement technique for monitoring CH4 emissions from the GrIS with the scope of setting up a CH4 monitoring network along the GrIS. The performance of the MOS is evaluated on the basis of simultaneous measurements using a cavity ring-down spectroscopy (CRDS) reference instrument for CH4 over a field calibration period of approximately 100 h. Results from the field calibration period show that CH4 concentrations measured with the MOS are in very good agreement with the reference CRDS. The absolute concentration difference between the MOS and the CRDS reference values within the measured concentration range of approximately 2–100 ppm CH4 was generally lower than 5 ppm CH4, while the relative concentration deviations between the MOS and the CRDS were generally below 10 %. The calculated root-mean-square error (RMSE) for the entire field calibration period was 1.69 ppm (n=37 140). The results confirm that low-cost and low-power MOSs can be effectively used for atmospheric CH4 measurements under stable water vapor conditions. The primary scientific importance of the study is that it provides a clear example of how the application of low-cost technology can enhance our future understanding on the climatic feedbacks from the cryosphere to the atmosphere.


Constraining the various sources and sinks in the global methane (CH4) budget is becoming an increasingly important parameter in mitigating climate change (Saunois et al., 2016). The Arctic is generally considered a major global emitter of CH4 to the atmosphere, but significant uncertainty exists as to the seasonal dynamics and strength of both CH4 sources and CH4 sinks from both terrestrial and marine environments as well as the cryosphere (Callaghan et al., 2011; Emmerton et al., 2014; Juncher Jørgensen et al., 2015; Pirk et al., 2017; Zona et al., 2016). A previously unknown source of CH4 emission to the atmosphere was recently identified in which CH4 is emitted from meltwater originating in the subglacial domain of the Greenland ice sheet (GrIS) (Christiansen and Jørgensen, 2018; Lamarche-Gagnon et al., 2018; Wadham et al., 2019). The spatiotemporal coverage of the new CH4 source is yet to be determined, and the overall climatic importance of this new component in the Arctic CH4 budget is still unknown. Future studies are needed in order to assess the overall climatic significance of this source of CH4 emission from the cryosphere to the atmosphere. The current state of knowledge on the CH4 exchange from Greenland is inherently limited by the remoteness of many field sites, following high expedition cost and limitations to the spatial coverage and temporal duration of field measurements. Adding to this is the financial and logistical challenges of bringing high-precision analyzers into the field, namely keeping them powered, running, and shielded in the harsh environments often encountered in the Arctic. Thus, there is substantial potential and need to develop low-power techniques and measurement systems that can perform reliable autonomous CH4 concentration measurements. The emergence of low-cost and low-power sensor technology in recent years provides an opportunity to overcome many of current restraints on obtaining continuous field measurements from a wide range of natural CH4-emitting systems (wetlands, ice sheets, marine gas seeps, lakes, permafrost) and expand the network of continuous measurements in remote areas, maximizing our understanding of these systems and minimizing the risk of losing valuable analytical equipment.
Low-cost metal oxide sensors (MOSs) have been widely used for sensing various gases under atmospheric conditions (Wang et al., 2010). However, MOSs have significant obstacles to their direct use as air quality monitors, as their output signal is influenced by the concentrations of both the target and interfering gases as well as the temperature and humidity effects (Masson et al., 2015; Sohn et al., 2008). Other known challenges to the use of MOSs are baseline drift over time, caused by either changes in the heat output of the sensing element or poisoning of the sensor surface (Peterson et al., 2017).
In recent years, investigations into the performance of CH4-sensitive MOSs for the measurement of atmospheric CH4 have been made under both natural and controlled conditions (van den Bossche et al., 2017; Eugster and Kling, 2012; Penza et al., 2015). These studies have been prompted by an increased interest in finding effective methods to quantify CH4 emissions to the atmosphere from both natural systems and man-made systems such as landfills or biogas production plants. Using sensor-specific post-processing to compensate for variations in relative humidity and air temperature, the previous studies have demonstrated a high potential for the low-cost and low-power monitoring of CH4 concentrations above the atmospheric background level for various applications and in sensor networks. In the current study, we tested the in situ performance of a CH4-sensitive MOS (Figaro TGS2611-E00) against a state-of-the-art cavity ring-down spectrometer (CRDS) for CH4 (Ultraportable Greenhouse Gas Analyzer, Los Gatos Research, Inc.) to measure CH4 concentrations in the air expelled from a subglacial meltwater outlet at GrIS. This was done to assess the MOS's potential for serving as a sensing element for future studies of CH4 emissions from the subglacial domain under the Greenland ice sheet.
2.1 Field site and instrumentation
The study site is located on the southern flank of the Isunnguata Sermia Glacier at the western margin of the GrIS (67∘09′16.40′′ N, 50∘04′08.48′′ W) at an elevation of 450 m a.s.l. (Fig. 1). At a small subglacial meltwater discharge outlet in this area, we performed measurements of CH4 concentrations in the subglacial air expelled from naturally occurring caves carved out by meltwater below the ice sheet. The measurements were done in the period between 22 and 26 June 2018. A more detailed description of the study site at the GrIS is given in Christiansen and Jørgensen (2018).
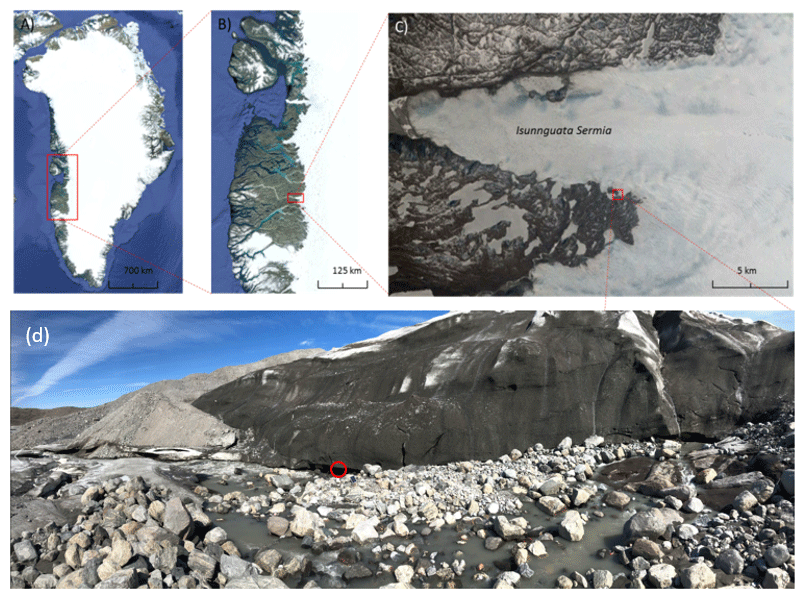
Figure 1Overview of the sampling location at Isunnguata Sermia Glacier at the western margin of the Greenland ice sheet during June 2018. (a) Location of sampling region the island of Greenland, (b) regional location of the outlet glacier, (c) location of the meltwater outlet at Isunnguata Sermia, and (d) local sample location, with investigated subglacial cavity marked with red circle. Source of (a, b, c): © Google Earth, https://earth.google.com/web/ (last access: 23 April 2020).
To sample the subglacial air the sampling tube was attached to an aluminum pole inserted approximately 5 m into an ice cave (Fig. 2a). The inlet of the sampling tube was connected to a 120 mL water trap. Humidity and temperature of the subglacial air were measured every 10 s using a combined sensor (S-THB-M008, Onset, USA; resolution 0.02 ∘C, 0.1 % RH) mounted at the tip of the aluminum pole inserted into the cave. The data were recorded using a datalogger (U30, Onset, USA).
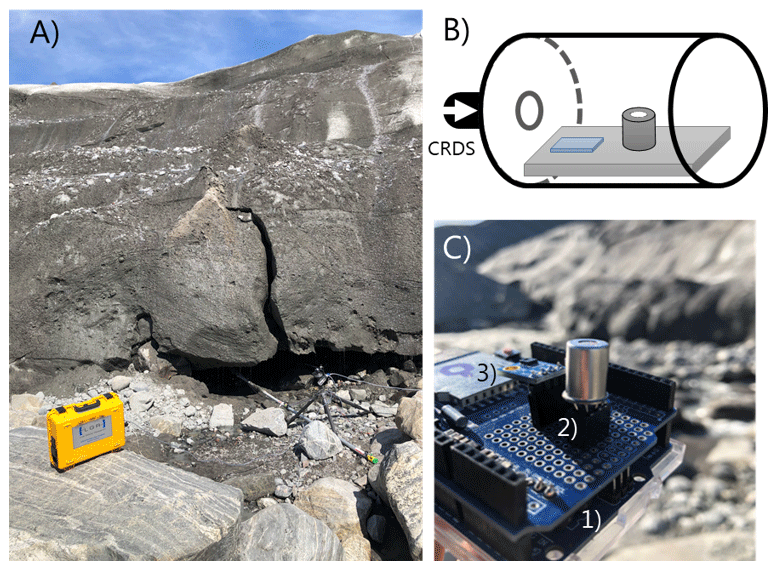
Figure 2(a) Close-up of air-filled cavity below the Greenland ice sheet next to the lateral meltwater outlet. The aluminum pole extends approximately 5 m into the cavity and holds the common inlet tube and the temperature and humidity smart sensor. (b) Conceptual diagram of the MOS system which was connected in series to the outlet port of the CRDS analyzer. (c) Close-up of the board-mounted MOS and temperature–humidity micro-sensor. The MOS system consisted of (1) a microcontroller, (2) datalogger shield holding metal oxide CH4 sensor, and (3) an additional temperature–relative humidity micro-sensor.
Real-time reference concentration (ppm) measurements of CH4, carbon dioxide (CO2), and water vapor (H2O) were obtained using a CRDS (Ultraportable Greenhouse Gas Analyzer, Los Gatos Research, USA). The inlet port of the CRDS was connected to the subglacial sampling point via a sampling tube (50 m length, inner diameter of 4 mm, and total volume of 630 mL) which was zip-tied to the aluminum pole. The flow of the sample gas from the subglacial sampling point to the measurement cell in the CRDS was obtained via the analyzer's internal diaphragm pump (800 mL min−1). The outlet port of the CRDS was connected in series via a 1 m plastic tube to a metal can enclosure (400 mL), where the lid had been removed (Fig. 2b). The prototype CH4 sensing system (MOS) was placed in the metal enclosure, where the short serial tube connector ensured a rapid flushing of the headspace in which the CH4 measurements with the MOS were made. Due to the non-destructive sampling principle of the CRDS and the rapid flushing of the headspace volume in the enclosure with the MOS system (2 times per minute), the concentration of CH4 is estimated to be virtually identical at the same time step for the MOS and the CRDS during the entire field calibration period (22 to 26 July 2018).
Following the field calibration test of approximately 100 h, the MOS system was left in the field as an autonomous monitoring system. For this autonomous measurement period, the CRDS was replaced by a 12 V diaphragm pump (Thomas pumps, 1410VD DC) with a constant air flow of approximately 3 L min−1 attached to the common sample tube, with similar connection of the pump inlet and outlet to the CRDS ports. During this period the MOS system was powered by 12 V LiFePO4 batteries connected to solar panels and a voltage regulator, placed in a waterproof case and buried under a pile of rocks to minimize the impact of sunlight-induced temperature variations in the sensor system.
2.2 The MOS system
The MOS system (Fig. 2c) consists of a microcontroller (Arduino Uno) and datalogger shield (Deek-Robot data-logging shield V1.0) holding the board-mounted metal oxide CH4 sensor (Figaro TGS2611-E00) and an additional temperature–relative humidity micro-sensor (GY-21 HTU21). The final prototype was assembled in the laboratory at Aarhus University. The logging frequency of the CRDS and MOS was 1 and 10 s, respectively. The CH4-sensitive MOS consists of a tin(IV) oxide (SnO2) semiconductor, which has low conductivity in clean air. In the presence of CH4, the sensor's conductivity increases depending on the gas concentration in the air (Kumar et al., 2009). A simple electrical circuit converts the changes in conductivity at the sensing element as the gas concentrations vary into a change in output voltage across the voltage divider (see Fig. 3). Both the heater and the sensing circuit of the MOS were powered by the 5 V regulated output of the Arduino Uno. The analogue output of the MOS was connected to the 10 bit analogue input on the Arduino Uno using a 10 kΩ precision load resistor in the voltage divider.

Figure 3Simplified schematic of the metal oxide sensor (MOS) system consisting of a TGS2611-E00 with pin 3 and 4 connected to the 5 V output of the Arduino Uno, pin 1 connected to ground, and pin 2 connected to the analogue input of the Arduino Uno and a 10 kΩ load resister, which also connects to ground.
2.3 Laboratory calibration of the MOS
In preparing for the field test of the CH4 sensing system prototype, the MOS was performance tested and calibrated in a controlled laboratory environment to evaluate the response time to variations in methane concentration in the concentration range 0–100 ppm CH4 at three different levels of relative humidity (37±2 %, 55±3 %, and 76±3 %). Synthetic air (80 % N2 and 20 % O2) was used as zero gas for the laboratory test into which various concentrations of a CH4-containing span gas were mixed using a HovaCAL calibration gas generator (IAS GmbH, Germany). After mixing of the zero gas and span gas, the calibration gas was humidified using a water-filled impinger (van den Bossche et al., 2017). At each humidity level, the output voltage from the MOS was logged using a Campbell CR1000 datalogger at a 2 s sampling frequency. A preprogrammed calibration step sequence was used for all three humidity levels, consisting of time steps of 10 min each in which the sensor was exposed to either zero gas or a calibration gas mixture in the applied the concentration range in an alternating step pattern (Fig. 4). The temperature in the laboratory, zero gas, mixed calibration gas, and water in the impinger was kept constant at around 22 ∘C throughout the laboratory calibration test.
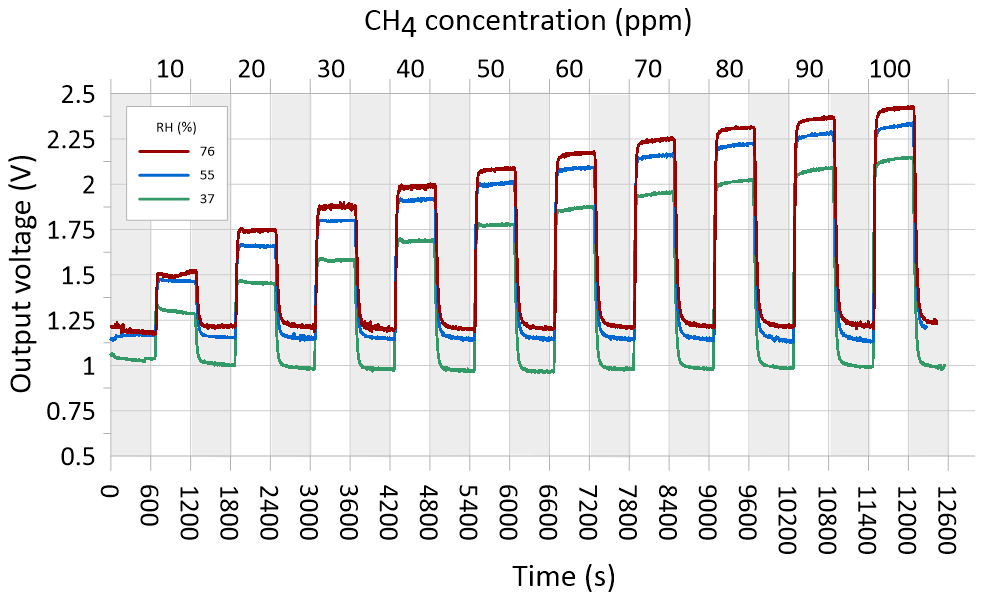
Figure 4Outlet voltages of the MOS during laboratory step calibration at stabilized levels of relative humidity (37±2 %, 55±3 %, and 76±3 %) in both the zero and span gas at alternating concentration of CH4 in the calibration gas between 10 and 100 ppm CH4. Each time step lasted 10 min, and sequences with grey shading show time periods where the sensor was exposed to CH4-free zero gas.
The sensor resistance (R0) at exposure to the CH4-free reference gas can be calculated at each of the three different humidity levels according to Eq. (1):
where VC is the circuit voltage (i.e., 5 V DC), RL is the load resistance (10 kΩ), and VOUT is the measured output voltage (see also Eugster and Kling, 2012, for further description).
The sensor resistance at various calibration gas concentrations (RS) at different concentration steps in the calibration sequence can also be calculated using Eq. (1) for each of the three humidity levels (i.e., Rs replaces R0 in Eq. 1). For the tested type of MOS, the sensor resistance ratio (RS∕R0) between the sensor resistance at a given concentration level (Rs) and the sensor resistance at the reference level (R0) are inversely proportional to the absolute CH4 concentration and can be modeled using, for example, a power fit (Fig. 5).
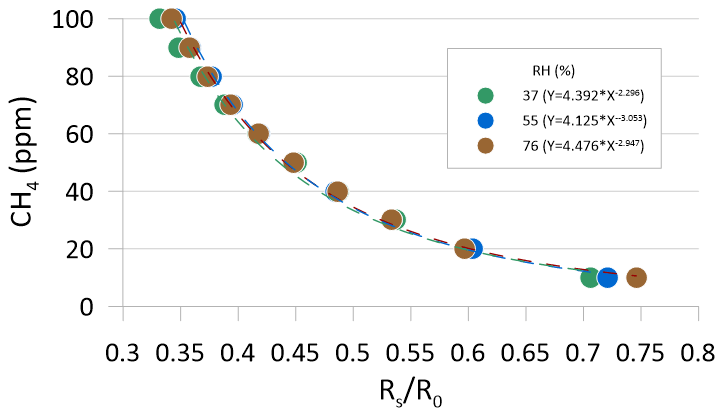
Figure 5Resistance ratio of MOS as three levels of relative humidity at CH4 concentration levels between 10 and 100 ppm CH4 in humidified synthetic air.
2.4 Field calibration of the MOS
Field calibration of the MOS was done at the meltwater outlet at the Greenland ice sheet by simultaneous measurements of the same air mass by the MOS system and a state-of-the-art CRDS in the configuration described above (Sect. 2.1). For the calculation of the average ambient sensor resistance () using Eq. (1), the atmospheric background concentration of CH4 of the air (approximately 1.9 ppm) close to the ice sheet was used, in the absence of a controlled and humidified zero gas. Exact measurements of temperature and humidity of this air mass are not available, but T and RH are estimated to fall within the range of 1–4 ∘C and 90 %–100 % RH. The output value of the MOS under these conditions was then used to establish the resistance ratio () vs. CH4 concentration field calibration function for the MOS (Fig. 6).
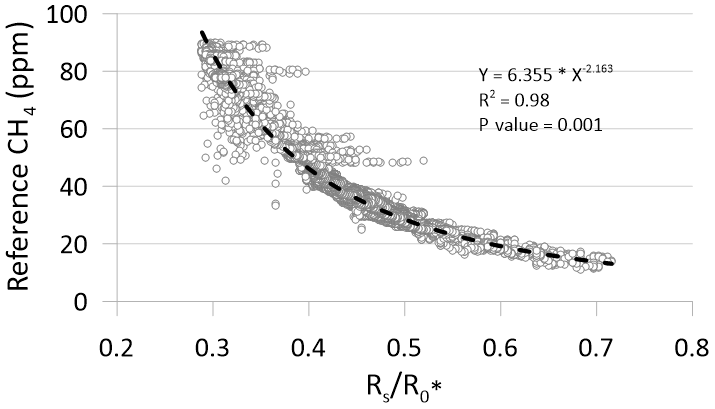
Figure 6Regression plot of calculated MOS resistance ratio vs. the reference in situ CH4 concentrations from the CRDS (n=37 140).
2.5 Data processing
In order to compensate for potential effects of micro-turbulent mixing of subglacial air with atmospheric air observed with the CRDS (Christiansen and Jørgensen, 2018). which occur at a faster frequency than the 10 s sampling interval of the MOS (see also Sect. 3.3), the measured raw time-series data from the MOS were smoothed using simple exponential smoothing according to Eq. (2):
where st is the smoothed CH4 concentration value (ppm), α is the smoothing factor, and st−1 is the previous smoothed CH4 concentration value (ppm). At time zero (t=0), the st is equal to the first unsmoothed raw CH4 value of the MOS. The optimum value for α was determined using the Microsoft Excel solver by minimizing the total average root-mean-square error (RMSE) between the raw data from the MOS and the simultaneous concentration measurement of the CRDS. Results show an optimal value of 0.042, which was used for both the CRDS and MOS data series (Fig. 7).

Figure 7(a) Grey dots show raw CH4 concentration from the cavity ring-down spectrometer (CRDS). Black line shows CRDS CH4 concentration values following exponential smoothing. Black bars show absolute error between raw and smoothed values. (b) Grey dots show calculated raw CH4 concentration from metal oxide sensor (MOS). Black line shows MOS CH4 concentration values following exponential smoothing. Black bars show absolute error between raw and smoothed values. (c) Black dots show temperature of air in subglacial cavity. (d) Black bars show the relative error in percentage between MOSsmooth and CRDSsmooth divided by the CRDSsmooth concentration. Grey background shading indicates period with higher observed turbulence at the margin of the GrIS. Temporal resolution is 10 s.
3.1 Laboratory calibration test of the MOS
Figure 3 shows the relationship between the resistance ratio (RS∕R0) for the step test at three regulated humidity levels, where Ro is calculated for each humidity level based on the average voltage output of the sensor in the time steps where it was exposed to the CH4-free synthetic air. It is observed that a near-identical response function can be obtained across the three different water vapor concentrations in the air, as long as the water concentration of the zero gas is the same as in the span gas. Based on existing knowledge of the expected air temperature variations at the in situ sampling point at the GrIS (Christiansen and Jørgensen, 2018), the humidity calibration was only carried out at a single temperature in this study. However, variations in the ambient air temperature are also expected to have a linear scaling effect for the type MOS system tested in this study (Bastviken et al., 2020; van den Bossche et al., 2017).
3.2 Field calibration of the metal oxide sensor
The measured ratios per time step over the field calibration period were converted into absolute CH4 concentrations using the regression statistics of the applied power model (Fig. 6). A total of 37 140 data points are included in the regression model for converting the ratios to CH4 concentrations. Inclusion of data points from the micro-turbulent periods produces a noisy visualization of the calibrations data at higher CH4 concentration levels (Fig. 6). However, this apparent noise is primarily a visual artifact that does not have significance for the underlying calibration statistics, which shows excellent statistical agreement between the independent and dependent variables (R2=0.98; p value: 0.001). While the same regression model is used for both the laboratory calibration and field calibration, significant deviation in the model parameters is observed between the laboratory calibration as a group and the field calibration. The reason for this difference is unknown, but a possible explanation could be the potential difference in input heater voltage for the MOS (i.e., pin 1 and 4 in Fig. 3), since variations in the input heater voltage have been reported to affect the CH4 concentration measurements (van den Bossche et al., 2017). In the laboratory test, the heater circuit of the MOS was supplied by the 5 V regulated output from the CR1000 datalogger, whereas the heater circuit was supplied from the Arduino Uno's 5 V regulated output. Future tests should aim to investigate if the differences between the results from the laboratory and field calibration can be minimized by using the same type of datalogger and identical power supply (FX rechargeable lithium ion battery pack) both in the laboratory and in the field. Results from this type of test could reveal if field calibration for each individual MOS system is needed, similar to the approach in Bastviken et al. (2020), or if batch calibrations of several identical MOS systems can be performed in the laboratory without the need for time-consuming field calibration.
3.3 Time-series plot of CH4 concentration from reference CRDS and MOS
Due to the dynamic environment at the margin of the GrIS, the physical configuration of the sampling point will vary over the melt season as well as on an inter-annual basis. In our previous study, high-frequency variations in CH4 concentrations in the subglacial air were observed in a downward-draping curve style, where a high concentration plateau was interrupted by rapid decreases in CH4 concentration (Christiansen and Jørgensen, 2018). This pattern was interpreted to be an effect of micro-turbulent and wind-driven dilution of the sample gas in the ice cave by atmospheric air with a CH4 concentration of approximately 1.9 ppm. In the current study, exponential smoothing of the raw values is used to compensate for the potential effects of physical disturbance of the sample gas caused by wind-driven turbulent mixing of atmospheric background air at the subglacial sample point. Also, temporal smoothing can compensate for some of the sensor-specific variation in response time, improving the pairwise measurement comparability between the CRDS and the MOS. According to the manufacturer, the CRDS is specified to have a response time of less than 1 Hz, while the response time of the MOS is expected to be slower.
The time-series plot of the raw and exponentially smoothed CH4 data from the CRDS (CRDSsmooth) is shown together with the pairwise error between the raw data and the smoothed data (Fig. 7a). Similarly, the time-series plot of the raw and exponentially smoothed CH4 data from the MOS (MOSsmooth) is shown together with the pairwise error between the raw data and the smoothed data (Fig. 7b). It is generally observed that over the first 4 d of the calibration test, very few differences are observed between the raw data CH4 concentration and the smoothed CH4 concentrations for both CRDSsmooth and MOSsmooth, with absolute errors below 5 ppm (Fig. 7a, b). At the end of the field calibrations, more errors are observed following the larger spread in CH4 concentration measurements of both the CRDS and the MOS. CRDS analyzers across different brands and manufacturers generally perform very consistently and have a highly linear measurement response across the effective concentration range, without any tendencies for increasing analytical error with increasing gas concentrations (Brannon et al., 2016). Fluctuations in CH4 concentrations in the subglacial air were also observed in Christiansen and Jørgensen (2018) using a CRDS from another manufacturer (G4301 GasScouter, Picarro Inc.). These variations were attributed to the dynamic and micro-turbulent environment in the subglacial cavity where the gas concentrations were measured and are likely produced by air movement generated by the shear stress of the running meltwater as well as turbulent intrusion of atmospheric air generated by shifting wind speeds at the measurement location at the ice margin.
According to the field notes for the current study, a shift in overall wind regime took place during 25 June 2018, where the weather shifted from calm and sunny conditions to more windy conditions dominated by strong catabatic easterly winds coming off the GrIS. A best estimate of the overall time period where more windy conditions occurred during the field calibration period is indicated with the grey background in Fig. 7. Unfortunately, no direct measurements of wind movement were made during the fieldwork period at the location. Measurements of air temperature at the sample inlet point in the subglacial cavity (Fig. 7c) show that an initial period with diurnal temperature variations of approximately 0.1 to 0.2 ∘C was followed by a period with more fluctuating temperature variations of up to +0.6 ∘C. The period with higher variability corresponds to the period where higher wind speeds predominate and the deviations between the raw and smoothed CH4 are the greatest. The higher variability in air temperature measurements during the more windy weather is interpreted as being a product of more turbulent wind conditions right at the margin of the GrIS and opening to the subglacial cavity, by which higher amounts of warmer atmospheric air with an approximate CH4 concentration of approximately 1.9 ppm are introduced into the subglacial cavity. The introduction of these atmospheric air masses results in short-term temperature increases as well as dilution of the subglacial CH4 concentration in the cavity producing the more variable CH4 concentration patterns observed in both the CRDS and MOS raw data. In the absence of direct measurements of wind speed and micro-turbulence at the margin of the ice, rapid variations in air temperature at the sample inlet point with an amplitude greater than 0.2 ∘C appear to be a reasonable indicator or proxy for micro-turbulent dilution and physical disturbance of the source signal, which can effectively be filtered out by the application of exponential smoothing.
The relative error between each MOSsmooth and CRDSsmooth measurement pair can be expressed as the percentage that the difference constitutes compared to the reference CRDS concentration (i.e., ). It is seen that the pairwise relative error between MOSsmooth and CRDSsmooth shows similar non-systematic variations in both the calm weather and windy time period, with relative errors typically below ±10 % (Fig. 7d). This result shows both that the accuracy of the CH4 concentration measured by the MOS is in close agreement with the reference CRDS and that the exponential smoothing effectively compensates for short-term physical disturbances at the measurement point. The result also indicates that no systematic drift or over- or underestimation is apparent when comparing MOSsmooth to CRDSsmooth over the 100 h field calibration period (Fig. 7b). When considering the magnitude of the absolute errors between the raw and smoothed CH4 concentration for both the CRDS and the MOS together with the temporal pattern in the development of the relative error, it shows that the high-frequency concentration fluctuations measured with the MOS are most likely the product of physical disturbances at the measurement point (primary sampling error) and not an analytical error introduced by the MOS itself (secondary sampling error).
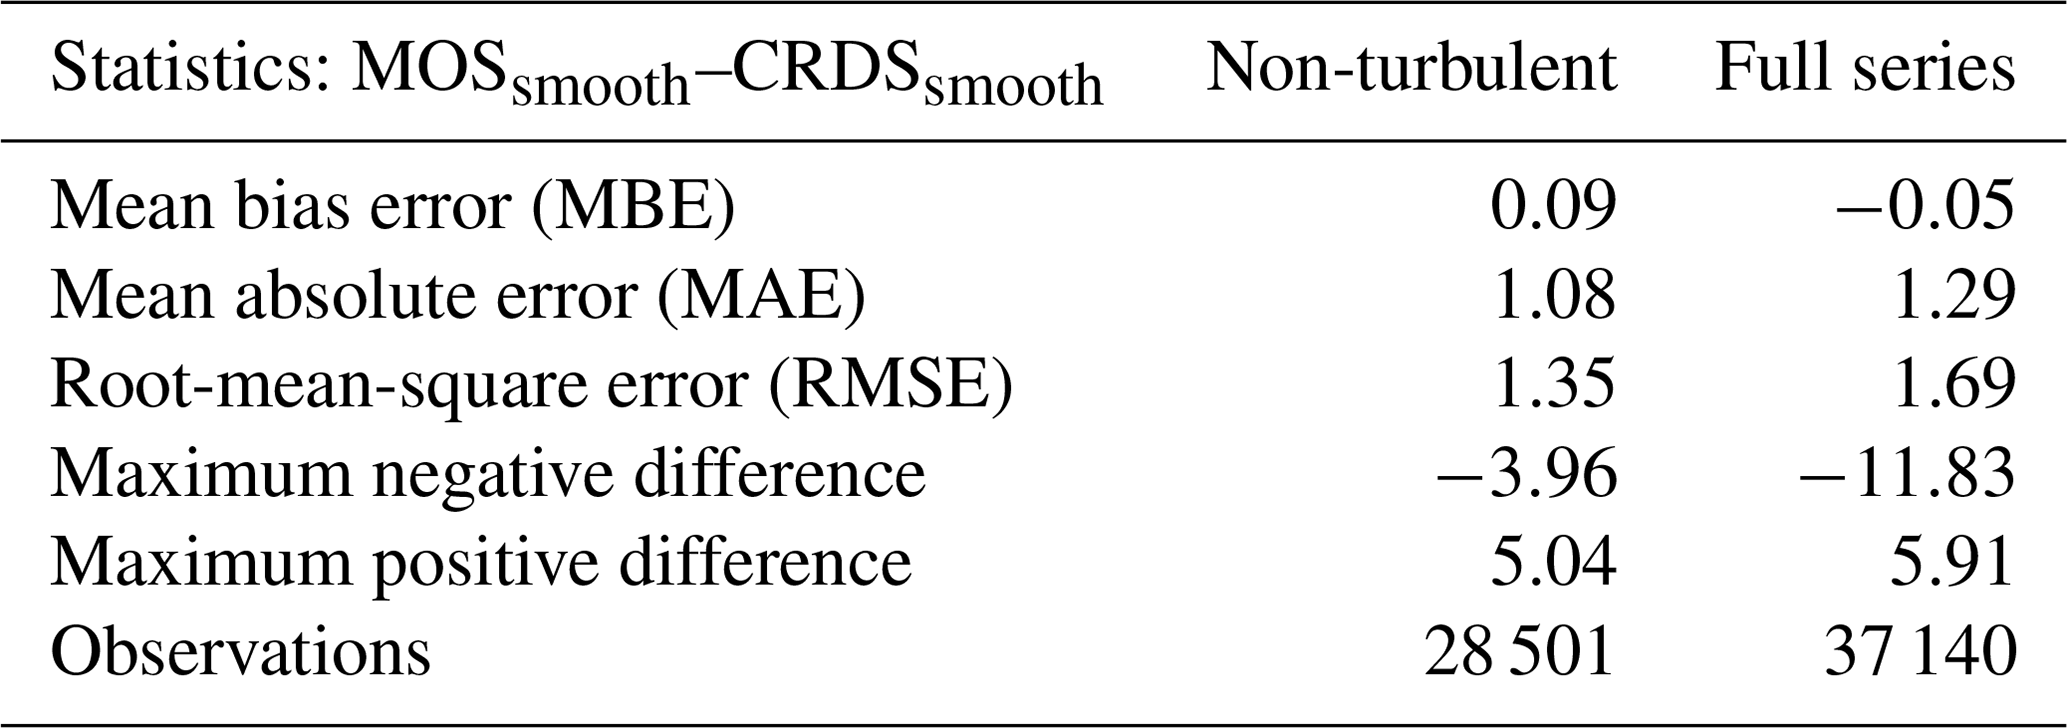
As a supplement to the pairwise error comparison, average time-series performance statistics for the difference between the MOSsmooth and CRDSsmooth time series can be calculated for the full-field calibration period as well for the non-turbulent time period with limited observed physical disturbance at the sampling point (Table 1). RMSEs of the non-turbulent and full time series are approximately 1.3 to 1.7 ppm CH4, respectively.
Table 1Statistics for the calculated differences between the smoothed MOS and smoothed CRDS data series in both the non-turbulent time period and full-field calibration period. The unit for error and difference values is parts per million (ppm).
3.4 Post-correction and cross-interference evaluation
One of the main obstacles previously reported concerning the use of MOSs for monitoring of gases in ambient air is the possible effect of variations in air temperature and humidity in the sampling environment (Bastviken et al., 2020; Eugster et al., 2019; Masson et al., 2015; Sohn et al., 2008). Different approaches exist to compensate for this potential measurement error and are related to post-correcting for variations in temperature and humidity, based on either generic temperature and humidity dependency curves supplied by the sensor company (Eugster and Kling, 2012). This is achieved by performing sensor calibrations under controlled levels of temperature and humidity in the laboratory (van den Bossche et al., 2017) or by field calibration (Bastviken et al., 2020).
Measurements from the air-filled cavity under the GrIS document a very stable sampling environment with a relative humidity throughout the sampling period of close to 100 % RH (data not shown) and only minor air temperature variations between approximately 0.05 ∘C during the night and 0.25 ∘C at midday (Fig. 7d). Because of these stable and well-buffered environmental conditions, no post-corrections due to variations in temperature and relative humidity are deemed necessary for this particular sampling environment.
Observed variations in maximum air temperature in the subglacial cavity correspond to field observation of the time of the day when maximum meltwater discharge occurs. We assume that the observed temperature pattern reflects the impact of thermal heat diffusion from this running meltwater to the air immediately above but would need direct measurements of the daily variations in meltwater temperature to verify this assumption.
The emitted CH4 may originate from thermogenic and/or biogenic sources below the GrIS. If the primary source of CH4 is thermogenic, the emission may also be accompanied by more complex hydrocarbons, including ethane (C2H6), while this will not be the case if the source is biogenic (Hopkins et al., 2016). Since the MOS used in the study is non-selective to CH4 due to its basic principle of operation (Eugster and Kling, 2012; Wang et al., 2010), the presence of other hydrocarbons such as ethanol (C2H6O), isobutene (C4H10), and potentially also other low-molecular-weight alkanes could potentially cause cross interference with the CH4 measurement. It follows that if the source of the CH4 that is emitted for the subglacial domain originates in thermogenic natural gas reservoirs under the GrIS, the other non-CH4 hydrocarbons could potentially affect the measurements performed by the MOS while being undetected by the CRDS. However, since the magnitudes and temporal patterns in CH4 concentrations are similar in both the CRDS and MOS, it is assumed that the gases emitted from the subglacial domain are primarily CH4 and CO2, with very limited potential for cross interference from other hydrocarbon gases. Also, isotopic analysis of the emitted CH4 and CO2 in Lamarche-Gagnon et al. (2018) as well as unpublished data from this study have shown that the emitted CH4 is dominantly of microbial origin and has isotopic similarity to CH4 produced by anaerobic decomposition of organic carbon in wetlands. We therefore assume that there is no need for any post-correction of the CH4 concentrations measured by the MOS in this type of environment due to lack of cross interference from other hydrocarbon gases.
3.5 Autonomous CH4 monitoring using MOS system
The combined time period in which CH4 concentrations were measured can be divided into three separate periods depending on the analytical devices used, namely period 1, corresponding to the field calibration period where both the CRDS and MOS were in operation (approximately 100 h), period 2, where only the CRDS was in operation (approximately 24 h), and period 3, where only the MOS was in operation (Fig. 8). Continuous CH4 data from period 3 exist for the period from 27 June to 15 July 2018. When comparing the combined CH4 concentration curves from all three periods, it is observed that CRDSsmooth and MOSsmooth follow each other as described above (Fig. 7). CRDSsmooth data for period 2 fill the data gap between the MOS measurement of period 1 and 3, where the start concentration data of MOSsmooth are similar to the concentration level where the CRDSsmooth measurements end. Due to the nature of the study design and difficult access to the remote field site at the GrIS, the accuracy and precision of MOSsmooth cannot be evaluated for the period 3, where only the MOS system was operating. However, the pattern in which subglacial CH4 concentrations varied and the estimated minimum and maximum values appear to be similar to the values of the calibration period. When comparing the complete time period of this study to, for example, Eugster and Kling (2012), no significant sensor drift is expected over the monitoring time period. Additional and extended fieldwork at the GrIS with repeated calibration at the end of the field deployment period is needed to quantify the potential sensor drift as well as stability range over longer timescales (Eugster et al., 2019). Nonetheless, the observed performance of the MOS during the calibration period with parts-per-million-level accuracies and subsequent trouble-free operation running as an autonomous unit shows that this type of low-cost and low-power CH4 sensing system has great potential for the further development and refinement of a greater sensor network at representative meltwater outlets at the Greenland ice sheet.

Figure 8Smoothed time-series measurements of CH4 at the Greenland ice sheet using both the cavity ring-down spectroscopy (CRDS) reference monitor and the metal oxide sensor (MOS). Temporal resolution is 10 s.
The next steps and lessons learned from this study deal with the further development of the low-power system for actual CH4 emission measurements, which involves measurements of air volume and meltwater discharge as well as continuous measurements of the dissolved CH4 in the meltwater, similar to Lamarche-Gagnon et al. (2018). Also, optimizing the positioning of gas-sensing equipment at the measurement point should be done to reduce the potential physical disturbances due to micro-turbulence and intrusion of atmospheric air in the subglacial cavity. Furthermore, an improved adjustment scheme should be developed to account for the dynamic meltback of the ice margin over the melt season, which requires either manual or automated sample point relocation to keep the sampling point at an optimal physical location. Finally, more work is needed to test the modification to the systems that are needed to establish a universal calibration curve in the laboratory so that the need for field calibration with the reference CRDS can be eliminated (see also Bastviken et al., 2020; Eugster et al., 2019).
Recent discoveries at the Greenland ice sheet (GrIS) have revealed a cryospheric source of CH4 from the subglacial domain under the ice to the atmosphere that has been overlooked so far. Development of low-power CH4 monitoring systems based on low-cost metal oxide sensors (MOSs) could enable the development of a sensor network at representative meltwater outlets at the GrIS which could significantly improve the fundamental understanding of the phenomena's climatic importance. In the current study, the performance of a metal oxide sensor sensitive to CH4 was tested in an air-filled cavity at the edge of the Greenland ice sheet over an initial field calibration period of approximately 100 h. Simultaneous measurements by both cavity ring-down spectroscopy (CRDS) and a low-cost MOS using a common inlet show good agreement between the MOS and the CRDS over time under the stable environmental conditions under the ice. Exponential smoothing of the raw data from both the CRDS and MOS effectively removes high-frequency concentration variations induced by physical disturbance of the air in the subglacial cavity under more turbulent wind conditions at the margin of the ice sheet. Based on concentration values of the smoothed CRDS and MOS data, the pairwise measurement errors were generally below ±5 ppm CH4 between the MOS and the CRDS reference value. Pairwise relative errors were generally below ±10 % between the MOS and the CRDS reference value. The RMSE for the entire field calibration period was ±1.69 ppm CH4. If only data for the non-turbulent time period were evaluated, the RMSE was reduced to ±1.35 ppm CH4. Due to the ice-buffered sampling environment in the air-filled cavity under the Greenland ice sheet, no post-corrections for variations in air temperature, humidity, or cross interference from other hydrocarbon gases were needed for the MOS measurements. Combined with measurement of airflow and meltwater discharge, the measurement of CH4 concentrations can be used for determination of the mass flux of CH4 to the atmosphere. The study demonstrates a clear potential for expanded monitoring of spatial and temporal variation in CH4 emissions from the subglacial domain of the Greenland ice sheet using low-cost and low-power MOS.
Original data can be accessed by e-mail to the corresponding author Christian Juncher Jørgensen (cjj@bios.au.dk).
CJJ and JRC designed and carried out the field experiments. CJJ, JMO, and KFU planned and carried out the laboratory calibrations. CJJ and JRC prepared the paper, with contributions from all co-authors.
The authors declare that they have no conflict of interest.
The laboratory test of MOSs was performed by FORCE Technology.
This research has been supported by the Brødrene Hartsmanns Fond (Udledning af metan til atmosfæren fra gletchere (project no. A32524)) and the Danish Agency for Innovation (A4 Den Danske Renluftsektor).
This paper was edited by Daniela Famulari and reviewed by three anonymous referees.
Bastviken, D., Nygren, J., Schenk, J., Parellada Massana, R., and Duc, N. T.: Technical note: Facilitating the use of low-cost methane (CH4) sensors in flux chambers – calibration, data processing, and an open source make-it-yourself logger, Biogeosciences Discuss., https://doi.org/10.5194/bg-2019-499, in review, 2020.
Brannon, E. Q., Moseman-valtierra, S. M., Rella, C. W., Martin, R. M., Chen, X., and Tang, J.: Evaluation of laser-based spectrometers for greenhouse gas flux measurements in coastal marshes, Limnol. Oceanogr.-Meth., 14, 466–476, https://doi.org/10.1002/lom3.10105, 2016.
Callaghan, T. V., Johansson, M., Key, J., Prowse, T., Ananicheva, M., and Klepikov, A.: Feedbacks and Interactions: From the Arctic Cryosphere to the Climate System, AMBIO, 40, 75–86, https://doi.org/10.1007/s13280-011-0215-8, 2011.
Christiansen, J. R. and Jørgensen, C. J.: First observation of direct methane emission to the atmosphere from the subglacial domain of the Greenland Ice Sheet, Scientific Reports, 8, 16623, https://doi.org/10.1038/s41598-018-35054-7, 2018.
Emmerton, C. A., St. Louis, V. L., Lehnherr, I., Humphreys, E. R., Rydz, E., and Kosolofski, H. R.: The net exchange of methane with high Arctic landscapes during the summer growing season, Biogeosciences, 11, 3095–3106, https://doi.org/10.5194/bg-11-3095-2014, 2014.
Eugster, W. and Kling, G. W.: Performance of a low-cost methane sensor for ambient concentration measurements in preliminary studies, Atmos. Meas. Tech., 5, 1925–1934, https://doi.org/10.5194/amt-5-1925-2012, 2012.
Eugster, W., Laundre, J., Eugster, J., and Kling, G. W.: Long-term reliability of the Figaro TGS 2600 solid-state methane sensor under low Arctic conditions at Toolik lake, Alaska, Atmos. Meas. Tech. Discuss., https://doi.org/10.5194/amt-2019-402, in review, 2019.
Hopkins, F. M., Kort, E. A., Bush, S. E., Ehleringer, J. R., Lai, C. T., Blake, D. R., and Randerson, J. T.: Spatial patterns and source attribution of urban methane in the Los Angeles Basin, J. Geophys. Res., 121, 2490–2507, https://doi.org/10.1002/2015JD024429, 2016.
Juncher Jørgensen, C., Lund Johansen, K. M., Westergaard-Nielsen, A., and Elberling, B.: Net regional methane sink in High Arctic soils of northeast Greenland, Nat. Geosci., 8, 20–23, https://doi.org/10.1038/ngeo2305, 2015.
Kumar, R., Imam, S. A., and Khan, M. R.: A Critical Review of Taguchi Gas Sensor for the Detection of VOC's, MASAUM Journal Of Reviews and Surveys, 1, 177–183, available at: https://www.researchgate.net/profile/Rajesh_Kumar529/publication/239280207_A_CRITICAL_REVIEW_OF_TAGUCHI_GAS_SENSOR_FOR_THE_DETECTION__OF_VOC'S/links/59bab980aca272aff2d012f8/A-CRITICAL-REVIEW-OF-TAGUCHI-GAS-SENSOR-FOR-THE-DETECTION-OF-VOCS.pdf (last access: 23 April 2020), 2009.
Lamarche-Gagnon, G., Wadham, J. L., Lollar, B. S., Arndt, S., Fietzek, P., Beaton, A. D., Tedstone, A. J., Telling, J., Bagshaw, E. A., Hawkings, J. R., Kohler, T. J., Zarsky, J. D., Mowlem, M. C., Anesio, A., and Stibal, M.: Greenland melt drives continuous export of methane from its bed, Nature, 565, 73–77, https://doi.org/10.1038/s41586-018-0800-0, 2018.
Masson, N., Piedrahita, R., and Hannigan, M.: Approach for quantification of metal oxide type semiconductor gas sensors used for ambient air quality monitoring, Sensor. Actuat. B-Chem., 208, 339–345, https://doi.org/10.1016/J.SNB.2014.11.032, 2015.
Penza, M., Suriano, D., Cassano, G., Pfister, V., Amodio, M., Trizio, L., Brattoli, M., and De Gennaro, G.: A case-study of microsensors for landfill air-pollution monitoring applications, Urban Climate, 14, 351–369, https://doi.org/10.1016/j.uclim.2014.09.002, 2015.
Peterson, P., Aujla, A., Grant, K., Brundle, A., Thompson, M., Vande Hey, J., and Leigh, R.: Practical Use of Metal Oxide Semiconductor Gas Sensors for Measuring Nitrogen Dioxide and Ozone in Urban Environments, Sensors, 17, 1653, https://doi.org/10.3390/s17071653, 2017.
Pirk, N., Mastepanov, M., López-Blanco, E., Christensen, L. H., Christiansen, H. H., Hansen, B. U., Lund, M., Parmentier, F.-J. W., Skov, K., and Christensen, T. R.: Toward a statistical description of methane emissions from arctic wetlands, Ambio, 46, 70–80, https://doi.org/10.1007/s13280-016-0893-3, 2017.
Saunois, M., Bousquet, P., Poulter, B., Peregon, A., Ciais, P., Canadell, J. G., Dlugokencky, E. J., Etiope, G., Bastviken, D., Houweling, S., Janssens-Maenhout, G., Tubiello, F. N., Castaldi, S., Jackson, R. B., Alexe, M., Arora, V. K., Beerling, D. J., Bergamaschi, P., Blake, D. R., Brailsford, G., Brovkin, V., Bruhwiler, L., Crevoisier, C., Crill, P., Covey, K., Curry, C., Frankenberg, C., Gedney, N., Höglund-Isaksson, L., Ishizawa, M., Ito, A., Joos, F., Kim, H.-S., Kleinen, T., Krummel, P., Lamarque, J.-F., Langenfelds, R., Locatelli, R., Machida, T., Maksyutov, S., McDonald, K. C., Marshall, J., Melton, J. R., Morino, I., Naik, V., O'Doherty, S., Parmentier, F.-J. W., Patra, P. K., Peng, C., Peng, S., Peters, G. P., Pison, I., Prigent, C., Prinn, R., Ramonet, M., Riley, W. J., Saito, M., Santini, M., Schroeder, R., Simpson, I. J., Spahni, R., Steele, P., Takizawa, A., Thornton, B. F., Tian, H., Tohjima, Y., Viovy, N., Voulgarakis, A., van Weele, M., van der Werf, G. R., Weiss, R., Wiedinmyer, C., Wilton, D. J., Wiltshire, A., Worthy, D., Wunch, D., Xu, X., Yoshida, Y., Zhang, B., Zhang, Z., and Zhu, Q.: The global methane budget 2000–2012, Earth Syst. Sci. Data, 8, 697–751, https://doi.org/10.5194/essd-8-697-2016, 2016.
Sohn, J. H., Atzeni, M., Zeller, L., and Pioggia, G.: Characterisation of humidity dependence of a metal oxide semiconductor sensor array using partial least squares, Sensor. Actuat. B-Chem., 131, 230–235, https://doi.org/10.1016/J.SNB.2007.11.009, 2008.
van den Bossche, M., Rose, N. T., and De Wekker, S. F. J.: Potential of a low-cost gas sensor for atmospheric methane monitoring, Sensor. Actuat. B-Chem., 238, 501–509, https://doi.org/10.1016/j.snb.2016.07.092, 2017.
Wadham, J. L., Hawkings, J. R., Tarasov, L., Gregoire, L. J., and Spencer, R. G. M.: Ice sheets matter for the global carbon cycle, Nat. Commun., 10, 3567, https://doi.org/10.1038/s41467-019-11394-4, 2019.
Wang, C., Yin, L., Zhang, L., Xiang, D., and Gao, R.: Metal oxide gas sensors: sensitivity and influencing factors, Sensors-Basel, 10, 2088–2106, https://doi.org/10.3390/s100302088, 2010.
Zona, D., Gioli, B., Commane, R., Lindaas, J., Wofsy, S. C., Miller, C. E., Dinardo, S. J., Dengel, S., Sweeney, C., Karion, A., Chang, R. Y.-W., Henderson, J. M., Murphy, P. C., Goodrich, J. P., Moreaux, V., Liljedahl, A., Watts, J. D., Kimball, J. S., Lipson, D. A., and Oechel, W. C.: Cold season emissions dominate the Arctic tundra methane budget, P. Natl. Acad. Sci. USA, 113, 40–45, https://doi.org/10.1073/pnas.1516017113, 2016.