the Creative Commons Attribution 4.0 License.
the Creative Commons Attribution 4.0 License.
 | 26 Jun 2020
The AERONET Version 3 aerosol retrieval algorithm, associated uncertainties and comparisons to Version 2
Alexander Sinyuk
Brent N. Holben
Thomas F. Eck
David M. Giles
Ilya Slutsker
Sergey Korkin
Joel S. Schafer
Alexander Smirnov
Mikhail Sorokin
Alexei Lyapustin
The Aerosol Robotic Network (AERONET) Version 3 (V3) aerosol retrieval algorithm is described, which is based on the Version 2 (V2) algorithm with numerous updates. Comparisons of V3 aerosol retrievals to those of V2 are presented, along with a new approach to estimate uncertainties in many of the retrieved aerosol parameters. Changes in the V3 aerosol retrieval algorithm include (1) a new polarized radiative transfer code (RTC), which replaced the scalar RTC of V2, (2) detailed characterization of gas absorption by adding NO2 and H2O to specify total gas absorption in the atmospheric column, specification of vertical profiles of all the atmospheric species, (3) new bidirectional reflectance distribution function (BRDF) parameters for land sites adopted from the MODIS BRDF/Albedo product, (4) a new version of the extraterrestrial solar flux spectrum, and (5) a new temperature correction procedure of both direct Sun and sky radiance measurements. The potential effect of each change in V3 on single scattering albedo (SSA) retrievals was analyzed. The operational almucantar retrievals of V2 versus V3 were compared for four AERONET sites: GSFC, Mezaira, Mongu, and Kanpur. Analysis showed very good agreement in retrieved parameters of the size distributions. Comparisons of SSA retrievals for dust aerosols (Mezaira) showed a good agreement in 440 nm SSA, while for longer wavelengths V3 SSAs are systematically higher than those of V2, with the largest mean difference at 675 nm due to cumulative effects of both extraterrestrial solar flux and BRDF changes. For non-dust aerosols, the largest SSA deviation is at 675 nm due to differences in extraterrestrial solar flux spectrums used in each version. Further, the SSA 675 nm mean differences are very different for weakly (GSFC) and strongly (Mongu) absorbing aerosols, which is explained by the lower sensitivity to a bias in aerosol scattering optical depth by less absorbing aerosols. A new hybrid (HYB) sky radiance measurement scan is introduced and discussed. The HYB combines features of scans in two different planes to maximize the range of scattering angles and achieve scan symmetry, thereby allowing for cloud screening and spatial averaging, which is an advantage over the principal plane scan that lacks robust symmetry. We show that due to an extended range of scattering angles, HYB SSA retrievals for dust aerosols exhibit smaller variability with solar zenith angles (SZAs) than those of almucantar (ALM), which allows extension of HYB SSA retrievals to SZAs less than 50∘ to as small as 25∘. The comparison of SSA retrievals from closely time-matched HYB and ALM scans in the 50 to 75∘ SZA range showed good agreement with the differences below ∼0.005. We also present an approach to estimate retrieval uncertainties which utilizes the variability in retrieved parameters generated by perturbing both measurements and auxiliary input parameters as a proxy for retrieval uncertainty. The perturbations in measurements and auxiliary inputs are assumed as estimated biases in aerosol optical depth (AOD), radiometric calibration of sky radiances combined with solar spectral irradiance, and surface reflectance. For each set of Level 2 Sun/sky radiometer observations, 27 inputs corresponding to 27 combinations of biases were produced and separately inverted to generate the following statistics of the inversion results: average, standard deviation, minimum and maximum values. From these statistics, standard deviation (labeled U27) is used as a proxy for estimated uncertainty, and a lookup table (LUT) approach was implemented to reduce the computational time. The U27 climatological LUT was generated from the entire AERONET almucantar (1993–2018) and hybrid (2014–2018) scan databases by binning U27s in AOD (440 nm), Angström exponent (AE, 440–870 nm), and SSA (440, 675, 870, 1020 nm). Using this LUT approach, the uncertainty estimates U27 for each individual V3 Level 2 retrieval can be obtained by interpolation using the corresponding measured and inverted combination of AOD, AE, and SSA.


The optical properties of particles in the Earth's atmosphere are measured or retrieved from numerous platforms, including space-based, airborne (or suborbital) and surface-based monitoring instruments. Remote sensing of aerosol optical properties is performed from all three of these instrument deployment platform types, while in situ measurements are made from both airborne and surface-based platforms. Measurements from all three of these major categories of platforms of both remotely sensed plus in situ data, in conjunction with atmospheric modeling, will be required to more accurately and completely understand the global extent of variability in aerosol optical properties (Kahn et al., 2004). While satellite (both polar-orbiting and geostationary) observations and retrievals are required for a full spatial understanding of aerosol properties, the uncertainty of these retrievals is at times greater than required for some applications. Additionally, algorithm development for satellite retrieval of aerosol optical properties typically requires a highly accurate set of measurements from which to gauge the retrievals and include some a priori assumptions about particular properties of major aerosol types. The Aerosol Robotic Network (AERONET) (Holben et al, 1998) of globally distributed ground-based instruments has provided the basis for total column aerosol optical properties that are required for satellite validation purposes and for some algorithms the specification of particular aerosol optical properties that must be assumed in the retrieval algorithms. Satellite validation has been mainly focused on aerosol optical depth (AOD), and accurate AERONET measurements of this parameter have been utilized for numerous satellite instruments and algorithms (Sayer et al., 2018, 2019; Levy et al., 2013, 2015; Holzer-Popp et al., 2013; Lyapustin et al., 2018; Kahn et al., 2010; Limbacher et al., 2019; Ahn et al., 2014; Choi et al., 2018). Some satellite algorithms require that aerosol absorption be specified a priori, and some utilize AERONET retrievals of the imaginary refractive index and/or single scattering albedo (SSA) as the source of these regional values (Remer et al., 2005; Lyapustin et al., 2018). Additionally, some initial aerosol size distributions of basic types are required for some satellite retrievals of AOD, and for some algorithms these have been developed or informed by analysis of AERONET retrievals (Remer et al., 2005; Holzer-Popp et al., 2013; Lyapustin et al., 2018). Furthermore, assessment of satellite retrievals of aerosol absorption by Jethva et al. (2014), as parameterized by SSA, has been performed by comparison to AERONET retrievals of SSA.
In order to assess the impact of aerosol on the Earth's climate system and compute aerosol radiative forcing, effective total column parameters are often required. AERONET measurements of AOD and retrievals of the size distributions and SSA are representative of the radiatively effective total column extinction weighted values. Kinne (2019a) utilized the AERONET database of AOD and retrieved parameters in conjunction with models and satellite data to construct a monthly global aerosol climatology. This aerosol climatology was then applied to compute global aerosol radiative forcing in Kinne (2019b). Additionally, analysis of aerosol black carbon in the global atmosphere and its effects on radiative forcing by Bond et al. (2013) utilized AERONET retrievals of SSA and the imaginary refractive index as one of many individual data sets of the spatial distribution of aerosol absorption. A particular strength of the AERONET database in analysis of regional or global aerosol variability is that the instrumentation is consistent throughout the network, with the same calibration standards applied to all data, and all of the data are processed with the same algorithms for the computation of AOD and the retrievals of all other aerosol parameters.
At each AERONET site the key instrumentation is comprised of an automatic Sun and sky scanning ground-based radiometer that performs measurements of direct solar intensity and directional sky radiance distributions. AERONET sites are located at numerous locations worldwide on all continents and some oceanic islands (∼500 sites in 2020). The automatic tracking Sun and sky scanning radiometers (CIMEL Electronique CE-318) take direct Sun measurements with a 1.2∘ full field of view every ∼5 to 15 min at 340, 380, 440, 500, 675, 870, 940, 1020 and 1640 nm (1640 nm excluded in older instruments). These solar extinction measurements are used to compute total column AOD at each wavelength except for the 940 nm channel, which is used to retrieve total column water vapor (or perceptible water) in centimeters (Schmid et al., 2001; Smirnov et al., 2004; Giles et al., 2019). The estimated uncertainty in computed AOD, due primarily to calibration uncertainty, is ∼0.010–0.021 for field instruments (which is spectrally dependent with the higher errors in the UV; Eck et al., 1999a). In addition to AOD from direct Sun measurements, the CIMEL collects sky radiance measurements in the almucantar geometry (fixed elevation angle equal to solar elevation, and ±180∘ azimuthal sweeps) at 440, 675, 870, and 1020 nm (nominal wavelengths with 380, 500 and 1640 nm added in newer instruments). Almucantar sky radiance measurements are made at optical air masses of 4, 3, 2, and 1.7 (75, 70, 60, 54∘ solar zenith angle, respectively) in the morning and afternoon, and once per hour in between. The newest instruments also perform hybrid scan measurements of directional sky radiances allowing additional retrievals below 50 to 25∘ solar zenith angle (SZA), which will be discussed in more detail later in Sect. 4.
The spectral AOD combined with the spectral sky radiance measurements constitute the input data sets to the AERONET aerosol retrieval algorithm. The algorithm was developed in Dubovik and King (2000) and Dubovik et al. (2006) and retrieves column-integrated aerosol size distribution and complex index of refraction. Other aerosol characteristics such as SSA, absorption AOD, asymmetry factor, lidar and depolarization ratios are calculated from the retrieved aerosol parameters. The stable performance of the inversion algorithm was illustrated in sensitivity studies performed by Dubovik et al. (2000), where the perturbations of the inversion resulting from random errors, possible instrument offsets and known uncertainties in the atmospheric radiation model were analyzed. Dubovik et al. (2000) employed retrieval tests using known size distributions to demonstrate successful retrievals of mode radii and the relative magnitude of modes for various types of bimodal size distributions, such as those dominated by a sub-micron accumulation mode or distributions dominated by super-micron coarse-mode aerosols. Based on this retrieval approach and an 8-year record of AERONET aerosol measurements, a climatology of the microphysical and optical properties of key aerosol types was developed (Dubovik et al., 2002). Over the years, AERONET aerosol retrievals have been widely used by the aerosol remote sensing community (e.g., Schuster et al., 2005, 2016; Xu et al., 2018; Chen et al., 2019; Wang et al., 2018; Benkhalifa et al., 2017; Lee et al., 2017; Qu et al., 2017; Zhang et al., 2017; Si et al., 2017).
Although very few direct comparisons of size distribution between in situ and AERONET retrievals have been published, several aerosol microphysical and optical parameters have been compared in specific regions: size of the fine-mode aerosols (e.g., Schafer et al., 2019; Reid et al., 2005 (South America, southern Africa, and North America); Clarke et al., 2002 (pollution in the Arabian Sea)) and size of larger sub-micron aerosols (e.g., Eck et al., 2010 (stratospheric aerosols); Reid et al., 2006 (sea salt), 2008a (desert dust); Smirnov et al., 2003 (maritime aerosol); Johnson and Osborne, 2011 (Sahel region of western Africa)). These comparisons showed a reasonably good agreement between AERONET retrievals of size distribution and in situ measurements. For example, Reid et al. (2005) showed that volume median diameters of the in situ versus AERONET retrievals are often within ∼0.01 µm of each other. For aerosol absorption, Schafer et al. (2014) compared SSA derived from AERONET and in situ aerosol profiles measured by the NASA Langley Aerosol Group Experiment (LARGE) team in the summer of 2011 during the coincident DRAGON-MD (Distributed Regional Aerosol Gridded Observational Network-Maryland) and DISCOVER-AQ (Deriving Information on Surface conditions from Column and Vertically Resolved Observations Relevant to Air Quality) experiments. Schafer et al. (2014) determined that the average SSA difference between LARGE in situ measurements and AERONET retrieval was ∼0.01 with a maximum difference in SSA of 0.023, while all of the observed differences were within the combined stated uncertainty for the AERONET SSA retrieval and measurement accuracies (0.03 for AERONET; 0.02 for LARGE).
The AERONET aerosol retrieval algorithm gradually evolved from its original Version 1 (V1) to V2 by improving the modeling capabilities of aerosol and the land–atmosphere system while keeping the inversion module of the algorithm intact. The first major advancement in V2 as compared to V1 was the refinement of the surface reflectance model. In V1 the reflectance was assumed to be isotropic and invariant geographically, with reflectance values of 0.03, 0.06, 0.20, and 0.20 for the 440, 675, 870, and 1020 nm wavelengths, respectively. Bright soil and sand surfaces have much higher spectral reflectance than the values assumed in V1 retrievals, which resulted in large errors in prescribed surface reflectance affecting the accuracy of retrieved aerosol parameters, including single scattering albedo (Sinyuk et al., 2007). In V2, bidirectional reflectance distribution function (BRDF) models were utilized that allow for dynamic reflectance as a function of solar zenith angle over land and water (e.g., Eck et al., 2008). Over the ocean, the Cox and Munk (Cox and Munk, 1954; Nakajima and Tanaka, 1983) model approximates the water BRDF as a function of wind speed, and over the land the Li–Ross model (e.g., Lucht and Roujean, 2000) was applied. The land BRDF parameters were adopted from MODIS generic ecosystem-type models and mixed by the ecosystem map of Moody et al. (2005). The second major improvement in V2 was related to the modeling of aerosol microphysics. V1 provided two types of aerosol retrievals for each set of input data: one obtained by modeling aerosol particles as homogeneous spheres and another using a model of randomly oriented spheroids, with either of them to be selected using external information such as the Angström exponent (AE). In V2 the aerosol is modeled as a mixture of spherical and non-spherical particles with the percentage of spherical aerosols in the mixture as a new retrieval parameter (Dubovik et al., 2006). The comparison of V1 and V2 aerosol retrievals (Eck et al., 2008) showed improved accuracy of size distribution and SSA retrievals for both fine- and coarse-mode-dominated aerosols. For example, the V1 artificial bimodality in the coarse-mode size distribution retrieved for dust aerosols was largely eliminated in V2. Also, in V2 the quality assurance criteria of V1 were revised and extended to help improve the accuracy and quality of the retrieved aerosol parameters (Holben et al., 2006).
The principal reasons for updating the V2 aerosol retrieval algorithm to a newer version were to further improve the modeling capabilities and extend them to a larger number of applications. For example, both V1 and V2 employed a scalar radiative transfer code (RTC) which restricts applicability of the retrieval algorithm to intensity measurements in the visible and infrared parts of the spectrum. For accurate modeling of atmospheric radiation in the UV or application of the retrieval algorithm to polarization measurements, the scalar RTC needed to be replaced by a vector code. Additional improvements involved more accurate characterization of gaseous absorption. In V1 only the absorption by ozone (O3) was accounted for at 675 nm due to its considerable contribution to the total absorption with an optical depth of ∼0.012. Another atmospheric gas which can potentially affect the SSA retrievals at 440 nm is nitrogen dioxide (NO2). NO2 is primarily emitted from the burning of fossil fuel. NO2 in the lower atmosphere forms principally from emissions from cars, trucks and buses, power plants, and off-road equipment, and in lower concentrations from biomass burning. For some AERONET sites, the NO2 absorption AOD at 440 nm is comparable to or even exceeds 675 nm absorption AOD of O3. For example, at the Beijing site (China) the maximum NO2 absorption AOD in December/January exceeds that of O3 absorption in April (in parentheses): ∼0.016 (∼0.014). Accurately accounting for water vapor (H2O) absorption at 1020 nm is important due to the fact that optical depth of water vapor can be as high as ∼0.01 at sites where the column water vapor is very high: even for moderate and small values of water vapor, its contribution to the total absorption can be substantial due to the small 1020 nm AOD for fine-mode-dominated aerosols and low 1020 nm absorption by dust. In addition, specifying the vertical extinction/absorption profiles for all the atmospheric species can be beneficial, especially at short visible wavelengths and UV.
The assessment of the accuracy of aerosol parameters retrieved by the AERONET algorithm was presented in Dubovik et al. (2000). The investigation was a series of sensitivity studies for sets of predefined aerosol models for three main aerosol types, water soluble, biomass burning, and dust, with input uncertainties due to random errors, instrumental offsets, and known uncertainties in atmospheric radiation modeling. The accuracy of wavelength-dependent aerosol parameters (real and imaginary parts of the refractive index and SSA) was analyzed by Dubovik et al. (2000) for only one wavelength (440 nm) and a fixed value of SZA (60∘), while applicability of the results to the 50∘–70∘ range of SZA was further assumed. Also, the AOD dependence of uncertainties was analyzed for only two AOD ranges for water-soluble aerosols (smaller and greater than 0.2) and for one AOD range (greater than 0.5) for biomass burning and dust aerosol types. In this study, we extend the analysis of Dubovik et al. (2000) by including all the inversion wavelengths and also analyzing the results to a much wider range of both AOD and SZA.
This paper describes the changes and additions to the V3 aerosol retrieval algorithm as compared to that of V2, along with a new approach for estimating the uncertainties of retrieved aerosol parameters. The paper is organized as follows: Sect. 2 describes changes and additions to the V3 aerosol retrieval algorithm. In Sect. 3, we present an analysis of the potential effects of each change and addition on the retrieved aerosol parameters, plus a comparison of almucantar scan retrievals of aerosol properties from V2 to those of V3. A new measurement protocol (called the hybrid scan) which increases the SZA range over that of almucantar for small SZAs and allows a robust spectral radiance symmetry check to be performed is discussed in Sect. 4. Section 5 presents a new method to estimate the uncertainties of the retrieved aerosol parameters. The final section presents a summary and conclusions.
Scalar radiative transfer theory can be used to calculate radiances for an aerosol-laden atmosphere in the visible part of the electromagnetic spectrum (e.g., Kattawar et al., 1976). However, at shorter wavelengths due to an increasing contribution of molecular scattering, neglecting the effects of polarization results in errors that may be too large for some practical applications (Mishchenko et al., 1994). In Version 3 (V3) of the AERONET aerosol retrieval algorithm a new polarized radiative transfer code (RTC) SORD (Korkin et al., 2017) replaced the scalar discrete ordinate RTC of Nakajima and Tanaka (1986) utilized in Version 2 (V2). SORD allows accurate simulations of atmospheric radiation in a wide spectral range using the method of successive orders of scattering. The code was extensively tested using 52 benchmark scenarios providing an accuracy of ∼0.1 % for both intensity and polarization calculations. Unlike V2 RTC, whose speed was boosted by employing the truncation approximation of Nakajima and Tanaka (1988), no such approximation is used by SORD due to the potential problems it can cause in the forward scattering direction (e.g., Korkin et al., 2012). The NASA Center for Climate Simulation (NCCS) at the NASA Goddard Space Flight Center (GSFC) Discover cluster is utilized to overcome the significant increase in computational resources required for the application of SORD in AERONET retrievals (https://www.nccs.nasa.gov/systems/discover, last access: 8 June 2020).
With SORD enabling accurate modeling of atmospheric radiation at short wavelengths, the retrieval of aerosol absorption in UV is possible by adding the 380 nm channel to the standard AERONET spectral range (440–1020 nm). The aerosol absorption in the UV became the subject of substantial interest in recent years due to the strong absorption of UV radiation by fine-mode aerosol (e.g., Corr et al., 2009). For example, a strong increase in smoke aerosol absorption in the UV wavelengths was observed by Mok et al. (2016) and explained by the presence of brown carbon in aerosol composition. Also, dust aerosols exhibit significant absorption with decreasing wavelength in the visible and UV (e.g., Sokolik and Toon, 1999; Sinyuk, et al., 2003). AERONET can contribute to better understanding of aerosol absorption in UV by providing absorption estimates at numerous locations with varying aerosol types.
Employing the SORD-polarized RTC provides the potential to add polarization measurements (e.g., CIMEL CE318-DP Sun photometer) as input to the inversion. Recent publications show that combining intensity and polarization measurements in one data set improves the accuracy of retrievals of the real part of the refractive index of fine-mode aerosols and the shape of aerosol particles, but has a little effect on aerosol absorption and size (Li et al., 2009; Fedarenka et al., 2016). As of now (2019) AERONET does not widely acquire polarization measurements primarily due to the long time interval of measurement acquisition (thereby creating large temporal gaps in the AOD time series) and the lack of clear understanding regarding the optimal set of spectral channel polarization measurements to be used. Additional research is required to determine the optimal number of the observational angles and spectral channels needed to reduce the acquisition time of these measurements.
The AERONET V3 aerosol inversion algorithm is the same as the one employed in V2 and is described in Dubovik and King (2000) and Dubovik et al. (2006). However, V3 incorporates a detailed characterization of gas absorption, which was neglected in V2 and previous versions. In addition to ozone (O3) absorption, V3 also accounts for that of nitrogen dioxide (NO2) and water vapor (H2O) to specify total gas absorption in the atmospheric column. Ozone optical depth is determined by utilizing the total column Total Ozone Mapping Spectrometer (TOMS) monthly average climatology (1978–2004) of O3 concentration at 1.0∘ by 1.25∘ spatial resolution, the O3 optical air mass using O3 scale height adjustment by latitude (Komhyr et al., 1989), and the O3 absorption coefficient of Burrows et al. (1999). Similarly, the nitrogen dioxide optical depth utilized as input to the V3 retrieval is from the total column Ozone Monitoring Instrument (OMI) monthly average climatology (2004–2013) of NO2 concentration at 0.25∘ by 0.25∘ spatial resolution and the NO2 absorption coefficient of Burrows et al. (1998). Total column water vapor amount is determined from the AERONET CIMEL instrument 940 nm channel retrievals (Schmid et al., 1998).
In V2 the atmosphere was modeled as a plane-parallel homogeneous layer. While for the almucantar (ALM) observation geometry this is a reasonable assumption (e.g., Dubovik and King, 2000; Torres et al., 2014), for other geometries the sensitivity to the vertical structure of aerosol and gases in the atmosphere can be important, especially at shorter wavelengths with relatively large Rayleigh scattering. For example, the effect of aerosol vertical distribution on aerosol parameters retrieved from ALM and principal plane (PP) observations was analyzed in Torres et al. (2014). It was shown that PP retrievals are more strongly affected by assumptions about aerosol vertical distributions than those of ALM. In V3 vertical profiles of all input atmospheric species are specified. Daily spectral aerosol extinction profiles are obtained from MERRA-2 (Gelaro et al., 2017) global assimilation model simulations. The vertical absorption profiles for O3 and H2O are specified using data of MERRA-2 and NCEP/NCAR Reanalysis data, respectively, which are acquired from the NOAA National Weather Service NOMADS NCEP server (e.g., Saha et al., 2010). The data to characterize typical tropospheric and stratospheric NO2 profiles were obtained from Vlemmix et al. (2015) and Kerzenmacher et al. (2008), respectively. The aerosol extinction, O3, NO2, and water vapor profiles are reported at 73, 73, 20, and 9 atmospheric altitudes, respectively. In SORD, they are rescaled to the same grid used for optical depth integration (Korkin et al., 2016).
The surface reflection in SORD is modeled by two BRDFs: the Cox–Munk model over water by Nakajima and Tanaka (1983) and the Ross–Li model (e.g., Lucht and Roujean, 2000) over land. BRDF models are important for computing the solar zenith angle-dependent spectral reflectance throughout the day. For mixed water–land surfaces the two BRDF models are mixed using the percentage of land and water within a 5 km radius circle centered at each AERONET site. The land–water percentage is determined using the MODIS/Terra Land Water Mask. Cox–Munk calculations use near-surface wind speed from NCEP/NCAR Reanalysis data. The procedure of assigning parameters to the Ross–Li model in V3 is rather different than before. In V2, the land BRDF parameters for each site were determined using the maps of ecosystem types combined with generic BRDF parameters (courtesy of Feng Gao) assigned to each ecosystem type and a gap-filled MODIS black sky albedo product (Moody et al., 2005). For each AERONET site the BRDF parameters were averaged over all the ecosystem types within a 5 km radius circle, and the resulting BRDF was normalized by the MODIS black sky albedo. Since new BRDF products recently became available, V3 BRDF parameters for land sites are adopted from the MODIS BRDF/Albedo CMG Gap-Filled Snow-Free Product MCD43GF V005 (see the link at the end of the publications list). Both V2 and V3 BRDF land parameters were aggregated into a climatology to apply to all years prior to and after the BRDF data availability interval of 2002–2004 for V2 and 2003–2013 for V3. Near-real-time Ice and Snow Extent (NISE) from the National Snow and Ice Data Center by Nolin et al. (1998) and the MODIS snow cover map by Hall et al. (2002) are used to account for the BRDF of snow and/or ice.
In order to improve the overall quality of observations, V3 employs a temperature correction of both AOD and sky measurements applied to account for the correction procedure, and examples of its application are presented in detail in Giles et al. (2019). Note that in V2 only the solar (not sky) 1020 nm channel was corrected for temperature (using a constant nominal value), while in V3 all non-UV channels are corrected for temperature variation, typically using characterization of the temperature sensitivity of each individual instrument. Also, in V3 a newer version of the extraterrestrial solar flux spectrum (Coddington et al., 2016) replaced the older version (ASTM E-490 https://www.nrel.gov/grid/solar-resource/spectra.html, last access: 8 June 2020). The inversion procedure, aerosol parametrization, and the set of retrieved aerosol parameters are the same as those of V2 and described in detail in Dubovik and King (2000) and Dubovik et al. (2004, 2006).
The described changes and additions to the V3 aerosol retrieval algorithm, RTC code and data inputs influence the aerosol retrieval results. This section analyzes the effect these changes have on the V3 inversions by first examining the potential effect of each particular change and then comparing aerosol retrievals from V2 and V3.
3.1 The effect of changes in input BRDF
Figure 1 shows the difference in the black sky surface albedo calculated with the Ross–Li BRDF using parameters of V2 and V3. The calculations are done for four AERONET sites with different surface types: GSFC (USA, MD) – urban/forest, Mezaira (United Arab Emirates) – desert, Mongu (Zambia) – treed savanna, and Kanpur (India) – semiarid/urban with strong seasonality. Figure 1 shows reasonably good agreement among average values of surface albedo for non-desert sites, with a maximum difference of ∼0.025. For desert, the agreement is good at 440 nm but decreases with increasing wavelength, reaching a maximum of ∼0.085 at 1020 nm. This discrepancy can be explained by the difference in the angular shape of the BRDFs in V2 and V3 as illustrated in Fig. 2a, which presents the difference in surface albedo as a function of SZA for Mezaira. Figure 2a shows that the surface albedo difference at 440 nm does not exhibit any substantial SZA dependence and therefore can be explained by the difference in the reflectance magnitude. For longer wavelengths, the SZA dependence of the surface albedo difference is much stronger, resulting in maximum variability from −0.05 to −0.16 at 1020 nm, and can be explained by the BRDF of V2 being more anisotropic than that of V3. For non-desert sites the difference in BRDF angular shape is less significant, as illustrated by Fig. 2b for the GSFC site, showing albedo differences within ±0.05, which is the reported uncertainty of the MODIS BRDF product (Wang et al., 2018). The large difference in surface albedo for desert sites has the potential to influence retrievals of SSA at longer wavelengths. Figure 3 illustrates the sensitivity of normalized sky radiances (NSRs) to the changes in BRDF parameters. The NSRs constitute the input to the inversion code and are defined as the measurements divided by extraterrestrial solar flux and multiplied by π. The calculations are made for two values of the SZA (50 and 75∘) using dust aerosol parameters retrieved at the Mezaira site when the AOD at 440 nm is 0.65 and the Angström exponent (440–870 nm) is 0.25. As is seen from Fig. 3, the BRDF effect on NSR at 440 nm is moderate and decreasing with increasing SZA (∼2.0 % to ∼0.9 %). For longer wavelengths the relative difference of NSR is larger, reaching −8.8 % and −16 % at 1020 nm for SZA 50 and 75∘, respectively.
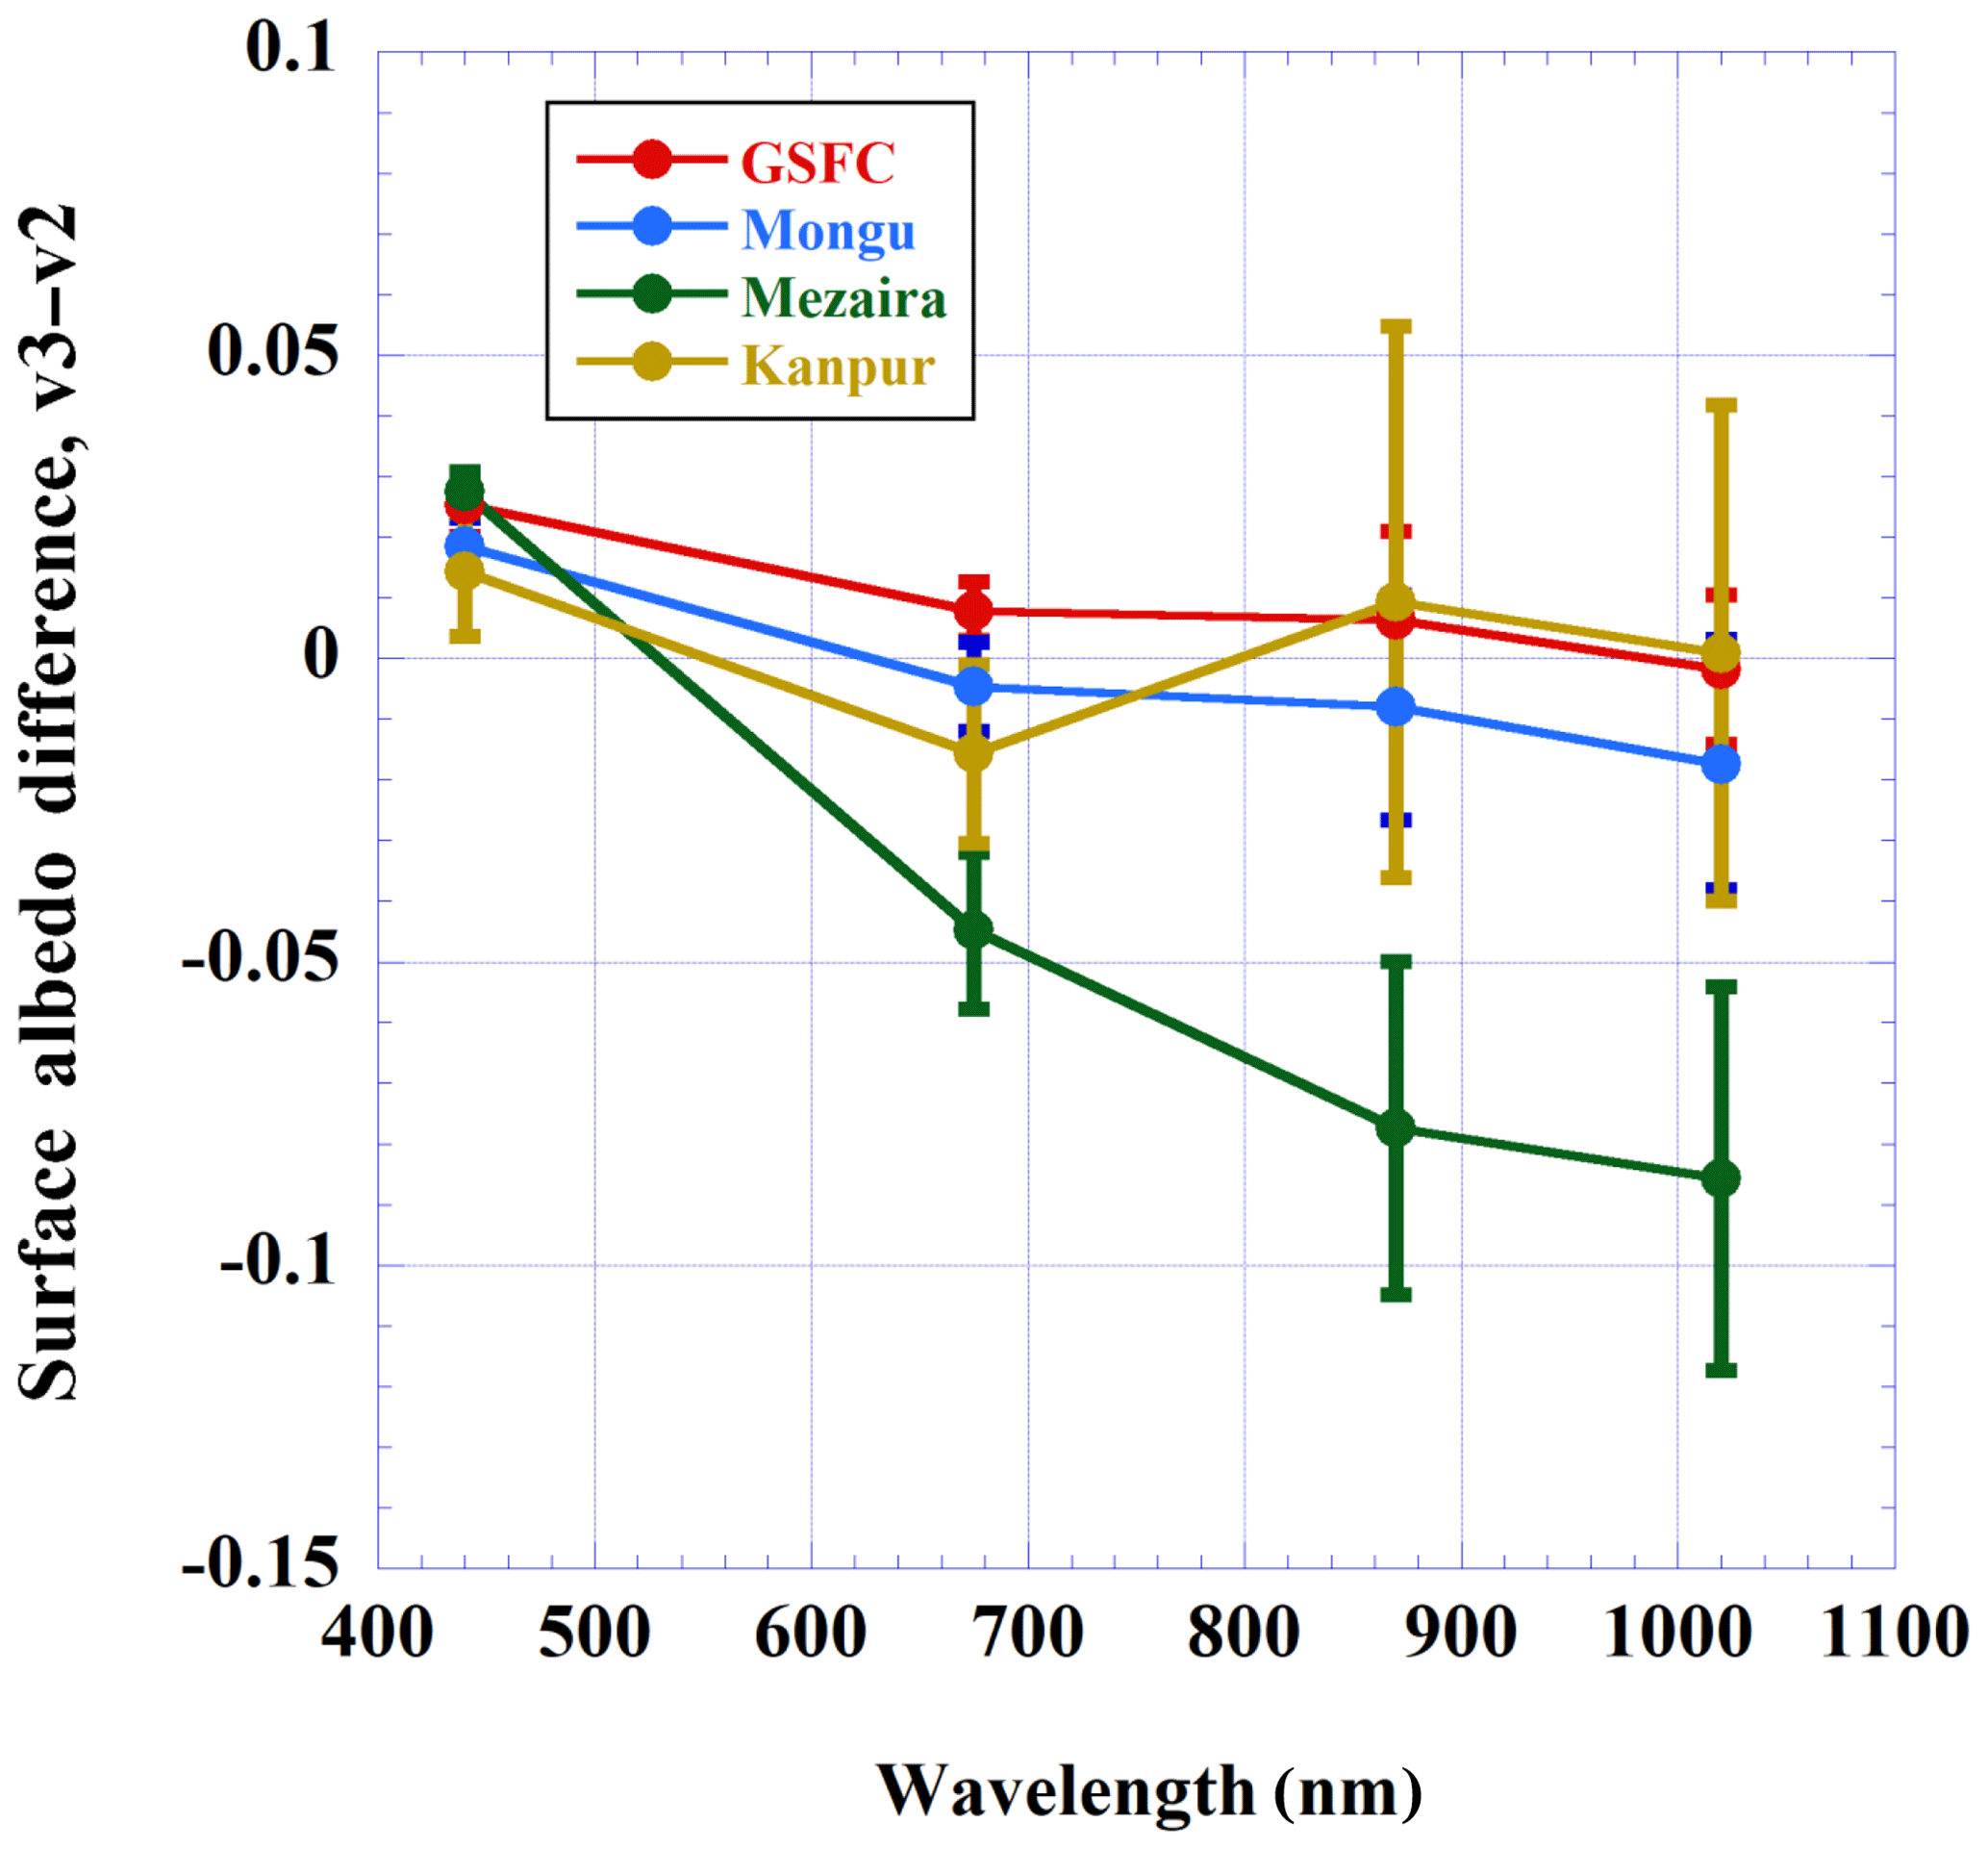
Figure 1The V2 and V3 average differences and standard deviations in surface albedo calculated using BRDF parameters at four sites: Goddard Space Flight Center (GSFC, USA), Mezaira (UAE), Mongu (Zambia), and Kanpur (India).
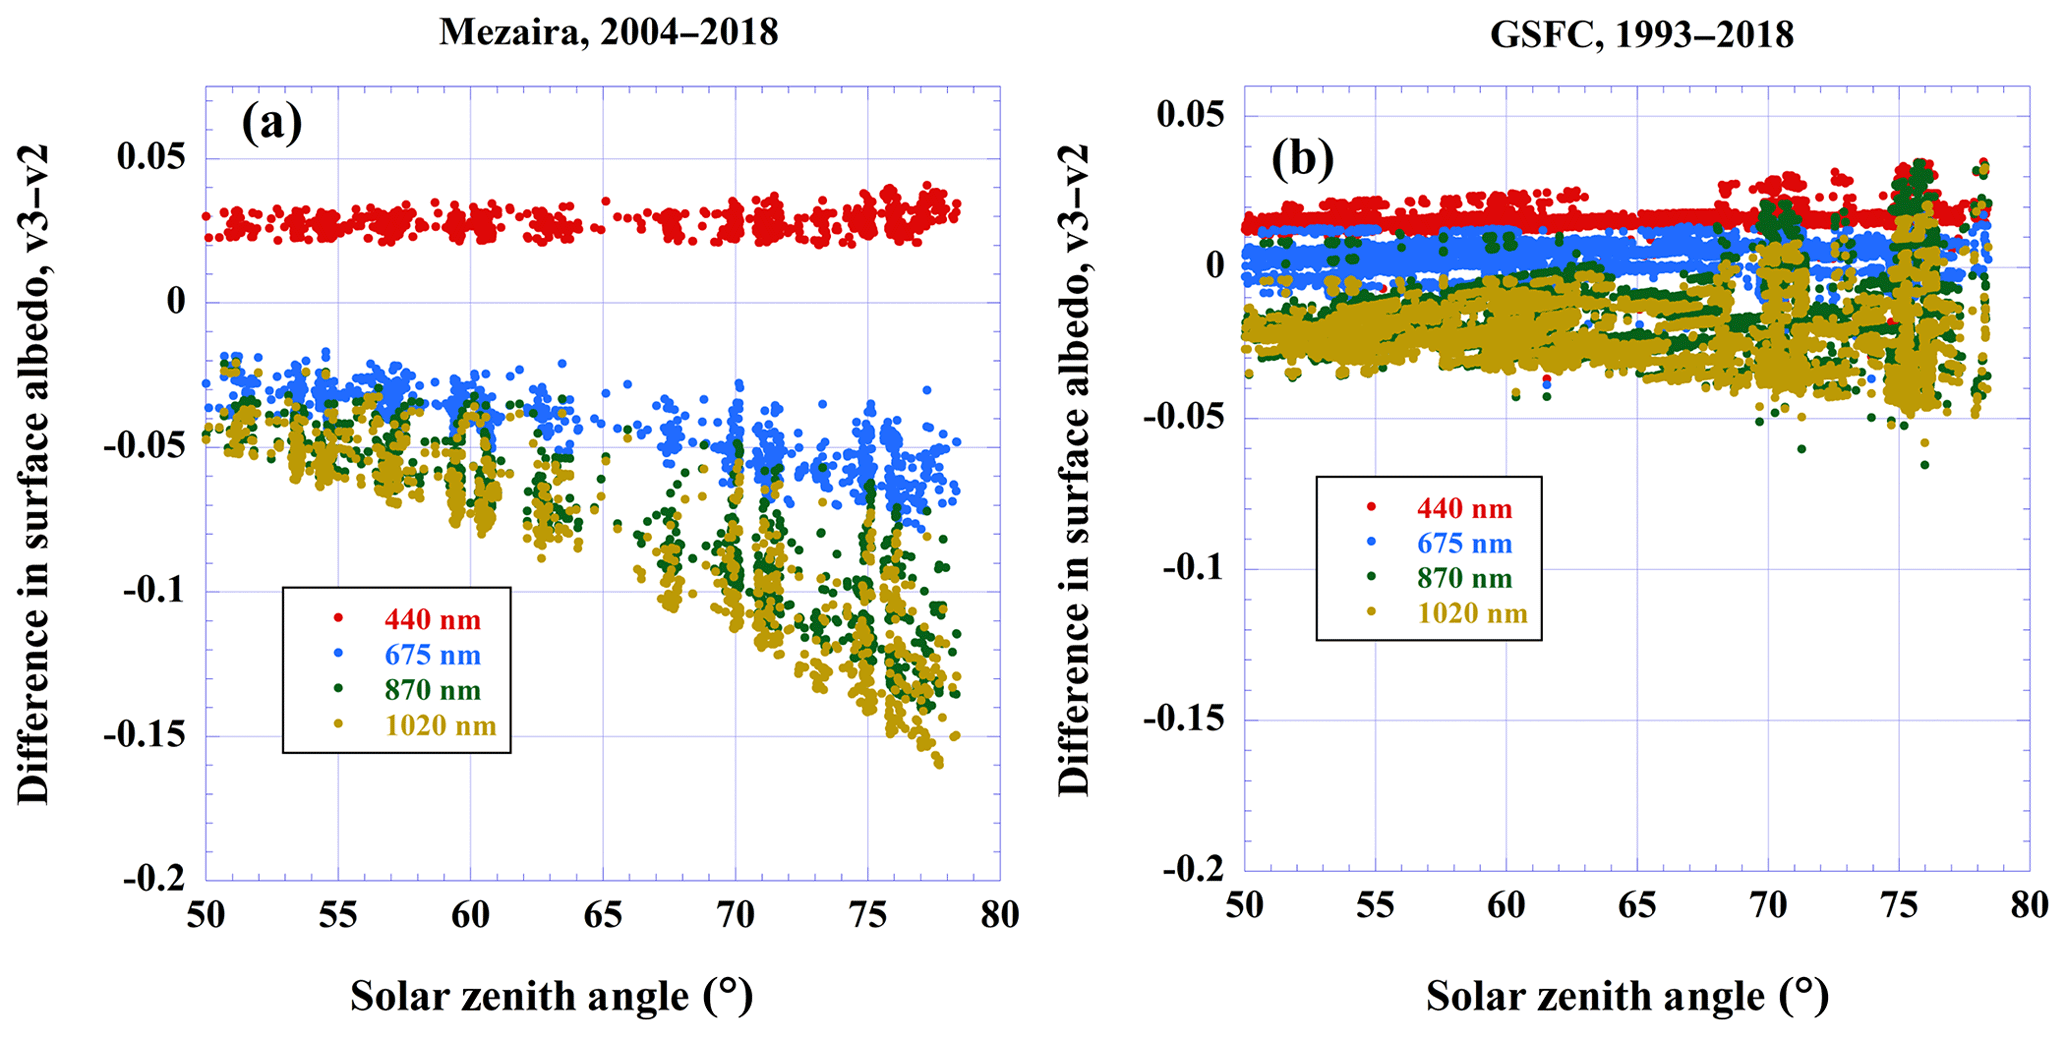
Figure 2Difference in surface albedo calculated with BRDF from V2 and V3 for (a) Mezaira (2004–2018) and (b) GSFC (1993–2018).
3.2 Effects of changes in extraterrestrial solar flux and temperature correction
Figure 4 shows the relative difference between the extraterrestrial solar fluxes of V2 and V3 for the four standard sky wavelengths of the AERONET retrievals. The agreement is reasonable (differences of ∼1 % or less) at most of the wavelengths, except 675 nm, where the difference is anomalously large (∼3 %). Figure 5 shows the combined effects of both changes in solar flux and application of the temperature correction of sky radiances on NSR for two instruments, nos. 721 and 1026, which were deployed at the Mezaira site in 2013–2014 and 2017–2018, respectively. Each point corresponds to an individual observation taken at a specific value of the Sun photometer sensor head temperature. In addition to temperature, part of the difference is due to solar flux changes and accounting for NO2 and water vapor absorption in V3. For example, at 675 nm, the ∼3 % bias is mostly due to differences in solar flux. The change in temperature dependence of the difference is due to the improved temperature correction in V3 (Giles et al., 2019). As is seen from Fig. 5a, the largest temperature correction effect is for 1020 nm, which is the most temperature-sensitive channel (Holben et al., 1998). At the same time for instrument 1026, the 1020 nm NSR difference is almost temperature-neutral. The reason is that instrument 1026 is the latest version – a T instrument equipped with a new model of filters (Iridian), which is much less temperature-sensitive than older filter models (Barr, Spetragon, POC) utilized in older versions of CIMEL instruments. Subtraction of the solar flux offset (V3 versus V2) in the case of the 1026 instrument gives a maximum NSR difference of ∼1.3 % at 440 nm and less than 1 % at 1020 nm. For instruments of older versions, the effect of temperature correction is expected to be larger than for those of Version-T; however, the specific numbers will vary from instrument to instrument.
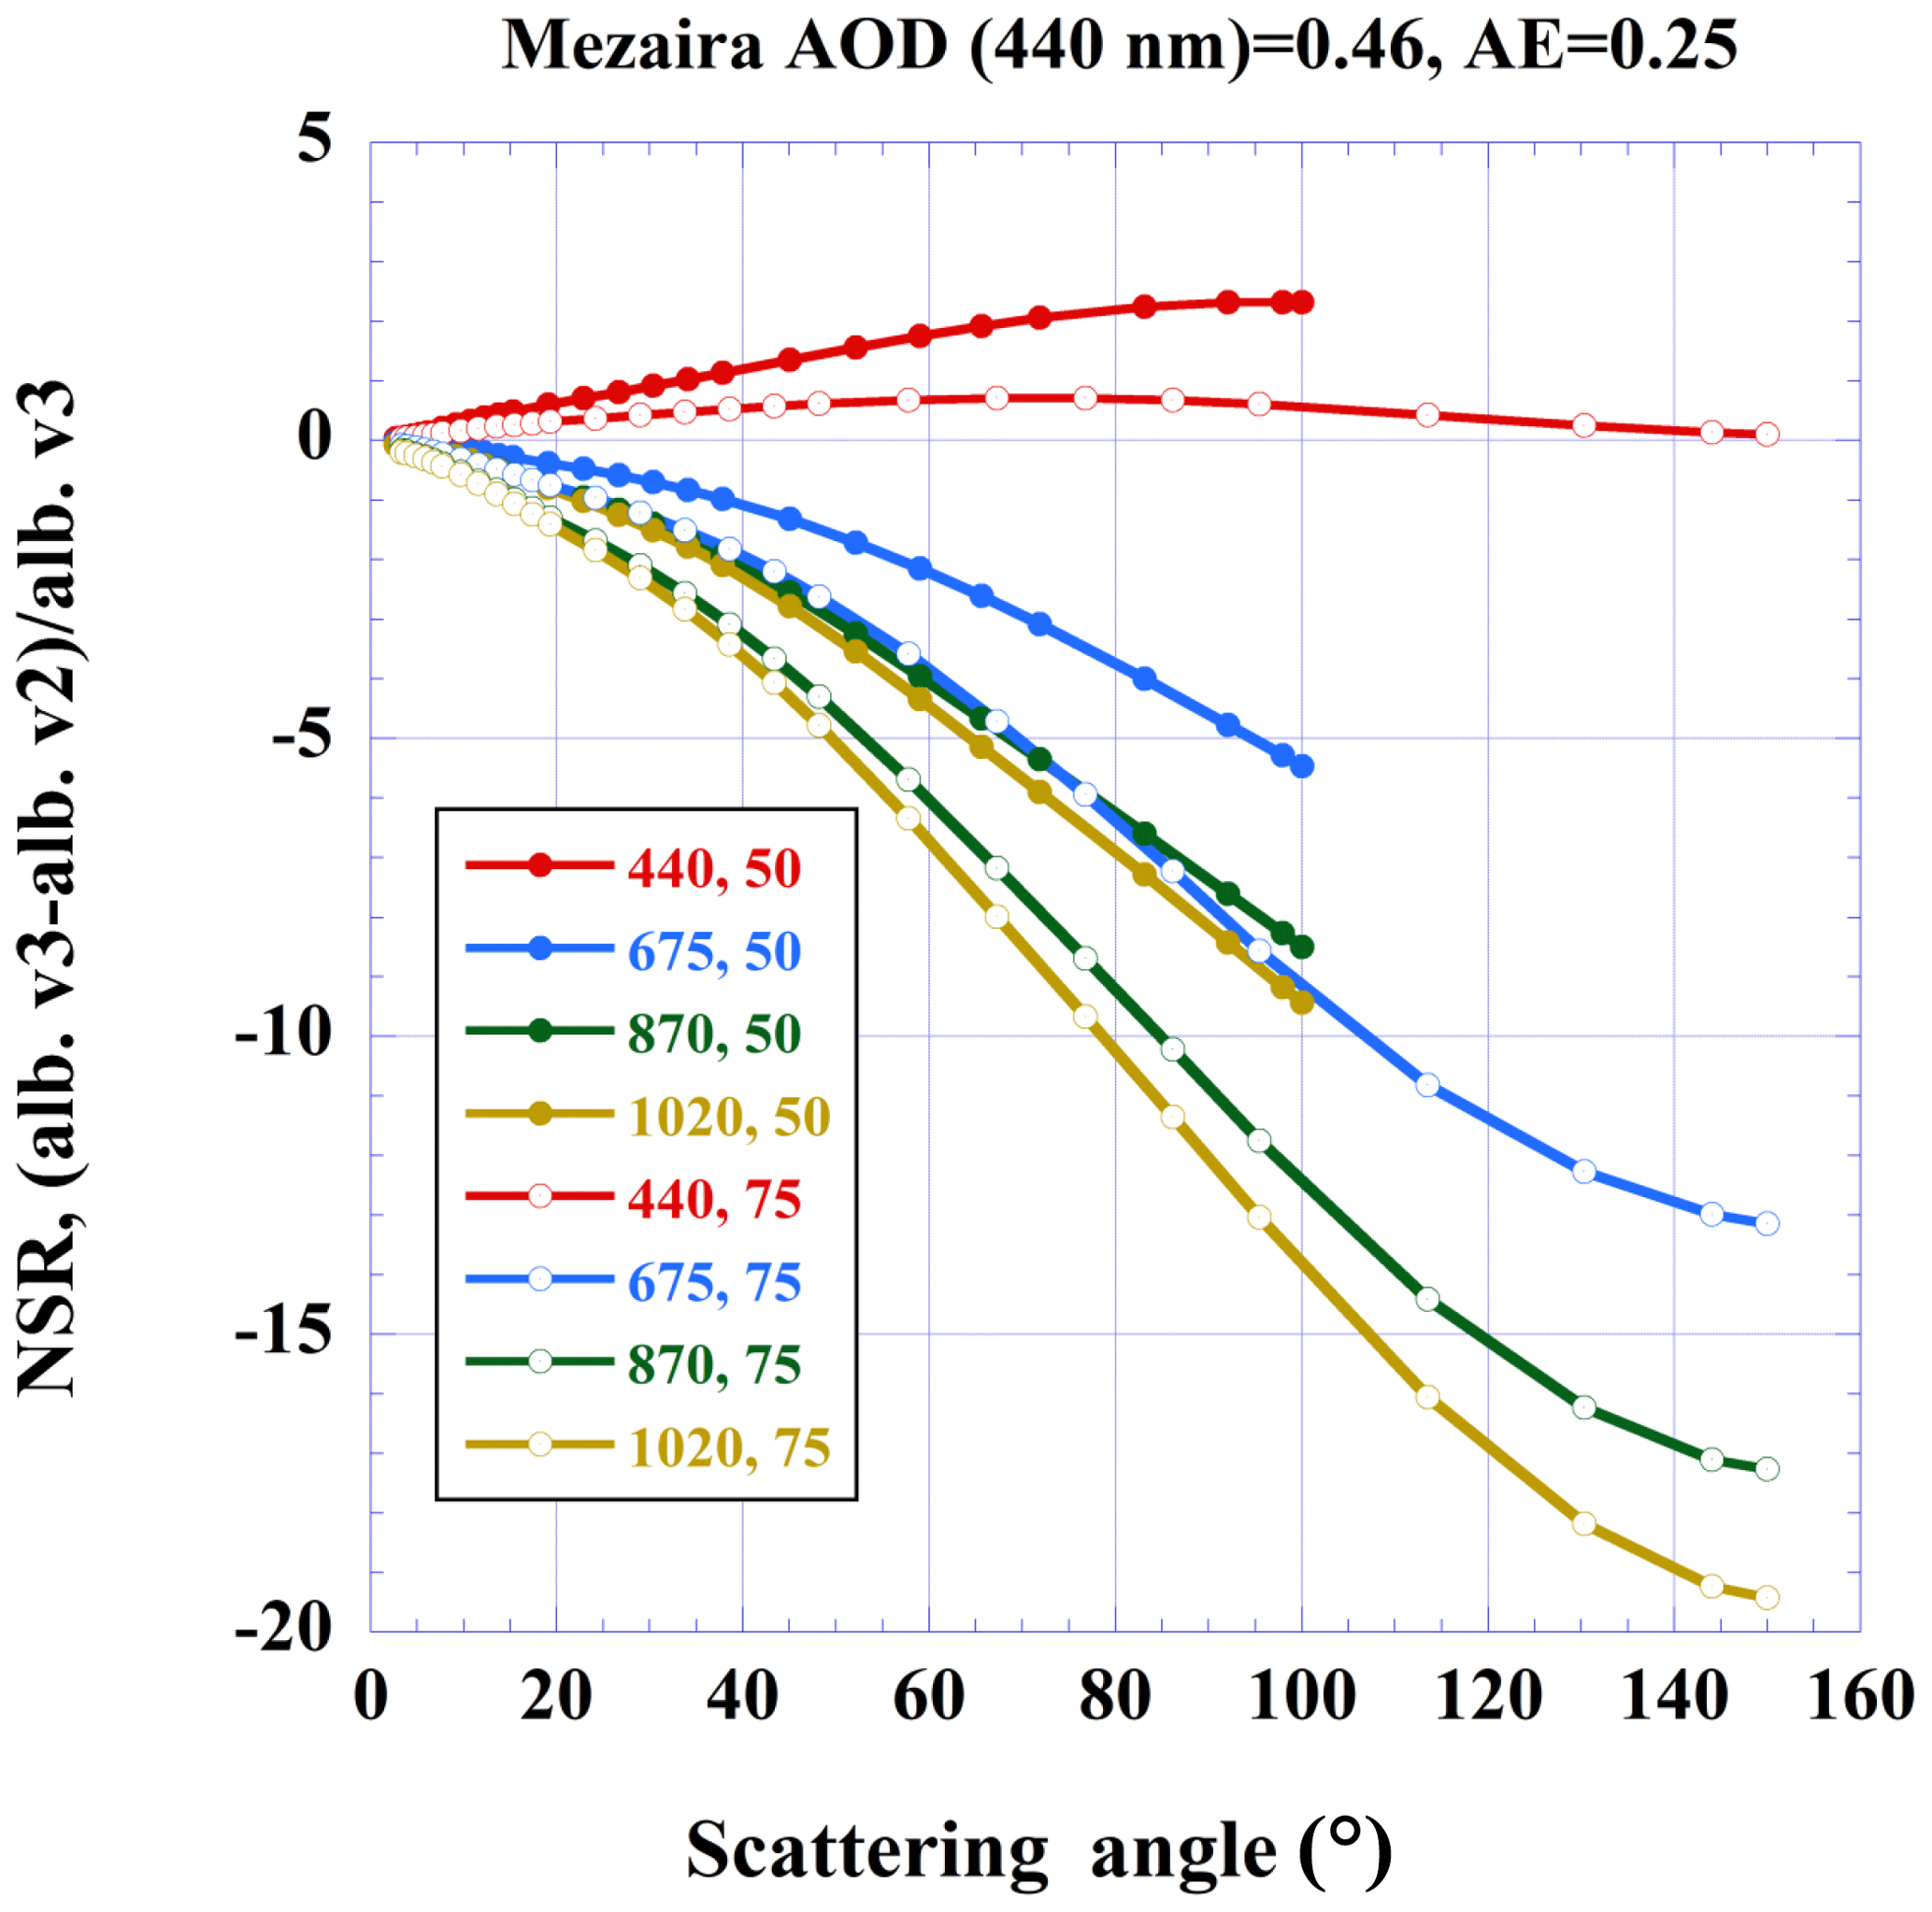
Figure 3The relative percent difference in normalized sky radiances (NSRs) calculated with BRDF parameters from V2 and V3 for the Mezaira site.
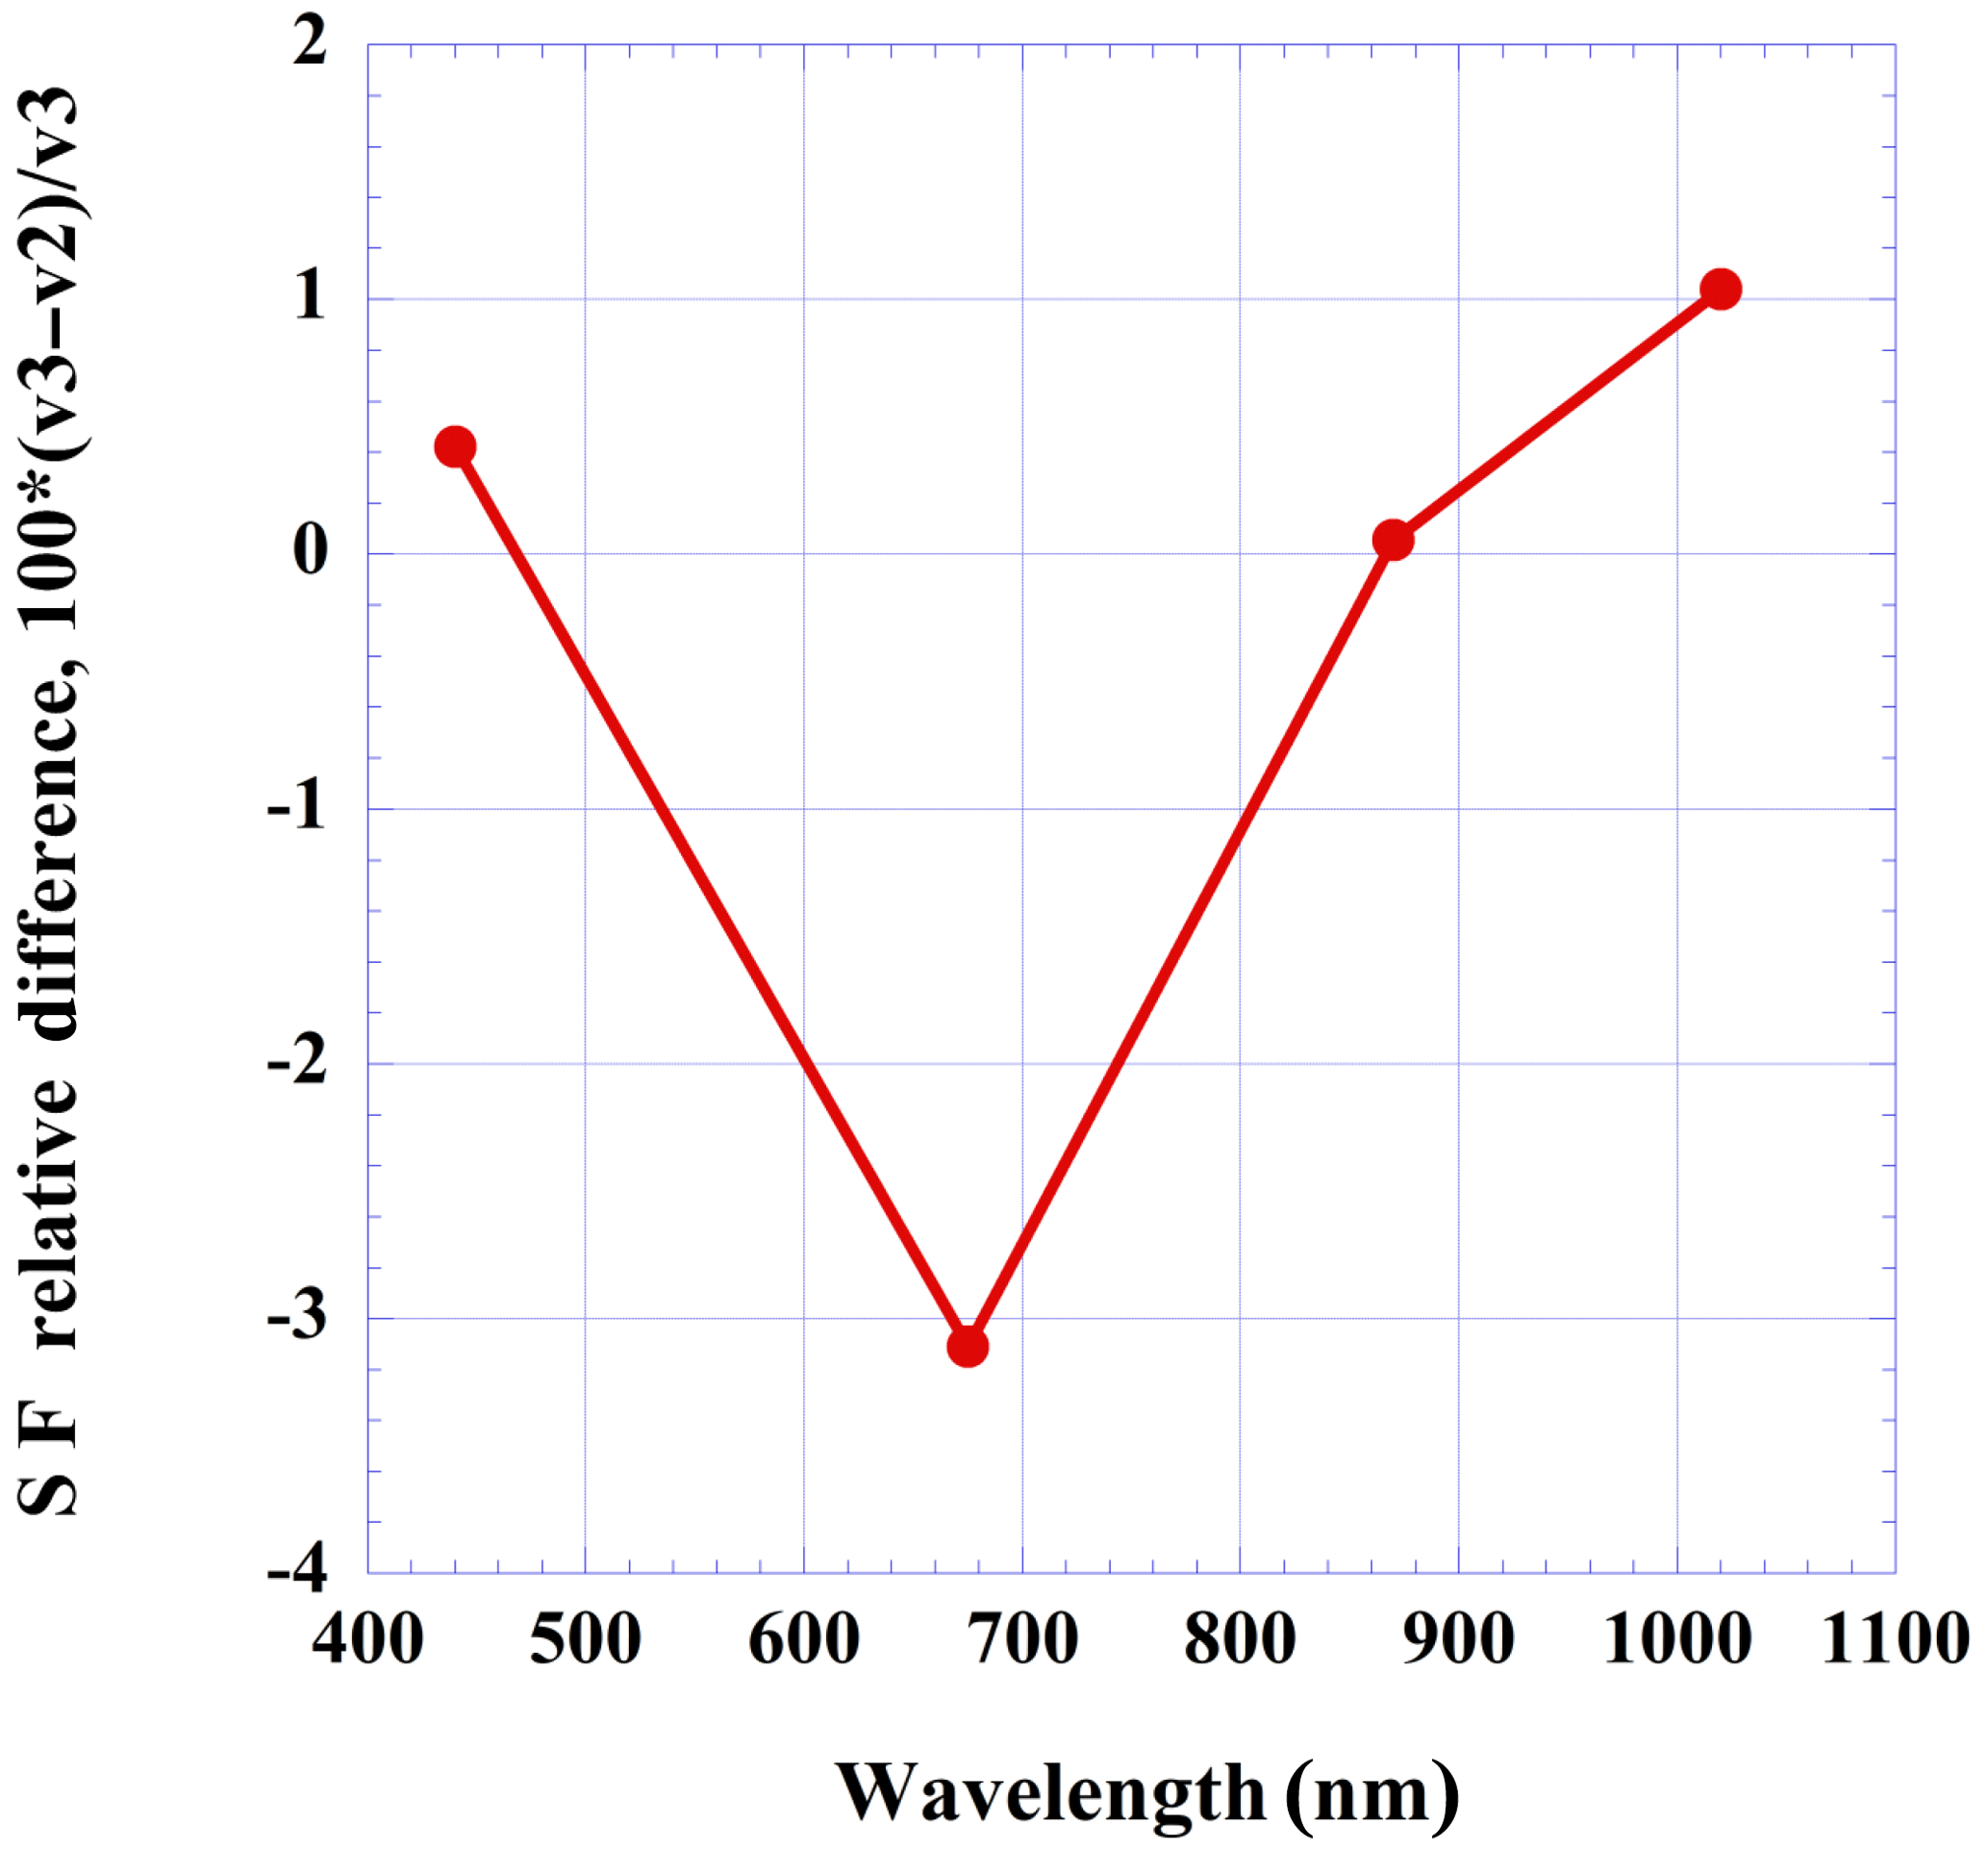
Figure 4The relative percent difference in spectral solar flux data used in V2 (ASTM E-490 https://www.nrel.gov/grid/solar-resource/spectra.html, last access: 8 June 2020) and V3 (Coddington et al., 2012) for four standard AERONET sky wavelengths (i.e., 440, 675, 870, and 1020 nm).
3.3 Joint effects of temperature correction, solar flux and BRDF on retrievals of SSA: case study
The joint effect of the above factors on aerosol retrievals is illustrated by a case study of diurnal variability of dust SSA retrieved at the Hamim AERONET site on 25 August 2004 during the UAE field campaign (e.g., Reid et al., 2008b). This site is located in a desert region in the United Arab Emirates and is in proximity to several dust aerosol sources. This particular day was selected due to a combination of a very stable AOD level (0.486±0.016) and a very stable 440–870 nm Angström exponent (0.22±0.01), which makes an assumption about the stability of aerosol properties throughout the day reasonable. Also, a large temperature gradient (29.1–47.8 ∘C), especially in the morning, makes an analysis of the diurnal variability of the temperature correction possible. Figure 6a shows the dependence of the difference in NSR on solar zenith angle, where negative values correspond to the morning and positive ones to the afternoon. In Fig. 6b the effect of solar flux is subtracted, so the variability is due to difference in temperature correction and BRDF only. Figure 6a shows that the total range of the variability of NSR difference is within for 675 and 1020 nm. Comparison of Fig. 6a and b shows that the 675 nm channel is primarily affected by changes in solar flux, while the difference at 1020 nm is mostly due to the temperature correction. The diurnal variability of NSR difference at 1020 nm shows clear dependence on SZA, reaching a maximum absolute value in the early afternoon when the instrument sensor head temperature is maximal. The NSR differences at 440 and 870 nm are the least affected by solar flux values due to their similarity in both graphs of Fig. 6. In addition, comparison of Fig. 6a and b shows that the difference due to the temperature correction at 440 nm is partially compensated by the change in solar flux, while at 675 and 1020 nm both factors work in the same direction.
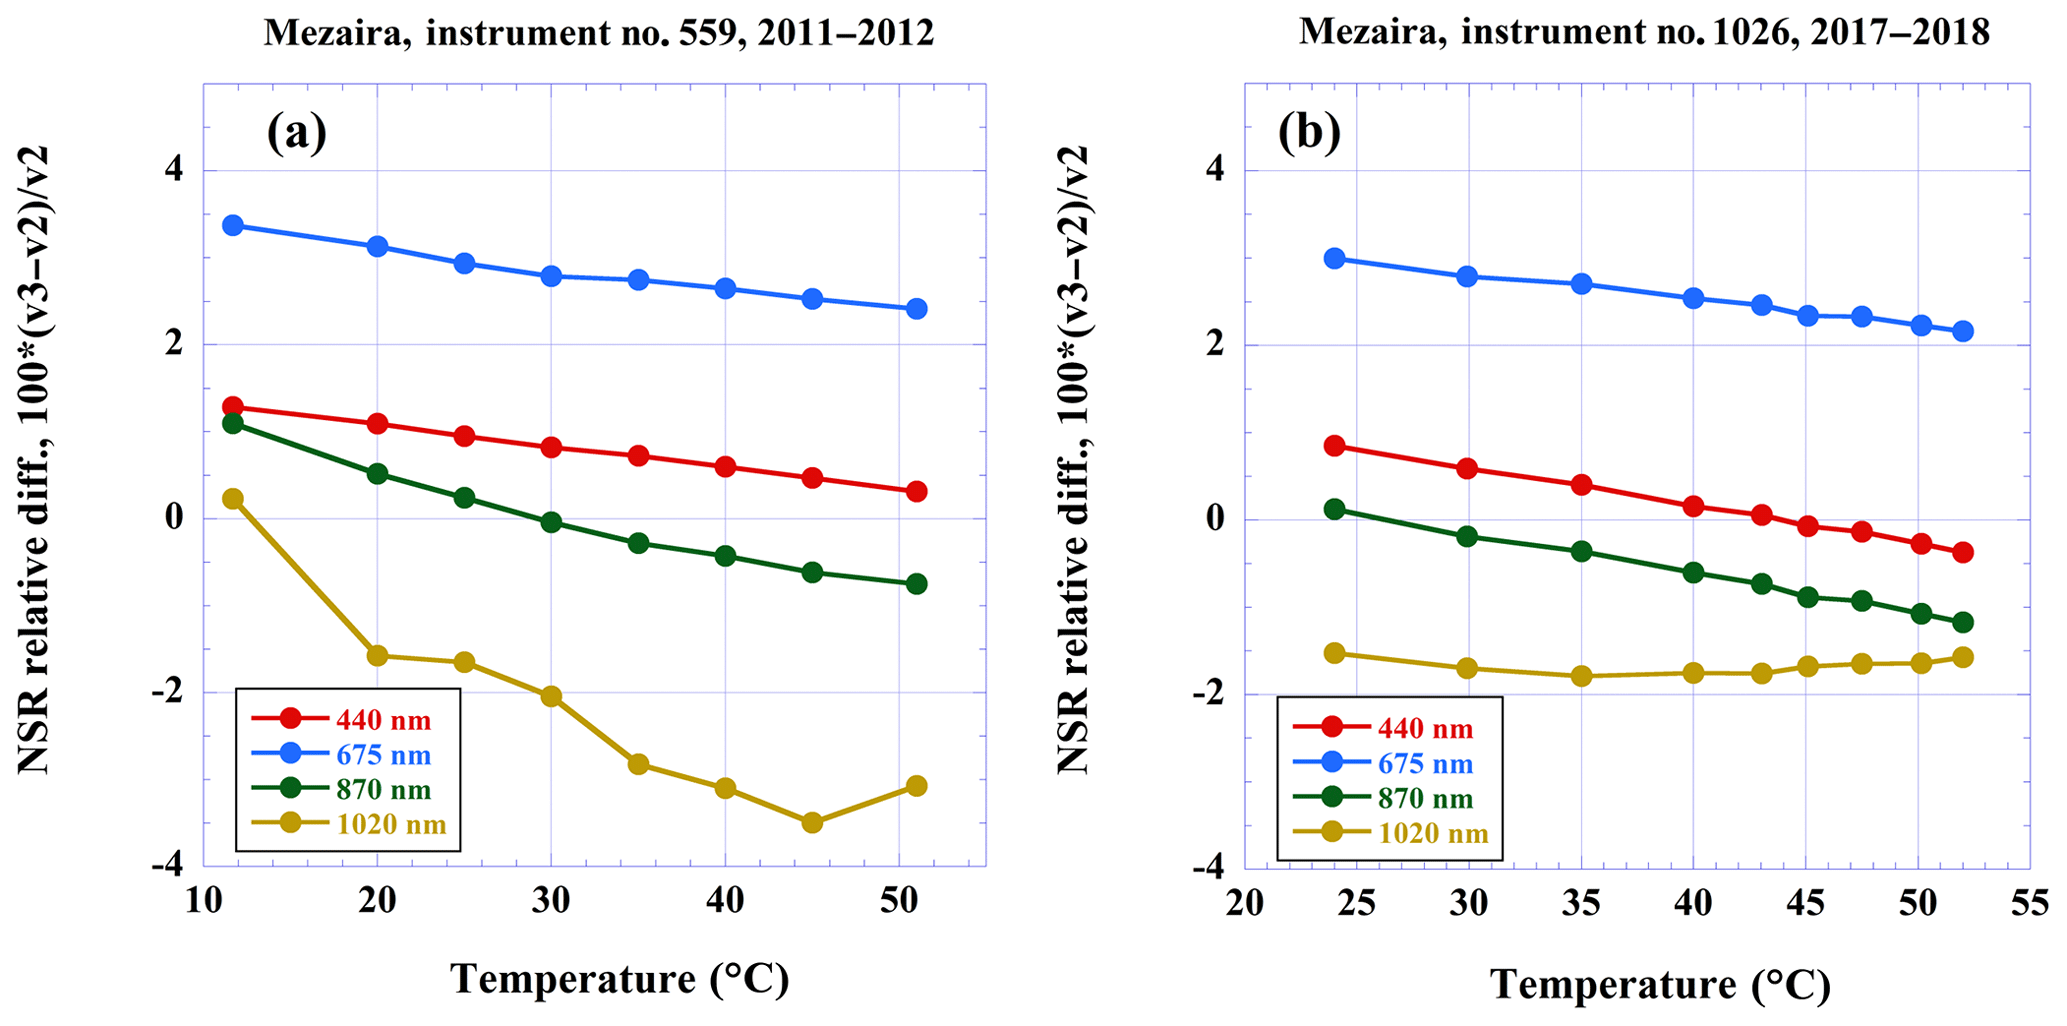
Figure 5Effect of solar spectrum and temperature correction on relative percent difference in NSR for Mezaira (a) instrument 721 and (b) instrument 1026.
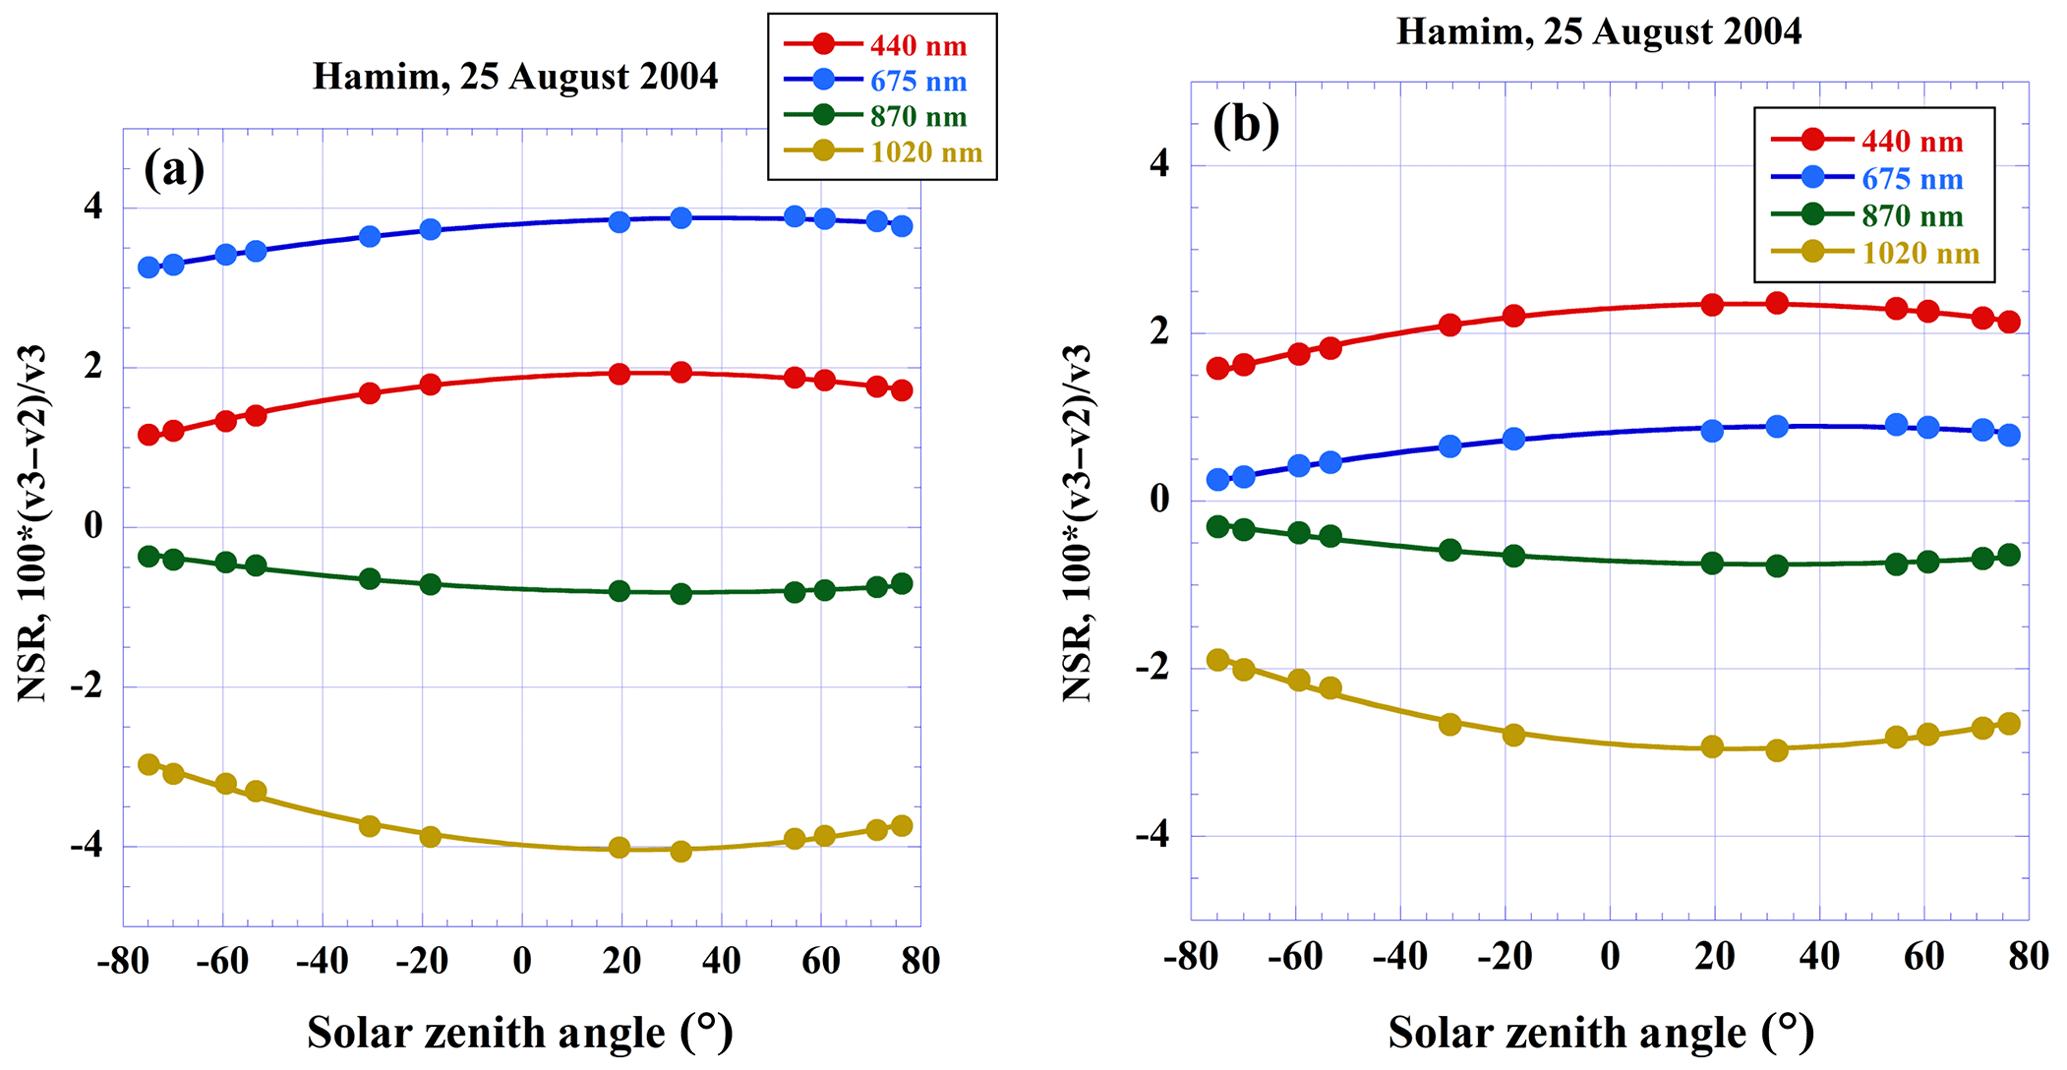
Figure 6Effect of solar flux and temperature correction on relative percent difference in normalized sky radiances for Hamim: (a) joint effect of temperature correction and solar flux; (b) the effect of solar flux is subtracted.
In analysis of the effect of the changes implemented in the V3 aerosol retrieval algorithm on SSA retrievals from almucantar scans, the following approach was used. It consists of generating three different input files for each set of measurements. The NSR and BRDF data of the first input file (1st) are identical to those of V2. The second input file (2nd) differs from the first one by replacing V2 NSRs with those of V3, and in the third input file (3rd) both NSR and BRDF parameters are replaced, utilizing only V3 inputs. These input files are then combined with SORD in different modes, scalar or vector, which allows for analysis of the effects of accounting for polarization on retrieval results. All the combinations are inverted, and retrieval results are compared to each other, allowing for analysis of sequential changes in retrieved SSA values as individual changes in input data take place. Figure 7a compares the diurnal variability of SSA retrieved by the V2 retrieval algorithm and that of V3 with the 1st file as an input and SORD in the scalar mode. The comparison shows a good agreement between two sets of retrievals, with a maximum difference of ∼0.0074 at SZA 19.5∘. The diurnal variability of SSA retrieved by Version 3, V3, is also shown.

Figure 7Data from Hamim (UAE) on 25 August 2004 showing (a) diurnal variability of SSA at 440 nm retrieved from almucantars by the V2 and V3 algorithms and algorithm of V3 in scalar mode using inputs of V2; (b) the relative percent difference between measured and fitted NSRs at 440 nm for three different SZAs.
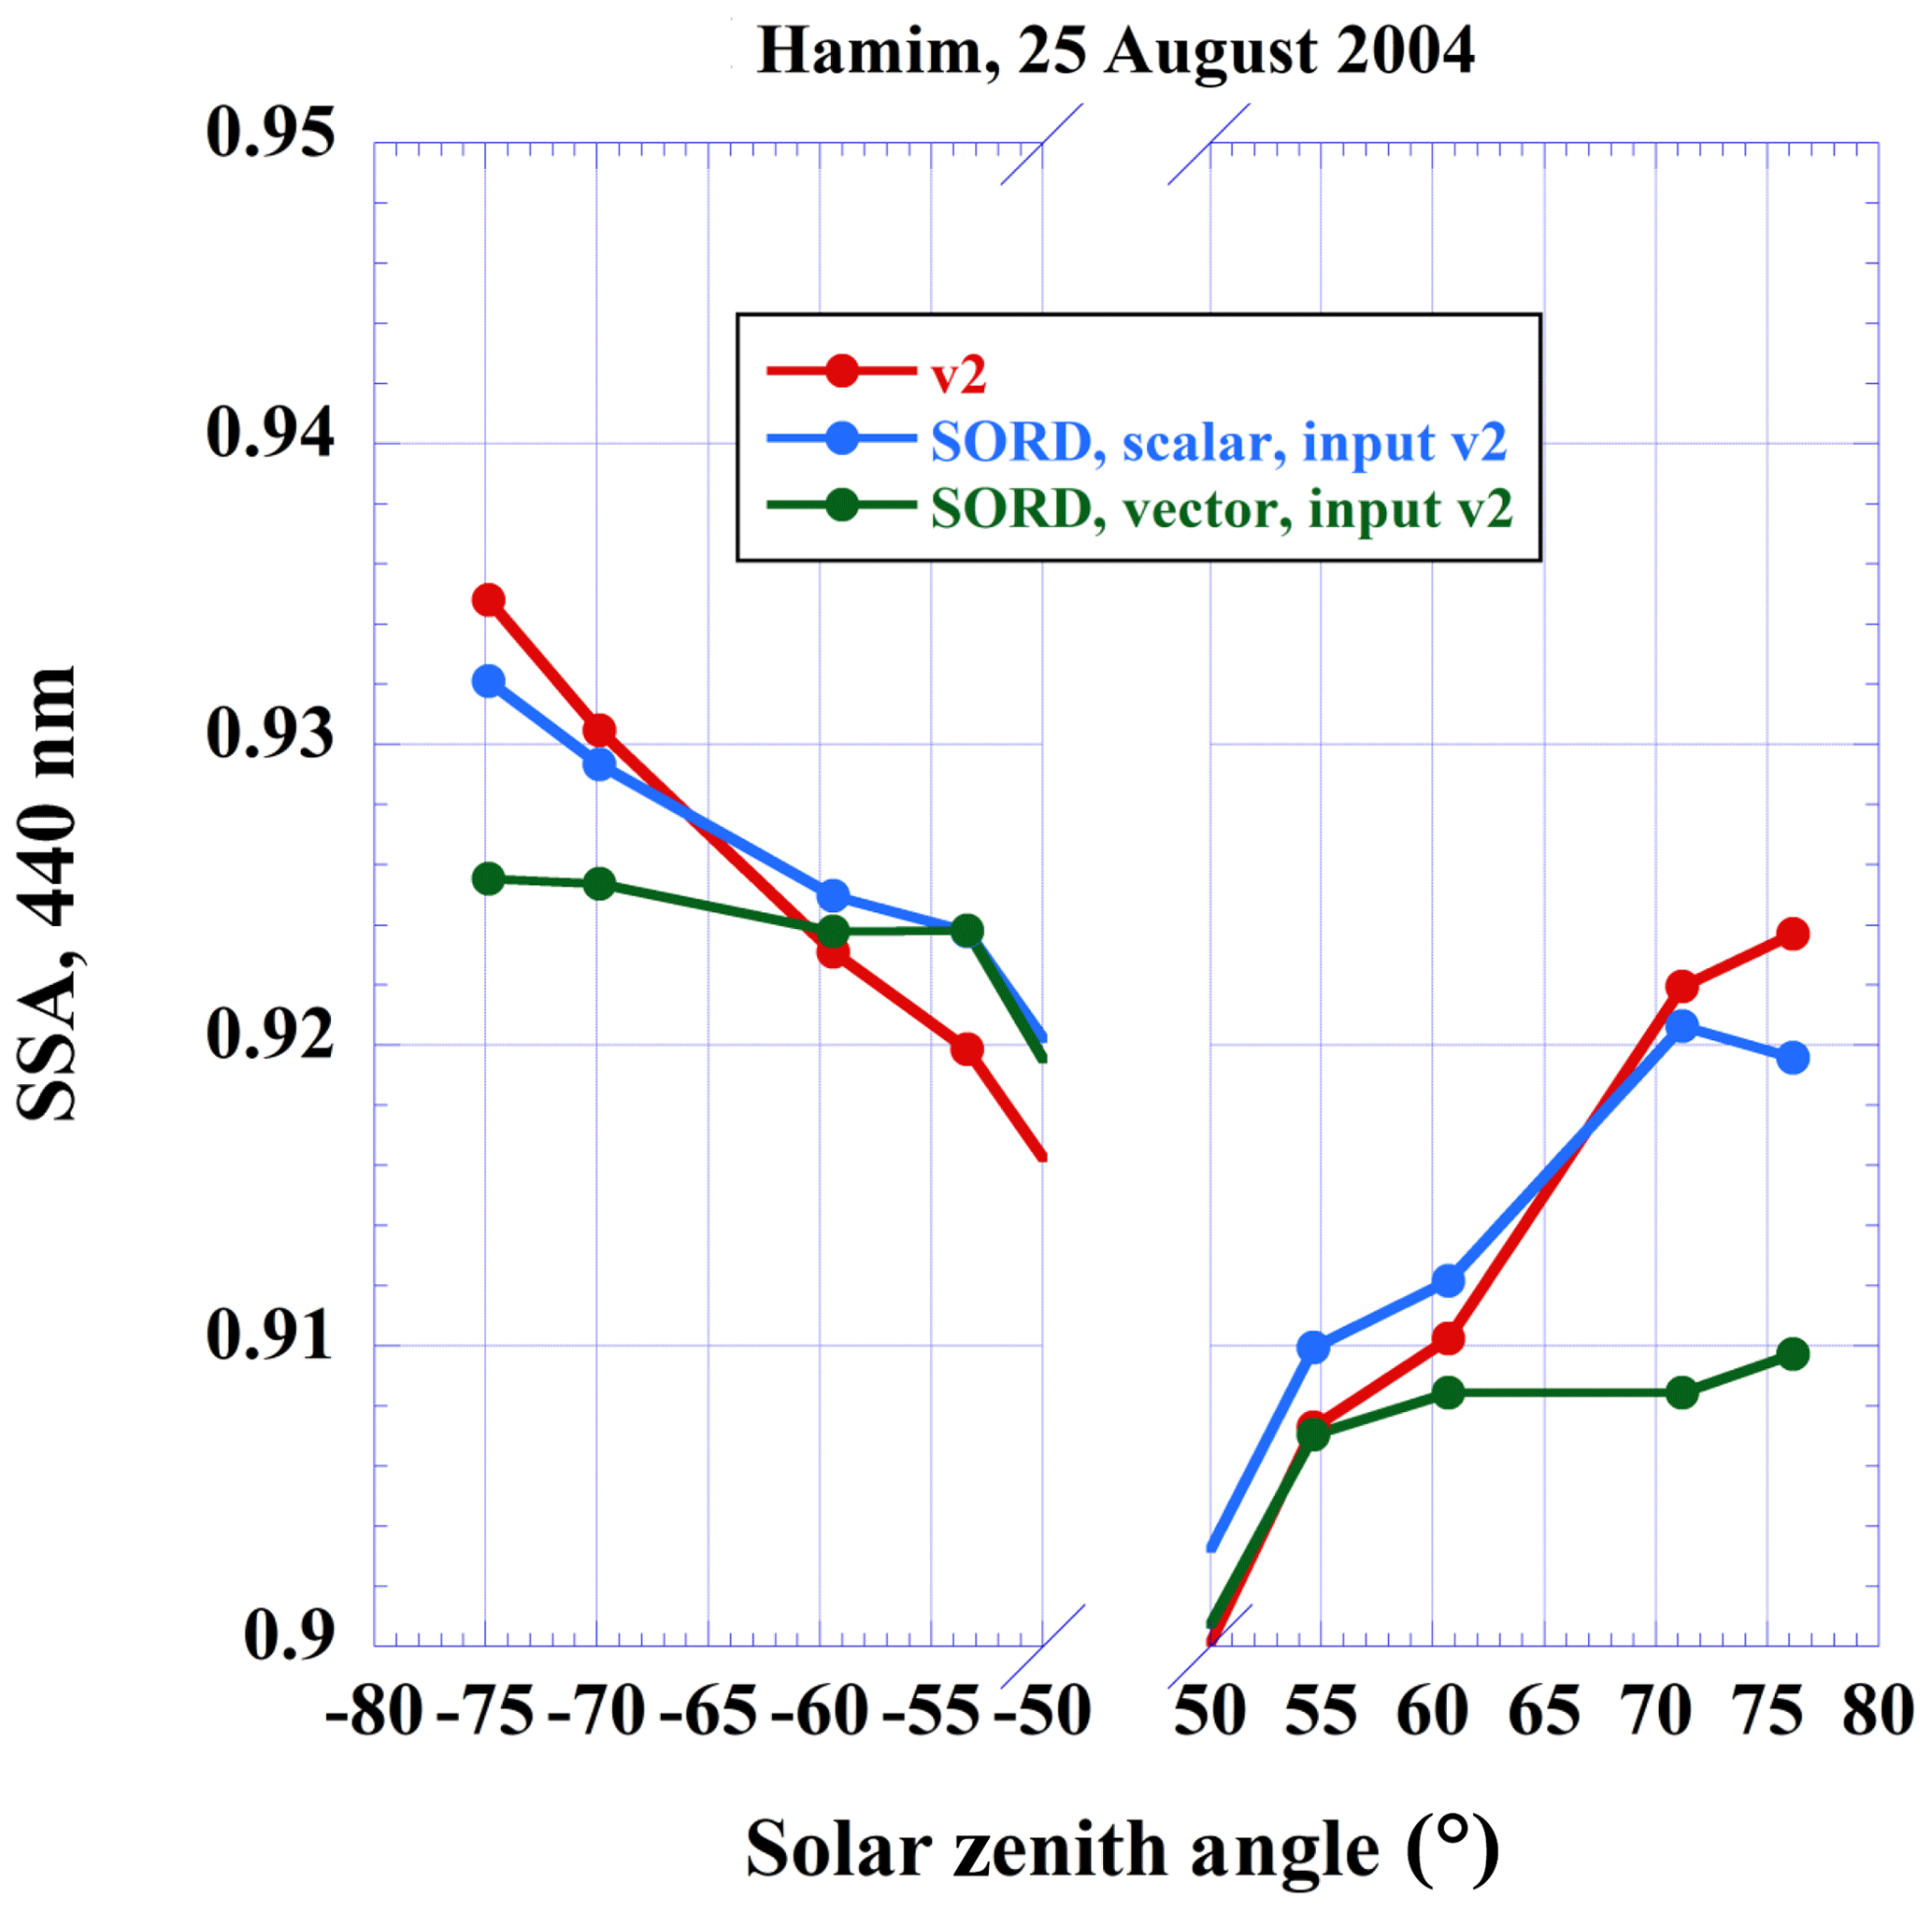
Figure 8Hamim on 25 August 2004. The diurnal variability of Level 2 SSA retrievals at 440 nm for three combinations of SORD and inversion inputs: V2 (red), SORD scalar mode (blue), and SORD vector mode using V2 inputs (green).
A distinct feature of Fig. 7a is a sharp decrease in the retrieved SSA for SZAs smaller than 50∘. This partially can be explained by the decrease in the range of the scattering angles as SZA decreases, in which case the solution becomes less stable with respect to both random noise and biases. However, the systematic decrease in retrieved SSA with SZA implies the presence of a bias which itself is SZA dependent. The recent analysis of Sinyuk et al. (2015) showed that this bias could be related to the accuracy of the model of randomly oriented spheroids at small scattering angles. This model was originally proposed by Mishchenko et al. (1997) for modeling of light scattering by non-spherical dust aerosols, was further developed in Dubovik et al. (2002, 2006) and is currently employed by the AERONET aerosol retrieval algorithm. The model has proven to be successful in interpreting the results of laboratory measurements of the light scattered by non-spherical aerosols in the backscattering direction (Dubovik et al., 2006). However, careful inspection of the fitting of the laboratory measurements by the model shows that it underestimates measured intensity at small scattering angles in the range centered at ∼70 (e.g., Lenoble et al., 2013, p. 49, Fig. 2.18, left upper panel). The influence of this bias on the accuracy of SSA retrievals depends on SZAs through the range of scattering angles, with the maximum scattering angle for almucantar geometry being double that of SZA. For large SZAs the effect of the bias is counterbalanced by the fit at the large scattering angles where the spheroidal model is accurate. In these cases, the bias is not or just partially fitted by the retrieval code and has little effect on the accuracy of SSA retrievals. However, with decreasing range of the scattering angles the contribution of the bias to the fitting of NSR increases, and with no measurements constraining the solution at larger scattering angles, it pushes the retrieved SSA lower. This reasoning is illustrated by Fig. 7b, which shows the relative difference between measured and fitted angular NSRs as a function of scattering angle for the three values of SZA. In particular, all curves exhibit a peak in the vicinity of ∼70 where the fit underestimates the measurements. The magnitude of the peak decreases with decreasing SZA, corresponding to a more accurate fit of the bias. Also, a decrease in fitting accuracy for the smallest SZA at larger scattering angles (> 50∘) can be seen.
Figure 8 shows the diurnal variability of SSA retrieved at 440 nm for SZAs greater than 50∘, a limit which is a key quality control for Level 2 almucantars (Dubovik et al., 2000; Holben et al., 2006). The results are presented for two different combinations of SORD and inversion inputs listed in the figure captions. As is seen from the figure, the SSA retrievals by both algorithms under the same conditions (scalar RTC) exhibit noticeable SZA dependence. Switching to the vector mode in the V3 retrieval code reduces the SZA dependence of SSA retrievals in both morning and afternoon. This can be explained by the higher accuracy of vector RTC in situations with substantial contribution of molecular scattering. In this particular Hamim case, the Rayleigh optical depth at 440 nm comprises ∼32 % of the total optical depth, which together with strong polarization of molecular scattering makes accurate accounting for polarization important.
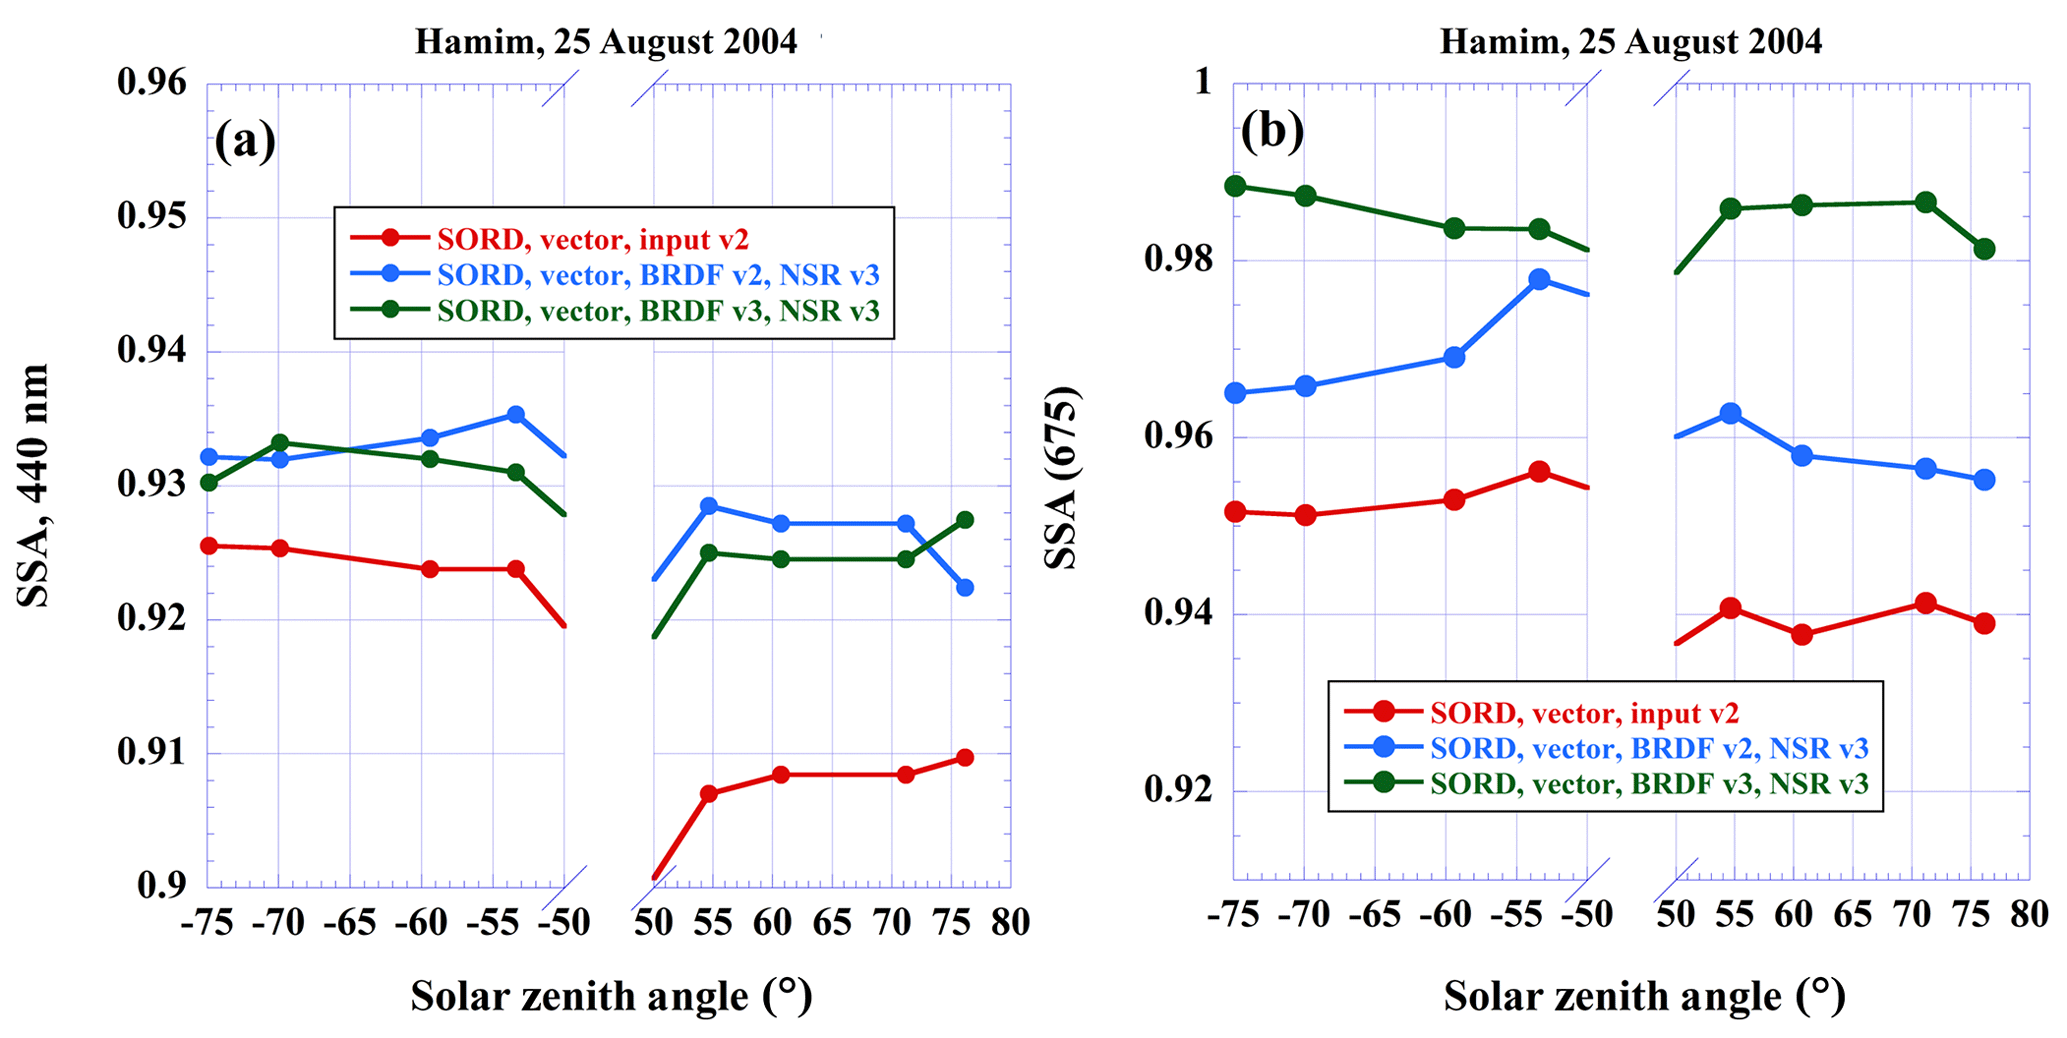
Figure 9Hamim on 25 August 2004. The diurnal variability of Level 2 SSA retrievals at 440 nm for three combinations of SORD and inversion inputs: V2 inputs (red), combined inputs with BRDF parameters of V2 and NSR of V3 (blue), and combined inputs with BRDF parameters of V3 and NSR of V3 (green) for (a) 440 nm and (b) 675 nm.
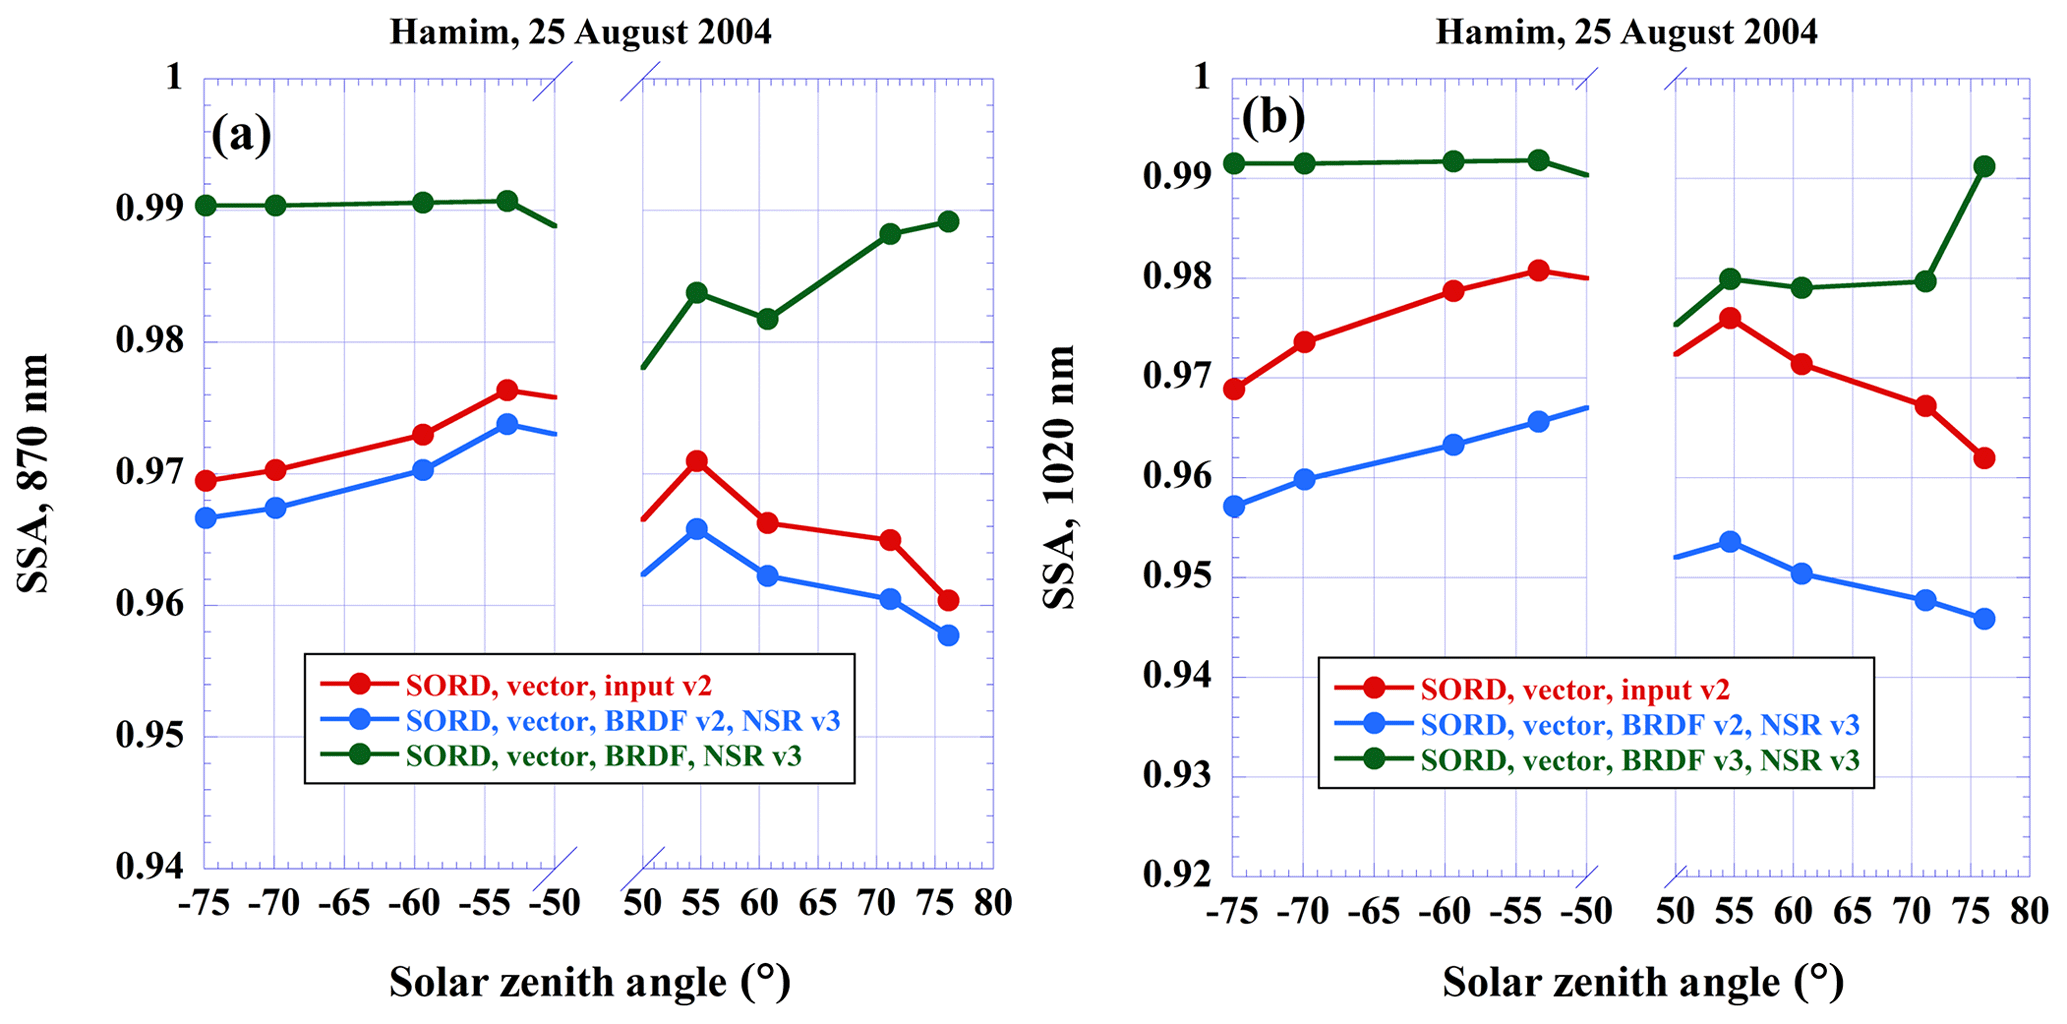
Figure 9 shows Level 2 SSA retrievals by the V3 aerosol retrieval algorithm with RTC in vector mode for the three different types of input files described in the figure captions. Figure 8 shows a near-constant offset in the values of retrieved SSA in the morning versus the afternoon, which averages ∼0.014 for 440 nm. One of the possible explanations for this difference is that the dust in the morning and the afternoon was transported to Hamim from different regions. This assumption is supported by the analysis of GSFC back trajectories for the Hamim site (https://aeronet.gsfc.nasa.gov/cgi-bin/bamgomas_interactive, last access: 8 June 2020), which shows different back trajectories in the afternoon versus morning. Figure 9a shows that the contribution from the changes in NSRs dominates that of BRDFs for 440 nm SSA retrievals, while according to Fig. 9b, the contributions from changes in NSR and BRDF at 675 nm are comparable. This is consistent with the results in Figs. 2, 4 and 6, which show that the changes in the temperature correction dominate the 440 nm NSR, while the 675 nm NSRs are mostly affected by the changes in solar flux and BRDF. For SSA retrievals at 870 nm the contribution of the changes in BRDF is dominant, as shown in Fig. 10a, versus comparatively smaller effects for both solar flux and temperature correction. The SSA retrievals at 1020 nm, shown in Fig. 10b, are affected primarily by the changes in temperature correction and BRDF, acting significantly however in opposite directions.
Figure 10 shows higher variability of SSA retrievals with SZA in the afternoon than in the morning for the inversions employing both NSR and BRDF of V3. In particular, retrieved SSA values in the near-infrared wavelengths in the morning are all close to 0.99, which is close to the theoretical limit for SSA of 1.0. This can be explained by low dust absorption at longer wavelengths (Dubovik et al., 2002) and constraints on the variability of retrieved parameters employed in the AERONET inversion algorithm (Dubovik and King, 2000). These constraints are based on a priori assumed ranges of variability of aerosol parameters and impose limits on the values of retrieved parameters. Theoretically, the highest retrieved SSA value is limited by 1, but because SSA is not retrieved directly (Dubovik and King, 2000), the limits on SSA retrievals are imposed through the constraints on the imaginary part of the refractive index (IRI). For low-absorbing aerosols the actual IRI values are very small, and therefore even a small bias in simulated NSRs can cause the retrieval values to hit the assumed limit. In the morning, the IRI retrievals assume the AERONET-constrained lower limit value of 0.0005, in which case the corresponding SSA retrievals are concentrated around 0.99. In the afternoon, the lower IRI limit is not reached due to the higher aerosol absorption.
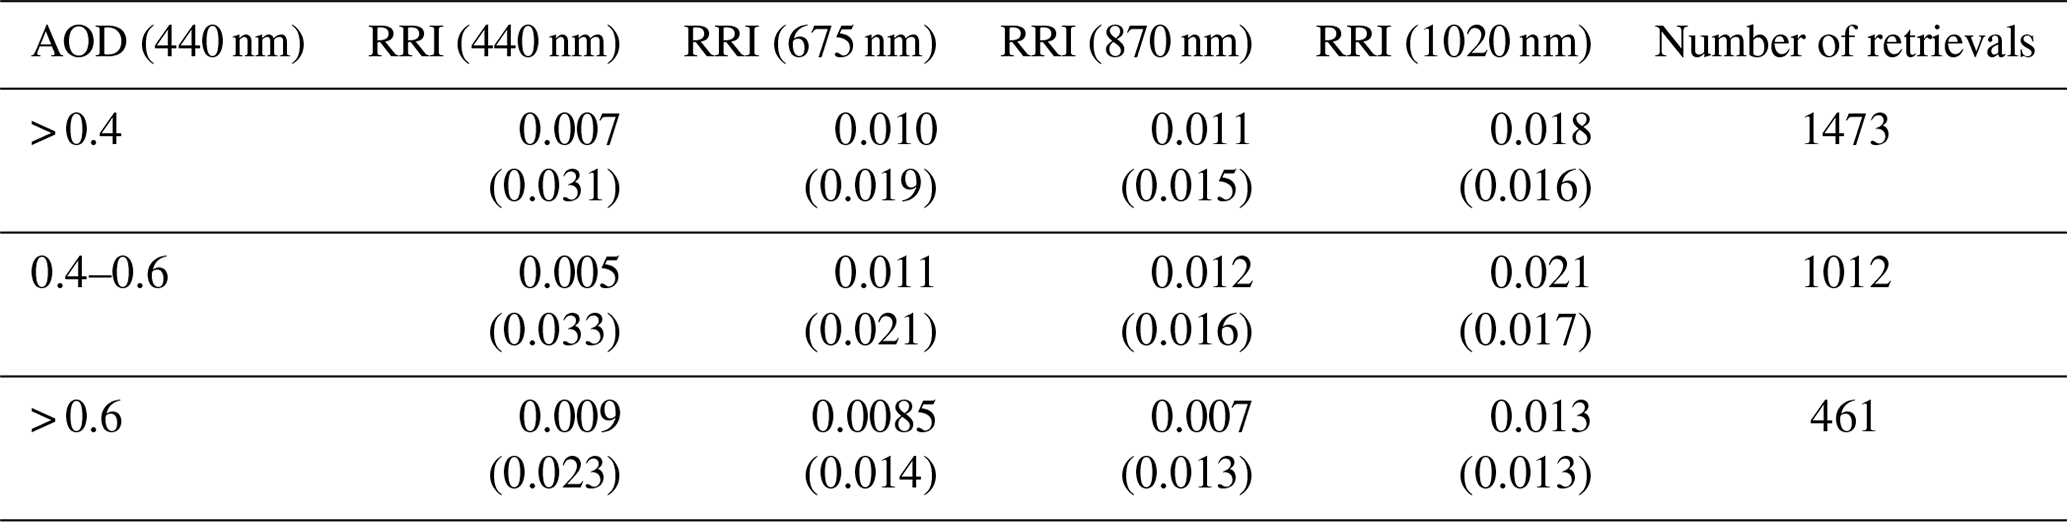
Table 1Statistics, average values and standard deviations (in parentheses) of the difference in SSA retrievals from almucantar scans of V2 and V3 for the Mezaira site. The difference is defined as V3−V2.

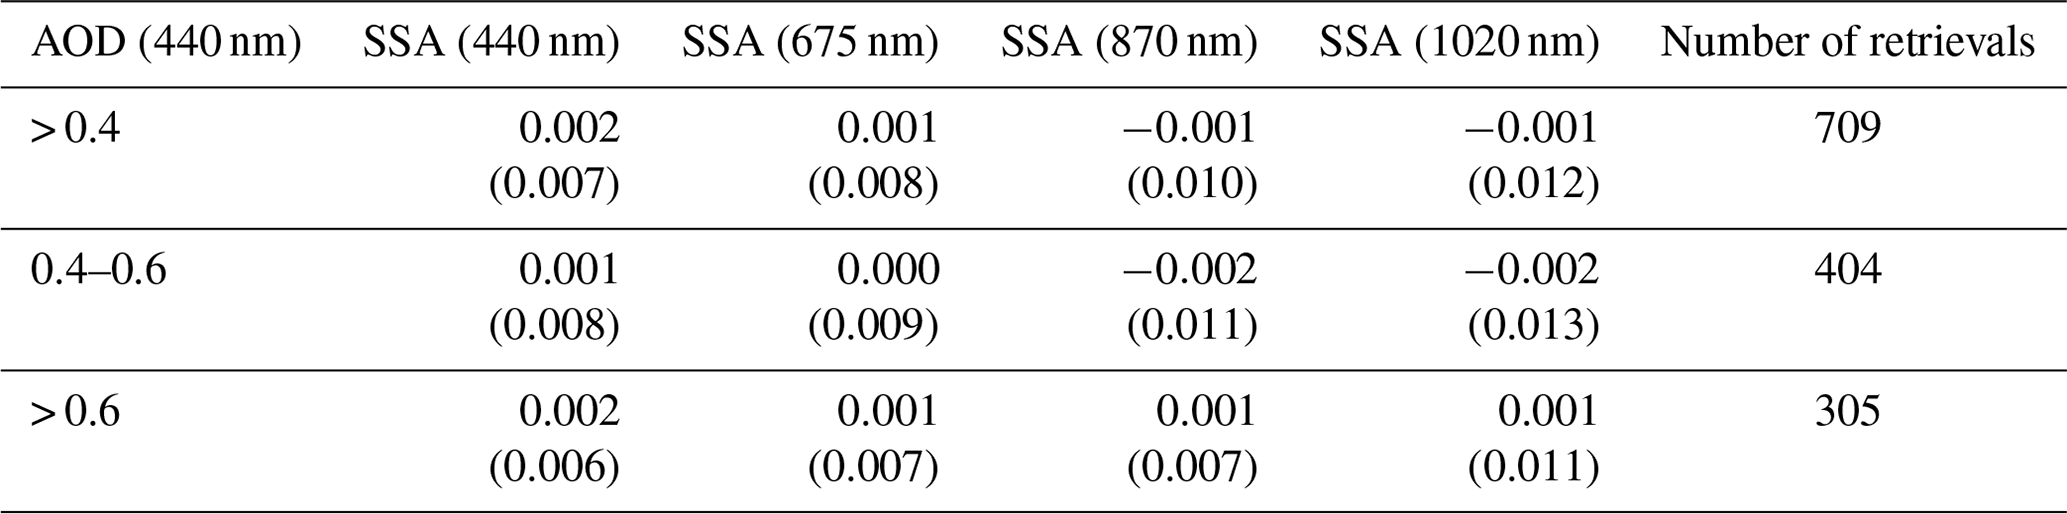
Table 2Statistics, average values and standard deviations (in parentheses) of the difference in the real part of refractive index (RRI) retrievals of V2 and V3 for the Mezaira site. The difference is defined as V3−V2.
3.4 Comparison of aerosol parameters retrieved by V2 and V3 retrieval algorithms
This comparison of operational almucantar retrievals of V2 versus V3 is presented for four selected AERONET sites (Mezaira, GSFC, Mongu, and Kanpur), and the results are summarized in Tables 1 through 12. For SSA and the real part of the refractive index, the analysis is done for three bins of 440 nm AOD, which allows for extension of the analysis of the inversion comparisons to different levels of sensitivity relative to the combined effects of measurement noise and modeling biases. For the size distribution parameters two AOD bins (smaller and greater than 0.2 at 440 nm) are used due to the significantly higher stability and accuracy of the aerosol size distribution retrievals (Dubovik et al., 2000, 2002). The tables display statistics (mean value and standard deviation) of the difference between aerosol parameters retrieved by the V2 and V3 retrieval algorithms.
For Mezaira, the SSA 440 nm retrievals by V2 and V3 are not biased with respect to each other. However, SSAs retrieved by V3 are systematically higher than those of V2 at longer wavelengths, with the mean difference at 675 nm being the largest due to cumulative effects of both solar flux and BRDF changes. Also, the mean differences are smaller for bins corresponding to larger AOD. The mean difference of the retrievals of the real part of the refractive index shows similar patterns at 440 and 675 nm but further increases, reaching a maximum at 1020 nm. The agreement in size distribution parameters for both modes is reasonable bearing in mind the mean climatological values for VMR (volume median radius) and STD (standard deviation, in parentheses) for the Mezaira site, which are 0.15 µm (0.5) for the fine mode and 2.3 µm (0.62) for the coarse mode, respectively. This translates into an average relative difference of only ∼0.1 % for VMRC and ∼1.5 % for STDC for AOD smaller than 0.2 and into ∼0.8 % and ∼0.5 % for greater AOD. The corresponding numbers for the fine mode are also small: 5.4 % and 0.5 % for a smaller AOD bin and 4.9 % and 0.05 % for AOD larger than 0.2.
Table 3Statistics, average values and standard deviations (in parentheses) of the difference in volume median radius (VMR) in microns and width of particle size distribution (STD) retrievals of V2 and V3 and for the Mezaira site for almucantar retrievals with AOD (440) > 0.2. The difference is defined as V3−V2.
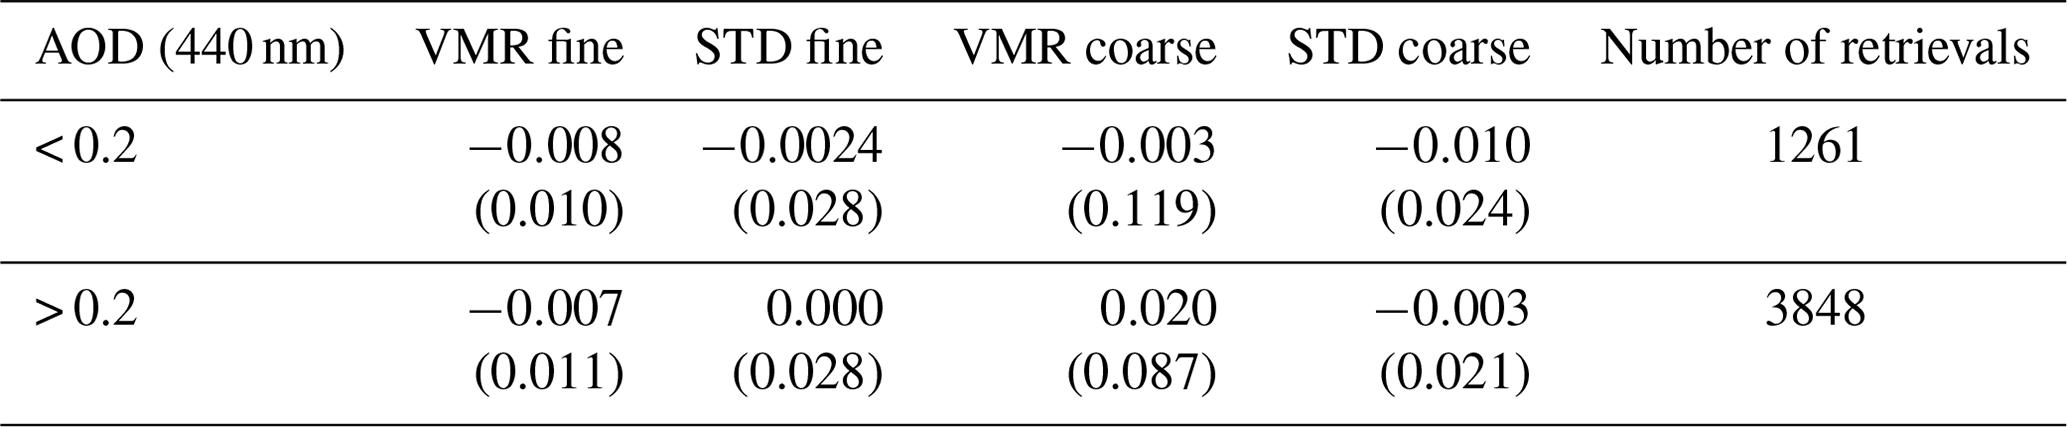
Table 4Statistics, average values and standard deviations (in parentheses) of the difference in SSA retrievals of V2 and V3 for the GSFC site. The difference is defined as V3−V2.
For the GSFC, Mongu and Kanpur sites the mean differences between V2 and V3 in SSA retrievals at the two longer wavelengths are much smaller than those for Mezaira due to smaller BRDF differences. However, the effect of the solar flux on SSA 675 nm retrievals is much weaker for GSFC than that for Mongu and Kanpur, which is explained by the difference in the magnitude of aerosol absorption. To gain a better understanding of the influence of the aerosol absorption on the uncertainty in retrieved SSA, Eq. (10) of Dubovik et al. (2000) can be used. Below this formula is rewritten to make the dependence on SSA explicit:
where ω0 is SSA, τext and τsca are extinction and scattering optical depth, respectively, and Δτsca and Δτext are their uncertainties. Both uncertainties are always present: Δτext is due to the accuracy of the AOD measurements and Δτsca may result from the modeling bias. For example, the changes in the magnitude of sky radiances due to the adjustment in solar flux value will be interpreted by the inversion algorithm as a change in scattering optical depth. Equation (1) shows that the contribution of the Δτsca to the SSA uncertainty depends on aerosol absorption: the smaller the aerosol absorption (larger ω0), the smaller the Δτsca contribution and vice versa. Figure 11 shows the results of simulation of the SSA uncertainty using Eq. (1) for the different levels of aerosol absorption (SSAs of 0.99, 0.96, and 0.86) and gives a qualitative picture of the dependence of SSA uncertainty on aerosol absorption.
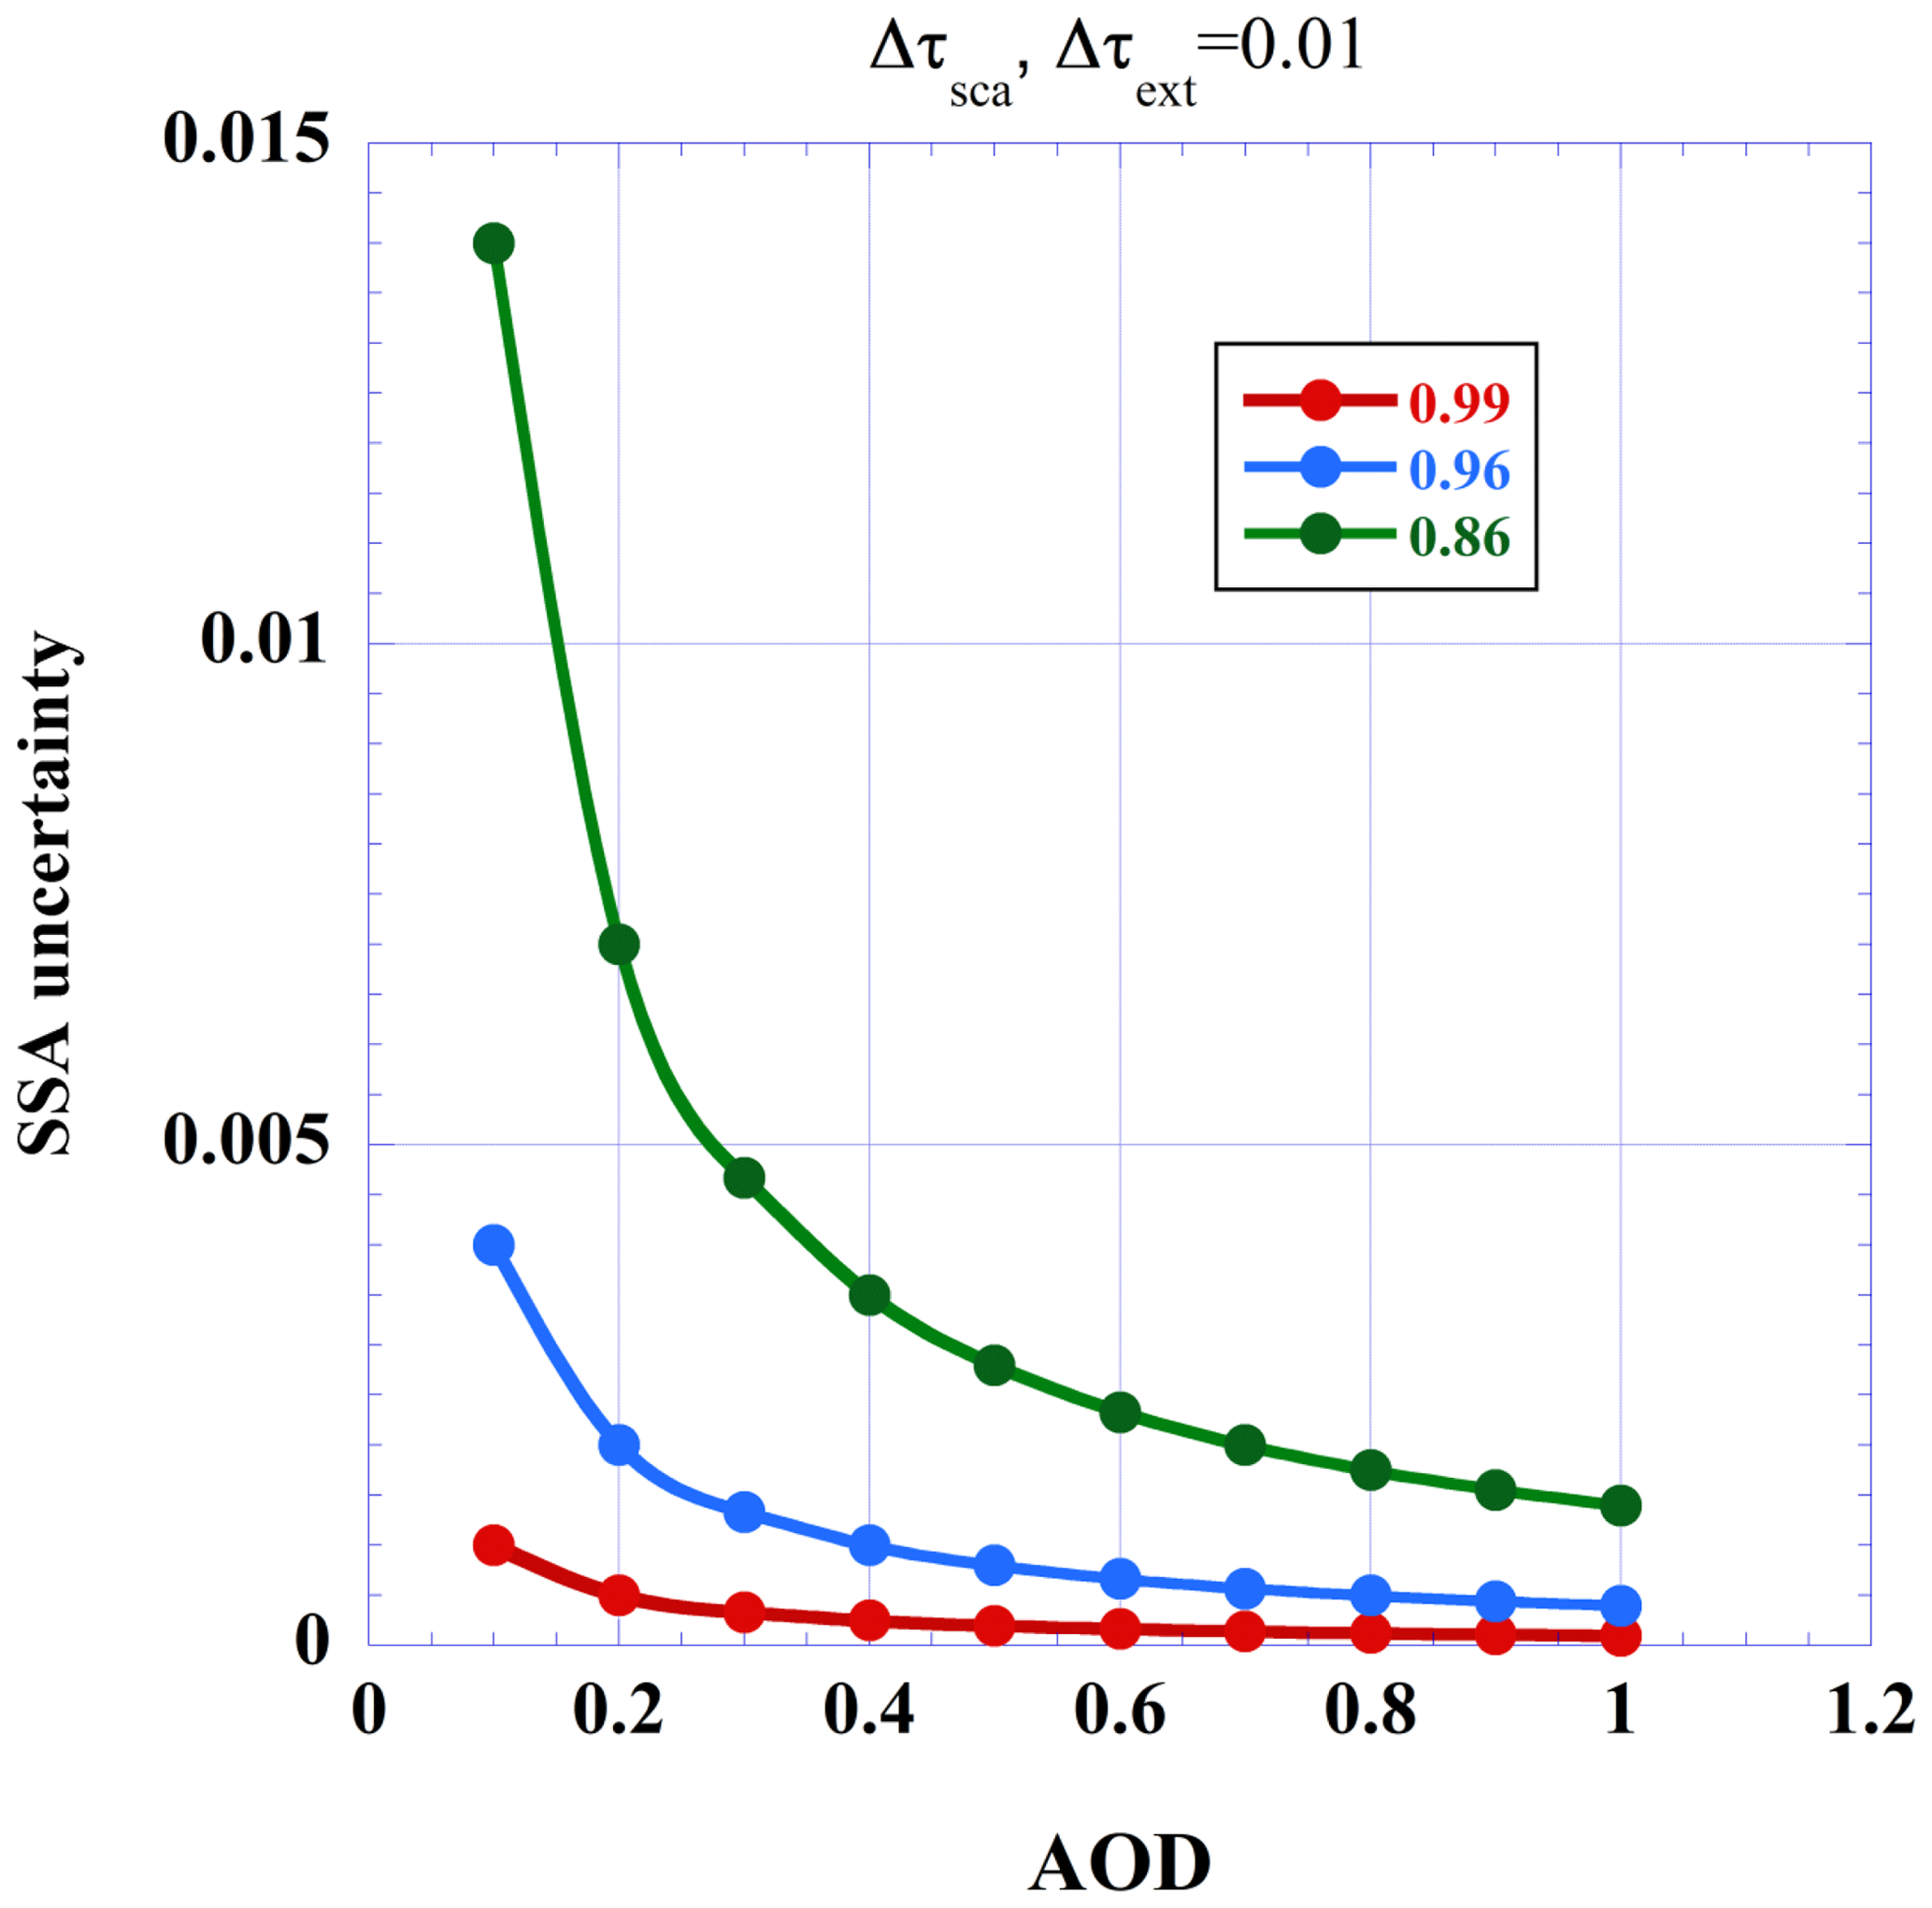
Figure 11The uncertainty in SSA simulated using Eq. (1) for the three values of SSA: 0.99 (red), 0.96 (blue) and 0.86 (green).
The parameters of size distribution retrieved by V2 and V3 are in good agreement for all three sites, which can be seen from the comparison V3−V2 mean differences to the following mean climatological values of VMR and STD (in parentheses) from all almucantar retrievals at each site: 0.166 (0.456) and 2.921 µm (0.672) for GSFC fine and coarse modes, respectively, 0.146 (0.420) and 3.432 µm (0.655) for Mongu, and 0.172 (0.486) and 2.85 µm (0.626) for Kanpur. The comparison gives the following average relative differences for VMR and STD (in parentheses) for the smaller AOD bin: 0.9 % (4 %) and 0.9 % (1.9 %) for GSFC fine and coarse modes, respectively, 5.4 % (4.2 %) and 3.7 % (0.8 %) for Mongu, and 0.4 % (4 %) and 3.3 % (0.65 %) for Kanpur. For AOD greater than 0.2, the corresponding differences are the following: 3.7 % (0.2 %) and 2.1 % (1.3 %) for GSFC, 0.9 % (0.5 %) and 3.8 % (1.7 %) for Mongu, and 0.9 % (1.5 %) and 4.7 % (2.6 %) for Kanpur.
The mean difference in the retrieved real part of the refractive index is almost spectrally constant for the Mongu site and decreases with increasing wavelength for GSFC and Kanpur. However, in all three cases, the standard deviations of the retrieval differences are significantly smaller than the ranges of operational almucantar retrieval variability for cases when AOD (440) > 0.4 in both V2 and V3.
Table 5Statistics, average values and standard deviations (in parentheses) of the difference in the RRI retrievals of V2 and V3 for the GSFC site. The difference is defined as V3−V2.
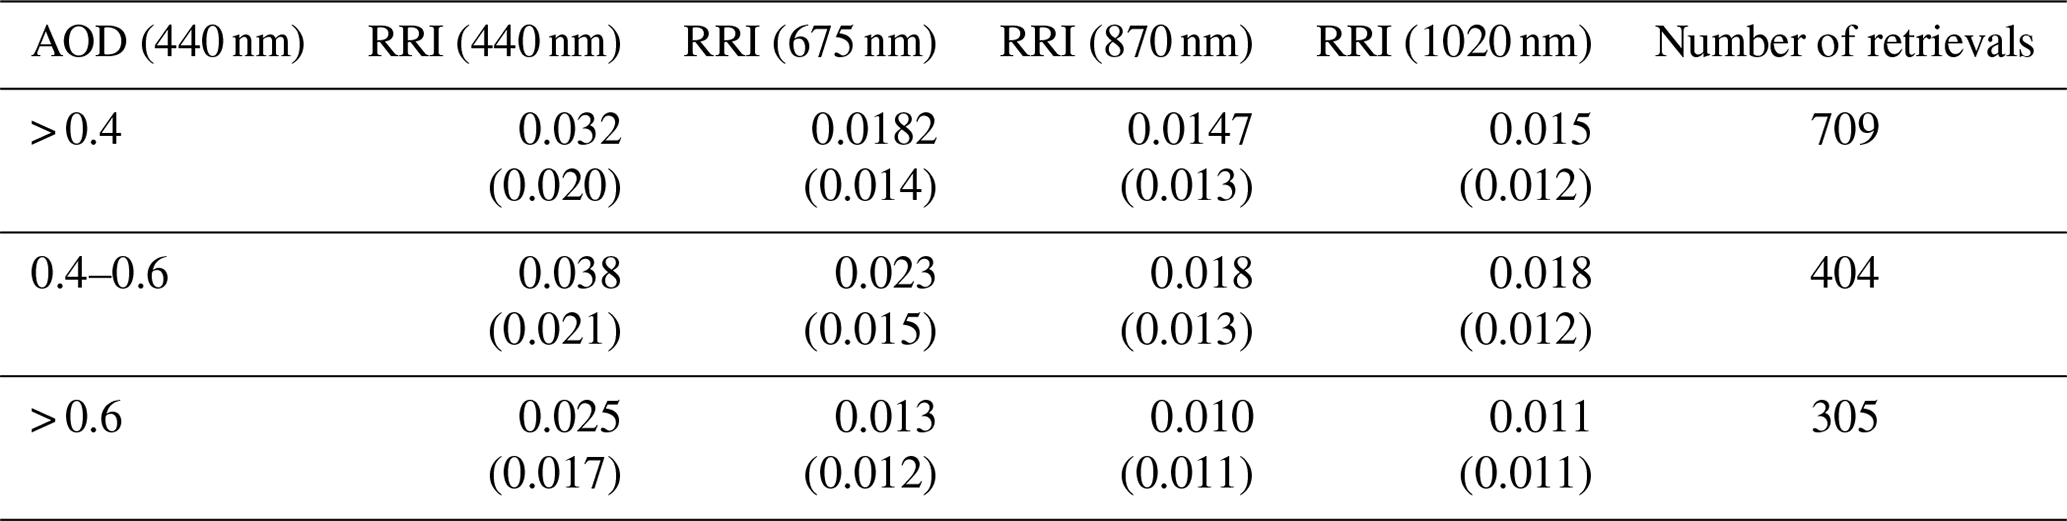
Table 6Statistics, average values and standard deviations (in parentheses) of the difference in volume median radius (VMR) and width of particle size distribution (STD) retrievals of V2 and V3 for the GSFC site. The difference is defined as V3−V2.

As discussed in Sect. 2, the reduction in the range of scattering angles of measured sky radiances affects the accuracy of SSA retrievals, making them less stable in the presence of random noise, instrumental offsets, and modeling biases. Before V3, the two scan geometries utilized by CIMEL instruments were ALM and solar PP (Holben et al., 1998). The ALM scan is performed at a fixed view zenith angle equal to the SZA with a varying azimuth angle ranging from ±3.50 to ±1800, including sweeps in both directions from the Sun position. The symmetry between these two ALM sides is used for the quality control of sky radiance measurements to screen out cloud cover and very inhomogeneous aerosol cases (thick plumes). The maximum acceptable difference between the corresponding equal-angle almucantar scan measurement pairs is 20 % (Holben et al., 1998); measurements that exceed this threshold are eliminated. The range of scattering angles for ALM geometry is a function of the SZA, and it is twice the value of the SZA, thus making retrievals at small SZAs less reliable and/or biased (see Fig. 7a). Level 2 criteria for SSA retrievals require SZAs to be larger than or equal to 50∘, thus making utilization of ALM retrievals for satellite product validation problematic at many latitudes and seasons (especially summer) due to the relative closeness of satellite overpass time to local noon. In the PP scan geometry, the measurements are taken in the solar principal plane (Sun azimuth position), with the view zenith angle changing and the range of scattering angles equal to the sum of the SZA and maximum view zenith angle, which is set to 75∘, corresponding to a 15∘ elevation angle. Thus, the PP scan geometry has an advantage over that of ALM for small SZA observations due to the larger range of scattering angles measured. However, due to the lack of the PP scan symmetry, the quality assurance, primarily cloud screening, of measured sky radiances becomes a problem. For new CIMEL Model-T instruments this principal plane scan is turned off in favor of the newly designed hybrid (HYB) scan. Note that only the newer Model-T instruments can perform the HYB scan due to the requirement of greater instrument controller processing capacity to compute the complete set of angles and perform this scan. Descriptions of this model are provided on the AERONET website: https://aeronet.gsfc.nasa.gov/new_web/system_descriptions_instrument.html (last access: 8 June 2020).
Table 7Statistics, average values and standard deviations (in parentheses) of the difference in SSA retrievals of V2 and V3 for the Mongu site. The difference is defined as V3−V2.

Table 8Statistics, average values and standard deviations (in parentheses) of the difference in the RRI retrievals of V2 and V3 for the Mongu site. The difference is defined as V3−V2.

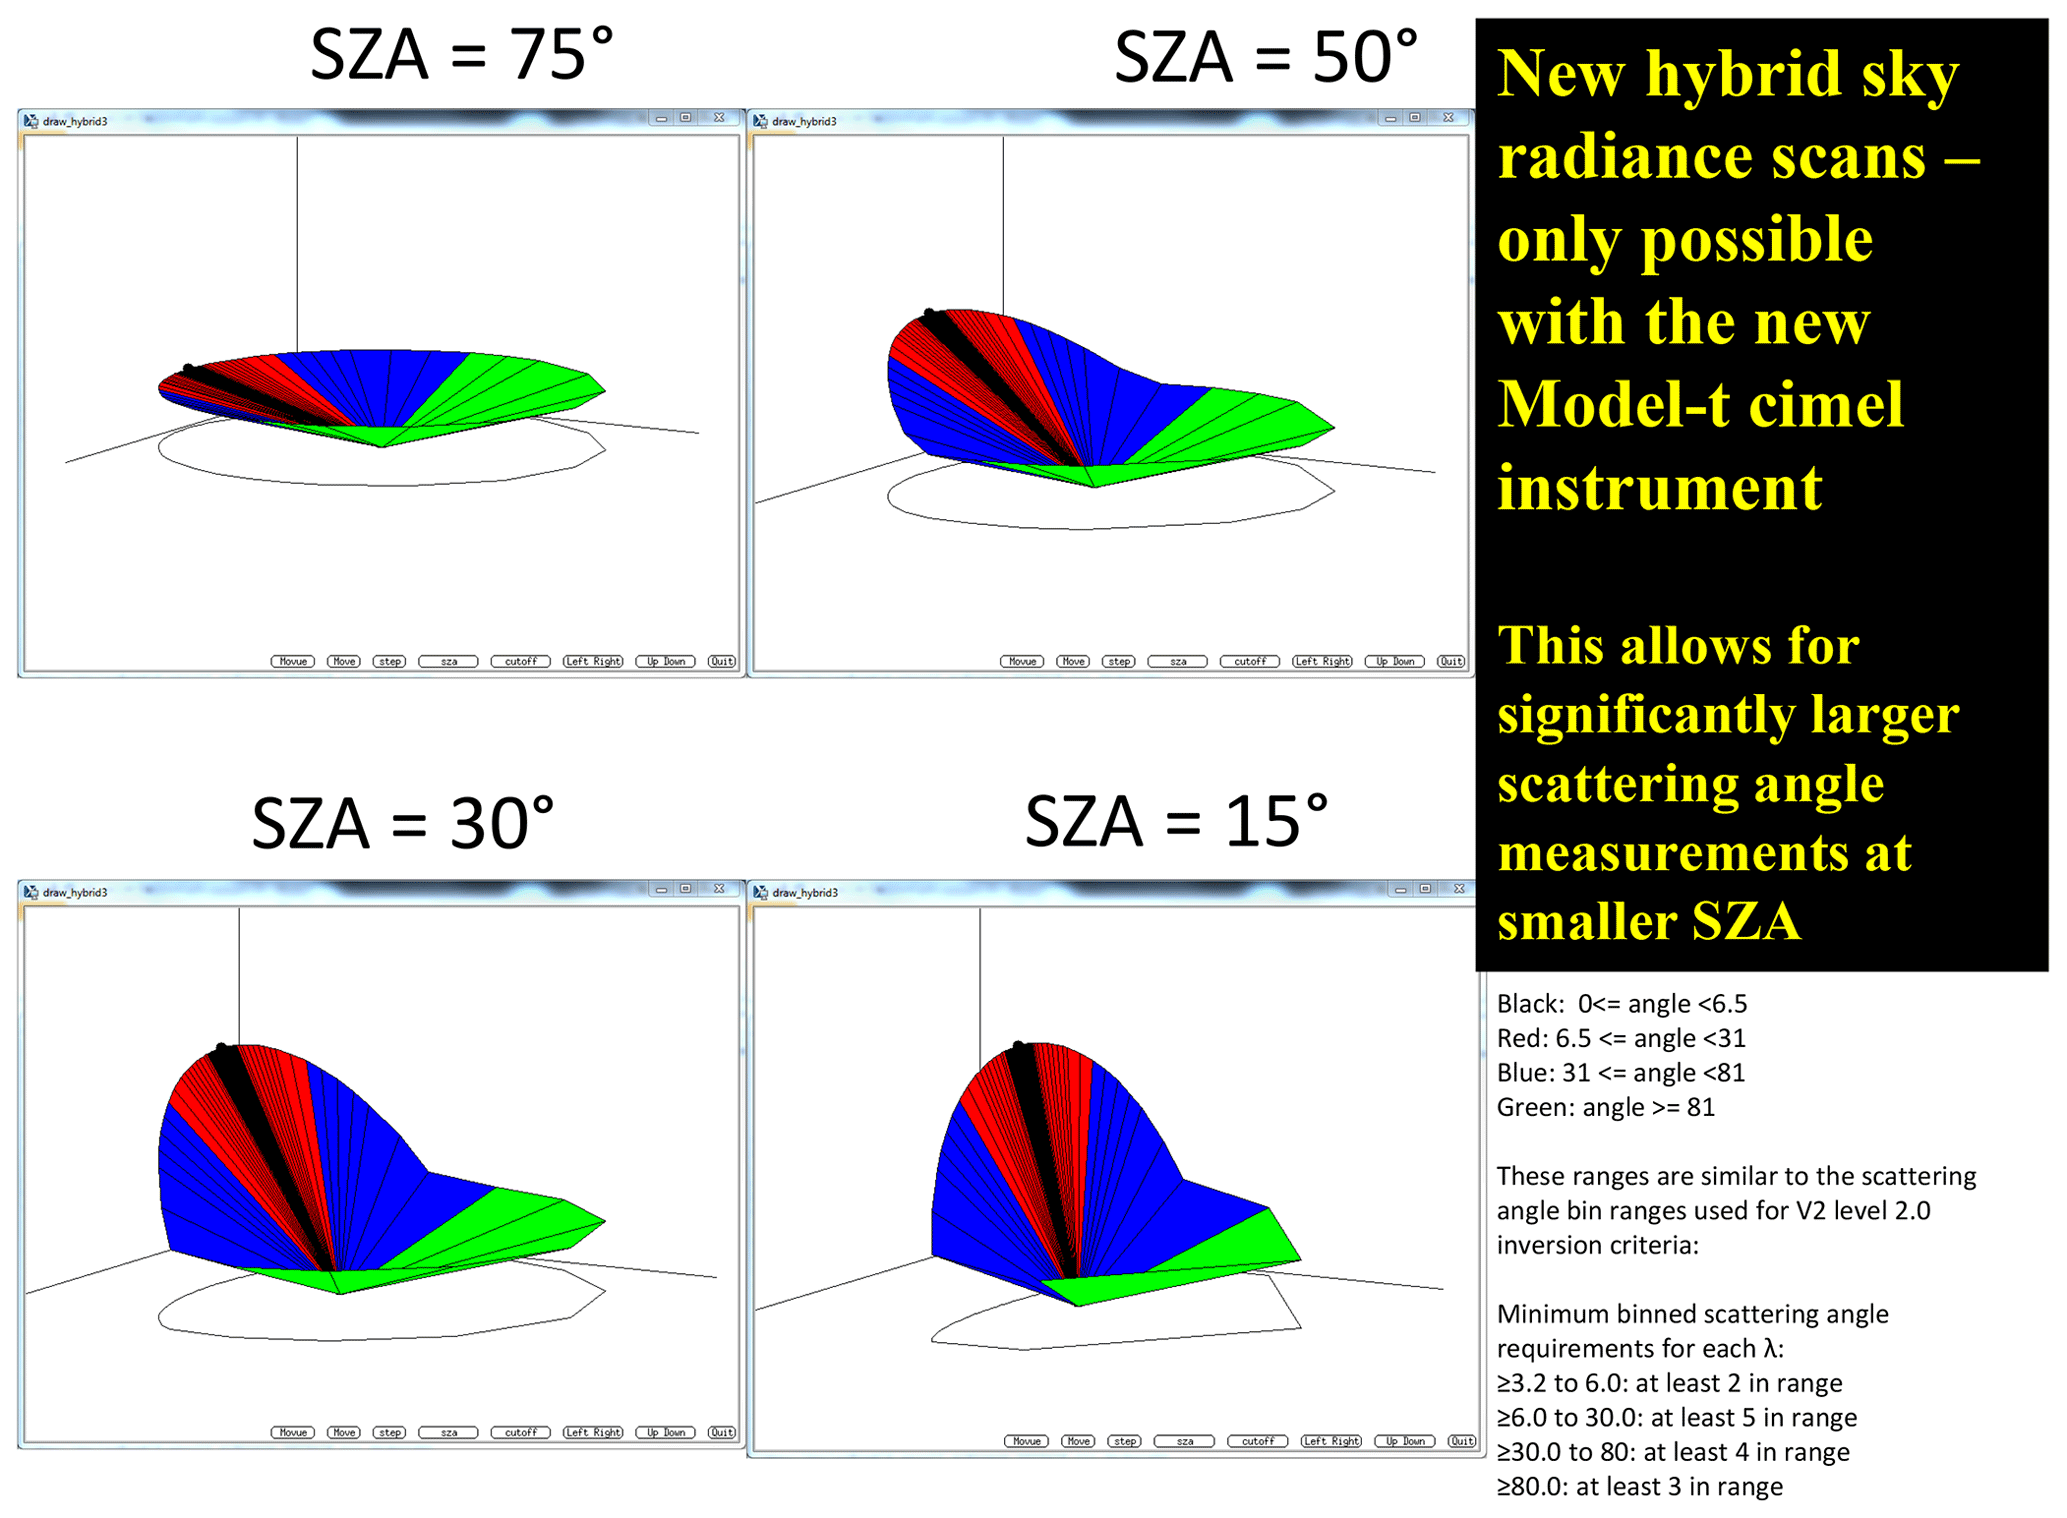
The HYB scan has the same range of scattering angles as the PP scan and yet also possesses the ALM scan symmetry as depicted in Fig. 12. The HYB scan begins from the Sun and then proceeds in steps in such a way that the scattering angle monotonically increases at each step, which requires simultaneous adjustments of both view and azimuth angles. After reaching the elevation angle of 15∘ the scan further proceeds at a fixed view angle by varying the azimuth angle similarly to that of an ALM scan except that the view angle is not equal to the SZA. The combination of two scans in two different planes allows one to maximize the range of scattering angles, similarly to in the PP geometry. The scattering angle range of the HYB scan is equal to 75∘ plus the SZA. Therefore, for a HYB scan made at 25∘ SZA the scattering angle range of measurements is 100∘, which is the same scattering angle range that the ALM scan is capable of at 50∘ SZA. The extension of the SZA range in HYB scan geometry results in a substantial increase in the number of inversions, e.g., Mezaira (∼61 %) and Kanpur (∼57 %). The increase was estimated as the ratio of the number of inversions for SZA less than 50∘ to that for larger SZAs. Table 13 shows the detailed geometry of the HYB scan for three SZA values: 30, 60, and 75∘.
The information on the AERONET sites equipped with Model-T Sun photometers can be found on the AERONET website, which provides an option to choose between ALM and HYB scan scenarios (https://aeronet.gsfc.nasa.gov/cgi-bin/draw_map_display_inv_v3, last access: 8 June 2020).
Table 9Statistics, average values and standard deviations (in parentheses) of the difference in volume median radius (VMR) and width of particle size distribution (STD) retrievals of V2 and V3 for the Mongu site. The difference is defined as V3−V2.
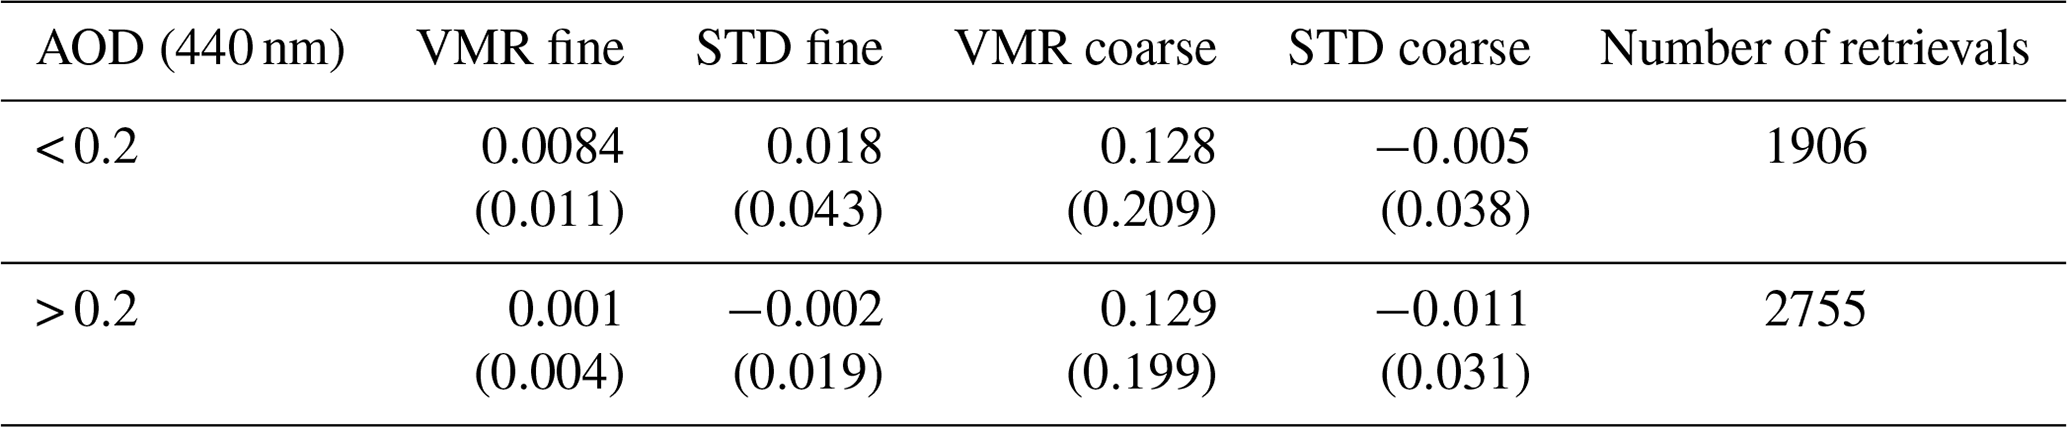
Table 10Statistics, average values and standard deviations (in parentheses) of the difference in SSA retrievals of V2 and V3 for the Kanpur site. The difference is defined as V3−V2.
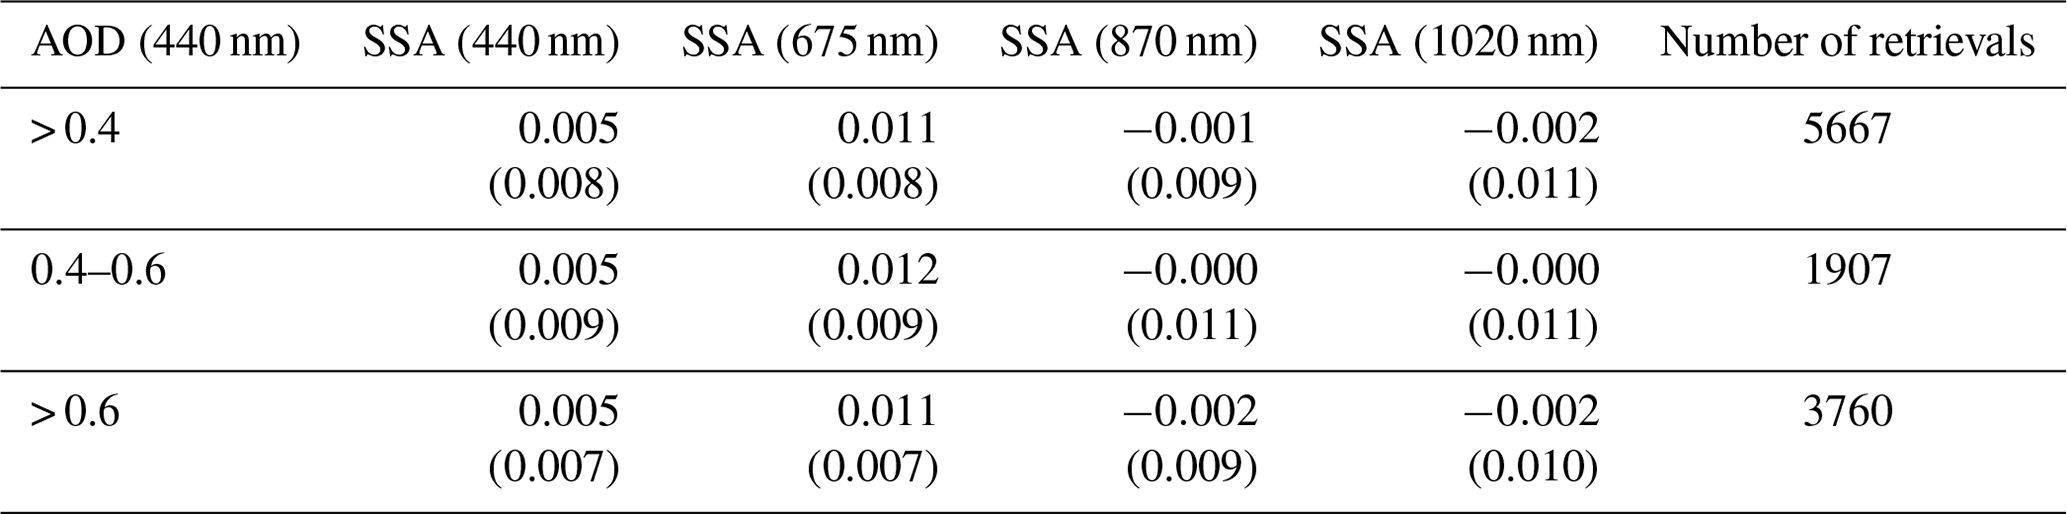

Figure 13Dependence of 440 nm SSA hybrid scan retrievals on SZA for three AERONET sites: (a) Mezaira, (b) Mongu Inn, (c) Kanpur.
4.1 HYB scan extension of SSA retrievals to smaller SZAs
Due to the increased range of scattering angles for the HYB geometry, the corresponding SSA retrievals are expected to exhibit less SZA variability than those of ALM, and to a much lower SZA. To test this assumption, the dependences of SSA retrieved from HYB scans on SZA were generated for three AERONET sites by aggregating retrievals in five SZA bins (each bin is 10∘ wide, centered at 30, 40, 50, 60 and 70∘ SZA) and calculating the mean value and the standard deviation for each bin. Figure 13 shows the dependencies of 440 nm SSA retrievals on SZA for the Mezaira, Mongu Inn, and Kanpur sites. These sites have the longest record of HYB-type observations starting from the fall of 2014. Figure 13a shows the mean SSA values for SZA 50∘ and larger are nearly constant but decrease by ∼0.007 for smaller SZAs. The magnitude of the decrease, however, is much smaller than that observed in the Hamim case study from almucantar retrievals where SSA drops by ∼0.045 between 50 and 30∘ (see Fig. 7a). Figure 13c shows a similar SZA dependence for Kanpur, with a mean SSA variability of ∼0.003 for SZAs larger than 40∘ and a decrease by ∼0.015 between the 30 and 40∘ angular bins. As was discussed in the analysis of the Hamim almucantar inversions, the reason for the decrease in retrieved SSA with decreasing SZA can be attributed to the bias in the modeling of light scattering by non-spherical dust aerosols when the scattering angle range is limited, which therefore can be expected to influence SSA retrievals at dust-dominated locations and smaller SZAs. In this regard, both the Mezaira and Kanpur sites are affected by dust aerosols: Mezaira is a desert site dominated by coarse-mode dust and Kanpur has a significant seasonal dust presence. The aerosol loading at Mongu Inn, on the other hand, is dominated by spherical fine-mode aerosols from seasonal biomass burning, and therefore no SZA-dependent bias in SSA retrievals is expected. This is illustrated in Fig. 13b, which shows that for Mongu Inn, the SSA does not exhibit any significant SZA dependence.
Table 11Statistics, average values and standard deviations (in parentheses) of the difference in the RRI retrievals of V2 and V3 for the Kanpur site. The difference is defined as V3−V2.
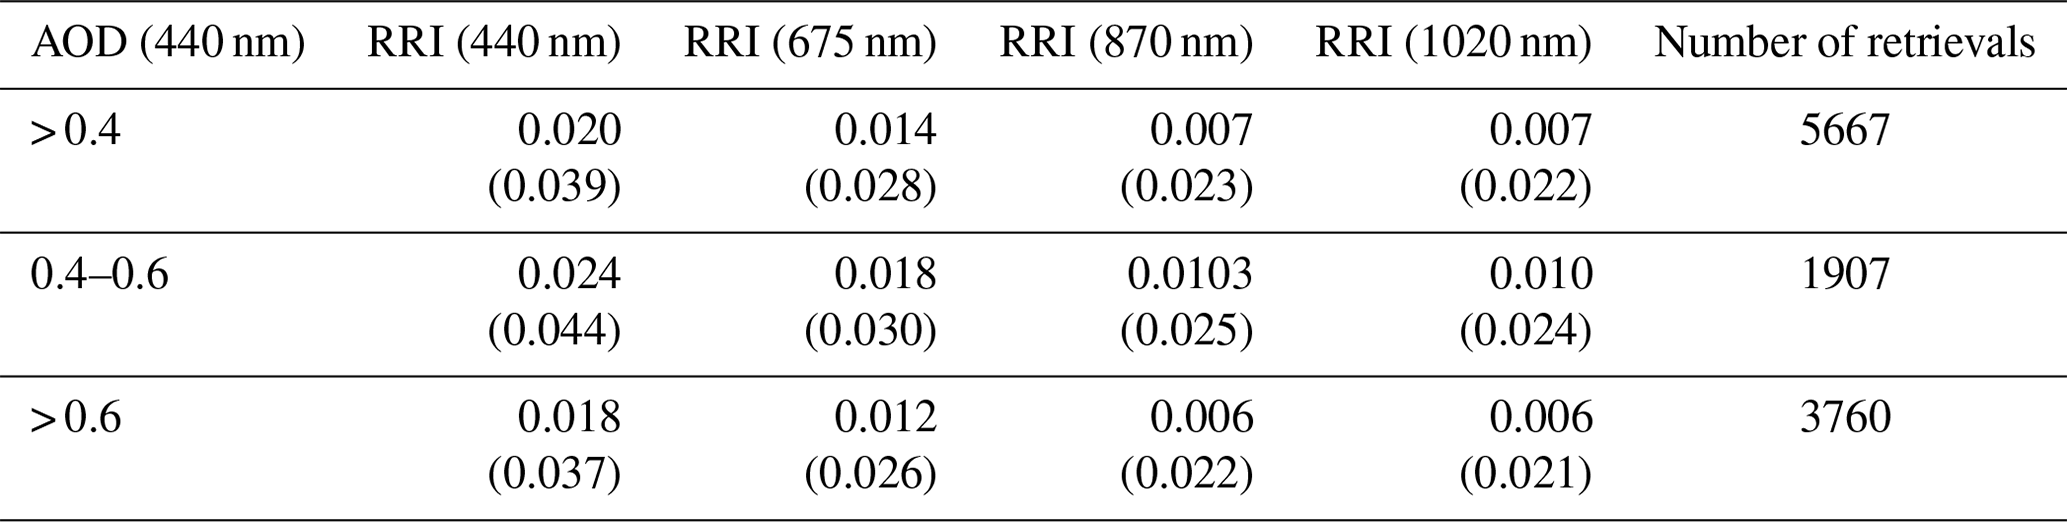
Table 12Statistics, average values and standard deviations (in parentheses) of the difference in volume median radius (VMR) and width of particle size distribution (STD) retrievals of V2 and V3 for the Kanpur site. The difference is defined as V3−V2.
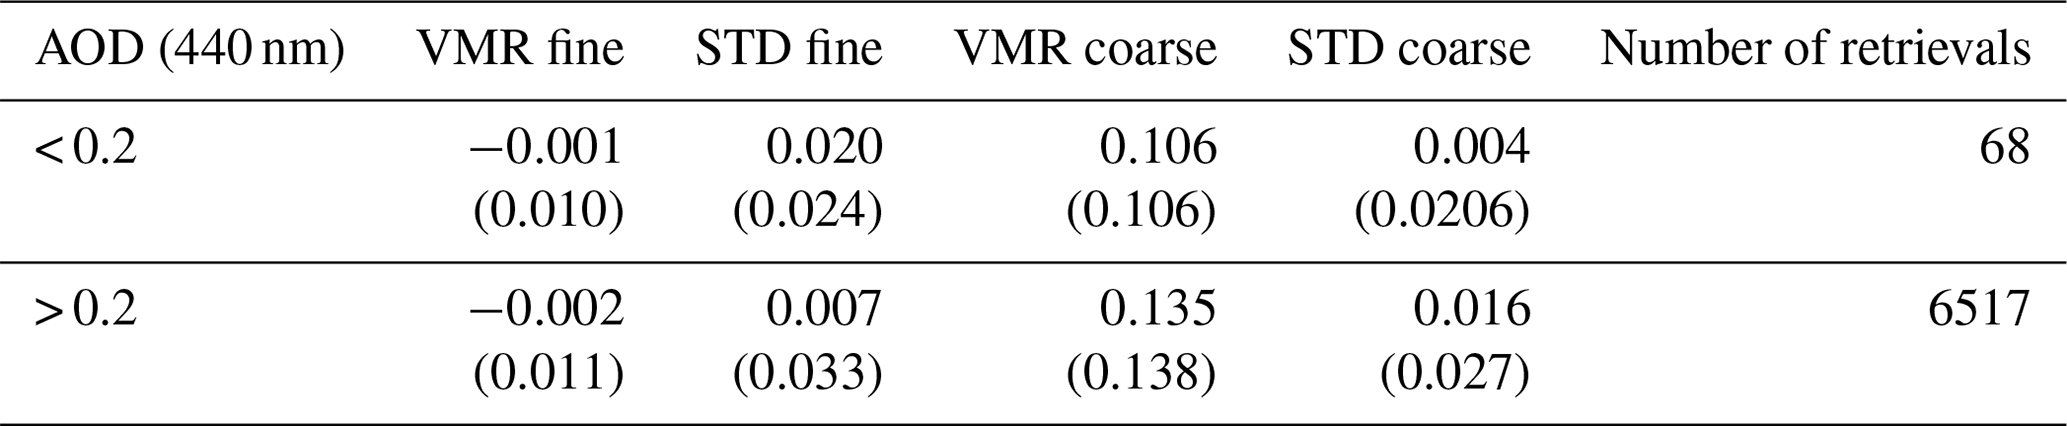
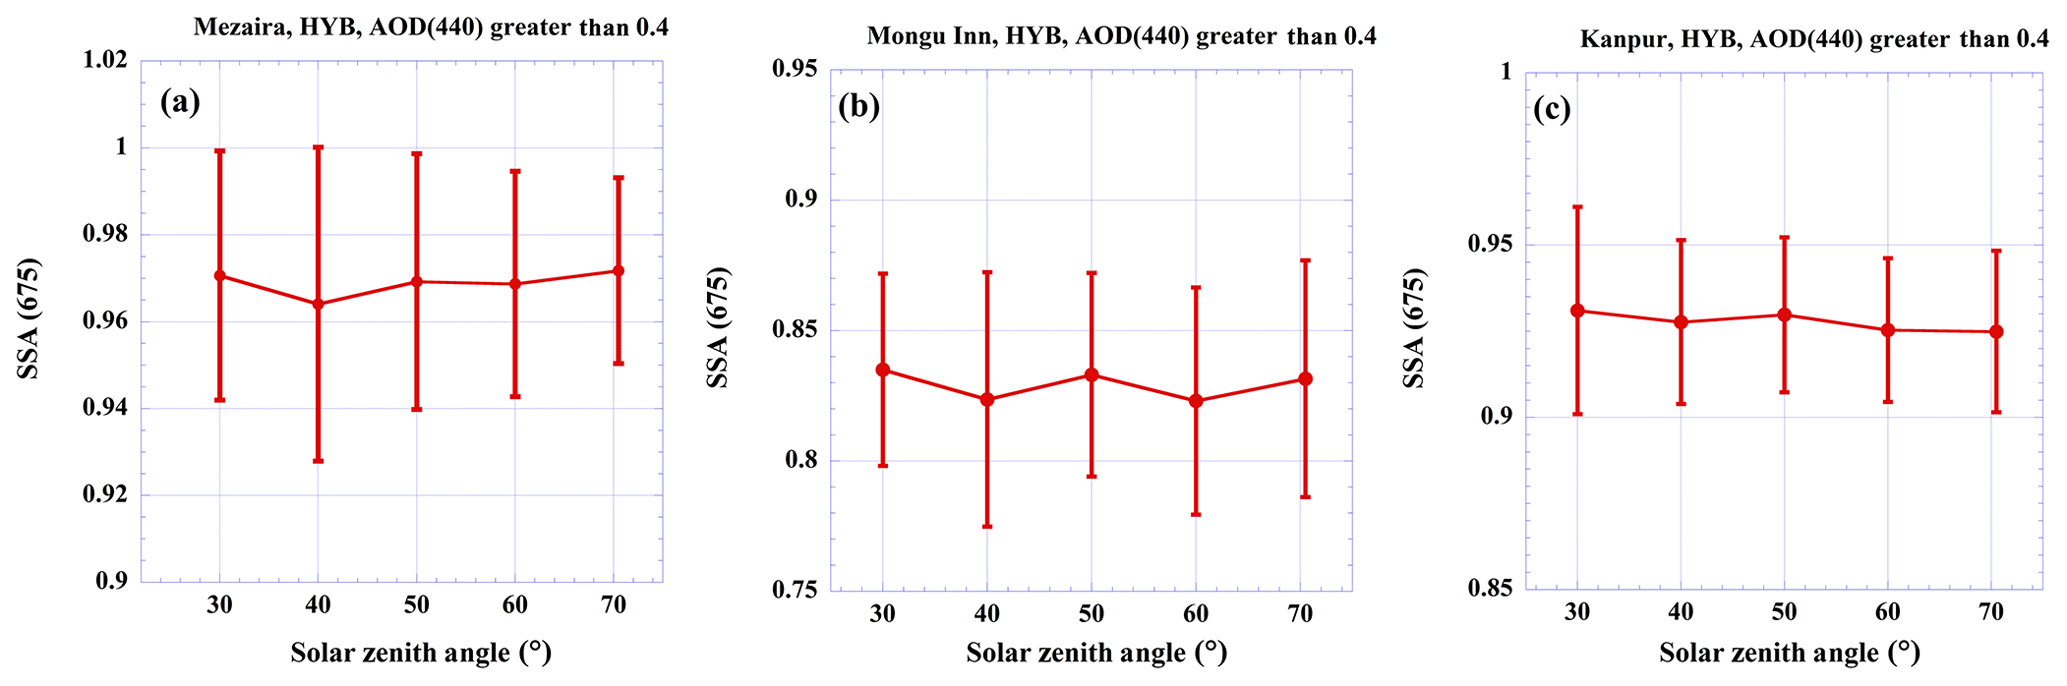
Figure 14Dependence of 675 nm SSA hybrid scan retrievals on SZA for three AERONET sites: (a) Mezaira, (b) Mongu Inn, (c) Kanpur.
The dependencies of SSA retrievals on SZA for HYB scans for longer wavelengths are shown in Figs. 14 through 16. The general feature of the results for Mezaira and Mongu Inn is the absence of any clear SZA trend for SSA retrievals. For Kanpur the SZA dependence at 440 nm (Fig. 13c) is gradually reversed as the wavelength increases, reaching the maximum 30∘ to 40∘ SZA difference of ∼0.018 at 1020 nm. The stability of dust SSA retrievals at Mezaira at longer wavelengths can be explained by the strong BRDF effect in V3 for barren desert sites which counterbalances the effect of modeling bias. Additional analysis revealed that the SSA trend reversal for Kanpur can be explained by changes in relative contributions of fine and coarse aerosol components to the total AOD with SZA bins. For example, at 1020 nm, the 30∘ SZA bin is dominated by coarse-mode AOD, which is ∼0.3, while fine-mode AOD is only ∼0.085. At the same time, at the 40∘ SZA bin the coarse- and fine-mode contributions are comparable, ∼0.18 (coarse) and ∼0.16 (fine), resulting in SSA at 30∘ being larger than that at 40∘ (e.g., Eck et al., 2010).
Table 13Hybrid sky scan with azimuth (AZ) and view zenith angle (VZA) for three selected solar zenith angles at 30, 60, and 75∘. NA – not available.
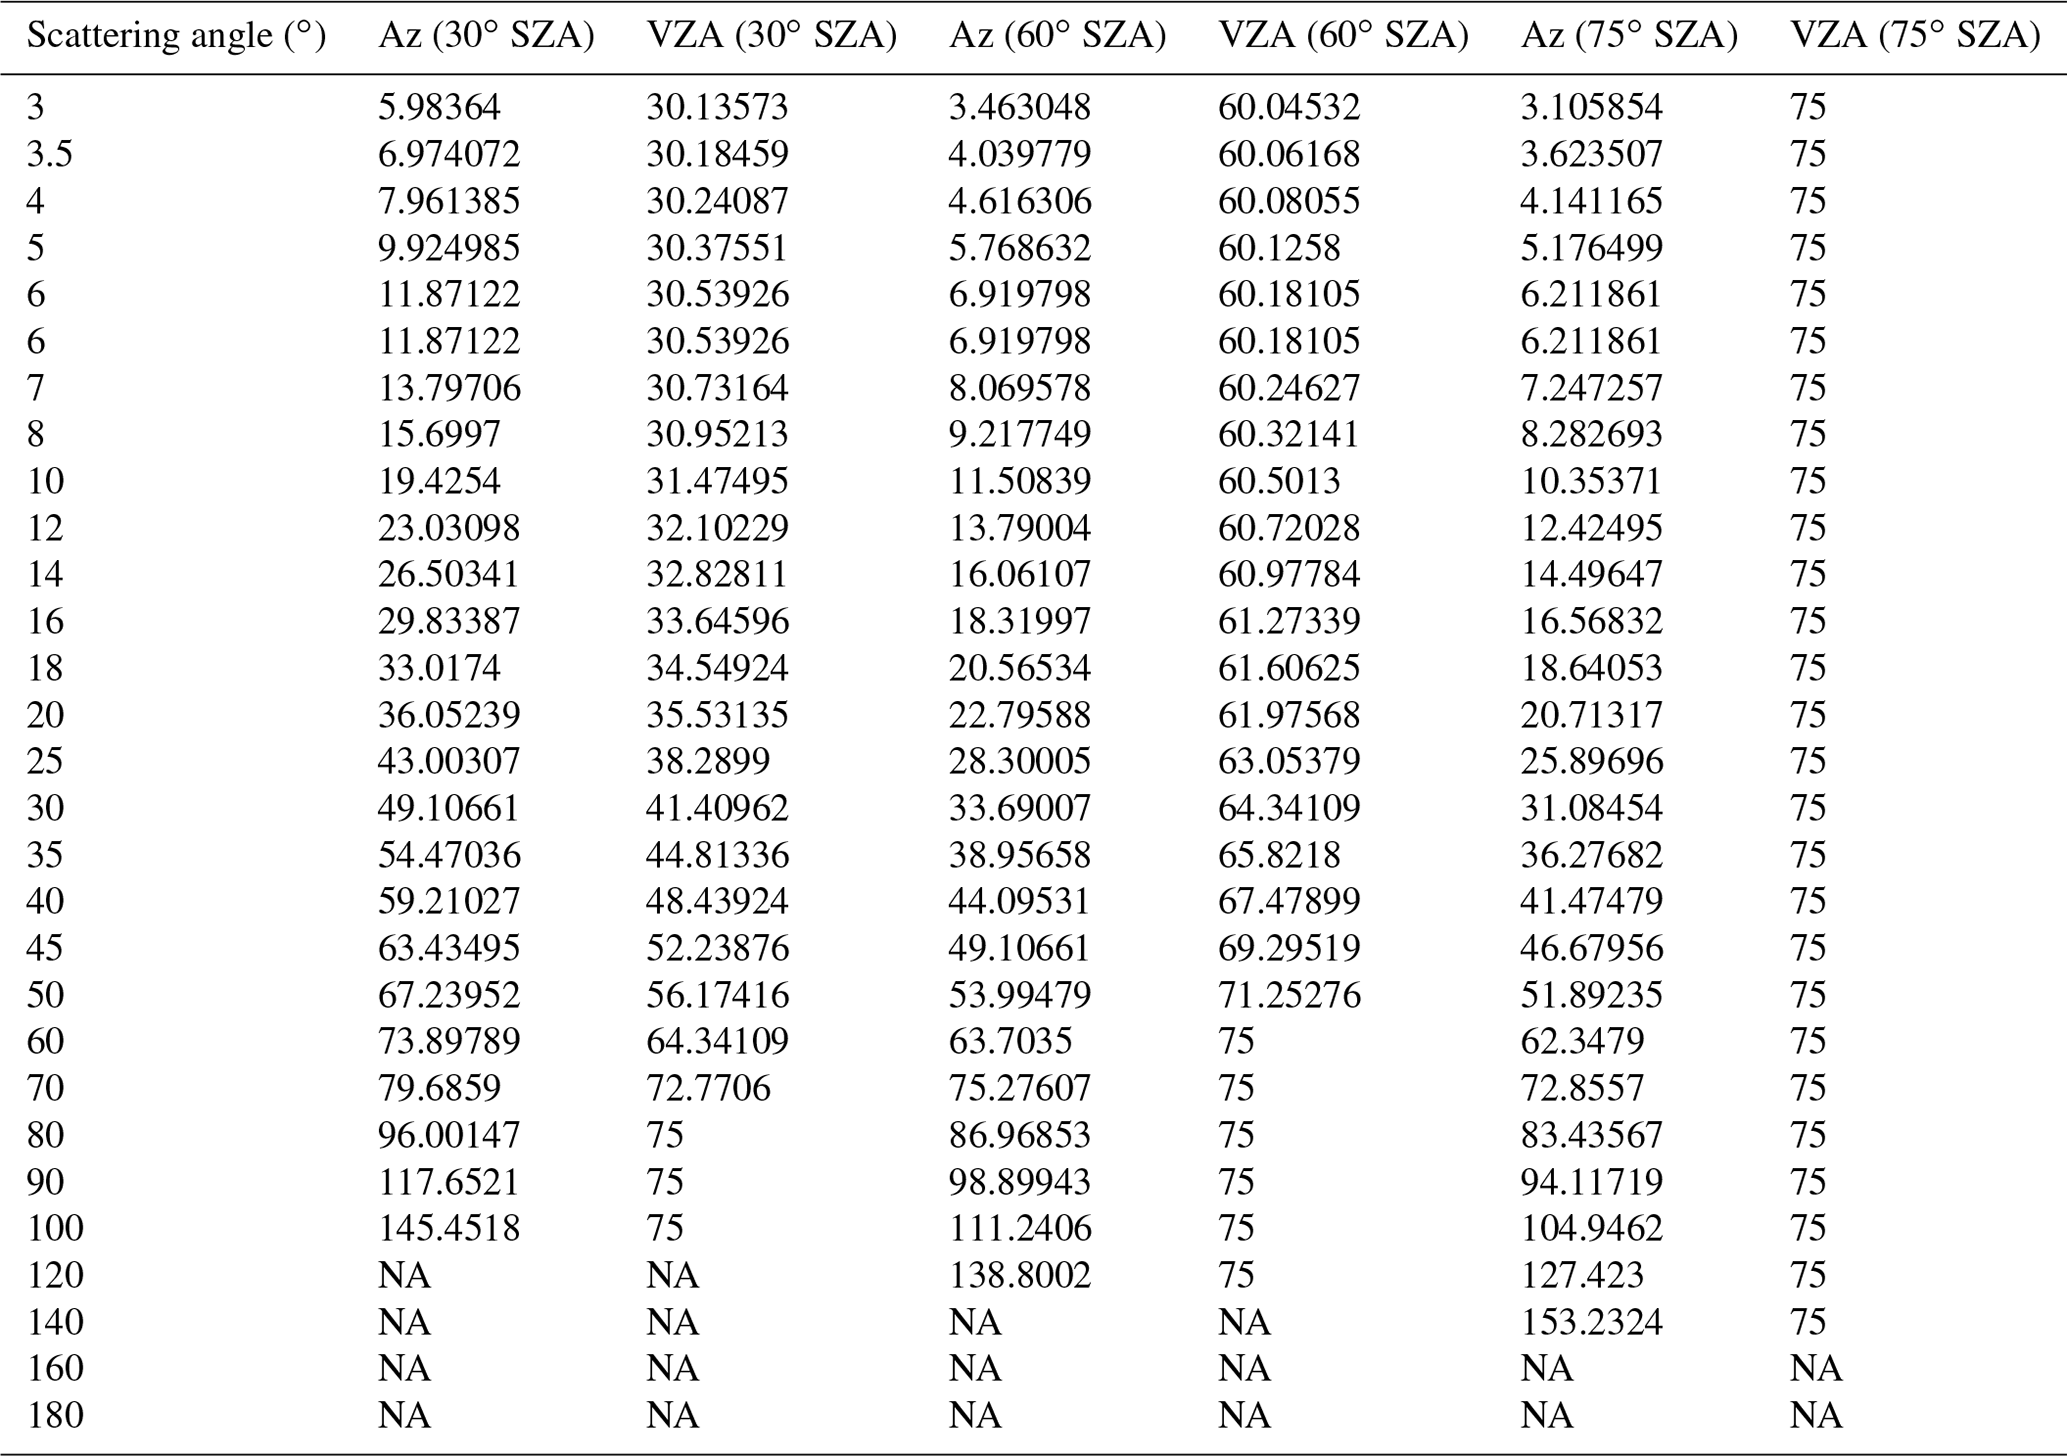
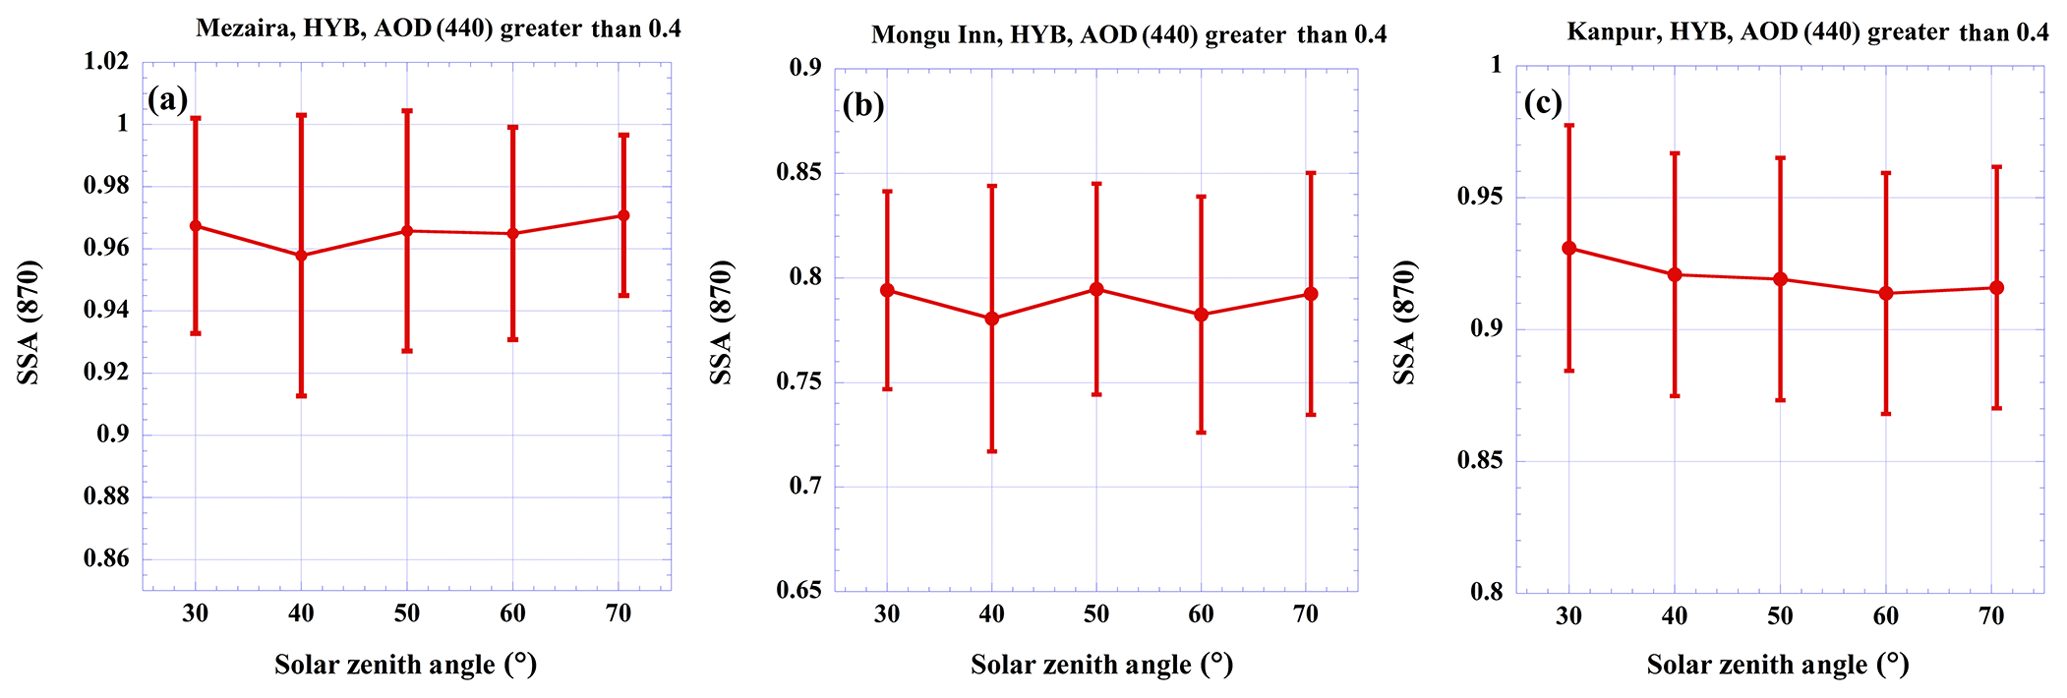
Figure 15Dependence of 870 nm SSA hybrid scan retrievals on SZA for three AERONET sites: (a) Mezaira, (b) Mongu Inn, (c) Kanpur.
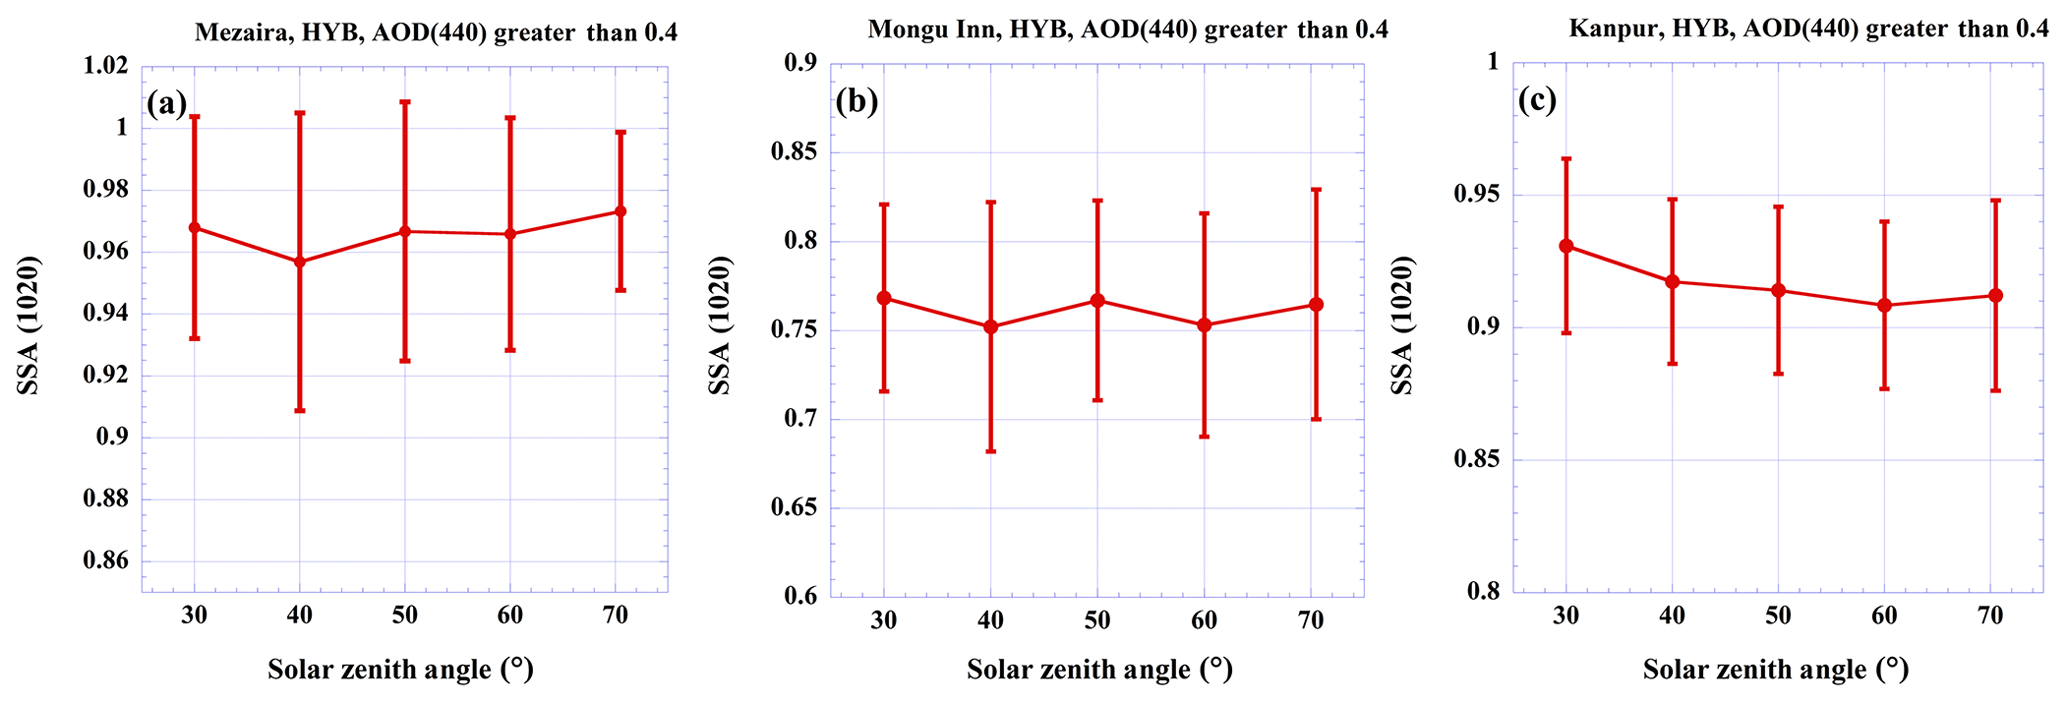
Figure 16Dependence of 1020 nm SSA hybrid scan retrievals on SZA for three AERONET sites: (a) Mezaira, (b) Mongu Inn, (c) Kanpur.
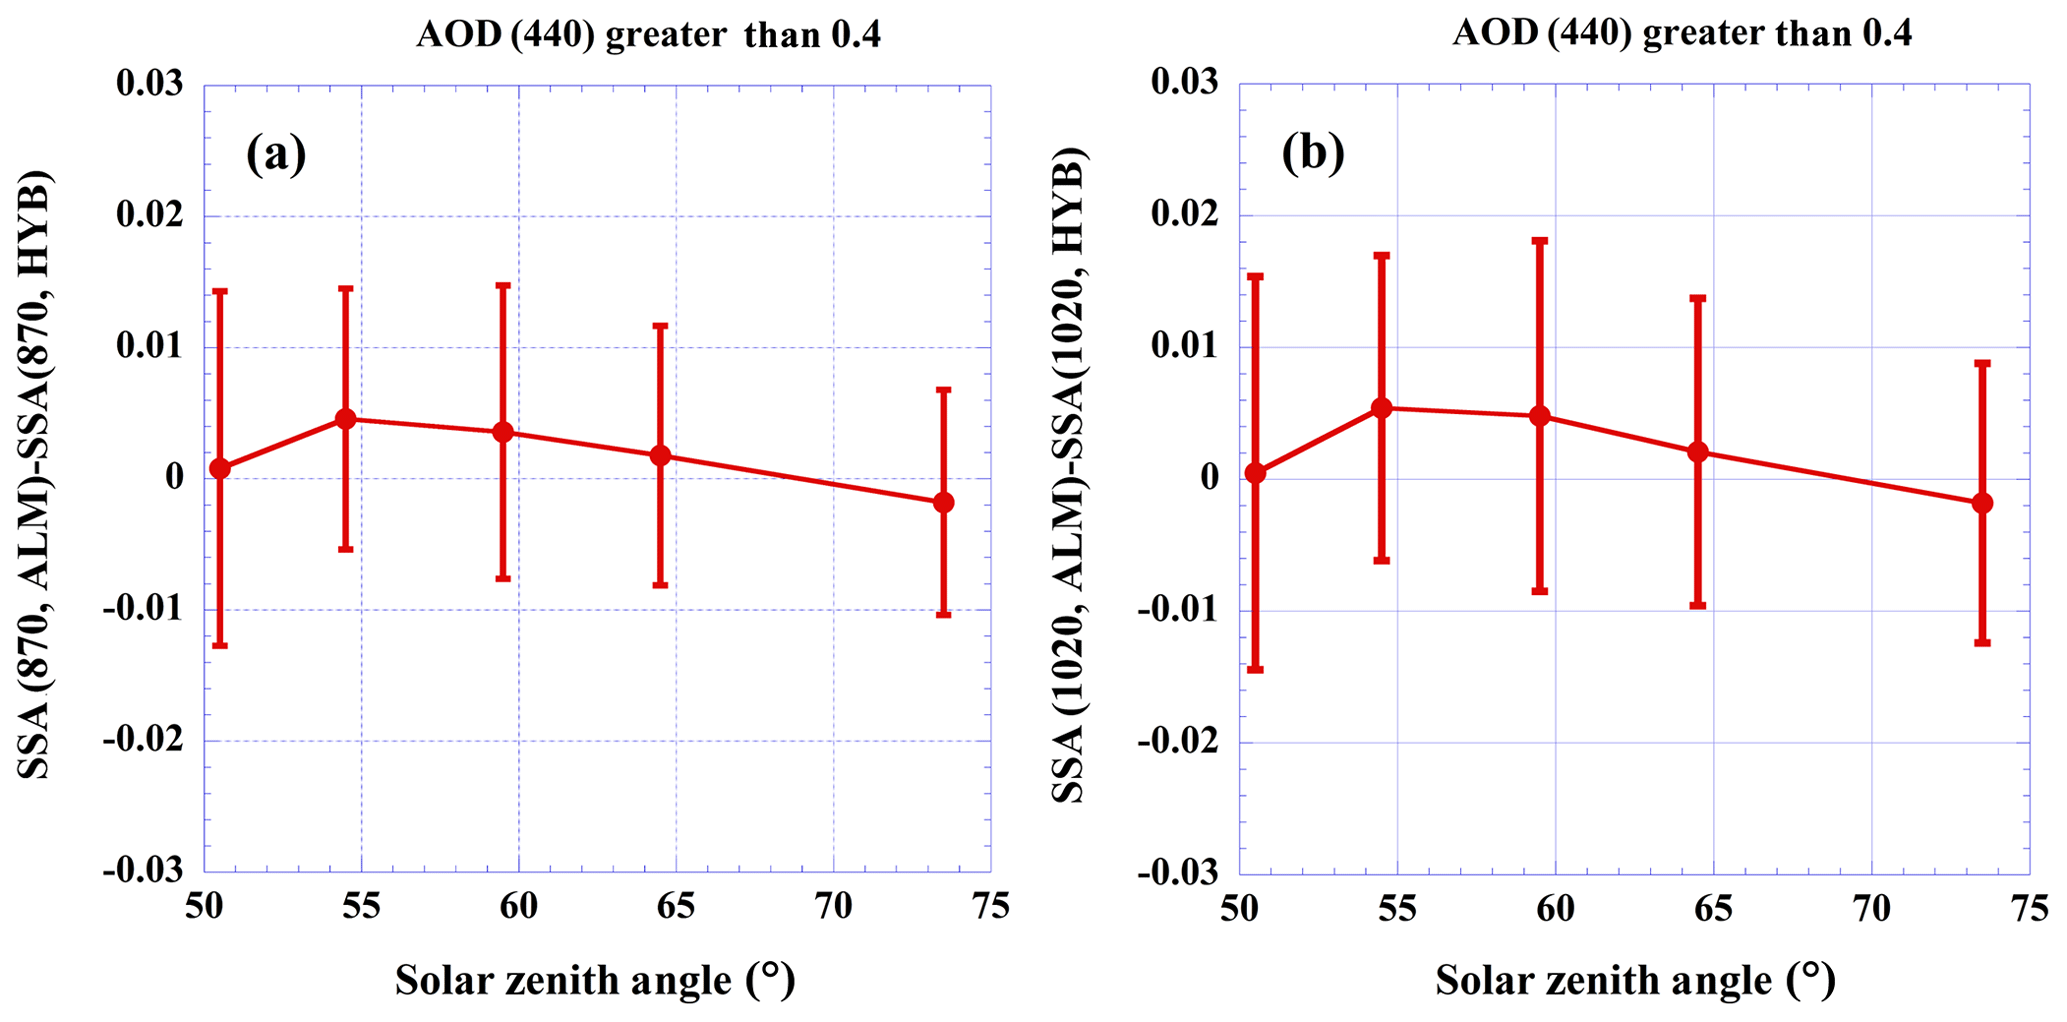
4.2 Hybrid versus almucantar scan – comparison of SSA retrievals
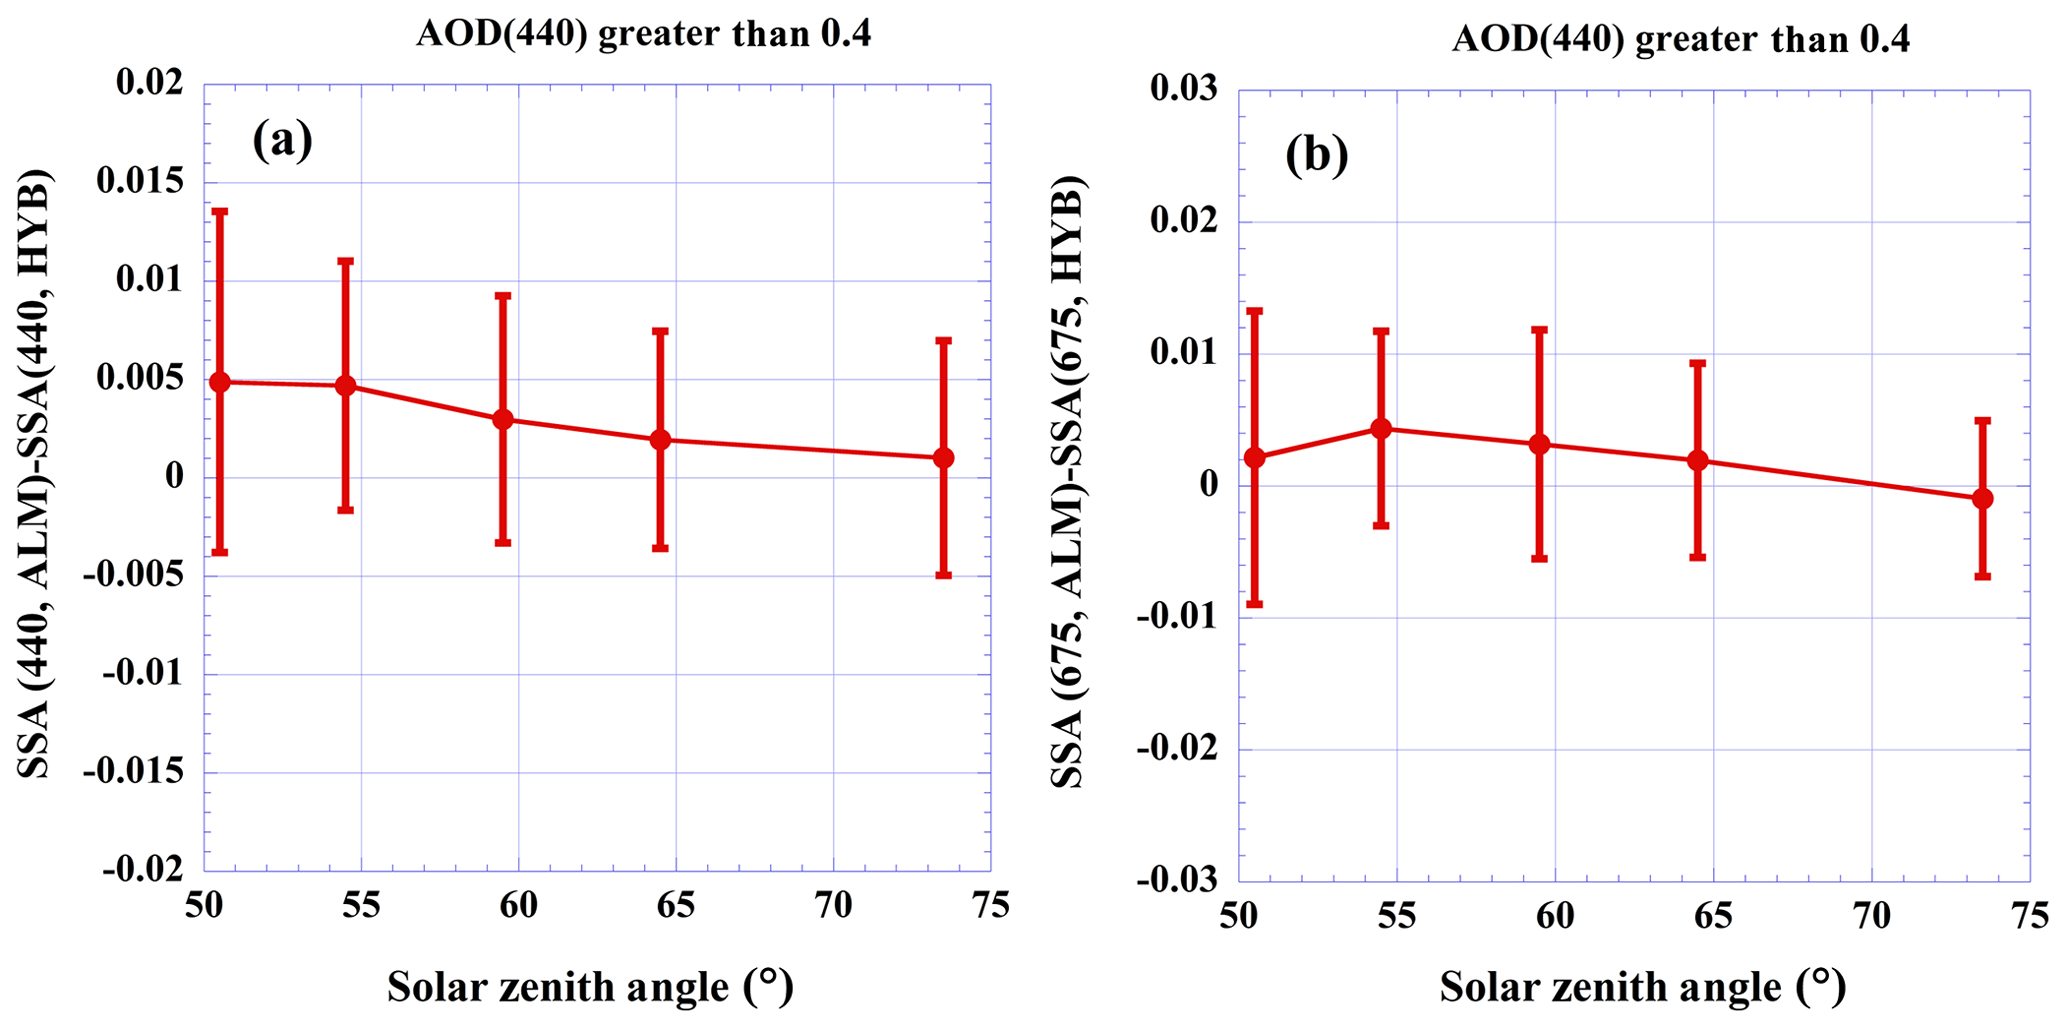
Typically, HYB and ALM scans are taken ∼10–12 min apart for the SZA range of 50∘ to 75∘; therefore, the corresponding retrieval results are expected to be in relatively good agreement. Figures 17 and 18 show the statistics of the difference in SSA retrieved from HYB and ALM scans as a function of SZA. The statistics were generated using the data from all AERONET sites for which the HYB inversions were available by aggregating SSA retrievals in five SZA bins. Each bin is 1∘ wide, centered at 50.5∘ (387), 54.5∘ (160), 59.5∘ (187), 64.5∘ (121) and 73.5∘ (296) SZA, where the number of inversions corresponding to each SZA bin are shown in parentheses. In general, the agreement is good for all wavelengths, with the mean values of the differences below 0.005. At the same time the variability is increasing with increasing wavelength due to the predominant contribution of fine-mode aerosols to the generated statistics (aerosol loading of ∼80 % sites is dominated by fine-mode aerosols) and therefore much smaller AOD at the longest wavelengths, which results in less sensitivity to aerosol absorption. Also, there is a trend of decreasing difference with increase in SZA due to increasing similarity of both scan geometries, which is very clearly visible at 440 nm. At longer wavelengths SZA dependencies exhibit a maximum at ∼550 due to a sharp decrease in the mean difference at the smallest SZA.
The first assessment of the accuracy of aerosol parameters retrieved by AERONET sky scan inversions was presented in Dubovik et al. (2000). This analysis was performed by sensitivity studies for a set of preselected aerosol models assuming given input uncertainties due to random errors, instrumental offsets, and known uncertainties in atmospheric radiation modeling. The main results are presented in Table 4 of that paper, summarizing the dependence of the accuracy on aerosol type for a limited number of AOD values and for a single fixed value of solar zenith angle (60∘). Applicability of the results to the 50–70∘ range of solar zenith angles is therefore assumed. The AOD dependence was analyzed for two AOD values for water-soluble aerosols (smaller and greater than 0.2 at 440 nm) and for one AOD range (greater than 0.5 at 440 nm) for biomass burning and dust aerosol types. The accuracy of wavelength-dependent aerosol parameters (real and imaginary parts of refractive index and single scattering albedo) was only analyzed for 440 nm. Based on these results the following thresholds for Level 2 aerosol retrieval quality control for the refractive indices are used: AOD (440) is greater than 0.5 and SZA is greater than 50∘ (Dubovik et al., 2000; Holben et al., 2006). These thresholds were selected in order to ensure that for Level 2 data the uncertainty of retrieved SSA was 0.03 or less. For the size distribution retrievals there was no lower limit threshold at 440 nm AOD to meet quality control for Level 2 data.
In V3 the analysis of the accuracy of retrieved aerosol parameters is extended to all the wavelengths participating in the inversion (440, 675, 870 and 1020 nm) and to a wider range of values of AOD and SZA. The approach is somewhat similar to that of Dubovik et al. (2000) in that the variability in retrieved aerosol parameters is generated by perturbing observations in inversion inputs as in typical sensitivity studies. However, instead of generating synthetic measurements for the prescribed sets of aerosol models and then perturbing them, the real-time Sun photometer observations are perturbed by the assumed values of instrumental and auxiliary input biases. This allows avoidance of some rather complex modeling, such as considering aerosols of different types or mixtures thereof over different types of surfaces, which would require a large set of different combinations to analyze. Also, a very wide range of AODs and SZAs are covered, since the entire multi-decade database of AERONET almucantar observations was analyzed in this V3 assessment of uncertainty.
5.1 Approach for individual inversions
The assumption made in this analysis is that the perturbations in measurements and auxiliary inputs are due to uncertainties (biases, systematic errors) in AOD, radiometric calibration of sky radiances, solar spectral irradiance, and surface reflectance. Sun photometer pointing bias is not included in the list of uncertainties because this error is quite small (), and furthermore averaging the left and right parts of almucantar scans before use as input to the retrieval code reduces this uncertainty significantly. Each bias assumes three values: positive value, negative value, and zero (non-biased), and the values and the signs of biases of the same type are assumed to be spectrally independent. This means, for example, that AODs at different wavelengths are biased in the same direction with the same assumed bias value. The same is true for sky radiances, solar irradiance spectrum, and surface reflectance. The radiometric calibration and solar spectrum irradiance uncertainties are combined in one bias because both affect the magnitude of sky radiances. As a result, there are three distinct biases, each assuming three values, which makes 27 distinct combinations in perturbing measurements in inversion inputs. The following values for 1 sigma biases of the input data are assumed. AOD: (Eck et al., 1999b), where m is optical air mass, radiometric calibration bias: ±3 %, solar irradiance spectrum: ±2 %, and surface reflectance: ±0.05. The combined calibration and solar irradiance bias assume the ±5 % values, which overestimate the sum of individual biases in cases when they compensate each other. In the Ross–Li BRDF model, only the first of the three BRDF parameters is perturbed. This is equivalent to an assumption that the angular shape of BRDF is unchanged and only the surface albedo is biased. For each set of Sun photometer observations an array of 27 inputs corresponding to 27 combinations of biases is produced. All of these inputs are then separately inverted, and the following statistics of the inversion results are generated: average value, standard deviation, and minimal and maximal values. These statistics describe the variability in retrieved aerosol parameters due to the assumed uncertainties in inversion inputs for each individual inversion. From these statistics only the standard deviation (which we label U27) is used as a proxy for the estimated uncertainty as an indicator of a spread of the retrievals corresponding to the different combinations of input uncertainties.
5.2 Lookup table (LUT) approach
Because operationally running 27 inversions instead of 1 substantially increases the computational time, a LUT approach was designed to speed up the determination of U27 for all new observations when they are reprocessed to Level 2 with final calibrations applied. A climatological LUT is generated from the entire AERONET almucantar and hybrid scan database by binning U27s in AOD (440 nm), AE (440–870 nm), and SSA (440, 675, 870, 1020 nm). A total of ∼1 million sky scans that passed Level 2 quality controls were inverted 27 times in order to produce the U27 values for all parameters. Using this LUT approach, U27 for each individual new Level 2 retrieval can be obtained by interpolation using the corresponding measured and inverted combination of AOD, AE, and SSA. The analysis of U27 for dust aerosol individual retrievals of SSA at longer wavelengths revealed physically nonrealistic small values of U27 related to IRI hitting its lower limit (boundary) constraint of the inversion, as was discussed in the analysis of the results presented in Fig. 10. Therefore, a second LUT was generated from the subset of U27s for only individual inversions when no boundary hits were detected for any of the retrieved parameters. The second LUT is used for obtaining the unbiased estimates of uncertainty in situations when the effect of boundary hitting by retrievals on U27 is substantial (typically for SSA of dust aerosol, which is already very weakly absorbing).
The following binning intervals were used in generating the LUT. AOD: less than 0.05, 0.05–0.1, 0.1–0.2, 0.2–3.4 (in 0.2 increment bins). AE (440–870 nm): less than 0.3, 0.3–2.4 (in 0.3 increment bins). SSA: 440, 675 nm: less than 0.7, 0.7–0.8, 0.8–0.85, 0.85–0.9, 0.9–0.95, 0.95–0.975, 0.975–1.0. SSA: 870–1020 nm: two additional bins: less than 0.6, and 0.6–0.7. The U27s are provided for the following parameters: VMR of size distribution for both modes, width of size distribution for both modes, IRI at four standard wavelengths, SSA at four standard wavelengths, and asymmetry parameter at four standard wavelengths. The uncertainty estimates for the real part of the refractive index (RRI) are not provided for the reason that will be discussed later in Sect. 5.4.2.
All the parameters use AOD and AE in the LUT; however, some absorption-dependent parameters also utilize the binning of SSA, which produces two types of LUTs. The first LUT is two-dimensional with binning in AOD and AE. This LUT is used to generate U27 for VMR, width of PSD, and asymmetry parameter. The second LUT is binned by AOD, AE, and SSA and used to obtain U27 for IRI and SSA in order to account for the effect of different absorption levels by aerosols with overlapping AE ranges, e.g., pollution and smoke aerosols (both of which exhibit a wide range of absorption: Dubovik et al., 2002; Giles et al., 2012). The two-dimensional (2D) LUT can be viewed as a rectangular grid, each node of which corresponds to an AOD, AE pair. Each inversion has its own AOD and AE and thus represents a point in the AOD, AE 2D space. If a point is inside of that grid, four surrounding nodes are used for 2D interpolation. Similarly, the three-dimensional (3D) LUT can be viewed as a parallelepiped lattice, each node of which corresponds to an AOD, AE, SSA triad. Each inversion has its own AOD, AE and SSA and thus represents a point in the AOD, AE, SSA 3D space. If a point is inside of the lattice, we use the eight surrounding nodes for 3D interpolation. If one or more points that are required for interpolation are missing, the values of the closest nodal points are used. The 2D interpolation is done on the original LUT (no restriction on boundary hits of the a priori constraints). The 3D interpolation uses the no hits LUT (no constraint limits reached for any retrieved parameters) only for the following combination of AE, SSA bins: AE – less than 0.3 and SSA – 0.975–1.0, conditions for which most of the boundary hits of the IRI parameter occur.
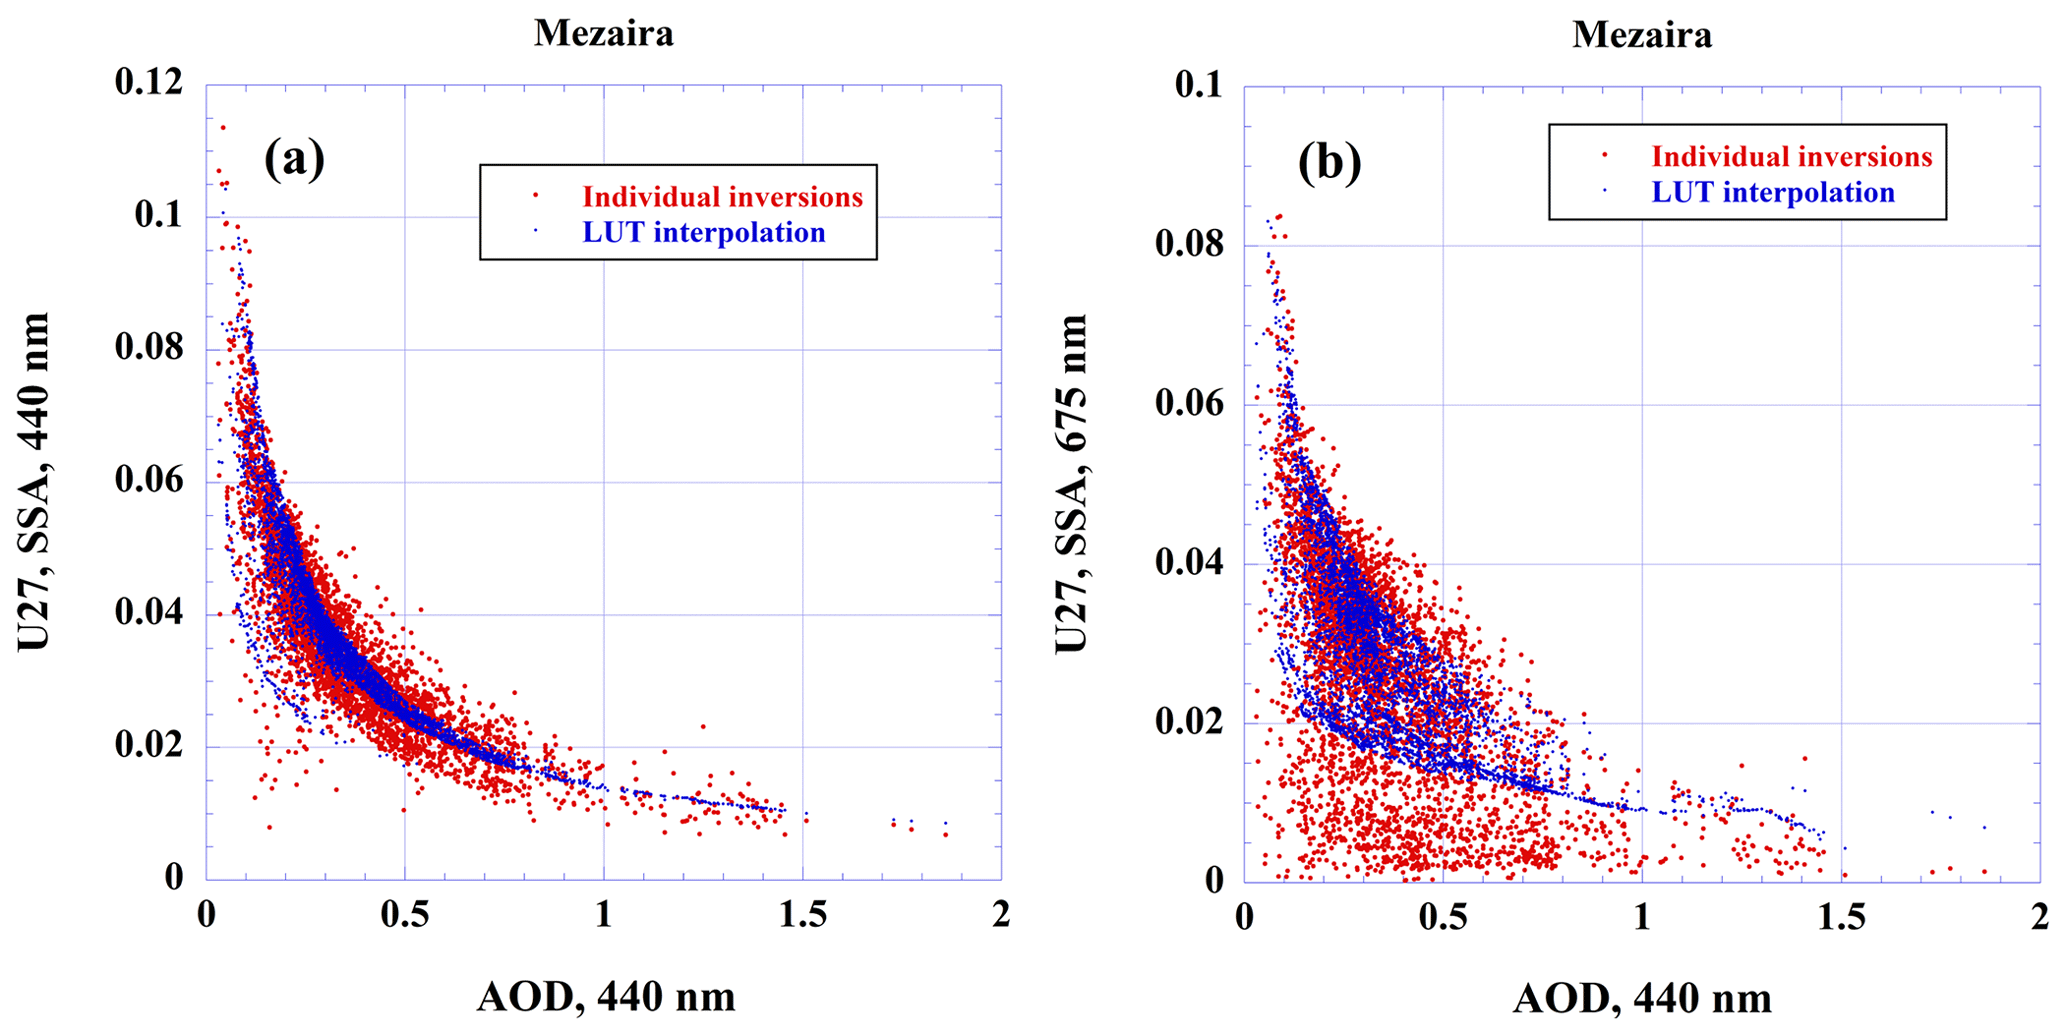
Figure 19Comparison of SSA U27 estimated for individual inversions and by interpolation over LUT for the Mezaira site: (a) 440; (b) 675 nm.
Figure 19 shows a comparison of U27 estimated for SSA retrievals by the two methods for Mezaira for SSA at 440 and 675 nm. Figure 19a shows good agreement between them at 440 nm, although the dependence of LUT-interpolated U27 on AOD exhibits less scattering than that for individual inversions, which can be explained by the additional LUT averaging. Figure 19b at 675 nm demonstrates the effect of the boundary hits by IRI retrievals on U27 obtained for individual inversions, in which case the variability among the 27 individual retrievals is reduced due to the lower limit constraint for IRI, resulting in an upper limit for SSA. Because of this artificial variability reduction, the corresponding standard deviations are underestimated in some of the individual retrievals. It is also seen from Fig. 19b that combining the original LUT with the one with no hits for the lowest AE and the highest SSA bins corrects these unphysically small U27 values, especially for low levels of AOD.
5.3 Quality control
For V3 retrieval parameters, we define the Level 2 criteria for estimated retrieval uncertainties in a manner very similar to that of Dubovik et al. (2000) and Holben et al. (2006), thus limiting the quality-assured U27 retrievals to those within AOD/SZA boundaries close to or equal to those defined in the previous V2. The following Level 2 criteria are used and U27 estimates of uncertainty are provided for these parameters.
-
SSA, IRI: for ALM 440 nm AOD larger than 0.4 and SZA larger than 50∘. For HYB 440 nm AOD larger than 0.4 and SZA larger than 25∘. This ensures that for both ALM and HYB scans the minimum angle of the scattering angle range is 100∘ for measured directional sky radiances.
-
Volume median radius, width of particle size distribution, asymmetry parameter: for ALM 440 nm AOD larger than 0.02 and SZA larger than 50∘. For HYB 440 nm AOD larger than 0.02 and SZA larger than 25∘.
5.4 Analysis
The approach utilizing LUT interpolation was investigated by generating U27 for aerosol retrievals at four selected AERONET sites: GSFC, Mezaira, Kanpur, and Mongu, for which the results are presented below.
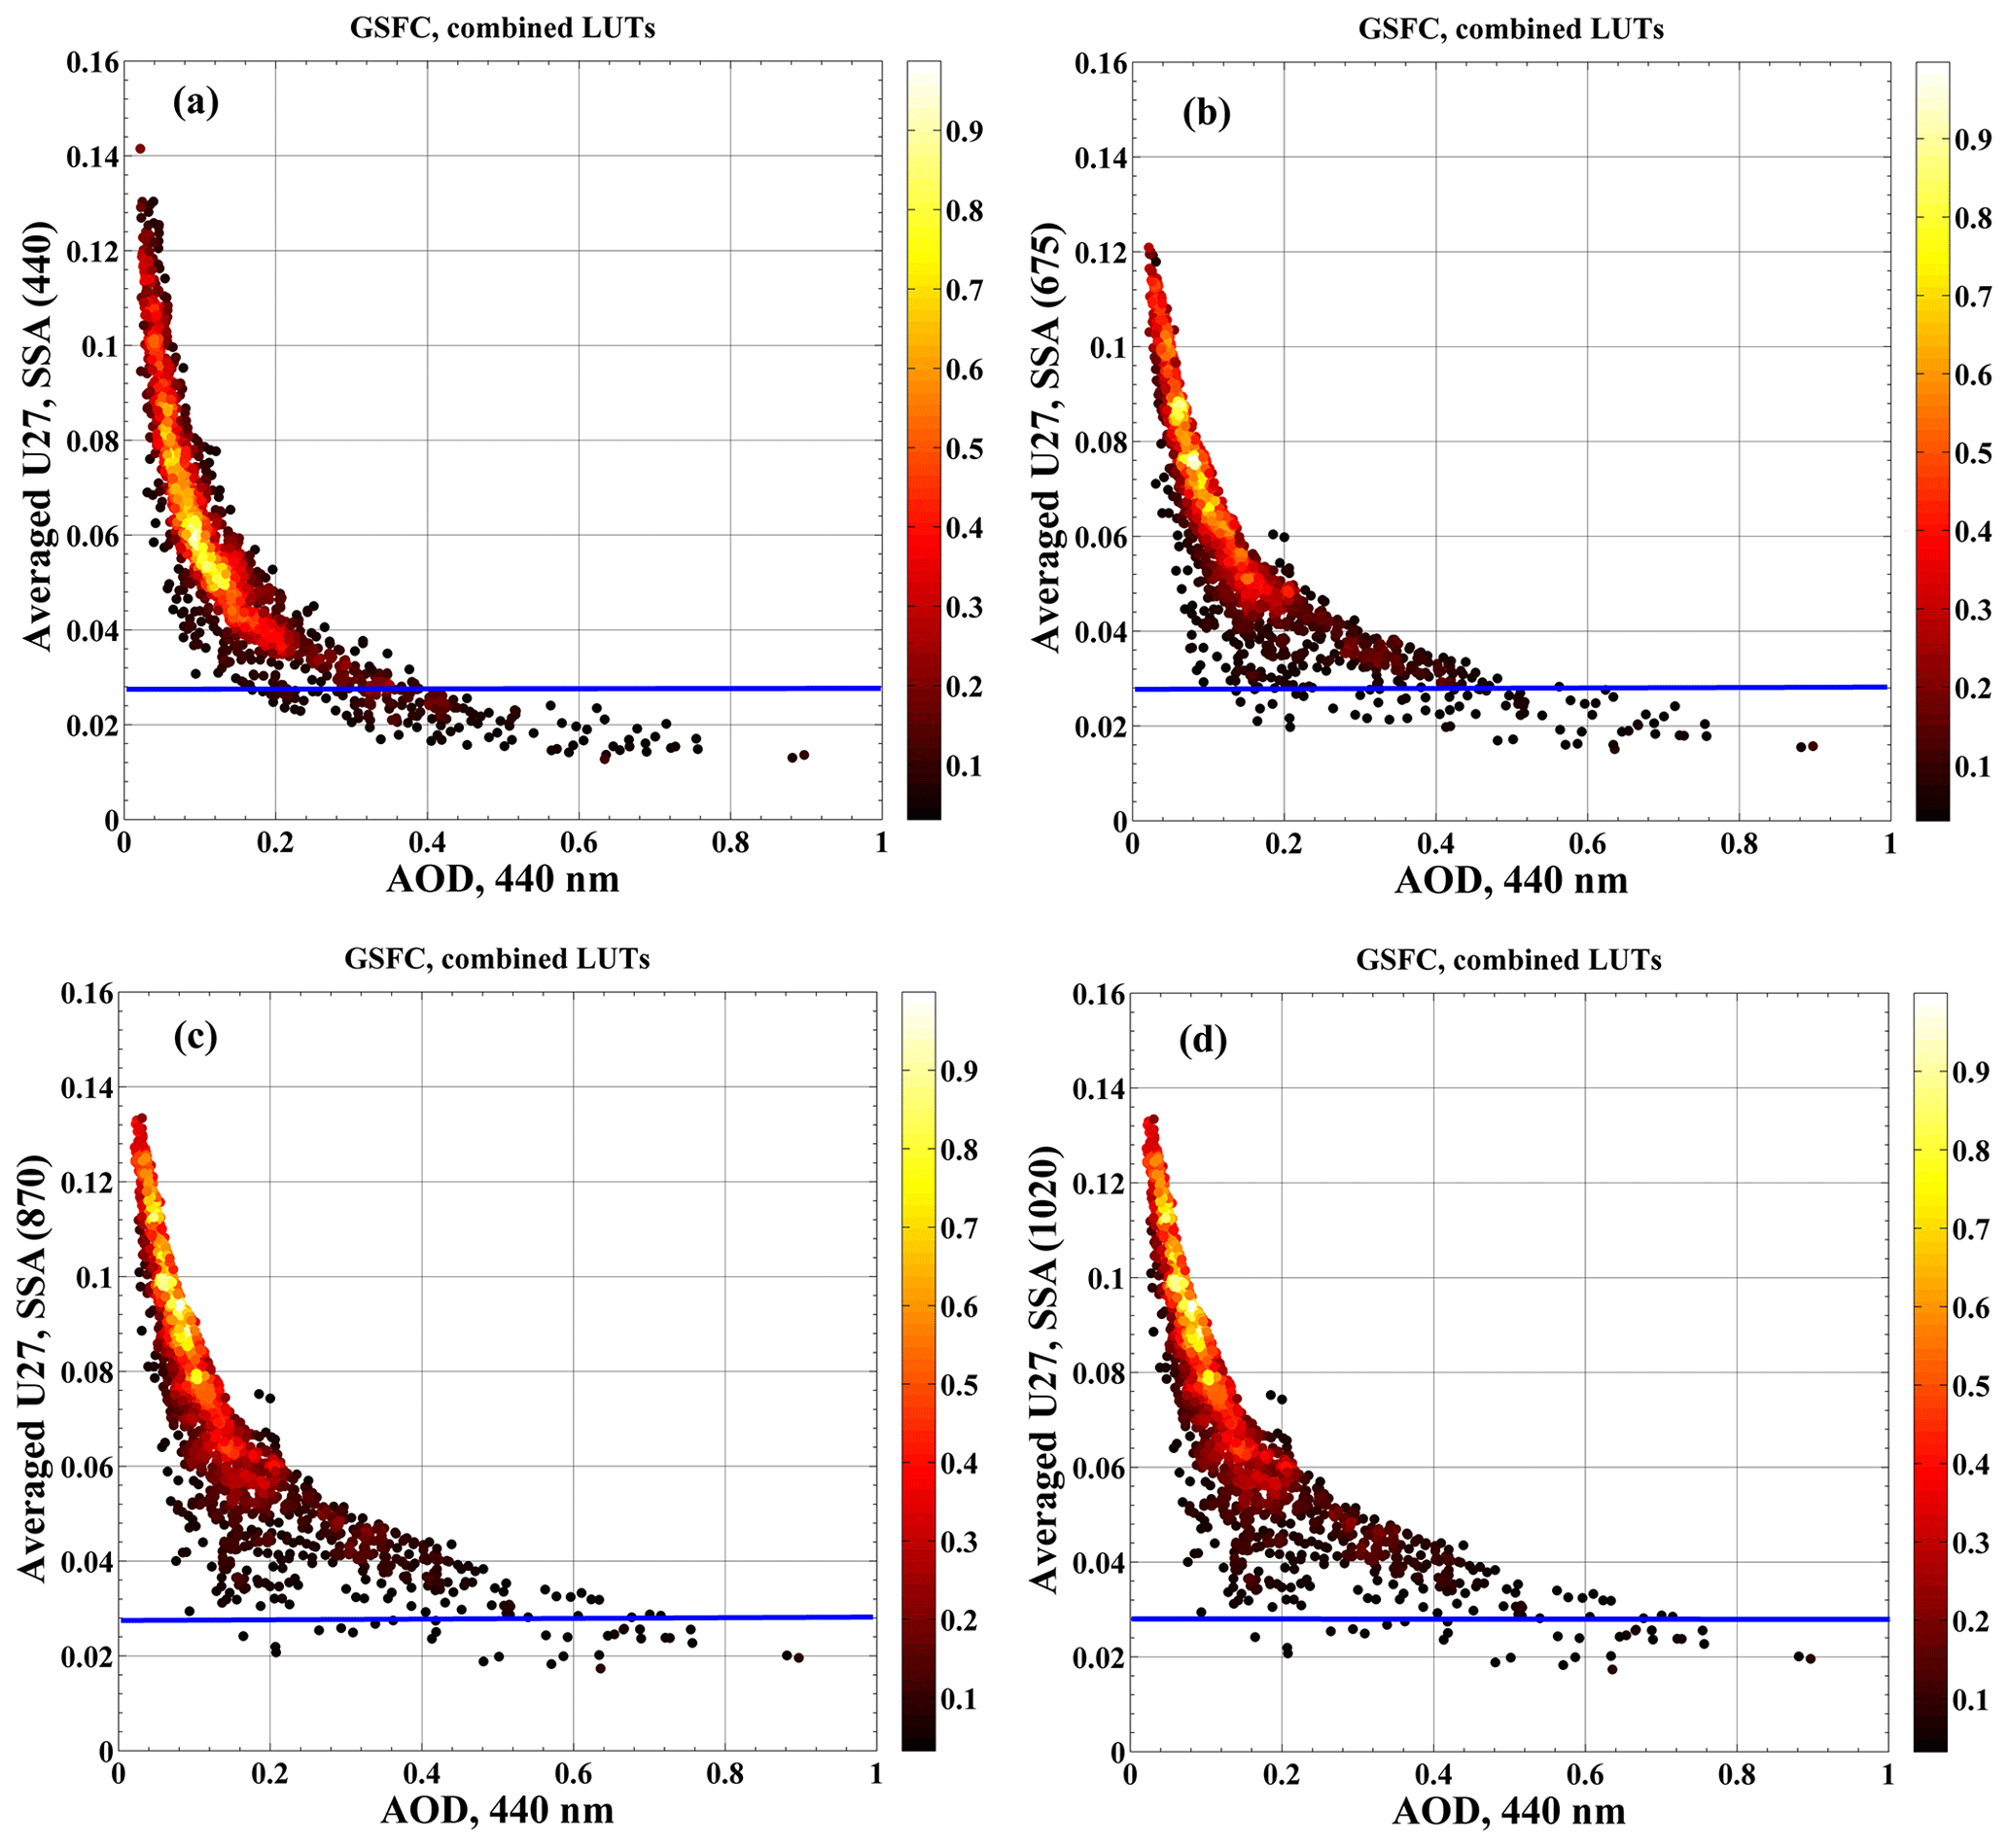
Figure 20Uncertainties for SSA retrievals at the GSFC site: (a) 440, (b) 675, (c) 870, and (d) 1020 nm.
5.4.1 SSA
Figure 20 shows the uncertainty estimates for SSA retrieved at the GSFC site. As is seen, at all the wavelengths the U27 exhibits power-like functional dependencies on AOD, with smaller uncertainties corresponding to the larger optical depth and vice versa. The scattering of the data increased with increasing wavelength, which can be explained by the decrease in AODs at longer wavelengths due to the large AE, a 1.61-yearly climatological value. In addition, the data displayed in Fig. 20 are comprised of retrievals for the range of SZA greater than 50∘ (upper limit ∼77∘), which can contribute to additional U27 scattering due to SZA variability within narrow AOD bins. The solid blue lines in Fig. 20 indicate the upper boundary of Level 2 SSA retrieval uncertainty established in Dubovik et al. (2000) for AOD (440 nm) greater than 0.2 for the water-soluble aerosol type (weakly absorbing) which dominates GSFC aerosol loading especially at the highest AOD levels. Close inspection of Fig. 20a shows that the crossing point between the blue line (Dubovik et al., 2000, estimate) and U27 AOD dependence is close to an AOD (440) of 0.3, thus increasing the AOD by 0.1 in V3 for the same estimate of SSA uncertainty (0.03) that was assumed in V2 (for water-soluble aerosol). Similar analysis of Fig. 20b though Fig. 20d shows that the AOD (440 nm) corresponding to the uncertainty of 0.03 increases with wavelength: ∼0.4, 0.5, and 0.6 for 675, 870, and 1020 nm, respectively.

Figure 21Uncertainties for SSA retrievals at the Mezaira site: (a) 440, (b) 675, (c) 870, and (d) 1020 nm.
Figure 21 shows the uncertainty estimates for SSA retrieved at the Mezaira site. The uncertainties exhibit some minor scattering at 440 nm and much larger variability at longer wavelengths. The main reason for the larger scattering of U27 values at longer wavelengths is the close proximity of the original IRI retrievals to the lower limit set by the inversion code even after the direct boundary hits were filtered out, resulting in small uncertainty values near the limit. In this case the different degree of proximity to the lower limit results in a different degree of reduction of U27, thus producing the resulting distribution of U27 values for each narrow AOD bin. The closeness of the IRI retrievals to the inversion limit at a longer wavelength in V3 is partially due to the BRDF input in V3 as discussed previously. The U27 exhibits smaller scattering for AODs larger than ∼0.9, which can be explained by the higher sensitivity to aerosol absorption in this AOD range as well as by the smaller number of the occurrences of high-AOD events. Additionally, as AOD increases, the aerosol signal increases relative to the fixed uncertainties of data and auxiliary inputs. Figure 21a shows the 0.03 uncertainty level corresponds to the 440 nm AOD value of ∼0.45, which is close to the 0.5 value by Dubovik et al. (2002) which gave the same AOD value for both dust and biomass burning aerosols. At longer wavelengths, the intersection point of the 0.03 line with U27 AOD dependence is harder to define due to a fair amount of scattering; however, intersection with the upper boundary of U27 AOD dependence is in the vicinity of 0.45 as well. However, it may be somewhat less than AOD (440) =0.45 due to the fact that absorption by dust is very weak at the longer wavelengths, therefore resulting in greater sensitivity to absorption, while it is much stronger at 440 nm, where absorption occurs from the iron oxides in dust.

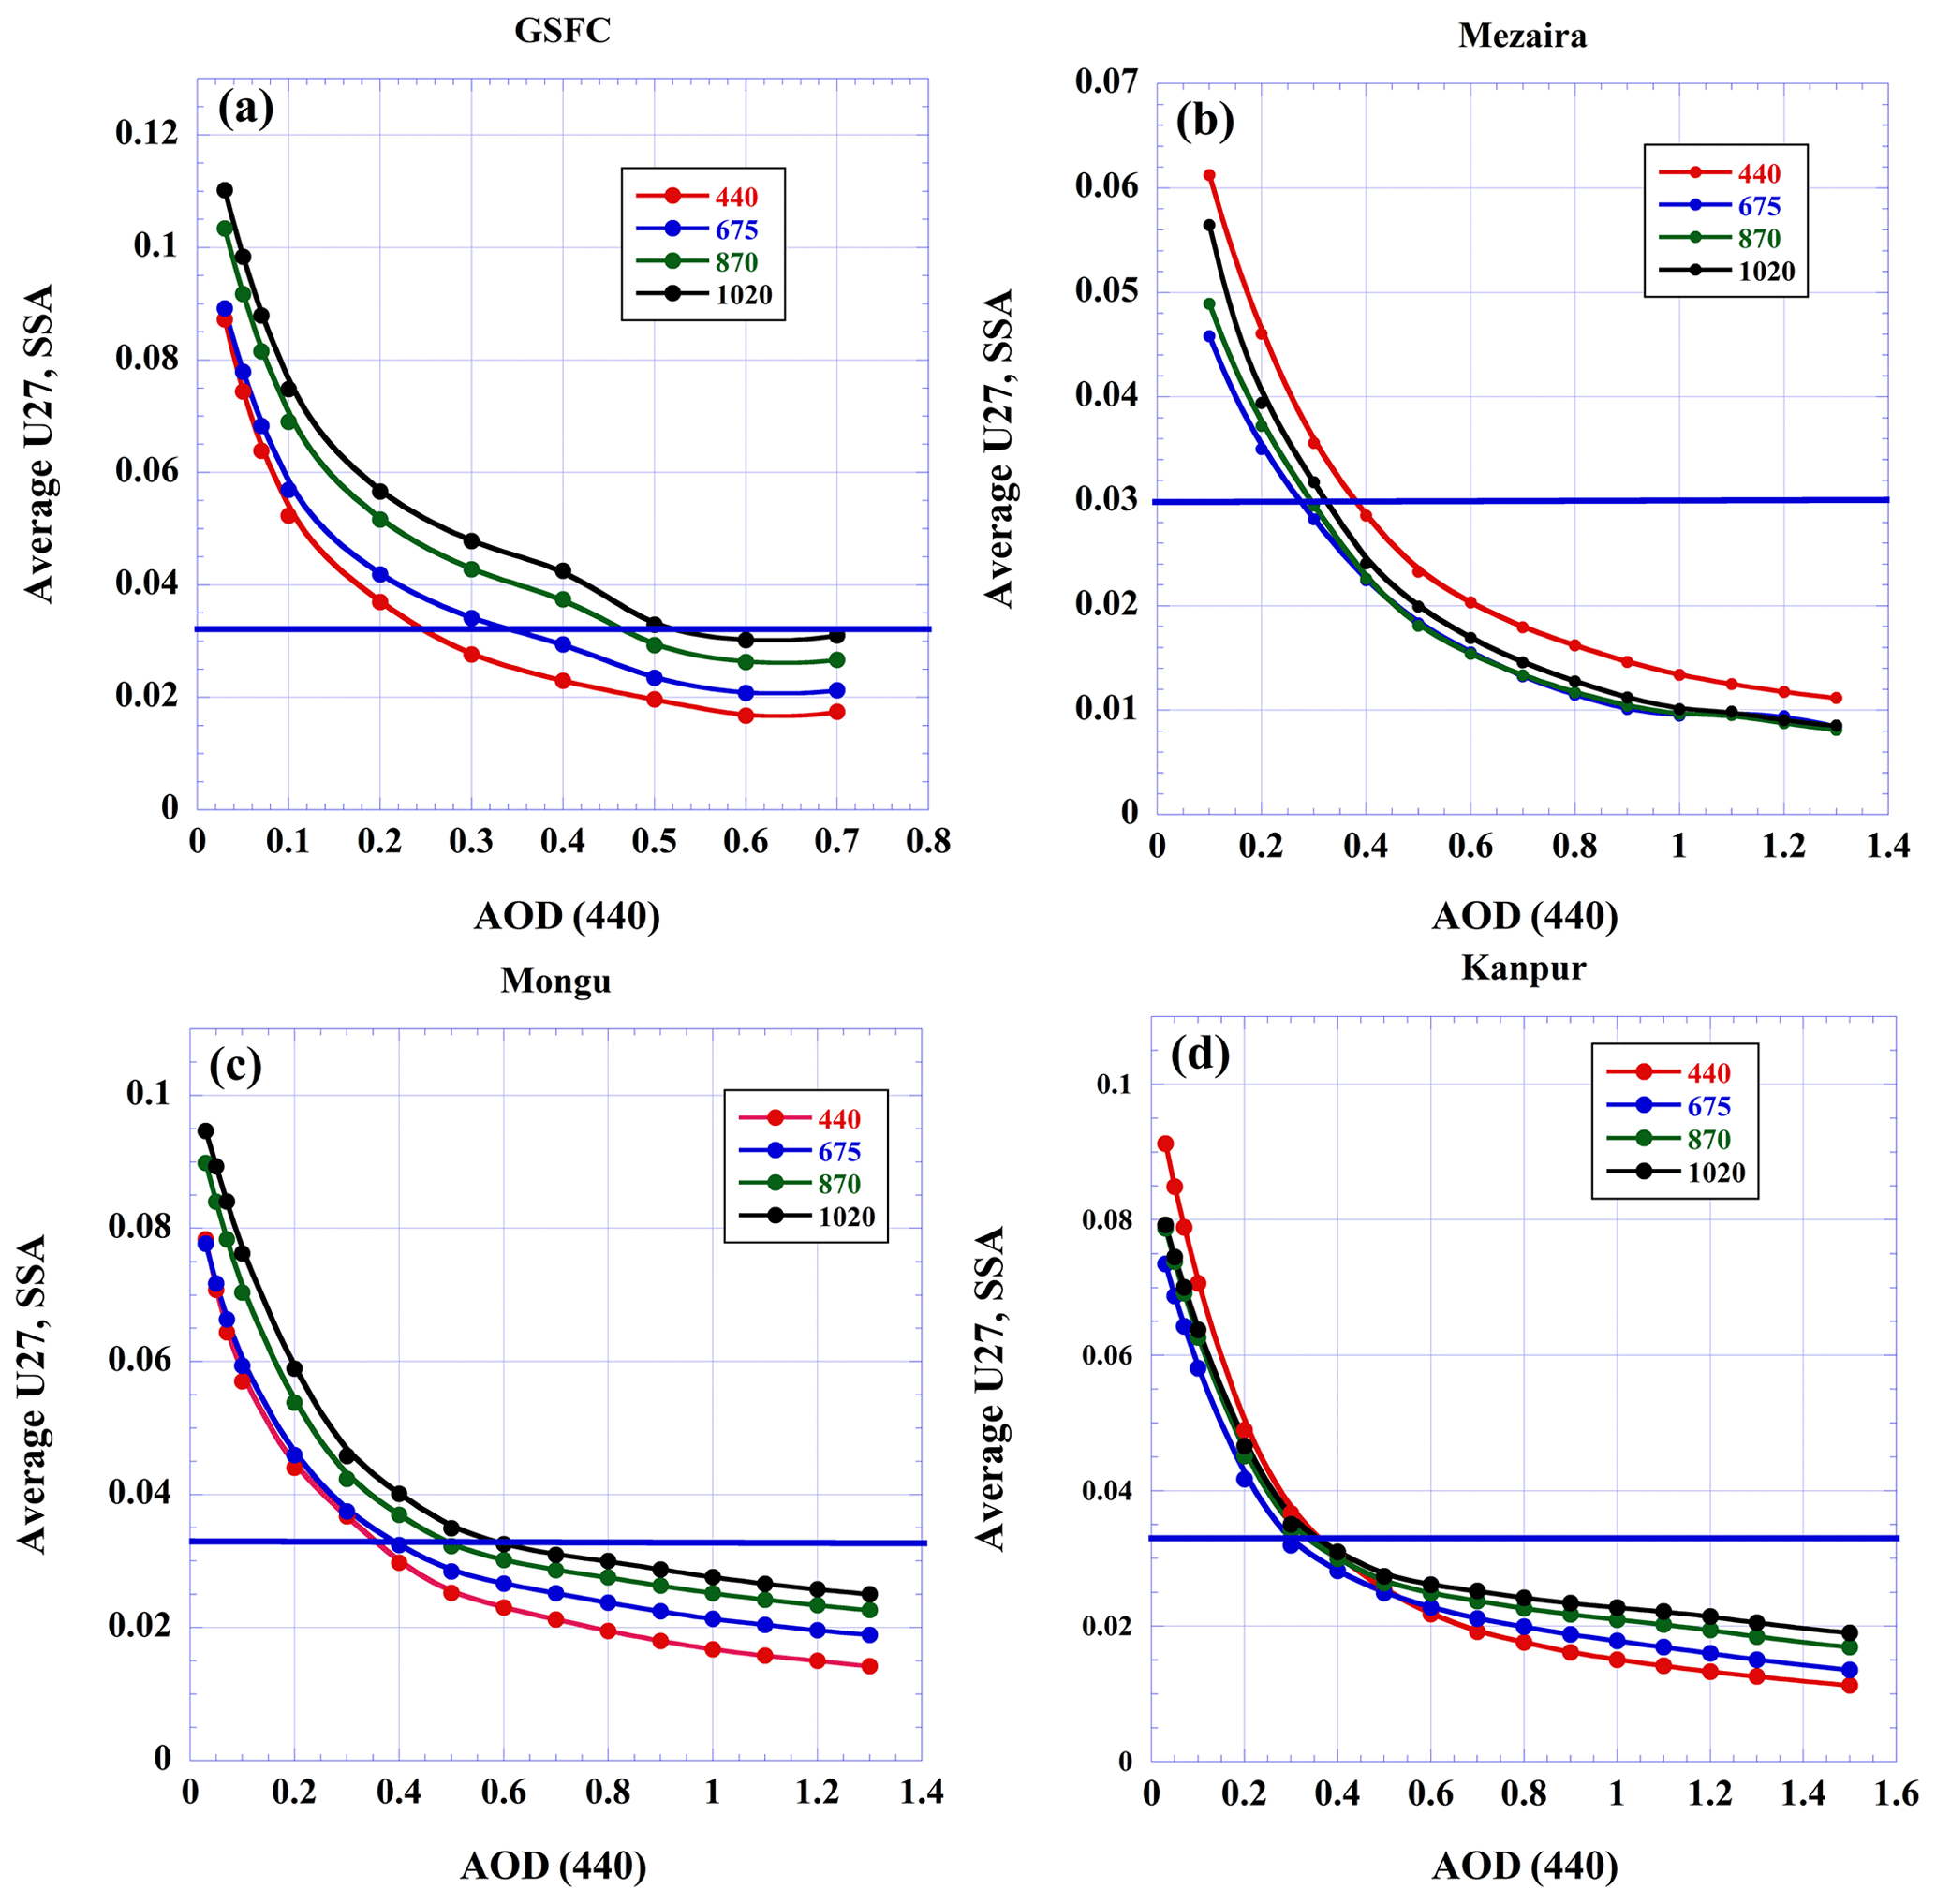
Figure 22SSA uncertainties generated by averaging over AOD bins with subsequent interpolation to the regularly spaced AOD grid: (a) GSFC, (b) Mezaira, (c) Mongu, (d) Kanpur.
The dependence of estimated retrieval uncertainties on AOD can be made more explicit by averaging the scattering of individual data points over narrow AOD bins. Following this reasoning, the U27 SSA data for each of the four representative AERONET sites were binned in AOD, with the number of bins selected in such a way as to cover the widest AOD range possible and at the same time keep the number of data points in each bin high enough for representative statistics. Then the average values for each AOD bin were calculated and the final U27 dependencies were obtained by interpolating the binned data to a regularly spaced AOD grid. Figure 22a through Fig. 22d show the resulting AOD dependencies of SSA uncertainties for each of four selected AERONET sites. The corresponding numerical data are summarized in Tables 14 through 17 for AOD (440 nm) less than 0.7. Figure 22 shows that as expected AOD averaging resulted in rather smooth AOD dependencies of U27. The graphs of Fig. 22 provide a clear visualization of the spectral dependence of SSA uncertainties by considering intersections of corresponding curves with the 0.03 uncertainty level. For fine-mode aerosols dominating both the GSFC and Mongu sites, the values of AOD corresponding to 0.03 SSA uncertainty are increasing with the wavelength, as can be seen from Fig. 22a and c. In the GSFC case, for example, the 0.03 accuracy for 1020 nm SSA is reached at AOD of ∼0.6 as compared to AOD of ∼0.3 for 440 nm SSA. For coarse-mode aerosols such as mineral dust (Mezaira site), the spectral variability of SSA uncertainty is much weaker, as is seen from the graphs of Fig. 22b. The decrease in U27 of ∼0.0085 for longer wavelengths relative to 440 nm can be explained in part by the underestimation of uncertainty due to the proximity of IRI to the inversion limit, as was previously discussed. In addition, the lower SSA uncertainties can be related to the lower dust absorption in this spectral range, as was discussed in relation to Eq. (1). The aerosol loading over Kanpur is representative of the mixture of fine-mode pollution and coarse-mode dust with dust aerosols dominating during April through June. The effect of different components of the mixture on AOD dependence of U27 is clearly seen in Fig. 22d. For example, for the AOD larger than ∼0.8 the contribution of fine-mode aerosols is dominant, resulting in clear separation of U27 values at different wavelengths. For the range of smaller AOD the dust contribution is stronger, as can be concluded from the much weaker spectral dependence of estimated SSA uncertainties. The analysis is supplemented by Table 18, which contains multiyear (1995–2019) averages of aerosol and surface characteristics at four selected AERONET sites. The following abbreviations are used in the Table 14 header: FMF stands for the fine-mode fraction of AOD, AE is the Angström exponent estimated for the (440–879) wavelength range, and SA is a surface albedo.
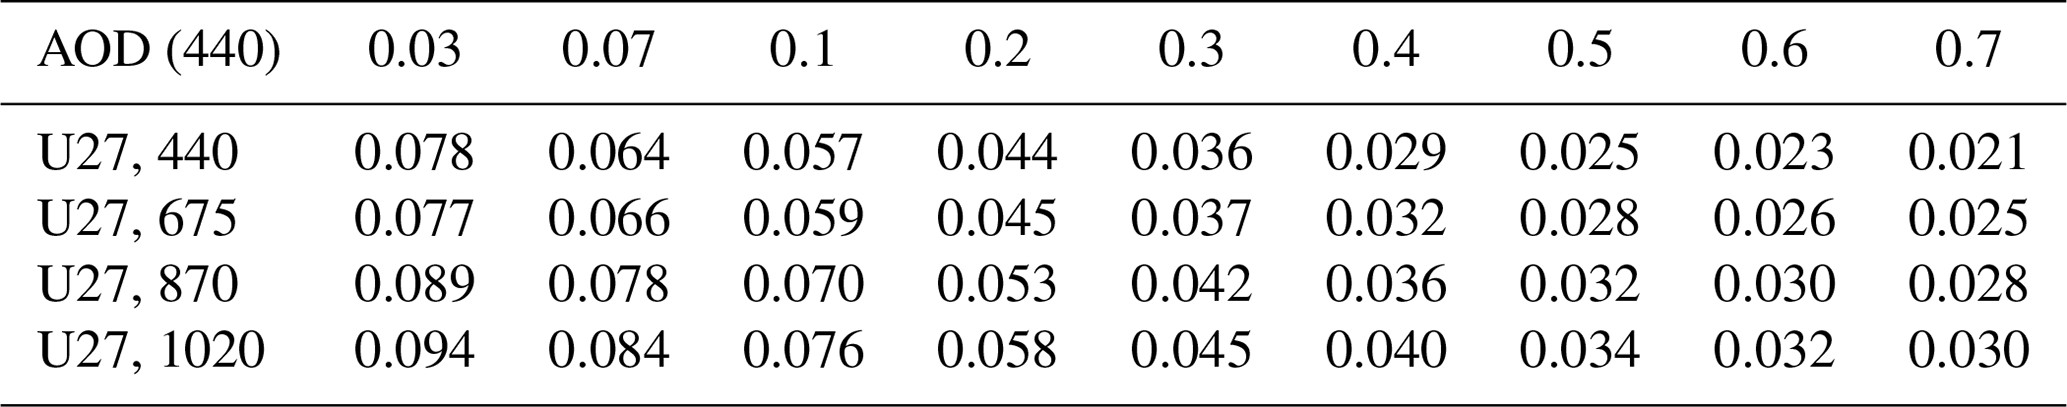
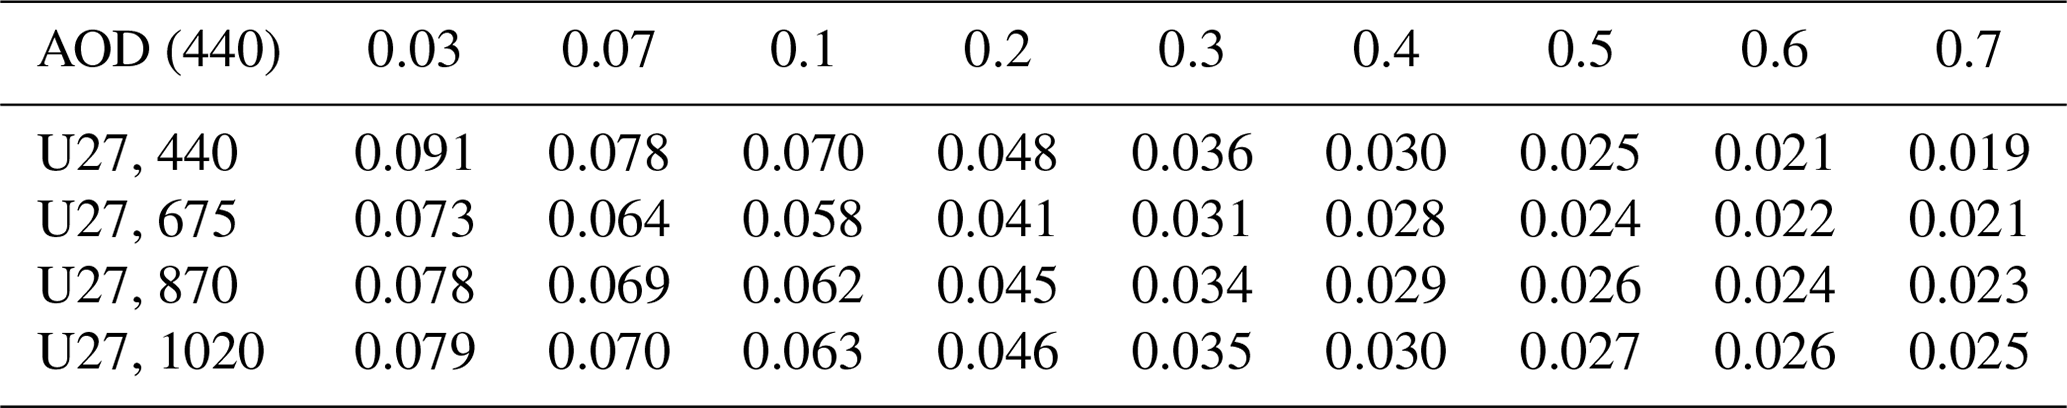
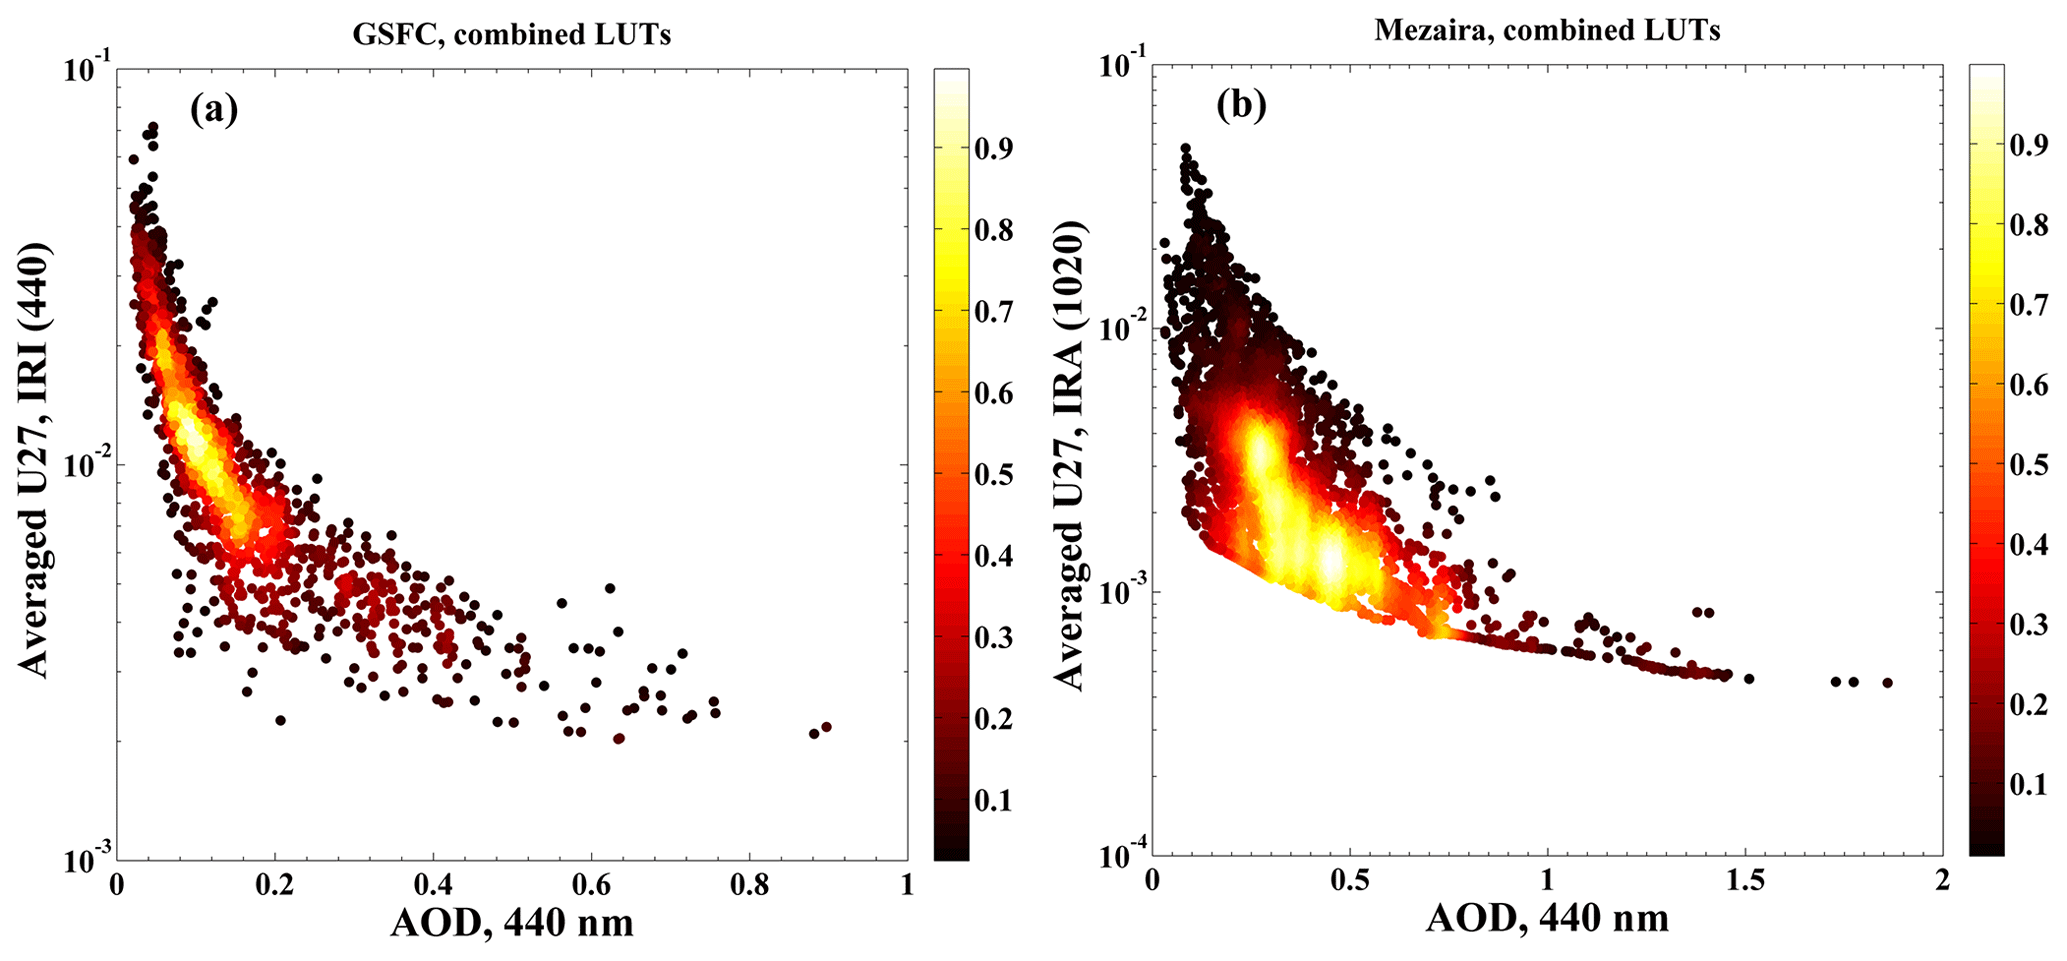
Figure 23Uncertainties of the imaginary part of refractive index estimates: (a) GSFC and (b) Mezaira.
5.4.2 Refractive index
The behaviors of the U27 uncertainty estimates for the IRI are very similar to that of SSA. Figure 23 shows examples of uncertainties for 440 nm IRI estimated at GSFC and those of 1020 nm IRI estimated at Mezaira. There is a clear similarity between AOD dependences of IRI uncertainties of Fig. 23 and AOD dependencies of uncertainties of the corresponding SSA; see Figs. 20a and 21d. The difference in the average magnitude of U27 estimates of GSFC and Mezaira is due to the very low dust absorption at 1020 nm as well as the effect of the lower boundary retrieval constraint for IRI.
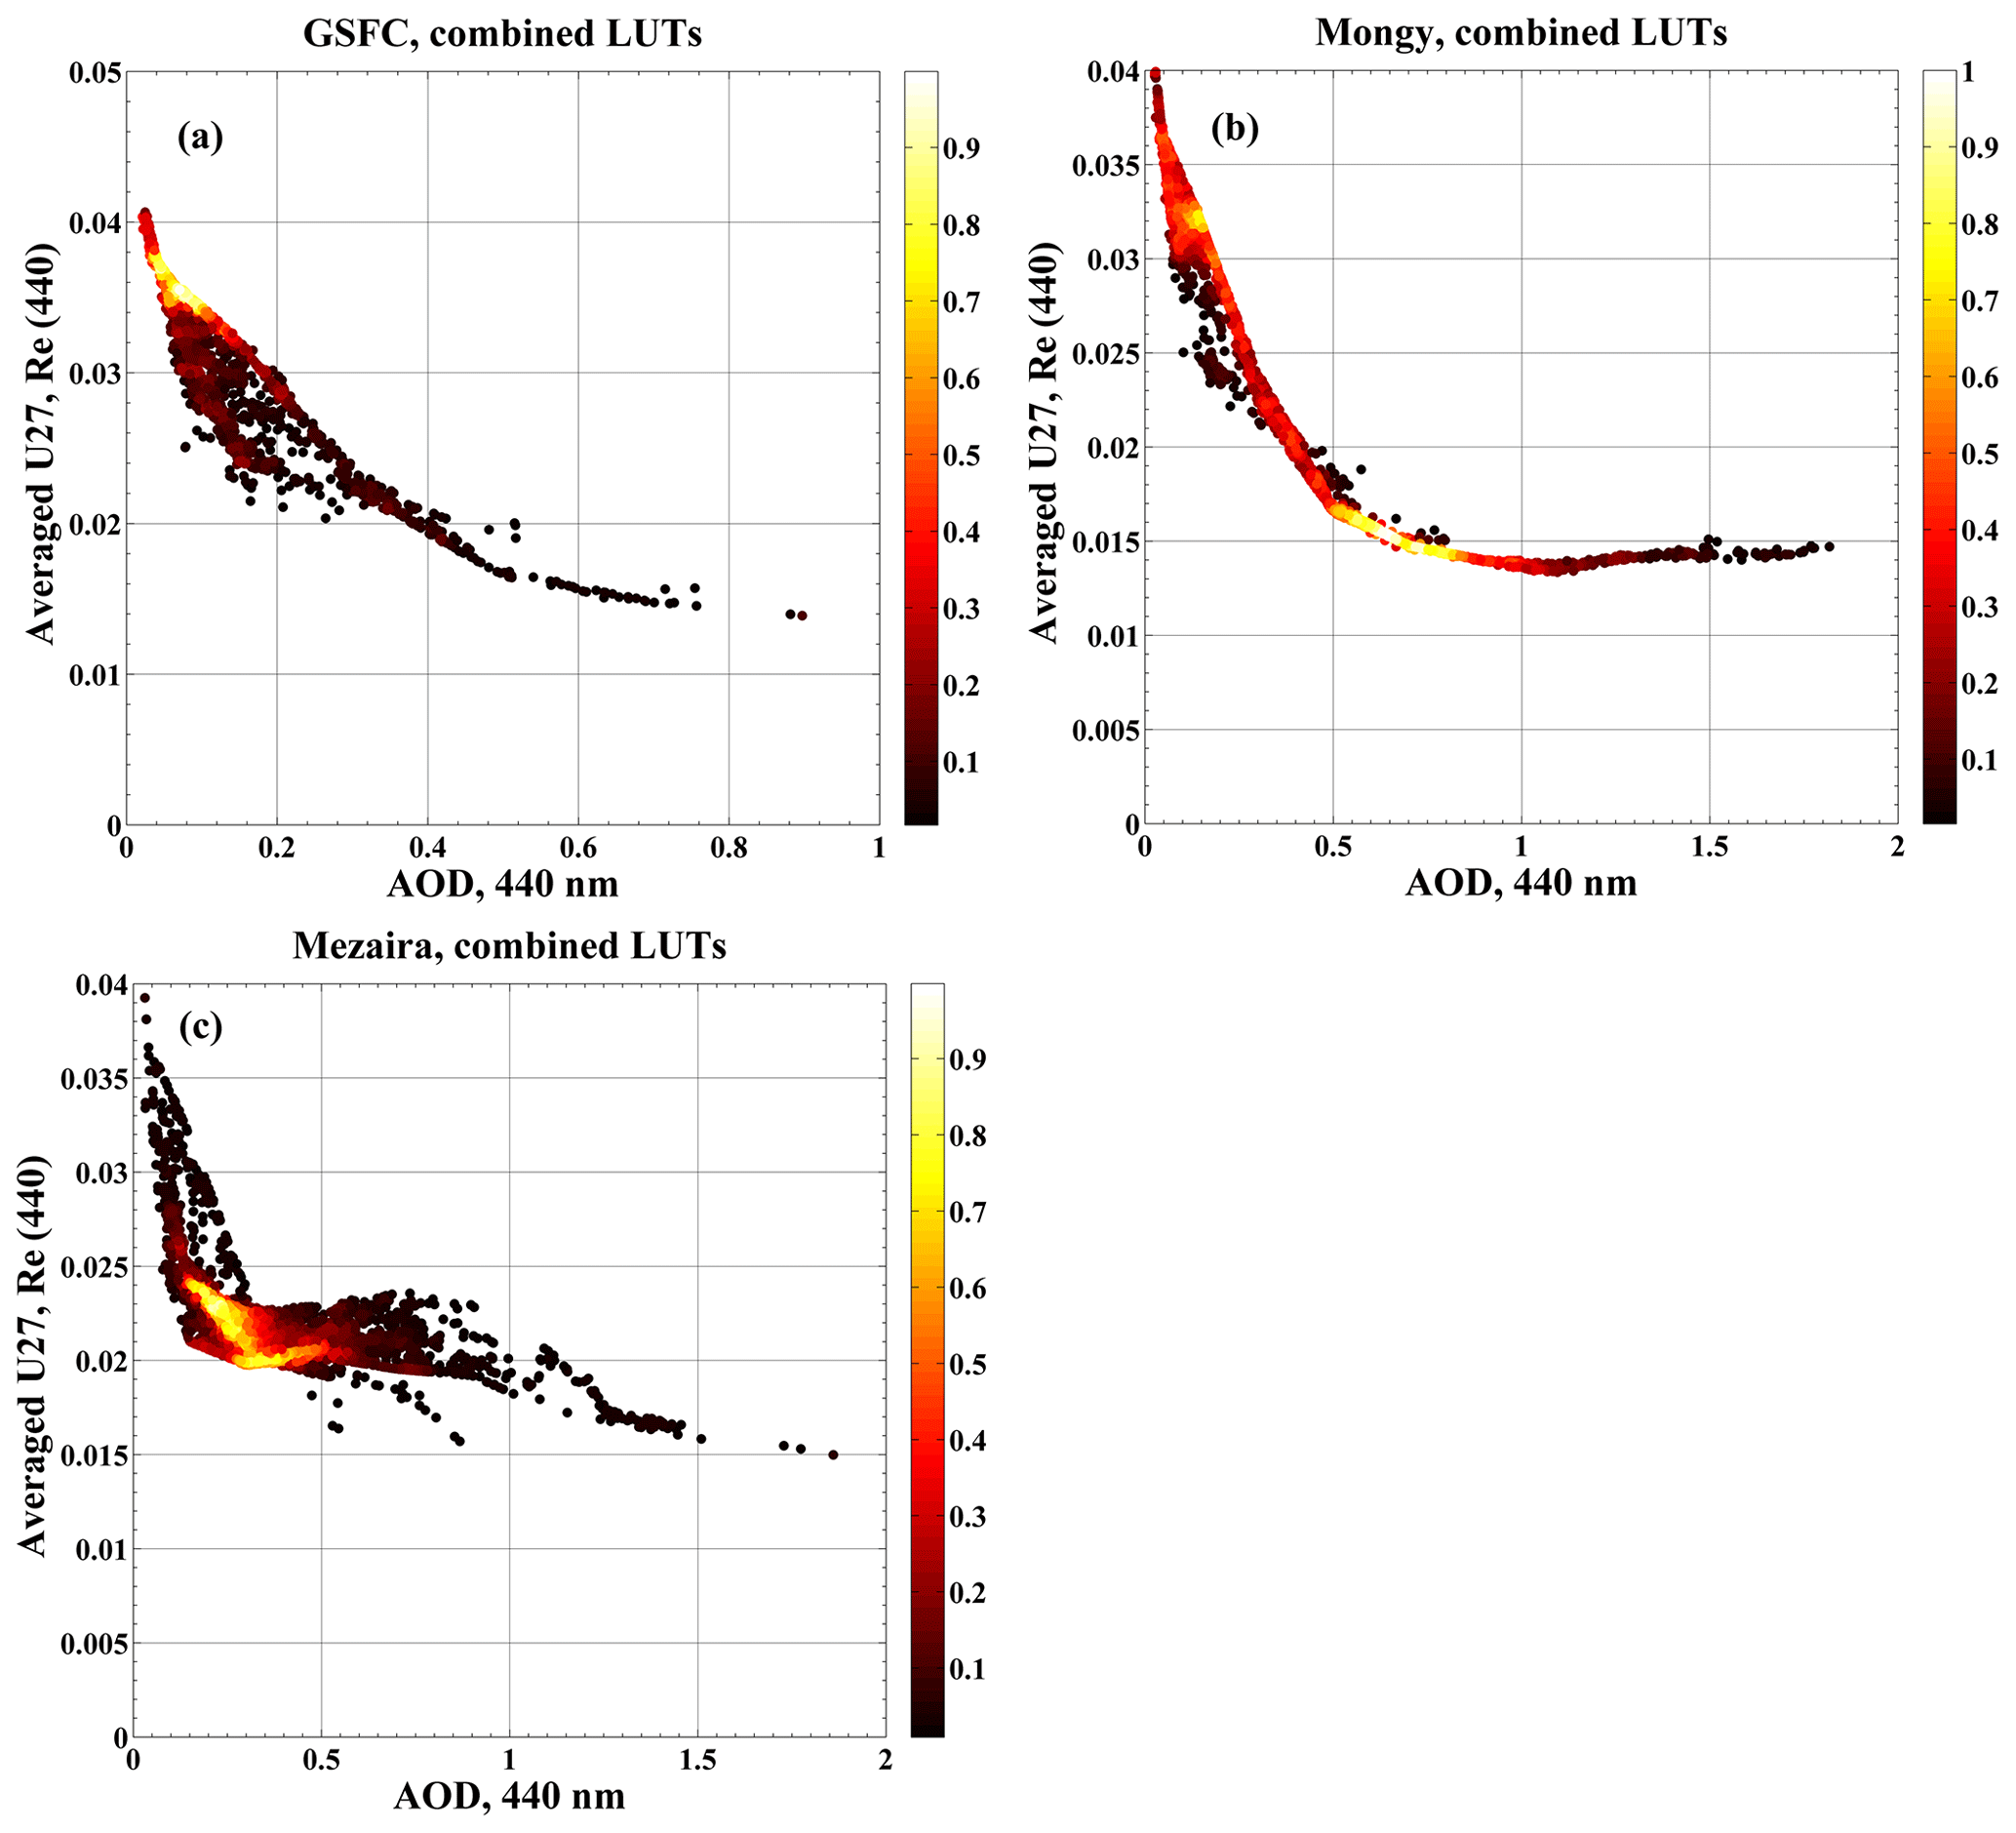
Figure 24Uncertainties of the real part of refractive index estimated at 440 nm: (a) GSFC, (b) Mongu, (c) Mezaira.
Figure 24 shows the uncertainties (by the U27 methodology) of the RRI at 440 nm estimated for the GSFC, Mongu, and Mezaira sites. The values of these uncertainties at the GSFC and Mongu sites are below 0.02 for AOD greater than 0.4 and further decrease with AOD, reaching a minimum value of ∼0.012, while the U27 estimated at Mezaira levels out at ∼0.021 for AOD greater than ∼0.30. The average U27s were calculated for the range of AOD larger than 0.5 and compared to the values reported in Dubovik et al. (2000) for different aerosol types: 0.02 (Dubovik: 0.04) for dust at Mezaira, 0.015 (Dubovik: 0.04) for biomass burning at Mongu, and 0.0175 (Dubovik: 0.025) for water soluble at GSFC. The difference in U27 estimates and uncertainties of Dubovik et al. (2000) can be explained by the different way of accounting for instrument-pointing bias. As was discussed before, V3 uncertainty estimation does not account for pointing because of its much-reduced effect due to the averaging of the left and right parts of the ALM or HYB scans. On the other hand, a pointing bias of 0.5∘ was assumed in the sensitivity analysis of Dubovik et al. (2000). This assumed value of the pointing bias is in excess of a more realistic value of 0.1∘, which was estimated by comparing the two sides of the ALM scans. Thus, an additional unrealistically large source of uncertainty was introduced in Dubovik et al. (2000), with potentially large effects on the RRI retrievals. Further analysis showed that U27 estimates are substantially lower than observed variability (standard deviations) of RRI retrievals: ∼0.05 at Mezaira, ∼0.06 at Mongu, and ∼0.049 at GSFC. In contrast, the U27 estimated for SSA and observed variability of SSA retrievals are more consistent.
The potential instability in the retrievals of RRI is further illustrated by the fact that the upper and lower limits imposed on RRI variability (1.33 and 1.60, respectively) are often reached especially for low AOD. The percentage values of RRI retrievals reaching 1.33 and 1.6 (in parentheses) were estimated for all three sites for two bins in 440 nm AOD: less than 0.2 and greater than 0.4. The estimates for smaller AOD bin show that RRI retrievals hit the 1.6 boundary more often than that of 1.33: 1.6 % (13.7 %) for Mezaira, 3.1 % (11.1 %) for GSFC, and 2.2 % (18.5 %) for Mongu. The corresponding estimates for larger AOD demonstrate a significant reduction in the number of boundary hits, especially that of 1.6: 0.6 % (6.8 %) for Mezaira, 2.5 % (0.9 %) for GSFC, and 0.4 % (4.3 %) for Mongu.
Table 18Multiyear (1995–2019) averages of aerosol and surface characteristics at four AERONET sites selected for analysis of uncertainties in retrieved aerosol parameters. The abbreviations FMF, AE and SA stand for the fine-mode fraction of AOD, Angström exponent estimated for the (440–879) wavelength range, and surface albedo, respectively.
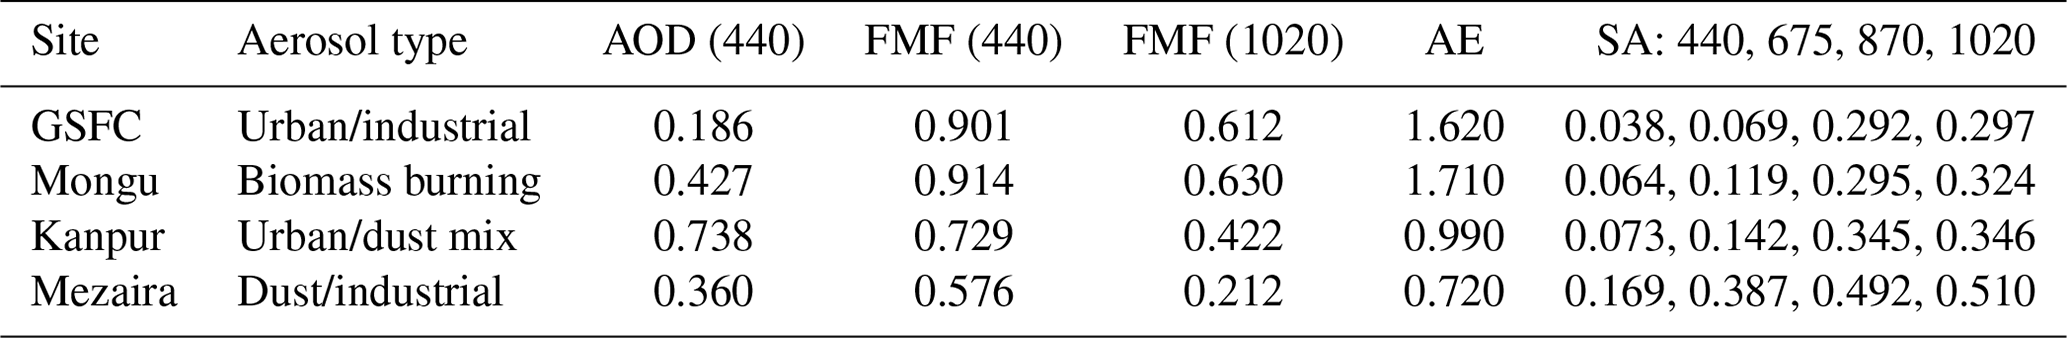
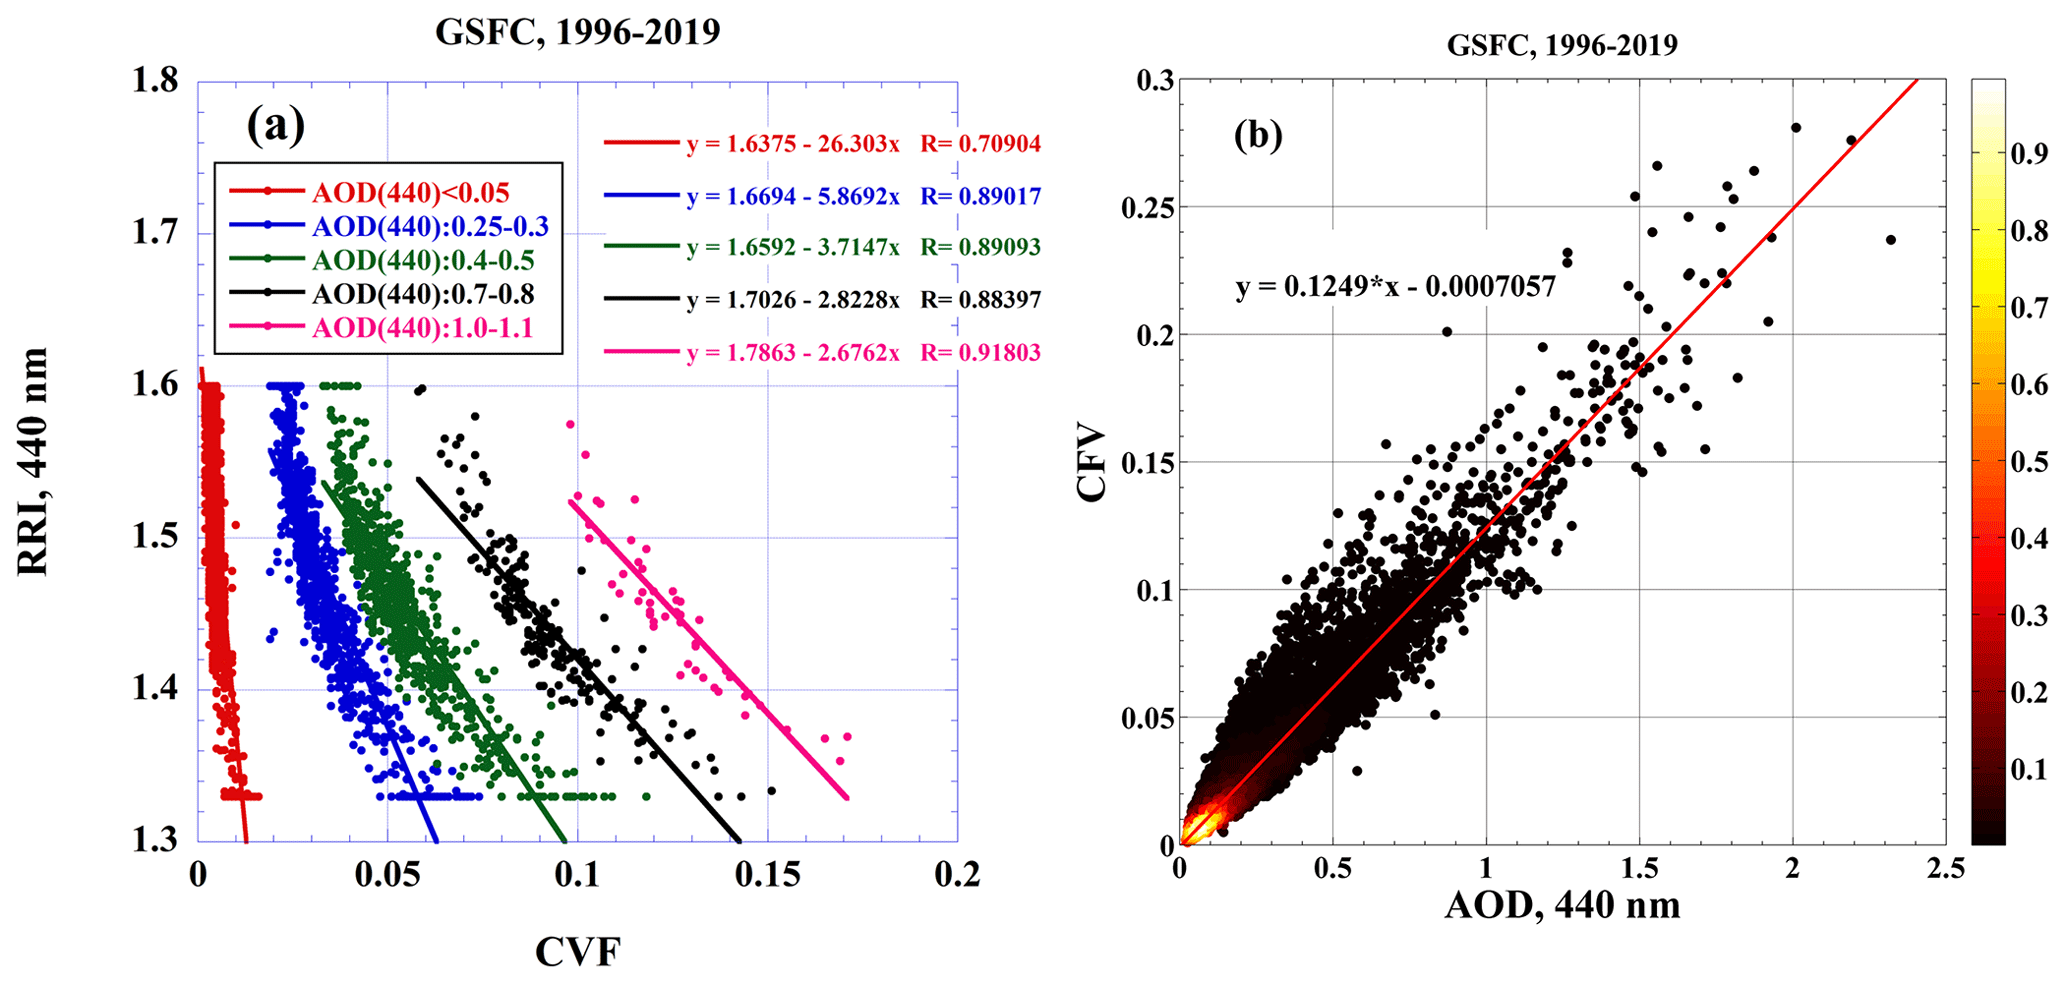
Figure 25Analysis of correlation between the real part of the refractive index and fine-mode concentration at the GSFC site.
The U27s estimated for RRI at longer wavelengths are very similar to those at 440 nm. The similarity between estimated uncertainties for RRI at different wavelengths can be explained by the fact that spectrally RRI retrievals are not independent but are related through the smoothness constraints (e.g., Dubovik and King, 2000).
The apparent underestimation of RRI uncertainties by U27 can be related to additional factors other than uncertainties in inversion inputs which can influence retrieval variability. Figure 25a shows the dependence of original retrievals of RRI at 440 nm on the concentration volume of the fine mode (CVF) derived from the retrieved particle size distribution for the GSFC site data (nearly all fine-mode-dominated). For this plot the data were sampled into five AOD bins, which resulted in separation of the RRI dependence on CVF into five distinct branches with a rather strong correlation between RRI and CVF. Each branch is well approximated by linear dependence, with regression equations and correlation coefficients displayed in the figure. As is seen, the absolute values of the slopes of linear regressions decrease as AOD increases. Simultaneously, the range of the variability of CVF increases and that of RRI decreases as AOD increases. The strong variability of RRI retrievals for narrow AOD bins can be explained by the lack of sufficient measurement sensitivity to this parameter to provide stable retrievals under somewhat noisy measurement conditions at times. In particular, AOD measurements do not constrain RRI individually but in conjunction with CVF, as it follows from results of Fig. 25a. As RRI is changing, it affects extinction optical depth through the change in aerosol scattering. However, to keep modeled extinction optical depth consistent with the AOD measurements, CVF is adjusted by the inversion code to compensate for the change caused by RRI. Thus, decreases in RRI are compensated by increases in CVF and vice versa in such a way as to reproduce the total aerosol scattering. Therefore, accurate retrievals of SSA are possible despite the variability of individual RRI and CVF retrievals, since total aerosol scattering is accurately described by a combination of these two parameters. The effect of the correlated behavior of RRI and CVF retrievals can be seen in Fig. 25b, where it manifests itself in the scattering of CVF retrievals for the narrow AOD bins. Similar analysis was done for the Mongu site, which is also dominated by fine-mode aerosol. As in the GSFC case the RRI versus CVF anti-correlation was observed, which allows one to extend the above conclusion to all fine-mode-dominated aerosols.
In the case of dust aerosols, AOD measurements do not provide enough constraints for RRI retrievals due to the very small sensitivity of AOD to variability in RRI for these coarse-mode-size particles. This is a consequence of a well-known fact that the extinction efficiency factor of large particles tends to a constant limit as particle size increases (e.g., Bohren and Huffman, 1998). In both cases, fine and coarse aerosols, constraints provided by the measurements of sky radiance intensities are not sufficient to provide stable RRI retrievals under conditions of typical measurement noise. The addition of polarization measurements can increase the sensitivity to RRI, as demonstrated in Fedarenka et al. (2016). The U27s for individual inversions are estimated under the specific realization of measurement noise which equally affects the original retrieval as well as retrievals obtained by inverting perturbed input files. Thus, the U27 estimates are not sensitive to the variability of retrievals caused by slightly noisy measurement conditions and will underestimate the retrieval uncertainty for RRI due to a lack of sufficient measurement constraints. For this reason, the U27 estimates for the RRI are not reported in the AERONET database.
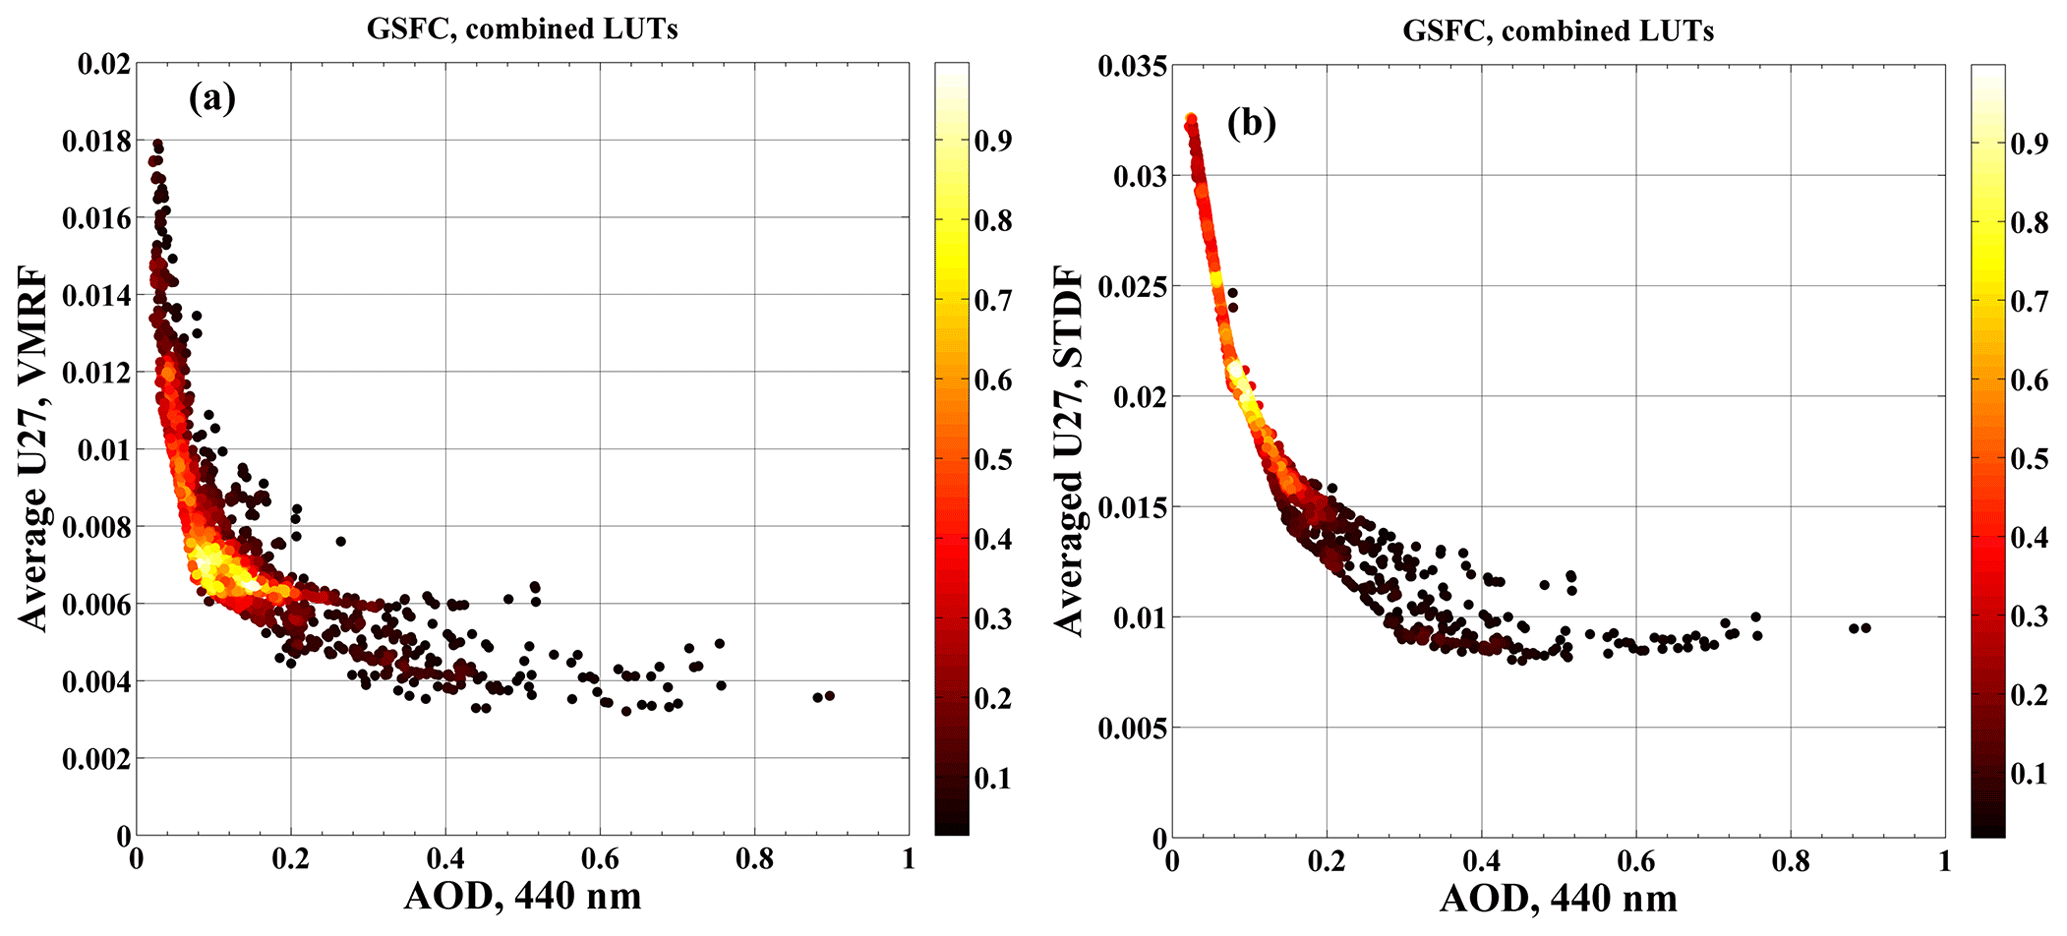
Figure 26Uncertainties for (a) volume median radius of fine mode and (b) width of size distribution for fine mode estimated at the GSFC site.
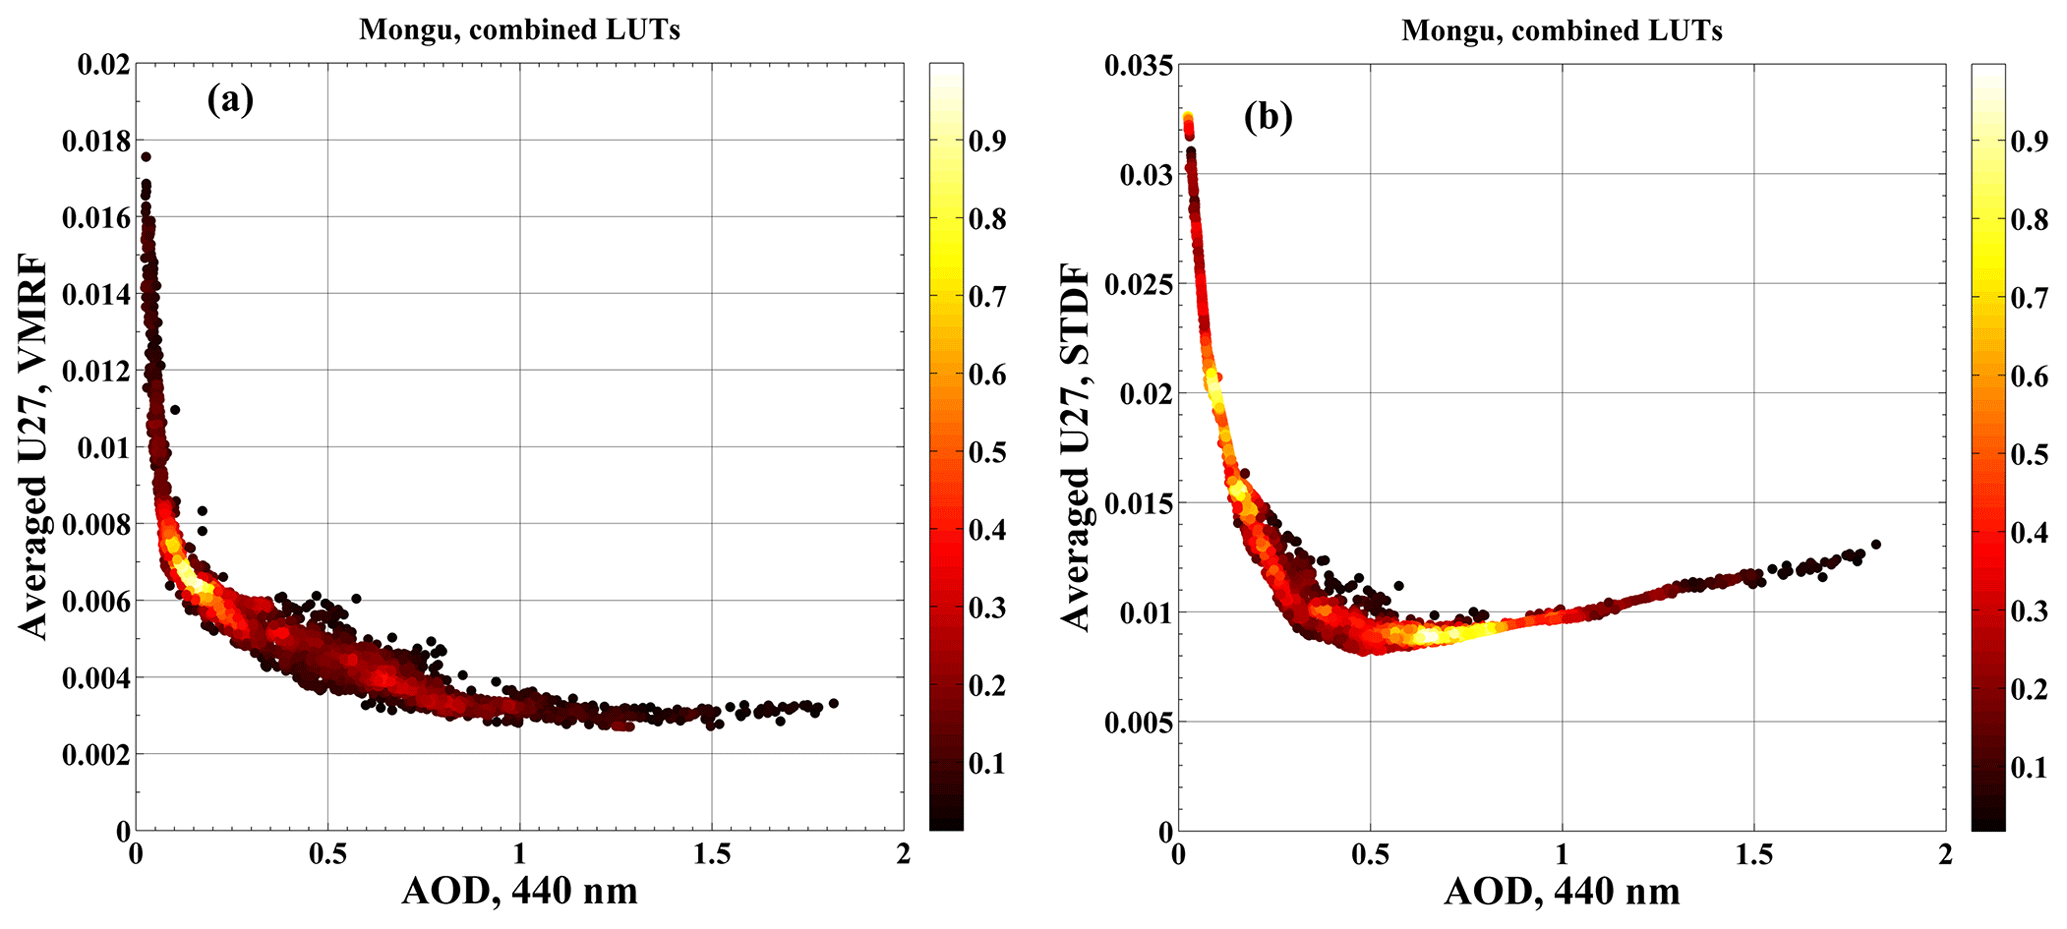
Figure 27Uncertainties for (a) volume median radius of fine mode and (b) width of size distribution for fine mode estimated at the Mongu site.
5.4.3 Size distribution
Figure 26a and b show estimated uncertainties (U27) for volume median radius for the fine mode (VMRF) and standard deviation (width) of the size distribution for the fine mode (STDF) plotted as a function of AOD for the GSFC site. Uncertainties for both parameters decrease as AOD increases, reaching ∼0.004 and ∼0.009 for VMRF and STDF, respectively, for high AOD (> 0.4 at 440 nm). Comparison of the U27 values from all L2 retrievals averaged over the entire AOD range to the variability of retrievals (in parentheses) shows that the U27 values are smaller than those of the standard deviation of retrieval variability: 0.008 (0.03) for VMRF and 0.02 (0.06) for STDF. This difference can be explained by the actual variability of VMRF and STDF due to the different levels of humidification growth, cloud processing and/or particle aging (Eck et al., 2012). Averaging over an AOD range greater than 0.4 results in decreasing U27 values but does not produce significant changes in the standard deviation of retrievals: 0.0043 (0.032) for VMRF and 0.009 (0.056) for STDF. The VMRF and STDF uncertainties (U27) estimated at the Mongu site are shown in Fig. 27a and b, respectively, and exhibit similar behavior with AOD to the uncertainties estimated at the GSFC site. Similarly, the U27 values averaged over the entire AOD range are significantly smaller than the standard deviations of retrieval variability: 0.0058 (0.0207) for VMRF and 0.0138 (0.0616) for STDF. Averaging over AOD greater than 0.4 reduces both U27 and standard deviation values: 0.0039 (0.0118) for VMRF and 0.0094 (0.0416) for STDF. Larger values of standard deviation at larger AOD can be explained by natural variability in aerosol size. For the Mongu site the average value of the Angström exponent (440–870 nm) is ∼1.67 over the entire AOD range, with a standard deviation of ∼0.24. We conclude that variability in aerosol size can contribute to the observed variability of aerosol retrievals (Eck et al., 2001, 2013).
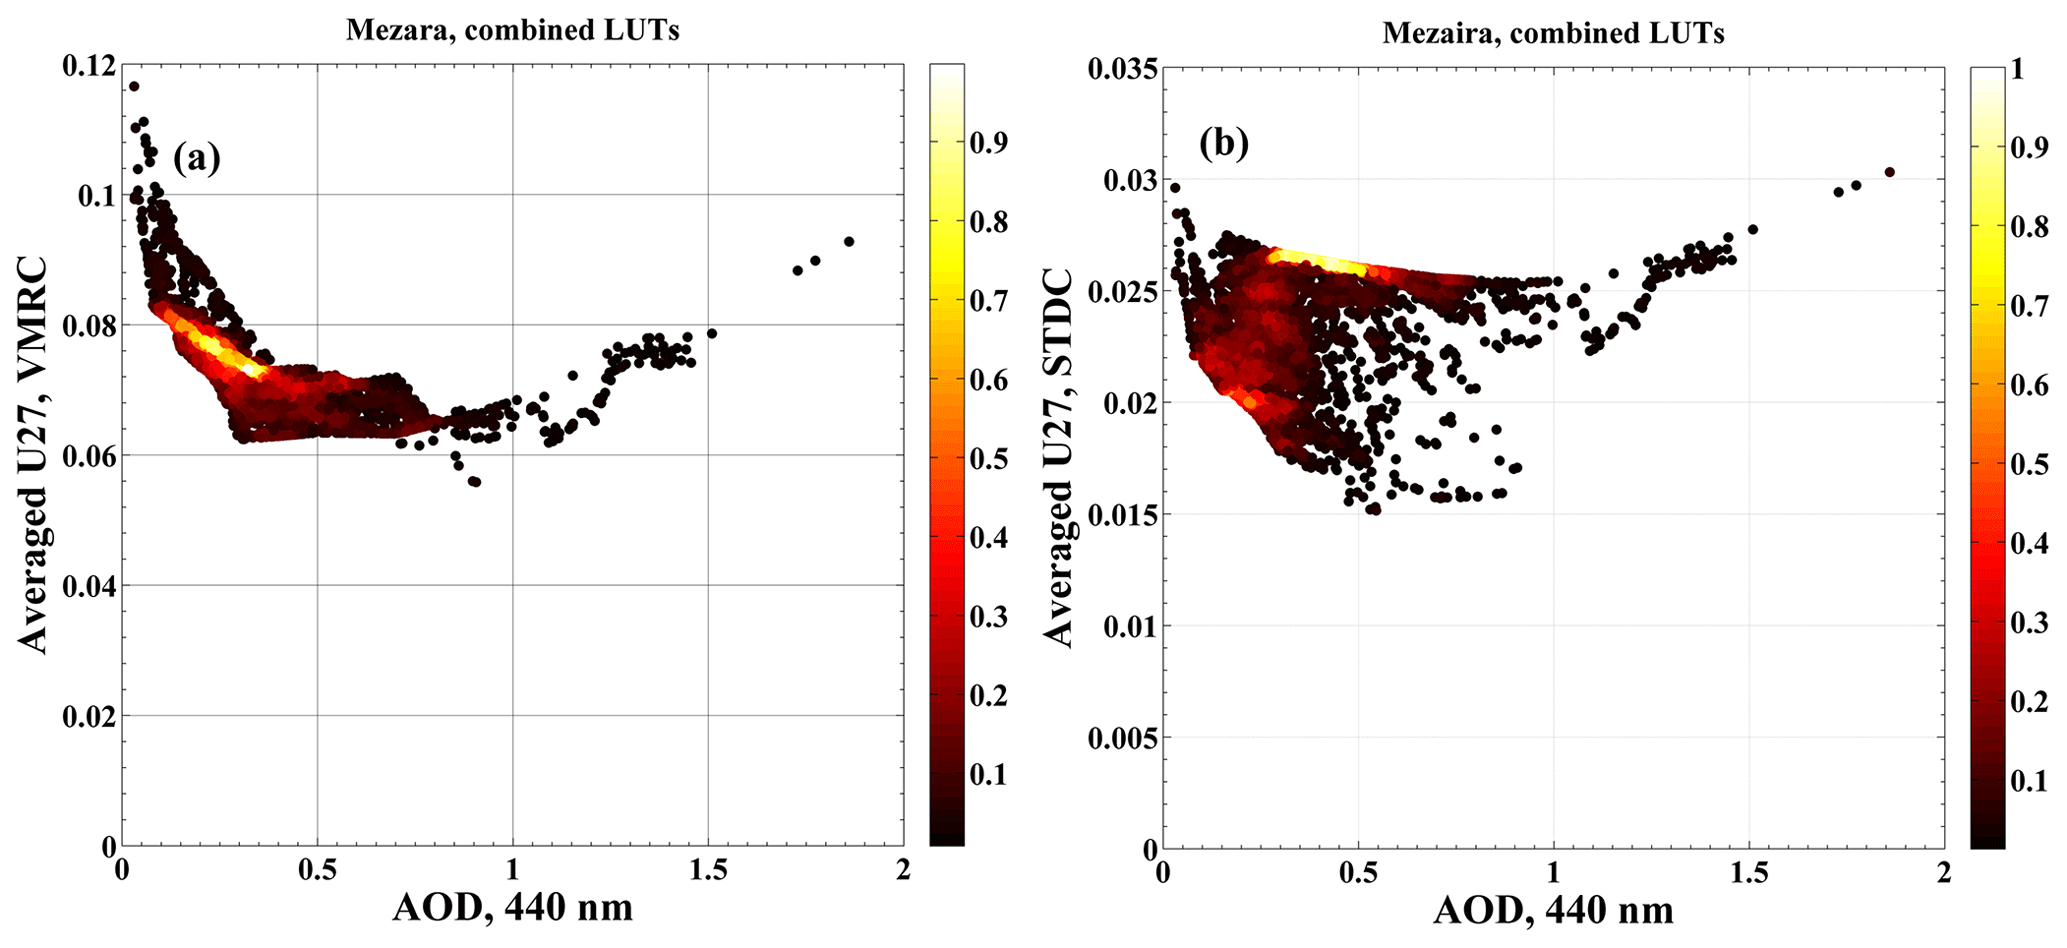
Figure 28Uncertainties for (a) volume median radius of coarse mode and (b) width of size distribution for coarse mode estimated at the Mezaira site.
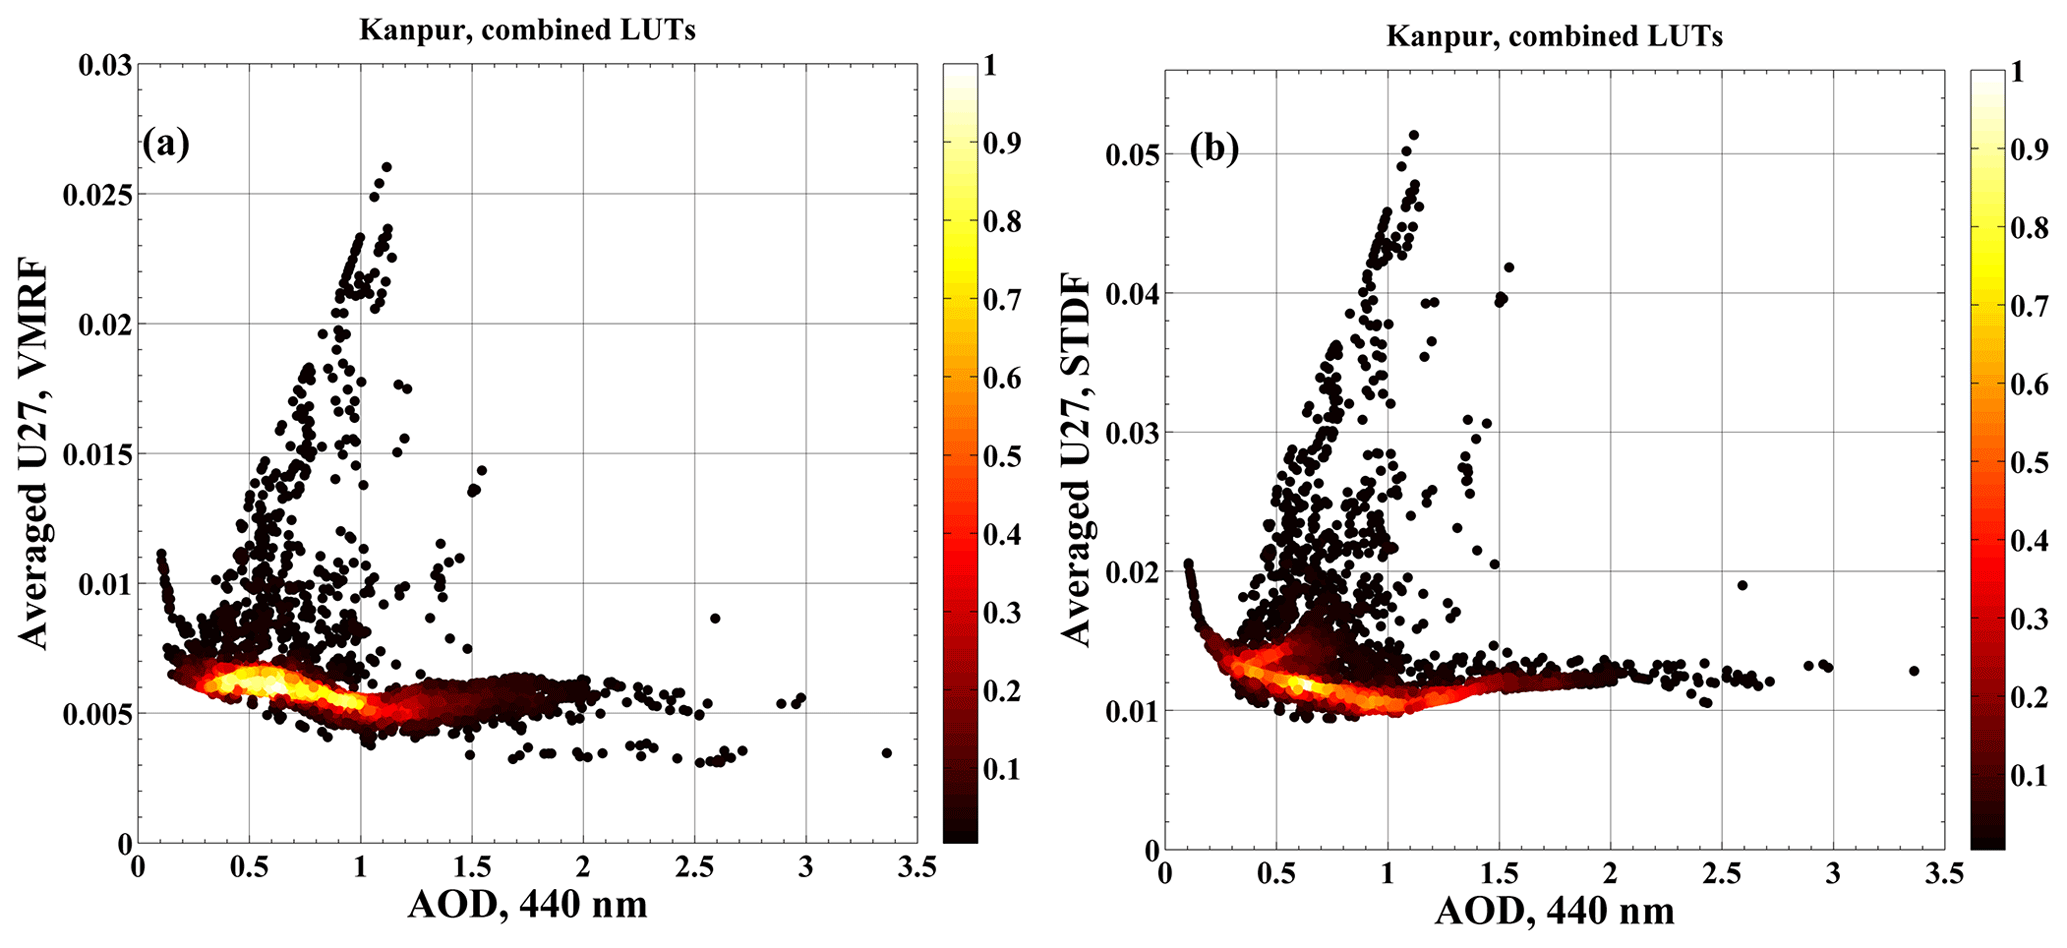
Figure 29Uncertainties for (a) volume median radius of fine mode and (b) width of size distribution for fine mode estimated at the Kanpur site.
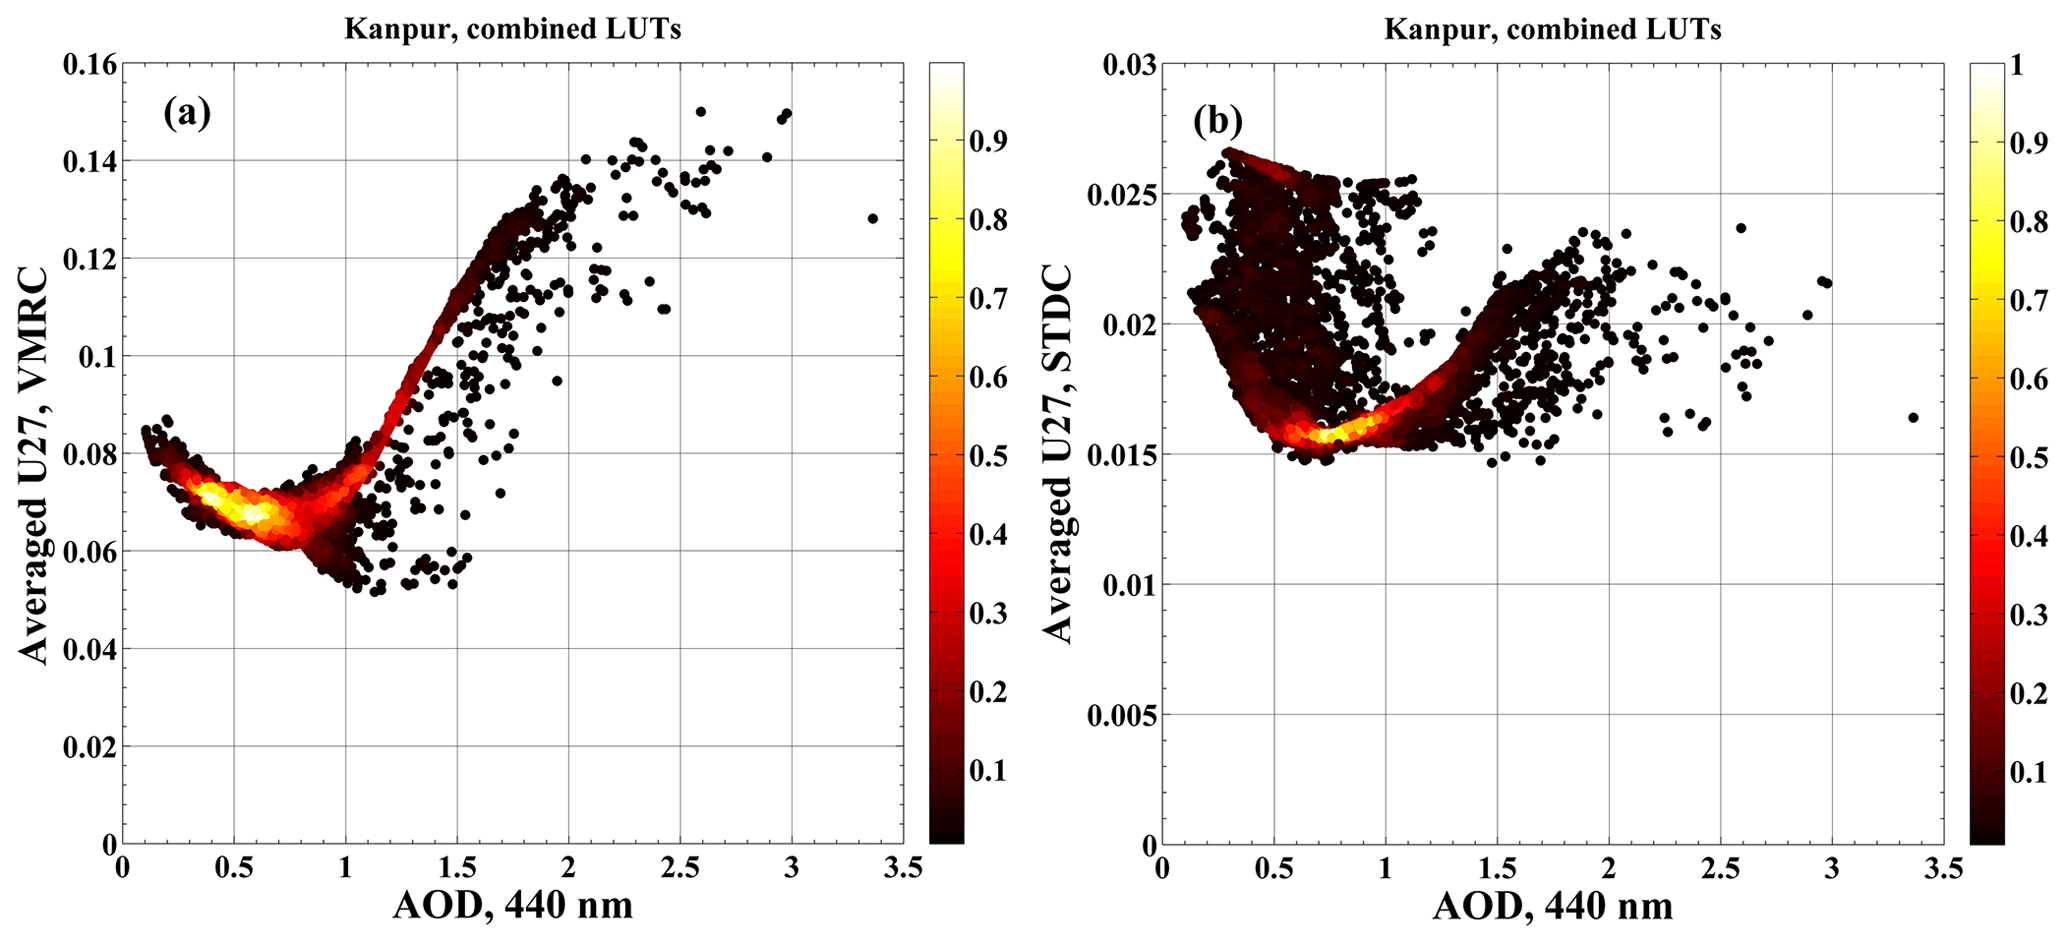
Figure 30Uncertainties for (a) volume median radius of coarse mode and (b) width of size distribution for coarse mode estimated at the Kanpur site.
Uncertainties (U27) in the size distribution parameters for the Mezaira site are presented in Fig. 28 for volume median radius and size distribution standard deviation for coarse mode (VMRC and STDC) since this is a desert-dust-dominated location. The VMRC dependence on AOD follows the pattern similar to that of fine-mode aerosols, with U27 values averaged over the entire AOD range being significantly smaller than standard deviations of L2 retrieval variability: 0.073 (0.356) and 0.068 (0.356) for averaging over AODs larger than 0.4. The ratio of VMRC U27 to the standard deviation of VMRC retrievals averaged over 440 nm AOD greater than 0.4 is ∼3.2 %. A significant amount of scattering can be seen from Fig. 28b for STDC uncertainties for AOD smaller than 0.5. This can be attributed to the presence of a significant fraction of smaller particles for AOD smaller than 0.5, for which the coarse mode is not well defined. This also partly explains the observed larger variability in retrieved size distribution parameters at low AOD.
For the Kanpur site, the U27 estimates of uncertainty for size distribution parameters are presented for both fine and coarse modes in Figs. 29 and 30, respectively. As is shown in Fig. 29, the U27 exhibits two populations, with one displaying a strong increase in U27 values between AOD values of 0.5 and 1.0. This increase can be explained by the presence of dust aerosols with a strong coarse mode for which therefore the fine-mode AOD is relatively low, thereby providing low information content for the fine mode in the retrieval which results in greater sensitivity to the uncertainties in the inversion inputs. Similarly, the U27 increase for a coarse-mode radius shown in Fig. 30 for AOD larger than 1 is related to the domination of fine-mode aerosol with relatively low coarse-mode AOD and therefore weak signal in the measurements attributed to the coarse mode. The U27 values averaged over the entire AOD range and for AOD larger than 0.4 are very close to each other and have the following values for the average of the entire AOD range, along with standard deviations of L2 retrieval variability: 0.0063 (0.0465) for VMRF, 0.013 (0.066) for STDF, 0.0753 (0.405) for VMRC, and 0.0187 (0.0538) for STDC.
The changes and additions to the V3 aerosol retrieval algorithm over that of V2 are presented and discussed. They include a new polarized radiative transfer code, SORD, which replaced the scalar code of V2, detailed characterization of gas absorption by adding NO2 and H2O to specify total gas absorption in the atmospheric column, specification of vertical profiles of all the atmospheric species, new BRDF parameters for land sites adopted from the MODIS BRDF/Albedo product, a new version of the extraterrestrial solar flux spectrum, and new temperature correction procedures of both AOD and sky measurements. The hybrid inversion processing is introduced and the uncertainty product (U27) is provided for specific inversion products.
The potential effect of each change in V3 on aerosol retrievals is analyzed. It is shown that desert BRDF of V3 is less anisotropic than that of V2, sometimes resulting in large differences in surface albedo between the two versions. The effect is important at longer wavelengths and especially at high SZA and can adversely affect the desert dust SSA retrievals at 675, 870, and 1020 nm channels. For non-desert sites the agreement in surface reflectance between V2 and V3 is reasonable. The comparison between the extraterrestrial solar fluxes of V2 and V3 revealed an anomalously large relative difference of ∼3 % at 675 nm which potentially affects the 675 nm SSA retrievals for all aerosol types. Also, it is demonstrated that new temperature correction procedures can substantially affect normalized sky radiances for instruments using older models of filters.
The combined effects of the above factors on retrievals of SSA were analyzed in a case study for 25 August 2004 at Hamim, which is a desert site in the United Arab Emirates. Analysis was done by making sequential changes in input files starting from V2 inputs and observing corresponding changes in retrieved SSA values. It was shown that the 440 nm SSA retrievals were primarily affected by the new temperature correction procedure due to similarity of V3 BRDF and that of V2 and a smaller than 1 % difference in extraterrestrial solar flux. The 675 nm SSA retrievals are influenced by the extraterrestrial solar flux and BRDF effects which were additive, and the 870 nm SSA changes were almost solely due to the changes in BRDF, with very low temperature sensitivity at this channel and an extraterrestrial solar flux difference close to zero. For the 1020 nm channel SSA retrievals are predominantly impacted by temperature correction and BRDF. These results, while derived from one case study only, could be used as a general guideline in analyzing SSA retrievals in some desert environments.
Operational almucantar retrievals of V2 versus V3 were compared for four AERONET sites: GSFC, Mezaira, Mongu, and Kanpur. The results are presented as statistics (mean value and standard deviation) of the difference between aerosol parameters retrieved by the V2 and V3 retrieval algorithms. For size distribution, mean differences are compared to climatological means for each selected site and percentage values of the ratios are calculated for VMR and STD for both fine and coarse modes. In general, the percentage values vary between ∼0.1 % and ∼5.4 % for VMR and ∼0.5 % and 4 % for STD, which indicates a reasonably good agreement in size distribution retrievals. The SSA comparisons are affected by all those factors discussed earlier in relation to the case study. For example, for the desert dust site, Mezaira, the comparison shows that SSAs retrieved by V3 at longer wavelengths are systematically higher than those of V2, with the mean difference at 675 nm being the largest due to cumulative effects of both solar flux and BRDF changes. For non-dust sites the main discrepancy is between 675 nm SSA retrievals due to extraterrestrial solar flux difference. The mean SSA differences at 675 nm, however, are very different for low- and high-absorbing aerosols, for example, 0.0007 for GSFC versus 0.01 for Mongu. This is explained by the lower sensitivity to a bias in aerosol scattering optical depth by more weakly absorbing aerosols.
A new sky radiance angular distribution measurement scan, called the hybrid (HYB), is introduced and discussed. The HYB combines scans in two different planes to maximize the range of measured scattering angles while also achieving scan symmetry, which aids in data quality control, especially cloud screening. The HYB scan proceeds in steps in such a way that the scattering angle monotonically increases at each step, which requires simultaneous adjustments of both view and azimuth angles. This is in contrast to ALM and PP scans, where just one of the angles is changed. It has been shown that due to the extended range of scattering angles at smaller SZAs, the HYB retrievals of SSA for dust aerosols exhibit smaller variability as a function of SZA than those of ALM. For example, the average decrease of 440 nm HYB SSA retrievals between 50∘ and 30∘ SZA is only ∼0.007, whereas in the case study for Hamim the corresponding SSA decrease for the ALM scan is ∼0.045. The SZA variability of dust SSA retrievals manifests itself as a decrease in SSA retrievals with decreasing SZA, which is explained by the SZA-dependent bias in the model describing single scattering properties of non-spherical dust aerosols. The comparison of SSA retrievals from successive HYB and ALM scans in the 50∘ to 75∘ SZA range (range of scattering angle measurements > 100∘) showed good agreement, with the differences below ∼0.005.
A new approach to estimate uncertainties in the retrieved aerosol parameters was developed. It uses variability in the inversion retrievals of aerosol parameters generated by perturbing both input measurements and auxiliary input parameters as a proxy for retrieval uncertainty. The perturbations in measurements and auxiliary inputs are due to estimates of biases in AOD, radiometric calibration uncertainty of sky radiances combined with uncertainties of solar spectral irradiance, and surface bidirectional reflectance. Each bias assumes three values: positive, negative, and zero (non-biased), and the values and signs of biases of the same type are assumed to be spectrally independent, which makes for 27 distinct combinations of perturbations to the inversion inputs. For each set of Sun photometer observations 27 inputs corresponding to these 27 combinations of biases were produced and separate inversions performed for each. The following statistics of the 27 individual inversion results were generated: average, standard deviation, and minimum and maximum values. These statistics describe the variability in retrieved aerosol parameters due to uncertainties in inversion inputs for each individual inversion. From these statistics the standard deviation (labeled U27) is used as a proxy for estimated retrieval parameter uncertainty.
Due to substantially increased computational time in running 27 inversions instead of 1, a LUT approach was designed to speed up the determination of U27 for all new observations. A climatological LUT was generated from the entire Level 2 AERONET almucantar and hybrid (∼10 % of total scans) scan database by binning U27s in AOD (440 nm), Angström exponent (AE, 440–870 nm), and SSA (440, 675, 870, 1020 nm). Using this LUT approach, U27 values for each individual new Level 2 retrieval can be obtained by interpolation using the corresponding measured and inverted combinations of AOD, AE, and SSA. There are two types of LUT. The first LUT is two-dimensional with binning in AOD and AE. This LUT is used to generate U27 for VMR, width of PSD, and asymmetry parameter. The second LUT, three-dimensional, is binned by AOD, AE, and SSA and used to obtain U27 for IRI and SSA in order to account for the effect of different absorption levels by aerosols with overlapping AE ranges, e.g., pollution and smoke aerosols. To prevent underestimation of U27 due to retrieved aerosol parameters hitting a priori boundaries set up by the inversion code, the second 3D LUT was generated from a subset of U27s for only those individual inversions when no boundary hits were detected for any of the retrieved parameters. This LUT is used for obtaining the unbiased estimates of uncertainty in situations when the effect of boundary hitting by retrievals on U27 is substantial.
The LUT approach was tested by generating U27 for aerosol retrievals at four selected AERONET sites, GSFC, Mezaira, Kanpur, and Mongu (representing differing aerosol types), and analyzing dependencies of U27 on 440 nm AOD. For SSA, it is found that U27 estimates are typically consistent with uncertainties reported in Dubovik et al. (2000). For example, the 440 nm AOD values corresponding to the V2 upper boundary for 440 nm SSA uncertainty (0.03) are close to those of Dubovik et al. (2000) (in parentheses): 0.3 (0.2) at GSFC and 0.45 (0.5) at Mezaira. For longer wavelengths, the 0.03 uncertainty is reached at higher 440 nm AODs for fine-mode aerosols, due to significantly lower AOD at longer wavelengths, and at similar AOD for dust, due to weak wavelength dependence of AOD. The smoothed dependencies of SSA uncertainties on 440 nm AOD for selected AERONET sites were generated by averaging of U27 over narrow AOD bins. The resulting data are tabulated for each site.
The U27s estimated for RRI are smaller than those of Dubovik et al. (2000) and significantly smaller than the observed variability of operational retrievals. The difference in U27 estimates and uncertainties of Dubovik et al. (2000) is explained by differences in estimating the magnitude of instrument-pointing bias. The U27 estimates do not account for pointing because of analysis showing small pointing bias plus its much reduced effect due to the averaging of the left and right parts of the ALM or HYB scans, while an unrealistically large pointing bias of 0.5∘ was assumed in the sensitivity analysis of Dubovik et al. (2000). It is shown that U27 underestimates RRI uncertainty due to insufficient measurement constraints, when polarization measurements are not available. The effect of variability in RRI on aerosol scattering for fine-mode aerosols is partially counterbalanced by variability in volume concentration, which is anti-correlated with RRI. This allows accurate reproduction of aerosol scattering and correspondingly accurate retrieval of SSA while resulting in significant uncertainty in RRI and fine volume concentration. For dust aerosols AOD is not sensitive to RRI due to asymptotic behavior of extinction and scattering by large aerosol particles. Thus, the U27s of RRI estimates are not sensitive to the variability of retrievals caused by noisy measurement conditions and will underestimate the retrieval uncertainty for RRI due to a lack of sufficient measurement constraints. For this reason, the U27 estimates for the RRI are not reported in the AERONET database.
The U27 estimates for size distribution (VMR and STD) averaged over the entire AOD range are compared to the variability of operational retrievals. In general, the averaged U27s are smaller than standard deviations of retrieval variability for both VMR and STD. The difference can be explained by natural variability of aerosol size distribution at selected sites. The estimates of uncertainty (U27) in size distribution VMR and STD parameters are relatively small even for low AOD; therefore, these parameters are designated as Level 2 quality for nearly all AERONET retrievals, when AOD at 440 nm > 0.02.
As of now the entire AERONET database is reprocessed using the V3 aerosol retrieval algorithm. The Level 2 U27 estimates are available on the AERONET website (https://aeronet.gsfc.nasa.gov/cgi-bin/webtool_inv_v3, last access: 8 June 2020) for each AERONET site. The number of new CIMEL Model-T instruments that can take measurements in the HYB protocol is steadily increasing.
Version 3 inversion products, including estimates of retrieval uncertainty, are available from the AERONET website (https://aeronet.gsfc.nasa.gov/cgi-bin/webtool_inv_v3?stage=3®ion=United_States_East&state=Maryland&site=GSFC&place_code=10&if_polarized=0, last access: 15 June 2020, AERONET, 2020), which provides these data freely to the public. Data may be acquired by utilizing several download mechanisms, including site-by-site download tools and web service options for near-real-time data acquisition.
The development of V3 aerosol retrieval algorithm and retrieval products is the result of a joint effort of the members of the AERONET team (listed as ASi, BNH, TFE, DMG, IS, JSS, ASm, and MS) as well as researchers from outside the project (SK and AL). Individual contributions can be summarized as follows. ASi developed the V3 AERONET retrieval code by modifying that of V2 and along with TFE suggested modification to the U27 algorithm. BNH proposed the idea of a new HYB measurement scan and approach to uncertainty estimation. IS and DMG performed coding and supercomputer processing (DMG) of data. JSS, ASm, and MS contributed to discussions during AERONET team meetings. SK and AL developed radiative transfer code SORD for the AERONET aerosol retrieval algorithm.
The authors declare that they have no conflict of interest.
The AERONET project at NASA GSFC is supported by the Earth Observing System Project Science Office cal–val, Radiation Sciences Program at NASA headquarters, and various field campaigns. Resources supporting this work were provided by the NASA High-End Computing (HEC) Program through the NASA Center for Climate Simulation (NCCS) at Goddard Space Flight Center. NCEP Reanalysis data are obtained routinely from the US National Weather Service Climate Prediction Center. We would like to thank Arlindo da Silva and Ravi Govindaraju (NASA GSFC) for providing tools to routinely generate MERRA-2 data sets for each AERONET site. Further, we would like to thank Crystal Schaaf and Qingsong Sun (University of Boston) for providing the MODIS snow-free gap-filled BRDF product.
This paper was edited by Alexander Kokhanovsky and reviewed by five anonymous referees.
AERONET: Data Download Tool, available at: https://aeronet.gsfc.nasa.gov/cgi-bin/webtool_inv_v3?stage=3®ion=United_States_East&state=Maryland&site=GSFC&place_code=10&if_polarized=0, last access: 2020.
Ahn, C., Torres, O., and Jethva, H.: Assessment of OMI near-UV aerosol optical depth over land, J. Geophys. Res.-Atmos., 119, 2457–2473, https://doi.org/10.1002/2013JD020188, 2014.
Benkhalifa, J., Leon, J. F., and Chaabane, M.: Aerosol optical properties of Western Mediterranean basin from multi-year AERONET data, J. Atmos. Sol.-Terr. Phy., 164, 222–228, 2017.
Bond, T. C., Doherty, S. J., Fahey, D. W., Forster, P., M., Berntsen, T., DeAngelo, B. J., Flanner, M. J., Ghan, S., Karcher, B., Koch, D., Kinne, S., Kondo, Y., Quinn, P. K., Sarofim, M. C., Schulz, M. G., Schulz, M., Venkataraman, C., Zhang, H., Zhang, S., Bellouin, N., Guttikunda, S. K., Hopke, P. K., Jacobson, M. Z., Kaiser, J. W., Klimont, Z., Lohmann, U., Schwartz, J. P., Shindell, D., Storelvmo, T., Warren, S. G., and Zender, C. S.: Bounding the role of black carbon in the climate system: A scientific assessment, J. Geophys. Res.-Atmos., 118, 5380–5552, https://doi.org/10.1002/jgrd.50171, 2013.
Bohren, C. F. and Huffman, D. R.: Absorption and scattering of light by small particles, Willey-VCH, Germany, 1998.
Burrows, J. P., Dehn A., Deters, B., Himmelmann, S., Richter, A., Voigt, S., and Orphal, J.: Atmospheric remote-sensing reference data from GOME: Part 1. Temperature-dependent absorption cross-sections of NO, in the 231–794 nm range, J. Quant. Spectrosc. Ra., 60, 1025–l031, 1998.
Burrows, J. P., Richter, A., Dehn, A., Deters, B., Himmehnann, S., Voigt, S., and Orphal, J.: Atmospheric remote-sensing reference data from GOME: Part 2. Temperature dependent absorption cross-sections of 0, in the 231–794 nm range, J. Quant. Spectrosc. Ra., 61, 509–517, 1999.
Clarke, A. D., Howell, S., Quinn, P. K., Bates, T. S., Ogren, J. A., Andrews, E., Jefferson, A., Massling, A., Mayol-Bracero, O., Maring, H., Savoie, D., and Cass, G.: INDOEX aerosol: A comparison and summary of chemical, microphysical, and optical properties observed from land, ship, and aircraft, J. Geophys. Res., 107, 8033, https://doi.org/10.1029/2001JD000572, 2002.
Chen, Q. X., Shen, W. X., Yuan, Y., Xie, M., and Tan, H. P.: Inferring fine-mode and coarse-mode aerosol complex refractive indices from AERONET inversion products over China, Atmosphere, 10, 158, https://doi.org/10.3390/atmos10030158, 2019.
Coddington, O., Lean, J. L., Pilewskie, P., Snow, M., and Lindholm, D.: A solar irradiance climate data record, B. Am. Meteorol. Soc., 97, 1265–1282, 2016.
Choi, M., Kim, J., Lee, J., Kim, M., Park, Y.-J., Holben, B., Eck, T. F., Li, Z., and Song, C. H.: GOCI Yonsei aerosol retrieval version 2 products: an improved algorithm and error analysis with uncertainty estimation from 5-year validation over East Asia, Atmos. Meas. Tech., 11, 385–408, https://doi.org/10.5194/amt-11-385-2018, 2018.
Corr, C. A., Krotkov, N., Madronich, S., Slusser, J. R., Holben, B., Gao, W., Flynn, J., Lefer, B., and Kreidenweis, S. M.: Retrieval of aerosol single scattering albedo at ultraviolet wavelengths at the T1 site during MILAGRO, Atmos. Chem. Phys., 9, 5813–5827, https://doi.org/10.5194/acp-9-5813-2009, 2009.
Cox, C. and Munk, W.: Measurement of the roughness of the sea surface from photograph of sun glitter, J. Opt. Soc. Am., 44, 838–850, 1954.
Dubovik, O. and King, M.: A flexible inversion algorithm for retrieval of aerosol optical properties from Sun and sky radiance measurements, J. Geophys. Res., 105, 20763–20696, 2000.
Dubovik, O., Smirnov, A., Holben, B. N., King, M. D., Kaufman, Y. J., Eck, T. F., and Slutsker, I.: Accuracy assessment of aerosol optical properties retrieved from Aerosol Robotic Network (AERONET) Sun and sky radiance measurements, J. Geophys. Res., 105, 9791–9806, 2000.
Dubovik, O., Holben, B. N., Eck, T. F., Smirnov, A., Kaufman, Y. J., King, M. D., Tanre, D., and Slutsker, I.: Variability of absorption and optical properties of key aerosol types observed worldwide locations, J. Atmos. Sci., 59, 590–608, 2002.
Dubovik, O.: Optimization of numerical inversion in photopolarimetric remote sensing, in: Photopolarimetry in remote sensing, edited by: Videen, G., Yatskiv, Y., and Mishchenko, M., Dordecht, Netherlands: Kluwer Academic Publisher, 65–106, 2004.
Dubovik, O., Sinyuk, A., Lapyonok, T., Holben, B. N., Mishchenko, M., Yang, P., Eck, T. F., Volten, H., Munoz, O., Veihelmann, B., van der Zande, W. J., Leon, J. F., Sorokin, M., and Slutsker, I.: Application of spheroid models to account for aerosol particle nonsphericity in remote sensing of desert dust, J. Geophys. Res., 111, D11208, https://doi.org/10.1029/2005JD006619, 2006.
Eck, T. F., Holben B. N., Reid, J. S., Dubovik, O., Smirnov, A., O'Neill, N. T., Slutsker, I., and Kinne, S.: Wavelength dependence of the optical depth of biomass burning, urban, and desert dust aerosols, J. Geophys. Res., 104, 31333–31349, 1999a.
Eck, T. F., Holben, B. N., Ward, D. E., Dubovik, O., Reid, J. S., Smirnov, A., Mukelabai, M. M., Hsu, N. C., O'Neill, N. T., and Slutsker, I.: Characterization of optical properties of biomass burning aerosols in Zambia during the 1997 ZIBBEE field campaign, J. Geophys. Res., 106, 3425–3449, 1999b.
Eck, T. F., Holben, B. N., Reid, J. S., Sinyuk, A., Dubovik, O., Smirnov, A., Giles, D. M., O'Neill, N. T., Tsay, S. C., Ji, Q., Al Mandoos, A., Khan, M. R., Reid, E., A., Schafer, J. S., Sorokine, M., Newcomb, W., and Slursker, I.: Spatial and temporal variability of column-integrated aerosol optical properties in the southern Arabian Gulf and United Arab Emirates in summer, J. Geophys. Res.-Atmos., 113, D01204, https://doi.org/10.1029/2007JD008944, 2008.
Eck, T. F., Holben, B. N., Sinyuk, A., Pinker, R. T., Goloub, P., Chen, H., Chatenet, B., Li, Z., Singh, R. P., Tipathi, S., N., Reid, J. S., Giles, D. M., Dubovik, O., O’Neill, N. T., Smirnov, A., Wang, P., and Xia, X.: Climatological aspects of the optical properties of fine/coarse mode aerosol mixtures., J. Geophys. Res., 115, D19205, https://doi.org/10.1029/2010JD014002, 2010.
Eck, T. F., Holben, B. N., Reid, J. S., Giles, D. M., Rivas, M. A., Singh, R. P., Tripathi, S. N., Bruegge, C. J., Platnick, S., Arnold, J. T., Krotkov, N. A., Carn, S. A., Sinyuk, A., Dubovik, O., Arola, A., Schafer, J. S., Artaxo, P., Smirnov, A., Chen, H., and Goloub, P.: Fog- and cloud- induced aerosol modification observed by AERONET Robotic Network (AERONET), J. Geophys. Res., 117, D07206, https://doi.org/10.1029/2011JD016839, 2012.
Eck, T. F., Holben, B. N., Reid, J. S., Mukelabai, M. M., Piketh, S. J., Torres, O., Jethva, H. H., Hyer, E. J., Ward, D. E., Dubovik, O., Sinyuk, A., Schafer, J. S., Giles, D. M., Sorokin, M., Smirnov, A., and Slutsker, I.: A seasonal trend of single scattering albedo in southern African biomass-burning particles: Implications for satellite products and estimates of emissions for the world's largest biomass-burning source, J. Geophys. Res., 118, 6414–6432, https://doi.org/10.1002/jgrd.50500, 2013.
Fedarenka, A., Dubovik, O., Goloub, P., Li, Z., Lapyonok, T., Litvinov, P., Barel, L., Gonzales, L., Podvin, T., and Crozel, D.: Utilization of AERONET polarimetric measurements for improving of aerosol microphysics: GSFC, Beijing, and Dakar data analysis, J. Quant. Spectrosc. Ra., 179, 72–97, 2016.
Gelaro, R., McCarty, W., Suares, M. J., Todling, R., Molod, A., Takacs, L., Randles, C. A., Darmenov, A., Bosilovich, G., Reichle, R., Wargan, K., Coy, L., Cullather, R., Draper, C., Akella, S., Buchard, V., Conaty, A., da Silva, A. M., Gu, W., Kim, G. K., Koster, R., Lucchesi, R., Merkova, D., Nielsen, J. E., Partyka, G., Pawson, S., Putman, W., Rienecker, M., Schubert, S. D., Sienkiewicz, M., and Zhao, B.: The modern era retrospective analysis foe research and applications, Version 2 (MERRA-2), J. Climate, 30, 5419–5454, 2017.
Giles, D. M., Holben, B. N., Eck, T. F., Sinyuk, A., Smirnov, A., Slutsker, I., Dickerson, R. R., Thompson, A. M., and Schafer, J. S.: An analysis of AERONET aerosol absorption properties and classifications representative of aerosol source regions, J. Geophys. Res., 117, D17203, https://doi.org/10.1029/2012JD018127, 2012.
Giles, D. M., Sinyuk, A., Sorokin, M. G., Schafer, J. S., Smirnov, A., Slutsker, I., Eck, T. F., Holben, B. N., Lewis, J. R., Campbell, J. R., Welton, E. J., Korkin, S. V., and Lyapustin, A. I.: Advancements in the Aerosol Robotic Network (AERONET) Version 3 database – automated near-real-time quality control algorithm with improved cloud screening for Sun photometer aerosol optical depth (AOD) measurements, Atmos. Meas. Tech., 12, 169–209, https://doi.org/10.5194/amt-12-169-2019, 2019.
Hall, D. K., Riggs, J. A., Salomonson, V. V., DiGerolamo, N. E., and Bayr, K. J.: MODIS snow-cover product, Remote Sens. Environ., 83, 181–194, 2002.
Holzer-Popp, T., de Leeuw, G., Griesfeller, J., Martynenko, D., Klüser, L., Bevan, S., Davies, W., Ducos, F., Deuzé, J. L., Graigner, R. G., Heckel, A., von Hoyningen-Hüne, W., Kolmonen, P., Litvinov, P., North, P., Poulsen, C. A., Ramon, D., Siddans, R., Sogacheva, L., Tanre, D., Thomas, G. E., Vountas, M., Descloitres, J., Griesfeller, J., Kinne, S., Schulz, M., and Pinnock, S.: Aerosol retrieval experiments in the ESA Aerosol_cci project, Atmos. Meas. Tech., 6, 1919–1957, https://doi.org/10.5194/amt-6-1919-2013, 2013.
Holben, B. N., Eck, T. F., Slutsker, I., Tanre, D., Buis, J. P., Setzer A., Vermore, E., Reagan, J. A., Kaufman, Y. J., Nakajima, T., Lavenu, F., Jankowiak, I., and Smirnov, A.: AERONET- a federal instrument network and data archive for aerosol characterization, Remote Sens. Environ., 66, 1–16, 1998.
Holben, B. N., Eck, T. F., Slutsker, I., Smirnov, A., Sinyuk, A., Schafer, J. S., Giles, D. M., and Dubovik, O.: AERONET's version 2.0 quality assurance criteria, Remote Sensing of Atmosphere and Clouds, Proc. SPIE Int. Soc. Opt. Eng., 6408, 64080Q, https://doi.org/10.1117/12.706524, 2006.
Jethva, H., Torres, O., and Ahn, C.: Global assessment of OMI aerosol single-scattering albedo using ground-based AERONET inversion, J. Geophys. Res.-Atmos., 119, 9020–9040, https://doi.org/10.1002/2014JD021672, 2014.
Johnson, B. T. and Osborne, S. R.: Physical and optical properties of mineral dust aerosol measured by aircraft during GERBILS campaign, Q. J. Roy. Meteor. Soc., 137, 1117–1130, 2011.
Kahn, R. A., Ogren, J. A., Ackerman, T. P., Bosenberg, J., Charlson, R. J., Diner, D., J., Holben, B. N., Menzies, R. T., Miller, M. A., and Seinfeld, J. H.: Aerosol data sources and their roles within PARAGON, B. Am. Meteorol. Soc., 85, 1511–1522, 2004.
Kahn, R. A., Gaitley, B. J., Garay, M. J., Diner, D. J., Eck, T. F., Smirnov, A., and Holben, B. N.: Multiangle Imaging SpectroRadiometer global aerosol product assessment by comparison with the Aerosol Robotic Network, J. Geophys. Res., 115, D23209, https://doi.org/10.1029/2010JD014601, 2010.
Kattawar, G. W., Plass, G. N., and Hitzfelder, S. J.: Multiple scattering radiation emerging from Rayleigh and continental haze layers. 1: Radiance, polarization, and neutral points, Appl. Optics, 15, 632–647, 1976.
Kerzenmacher, T., Wolff, M. A., Strong, K., Dupuy, E., Walker, K. A., Amekudzi, L. K., Batchelor, R. L., Bernath, P. F., Berthet, G., Blumenstock, T., Boone, C. D., Bramstedt, K., Brogniez, C., Brohede, S., Burrows, J. P., Catoire, V., Dodion, J., Drummond, J. R., Dufour, D. G., Funke, B., Fussen, D., Goutail, F., Griffith, D. W. T., Haley, C. S., Hendrick, F., Höpfner, M., Huret, N., Jones, N., Kar, J., Kramer, I., Llewellyn, E. J., López-Puertas, M., Manney, G., McElroy, C. T., McLinden, C. A., Melo, S., Mikuteit, S., Murtagh, D., Nichitiu, F., Notholt, J., Nowlan, C., Piccolo, C., Pommereau, J.-P., Randall, C., Raspollini, P., Ridolfi, M., Richter, A., Schneider, M., Schrems, O., Silicani, M., Stiller, G. P., Taylor, J., Tétard, C., Toohey, M., Vanhellemont, F., Warneke, T., Zawodny, J. M., and Zou, J.: Validation of NO2 and NO from the Atmospheric Chemistry Experiment (ACE), Atmos. Chem. Phys., 8, 5801–5841, https://doi.org/10.5194/acp-8-5801-2008, 2008.
Kinne, S.: The MACv2 aerosol climatology, Tellus B, 71, 1–21, https://doi.org/10.1080/16000889.2019.1623639, 2019a.
Kinne, S.: Aerosol radiative effects with MACv2, Atmos. Chem. Phys., 19, 10919–10959, https://doi.org/10.5194/acp-19-10919-2019, 2019b.
Komhyr, W. D., Harris, T. B., Waterman, L. S., Chin, J. F. S., and Thoning, K. W.: Atmospheric carbon dioxide at Mauna Loa Observatory 1. NOAA global monitoring for climatic change measurements with nondispersive infrared analyzer, J. Geophys. Res., 94, 8533–8547, 1989.
Korkin, S., Lyapustin, A., and Rozanov, V.: Modifications of discrete ordinate method for computations with high scattering anisotropy, J. Quant. Spectrosc. Ra., 113, 2040–2048, 2012.
Korkin S., Lyapustin A., Sinyuk A., and Holben B.: Accuracy of RT code SORD for realistic atmospheric profiles, in: Proceedings of SPIE, 10001-100010B, 2016.
Korkin, S., Lyapustin, A., Sinyuk, A., Holben, B. N., and Kokhanovsky, A.: Vector radiative transfer code SORD: Performance analysis and quick start guide, J. Quant. Spectrosc. Ra., 200, 295–310, 2017.
Levy, R. C., Mattoo, S., Munchak, L. A., Remer, L. A., Sayer, A. M., Patadia, F., and Hsu, N. C.: The Collection 6 MODIS aerosol products over land and ocean, Atmos. Meas. Tech., 6, 2989–3034, https://doi.org/10.5194/amt-6-2989-2013, 2013.
Levy, R. C., Munchak, L. A., Mattoo, S., Patadia, F., Remer, L. A., and Holz, R. E.: Towards a long-term global aerosol optical depth record: applying a consistent aerosol retrieval algorithm to MODIS and VIIRS-observed reflectance, Atmos. Meas. Tech., 8, 4083–4110, https://doi.org/10.5194/amt-8-4083-2015, 2015.
Lenoble, J., Mishchenko, M. I., and Herman, M.: Absorption and scattering by molecules and particles, in: Aerosol Remote Sensing, edited by: Lenoble, J., Remer, L., and Tanré, D., Springer Praxis Books, 13–51, 2013.
Lee, J., Hsu, N. C., Sayer, A. M., Bettenhausen, C., and Yang, P.: AERONET- based nonspherical dust optical models and effects on the VIIRS deep blue/SOAR over water aerosol product, J. Geophys. Res.-Atmos., 122, 10441–10458, 2017.
Lucht, W. and Roujean, J. L.: Consideration in parametric modeling of BRDF and albedo from multi-angular satellite sensors observations, Remote Sensing Reviews, 18, 343–379, 2000.
Limbacher, J. A. and Kahn, R. A.: Updated MISR over-water research aerosol retrieval algorithm – Part 2: A multi-angle aerosol retrieval algorithm for shallow, turbid, oligotrophic, and eutrophic waters, Atmos. Meas. Tech., 12, 675–689, https://doi.org/10.5194/amt-12-675-2019, 2019.
Li, Z., Goloub, P., Dubovik, O., Blarel, L., Zhang, W., Podvin, T., Sinyuk, A., Chen, H., Holben, B. N., Tanre, D., Canini, M., and Buis, J. P.: Improvements for ground-based remote sensing of atmospheric aerosol properties by additional polarimetric measurements, J. Quant. Spectrosc. Ra., 110, 1954–1961, 2009.
Lyapustin, A., Wang, Y., Korkin, S., and Huang, D.: MODIS Collection 6 MAIAC algorithm, Atmos. Meas. Tech., 11, 5741–5765, https://doi.org/10.5194/amt-11-5741-2018, 2018.
Mishchenko, M. I., Lacis, A. A., and Travis, L. D.: Errors induced by the neglect of polarization in radiance calculations for Rayleigh-scattering atmospheres, J. Quant. Spectrosc. Ra., 51, 491–510, 1994.
Mishchenko, M. I., Travis, L. D., Khan, R., A., and West, R. A.: Modeling phase functions for dustlike tropospheric aerosols using a mixture of randomly oriented polydisperse spheroids, J. Geophys. Res., 102, 16831–16847, 1997.
Mok, J., Krotkov, N. A., Arola, A., Torres, O., Jethva, H., Andrade, M., Labow, G., Eck, T. F., Li, Z., Dickerson, R. R., Stenchikov, G. L., Osipov, S., and Ren, X.: Impact of brown carbon from biomass burning on surface UV and ozone photochemistry in the Amazon Basin, Sci. Rep.-UK, 6, 36940, https://doi.org/10.1038/srep36940, 2016.
Moody, E. G., King, D. M., Platnick, S., Schaaf, C. B., and Gao, F.: Spatially complete Global surface albedo: value-added datasets derived from Terra MODIS land products, IEEE T. Geosci. Remote, 43, 144–158, 2005.
Nakajima, T. and Tanaka, M.: Effect of wind-generated waves on the transfer of solar radiation in the atmosphere-ocean system, J. Quant. Spetrosc. Ra., 29, 521–537, 1983.
Nakajima, T. and Tanaka, M.: Matrix formulations for the transfer of solar radiation in plane-parallel scattering atmosphere, J. Quant. Spectrosc. Ra., 35, 13–21, 1986.
Nakajima, T. and Tanaka, M.: Algorithm for radiative intensity calculations in moderately thick atmospheres using a truncation approximation, J. Quant. Spectrosc. Ra., 40, 51–69, 1988.
Nolin, A., Armstrong, R. L., and Maslanik, J.: Near-Real-Time SSM/IEASE-Grid Daily Global Ice Concentration and Snow Extent (2004–present), digital media, Natl. Snow and Ice Data Cent., Boulder, Colo., 1998.
Ou, Y., Zhao, W. H., Wang, J. Q., Zhao, W. J., and Zhang, B.: Characteristics of aerosol types in Beijing and the associations with air pollution from 2004 to 2015, Remote Sens., 9, 898, https://doi.org/10.3390/rs9090898 , 2017.
Reid, J. S., Koppmann, R., Eck, T. F., and Eleuterio, D. P.: A review of biomass burning emissions part II: intensive physical properties of biomass burning particles, Atmos. Chem. Phys., 5, 799–825, https://doi.org/10.5194/acp-5-799-2005, 2005.
Reid, J. S., Brooks, B., Crahan, K. K., Hegg, D. A., Eck, T. F., O’Neill, N., de Leeuw, G., Reid, E. A., and Anderson, K. D.: Reconciliation of coarse mode sea-salt aerosol particle size measurements and parameterizations at a subtropical ocean receptor site, J. Geophys. Res., 111, D02202, https://doi.org/10.1029/2005JD006200, 2006.
Reid, J. S., Reid, E. A., Walker, A., Piketh, S., Cliff, S., Al Mandoos, A., Tsay, S. C., and Eck, T. F.: Dynamics of southwest Asian dust particle size characteristics with implications for global dust research, J. Geophys. Res., 113, D14212, https://doi.org/10.1029/2007JD009752, 2008a.
Reid, J. S., Piketh, S. J., Walker, A. L., Burger, R. P., Ross, K. E., Westphal, D. L., Bruintjes, R., Holben, B. N., Hsu, C., Jensen, T. L., Kahn, R. A., Kuciauskas, A. P., Mandoos, A. A., Miller, S. D., Porter, J. N., Reid, E. A., and Tsay, S. C.: An overview of UAE2 flight operations: thermodynamics and aerosol profiles of the southern Arabian Gulf, J. Geophys. Res., 113, D14213, https://doi.org/10.1029/2007JD009435, 2008b.
Remer, L. A., Kaufman, Y. J., Tanré, D., Mattoo, S., Chu, D. A., Martins, J. V., Li, R., Ichoku, C., Levy, R. C., Kleidman, R. G., Eck, T. F., Vermote, E., and Holben, B. N.: The MODIS Aerosol Algorithm, Products, and Validation, J. Atmos. Sci., 62, 947–973, https://doi.org/10.1175/JAS3385.1, 2005.
Schafer, J. S., Eck, T. F., Holben, B. N., Thornhill, K. L., Anderson, B. E., Sinyuk, A., Giles, D. M., Winstead, E. L., Zlemba, L. D., Beyersdorf, A. J., Kenny, P. R., Smirnov, A., and Slutsker, I.: Intercomparison of aerosol single-scattering albedo derived from AERONET surface radiometers and LARGE in situ aircraft profiles during the 2011 DRAGON-MD and DISCIVER-AQ experiments, J. Geophys. Res.-Atmos., 119, 7493–7452, 2014.
Schafer, J. S., Eck, T. F., Holben, B. N., Thornhill, K. L., Ziemba, L. D., Sawamura, P., Moore, R. H., Slutsker, I., Anderson, B. E., Sinyuk, A., Giles, D. M., Smirnov, A., Beyersdorf, A. J., and Winstead, E. L.: Intercomparison of aerosol volume size distributions derived from AERONET ground-based remote sensing and LARGE in situ aircraft profiles during the 2011–2014 DRAGON and DISCOVER-AQ experiments, Atmos. Meas. Tech., 12, 5289–5301, https://doi.org/10.5194/amt-12-5289-2019, 2019.
Saha, S., Moorthi, S., Pan, H-L., Wu, X., Wang, J., Nadiga, S., Tripp, P., Kistler, R., Woollen, J., Behringer D., Liu, H., Stokes, D., Grumbine, R., Gayno, G., Wang, J., Hou, Y. T., Chuang, H., Juang, H-M. H., Sela, J., Iredell, M., Treadon, R., Kleist, D., van Delst, P., Keyser, D., Derber, J., Ek, M., Meng, J., Wei, H., Yang, R., Lord, S., van del Dool, H., Kumar, A., Wang W., Long, C., Chelliah, M., Xue, Y., Huang, B., Schemm, J. K., Ebisuzaki, W., Lin, R., Xie, P., Chen, M., Zhou, S., Higgins, W., Zou, C. Z., Liu, Q., Chen, Y., Han. Y., Cucurull, L., Reynolds, R. W., Rutledge, G., and Goldberg, M.: The NCEP climate forecast system reanalysis, B. Am. Meteorol. Soc., 91, 1015–1057, 2010.
Sayer, A. M., Hsu, N. C., Lee, J., Bettenhausen, C., Kim, W. V., and Smirnov, A.: Satellite Ocean Aerosol Retrieval (SOAR) algorithm extension to S-NPP VIIRS as part of the “Dep Blue” aerosol project, J. Geophys. Res.-Atmos., 123, 380–400, https://doi.org/10.1002/2017JD027412, 2018.
Sayer, A. M., Hsu, N. C., Lee, J., Kim, W. V., and Dutcher, S. T.: Validation, stability, and consistency of MODIS collection 6.1 and VIIRS version 1 Deep Blue aerosol data over land, J. Geophys. Res.-Atmos., 124, 4658–4688, https://doi.org/10.1029/2018JD029598, 2019.
Schuster, G. L., Dubovik, O., Holben, B. N., and Clothiaux, E. E.: Inferring black carbon content and specific absorption from Aerosol Robotic Network (AERONET) aerosol retrievals, J. Geophys. Res.-Atmos., 110, D10S17, https://doi.org/10.1029/2004JD004548, 2005.
Schuster, G. L., Dubovik, O., and Arola, A.: Remote sensing of soot carbon – Part 1: Distinguishing different absorbing aerosol species, Atmos. Chem. Phys., 16, 1565–1585, https://doi.org/10.5194/acp-16-1565-2016, 2016.
Schmid, B., Spyak, P. R., Biggar, S. F., Wehrli, C., Sekler, J., Ingold, T., Matzler, C., and Kampfer, N.: Evaluation of the applicability of solar and lamp radiometric calibrations of a precision Sun photometer operating between 300 and 1025 nm, Appl. Optics, 37, 3923–3941, 1998.
Schmid, B., Michalsky, J. J., Slater, D. W., Barnard, J. C., Halthore, R. N., Liljergen, J. S., Holben, B. N., Eck, T. F., Livingston, J. M., Russel, P. B., Ingold, T., and Slutsker, I.: Comparison of columnar water-vapor measurements from solar transmittance methods, Appl. Optics, 40, 1886–1896, 2001.
Si, Y. D., Li, S. S., Chen, L. F., Shang, H. Z., Wang, L., and Letu, H.: Assessment and improvement of MISR angstrom exponent and single-scattering albedo products using AERONET data in China, Remote Sens., 9, 693, https://doi.org/10.3390/rs9070693, 2017.
Sokolik, I. N. and Toon, O. B.: Incorporation of mineralogical composition into models of the radiative properties of mineral aerosol from UV to IR wavelengths, J. Geophys. Res., 104, 9423–9444, 1999.
Sinyuk, A., Torres, O., and Dubovik, O.: Combined use of satellite and surface observations to infer imaginary part of refractive index of Saharan dust, Geophys. Res. Lett., 30, 1081, https://doi.org/10.1029/2002GL016189, 2003.
Sinyuk, A., Dubovik, O., Holben, B. N., Eck, T. F., Breon, F. M., Martonchik, J., Kahn, R., Diner, D. J., Vermote, E. F., Roger, J. C., Lapyonok, T., and Slutsker, I.: Simultaneous retrieval of aerosol and surface properties from combination of AERONERT and satellite data, Remote Sens. Environ., 107, 90–108, 2007.
Sinyuk, A., Holben, B. N., Eck, T. F., Slutsker, I., Schafer, J. S., Giles, D. M., Smirnov, A., and Sorokin, M.: Effect of non-sphericity of mineral dust particles on AERONET aerosol retrievals, in: Proceedings of the XV Electromagnetic and Light Scattering, Leipzig, Germany, 21–26 June 2015, Abstract number 51, 2015.
Smirnov, A. Holben, B. N., Dubovik, O., Frouin, R., Eck, T. F., and Slutsker, I.: Maritime component in aerosol optical models derived from Aerosol Robotic Network data, J. Geophys. Res., 108, D1, https://doi.org/10.1029/2002JD002701, 2003.
Smirnov, A., Holben, B. N., Lyapustin, A., Slutsker, I., and Eck, T. F.: AERONET processing algorithms refinement, AERONET2004 workshop, El Arenosillo, Spain, 10–14 May 2004.
Torres, B., Dubovik, O., Toledano, C., Berjon, A., Cachorro, V. E., Lapyonok, T., Litvinov, P., and Goloub, P.: Sensitivity of aerosol retrieval to geometrical configuration of ground-based sun/sky radiometer observations, Atmos. Chem. Phys., 14, 847–875, https://doi.org/10.5194/acp-14-847-2014, 2014.
Vlemmix, T., Hendrick, F., Pinardi, G., De Smedt, I., Fayt, C., Hermans, C., Piters, A., Wang, P., Levelt, P., and Van Roozendael, M.: MAX-DOAS observations of aerosols, formaldehyde and nitrogen dioxide in the Beijing area: comparison of two profile retrieval approaches, Atmos. Meas. Tech., 8, 941–963, https://doi.org/10.5194/amt-8-941-2015, 2015.
Wang, J., Niu, S. J., and Xu, D.: Light-absorbing aerosol properties retrieved from the sunphotometer observation over the Yangtze River Delta, China, Appl. Optics, 57, 992–1004, 2018.
Wang, Z., Schaaf, C. B., Sun, Q., Shuai, Y., and Roman, M. O.: Capturing rapid land surface dynamics with Collection V006 MODIS/BRDF/NBAR/Albedo (MCD43) product, Remote Sens. Environ., 207, 50–64, 2018.
Xu, F., Diner, D. J., Dubovik, O., and Schechner, Y. A.: Correlated multi-pixel inversion approach for aerosol remote sensing, Remote Sens., 11, 746, https://doi.org/10.3390/rs11070746, 2019.
Zhang, Y., Li, Z., Zhang, Y., Li, D., Qie, L., Che, H., and Xu, H.: Estimation of aerosol complex refractive indices for both fine and coarse modes simultaneously based on AERONET remote sensing products, Atmos. Meas. Tech., 10, 3203–3213, https://doi.org/10.5194/amt-10-3203-2017, 2017.
- Abstract
- Introduction
- Version 3 retrieval algorithm description
- Comparison of AERONET V3 to V2 aerosol retrievals
- Hybrid scan: concept and retrieval scan
- Uncertainty estimates of the retrieved aerosol parameters: U27
- Summary and conclusions
- Data availability
- Author contributions
- Competing interests
- Acknowledgements
- Review statement
- References